

Student Aid and University PersistenceDoes Debt Matter?

Published in 2005 by
The Canada Millennium Scholarship Foundation
1000 Sherbrooke Street West, Suite 800, Montreal, QC, Canada H3A 3R2
Toll Free: 1-877-786-3999
Fax: (514) 985-5987
Web: www.millenniumscholarships.ca
Email: [email protected]
National Library of Canada Cataloguing in Publication
Lori McElroy
Student Aid and University Persistence — Does Debt Matter?
Number 23
Includes bibliographical references.
ISSN 1704-8435 Millennium Research Series (Online)
Layout Design: Charlton + Company Design Group
The opinions expressed in this research document are those of the authors and do not represent official policies of the Canada Millennium Scholarship Foundation, and other agencies or organizations that may have provided support, financial or otherwise, for this project.
Student Aid and University PersistenceDoes Debt Matter?
Written by:Lori McElroy
Canada Millennium Scholarship FoundationDecember 2005


Acknowledgements _____________________________________________________ i
Highlights ___________________________________________________________ iiiThe Study______________________________________________________________________________________________________ iii
The Findings ___________________________________________________________________________________________________ iii
Summary and Conclusions _______________________________________________________________________________________ v
Introduction __________________________________________________________ 1
Review of the Relevant Literature ___________________________________________ 3Financing Post-Secondary Education ______________________________________________________________________________ 3
Persistence _____________________________________________________________________________________________________ 5
Factors Influencing Persistence ___________________________________________________________________________________ 5
The Study ____________________________________________________________ 9Purpose ________________________________________________________________________________________________________ 9
Methodology ___________________________________________________________________________________________________ 9
Limitations ____________________________________________________________________________________________________ 10
Profile _____________________________________________________________ 11Institutions ____________________________________________________________________________________________________ 11
Study Cohort __________________________________________________________________________________________________ 12
Persistence __________________________________________________________ 13Persistence Status at End of Tracking Period _______________________________________________________________________ 13
Degree Completion_____________________________________________________________________________________________ 15
Progress Toward Completion ____________________________________________________________________________________ 16
Program Length Completed _____________________________________________________________________________________ 18
Student Financial Aid __________________________________________________ 19Distribution of Financial Aid Dol1lars ____________________________________________________________________________ 19
Recipients of Student Financial Aid_______________________________________________________________________________ 21
Amount and Type of Aid Received ________________________________________________________________________________ 22
Standardized Measures of Student Financial Aid ___________________________________________________________________ 26
Persistence and Student Financial Aid ______________________________________ 31Persistence, Total Aid and Annualized Aid _________________________________________________________________________ 31
The Relationship Between Annualized Aid and Persistence__________________________________________________________ 32
Predictors of Persistence ________________________________________________________________________________________ 34
Table of Contents

Summary and Conclusions ______________________________________________ 39
Bibliography _________________________________________________________ 43
Appendix A: Data Request to Institutions ____________________________________ 45Cohort Definition ______________________________________________________________________________________________ 45
Data Submission _______________________________________________________________________________________________ 46
Appendix B: Detailed Results _____________________________________________ 47
Appendix C: Financial Assistance Available in British Columbia, Ontario and Quebec ____ 51Student Financial Assistance in British Columbia __________________________________________________________________ 51
Financial Assistance Available to Ontario Students _________________________________________________________________ 52
Student Financial Assistance in Quebec___________________________________________________________________________ 53
Appendix D: Standardization Methodology ___________________________________ 55Basic Method of Standardization _________________________________________________________________________________ 55
Adjustment to Standardization___________________________________________________________________________________ 57
Appendix E: Regression Results ___________________________________________ 59Indicator Variables _____________________________________________________________________________________________ 59
Mean Persistence (Actual Persistence) ____________________________________________________________________________ 60
Original Models ________________________________________________________________________________________________ 64
Predicted Persistence from Original Models _______________________________________________________________________ 64
Models Excluding Quebec _______________________________________________________________________________________ 65
Predicted Persistence from Models Excluding Quebec_______________________________________________________________66

This research would not have been possible without
the participation of the six universities involved. Each
institution provided the necessary data and helped to
clarify data issues when required. Some also provided
feedback on earlier versions of this report. In addi-
tion, representatives from these institutions, as well
as many that could not participate, provided input in
the planning phase when the feasibility of conducting
this research was assessed. In particular, we would
like to thank the following people for their assistance
in this project:
From Brock University:
• Pat Beard, Director, Institutional Planning &
Analysis
• Gloria Gallagher, Assistant Registrar
• Rico Natale, Director, Student Awards and
Financial Aid
From Carleton University:
• Bruce Winer, Associate Director, Office of Institu-
tional Research and Planning
From Concordia University:
• Alexander Lee, Office Technology Assistant,
Financial Aid and Awards Office
• Cameron Tilson, Senior Planning & Policy Analyst,
Office of the President
• Terry Too, Director of Enrolment Analysis/Process
Control and Associate Registrar, Enrolment &
Student Services
• Lise Tremblay, Director of Institutional Research
From Lakehead University:
• Kerrie-Lee Clarke, Director, Institutional Analysis
and Government Relations
• Daniel M. Klein, Programmer/Analyst, Institu-
tional Analysis and Government Relations
• Kathleen Michalchuk, Research Assistant, Institu-
tional Analysis & Government Relations
• Taina Van Damme, Research Analyst, Institutional
Analysis & Government Relations
From the University of Ottawa:
• Maryam Mashaie, Research & Analyst Officer,
Office of the Rector
• Anita Pak, Senior Analyst, Institutional Research
and Planning
• Henri Wong, Assistant Vice-Rector, Strategic enrol-
ment Management
From Simon Fraser University:
• Liny Chan, Analyst, Office of Analytical Studies
• Charlotte French, Director, Academic Resources
• Walter J. Wattamaniuk, Director, Office of Analy-
tical Studies
The author of this report, Lori McElroy, would also
like to thank her research team from CEISS —
Research & IT Solutions for their valuable contribu-
tions to this project:
• Vicki Hvid, Business Analyst, Research and
Accountability Division
• Marti Lea Thib, Senior Analyst, Research and
Accountability Division
i
Acknowledgements


The StudyThis paper deals with the relationship between
student financial aid and persistence. It begins by
reviewing the relevant literature, including studies of
how students finance their education and the various
factors (both financial and non-financial) that have
been found to affect persistence. The second part of
the paper consists of a retrospective study on education
persistence. This study sought to determine whether
student financial aid was related to persistence.
Private sources of financing were not examined.
Six universities participated: four from Ontario,
one from Quebec and one from British Columbia.
These institutions provided student aid and enrol-
ment data for 13,280 students who entered three-,
four- or five-year undergraduate degree programs in
1997 or 1998. Students in the study had to be in their
first degree program with no prior post-secondary
experience. The sample included both full-time and
part-time students. Foreign students were excluded.
We tracked students for five years following the
beginning of their studies, to see whether they
persisted at the same institution. We used two meas-
ures of persistence:
• Completion: Whether or not a degree was
completed by the end of the tracking period.
• Progress toward completion: The proportion of the
number of credits required for the degree that
were earned by the end of the tracking period.
iii
Highlights
The FindingsPersistence Status at End of Tracking Period
By the end of the five-year tracking period, 51% of the
students had completed a degree, 17% were continu-
ing their studies (and had not yet earned a degree)
and 32% had left the institution without earning a
degree. Some 44% of all “leavers” left prior to the
second year of study.
The majority of students had earned a high
proportion of the number of credits required for their
program — an average of 77%. A few (2%) had earned
no credits, while almost half had completed 100% or
more of the credits required.
“Continuers” consisted of two groups: those
studying at a slower rate and those who had earned
credits that didn’t count toward their degree. Almost
40% of continuers had earned 100% or more of the
number of credits required by the end of the fifth year
of the tracking period, yet they had not completed
the degree. Just over 10% of continuers had earned
less than half of the credits needed, even though they
had started the program five years earlier.
Student Financial Aid
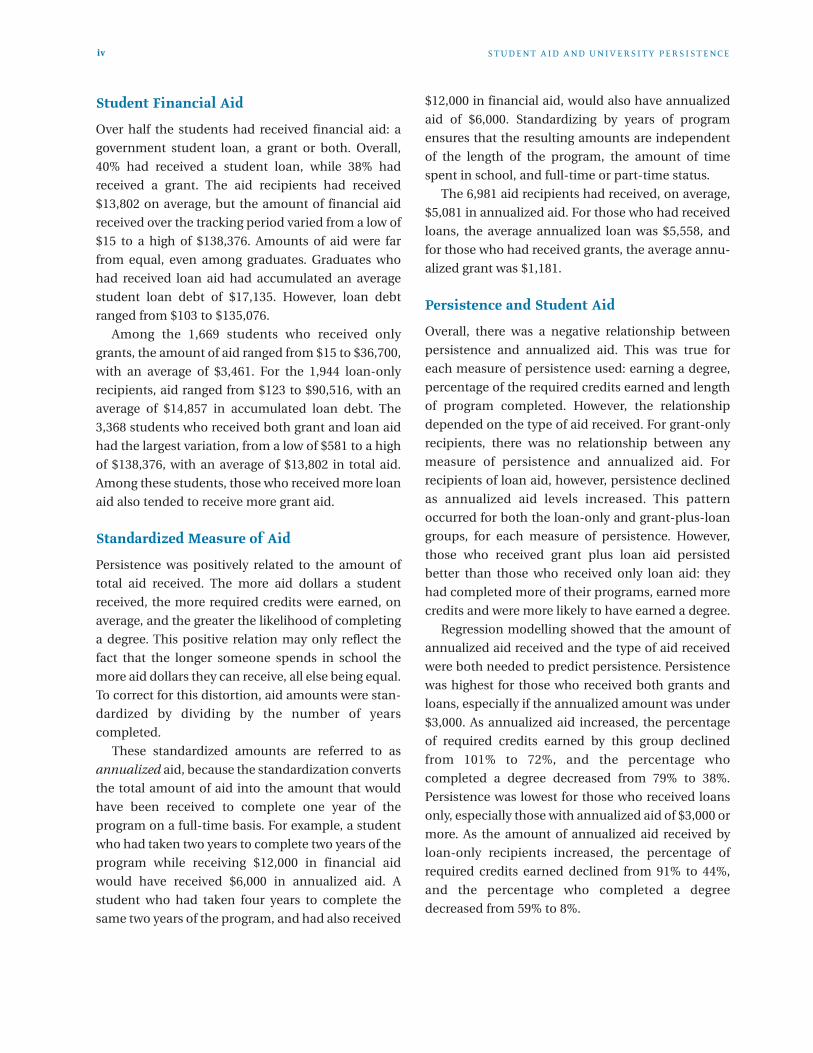
Over half the students had received financial aid: a
government student loan, a grant or both. Overall,
40% had received a student loan, while 38% had
received a grant. The aid recipients had received
$13,802 on average, but the amount of financial aid
received over the tracking period varied from a low of
$15 to a high of $138,376. Amounts of aid were far
from equal, even among graduates. Graduates who
had received loan aid had accumulated an average
student loan debt of $17,135. However, loan debt
ranged from $103 to $135,076.
Among the 1,669 students who received only
grants, the amount of aid ranged from $15 to $36,700,
with an average of $3,461. For the 1,944 loan-only
recipients, aid ranged from $123 to $90,516, with an
average of $14,857 in accumulated loan debt. The
3,368 students who received both grant and loan aid
had the largest variation, from a low of $581 to a high
of $138,376, with an average of $13,802 in total aid.
Among these students, those who received more loan
aid also tended to receive more grant aid.
Standardized Measure of Aid
Persistence was positively related to the amount of
total aid received. The more aid dollars a student
received, the more required credits were earned, on
average, and the greater the likelihood of completing
a degree. This positive relation may only reflect the
fact that the longer someone spends in school the
more aid dollars they can receive, all else being equal.
To correct for this distortion, aid amounts were stan-
dardized by dividing by the number of years
completed.
These standardized amounts are referred to as
annualized aid, because the standardization converts
the total amount of aid into the amount that would
have been received to complete one year of the
program on a full-time basis. For example, a student
who had taken two years to complete two years of the
program while receiving $12,000 in financial aid
would have received $6,000 in annualized aid. A
student who had taken four years to complete the
same two years of the program, and had also received
$12,000 in financial aid, would also have annualized
aid of $6,000. Standardizing by years of program
ensures that the resulting amounts are independent
of the length of the program, the amount of time
spent in school, and full-time or part-time status.
The 6,981 aid recipients had received, on average,
$5,081 in annualized aid. For those who had received
loans, the average annualized loan was $5,558, and
for those who had received grants, the average annu-
alized grant was $1,181.
Persistence and Student Aid
Overall, there was a negative relationship between
persistence and annualized aid. This was true for
each measure of persistence used: earning a degree,
percentage of the required credits earned and length
of program completed. However, the relationship
depended on the type of aid received. For grant-only
recipients, there was no relationship between any
measure of persistence and annualized aid. For
recipients of loan aid, however, persistence declined
as annualized aid levels increased. This pattern
occurred for both the loan-only and grant-plus-loan
groups, for each measure of persistence. However,
those who received grant plus loan aid persisted
better than those who received only loan aid: they
had completed more of their programs, earned more
credits and were more likely to have earned a degree.
Regression modelling showed that the amount of
annualized aid received and the type of aid received
were both needed to predict persistence. Persistence
was highest for those who received both grants and
loans, especially if the annualized amount was under
$3,000. As annualized aid increased, the percentage
of required credits earned by this group declined
from 101% to 72%, and the percentage who
completed a degree decreased from 79% to 38%.
Persistence was lowest for those who received loans
only, especially those with annualized aid of $3,000 or
more. As the amount of annualized aid received by
loan-only recipients increased, the percentage of
required credits earned declined from 91% to 44%,
and the percentage who completed a degree
decreased from 59% to 8%.
S T U D E N T A I D A N D U N I V E R S I TY P E R S I S T E N C Eiv
The persistence results of the grant-only group fell
between that of the grant-plus-loan group and that of
the loan-only group. Students in the grant-only group
had earned, on average, 92% of the credits required,
with 69% having completed a degree. Students with
no aid had made more modest progress, having
earned an average of 71% of required credits, with
47% having completed a degree. These results are
slightly below the persistence levels of loan-only
recipients with annualized aid amounts under
$3,000.
Summary and ConclusionsThis study demonstrates that averages can be
misleading when describing student aid. In the
current system, students can accumulate over
$100,000 in student loan debt by the time they
complete their first degree. The average debt of the
graduates in this study was only $17,135, which may
be a reasonable amount to repay, even with interest
added. However, graduates at the upper end of the
range are incurring debt that cannot be repaid
without undue hardship.
This study also shows that the persistence of
students in undergraduate degree programs can be
related to the type and amount of financial aid
received. At the institutions included in this study,
the higher the amount of annualized aid received, the
lower the level of persistence — although this rela-
tionship varied according to the type of aid received.
The paper concludes by discussing the possible
causes of the persistence patterns and their policy
implications. Family income and academic
preparedness are ruled out. Instead, debt aversion
and unmet need are seen as more plausible factors.
Debt aversion may underlie the negative associa-
tion between persistence and annualized aid. The
group with the lowest level of persistence had the
highest amount of debt for the amount of program
they had completed. Students who received a combi-
nation of grant and loan aid had accumulated less
debt for the same level of assistance received, which
may explain their higher level of persistence. As debt
increases, persistence declines, perhaps because
students who already have debt are trying to avoid
accumulating more.
Another possible explanation for the negative
association between persistence and amount of
annualized aid is unmet need. Annualized aid is
related to total aid, which is determined by the
student’s assessed financial need. The higher the
assessed need, the higher the amount of assistance
received — unless aid limits are reached. Students
with low assessed need will not be affected by assis-
tance limits, but as assessed need increases, the
possibility of reaching a limit increases. It is possible,
therefore, that “unmet need” increases as annualized
aid increases. If a student’s unmet need is high
enough, he or she may not have sufficient resources
to stay in school, or may work more and study at a
slower rate. Both these strategies would negatively
affect persistence.
Although unmet need may explain the negative
association between persistence and annualized aid,
it does not explain the positive association with
receiving a grant. It may be that both unmet need and
debt aversion affect persistence. If students receive
some of their assistance in the form of grant aid, their
accumulated debt at the end of studies will be lower.
Hence, the positive effect of receiving grant aid in
addition to loan aid may be due to debt reduction.
However, if unmet need is high, having some of the
assistance in the form of grant aid still leaves the
student either needing to work too much, or needing
to take time off to work. This would explain the nega-
tive relation between annualized aid and persistence
for all loan recipients, whether or not they also
received grant aid.
H I G H L I G H T S v

The higher the amount of annualized aid, the
higher the cost to complete one year of the program
and the higher the cost to complete the entire
program. The more costly it is to complete a degree —
for the student aid program, in terms of providing
aid, or for the student, in terms of accumulated debt
— the slower is the rate of progress toward comple-
tion. However, this association does not establish
causation. Students may take longer due to higher
costs, or they may incur higher costs because they are
taking longer to complete their degree. It is possible
that both types of students exist. Students who take
longer to complete incur higher costs for themselves,
and can cost a student assistance program more.
We need more research to understand the strate-
gies students use to stay in school, as well as the
factors that influence their decisions. By learning
how students decide whether to stay in school and by
understanding the financial consequences of their
decisions, we can improve financial aid programs.
Ultimately, we should be able to ensure that all qual-
ified students can have access to post-secondary
education and can complete their programs in a
timely manner.
S T U D E N T A I D A N D U N I V E R S I TY P E R S I S T E N C Evi

1
IntroductionThis paper deals with the relationship between student financial aid and persistence. The purpose of student
aid is to assist students with financial need to pursue their post-secondary education. To understand the effec-
tiveness of financial assistance and to inform future policy in this area, a better understanding is needed of the
relationship between financial aid and persistence.
The paper begins by reviewing the relevant literature, including studies of how students finance their educa-
tion as well as research on the various factors (both financial and non-financial) that have been found to affect
persistence.
The second part of the paper consists of a retrospective study on education persistence. This study sought
to determine whether student financial aid was related to persistence of university students in undergraduate
degree programs in Canada. Private sources of financing were not examined.


Students draw on a variety of sources to finance their
post-secondary education. Government student
loans are only one of many sources used.
Employment has consistently been reported to be
one of the most common sources. Others include:
non-repayable support from family; non-repayable
support such as grants, bursaries, scholarships and
work-study aid; as well as borrowing through credit
cards and private loans.
Comparing current patterns of post-secondary
student financing with those of 40 years ago (when
the Canada Student Loans program began),
Cervenan and Usher (2004) found some notable
changes. Whereas students in 1965 received 29% of
their income from their families and only 18% from
government sources, students in 2004 received only
15% of their income from their families and 31% from
government. While employment remained a stable
source of income (representing about 36% of
students’ income), the timing of the employment had
shifted. Whereas in 1965 only 10% of income was
derived from employment during the study term, by
2004, this had grown to represent 23% of students’
income.
Findings on the rate of borrowing have varied from
study to study, depending on the methods used. For
instance, based on the 2000 Youth in Transition
Survey (YITS), which surveyed 18- to 20-year-olds,
Bowlby (2002) found that 29% of youth with some
post-secondary education had borrowed from
government student loan programs. Using the Post-
Secondary Education Participation Survey (PEPS),
Barr-Telford et al. (2003) found that 26% of full-time
students aged 18 to 24 in the 2001–02 school year had
a government student loan.1
EKOS (2003), using a different methodology and
no age restrictions, found that the method of financ-
ing education varied somewhat by age for the same
school year (2001–02). Overall, 32% of students
surveyed used government student loans that year.
Employment was the primary source of income,
contributing 40% of total annual income, on average.
Government student aid was the second most
common source, making up 20% of the total, on
average (student loans and non-repayable govern-
ment aid made up 15% and 5% of students’ income,
respectively). When only students who received
student aid were considered, employment consti-
tuted 26% of total income, while student aid
contributed 43%. As students get older, they tend to
receive less support from family and borrow more;
this may explain why student loans made a greater
contribution in the EKOS study than in PEPS.
3
Review of the RelevantLiteratureFinancing Post-Secondary Education
1 The age group was 17 to 24 in Quebec.

The average amount borrowed per year from all
government sources has increased considerably over
the last two decades, from approximately $3,000 in
1980 to just under $8,000 in 1998 (Junor & Usher,
2002).2 Although the amount borrowed has
increased, its share of total income appears to have
decreased in recent years. In 1995, student loans
made up more than half of students’ total revenue
(56% for public college first-year students, 58% for
private college first-year students and 59% for
university first-year students) (Evaluation and Data
Development, 1997). This is considerably higher than
the 43% from all government student aid3 reported in
2001–02.4 Students may be borrowing more than they
did previously, but student loans are making up a
smaller portion of their total income.
By borrowing more, students are accumulating
more debt. The amount of student loan debt accu-
mulated by the time of graduation increased consid-
erably from the early 1980s to the mid-1990s,
although the proportion of graduates who had
borrowed increased only slightly (Finnie, 2002).
Among those who earned a bachelor’s degree in 1982,
45% of men and 39% of women had borrowed.
This rose to 47% for men and 44% for women who
graduated in 1995. The average amount of debt at
graduation rose from $6,070 for men and $5,650 for
women in 1982 to $13,390 and $13,840, respectively,
in 1995.5 Although the incidence of borrowing has not
changed since the mid-1990s, those who graduated
in 2000 owed considerably more than their 1995
counterparts, with an average debt of $19,500 (Allen
& Vaillancourt, 2004). On average, those who earned
a bachelor’s degree in 2000 owed 30% more (in 2000
constant dollars) than 1995 graduates and 70% more
than 1990 graduates.
One measure of the impact of debt on graduates is
the debt-to-earnings ratio, which is the amount owed
at graduation divided by the annual rate of pay.6 For
graduates with a bachelor’s degree, this ratio
increased from 0.14 for men and 0.17 for women in
1982 to 0.38 and 0.51, respectively, in 1995 (Finnie,
2002). This ratio can only be calculated for those who
have graduated and have jobs. It excludes unem-
ployed graduates; it also excludes students who did
not complete their studies. (While the latter students
can be expected to have incurred less debt, they can
also be expected to have lower earnings and a higher
potential for unemployment than those with a
university degree (Canadian Education Statistics
Council, 2003).)
In addition to starting with more debt, 1995 grad-
uates were taking longer to repay their loans than
were 1990 graduates. Five years after graduation,
1995 graduates had reduced their debt by an average
of 34%, while 1990 graduates had reduced their debt
by 41%. As a result of the higher initial debt levels and
the slower rate of repayment, 1995 graduates who
had borrowed had 49% more debt five years after
graduation than did their 1990 counterparts (Canadian
Education Statistics Council, 2003).
Another impact of the rising levels of debt is the
increase in student loan defaults. From 1980 to 1990,
the default rate for Canada Student Loans rose from
9% to 17%. The cost to the federal government of
student loan defaults due to bankruptcy rose from
$30 million in 1990–91 to $70 million in 1996–97
(Schwartz, 1999).
S T U D E N T A I D A N D U N I V E R S I TY P E R S I S T E N C E4
2 The amounts do not include student borrowing in the Northwest Territories, Nunavut or Quebec, since these jurisdictions do not participate in the CSLP.
3 EKOS (2003) reports that among those who received student aid in 2001–02, 43% of their income was from aid. This includes government student loansand bursaries.
4 It should be noted that the two studies used different methodologies. The 1995 data were based on full-time students in their first year of study, whereasthe more recent data are based on students in any year of study, whether studying full-time or part-time.
5 These figures are given in constant 1997 dollars.
6 The annual rate of pay is based on the job held at the time of the interview, two years after graduation.

PersistencePersistence can be defined in terms of credential
completion or progress toward completion. Progress
can be measured in terms of years completed or the
transition from one year to the next.7 One of the only
Canadian sources of post-secondary completion
rates is the School Leavers Follow-up survey (SLF),
which surveyed a sample of young people in 1991
(when they were 18 to 20 years old) and again in 1995
(Gilbert & Frank, 1998). This study found that
students often take longer than the standard time to
complete their program. Only 43% of the university
graduates in the follow-up survey had earned their
degree within four years of completing high school.
About one-third did so in five years and 23%
completed in six years or longer. Of those who had
completed other post-secondary studies, such as a
college diploma or certificate, 64% had completed
within four years, 15% within five years and 21% took
six years or longer to complete.
The SLF also found that about 30% of high school
graduates who had pursued some post-secondary
education were still students in 1995. Since members
of this group were then between 22 and 24 years of
age, the authors suggested that 29 may be a more
appropriate age cut-off for estimating post-second-
ary completion. One implication of these findings is
that students’ progress must be tracked for a number
of years to get an accurate measure of completion
and the factors that might affect persistence and
completion.
R E V I E W O F T H E R E L E VA N T L I T E R AT U R E 5
7 Years completed is the total numbers of years a student completed during a specified period, whether or not any time was taken off. Transition fromone year to the next measures whether or not a students continued into the next year. Its focus is only on the transition from one year to the next, noton the total amount of time in school.
8 For a review and critique of the research on retention and attrition, see Grayson & Grayson (2003).
Factors Influencing Persistence
Most of the studies that have tracked students’
progress over a period of time are American.
Persistence is measured in various ways, such as
institutional attrition from one year to the next, insti-
tutional retention until completion, or system
persistence in terms of year-to-year retention or
completion. Typically, regression analysis is used to
determine which factors are related to persistence.
Some studies include a combination of financial and
non-financial factors, while other studies include just
one or the other.
Non-Financial Factors
Researchers have devoted considerable attention to
the relationship between various non-financial
factors and persistence, especially in the United
States. Their results are not always consistent, and
may depend on the type of credential sought (degree,
diploma or certificate), the aspect of persistence
being examined and the methodology used.8 Despite
these differences, a number of patterns emerge:
persistence can be related to students’ demographic
characteristics, their family backgrounds and
academic preparation, as well as certain institutional
characteristics.

With respect to demographic characteristics,
persistence is generally somewhat higher for females,
for younger students, and for those who are white or
Asian (Berkner et al., 2002; Butlin, 2000; Fenske,
Porter & DuBrock, 1999; Heller, 2003; Grayson &
Grayson, 2003; Looker & Lowe, 2001; Reynolds &
Weagley, 2003; Thiessen, 2001). Other student attrib-
utes that have been shown to be positively associated
with persistence include: attending full-time; living
at home; not having dependants; not being from a
rural environment; not delaying the start of post-
secondary studies; not changing institutions; and not
working extensively during school (Berkner et al.,
2002; Choy, 2002; Cofer & Somers, 2001; Grayson &
Grayson, 2003; Heller, 2003; Looker and Lowe, 2001).
There is also evidence to suggest that different
factors may affect persistence at different points in a
student’s education. In particular, factors that influ-
ence students to leave after the first year may be
different from those that affect students later on
(Choy, 2002; Grayson & Grayson, 2003). A longitudinal
study in the United States found that 16% of first-year
students did not proceed directly to their second
year, although 64% of these students eventually
returned within six years of starting. Those who
did not return during the six-year study period were
more likely to be older, to be married, to have
children and to be working full-time while enrolled.
Those who “stopped out” but later returned were
more likely to have studied full-time and had more
contact with faculty and other students (Choy, 2002).
Another factor positively associated with persist-
ence is better academic preparation (Berkner et al.,
2002; Butlin, 2000; Choy, 2002; Cofer & Somers, 2001;
Grayson & Grayson, 2003; Heller, 2003; Looker &
Lowe, 2001; Reynolds & Weagley, 2003; Thiessen,
2001). Motivation to complete a degree or diploma
can also play a role (Cofer & Somers, 2001; Grayson &
Grayson, 2003; Heller, 2003; Looker & Lowe, 2001).
Some researchers have hypothesized factors repre-
senting students’ social and academic integration
and have shown that better integration is positively
associated with persistence (Grayson & Grayson, 2003).
The size and type of institution has been found to
make a difference (Berkner et al., 2002; Choy, 2002;
Grayson & Grayson, 2003) as has the program of
study or credential (Butlin, 2000; Fenske et al., 1999;
Grayson & Grayson, 2003). Some studies have also
found that parents’ characteristics make a difference:
persistence can be positively associated with parents’
education level and with family income (Berkner et
al., 2002; Butlin, 2000; Choy, 2002; Grayson & Grayson,
2003; Heller, 2003; Reynolds & Weagley, 2003).
Financial Factors
The purpose of the Canada Student Loans Program is
to help students with demonstrated financial need
pursue and complete their post-secondary educa-
tion. Although we know little about the impact of
student aid on persistence, especially in Canada,
some research suggests a possible relationship.
In the YITS, Bowlby (2002) found that persistence
was somewhat related to how students financed their
education. Leavers were somewhat less likely than
graduates and continuers to have received a student
loan, grant or scholarship. They were also less likely
than continuers and somewhat more likely than
graduates to have received money that they did not
have to repay. However, since this study only
surveyed 18- to 20-year-olds, it was too early to tell
what level of education these respondents would
eventually achieve; some may have “stopped out”
and returned later, as has been found in other studies
(Berkner et al., 2002; Choy, 2002).
Some studies have found that post-secondary
leavers often cite finances as a reason for stopping
(Barr-Telford et al., 2003; Grayson & Grayson, 2003;
Reynolds & Weagley, 2003). Using the YITS data, Junor
and Usher (2002) found that young people who felt
they would not be able to obtain as much education
as they wanted cited finances more than any other
reason. Among those who felt there were barriers to
getting all the education they wanted, 36% of post-
secondary leavers cited financial barriers, compared
to 30% of graduates and 28% of continuers.9 Using
data from the PEPS, Barr-Telford et al. (2003) found
S T U D E N T A I D A N D U N I V E R S I TY P E R S I S T E N C E6
9 These percentages are based on analysis of YITS data presented by Junor and Usher (2002).

that half of those who left without completing stated
that they did so because the institution or program
was a poor fit for them, while 29% cited financial
reasons (Barr-Telford et al., 2003).
The fact that students cite financial reasons for
leaving does not tell us the nature of their financial
problems. Nor does it tell us how student assistance
might affect completion. Unfortunately, the effects of
finances on persistence have not been studied as
extensively as have non-financial factors. When they
have been studied, the results have been inconsistent
(Grayson & Grayson, 2003). Some of these inconsis-
tencies may be due to different ways of measuring
persistence. They may also be due to the inclusion of
different financial factors (e.g., loans vs. grants, size
vs. receipt of grant or loan, merit-based vs. need-
based, total assistance and accumulated debt) in
different studies.
Inconsistencies may also arise because some of
the factors that influence persistence are correlated
or are related to some unknown underlying factor.
The factors that appear to influence persistence may
therefore depend on which ones are included in the
study. For instance, Heller (2003) found that the effect
on persistence of demographic variables such as age
and race depended on what other variables were
included in the regression model. Generally, the
effect of some demographic variables tended to
decline, or disappear, as academic and financial aid
variables were added.
The Canadian Survey of Borrowers examined
the persistence of full-time first-year students who
borrowed in 1995 (Evaluation and Data Development,
1997). This study found no relationship between
persistence and financial factors such as proportion
of income from student loans and borrowers’ satis-
faction with the amount of assistance received.
However, this study only looked at completion of the
first year and continuation into the second year.
Since many first-year students stop out and return
later, this study cannot be taken as evidence that
financial factors have no effect on persistence.
In their longitudinal study of University of
Missouri students, Reynolds and Weagley found that
completion was positively associated with parental
income and the receipt of work-study aid, although it
was negatively associated with receipt of student
loans (Reynolds & Weagley, 2003). Grants, whether
merit-based or need-based, had no effect. Fenske
et al. (1999) also found that loans had a negative
effect on year-to-year persistence, although they
found that grants had a positive effect.
While Heller (2003) found that academic factors
were the best predictors of students’ persistence or
degree attainment within six years of entering post-
secondary education, he also found that grants had
positive effects. The size of grants (both need-based
and non-need-based) was positively related to
persistence and degree attainment. When grants
were included in the model, academic variables had
less of an effect on persistence. This study did not
examine the effect of student loans.
In their review of research on the effects of financial
factors, Grayson and Grayson (2003) found mixed
results. One study they reviewed found that the
amount of assistance had a positive effect on persist-
ence. Another found that persistence was somewhat
higher for students who borrowed than for those who
did not. However, other research found that it was not
the receipt of financial aid that mattered but whether
the assistance met the students’ needs.
We know from Hemingway’s (2003) assessment of
Canada’s student aid need assessment policies that
the financial needs of students cannot always be met.
Hemingway concluded that certain policies leave
some students with unmet need, by imposing maxi-
mums for some types of expenses or by limiting the
amount of assistance available. Hemingway suggests
that unmet need could have a negative effect on
academic performance and on persistence.
R E V I E W O F T H E R E L E VA N T L I T E R AT U R E 7

Unmet need may be important in explaining
some of the inconsistent findings on the effects of
financial factors on persistence. If student assistance,
combined with other resources, is enough to allow
students to focus on their studies, the assistance may
have a positive impact on persistence. But if there is
not enough assistance, students may have to work
too much, which can have a detrimental effect on
their rate of progress.
EKOS (2003) found some possible support for this
notion: students who needed to work more than 10
hours per week during school reported that they
would complete their studies sooner if they did not
need to work. This suggests that if student assistance
is too low, students may progress more slowly
because they take a reduced course load in order to
work. Although no research has systematically exam-
ined the effect of unmet need on persistence, some
research suggests that unmet need is a factor.
In their study of within-year retention of two-year
college students, Cofer and Somers (2001) found that
the size of current year grants and current year student
loans had a positive effect on retention. At high levels
of debt, however, the amount of accumulated debt
was negatively associated with persistence. For the
1996 cohort, low debt levels were positively associ-
ated with persistence, but this was not the case for
the 1993 cohort. Cofer and Somers speculated that
unmet need may explain this: more loan assistance
was available to the later cohort, so these students
presumably had less unmet need than did the earlier
cohort. Debt levels only affected persistence when
unmet need is low.
McElroy (2004) also proposed unmet need to
explain why grants were positively associated with
persistence only when levels of unmet need were low.
She suggested that if a student’s financial needs are
being met, accumulated debt may factor into his or
her decision to continue; hence, grants can have a
positive effect on persistence by reducing debt. But if
assistance for the current year is insufficient to meet
the student’s needs, his or her level of accumulated
debt will not affect the decision to continue.
The bulk of the research examining the effects of
student assistance on persistence suggests that grants,
both need-based and merit-based, are positively
associated with persistence. The effects of loans and
accumulated debt, however, are unclear. Most of the
research on this topic is American; post-secondary
education is funded differently in Canada. Policy
implications of the effects of student aid on persistence
should therefore be based on Canadian research.
S T U D E N T A I D A N D U N I V E R S I TY P E R S I S T E N C E8

This study looks at education persistence retrospec-
tively. In particular, it examines whether public
student financial aid is related to the persistence of
students who began undergraduate degree programs
at six universities in Canada between 1997 and 1998.
Private sources of financing, such as bank loans and
credit cards, were not examined.
There were two phases to this research. First, we
conducted an assessment to determine whether such
a study was feasible. The study required financial aid
data and persistence information for the same group
of students. Initially, 20 universities expressed an
interest in participating, but many were unable to do
so because they lacked the necessary financial aid data.
Since academic preparation has been shown to be
positively associated with persistence, we originally
wanted to address this factor as well. Unfortunately,
most participating institutions were not able to
supply entrance averages, so this factor could not be
included.
9
The StudyPurpose
MethodologySix universities participated in the study: four from
Ontario, one from Quebec and one from British
Columbia. These institutions provided data on
provincial and institutional aid10 for 13,280 students
who entered three-, four-, or five-year undergraduate
degree programs in 1997 or 1998. To be included in
the study cohort, students had to be in their first
degree program with no prior post-secondary experi-
ence. The sample included both full-time and part-
time students. Foreign students were excluded.
We tracked students for the five years following the
beginning of their studies, to determine how far they
progressed. We used two measures of persistence:
• Completion: Whether or not a degree was
completed by the end of the tracking period.
• Progress toward completion: The proportion of the
number of credits required for the degree that
were earned by the end of the tracking period.
We received the following administrative data for
13,280 students:
• Total amount of financial aid received since entry.
• Total amount of student loans received since
entry.
• Total number of credits completed since entry.
• Whether or not the student earned the degree.
• The last academic year in which the student was
enrolled.
• Gender.
Appendix A provides the actual request for data
that was sent to the participating institutions.
10 Different institutions collected different types of financial aid data. All provided data on need-based aid; some also included data on merit-based aid.

LimitationsAlthough our data came from six universities across
Canada, only three provinces were represented. Since
student aid programs vary among the provinces and
territories, our findings may not apply to the jurisdic-
tions not represented. In addition, since the partici-
pating institutions may not be representative of the
universities in their respective provinces, we cannot
generalize our findings to all universities in the three
participating provinces.
All of the students in the study were working
toward university degrees. Our findings may not
apply to students working toward other credentials.
Different credentials attract different kinds of
students and come with different price tags. Such
factors could have a bearing on any relationship
between student aid and persistence.
This study tracks progress over a five-year period.
A longer tracking period would have produced higher
persistence levels; we know from the SLF that 23% of
students took more than five years to complete a
university degree (Gilbert & Frank, 1998). However, a
longer tracking period might not have changed the
overall relationship between persistence and finan-
cial aid.
Another limitation of this study is that it examined
only institutional persistence. It is likely that some
students who dropped out continued their studies at
another institution. However, research has shown
that those who change institutions have lower rates
of completion (Berkner et al., 2002; Choy, 2002). This
suggests that it is important to consider the factors
that cause students to leave their first institution.
Persistence may also depend on other financial
factors beyond those considered in this study. These
could include the income of the student’s family,
whether or not the student is dependent on his or her
family for financial support, and whether or not the
assistance received is sufficient to meet the student’s
needs. Non-financial factors, such as academic
preparation prior to university and academic
performance during university, might also play a role.
These factors were beyond the scope of this research.
Indeed, at this time a retrospective study probably
could not include these additional variables, as the
data is not likely available. This study is intended only
as a starting point to begin to understand how finan-
cial aid may affect persistence.
S T U D E N T A I D A N D U N I V E R S I TY P E R S I S T E N C E10

InstitutionsThe six participating institutions represented three
different regions of Canada, although four of the six
were from Ontario. Over half the students were from
Ontario; 29% were from Quebec and 12% were from
British Columbia. Table 1 provides basic information
about each participating institution. Institutions
varied in size and type, although only small- to
moderate-sized universities participated. In terms of
the categorization system used in the Maclean’s
Guide To Canadian Universities (primarily under-
graduate, medical/doctoral, and comprehensive), all
three types of university were represented: 59% of the
students were from comprehensive universities, 22%
from primarily undergraduate universities, and 20%
from medical/doctoral universities. Of course, these
six schools cannot be considered a representative
sample of all Canadian universities.
11
Profile
Region
British Columbia
Ontario
Quebec
All
Institution
Simon Fraser University
Brock University
Carleton University
Lakehead University
University of Ottawa
Concordia University
Maclean’s Category*
Comprehensive
Primarily Undergraduate
Comprehensive
Primarily Undergraduate
Medical/Doctoral
Comprehensive
Number
1,659
1,744
2,237
1,143
2,591
3,906
13,280
% of Total
13%
13%
17%
9%
20%
29%
100%
Table 1 — Participating Institutions by Region, Type and Size
Study Cohort Size
* Based on Maclean’s Guide To Canadian Universities

Study CohortJust over half of the students in the study cohort
(54%) were female. The overall median age at entry11
was 19; it was 22 in the last year of enrolment. A
higher proportion of females than of males were
under the age of 20 at entry (see Figure 1). Detailed
descriptive information about each institution’s
cohort is provided in Appendix B.
About 3% of the students were in five-year
programs, while more than half (56%) were in four-
year programs and the rest (41%) were in three-year
programs. As shown in Table 2, females were more
likely than males to take shorter programs. Younger
students were more likely than older students to be
in longer programs. Of students entering five-year
programs, 70% were under 19 years of age, compared
to 41% entering four-year programs and 16% entering
three-year programs.
S T U D E N T A I D A N D U N I V E R S I TY P E R S I S T E N C E12
11 Age at entry was based on calendar age as of August of the year the student entered the institution. Hence, someone born in August 1980 who enteredin 1998 would be 18, while someone born in September 1980 would be 17 at entry.
% Female
Age 16–18
19
20–23
24+
All
All
54%
31%
40%
23%
5%
5 Year
48%
72%
11%
10%
8%
3%
4 Year
51%
41%
40%
14%
5%
56%
3 Year
58%
16%
43%
36%
6%
41%
Table 2 — Gender and Age Distribution by Program Length
16 to 18
19
20 to 23
24 & older
Figure 1 — Age Distribution by Gender
33% 30%
42% 38%
20% 26%
5% 6%
FemaleMale

Figure 2 shows the status of students at the end of
the five-year tracking period, using the following
classification:
• Completers: degree earned, at any time during the
tracking period.
• Continuers: degree not earned, but still a student
in the last year of tracking period.
• First-year leavers: did not earn more than one
year’s worth of credits and were not enrolled at the
institution in the last year of the tracking period.
These are students who studied for the equivalent
of one year or less in terms of credits earned.
• Other leavers: earned more than one year’s worth
of credits, but did not earn a degree and were not
enrolled in the final year of the tracking period.
These students studied for more than a year, but
had not earned a degree and were not studying at
the end of the tracking period.
In their review of retention and attrition rates,
Grayson and Grayson (2003) found that completion
and drop-out rates vary considerably across institu-
tions and programs of study. However, the five-year
completion rate of 51% for the 1997–98 cohort in this
study appears to be typical. Grayson and Grayson
report that the six-year completion rate for the 1994
cohort from the Consortium for Student Retention
Data Exchange12 was 54% and that the five-year
completion rate for the 1985 cohort of Canadian
university students was 58%.
Of the entire study cohort, 17% were continuers —
that is, they had not earned a degree but were
enrolled at the end of the tracking period. Previous
research has shown that rates of degree completion
continue to increase for a number of years after the
expected date of completion (based on program
length). We would expect, therefore, that the percent-
age of students who complete their degree will
continue to increase after the five-year tracking
period.
Of the study cohort, 14% did not proceed to the
second year of study, and an additional 18% left in a
later year. These attrition rates appear to be some-
what lower than those reported by Grayson and
Grayson, especially for first-year leavers. Grayson
and Grayson reported figures for first-year leavers
between 20 and 25%. Some leavers undoubtedly
went to other institutions, but other research
(Berkner et al., 2002; Choy, 2002) suggests that their
rate of completion will be lower than that of students
who do not change institutions.
13
PersistencePersistence Status at End of Tracking Period
Figure 2 — Persistence Status at End of Tracking Period
ContinuersOther leavers1st year leaversCompleters
51%
17%
18%
14%
12 Based on 405 American colleges and universities, plus McGill University and the University of Toronto.

Table 3 shows that persistence status varied by
gender and age. Females were more likely than males
to be completers (57% vs. 44%), and males were more
likely than females to be leavers (36% vs. 29%).
Students under 20 were more likely than older
students to be completers and less likely to be
leavers. This age difference was apparent despite the
fact that older students were much more likely to be
in shorter programs.
As one would expect, persistence did vary accord-
ing to the length of the program of study. As shown in
Figure 3, just over half the students in three- and
four-year programs (52%) were completers, while the
majority (63%) of students in five-year programs
were continuers. This difference is likely the result of
having only five years to track progress, as students in
three- and four-year programs had more time to
complete their programs. Regardless of program
length, leavers were a minority, although there were
almost twice as many leavers from three- and four-
year programs as from five-year programs. There
were fewer first-year leavers than leavers from other
years, but for each type of leaver, the percentage
declined with program length.
Persistence status also varied by age at the time of
entry, as shown in Figure 4. The persistence pattern
was similar for three- and four-year programs. There
were more completers under 20 than 20 and over,
while there were more leavers in the 20 and over age
group. For five-year programs, the majority of
students under 20 were continuers, while the major-
ity of students 20 and over were leavers.
S T U D E N T A I D A N D U N I V E R S I TY P E R S I S T E N C E14
Female
Male
Age 16–18
19
20–23
24+
All
OtherLeavers
16%
21%
15%
15%
24%
35%
18%
1st-YearLeavers
13%
15%
11%
11%
19%
27%
14%
All Leavers
29%
36%
26%
27%
43%
62%
32%
Continuers
14%
20%
23%
12%
17%
16%
17%
Completers
57%
44%
51%
62%
40%
22%
51%
Table 3 — Persistence Status by Gender and Age Distributions
3-Year 4-Year 5-Year
0%
20%
40%
60%
80%
100%
Figure 3 — Persistence Status by Program Length
CompletersContinuersLeavers
51% 52%
22%
12%18%
63%
36% 30%16%
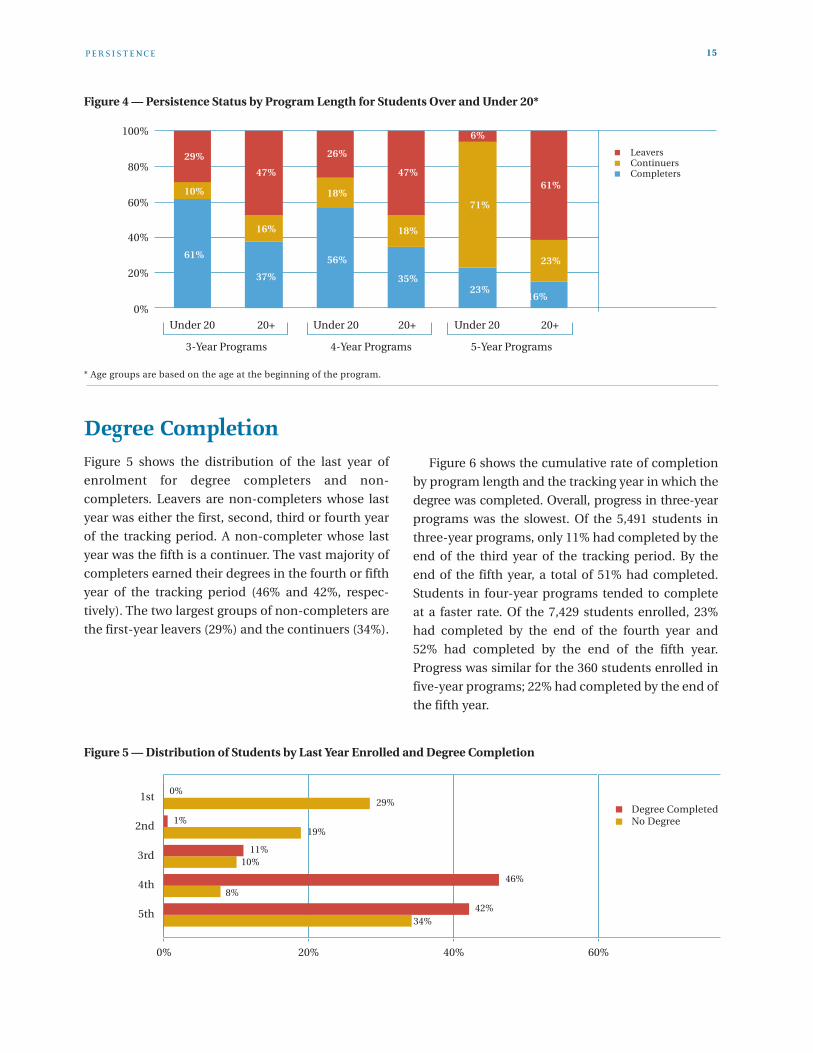
Degree CompletionFigure 5 shows the distribution of the last year of
enrolment for degree completers and non-
completers. Leavers are non-completers whose last
year was either the first, second, third or fourth year
of the tracking period. A non-completer whose last
year was the fifth is a continuer. The vast majority of
completers earned their degrees in the fourth or fifth
year of the tracking period (46% and 42%, respec-
tively). The two largest groups of non-completers are
the first-year leavers (29%) and the continuers (34%).
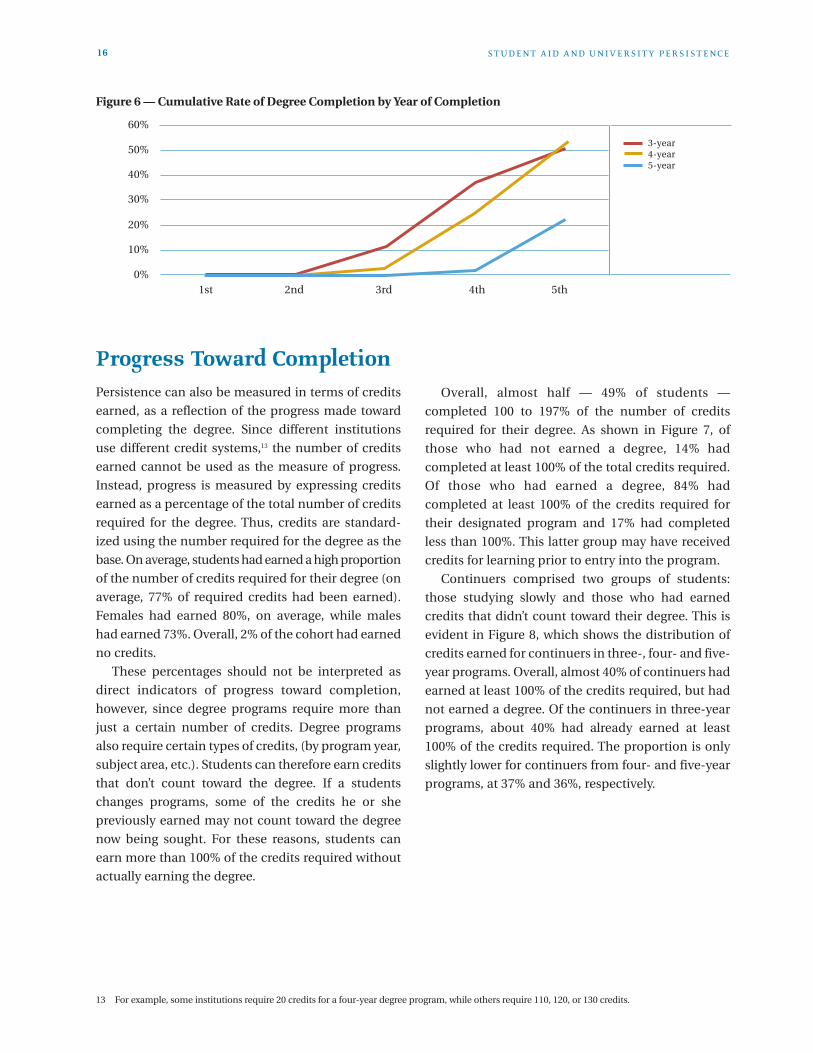
Figure 6 shows the cumulative rate of completion
by program length and the tracking year in which the
degree was completed. Overall, progress in three-year
programs was the slowest. Of the 5,491 students in
three-year programs, only 11% had completed by the
end of the third year of the tracking period. By the
end of the fifth year, a total of 51% had completed.
Students in four-year programs tended to complete
at a faster rate. Of the 7,429 students enrolled, 23%
had completed by the end of the fourth year and
52% had completed by the end of the fifth year.
Progress was similar for the 360 students enrolled in
five-year programs; 22% had completed by the end of
the fifth year.
P E R S I S T E N C E 15
Figure 5 — Distribution of Students by Last Year Enrolled and Degree Completion
Degree CompletedNo Degree
19%
29%
42%
46%
11%
1%
0%
34%
8%
10%
0% 20% 40% 60%
5th
4th
3rd
2nd
1st
Figure 4 — Persistence Status by Program Length for Students Over and Under 20*
LeaversContinuersCompleters
0%
20%
40%
60%
80%
100%
61%
37%
56%
35%23%
16%
10%
16%
18%
18%
71%
23%
29%
47%
26%
47%61%
6%
Under 20 20+ Under 20 20+ Under 20 20+
3-Year Programs 4-Year Programs 5-Year Programs
* Age groups are based on the age at the beginning of the program.
Progress Toward CompletionPersistence can also be measured in terms of credits
earned, as a reflection of the progress made toward
completing the degree. Since different institutions
use different credit systems,13 the number of credits
earned cannot be used as the measure of progress.
Instead, progress is measured by expressing credits
earned as a percentage of the total number of credits
required for the degree. Thus, credits are standard-
ized using the number required for the degree as the
base. On average, students had earned a high proportion
of the number of credits required for their degree (on
average, 77% of required credits had been earned).
Females had earned 80%, on average, while males
had earned 73%. Overall, 2% of the cohort had earned
no credits.
These percentages should not be interpreted as
direct indicators of progress toward completion,
however, since degree programs require more than
just a certain number of credits. Degree programs
also require certain types of credits, (by program year,
subject area, etc.). Students can therefore earn credits
that don’t count toward the degree. If a students
changes programs, some of the credits he or she
previously earned may not count toward the degree
now being sought. For these reasons, students can
earn more than 100% of the credits required without
actually earning the degree.
Overall, almost half — 49% of students —
completed 100 to 197% of the number of credits
required for their degree. As shown in Figure 7, of
those who had not earned a degree, 14% had
completed at least 100% of the total credits required.
Of those who had earned a degree, 84% had
completed at least 100% of the credits required for
their designated program and 17% had completed
less than 100%. This latter group may have received
credits for learning prior to entry into the program.
Continuers comprised two groups of students:
those studying slowly and those who had earned
credits that didn’t count toward their degree. This is
evident in Figure 8, which shows the distribution of
credits earned for continuers in three-, four- and five-
year programs. Overall, almost 40% of continuers had
earned at least 100% of the credits required, but had
not earned a degree. Of the continuers in three-year
programs, about 40% had already earned at least
100% of the credits required. The proportion is only
slightly lower for continuers from four- and five-year
programs, at 37% and 36%, respectively.
S T U D E N T A I D A N D U N I V E R S I TY P E R S I S T E N C E16
Figure 6 — Cumulative Rate of Degree Completion by Year of Completion
5th4th3rd2nd1st
3-year4-year5-year
0%
10%
20%
30%
40%
50%
60%
13 For example, some institutions require 20 credits for a four-year degree program, while others require 110, 120, or 130 credits.

It is likely that some of those studying more slowly
were not taking full-time course loads each year, and
others were taking time off between years. Students
who had earned credits that did not count toward
their degree could either have been changing
programs or taking courses that did not meet their
program requirements.
P E R S I S T E N C E 17
Figure 7 — Distribution of Students by Percentage of Required Credits Earned and Degree Completion
Degree CompletedNo Degree
0% 20% 40% 60%
4%
54%
14%
14%
0%
0%
2%
14%
46%
38%
4%
10%
0%
1%–49%
50%–74%
75%–99%
100%
>100%
Figure 8 — Distribution of Percentage of Credits Earned by Continuers
< 50%50–74%75–99%100%+
0% 10% 20% 30% 40% 50% 60%
3-year
4-year
5-year
All Programs

Program Length CompletedSince students can study on a full-time or part-time
basis, the percentage of credits earned was used to
estimate the number of years of the program each
student had completed. For example, a student in a
four-year program who had completed 50% of the
credits required would be deemed to have completed
two years of his or her program.14
Figure 9 shows the average length of program
completed as a function of the length of the
program.15 Although students in three-year programs
had an additional two years to complete all three
years, on average only 2.28 years had been
completed, representing 76% of the length of the
program. Students in four-year programs had
completed 3.08 years, on average, or 77% of the
program length. Students in five-year programs
showed faster progress, having completed an average
of 4.15 years, or 83% of the program length.
S T U D E N T A I D A N D U N I V E R S I TY P E R S I S T E N C E18
14 This is only an approximation, as we do not know whether all credits earned count toward the degree requirements.
15 Program length completed is equal to the percentage of credits completed multiplied by program length.
Figure 9 — Years of Program Completed by Program Length
2.3
3.1
4.2
76%77%
83%
0.0
1.0
2.0
3.0
4.0
5.0
3-Year 4-Year 5-Year
Year
s C
om
ple
ted
70%
75%
80%
85%
90%
% o
f Pro
gram
L
engt
h C
om
ple
ted

The students in the study cohort received a total of
$78,918,661 in loans and $17,432,080 in grants over
the five-year tracking period. This includes both
governmental and institutional aid. Some 82% of the
total amount of aid came in the form of loans.
Appendix C provides an overview of the types of
financial aid programs available in the three
provinces participating in this study. The five most
common types of aid available to undergraduate
students that are administered through provincial
student aid programs are:
• Canada Student Loans: Repayable loans to eligible
full-time post-secondary students, funded by the
federal government. Loans are interest-free for up
to six months after a student ceases post-secondary
studies. Generally, the Canada Student Loan
makes up 60% of the total loan amount received.
• Provincial student loans: Repayable loans to eligible
full-time post-secondary students, funded by the
provincial government. Loans are interest-free for
up to six months after a student ceases post-
secondary studies.
• Canada Millennium Scholarship Foundation
bursaries: Non-repayable bursaries in the form of
grants or loan remissions from the Canada
Millennium Scholarship Foundation. Millennium
bursaries are given to eligible undergraduates with
assessed need above a specified threshold who
have completed at least one year of full-time post-
secondary studies.
• Canada Study Grants: Non-repayable financial
assistance for specific students, funded by the
government of Canada. The largest group of recip-
ients consists of students with wholly dependent
children or other relatives. Canada Study Grants
are also available to students with disabilities,
high-need part-time students and women in
certain doctoral studies.
• Provincial grants: Non-repayable grants or loan
remissions for students with annual debt or
assessed need above a specified threshold, funded
by the provincial government.
In addition to these awards, students may have
access to non-repayable institutional aid such as:
• Need-based bursaries: Although these are usually
awarded on the basis of financial need, there may
be other criteria as well.
• Work-study aid: Institutions may provide some
students with part-time on-campus jobs during
the study term. Work-study jobs are designed to
provide financial assistance and employment
experience to students in high financial need.
• Merit scholarships (including one-time entrance
awards, renewable entrance awards and in-course
awards): While most scholarships are based on
academic merit, some are based on athletic or
extracurricular merit, and some include a combi-
nation of academic and non-academic criteria.
19
Student Financial AidDistribution of Financial Aid Dol1lars

Figure 10 shows the distribution of governmental
and institutional aid dollars for 2000–01, based on
data reported by Junor and Usher (2002). The federal
and provincial aid is for all credentials and was
provided by the federal and provincial student aid
programs. The institutional data is based on a survey
of undergraduate merit and need-based awards
conducted by the Canada Millennium Scholarship
Foundation.
Of the governmental and institutional assistance
awarded in 2000–01, 68% was in the form of loans.
The rest consisted of non-repayable aid. Institutional
awards constituted 5% of the total amount of aid dollars
awarded; 95% of institutional funds were awarded by
universities. Merit-based awards represented just
under 3% of all aid, or 9% of non-repayable aid.
Although the data in Figure 10 provide context,
they are not directly applicable to this study. Figure
10 represents all aid provided in 2000–01, while this
study is concerned with the cumulative amount of
aid students received over a five-year period. Figure
10 also includes all types of institutions and credentials,
whereas all of the students in the study cohort were
university students working toward bachelor’s
degrees. They were likely to have higher costs, and
hence more assistance, than those in certificate and
diploma programs.
Eligibility requirements and award programs also
change over time. Figure 10 only covers 2000–01,
while the study cohort spanned the period from
1997–98 to 2003–04. Eligibility for some forms of
non-repayable aid also depends on the year of study:
the Foundation’s millennium bursaries, for instance,
are not available for students in their first year of
post-secondary studies. Many institutional merit
scholarships, on the other hand, are entrance schol-
arships; of the funds awarded as entrance scholar-
ships in 2000–01, 61% could not be renewed.
Although we don’t know what proportion of the
aid awarded to the study cohort was for merit, the
data in Figure 10, suggest that merit awards represent
a very small proportion of all aid dollars (under 3%)
and a small proportion of non-repayable aid (about
9%). For the rest of the report the term grant is used
to refer to all non-repayable aid. This includes a small
amount of merit aid.
S T U D E N T A I D A N D U N I V E R S I TY P E R S I S T E N C E20
Figure 10 — Distribution of Governmental and Institutional Aid Dollars, 2000-01
Canada Study GrantsFoundation Millennium bursariesInstitutionalneed-basedawardsInstitutional merit-based awardsProvincial grants & loan remissionProvincial loansCanada Student Loans
3%3%
8%2%
17%
28%
42%
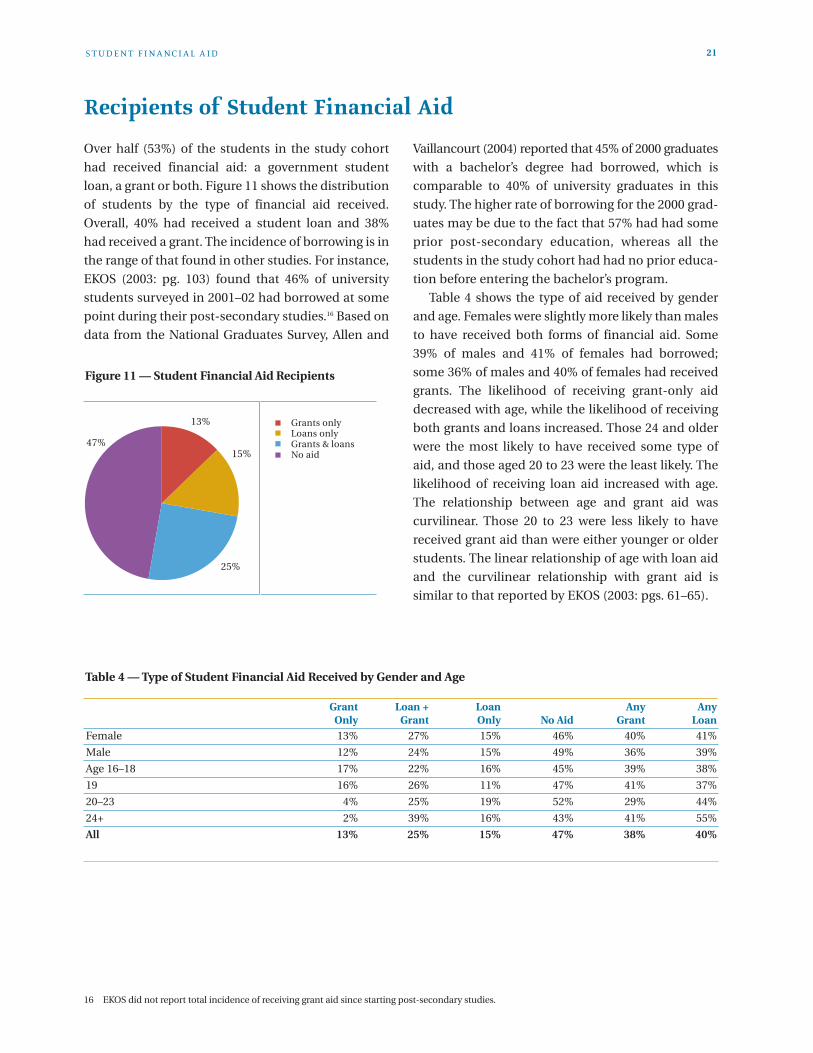
Over half (53%) of the students in the study cohort
had received financial aid: a government student
loan, a grant or both. Figure 11 shows the distribution
of students by the type of financial aid received.
Overall, 40% had received a student loan and 38%
had received a grant. The incidence of borrowing is in
the range of that found in other studies. For instance,
EKOS (2003: pg. 103) found that 46% of university
students surveyed in 2001–02 had borrowed at some
point during their post-secondary studies.16 Based on
data from the National Graduates Survey, Allen and
Vaillancourt (2004) reported that 45% of 2000 graduates
with a bachelor’s degree had borrowed, which is
comparable to 40% of university graduates in this
study. The higher rate of borrowing for the 2000 grad-
uates may be due to the fact that 57% had had some
prior post-secondary education, whereas all the
students in the study cohort had had no prior educa-
tion before entering the bachelor’s program.
Table 4 shows the type of aid received by gender
and age. Females were slightly more likely than males
to have received both forms of financial aid. Some
39% of males and 41% of females had borrowed;
some 36% of males and 40% of females had received
grants. The likelihood of receiving grant-only aid
decreased with age, while the likelihood of receiving
both grants and loans increased. Those 24 and older
were the most likely to have received some type of
aid, and those aged 20 to 23 were the least likely. The
likelihood of receiving loan aid increased with age.
The relationship between age and grant aid was
curvilinear. Those 20 to 23 were less likely to have
received grant aid than were either younger or older
students. The linear relationship of age with loan aid
and the curvilinear relationship with grant aid is
similar to that reported by EKOS (2003: pgs. 61–65).
S T U D E N T F I N A N C I A L A I D 21
Recipients of Student Financial Aid
Figure 11 — Student Financial Aid Recipients
Grants onlyLoans onlyGrants & loansNo aid
13%
25%
15%47%
Female
Male
Age 16–18
19
20–23
24+
All
Any Loan
41%
39%
38%
37%
44%
55%
40%
Any Grant
40%
36%
39%
41%
29%
41%
38%
No Aid
46%
49%
45%
47%
52%
43%
47%
Loan Only
15%
15%
16%
11%
19%
16%
15%
Loan +Grant
27%
24%
22%
26%
25%
39%
25%
Grant Only
13%
12%
17%
16%
4%
2%
13%
Table 4 — Type of Student Financial Aid Received by Gender and Age
16 EKOS did not report total incidence of receiving grant aid since starting post-secondary studies.

Students who had received some aid had received, on
average, $13,802 over the tracking period. This
average does not provide a clear picture, however, as
the amount of aid received by each student varied
from two to six figures. The amount of aid received in
a given year is determined by the student’s assessed
need, which is the difference between his or her
expenses and resources (including, if applicable, the
expected contribution of parents or spouse). The
total amount of aid received over the tracking period
will be determined by the assessed need of the
student each year, the maximum award limits and
the number of years in which the student receives
aid. Hence, part of the variation in aid received is due
to differences in assessed need and part is due to
differences in the number of years in which the
student was enrolled and received aid. To avoid
giving a misleading impression, averages should be
accompanied by information on the distribution of
the amount of aid received.
Total aid received over the tracking period ranged
from a low of $15 to a high of $138,376. Just over half
of aid recipients (53%) received less than $10,000 in
aid. About a fifth (21%) received aid between $10,000
and $19,999, and another quarter (24%) received aid
between $20,000 and $49,999. Only 2% received aid
of $50,000 or more. (Details are provided in Table B.2
in Appendix B.)
Figure 12 shows the distribution of the amount of
aid received by the type of aid. For the 1,669 students
who received only grants, the amount of grant aid
ranged from $15 to $36,700, with an average of
$3,461. Total loans for the 1,944 who received only
loans ranged from $123 to $90,516, with an average of
$14,857 in accumulated loans. The 3,368 recipients of
combined loan and grant aid had the largest range in
total aid received, from a low of $581 to a high of
$138,376,17 with an average of $13,802.
S T U D E N T A I D A N D U N I V E R S I TY P E R S I S T E N C E22
Amount and Type of Aid Received
Figure 12 — Distribution of Aid Recipients by Type and Total Amount of Aid
< $10,000$10,000–$19,999$20,000–$39,999$40,000+
3,709
842
1,317
1,550101
371
1,026
1,498
18
1,164
234
1,416
22
0
336
358
0 500 1,000 1,500 2,000 2,500 3,000 3,500 4,000
Grant only
Loan only
Grant + loan
All Recipients
17 Two Ontario students in the study cohort each received more than $100,000 in total aid over the course of the five years. One had received $138,376, ofwhich $135,076 was loan aid, and the other had received $121,180, of which $120,180 was loan aid. Although these amounts may seem implausible,McElroy (2004) reported accumulated student loans for B.C. undergraduate students up to $100,320. The maximum lifetime combined Canada-Ontariostudent loan limit is currently $170,000. This is based on 340 weeks of study at $500 per week—the maximum amount available for someone withdependants. It is likely that these two students had dependants, and were enrolled in programs that were at or near 52 weeks per year.

Most of the recipients of very small amounts of aid
received all of this in the form of grant aid: 90% of the
992 students who received aid of $1,500 or less
received only grants. On the other hand, almost all
(96%) of the 127 recipients of high amounts of aid
($50,000 or more) received a combination of grant
and loan aid.
Table 5 shows the average amount of grant, loan
and total aid received by gender and age (medians
are in Appendix B). There were few differences
between females and males; females had somewhat
higher amounts of loan aid than males, but amounts
of grant aid were similar. Students who were 24 or
older at entry had, on average, more grant aid and
somewhat more loan aid than younger students. This
age difference may be because older students are
more likely to have dependants, and hence higher
assessed needs, which increases the aid for which
they are eligible. Some grants, such as the Foundation’s
millennium bursaries (which represent 25% of grant
aid awarded in 2000–01), are only available to high-
need students Some grants are specifically for
students with dependants, such as the Canada Study
Grant for students with dependants.
The amount of aid received increased with the
number of years in school, as is shown in Figure 13.
This would be expected, since the more time a
student spends in school, the more aid he or she can
accumulate.
S T U D E N T F I N A N C I A L A I D 23
Table 5 — Average Total Student Financial Aid by Gender and Age at Entry
Females
Males
Age 16–18
Age 19
Age 20–23
Age 24+
Total
Mean
$13,971
$13,592
$13,220
$12,096
$15,679
$22,027
$13,802
No.
3,866
3,115
2,295
2,816
1,456
414
6,981
Total Aid
Mean
$15,095
$14,562
$15,575
$14,183
$14,456
$16,693
$14,857
No.
2,935
2,377
1,586
1,984
1,342
400
5,312
Student Loans
Mean
$3,431
$3,499
$3,434
$2,680
$3,861
$8,221
$3,461
No.
2,829
2,208
1,642
2,210
888
297
5,037
Grants
Figure 13 — Number of Years Completed by Amount of Financial Aid Received
2.5
2.8
3.0
3.4
3.6
3.9
4.1
0 1 2 3 4 5
No Aid
< $10,000
$10,000–$19,999
$20,000–$29,999
$30,000–$39,999
$40,000–$49,999
$50,000+

Loan Recipients
Figure 14 compares the distribution of total loan aid
received by the study cohort with that received by the
members of the Class of 2000 surveyed in the
National Graduates Survey (Allen & Vaillancourt,
2004). As mentioned, the incidence of borrowing was
somewhat higher for the 2000 graduates, perhaps
because this group includes students who already
had some post-secondary experience before
enrolling in a bachelor’s program. Despite this differ-
ence, study cohort graduates and 2000 graduates had
similar distributions of student loan debt. The most
notable difference is that fewer study cohort gradu-
ates had accumulated loans between $10,000 and
$25,000, and more had no loans. Compared with the
entire study cohort, study cohort graduates were
more likely to have accumulated loans of $25,000 or
more, and less likely to have loans under $10,000.
Grant Recipients
Of the grant recipients, some received only grant aid,
while others received both loan and grant aid. Those
who had received only grant aid represented one-
third of all grant recipients. Grant-only recipients
tended to receive smaller grants, on average ($3,027),
than did those who received both loans and grants
($3,676).
For recipients of both loan and grant aid, the
average amount of total grant aid tended to increase
with the total amount of loan aid. This is illustrated in
Figure 15, which also shows the average total grant
for the grant-only group. This relationship would be
expected, since eligibility for loans and need-based
grants depends on the same measure: assessed need.
(More detailed results are provided in Appendix B.)
S T U D E N T A I D A N D U N I V E R S I TY P E R S I S T E N C E24
0%
20%
40%
60%
80%
100%
Figure 14 — Distribution of Total Loan Aid for Cohort Graduates and 2000 Graduates
$25,000 and over$10,000 - $24,999$5,000 - $9,999Less than $5,000No loan
55%
4%7%
20%
14%
60%
7%
8%
14%
10%
60%
10%
13%
12%5%
Total Study Cohort
Study Cohort
Graduates
2000 Bachelor Graduates
Figure 15 — Average Total Grant Aid for Those Who Received Both Loan and Grant Aid
$2,000
$2,500
$3,000
$3,500
$4,000
$4,500
$5,000
Grant Only
Group
up to$5,000
$5,001–$10,000
$10,001–$15,000
$15,001–$20,000
$20,001–$30,000
over$30,000
Total Loan Aid

Total Aid Received by Completers, Continuers and Leavers
The type and amount of financial aid received varied
somewhat with the students’ persistence status at the
end of the tracking period, as is shown in Table 6.
Completers and continuers were both more likely
than leavers to have received grant aid. Of all groups,
first-year leavers were the least likely to have received
aid, especially grant aid. Among those who received
aid, leavers received the smallest average amount of
aid — which is to be expected, since they had less
time to receive it.
Figure 16 shows the distribution of type of aid
received: Figure 17 shows the amount of total aid
received. Completers were the least likely to have
received loan-only aid and the most likely to have
received grant aid, either with or without loan aid.
Continuers and leavers received similar amounts of
loan-only aid, but continuers were more likely than
leavers to have received grant aid. The distribution of
amount of total aid received was similar for
completers and continuers, but leavers were less
likely than others to receive aid above $10,000.
S T U D E N T F I N A N C I A L A I D 25
Table 6 — Financial Aid Received by Completers, Continuers and Leavers
Completers
Continuers
All Leavers
1st-Year Leavers
Other Leavers
Mean
$14,930
$16,172
$10,022
$6,060
$12,454
%
57%
55%
45%
39%
49%
All Aid
Mean
$17,135
$16,888
$9,975
$6,090
$12,310
%
40%
43%
39%
33%
43%
Loan Aid
Mean
$3,619
$4,192
$2,448
$1,902
$2,685
%
46%
37%
25%
18%
31%
Grant Aid
Means are based on only those in the sub-group who received the type of aid.
0%
20%
40%
60%
80%
100%
Figure 16 — Distribution of Type of Aid Received by Completers, Continuers and Leavers
Grant onlyLoan + GrantLoan onlyNo Aid
43% 45%55%
11%18%
19%29%25%
19%17% 12%
6%
Completers Continuers Leavers0%
20%
40%
60%
80%
100%
Figure 17 — Distribution of Amount of Total Aid Received by Completers, Continuers and Leavers
$30,000 & above$10,000–$29,999Under $10,000No Aid
Completers Continuers Leavers
43% 45%55%
28% 25%
29%
19% 20%
14%9% 10%
2%
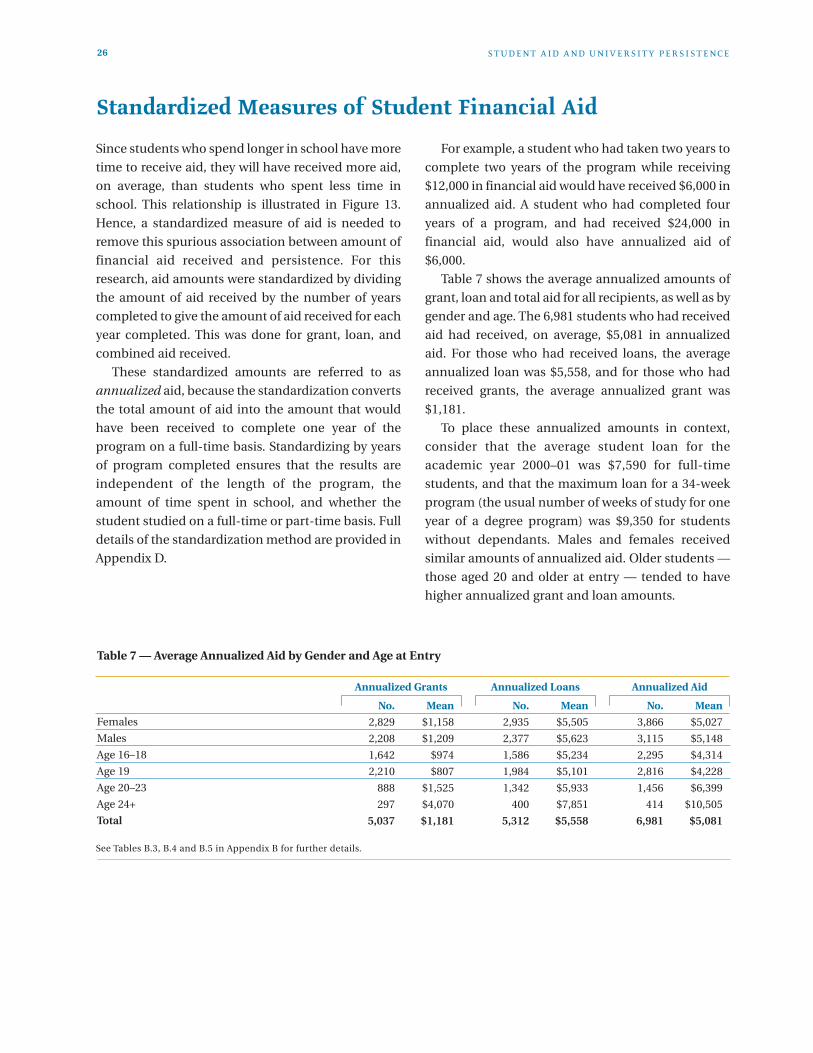
Since students who spend longer in school have more
time to receive aid, they will have received more aid,
on average, than students who spent less time in
school. This relationship is illustrated in Figure 13.
Hence, a standardized measure of aid is needed to
remove this spurious association between amount of
financial aid received and persistence. For this
research, aid amounts were standardized by dividing
the amount of aid received by the number of years
completed to give the amount of aid received for each
year completed. This was done for grant, loan, and
combined aid received.
These standardized amounts are referred to as
annualized aid, because the standardization converts
the total amount of aid into the amount that would
have been received to complete one year of the
program on a full-time basis. Standardizing by years
of program completed ensures that the results are
independent of the length of the program, the
amount of time spent in school, and whether the
student studied on a full-time or part-time basis. Full
details of the standardization method are provided in
Appendix D.
For example, a student who had taken two years to
complete two years of the program while receiving
$12,000 in financial aid would have received $6,000 in
annualized aid. A student who had completed four
years of a program, and had received $24,000 in
financial aid, would also have annualized aid of
$6,000.
Table 7 shows the average annualized amounts of
grant, loan and total aid for all recipients, as well as by
gender and age. The 6,981 students who had received
aid had received, on average, $5,081 in annualized
aid. For those who had received loans, the average
annualized loan was $5,558, and for those who had
received grants, the average annualized grant was
$1,181.
To place these annualized amounts in context,
consider that the average student loan for the
academic year 2000–01 was $7,590 for full-time
students, and that the maximum loan for a 34-week
program (the usual number of weeks of study for one
year of a degree program) was $9,350 for students
without dependants. Males and females received
similar amounts of annualized aid. Older students —
those aged 20 and older at entry — tended to have
higher annualized grant and loan amounts.
S T U D E N T A I D A N D U N I V E R S I TY P E R S I S T E N C E26
Standardized Measures of Student Financial Aid
No.
2,829
2,208
1,642
2,210
888
297
5,037
Table 7 — Average Annualized Aid by Gender and Age at Entry
Females
Males
Age 16–18
Age 19
Age 20–23
Age 24+
Total
Mean
$5,027
$5,148
$4,314
$4,228
$6,399
$10,505
$5,081
No.
3,866
3,115
2,295
2,816
1,456
414
6,981
Annualized Aid
Mean
$5,505
$5,623
$5,234
$5,101
$5,933
$7,851
$5,558
No.
2,935
2,377
1,586
1,984
1,342
400
5,312
Annualized Loans
Mean
$1,158
$1,209
$974
$807
$1,525
$4,070
$1,181
Annualized Grants
See Tables B.3, B.4 and B.5 in Appendix B for further details.

Annualized amounts should not be interpreted as
the actual aid received each year. A student could, for
instance, receive the maximum loan each year by
taking 60% of a full course load. At this rate, it would
take the student five years to complete a three-year
program. A student receiving $9,350 in loan aid each
calendar year would have accumulated $46,750 in
loan aid. However, since the student only completed
three program years, the annualized loan would be
$15,583. A student who took only three years to
complete the same three-year program and received
$9,350 in loans each calendar year would have an
annualized loan of $9,350. Annualized amounts
reflect the aid required to complete one year of study
on a full-time equivalency basis. The difference in the
annualized aid received by the two students reflects
the additional cost of studying at a slower pace.
Table 8 shows the amounts of annualized aid that
went to recipients of grant-only, loan-only and grant-
plus-loan aid. Those who had received both loan and
grant aid had higher amounts of annualized grant
aid, on average, than did those who had received only
grant aid. This would be expected for need-based
grants, since many need-based grants are based on
assessed need, which is also the basis for loans (and,
as discussed earlier, many grants are only available to
students with high levels of need, who will have
received larger loans than students with lower levels
of need). The grant-plus-loan aid group had higher
levels of annualized loan aid than had the loan-only
group. With its higher annualized loan aid and higher
annualized grant aid, the grant-plus-loan group had
annualized aid that was, on average, $2,637 higher
than the annualized aid of the loan-only group.
Loan Recipients
The study cohort includes two groups who received
loan aid: the loan-only group and the grant-plus-loan
group. Table 9 shows the average amount of annual-
ized total aid and annualized loan aid received by
each group, broken into categories.
For recipients of annualized aid under $3,000, the
two groups had similar levels of annualized total aid.
However, grant-plus-loan recipients who received
annualized aid in the $3,000 to $9,999 range received
$526 more in annualized aid, on average, than did
loan-only recipients in this range. On the other hand,
loan-only recipients of annualized aid of $10,000 and
above received $1,267 more in annualized aid than
did grant-plus-loan recipients.
The loan-only group had higher levels of annual-
ized loan aid than did the grant-plus-loan group for
every amount of annualized total aid. The difference
tended to increase as the amount of annualized total
aid increased; it was greatest for recipients of $10,000
or more in annualized aid. In this group, loan-only
recipients had $3,896 more, on average, in annual-
ized loan aid than did the grant-plus-loan group. In
other words, as the amount of annualized aid
increased, the amount of accumulated annualized
loan aid received by the loan-only group increased at
a faster rate. Loan-only recipients of $10,000 or more
in annualized aid had annualized loan aid of $15,241,
on average, compared to only $622 for loan-only
recipients of annualized aid under $1,000.
S T U D E N T F I N A N C I A L A I D 27
Number of Students
Average Annualized Grant Aid
Average Annualized Loan Aid
Average Annualized Total Aid
All AidRecipients
6,981
$852
$4,229
$5,081
Loan-OnlyRecipients
1,944
–
$4,730
$4,730
Grant + LoanRecipients
3,368
$1,331
$6,036
$7,367
Grant-OnlyRecipients
1,669
$877
–
$877
Table 8 —Average Annualized Aid by Type of Aid Received
See Table B.2 in Appendix B for medians and ranges.

Annualized Grant and Loan Aid
Annualized grant amounts tended to increase as the
annualized loan amount increased. This correlation
is illustrated in Figure 18, which also shows the
average annualized grant amount for the grant-only
group. This relationship is similar to that between
total grant aid and total loan aid, previously depicted
in Figure 15.
Annualized Aid Received by Completers,Continuers and Leavers
Different persistence groups received different
amounts of total aid. They also received different
amounts of annualized aid. However, since annual-
ized aid eliminates differences due to the amount of
time spent in school, annualized aid produced a
different pattern.
S T U D E N T A I D A N D U N I V E R S I TY P E R S I S T E N C E28
Table 9 — Average Annualized Total Aid and Annualized Loan Aid Received by Loan Recipients
Loan-OnlyRecipients
$622
$1,462
$2,489
$5,809
$15,241
Grant + LoanRecipients
$442
$1,077
$1,927
$5,272
$11,345
Loan-OnlyRecipients
$622
$1,462
$2,489
$5,809
$15,241
Grant + LoanRecipients
$686
$1,516
$2,501
$6,334
$13,975
Annualized Aid
Aid under $1,000
$1,000–$1,999
$2,000–$2,999
$3,000–$9,999
$10,000+
Average Annualized Loan AidAverage Annualized Total Aid
Figure 18 — Annualized Grant Aid by Amount of Annualized Loan Aid
$0
$400
$800
$1,200
$1,600
$2,000
Grant OnlyGroup
Under $2,000 $2,000–$3,999 $4,000–$5,999 $6,000–$8,999 $9,000+
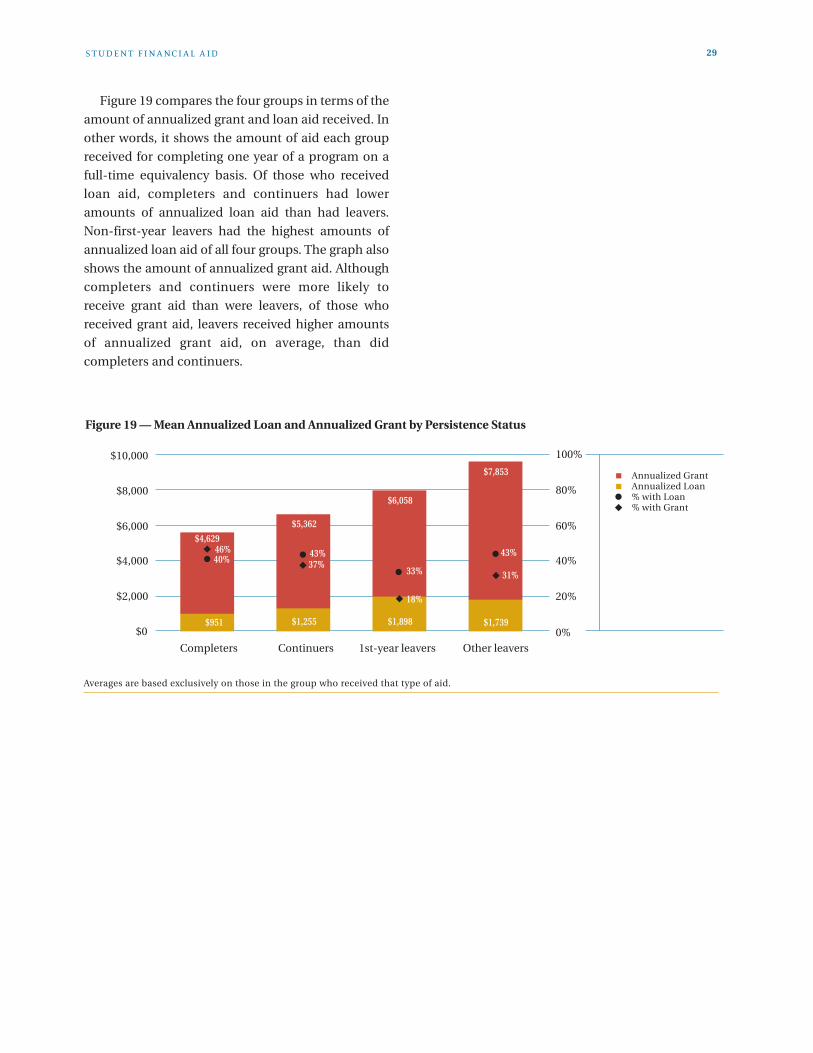
Figure 19 compares the four groups in terms of the
amount of annualized grant and loan aid received. In
other words, it shows the amount of aid each group
received for completing one year of a program on a
full-time equivalency basis. Of those who received
loan aid, completers and continuers had lower
amounts of annualized loan aid than had leavers.
Non-first-year leavers had the highest amounts of
annualized loan aid of all four groups. The graph also
shows the amount of annualized grant aid. Although
completers and continuers were more likely to
receive grant aid than were leavers, of those who
received grant aid, leavers received higher amounts
of annualized grant aid, on average, than did
completers and continuers.
S T U D E N T F I N A N C I A L A I D 29
Figure 19 — Mean Annualized Loan and Annualized Grant by Persistence Status
Annualized GrantAnnualized Loan% with Loan% with Grant
0%
20%
40%
60%
80%
100%
Completers Continuers 1st-year leavers Other leavers
$0
$2,000
$4,000
$6,000
$8,000
$10,000
$5,362
$6,058
$7,853
$951 $1,255 $1,898 $1,739
$4,62943%
33%
43%40%
18%
37%31%
46%
Averages are based exclusively on those in the group who received that type of aid.


Persistence is positively related to the amount of total
aid received. The more aid dollars a student received,
the more required credits were earned, on average,
and the greater the likelihood of completing a degree.
However, this positive relationship may only reflect
the fact that the longer someone spends in school the
more aid dollars they can receive, all else being equal.
When aid amounts are annualized, the relationship
between persistence and annualized aid is negative.
The percentage of required credits earned and the
likelihood of completing a degree declined as annu-
alized aid increased. Figure 20 illustrates this for
required credits earned. Figure 21 shows the relationship
for degree completion. Since annualized aid removes
the association between persistence and number of
years in school, it is used in all subsequent analyses.
31
Persistence and StudentFinancial AidPersistence, Total Aid and Annualized Aid
Figure 20 — Percentage of Required Credits Earned in Relation to Total Aid and Annualized Aid
40%
50%
60%
70%
80%
90%
100%
110%
Under$1,000
$1,000–$1,999
$2,000–$2,999
$3,000–$9,999
$10,000+
Annualized Aid
Under$10,000
$10,000–$19,999
$20,000–$29,999
$30,000–$39,999
$40,000+
Total Aid
No AidNo Aid

To determine whether student aid may have an
impact on persistence, we examined the relationship
between persistence and the amount of annualized
aid received. The graphs in Figure 22 illustrate the
relationship between two measures of persistence
(progress and completion) and annualized aid for
recipients of different types of aid (grant-only, loan-
only or grant-plus-loan). For comparison, both graphs
also show the results for students who had received
no aid.
To graph the results, annualized aid was grouped
into five categories. The groupings were determined
to yield a sufficient number of observations for each
combination of annualized aid and type of aid. (The
annualized aid categories and the number of
students in each group, as well as the mean and
median amounts of annualized aid, are shown in
Table B.7 in Appendix B.)
There was no relationship between any measure of
persistence and annualized aid for grant-only recipi-
ents. However, for recipients of loan aid, persistence
declined as annualized aid levels increased. This was
true for both the loan-only and grant-plus-loan
groups, for any measure of persistence used: earning
a degree (completion), percentage of the required
credits earned (progress) or length of program
completed. However, persistence was higher for
those who also received grant aid than for those who
received only loan aid. That is, the persistence of
students with loans and grants was better: they had
completed more of their programs, had earned more
credits and were more likely to have earned a degree
than were those with similar aid levels who had
received only loan aid.
Persistence was highest for those who had
received both loan and grant aid, especially if the
annualized amount was under $3,000. As annualized
aid increased, the percentage of required credits
earned by this group declined from 101% to 72%, and
the percentage who completed a degree decreased
from 79% to 38%. Persistence was lowest for those
who received loan-only aid, especially those with
annualized loan aid of $3,000 or more. As the amount
of annualized aid received by loan-only recipients
increased, the average percentage of required credits
earned declined from 91% to 44% and the percentage
of recipients who had completed a degree decreased
from 59% to 8%.
S T U D E N T A I D A N D U N I V E R S I TY P E R S I S T E N C E32
Figure 21 — Degree Completion in Relation to Total Aid and Annualized Aid
Under$1,000
$1,000–$1,999
$2,000–$2,999
$3,000–$9,999
$10,000+
Annualized Aid
Under$10,000
$10,000–$19,999
$20,000–$29,999
$30,000–$39,999
$40,000+
Total Aid
No AidNo Aid
20%
30%
40%
50%
60%
70%
80%
The Relationship Between Annualized Aid and Persistence
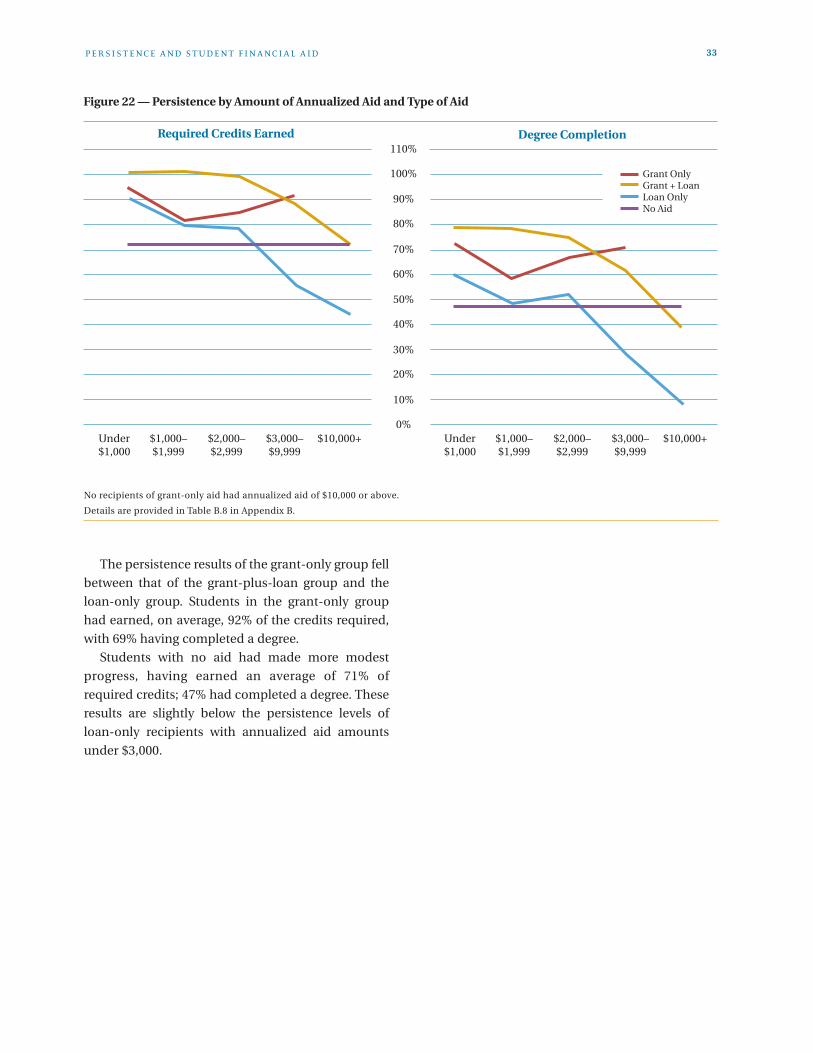
P E R S I S T E N C E A N D S T U D E N T F I N A N C I A L A I D 33
Figure 22 — Persistence by Amount of Annualized Aid and Type of Aid
Degree CompletionRequired Credits Earned
Under$1,000
$1,000–$1,999
$2,000–$2,999
$3,000–$9,999
$10,000+Under$1,000
$1,000–$1,999
$2,000–$2,999
$3,000–$9,999
$10,000+
Grant OnlyGrant + LoanLoan OnlyNo Aid
0%
10%
20%
30%
40%
50%
60%
70%
80%
90%
100%
110%
No recipients of grant-only aid had annualized aid of $10,000 or above.
Details are provided in Table B.8 in Appendix B.
The persistence results of the grant-only group fell
between that of the grant-plus-loan group and the
loan-only group. Students in the grant-only group
had earned, on average, 92% of the credits required,
with 69% having completed a degree.
Students with no aid had made more modest
progress, having earned an average of 71% of
required credits; 47% had completed a degree. These
results are slightly below the persistence levels of
loan-only recipients with annualized aid amounts
under $3,000.

Predictors of PersistenceOne way to measure the relationship between
persistence and financial aid is to determine how
well persistence can be predicted using the various
aid variables. In this study we used regression model-
ling to identify the best predictors of progress
(i.e., percentage of required credits completed). Since
degree completion is a dichotomous variable, we
used logistic regression to identify the best predictors
of completion.
As the review of the research on retention and
attrition has shown, many factors affect persistence,
including psychological traits. Given the limited
number of variables available in this study, it is
not possible to develop a full model to predict
persistence. The purpose of the modelling in this
study is simply to compare the predictive power of
the variables available.
We developed models to predict persistence using
the variables available for this data. The non-finan-
cial variables were gender, age at entry and program
length.18 The financial variables were the type of aid
received (none, loan-only, grant-only, loan plus
grant) and the amount of annualized aid received.19
Categorical variables were coded as indicator vari-
ables in the model. (See Appendix E for information
on the coding used.) The interaction of aid type by
annualized aid was also included as a possible
predictor.
Figure 23 compares the actual progress results with
the predictions made by the model. This model
accounts for 13 percent of the variation in progress. All
variables in the model are significant. However,
although the overall interaction effect of aid type by
annualized aid is significant, the specific interaction
for the grant-only group is not significant. This means
that the slope of the line relating progress to aid is the
same for the grant-only and loan-plus-grant groups
(the reference group). The slope of the line for the
loan-only group is somewhat steeper, that is, as aid
increases, progress decreases at a somewhat faster rate
for the loan-only group than for the other two.
The means of the actual and predicted measures
of persistence, as well as regression results for
predicting progress and completion are presented in
Appendix E.
The model predicts the no aid and grant-plus-loan
groups very well. For the grant-only group the model
smoothes out the variations over annualized aid
and predicts a slight decline with aid, which is not
evident in the observed data. For the loan-only
group, however, the model tends to predict lower
values of progress than are actually observed in the
data, especially at higher levels of annualized aid.
This model only explains 13% of the variation in
progress, which means that 87% is unexplained.
Obviously there is more to predicting persistence
than the few variables available in this study. None
the less, this analysis does demonstrate that the
amount and type of aid is related to persistence.
Persistence declines for those with high levels of
annualized aid, and persistence is best with both
grant and loan aid combined.
The logistic model to predict degree completion
(using the same variables) shows similar results,
predicting the no aid and grant-plus-loan groups
very well. It also smoothes out the variation for the
grant-only group, predicting a decline that is not in
the observed data. However, the completion model
does not have the same problem of under predicting
for the loan-only group. This model predicts the loan-
only results much better than does the model for
progress. Figure 24 compares the actual completion
results with the predictions made by the model.
This model accounts for 14 percent of the varia-
tion in completion. All variables in the model are
significant, except for the interaction with annual-
ized aid for the grant-only group. This model
correctly predicts degree completion for 70% of those
who did complete. However it correctly predicts
failure to complete a degree for only 58% of those
who did not complete. Overall, the predictions are
correct 64% of the time.
S T U D E N T A I D A N D U N I V E R S I TY P E R S I S T E N C E34
18 Although there are three different program lengths, only 3% of the students were enrolled in five-year programs. So only two groups were used forregression purposes: three years and four or more years.
19 Technically there are two other financial variables, annualized loan and annualized grant. We cannot include both of these in the model, since loan plusgrant equals aid. This means we can completely predict one predictor, which makes one of them redundant. In addition, all three variables have a valueof 0 for the no aid group. The result is that aid is highly related to each of the other two. Two highly related variables cause problems of multicollinear-ity in the model. Hence only annualized aid is used in any model.

P E R S I S T E N C E A N D S T U D E N T F I N A N C I A L A I D 35
Figure 23 Actual and Predicted Progress
Predicted ProgressActual Progress
Under$1,000
$1,000–$1,999
$2,000–$2,999
$3,000–$9,999
$10,000+Under$1,000
$1,000–$1,999
$2,000–$2,999
$3,000–$9,999
$10,000+
Grant OnlyGrant + LoanLoan OnlyNo Aid
0%
10%
20%
30%
40%
50%
60%
70%
80%
90%
100%
110%
Figure 24 — Actual and Predicted Completion
Predicted CompletionActual Completion
Under$1,000
$1,000–$1,999
$2,000–$2,999
$3,000–$9,999
$10,000+Under$1,000
$1,000–$1,999
$2,000–$2,999
$3,000–$9,999
$10,000+
Grant OnlyGrant + LoanLoan OnlyNo Aid
0%
10%
20%
30%
40%
50%
60%
70%
80%
90%
100%

Aid Recipients
Two of the important predictors, type of aid and
amount of annualized aid received, apply only to aid
recipients. Its is not surprising then that there is so
much unexplained variation in persistence. However,
when the no-aid group is omitted when generating a
model to predict progress, the predictive power of the
model increases by 5 percent. There was a similar
increase in the predictive power of the model predict-
ing completion.
This still leaves over 80 percent of unexplained
variation in predicting persistence for aid recipients.
This suggests that most of the unexplained variation
is due to factors that are beyond the scope of the
project.
One way to test the importance of the aid variables
is to remove the non-aid variables (age, gender and
program length) from the model. This subset model
accounts for 17% of the variation in progress for aid
recipients. A subset model of only age, gender and
program length only accounts for 4% of the variation
in progress. For completion, the subset model with
aid variables accounts for 17% of the variation while
the subset model of only non-aid variables accounts
for only 5%. Clearly, aid variables are much stronger
predictors of persistence than are the non-aid vari-
ables in this study.
We know that most aid recipients in this study
were receiving need-based aid because they received
at least some of this aid in the form of student loans,
which are always based on financial need. Loan
recipients represent 76% of all aid recipients. Those
who received only grants could be recipients of
need-based or merit-based aid. (We were not able
to separate need-based and merit-based grants,
because we lacked information about the rationale
for awarding the grants.) As presented previously in
Figure 11, less than 3% of all government and institu-
tional aid is merit-based. Given this, it is likely that
most of the grant aid that loan recipients received
was also need-based.
Using the original predictors, a model was gener-
ated on just the loan recipient data — those with and
without grants. There was little change from the aid
recipients model for either measure of persistence,
progress or completion. The predictive power of the
model increased by less than one percent and the
coefficients were almost identical. Hence when we only
include students with need-based aid the predictors
of persistence remain the same. Persistence declines
as amount of annualized aid increases, and is higher
if some of the aid is a non-repayable grant.
Excluding Quebec
Since the post-secondary system in Quebec is so
different from that in the rest of the country,20 it is
important to determine whether the inclusion of
Quebec in the model makes a difference in predicting
persistence. This was done by using the original
predictors on the data excluding Quebec.
Figure 25 shows the results for progress, compar-
ing this model to the model generated from all the
data, originally shown in Figure 23, except that the
means of the predicted values shown in Figure 25 are
only for Ontario and BC. Whether or not Quebec is
included in the data used to generate the model
makes little difference. There is a slight decrease in
the variation explained by the model excluding
Quebec (from 13 to 11%). However, the means of the
predicted values from both models are almost identical.
Figure 26 shows the same comparison for the
completion measure. There is little change in the
power of the model to predict completion when
Quebec is excluded. Without Quebec, the model still
accounts for 14% of the variation in completion, and
predicts 64% of the cases correctly. The only change is
that without Quebec there is a slight improvement in
predicting completion for those who did complete
(from 70% to 75%), and a slight decrease for those
who did not complete (from 58% to 51%).
S T U D E N T A I D A N D U N I V E R S I TY P E R S I S T E N C E36
20 Quebec students must receive a college diploma (a two-year program) before beginning university studies. As a result, compared to other jurisdictionsuniversity students in Quebec are generally older when they begin their university studies, and entering university is their second transition sincecompleting high school.

The models compared in Figures 25 and 26
demonstrate that whether or not Quebec is included
when generating the model makes no meaningful
difference in the result. The pattern relating persistence
and aid remains the same. Persistence declines as
levels of annualized aid increase, and persistence is
best when the aid consisted of both grants and loans.
P E R S I S T E N C E A N D S T U D E N T F I N A N C I A L A I D 37
Figure 25 –Predicted Progress for Ontario and British Columbia Based on the Original Model (generated from All Data) and the Model generated from the Data excluding Quebec
Model without QuebecOriginal Model
Under$1,000
$1,000–$1,999
$2,000–$2,999
$3,000–$9,999
$10,000+Under$1,000
$1,000–$1,999
$2,000–$2,999
$3,000–$9,999
$10,000+
Grant OnlyGrant + LoanLoan OnlyNo Aid
0%
10%
20%
30%
40%
50%
60%
70%
80%
90%
100%
110%

S T U D E N T A I D A N D U N I V E R S I TY P E R S I S T E N C E38
Figure 26 — Predicted Completion for Ontario and British Columbia Based on the Original Model (generated from All Data) and the Model generated from the Data excluding Quebec
Model without QuebecOriginal Model
Under$1,000
$1,000–$1,999
$2,000–$2,999
$3,000–$9,999
$10,000+Under$1,000
$1,000–$1,999
$2,000–$2,999
$3,000–$9,999
$10,000+
Grant OnlyGrant + LoanLoan OnlyNo Aid
0%
10%
20%
30%
40%
50%
60%
70%
80%
90%
100%
This study illustrates the variability in the amount
and type of financial aid received by undergraduate
university students. Just under half of all students in
the study cohort received no financial aid; about 40%
received loan aid, including 15% who received only
loan aid; 38% received grant aid, including 13% who
received only grant aid; overall, about a quarter
received both grant and loan aid. Graduates in the
study cohort who had received loan aid had accumu-
lated student loan debt of $17,135, on average.
However, loan debt ranged from a low of $103 to a
high of $135,076. About 25% of the graduates with
loan aid had accumulated debt above $25,600,
including 1% with accumulated debt of $55,000
or more.
This study also shows that the persistence of
students in undergraduate degree programs can be
related to the type and amount of financial aid
received. At the universities included in this study,
the higher the amount of annualized aid received, the
lower the level of persistence. However, receiving
grant aid was positively associated with persistence.
Those who received both grant and loan aid had
higher levels of persistence than those who received
the same annualized amount of aid, all in the form of
a loan.
The group with the lowest level of persistence had
the highest amount of annualized aid — $10,000 or
more — in the form of loans only. These students had
earned, on average, 44% of required credits; only 8%
had completed a degree. In contrast, those who had
received some of their aid in the form of a grant had
considerably higher levels of persistence. With
similar amounts of annualized aid, they had earned,
on average, 72% of required credits; 38% had
completed a degree.
Persistence was highest for those with the lowest
amounts of annualized aid — under $1,000 — who
had received some of this aid in the form of a grant.
They had earned 100% of the required credits, on
average; 79% of them had completed a degree. Loan-
only recipients of annualized aid under $1,000 had
somewhat lower levels of persistence — they had
earned 91% of required credits, on average; 59% of
them had completed a degree. The persistence of
grant-only recipients of annualized aid under $1,000
fell between that of the grant-plus-loan recipients
and that of the loan-only recipients. They had earned
95% of the required credits; 72% of them had
completed a degree.
Students who received no aid had persistence
levels that were similar to those of loan-only recipients
with annualized aid under $3,000: they had earned,
on average, 71% of required credits; 47% of them had
completed a degree. The no-aid group may include
students who are supported by their family as well as
others who are paying their own way. It likely
includes more part-time students than do the aid-
recipient groups, since part-time students are less
likely to be eligible for financial aid. Hence, the no-aid
group’s modest persistence may be a reflection of the
mixed composition of this group rather than any
single factor.
Annualized aid is related to total aid, so it captures
all three variables: total aid, load aid, and grant aid,
and is determined by the amount of the student’s
assessed financial need. The higher the assessed
need, the higher the amount of assistance received —
unless aid limits are reached. Hence, differences in
annualized aid amounts reflect differences in levels
of financial need.
39
Summary and Conclusions

Phrased in terms of need, then, this study suggests
that the higher the level of assessed financial need,
the slower the rate of progress and the lower the like-
lihood of completion within a set period of time.
Family income could explain the negative association
between annualized aid and persistence, with
students from low-income families receiving more
aid and having lower levels of persistence. Although
there is some evidence of a positive association
between persistence and family income level
(Berkner et al., 2002; Grayson & Grayson, 2003; Heller,
2003; Reynolds and Weagley, 2003), assessed need is
not directly related to family income.
In a recent paper, Usher (2004) demonstrated that
assessed need and family income are not the same.
He found that students from families with above-
median incomes in 2001 were receiving just over 40%
of the student loan dollars and a similar portion of
need-based grant dollars.
This counterintuitive situation arises from the way
assessed need is determined. Assessed need is the
difference between allowable expenses and
resources. Parental income is counted as a resource,
but only if the student is classified as dependent21 on
parental support. For dependent students, assessed
need declines as family income increases. But no
parental contribution is expected for students who
are classified as independent.22 Usher found that only
about 40% of Canada Student Loan recipients in 2001
were classified as dependent. Because parental
income is not relevant for remaining 60% of recipi-
ents, the amount of assistance they receive does not
reflect family income. Therefore, it is unlikely that
family income can explain the negative association
between annualized aid and persistence.
Students with high annualized aid tended to have
high annualized loan aid. Students with higher annu-
alized loan aid will have more debt than will those
with lower annualized loan aid, if they continue to
study under the same financial conditions. Debt may
provide an explanation for the findings on persist-
ence. As debt increases, persistence declines,
perhaps because students who already owe money
are trying to avoid owing more.
The group with the lowest level of persistence had
the highest amount of debt for the amount of
program they had completed. These were loan-only
recipients with annualized aid of $10,000 and above;
their average annualized loan aid was $15,241. Grant-
plus-loan recipients who had the same amount of
annualized aid — $10,000 and above — had higher
persistence levels and lower levels of debt, with
average annualized loan aid of $11,345.
Students who received a combination of grant and
loan aid had accumulated less debt for the same level
of assistance received, which may explain their
higher levels of persistence. Compared to the loan-only
group, recipients of grant-plus-loan aid had persis-
tence levels that were about 30% higher, on average,
for required credits earned and about 60% higher for
degree completion.
Another possible explanation for the negative
association between persistence and annualized aid
is unmet need. Since a finite amount of assistance is
available, aid authorities impose weekly limits and
lifetime maximums. Students who reach these limits
receive less assistance than they need. Students with
low assessed need are not affected by these limits, but
some of the students with high annualized aid may
have been experiencing “unmet need.” If unmet need
is high enough, a student may not have sufficient
resources to stay in school, or she or he may work
more and study at a slower rate. We have no direct
measure of unmet need in this study, but McElroy
(2004) found that high levels of unmet need in the
first year were associated with reduced likelihood of
continuing into the second year.
S T U D E N T A I D A N D U N I V E R S I TY P E R S I S T E N C E40
21 For student assistance purposes, students are classified as dependent unless they meet one of the following criteria: being married, having children,having spent two years in the labour market while not in school or having been out of secondary school for more than four years.
22 Other factors can affect assessed need as well. On the cost side of the equation, assessed need will be higher, all other factors being equal, for studentswith dependants, those who attend a more expensive program, and those who study away from home. On the resources side, assessed need is lowerwhen students work during the school term.

Although unmet need may explain the negative
association between persistence and annualized aid,
it does not explain the positive association between
persistence and receiving a grant. It may be that both
unmet need and debt aversion contribute to the
persistence patterns observed in this study. If a
student receives some assistance in the form of
grants, he or she will accumulate less debt. But if
unmet need is high, these grants may still leave the
student needing to work too much, or needing to take
time off from school to work. This would explain why
there is a negative relationship between annualized
aid and persistence, both for those who received
grant aid and for those who did not.
Some grants are based on merit; these are usually
given for academic achievement. Since academic
performance has been found to be related to persist-
ence, the positive relationship between grants and
persistence may be due to merit-based aid. Students
with merit-based grants would be expected to have
high levels of academic performance, which may
have an impact on their persistence.
However, since merit aid forms only a small
proportion of student assistance, it is unlikely to have
a large effect in this study. Nor can academic
performance explain the different persistence
patterns of grant-only and grant-plus-loan recipients.
For grant-only recipients, persistence was unrelated
to the amount of annualized aid. However, for grant-
plus-loan recipients, persistence declined as the
amount of annualized aid increased. This difference,
and the fact that almost all forms of need-based aid
include loans,23 may indicate that the grant-only group
received merit-based aid. Academic performance may
influence the persistence of grant-only recipients,
but it cannot explain why persistence declines as
annualized aid increases for grant-plus-loan recipients.
Persistence for the grant-plus-loan group is better
explained by debt aversion and unmet need,
discussed above.
This study demonstrates that averages can be
misleading when describing student aid. In the
current system, students can accumulate over
$100,000 in student loan debt by the time they
complete their first degree. The average debt of the
graduates in this study was only $17,135, which may
be a reasonable amount to expect graduates to repay.
However, graduates at the upper end of the range are
incurring debt that cannot be repaid within a reason-
able time without undue hardship. With interest,
even a debt considerably below $100,000 may be an
unreasonable burden for a new graduate.
This study also demonstrates the importance of
the method used to measure student aid. Students
who stay in school have more time to receive aid, so a
spurious association arises between the amount of
aid received and persistence. This association can be
eliminated by standardizing aid according to pro-
gram years completed.
The more it costs to complete a degree — for the
student aid program, in terms of providing aid, or
for the student, in terms of accumulated debt —
the slower the rate of progress toward completion.
However, this association does not establish causa-
tion. Students may take longer due to higher costs, or
they may incur higher costs because they are taking
longer to complete their degree. It is possible that
both types of students exist. Students who take
longer to complete incur higher costs for themselves
and can cost the student assistance program more.
What are the policy implications of this research?
If the negative association between persistence and
annualized aid is due to debt aversion, then perhaps
loan maximums need to be lower. But if the negative
association is due to unmet need, reducing loans
could reduce persistence by increasing unmet need.
If the benefit of grants is due to debt reduction, then
perhaps grants need to be distributed differently.
Students with high accumulated debt could receive
more grant dollars to keep their debt within a
manageable range, while students with lower debt
could get proportionally less grant aid. However, if
grants have a motivational benefit, it may not matter
who gets them. Students who receive grants may feel
more of a commitment to their studies because of the
support they are given.
S U M M A RY A N D C O N C L U S I O N S 41
23 Most forms of need-based grant aid are only available to recipients of student loans.

Although this study suggests that debt matters, it
does not explain why. Until we know why persistence
declines as amount of annualized aid increases, or
why receiving some grant aid is associated with
higher levels of persistence, we cannot draw any
conclusions for policy. However, we can suggest the
types of questions that future research should
address.
To fully understand the causes of persistence, we
need to know how students weigh each factor when
deciding whether or not to continue in school. The
factors to consider include unmet need, family income
and support, academic performance, as well as the
perceived benefits of a post-secondary education. We
need to know whether students are responding
rationally to financial situations or whether they are
underestimating their ability to repay loans. We also
need to know whether some of the strategies students
use to stay in school are counterproductive — resulting
in high debt, low persistence or both.
We need either a longitudinal study tracking
progress over time or a retrospective study following
up both completers and leavers. This study should
not only collect academic, financial and enrolment
data; it should also ask students the reasons for their
actions. Such a study would make it possible to deter-
mine how factors such as academic performance,
family support, fear of debt and unmet need influ-
ence persistence.
With the right questions, we could understand the
strategies students use to stay in school, such as
changing to less expensive programs or institutions,
studying at a slower rate to work more during school,
stopping out to work for some time or dropping out
altogether. By learning how students make their deci-
sions about attending school and by understanding
the consequences of these actions on persistence, we
can improve the design of financial aid programs.
Ultimately, we should be able to ensure that all those
who are qualified can access post-secondary educa-
tion and complete their program in a timely manner
once they have begun.
S T U D E N T A I D A N D U N I V E R S I TY P E R S I S T E N C E42
Allen, M. & Vaillancourt, C. (2004). Class of 2000: Profile of post-secondary graduates and student debt. Ottawa:
Statistics Canada.
Barr-Telford, L., Cartwright, F., Prasil, S. & Shimmons, K. (2003). Access, persistence and financing: first results
from the post-secondary education participation survey (PEPS). Ottawa: Statistics Canada.
Berkner, L., He, S., Cataldi, E. F. & Knepper, P. (2002). Descriptive summary of 1995–96 beginning post-secondary
students: Six years later. Washington, D.C.: National Center for Education Statistics.
Bowlby, J. W. (2002). At a crossroads: First results for the 18- to 20-year-old cohort of the youth in transition survey.
Ottawa: Human Resources Development Canada and Statistics Canada.
Butlin, G. (2000). Determinants of university and community college leaving. Education Quarterly Review, 6(4),
8–23.
Cervenan, A. & Usher, A. (2004). The more things change: Undergraduate student lining standards after 40 years
of the Canada Student Loans Program. Toronto: Education Policy Institute.
Canadian Education Statistics Council (2003). Education indicators in Canada: report of the Pan-Canadian
Education Indicators Program 2003. Ottawa: Statistics Canada and Council of Ministers of Education, Canada.
Choy, S. P. (2002). Access and persistence: Findings from ten years of longitudinal research on students.
Washington, D.C.: American Council on Education.
Cofer, J. & Somers, P. (2001). What influences student persistence at two-year colleges? Community College
Review, 29(3), 56–76.
EKOS Research Associates (2003). Making ends meet: The 2001–02 student financial survey. Montreal: Canada
Millennium Scholarship Foundation.
Evaluation and Data Development (1997). Evaluation of the Canada Student Loans Program: Final report.
Ottawa: Strategic Policy, Human Resources Development Canada.
Fenske, R. H., Porter, J. D. & DuBrock, C. P. (1999). Analyzing student aid packaging to improve low-income and
minority student access, retention and degree completion. Paper presented to the Annual Forum of the
Association for Institutional Research, Seattle.
Finnie, R. (2002). Student loans: Borrowing and burden. Education Quarterly Review, 8(4), 28–42.
43
Bibliography
Gilbert, S. & Frank, J. (1998). “Educational pathways.” High school may not be enough: An analysis of results from
the School Leavers Follow-up survey, 1995. Ottawa: Human Resources Development Canada and Statistics
Canada.
Grayson, J. P. & Grayson, K. (2003). Research on retention and attrition. Montreal: Canada Millennium
Scholarship Foundation.
Heller, D. E. (2003). Informing public policy: Financial aid and student persistence. Boulder, Colorado: Western
Interstate Commission for Higher Education.
Hemingway, F. (2003). Assessing Canada’s student aid need assessment policies. Montreal: Canada Millennium
Scholarship Foundation.
Junor, S. & Usher, A (2002). The price of knowledge: Access and student finance in Canada. Montreal: Canada
Millennium Scholarship Foundation.
Looker, E. D. & Lowe, G. S. (2001). Post-secondary access and student financial aid in Canada: Current knowl-
edge and research gaps. Paper presented to the Canadian Policy Research Networks Workshop on Post-
Secondary Access and Student Financial Aid, Ottawa.
McElroy, L. (2004) The millennium bursary in British Columbia: Exploring its impact. Montreal: Canada
Millennium Scholarship Foundation.
Reynolds, L. M. & Weagley, R. O. (2003). Academic persistence in higher education. Paper presented to the 49th
Consumer Interests Annual conference, Atlanta.
Schwartz, S. (1999). The dark side of student loans: Debt burden, default, and bankruptcy. Osgoode Hall Law
Journal, 37(1–2), 308–338.
Thiessen, V. (2001). Policy research issues for Canadian youth: School-work transitions. Ottawa: Applied
Research Branch, Strategic Policy, Human Resources Development Canada.
Usher, A. (2004). Are the poor needy? Are the needy poor? The distribution of student loans and grants by family
income quartile in Canada. Toronto: Education Policy Institute.

The purpose of the cohort definition is to ensure that
borrowers and non-borrowers from the same institu-
tion are matched in terms of program length and
entry year. Hence, within a given institution, the
same cohort definition should be applied to both
borrowers and non-borrowers. However, there is
some flexibility so that institutions can select the
most appropriate cohort (cohorts) given the specific
characteristics of their programs.
Program Type
A cohort is defined as all the students who entered
degree programs of a given length in a given year.
There are three possible cohorts for inclusion in the
study defined by program length: three-year, four-
year, and five-year degree programs. All direct-entry
degree programs that meet the length criteria should
be included.
Tracking Period
There are two entry years that are possible, 1997–98
or 1998–99. Regardless of the program length, we are
interested in learning what progress students made
in the five years since entering the program.
Therefore, if the entry year is 1997–98, we are inter-
ested in their progress up to and including 2001–02. If
the entry year is 1998–99, we are interested in their
progress up to and including 2002–03.
Institutions can use either entry year, but should
not use both. If the later entry year is used (1998–99),
the required data will need to be available for every
year from the entry year up to and including 2002–03.
Each institution can define school year in a manner
consistent with their practices (entry in Fall, Winter,
Spring, or Summer), provided the same definition is
applied uniformly regardless of program length, year
of entry, borrower status, etc.
To participate, an institution must include at least
one of the cohorts in the table. The same entry and
tracking period should be used for all cohorts
submitted by an institution. The maximum number
of cohorts that can be submitted is three.
45
Appendix A: Data Request to InstitutionsThe purpose of this study is to determine whether education persistence is affected by public student debt.
Specifically, this study will examine the impact of borrowing through government student financial aid
programs on persistence of students in direct-entry university degree programs. Please refer to the attached
report Proposed Approach to Researching the Impact of Borrowing on Education Persistence for additional
information.
Cohort Definition

Data SubmissionData Required
The following data on each eligible student in the
cohort is required:
• Total amount of financial aid received since entry
to the end of the tracking period
• Total amount of student loans received since entry
to the end of the tracking period
• Total number of credits received since entry to the
end of the tracking period
• Whether or not the student earned the degree by
the end of the tracking period
• The last academic year in which the student was
enrolled
• Gender
• Birth date
Submission Format
Files should be in MS Access (97 or 2000), Excel,
comma delimited text, or tab delimited text and may
be compressed using WinZip or PkZip. Please be
certain that the file contains column headers (field
names). With the submission, also indicate which
entry year was used. Additional information on the
format for the data submission is provided in the
attached EXCEL spreadsheet.
If you have questions about the requirements or
the data format for the submission, please contact
one of the members of the project team.
Eligible Students
Students are eligible for inclusion in the cohort if, in
addition to meeting the program length and entry
year criteria, they also meet the following criteria:
• Students must be direct entry students in their
first degree program. Direct entry is defined as
students with no post-secondary experience prior
to entering the program.
• Course load is not relevant. Both full and part-time
students should be included.
• Students must not be foreign students. Foreign
students will not be included.
• Current status is not relevant. In other words,
students should be included even if they never
earned any credits or have not yet completed the
program. Students who have transferred to other
programs should be included.
S T U D E N T A I D A N D U N I V E R S I TY P E R S I S T E N C E46
Cohort
A: 3-year program tracked for 5 years
or
B: 4-year program tracked for 5 years
or
C: 5-year program tracked for 5 years
or
Track to
2001–02
2002–03
2001–02
2002–03
2001–02
2002–03
Year ofEntry
1997–98
1998–99
1997–98
1998–99
1997–98
1998–99
Programlength
3
3
4
4
5
5

47
Appendix B: Detailed Results
Number of students in cohort
Female
Median age at entry
Program length distribution:
3-year programs
4-year programs
5-year programs
Received financial aid
Received grant
Received grant only
Received student loan
Received student loan only
Average total financial aid
Average total grant
Average total student loan
Average annualized financial aid
Average annualized grant
Average annualized loan
All
13,280
54%
19
41%
56%
3%
53%
38%
13%
40%
15%
$13,802
$3,461
$14,857
$5,081
$1,181
$5,558
Concordia
3,906
53%
20
74%
24%
2%
34%
16%
0.1%
34%
18%
$11,777
$7,127
$8,494
$5,564
$3,438
$3,981
SimonFraser
1,659
53%
18
0%
86%
14%
53%
24%
13%
40%
28%
$14,414
$4,785
$16,174
$4,414
$1,236
$5,095
U. ofOttawa
2,591
60%
19
42%
58%
0%
45%
30%
2%
42%
15%
$15,620
$1,211
$15,658
$5,984
$394
$6,047
Lakehead
1,143
57%
19
31%
65%
3%
69%
56%
26%
43%
13%
$15,581
$2,842
$21,414
$5,490
$802
$7,808
Carleton
2,237
46%
19
10%
90%
0%
74%
65%
31%
43%
9%
$13,690
$4,071
$17,563
$4,386
$1,164
$5,841
Brock
1,744
55%
19
53%
47%
0%
67%
66%
22%
45%
2%
$12,823
$2,079
$16,091
$4,839
$696
$6,202
Table B.1 — Comparisons by Institution
Note: “Total” is the total loan, grant, or aid amount over the tracking period. “Annualized” is the amount of loan, grant, or aid for one year ofthe program completed on a full-time equivalency basis.
Total Amount of Aid Received
< $10,000
$10,000–$19,999
$20,000–$29,999
$30,000–$39,999
$40,000–$49,999
$50,000–$59,999
$60,000–$69,999
$70,000–$79,999
$80,000–$89,999
$90,000–$99,999
$100,000–$109,999
$110,000–$119,999
$120,000–$129,999
$130,000–$139,999
Any aid received
TotalRecipients
3,709
1,498
835
581
231
77
28
6
9
3
2
0
1
1
6,981
Grant + loan
842
1,026
668
496
214
74
28
6
8
2
2
0
1
1
3,368
Loan only
1,317
371
151
83
17
3
0
0
1
1
0
0
0
0
1,944
Grant only
1,550
101
16
2
0
0
0
0
0
0
0
0
0
0
1,669
Table B.2 — Distribution of Aid Recipients by Amount and Type of Aid
Type of Aid Received

S T U D E N T A I D A N D U N I V E R S I TY P E R S I S T E N C E48
Number of students
Annualized Grant
Minimum
Maximum
Average
Annualized Loan
Minimum
Maximum
Average
Annualized Total Aid
Minimum
Maximum
Average
All AidRecipients
6,981
$0
$37,692
$852
$0
$47,360
$4,229
$4
$59,645
$5,081
Loan-onlyRecipients
1,944
–
–
–
$41
$47,360
$4,730
$41
$47,360
$4,730
Loan + GrantRecipients
3,368
$9
$37,692
$1,331
$27
$44,357
$6,036
$142
$59,645
$7,367
Grant-onlyRecipients
1,669
$4
$9,500
$877
–
–
–
$4
$9,500
$877
Table B.3 — Annualized Amount of Aid by Type of Aid Received
Females
Males
Age 16–18
Age 19
Age 20–23
Age 24+
Total
No.
3,866
3,115
2,295
2,816
1,456
414
6,981
Median
$3,791
$3,774
$3,200
$3,107
$5,113
$8,930
$3,776
Mean
$5,027
$5,148
$4,314
$4,228
$6,399
$10,506
$5,081
Maximum
$59,645
$43,123
$33,914
$40,970
$43,123
$59,645
$59,645
Minimum
$4
$8
$4
$8
$25
$55
$4
Table B.4 — Total and Annualized Combined Loan and Grant Aid by Gender and Age at Entry
Annualized Combined Loan and Grant Aid
Median
$9,350
$9,228
$9,150
$8,019
$10,370
$16,946
$9,350
Mean
$13,971
$13,592
$13,220
$12,096
$15,679
$22,027
$13,802
Maximum
$121,180
$138,376
$89,419
$85,665
$138,376
$121,180
$138,376
Minimum
$15
$40
$15
$40
$100
$75
$15
Total Combined Loan and Grant Aid
Note: “Total” refers to the total amount of loan aid received over the tracking period. “Annualized” is the amount of aid for one year of theprogram completed on a full-time equivalency basis.
Females
Males
Age 16–18
Age 19
Age 20–23
Age 24+
Total
No.
2,829
2,208
1,642
2,210
888
297
5,037
Median
$597
$654
$610
$508
$749
$2,963
$625
Mean
$1,158
$1,209
$974
$807
$1,525
$4,070
$1,181
Maximum
$37,692
$25,252
$11,241
$8,562
$25,252
$37,692
$37,692
Minimum
$4
$8
$4
$8
$23
$11
$4
Table B.5 — Total and Annualized Grant Aid by Gender and Age at Entry
Annualized Grant Aid
Median
$1,750
$1,793
$1,800
$1,500
$1,985
$5,682
$1,752
Mean
$3,431
$3,499
$3,434
$2,680
$3,861
$8,221
$3,461
Maximum
$38,347
$30,371
$36,700
$25,305
$29,365
$38,347
$38,347
Minimum
$15
$27
$15
$38
$27
$32
$15
Total Grant Aid
Note: “Total” refers to the total amount of grant aid received over the tracking period. “Annualized” is the amount of grant aid for one year ofthe program completed on a full-time equivalency basis.

Mean
$622
$1,462
$2,489
$5,809
$15,241
$4,730
Median
$338
$1,265
$2,442
$4,009
–
$500
A P P E N D I X B : D E TA I L E D R E S U L T S 49
Females
Males
Age 16–18
Age 19
Age 20–23
Age 24+
Total
No.
2,935
2,377
1,586
1,984
1,342
400
5,312
Median
$4,553
$4,692
$4,472
$4,489
$4,678
$5,795
$4,615
Mean
$5,505
$5,623
$5,234
$5,101
$5,933
$7,852
$5,558
Maximum
$47,360
$40,970
$33,914
$40,970
$34,454
$47,360
$47,360
Minimum
$27
$37
$31
$27
$41
$513
$27
Table B.6 — Total and Annualized Loan Aid by Gender and Age at Entry
Annualized Loan Aid
Median
$11,201
$10,523
$12,356
$10,701
$9,780
$11,180
$10,926
Mean
$15,095
$14,562
$15,575
$14,183
$14,456
$16,693
$14,857
Maximum
$120,180
$135,076
$82,739
$85,665
$135,076
$120,180
$135,076
Minimum
$103
$123
$125
$103
$123
$1,610
$103
Total Loan Aid
Note: “Total” refers to the total amount of grant aid received over the tracking period. “Annualized” is the amount of grant aid for one year ofthe program completed on a full-time equivalency basis.
Annualized Aid
Aid under $1,000
$1,000–$1,999
$2,000–$2,999
$3,000–$9,999
$10,000+
No Aid
All Students
Median
$658
$1,444
$2,463
$5,610
$12,608
$3,540
Number
216
326
271
989
142
1,944
Table B.7 — Number of Students, Mean and Median Annualized Aid Amounts by Annualized Aid Group andType of Aid
Loan-only Recipients
Median
$697
$1,515
$2,487
$6,173
$12,033
$6,611
Mean
$686
$1,516
$2,501
$6,334
$13,975
$7,367
Number
104
213
264
1,988
799
3,368
Grant + Loan Recipients
Mean
$395
$1,332
$2,424
$4,399
–
$877
Number
1,217
264
99
89
0
1,669
Grant-only Recipients
Median
$395
$1,418
$2,470
$5,913
$12,135
$0
$223
Mean
$446
$1,434
$2,484
$6,109
$14,166
$0
$2,671
Number
1,537
803
634
3,066
941
6,299
13,280
All Aid Recipients
Degree
59%
48%
52%
28%
8%
37%
Years
3.6
3.2
3.3
3.6
–
3.6
Annualized Aid
Aid under $1,000
$1,000–$1,999
$2,000–$2,999
$3,000–$9,999
$10,000+
No Aid
All Students
Years
3.3
2.9
2.7
2.1
1.7
2.4
Credits
91%
80%
78%
56%
44%
66%
Table B.7 — Number of Students, Mean and Median Annualized Aid Amounts by Annualized Aid Group andType of Aid
Loan-only Recipients
Years
3.8
3.8
3.7
3.2
2.6
3.1
Degree
79%
78%
75%
62%
38%
59%
Credits
101%
102%
98%
87%
72%
86%
Grant + Loan Recipients
Degree
72%
58%
67%
71%
–
69%
Credits
95%
81%
84%
91%
–
92%
Grant-only Recipients
Years
3.6
3.2
3.2
2.8
2.5
2.5
2.8
Degree
71%
59%
64%
51%
34%
47%
51%
Credits
95%
86%
88%
77%
68%
71%
77%
All Aid Recipients


Government-funded financial assistance in British
Columbia consists of the following programs:
• Canada Student Loans and British Columbia
Student Loans provided $466.5 million ($333.3
and $133.2 million respectively) to over 66,500
British Columbia students in 2002–03.
• British Columbia Grants, which were only available
until the end of July 2004 to students in their
second, third and fourth years of undergraduate
study, replace a portion of B.C. Student Loans. In
2002–03, $80 million was awarded to over 26,000
students.
• Canada Study Grants are available to students
with permanent disabilities, high-need part-time
students, women in non-traditional doctoral
studies and students with dependants. In 2002–03,
British Columbia students received $21.4 million,
with $16.9 million awarded to address the needs of
more than 9,700 students with dependants.
• British Columbia Nurses Education Bursaries
provide up to $2 million in bursary funding annu-
ally to qualified applicants who have great finan-
cial need. These bursaries range from $500 to
$3,500 per academic year. In 2002–03, 540 students
received the bursary.
• In addition, Health Care Scholarships provide up
to $1 million in bursaries to 325 health care
workers to retrain or upgrade their skills.
• British Columbia Premier’s Excellence Awards are
$5,000 scholarships given annually to the 15 top
grade 12 students in each of the province’s
15 college regions. Students must attend a British
Columbia institution to be eligible for this award.
• The province also offers Queen Elizabeth II
United World Scholarships to top graduate
students. One major scholarship with a total value
of $20,000 is available each year. In addition to the
major scholarship, two minor scholarships of
$4,000 each are available for the two top runners-
up to the major winner each year.
• The Canada Millennium Scholarship Foundation
provides bursaries worth $1,500 to $4,500 to
British Columbia students. To be eligible, students
must be in undergraduate programs and have
completed at least one year of post-secondary
studies. In 2002–2003, 10,642 students received the
bursary for a total investment of $38.3 million.
51
Appendix C: FinancialAssistance Available inBritish Columbia, Ontarioand QuebecStudent Financial Assistance in British Columbia

Government financial assistance in Ontario consists
of eight main programs:
• The Canada-Ontario Integrated Student Loans
Program lent about $1.12 billion ($647.6 million from
the Government of Canada and $467.5 million
from the Government of Ontario) to 150,000
Ontario students in 2002–03.
• Canada Study Grants are available to students
with permanent disabilities for educational
supports and unmet need, high-need part-time
students, women in non-traditional doctoral
studies and students with dependants. In 2002–03,
Ontario students received $30.9 million through
all programs. Of this amount, $26.9 million was
awarded to reduce the debt of students with
dependants.
• The Ontario Special Bursary Plan encourages
financially needy students to pursue part-time
post-secondary studies for the first time. This
bursary is also available to full- and part-time
students taking academic upgrading or training
programs that will enable them to advance their
employment-related skills. The largest bursary one
can receive is $2,500 per academic year; the
bursary is taxable. In 2002–03, 5,442 students
received the bursary for a total investment of
$4.57 million.
• The Ontario Child Care Bursary is a non-
repayable bursary designed to assist students who
have childcare costs for three or more children.
Childcare costs for the first and second eligible
children are included in the Canada-Ontario
Integrated Student Loan as well as the Canada
Study Grant for Students with Dependants. In
2002–03, 226 students received the bursary for a
total investment of $230,000.
• The Ontario Work Study Plan helps students at
public universities and colleges of applied arts and
technology in Ontario to meet their educational
costs by working part-time during the year.
Eligible students can earn up to $2,000 over two
terms. In 2002–03, 12,615 students received the
bursary for a total investment of $7.51 million.
• The Queen Elizabeth II Aiming for the Top
Scholarship Program is designed to recognize
students who have shown academic excellence at
the high school level and to assist students with
financial need. The value of the scholarship varies
between $100 and $3,500 per academic year. The
scholarship is renewable for four years at the
amount the student is eligible to receive in his or
her first year. To have the scholarship renewed, a
student must continue to study on a full-time
basis (as defined by the Ontario Student Assistance
Program) and must maintain an average of at least
80% or its equivalent, as determined by his or her
post-secondary institution. In 2002–03, about
12,000 students received a scholarship for a total
investment of $25 million.
• The Ontario Student Opportunity Grant is avail-
able to help students reduce their annual Canada-
Ontario Integrated Student Loan debt by limiting a
student’s repayable debt to $7,000 for a two-term
academic year and $10,500 for a three-term
academic year. It is available at the end of each
academic year. In 2002–03, 39,430 students received
the grant for a total investment of $121.8 million.
• The Canada Millennium Scholarship Foundation’s
Millennium bursaries are cash grants of $3,000
each within the Ontario Student Assistance
Program. To be eligible, students must be in
undergraduate programs and have completed at
least one year of post-secondary studies. In
2002–03, 35,583 Ontario students received a
millennium bursary, for a total investment of
$106.8 million.
S T U D E N T A I D A N D U N I V E R S I TY P E R S I S T E N C E52
Financial Assistance Available to Ontario Students

Government-funded financial assistance in Quebec
included the following programs:
• The Loans and Bursaries Program of the provincial
government’s Aide financière aux études distributes
most of Quebec’s student financial aid. Students
are given interest-free loans that vary according to
the type of post-secondary institution. In 2003–04,
college and secondary students in professional
training received the first $2,005 as a loan.
Undergraduate university students received the
first $2,460 as a loan. Students in graduate and
doctoral programs received the first $3,255 as a
loan. If the loan is insufficient, a bursary may be
added to the assistance package. In 2002–03, the
program provided $568.5 million to approximately
130,000 students. More than half received both a
loan and a bursary. The rest received a loan only.
• Through its Millennium bursaries, the Canada
Millennium Scholarship Foundation provided
$71.1 million to 22,783 Quebec students in
2002–03. Recipients must be in undergraduate
programs and have completed at least one year of
post-secondary studies.
Quebec’s Aide financière aux études manages
several other programs:
• Six months after they complete full-time studies,
students must begin to repay their loans. They
may, however, have access to the Deferred
Payment Plan, designed to assist borrowers in
financial difficulty. In 2001–02, the program
provided $7.1 million to 22,869 students.
• The Bursary Program for Students with Major
Functional Disabilities provided $6.8 million in
bursaries in 2001–02. Students who received this
assistance received bursaries only; they were not
required to make a minimum contribution.
• The Loan Remission Program reduces the debt of
the most disadvantaged university students. To
participate, students must have completed their
studies during the normal prescribed time limits
and must have received a grant for each year of study.
In 2001–02, 1,298 students received $2 million
through this program.
• The Work/Study Program, inaugurated in 1999–2000,
distributed $4 million to 2,562 students in 2001–02.
• The Bursary Program for Permanently Elected
Student Leaders provided $100,000 to approximately
20 students during the 2001–02 academic year.
A P P E N D I X C : F I N A N C I A L A S S I S TA N C E AVA I L A B L E I N B R I T I S H C O L U M B I A , O N TA R I O A N D Q U E B E C 53
Student Financial Assistance in Quebec


We calculated annualized loan aid, grant aid and
overall aid as follows:
1. Determine the percentage of the total required
credits that the student had earned.
Example:
— 20 credits are required to complete a particular
four-year program.
— Student A had earned 10 credits over a five-year
period.
— Hence, student A had completed 50% of the
total credits required.
2. Estimate the number of years of the program that
the student had completed, based on full-time
equivalency.
Example:
— Student A had completed 50% of the total
credits required in a four-year program over a
five-year period.
— 50% x 4 = 2 years completed.
— Hence, student A had completed 2 years of
study (at a full-time equivalent rate).
3. Calculate the annualized aid for the years
completed.
Example:
— Student A had completed 2 years and had
received a total of $10,000 in aid since entering
the program.
— Annualized aid = $10,000/2 = $5,000 per year of
study completed
— Hence, student A had received $5,000 in annu-
alized aid.
The result is standardized measures of aid (loan,
grant and total aid) with these features:
• Removes any spurious relation between aid
amounts and total credits earned.
• Increases as total aid amounts increase when
other variables are constant.
• Preserves the relationship between aid and
persistence, regardless of full-time or part-time
status: full-time and part-time students who
received the same amount of aid and completed
the same percentage of credits will have the same
amount of annualized aid.
• Shows the cost per value received, by presenting
the amount of aid relative to years of the program
completed.
55
Appendix D: StandardizationMethodologyWe calculated annualized amounts of loans, grants and total aid for each student using the following
definitions:
• Annualized loan: Amount of loan annualized for year of study completed.
• Annualized grant: Amount of grant annualized for year of study completed.
• Annualized aid: Amount of combined grant and loan annualized for year of study completed.
Basic Method of Standardization

These features are illustrated in Tables D.1, D.2 and
D.3, which provide examples of this measure for
various levels of student aid, credits earned and years
of study.
S T U D E N T A I D A N D U N I V E R S I TY P E R S I S T E N C E56
Program length
Credits required
Credits earned
% of required credits earned
Years of study completed
Total aid received
Annualized aid
Student E
4 years
20
25
125%
5
$25,000
$5,000
Student D
4 years
20
20
100%
4
$20,000
$5,000
Student C
4 years
20
15
75%
3
$15,000
$5,000
Student B
4 years
20
10
50%
2
$10,000
$5,000
Student A
4 years
20
5
25%
1
$5,000
$5,000
Table D.1 — Standardization Removes the Relationship between Aid Received and Credits Earned
Program length
Credits required
Credits earned
% of required credits earned
Years of study completed
Total aid received
Annualized aid
Student I
4 years
20
10
50%
2
$25,000
$12,500
Student H
4 years
20
10
50%
2
$20,000
$10,000
Student G
4 years
20
10
50%
2
$15,000
$7,500
Student F
4 years
20
10
50%
2
$10,000
$5,000
Student E
4 years
20
10
50%
2
$5,000
$2,500
Table D.2 — Standardized Aid Amounts Increase as Total Aid Amounts Increase when All Else is Constant
Program length
Credits required
Credits earned
% of required credits earned
Years of study completed
Total aid received
Annualized aid
Student N
4 years
20
25
125%
5
$15,000
$3,000
Student M
4 years
20
20
100%
4
$15,000
$3,750
Student L
4 years
20
15
75%
3
$15,000
$5,000
Student K
4 years
20
10
50%
2
$15,000
$7,500
Student J
4 years
20
5
25%
1
$15,000
$15,000
Table D.3 — Standardization Shows the Cost per Value (Credits or Years Completed) Received

Although the basic method of standardization
normally produces measures that have favourable
properties, it can create undesirable results in two
situations:
• Students who had completed less than one year of
study have inflated annualized aid amounts, since
their loan, grant and aid amounts are divided by a
number less than one.
Example:
— 20 credits are required to complete a particular
four-year program.
— Student X had earned only one credit.
— Hence, student X had completed 5% of the total
credits required, equivalent to 0.2 of a year of
study.
— If the student had received $1,000 in aid that
year, calculation of the amount of annualized
aid yields:
— Annualized aid = 1,000/0.2 = $5,000 per year of
study completed: five times higher than the
total amount of aid received.
• The opposite problem arises for students who had
earned over 100% of the credits needed. As calcu-
lated by the basic method, their full-time equiva-
lent years of study exceed the program length and
can even exceed the tracking period (five years).
The result is an annualized amount that is too low.
Example:
— 20 credits are required to complete a particular
four-year program.
— Student Y had earned 30 credits over a five-year
period.
— Hence, student Y had completed 150% of the
total credits required, equivalent to six years of
study.
— If the student had received $10,000 in aid over
his or her entire time in school, calculation of
the amount of annualized aid yields:
— Annualized aid = $10,000/6 = $1,667 per year of
study completed.
— However, since the tracking period is only five
years in length, the student could not have been
studying for six years. Hence, $1,667 is lower than
the average aid per year of actual study.
— If the student had studied for five years, the
amount of annualized aid would be $2,000, not
$1,667.
A P P E N D I X D : S TA N DA R D I Z AT I O N M E T H O D O LO G Y 57
Adjustment to Standardization
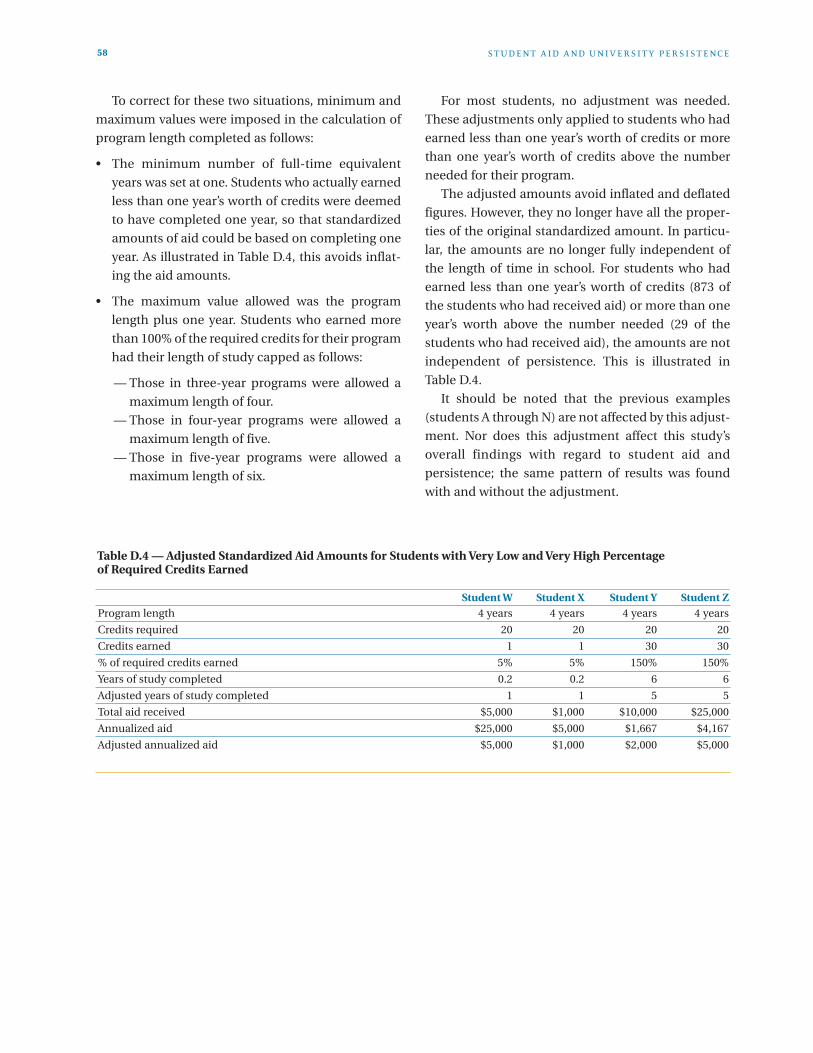
To correct for these two situations, minimum and
maximum values were imposed in the calculation of
program length completed as follows:
• The minimum number of full-time equivalent
years was set at one. Students who actually earned
less than one year’s worth of credits were deemed
to have completed one year, so that standardized
amounts of aid could be based on completing one
year. As illustrated in Table D.4, this avoids inflat-
ing the aid amounts.
• The maximum value allowed was the program
length plus one year. Students who earned more
than 100% of the required credits for their program
had their length of study capped as follows:
— Those in three-year programs were allowed a
maximum length of four.
— Those in four-year programs were allowed a
maximum length of five.
— Those in five-year programs were allowed a
maximum length of six.
For most students, no adjustment was needed.
These adjustments only applied to students who had
earned less than one year’s worth of credits or more
than one year’s worth of credits above the number
needed for their program.
The adjusted amounts avoid inflated and deflated
figures. However, they no longer have all the proper-
ties of the original standardized amount. In particu-
lar, the amounts are no longer fully independent of
the length of time in school. For students who had
earned less than one year’s worth of credits (873 of
the students who had received aid) or more than one
year’s worth above the number needed (29 of the
students who had received aid), the amounts are not
independent of persistence. This is illustrated in
Table D.4.
It should be noted that the previous examples
(students A through N) are not affected by this adjust-
ment. Nor does this adjustment affect this study’s
overall findings with regard to student aid and
persistence; the same pattern of results was found
with and without the adjustment.
S T U D E N T A I D A N D U N I V E R S I TY P E R S I S T E N C E58
Program length
Credits required
Credits earned
% of required credits earned
Years of study completed
Adjusted years of study completed
Total aid received
Annualized aid
Adjusted annualized aid
Student Z
4 years
20
30
150%
6
5
$25,000
$4,167
$5,000
Student Y
4 years
20
30
150%
6
5
$10,000
$1,667
$2,000
Student X
4 years
20
1
5%
0.2
1
$1,000
$5,000
$1,000
Student W
4 years
20
1
5%
0.2
1
$5,000
$25,000
$5,000
Table D.4 — Adjusted Standardized Aid Amounts for Students with Very Low and Very High Percentageof Required Credits Earned

All categorical variables have been recoded into
appropriate indicator (dummy) variables. A reference
category was coded as 0, and the comparison cate-
gory was coded as 1. For variables with two categories
only one indicator variable is needed to specify both
categories. Variables with three categories need two
indicator variables and variables with four categories
need three indicator variables. The table below shows
the indicator variables and the reference category
used for each variable.
The coefficients24 for each indicator variable are
interpreted as follows:
• The coefficient for the female indicator is the change
in the intercept for females compared to males.25
The model intercept is the value of the predicted
variable for males (with all other variables equal
to zero).
• The coefficient for 4 + 5 Years is the change in the
intercept for programs of four or more years in
length compared to three-year programs.
• The grant only coefficient refers to the change in
the intercept for grant only students compared to
students with no aid.
• The loan only coefficient refers to the change in
the intercept for loan only students compared to
students with no aid.
• The loan + grant coefficient refers to the change in
the intercept for loan + grant students compared
to students with no aid.
• The coefficient for BC refers to the change in the
intercept for BC students compared to Ontario
students.
• The coefficient for QC refers to the change in the
intercept for Quebec students compared to
Ontario students.
59
Appendix E: Regression ResultsIndicator Variables
24 Each coefficient represents the additional effect of adding its corresponding variable to the model, if the effects of all other variables in the model arealready accounted for.
25 The intercept represents the value of the persistence measure when the value of all predictors in the model is zero. For this models this refers to maleOntario students who received no aid and were in three year programs with an age of zero. Since an age of zero is not possible the intercept does nothave a literal interpretation and simply anchors the regression line in the right place.
Variable
Gender
Program length
Type of aid
Jurisdiction
ReferenceCategory
(Coded 0)
Male
3 year
No aid
No aid
No aid
Ontario
Ontario
Indicators(Coded 1)
Female
4 + 5 Year
Grant only
Loan only
Loan + Grant
BC
QC
Table E.1 — Indicator Variables Used for EachCategory Variable
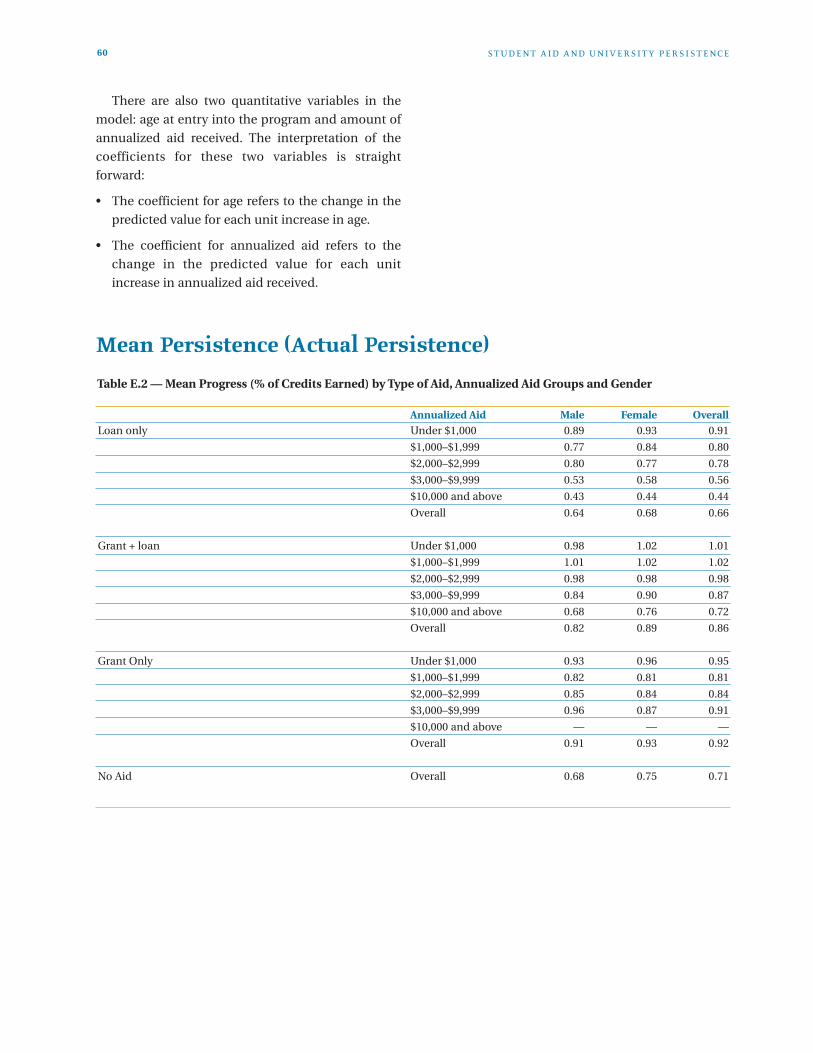
There are also two quantitative variables in the
model: age at entry into the program and amount of
annualized aid received. The interpretation of the
coefficients for these two variables is straight
forward:
• The coefficient for age refers to the change in the
predicted value for each unit increase in age.
• The coefficient for annualized aid refers to the
change in the predicted value for each unit
increase in annualized aid received.
Mean Persistence (Actual Persistence)
S T U D E N T A I D A N D U N I V E R S I TY P E R S I S T E N C E60
Loan only
Grant + loan
Grant Only
No Aid
Overall
0.91
0.80
0.78
0.56
0.44
0.66
1.01
1.02
0.98
0.87
0.72
0.86
0.95
0.81
0.84
0.91
—
0.92
0.71
Female
0.93
0.84
0.77
0.58
0.44
0.68
1.02
1.02
0.98
0.90
0.76
0.89
0.96
0.81
0.84
0.87
—
0.93
0.75
Male
0.89
0.77
0.80
0.53
0.43
0.64
0.98
1.01
0.98
0.84
0.68
0.82
0.93
0.82
0.85
0.96
—
0.91
0.68
Annualized Aid
Under $1,000
$1,000–$1,999
$2,000–$2,999
$3,000–$9,999
$10,000 and above
Overall
Under $1,000
$1,000–$1,999
$2,000–$2,999
$3,000–$9,999
$10,000 and above
Overall
Under $1,000
$1,000–$1,999
$2,000–$2,999
$3,000–$9,999
$10,000 and above
Overall
Overall
Table E.2 — Mean Progress (% of Credits Earned) by Type of Aid, Annualized Aid Groups and Gender

A P P E N D I X E : R E G R E S S I O N R E S U L T S 61
Loan only
Grant + loan
Grant Only
No Aid
Overall
0.59
0.48
0.52
0.28
0.08
0.37
0.79
0.78
0.75
0.62
0.38
0.59
0.72
0.58
0.67
0.71
—
0.69
0.47
Female
0.60
0.54
0.53
0.33
0.11
0.41
0.81
0.83
0.78
0.68
0.45
0.65
0.78
0.60
0.66
0.67
—
0.74
0.53
Male
0.58
0.42
0.50
0.22
0.06
0.32
0.76
0.71
0.69
0.53
0.31
0.50
0.64
0.55
0.67
0.76
—
0.63
0.40
Annualized Aid
Under $1,000
$1,000–$1,999
$2,000–$2,999
$3,000–$9,999
$10,000 and above
Overall
Under $1,000
$1,000–$1,999
$2,000–$2,999
$3,000–$9,999
$10,000 and above
Overall
Under $1,000
$1,000–$1,999
$2,000–$2,999
$3,000–$9,999
$10,000 and above
Overall
Overall
Table E.3 — Mean Completion Rates (Degree Earned) by Type of Aid, Annualized Aid Groups and Gender

S T U D E N T A I D A N D U N I V E R S I TY P E R S I S T E N C E62
Loan only
Grant + loan
Grant Only
No Aid
Overall
0.92
0.81
0.76
0.57
0.42
0.64
1.01
1.01
0.98
0.89
0.79
0.89
0.95
0.81
0.84
0.92
—
0.92
0.76
Female
0.95
0.86
0.75
0.61
0.43
0.66
1.02
1.03
0.98
0.91
0.82
0.91
0.96
0.81
0.84
0.88
—
0.93
0.80
Male
0.90
0.77
0.78
0.53
0.42
0.62
0.98
1.00
0.98
0.87
0.75
0.86
0.93
0.82
0.85
0.96
—
0.91
0.71
Annualized Aid
Under $1,000
$1,000–$1,999
$2,000–$2,999
$3,000–$9,999
$10,000 and above
Overall
Under $1,000
$1,000–$1,999
$2,000–$2,999
$3,000–$9,999
$10,000 and above
Overall
Under $1,000
$1,000–$1,999
$2,000–$2,999
$3,000–$9,999
$10,000 and above
Overall
Overall
Table E.4 — Mean Progress for BC and Ontario Only by Type of Aid, Annualized Aid Groups and Gender

A P P E N D I X E : R E G R E S S I O N R E S U L T S 63
Loan only
Grant + loan
Grant Only
No Aid
Overall
0.56
0.40
0.44
0.28
0.08
0.32
0.79
0.80
0.72
0.65
0.44
0.62
0.72
0.58
0.67
0.72
—
0.69
0.48
Female
0.59
0.50
0.46
0.35
0.11
0.38
0.81
0.84
0.76
0.71
0.50
0.68
0.78
0.60
0.66
0.70
—
0.74
0.56
Male
0.53
0.32
0.40
0.19
0.05
0.25
0.76
0.74
0.67
0.56
0.36
0.53
0.64
0.55
0.67
0.76
—
0.63
0.40
Annualized Aid
Under $1,000
$1,000–$1,999
$2,000–$2,999
$3,000–$9,999
$10,000 and above
Overall
Under $1,000
$1,000–$1,999
$2,000–$2,999
$3,000–$9,999
$10,000 and above
Overall
Under $1,000
$1,000–$1,999
$2,000–$2,999
$3,000–$9,999
$10,000 and above
Overall
Overall
Table E.5 — Mean Completion Rates for BC and Ontario Only by Type of Aid, Annualized Aid Groups and Gender

Original Models
Predicted Persistence from Original Models
S T U D E N T A I D A N D U N I V E R S I TY P E R S I S T E N C E64
Model Summary
Model Adjusted R2
Model F
Degrees of freedom
Variables in Model
Female
Age at entry
Four- + five-year programs
Loan only aid
Grant only aid
Loan + grant aid
Annualized aid
Loan only X annualized aid
Grant only X annualized aid
Constant
UnstandardizedCoefficients
0.05
-0.02
-0.04
0.08
0.22
0.28
-1.6E–05
-1.2E–05
-9.7E–06
1.18
.134
229.456
9 & 13,269
StandardizedCoefficients
0.07
-0.19
-0.05
0.08
0.19
0.31
-0.19
-0.07
-0.01
Table E.6 – Regression Model for Predicting Progress
Model Summary
Model Nagelkerke R2
Model Chi-square
Degrees of freedom
Variables in Model
Female
Age at entry
Four- + five-year programs
Loan only aid
Grant only aid
Loan + grant aid
Annualized aid
Loan only X annualized aid
Grant only X annualized aid
Constant
Coefficients *(Log Odds)
0.53
-0.11
-0.23
0.50
1.03
1.43
-1.2E–04
-1.0E–04
2.6E–05
1.85
.143
1503.685
9
Coefficients **(Odds)
1.70
0.90
0.79
1.64
2.79
4.17
1.00
1.00
1.00
6.34
Table E.7 — Logistic Model for Predicting Completion
* Coefficient on log scale** Exponent of coefficient
Loan only
Grant + loan
Grant Only
No Aid
Overall
0.79
0.76
0.73
0.63
0.32
0.66
1.00
0.98
0.96
0.88
0.72
0.86
0.93
0.91
0.87
0.81
—
0.92
0.71
Female
0.82
0.79
0.75
0.66
0.32
0.69
1.02
1.00
0.99
0.91
0.75
0.89
0.95
0.93
0.90
0.82
—
0.94
0.74
Male
0.75
0.73
0.70
0.59
0.33
0.63
0.96
0.95
0.92
0.85
0.69
0.82
0.90
0.88
0.84
0.81
—
0.89
0.69
Annualized Aid
Under $1,000
$1,000–$1,999
$2,000–$2,999
$3,000–$9,999
$10,000 and above
Overall
Under $1,000
$1,000–$1,999
$2,000–$2,999
$3,000–$9,999
$10,000 and above
Overall
Under $1,000
$1,000–$1,999
$2,000–$2,999
$3,000–$9,999
$10,000 and above
Overall
Overall
Table E.8 — Mean Predicted Progress (% of Credits Earned) by Type of Aid, Annualized Aid Groups and Gender

Models Excluding Quebec
A P P E N D I X E : R E G R E S S I O N R E S U L T S 65
Model Summary
Model Adjusted R2
Model F
Degrees of freedom
Variables in Model
Female
Age at entry
Four- + five-year programs
Loan only aid
Grant only aid
Loan + grant aid
Annualized aid
Loan only X annualized aid
Grant only X annualized aid
Constant
UnstandardizedCoefficients
0.05
-0.02
-0.04
0.04
0.19
0.25
-1.5E–05
-1.2E–05
-1.3E–05
1.04
.114
134.368
9 & 9,363
StandardizedCoefficients
0.07
-0.10
-0.04
0.04
0.19
0.31
-0.19
-0.08
-0.02
Table E.10 — Regression Model for Predicting Progress
Model Summary
Model Nagelkerke R2
Model Chi-square
Degrees of freedom
Variables in Model
Female
Age at entry
Four- + five-year programs
Loan only aid
Grant only aid
Loan + grant aid
Annualized aid
Loan only X annualized aid
Grant only X annualized aid
Constant
Coefficients *(Log Odds)
0.62
-0.03
-0.09
0.24
0.97
1.42
-1.2E–04
-7.6E–05
3.0E–05
0.16
.140
1039.425
9
Coefficients **(Odds)
1.87
0.97
0.92
1.27
2.65
4.14
1.00
1.00
1.00
1.18
Table E.11 — Logistic Model for Predicting Completion
* Coefficient on log scale** Exponent of coefficient
Loan only
Grant + loan
Grant Only
No Aid
Overall
0.56
0.51
0.46
0.29
0.07
0.37
0.77
0.75
0.73
0.62
0.38
0.59
0.70
0.69
0.65
0.61
—
0.69
0.47
Female
0.63
0.58
0.52
0.35
0.08
0.42
0.82
0.80
0.78
0.67
0.45
0.65
0.75
0.74
0.71
0.66
—
0.74
0.53
Male
0.48
0.44
0.38
0.23
0.05
0.30
0.72
0.70
0.66
0.54
0.32
0.51
0.64
0.62
0.59
0.56
—
0.63
0.40
Annualized Aid
Under $1,000
$1,000–$1,999
$2,000–$2,999
$3,000–$9,999
$10,000 and above
Overall
Under $1,000
$1,000–$1,999
$2,000–$2,999
$3,000–$9,999
$10,000 and above
Overall
Under $1,000
$1,000–$1,999
$2,000–$2,999
$3,000–$9,999
$10,000 and above
Overall
Overall
Table E.9 — Mean Predicted Completion Rates (Degree Earned) by Type of Aid, Annualized Aid Groups and Gender

Predicted Persistence from Models Excluding Quebec
S T U D E N T A I D A N D U N I V E R S I TY P E R S I S T E N C E66
Loan only
Grant + loan
Grant Only
No Aid
Overall
0.78
0.75
0.73
0.63
0.34
0.64
1.00
0.98
0.97
0.91
0.78
0.89
0.93
0.91
0.87
0.82
—
0.92
0.76
Female
0.81
0.79
0.75
0.65
0.34
0.67
1.02
1.01
0.99
0.93
0.80
0.92
0.96
0.93
0.90
0.83
—
0.94
0.78
Male
0.75
0.73
0.70
0.59
0.35
0.61
0.96
0.95
0.93
0.87
0.75
0.85
0.90
0.87
0.84
0.80
—
0.89
0.73
Annualized Aid
Under $1,000
$1,000–$1,999
$2,000–$2,999
$3,000–$9,999
$10,000 and above
Overall
Under $1,000
$1,000–$1,999
$2,000–$2,999
$3,000–$9,999
$10,000 and above
Overall
Under $1,000
$1,000–$1,999
$2,000–$2,999
$3,000–$9,999
$10,000 and above
Overall
Overall
Table E.12 — Mean Predicted Progress for BC and Ontario Only by Type of Aid, Annualized Aid Groups and Gender

A P P E N D I X E : R E G R E S S I O N R E S U L T S 67
Loan only
Grant + loan
Grant Only
No Aid
Overall
0.51
0.46
0.42
0.28
0.08
0.32
0.78
0.76
0.75
0.65
0.44
0.62
0.70
0.69
0.66
0.62
—
0.69
0.48
Female
0.59
0.55
0.49
0.33
0.10
0.37
0.83
0.81
0.80
0.70
0.51
0.68
0.76
0.75
0.73
0.68
—
0.75
0.56
Male
0.43
0.39
0.34
0.21
0.06
0.26
0.72
0.70
0.67
0.56
0.37
0.53
0.63
0.61
0.58
0.55
—
0.62
0.40
Annualized Aid
Under $1,000
$1,000–$1,999
$2,000–$2,999
$3,000–$9,999
$10,000 and above
Overall
Under $1,000
$1,000–$1,999
$2,000–$2,999
$3,000–$9,999
$10,000 and above
Overall
Under $1,000
$1,000–$1,999
$2,000–$2,999
$3,000–$9,999
$10,000 and above
Overall
Overall
Table E.13 — Mean Predicted Completion Rates for BC and Ontario Only by Type of Aid, Annualized Aid Groupsand Gender


