
Study exploiting the possibility of creating a rail
freight corridor linking Belgium and Poland

Study exploiting the possibility of creating a rail
freight corridor linking Belgium and Poland
drs. A.A. Roest Crollius
This report has been financed by Infrabel
Reference R20100134/31332000/ARC/LJO
Final version
Zoetermeer, September 2010
© The use of figures and/or text from this report is permitted if the source is clearly
mentioned. Copying of this report is only permitted with written permission from NEA.

Study exploiting the possibility of creating a rail freight corridor linking Belgium and Poland
R20100134.doc 1 September 2010
Contents
1 MANAGEMENT SUMMARY 3 1.1 Introduction 3 1.2 Chapter 1 – Current situation on the market and its’ potential
for further development 3 1.2.1 Freight volumes analysis on the corridor Belgium – Poland /
Czech Republic 3 1.3 Intermodal transport analysis 5 1.4 Chapter 2 - Identification of barriers to further development 8 1.5 Chapter 3 Selection of the Paths 8 1.6 Action Plan focusing on Belgium 9 1.6.1 Elaboration of the action plan 11
2 CURRENT SITUATION ON THE MARKET AND ITS’ POTENTIAL FOR FURTHER DEVELOPMENT 17
2.1 Freight volumes analysis on the corridor Belgium – Poland /
Czech Republic 17 2.1.1 Background and Methodology 17 2.1.2 Results 23 2.1.3 Conclusions 39 2.2 Intermodal transport analysis 40 2.2.1 Rail shuttle connections and market parties 42 2.2.2 Rail transport compared to other transport modes 48 2.3 Conclusions 59
3 IDENTIFICATION OF BARRIERS TO FURTHER DEVELOPMENT 63
3.1 Introduction 63 3.2 Barriers as viewed by the stakeholders 63 3.3 Institutional barriers & issues 64 3.4 Operational barriers & issues 65 3.5 Technical barriers & issues 66 3.6 Market barriers & issues 66 3.7 Conclusions 67
4 SELECTION OF THE PATHS AND RAIL TERMINALS 69
4.1 Introduction 69 4.1.1 Main considered rail traffic routes between Belgium and
Relations with other international European programs 71 4.1.2 Relations with other international European programs 72 4.2 The Belgium initiative 73 4.3 Rail Routes 74 4.3.1 Montzen route 74 4.3.2 Main barriers 74 4.3.3 Iron Rhine 75 4.3.4 Main barriers for revitalizing the Iron Rhine 76 4.3.5 Via the Netherlands - Rotterdam - Betuwelijn or Osnabruck 77 4.3.6 Comparing routes 77
Study exploiting the possibility of creating a rail freight corridor linking Poland and Belgium
2 R20100134.doc September 2010
4.3.7 Corridor Capacity 79 4.4 Road 79 4.5 Rail terminals 79 4.5.1 Antwerp 80 4.5.2 Zeebrugge 81 4.6 Infrastructure Projects 82 4.6.1 Zeebrugge 84 4.7 Conclusions 85
5 REFERENCES 87
6 APPENDIX 89 6.1 Traction providers and rail operators in Belgium 89 6.2 List of Interviews 90 6.3 A complete list of terminals in Belgium 90 6.4 Rail maps 91 6.1 Table: Action Plan for Rail Freight Corridor Belgium – Poland
(complete version) 96 6.4.1 Elaboration of the action plan 102

Study exploiting the possibility of creating a rail freight corridor linking Belgium and Poland
R20100134.doc 3 September 2010
1 Management Summary
1.1 Introduction
In addition to the existing rail legislation, a latest legislative development was
that the position (EU) No 2/2010 of the Council at first reading with a view to the
adoption of a Regulation of the European Parliament and of the Council
concerning a European rail network for competitive freight was published 4 May
2010. Within this regulation proposal, a total of nine principle routes of freight
corridors are selected to be used as the base for the establishment of European
rail freight corridors in the near future. In addition, clear and tighter rules are
proposed in this regulation proposal concerning the establishment, organization
and management of the rail freight corridors. This regulation proposal
demonstrates the resolution of policy makers in facilitating the rail freight sector
in Europe. Besides, it shows the crucial role the principle routes will play in
establishing the European rail freight corridors. Among all principle routes, route
Bremerhaven/Rotterdam/Antwerp-Aachen/Berlin-Warsaw-Terespol (Poland-
Belarus border)/Kaunas is one of them. NEA Transport research and training
(NEA) has been executed recently a ‘study exploiting the possibility of creating a
rail freight corridor linking Poland and The Netherlands’. Infrabel has requested
NEA to carry out a similar study for Belgium in order to include Belgium in this
corridor study.
The Management Summary provides an overview of the results of Task 1 (market
situation and forecasting), 2 (barriers to the market) and 3 (corridor description)
and the Action Plan.
1.2 Chapter 1 – Current situation on the market and its’ potential for further development
1.2.1 Freight volumes analysis on the corridor Belgium – Poland / Czech Republic
Overall, it can be concluded that the rail freight volumes in the corridor Belgium
– Poland/Czech Republic are rather limited. Especially compared to other
volumes on the corridor such as between Belgium and Germany or between
Poland and Germany.
In the direction from Belgium to Poland/Czech Republic, the rail freight volume is
169.000 tons or about 223 trains in 2007 towards Poland and 23.000 tons or
about 31 trains towards the Czech Republic. For future years, the volumes
towards Poland ranges between 271.000 tons in the low growth scenario for
2020 (index 1.6) to more than 422,000 tons (index 2.5) in the middle scenario in
2030 to 558.000 tons in the high growth scenario for the year 2030 (index 3.3)
and 718.000 tons (index 4.2) in 2040.
Study exploiting the possibility of creating a rail freight corridor linking Poland and Belgium
4 R20100134.doc September 2010
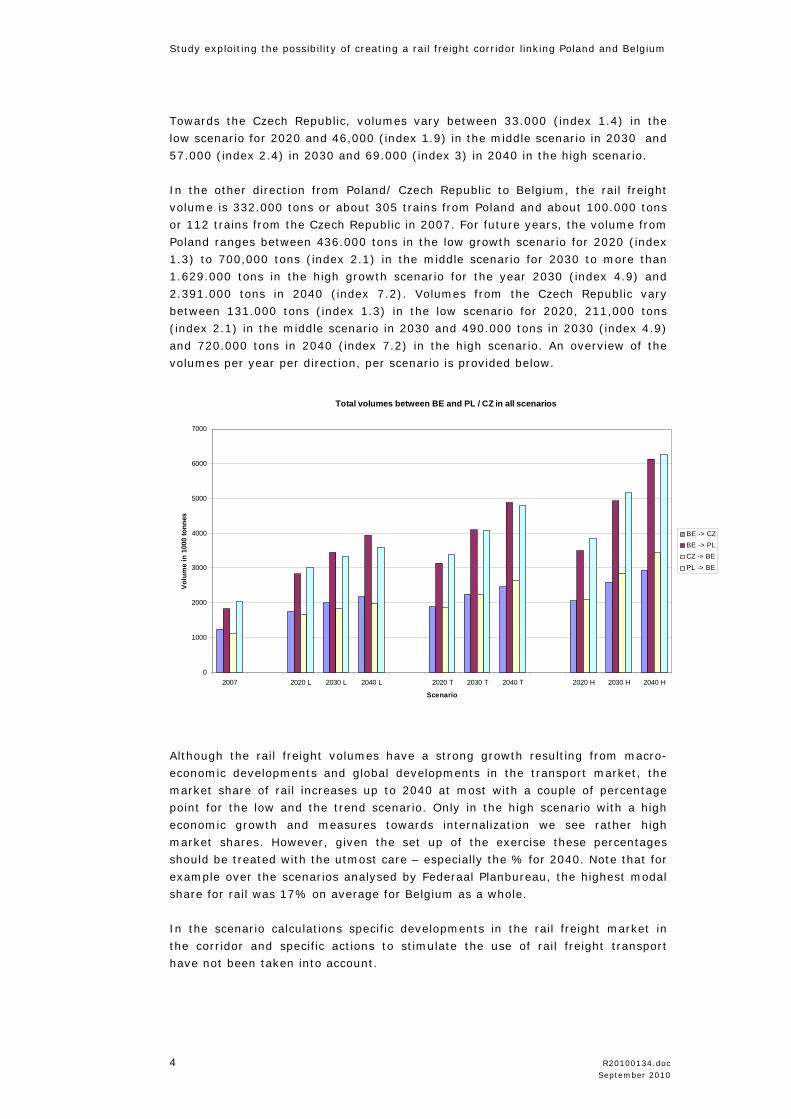
Towards the Czech Republic, volumes vary between 33.000 (index 1.4) in the
low scenario for 2020 and 46,000 (index 1.9) in the middle scenario in 2030 and
57.000 (index 2.4) in 2030 and 69.000 (index 3) in 2040 in the high scenario.
In the other direction from Poland/ Czech Republic to Belgium, the rail freight
volume is 332.000 tons or about 305 trains from Poland and about 100.000 tons
or 112 trains from the Czech Republic in 2007. For future years, the volume from
Poland ranges between 436.000 tons in the low growth scenario for 2020 (index
1.3) to 700,000 tons (index 2.1) in the middle scenario for 2030 to more than
1.629.000 tons in the high growth scenario for the year 2030 (index 4.9) and
2.391.000 tons in 2040 (index 7.2). Volumes from the Czech Republic vary
between 131.000 tons (index 1.3) in the low scenario for 2020, 211,000 tons
(index 2.1) in the middle scenario in 2030 and 490.000 tons in 2030 (index 4.9)
and 720.000 tons in 2040 (index 7.2) in the high scenario. An overview of the
volumes per year per direction, per scenario is provided below.
Total volumes between BE and PL / CZ in all scenarios
0
1000
2000
3000
4000
5000
6000
7000
2007 2020 L 2030 L 2040 L 2020 T 2030 T 2040 T 2020 H 2030 H 2040 H
Scenario
Volu
me
in 1
000
tonn
es
BE -> CZBE -> PLCZ -> BEPL -> BE
Although the rail freight volumes have a strong growth resulting from macro-
economic developments and global developments in the transport market, the
market share of rail increases up to 2040 at most with a couple of percentage
point for the low and the trend scenario. Only in the high scenario with a high
economic growth and measures towards internalization we see rather high
market shares. However, given the set up of the exercise these percentages
should be treated with the utmost care – especially the % for 2040. Note that for
example over the scenarios analysed by Federaal Planbureau, the highest modal
share for rail was 17% on average for Belgium as a whole.
In the scenario calculations specific developments in the rail freight market in
the corridor and specific actions to stimulate the use of rail freight transport
have not been taken into account.
Study exploiting the possibility of creating a rail freight corridor linking Belgium and Poland
R20100134.doc 5 September 2010
If specific developments in the rail freight market are expected and measures
and policies are introduced to stimulate the use of rail freight transport, there
might be a higher potential for rail freight transport on this corridor.
Comparing traffic flows in the Dutch-Poland, Dutch-Czech Republic study to the
Belgium-Poland and Belgium-Czech Republic study shows that there are more or
less two corridors: a strong Belgium-Poland and Dutch-Czech Republic traffic
flow and a much weaker Belgium-Czech Republic and Dutch-Poland traffic flow.
1.3 Intermodal transport analysis
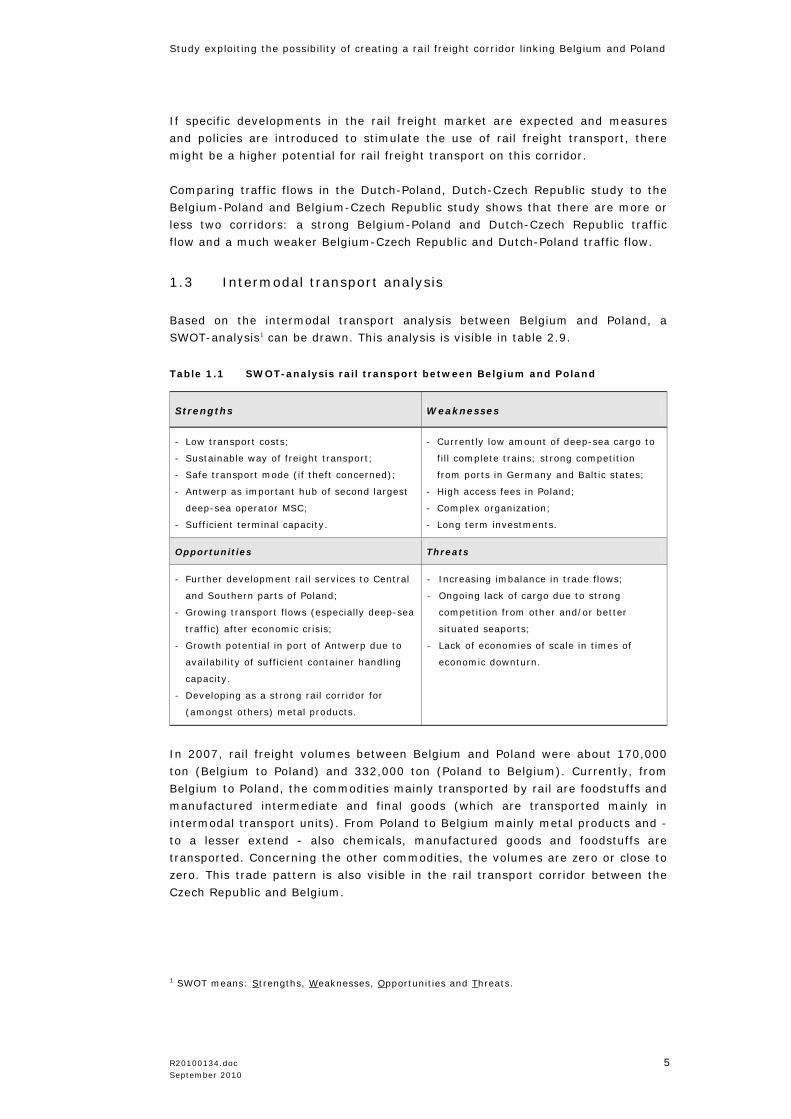
Based on the intermodal transport analysis between Belgium and Poland, a
SWOT-analysis1 can be drawn. This analysis is visible in table 2.9.
Table 1.1 SWOT-analysis rail transport between Belgium and Poland
Strengths Weaknesses
- Low transport costs;
- Sustainable way of freight transport;
- Safe transport mode (if theft concerned);
- Antwerp as important hub of second largest
deep-sea operator MSC;
- Sufficient terminal capacity.
- Currently low amount of deep-sea cargo to
fill complete trains; strong competition
from ports in Germany and Baltic states;
- High access fees in Poland;
- Complex organization;
- Long term investments.
Opportunities Threats
- Further development rail services to Central
and Southern parts of Poland;
- Growing transport flows (especially deep-sea
traffic) after economic crisis;
- Growth potential in port of Antwerp due to
availability of sufficient container handling
capacity.
- Developing as a strong rail corridor for
(amongst others) metal products.
- Increasing imbalance in trade flows;
- Ongoing lack of cargo due to strong
competition from other and/or better
situated seaports;
- Lack of economies of scale in times of
economic downturn.
In 2007, rail freight volumes between Belgium and Poland were about 170,000
ton (Belgium to Poland) and 332,000 ton (Poland to Belgium). Currently, from
Belgium to Poland, the commodities mainly transported by rail are foodstuffs and
manufactured intermediate and final goods (which are transported mainly in
intermodal transport units). From Poland to Belgium mainly metal products and -
to a lesser extend - also chemicals, manufactured goods and foodstuffs are
transported. Concerning the other commodities, the volumes are zero or close to
zero. This trade pattern is also visible in the rail transport corridor between the
Czech Republic and Belgium.
1 SWOT means: Strengths, Weaknesses, Opportunities and Threats.
Study exploiting the possibility of creating a rail freight corridor linking Poland and Belgium
6 R20100134.doc September 2010
For future years, Belgium to Poland volume ranges between 271,000 ton in the
low growth scenario for 2020 to 558,000 ton for the year 2030 and 718,000 ton
for the year 2040 in the high growth scenario. In the medium scenario (T),
transport volumes grow from 309,000 in 2020 to 516,000 in 2040. Belgium to
Czech Republic volumes ranges between 33,000 ton in the low growth scenario
for 2020 to approximately 57,000 ton for the year 2030 and 69,000 ton for the
year 2040 in the high growth scenario. In the medium scenario transport flows
vary from 37,000 in 2020 to about 53,000 in 2040. We would, however, like to
point out here that – given the set up of the model – the predictions for the year
2040 are less reliable and should be treated with care.Vice versa, for both Poland
and the Czech Republic, the growth figures from these countries to Belgium are
expected to develop much faster, although these remain rather low for the Czech
Republic compared to Poland. From Poland to Belgium the volumes ranges
between 436,000 ton in the low growth scenario for 2020 to about 700,000 in
the middle scenario in 2030 to even more than 1.6 million ton in the high growth
scenario for the year 2030; especially the metal products are expected to grow
considerably. The predictions for the year 2040 in the high scenario go even
further but, as mentioned before, are less reliable.
These forecasts are much higher than the most optimistic forecast for the
Netherlands in which rail volumes are expected to grow to a maximum of 1.2
million in 2040 (high growth scenario). Hence, these Poland – Belgium forecasts
underline the high potential of the Belgium – Poland rail corridor. From the Czech
Republic to Belgium the volumes ranges between 131,000 ton in the low growth
scenario for 2020 to 211,000 ton in 2030 in the central scenario to 490,000 ton
in the high growth scenario for the year 2030 and even till 720,000 tons in 2040.
In more detail, it can be concluded that especially the metal products (regarding
both Poland and the Czech republic) and containerized goods (between Belgium
and the Czech Republic) show a strong growth on these corridors. Because the
rail freight volumes are expected to grow fast, the market share of rail could
increase from 7% in 2007 to 8% in the middle and 9% in the high growth
scenario in 2030 (Belgium to Poland) and from 20% in 2007 to 21% in the
medium scenario in 2030 and 39% in the high growth scenario in 2030 (Poland
to Belgium). Finally, the market share of rail could increase from 13% in 2007 to
15% in the medium scenario and 16% in the high growth scenario in 2030
(Belgium to Czech Republic) and from 26% in 2007 to 28% in the medium
scenario in 2030 (Czech Republic to Belgium). In the high scenario this share
increases to 51% in 2030. Even taking into account that this is a scenario with
larger economic growth and measures aimed at a model shift towards rail, this
seems to be a too high modal share. Modal shares for 2040 are even higher, but
are likely overestimated in the case of transport from the Czech Republic/Poland
to Belgium.
Analyzing the intermodal transport market between Belgium and Poland, the
highest potential for rail transport is on the corridor between Belgium and the
centre (Poznan - Warsaw) and the South (Wroclaw – Katowice) of Poland. On
these corridors, rail transport has – especially if lightweight cargo is transported
- a cost advantage over short sea shipping via Polish seaports, due to long
distances of pre- and end haulage. Rail transport has also a clear cost advantage
over road transport if pre/end haulage is limited.

Study exploiting the possibility of creating a rail freight corridor linking Belgium and Poland
R20100134.doc 7 September 2010
The more origin and/or destinations of cargo are located Southwards and near a
rail terminal, the higher is the potential for rail transport. In addition, the
majority (87%) of all rail shipments (measured in weight) from Belgium to
Poland currently has a destination in the central or Southern part of Poland. In
the other direction, these parts in Poland are even stronger involved: 94% of all
rail shipments (measured in weight) from Poland to Belgium has an origin in the
central or Southern part of Poland.
Another important development is the growing consciousness of sustainable
supply chains in which rail transport will play an important role. If cargo transit
times are considered, those supply chains which ‘allow’ some longer transit times
in certain parts of the supply chain, rail transport can be a good transport
alternative. While some rail services have even competitive transit times
compared to road transport, rail transport is for all parts in Poland much faster
than short sea shipping via Polish seaports. Above all, frequencies of rail
transport services between Belgium and Poland are higher than for short sea
shipping. There is not enough cargo to load short sea vessels (almost) full every
day of the week, while rail transport offers a daily service between both
countries; a higher transport frequency means a higher degree of flexibility for
shippers. Finally, it is worth mentioning that especially rail services over the
weekend have an advantage over road transport, because of the driving ban on
Sunday within Germany. Table 2.10 shows the strengths and weaknesses of rail
transport over road and short sea shipping. Regarding transport costs it is clear
that short sea shipping only has an advantage over rail transport if origin and/or
destinations of cargo are located in the Northern part of Poland, close to the
Polish seaports of Gdansk/Gdynia.
Strengths and weaknesses of rail transport compared to other transport modes
Transport costs Transit times Flexibility
Rail versus road
lightweight goods + - -
Rail versus short sea
lightweight goods
+ (Southern regions)
- (Northern regions) + +
Rail versus road
heavy goods + - -
Rail versus short sea
heavy goods
+ (Southern regions)
- (Northern regions) + +
In short, rail transport has potential if cargo is or has:
• Originated and/or a destination in Central/Southern Poland;
• High and low weight density; however the advantage towards the other
modalities is stronger for light weight goods, because of weight restrictions.
• Predictable well in advance;
• Expected to be produced and transported in a sustainable way.
Study exploiting the possibility of creating a rail freight corridor linking Poland and Belgium
8 R20100134.doc September 2010
1.4 Chapter 2 - Identification of barriers to further development
The barriers to the transport of goods between Poland and Belgium which have
been presented above, are those reported by the interested parties who are
operating on the market of rail transport. These barriers are subjective opinions
and they do not always coincide with the opinions of others participants of the
market. However, in most cases, the identified barriers are the same or similar.
The barriers focused on Beglium corridor as there are limited operators running
trains to Poland and the Polish are described in detail in the Netherlands-Poland
corridor study.
When analyzing the railway freight market Belgium and Poland it must be noted
that there is a strong competition with the others means of transport and also
inside the railway market (especially between block trains). This competition
results in the most important feature of the services offered to the customer
being the price of carriages of goods between Belgium and Poland. The vast
majority of the interviewees focused on the fact that as regards transport offers,
customers choose the cheapest offer. Only few times the quality of transport was
more stressed on. Indeed, only a few interviewees declared that in addition to
price, other factors such as quality of transport service play an important role. In
addition, significant importance was given to the inadequacy of infrastructure
and the additional scope of services offered.
1.5 Chapter 3 Selection of the Paths
This Task has been presenting the features of the Belgium railways in their
relations to Poland. For each route the advantages and disadvantages are
described including the bottlenecks. The main terminals are described including
some caracteristics and the most important infrastructure projects relevant to
the corridor Belgium – Poland are presented.
An overwiew is provided between the main alternative routes from Antwerp to
Hannover and from Hannover to Poland. Following routes were considered:
• Antwerp – Montzen – Hannover
• Antwerp – Rotterdam – Duisburg – Hannover
• Antwerp – Rotterdam – Osnabruck – Hannover
• Antwerp – Duisburg – Hannover (Iron Rhine)
The three available routes show quite some differences; the route via Rotterdam
and Osnabruck is currently the fastest, the shortest and the cheapest; which will
change with the opening of revitalished Iron Rhine. The Iron Rhine is according
the schedule the fastest, shortest and nearly the cheapest route to Hannover in
future.
Especially the track access charges are (of the existing routes) much lower at the
Rotterdam-Osnabruck route than the other two current options. However for this
last route the locomotive has to been adopted with the Dutch safety and energy
system. Moreover, the route can coop with the current level of freight trains, but
faces congestion when traffic rises.
Study exploiting the possibility of creating a rail freight corridor linking Belgium and Poland
R20100134.doc 9 September 2010
As track access charges in Belgium and the Netherlands are cheaper than in
Germany, it reduces TAC costs when taking the route which is avoiding extra
kilometers in Germany. The Iron Rhine is the shortest, but, most probably, due
to the higher German access charges not the cheapest.
The Anwerp – Montzen – Hannover route is or will be included in the existing and
planned to be implemented European transport rail services corridors such as
ERTMS corridors, TEN-T corridors or RailNetEurope (RNE corridor 3).
The proposed revitalished Iron Rhine Railway line is a future alternative to
Poland being the shortest route to Hannover and much cheaper than the Montzen
route.
In order to allow the efficient implementation of the transport of goods in the
planned corridors, appropriate actions should be proposed and laid down. These
activities should be coordinated one another and should be associated with the
adaptation and adequate maintenance of the railway and terminal
infrastructures.
1.6 Action Plan focusing on Belgium
A complete version of Action Plan for Rail Freight Corridor Belgium – Poland
(hereinafter: the Corridor) is made and provided in the Appendix 6.1. This
Action Plan is made on the basis of the Action Plan of developing corridor The
Netherlands – Poland1 with focus on Belgium. In total, seven measures (listed in
the 1st column) are brought forward, each of which presents the development of
one specific aspect of the Corridor. Under each measure a set of milestones
(listed in the 2nd column) are generated, adding up to a total of forty-one
milestones for all seven measures. For each milestone, primary stakeholders are
determined from four types of stakeholders (listed in the 3rd column), namely,
Ministries of Transport (MoTs), Infrastructure Managers (IMs), National Safety
Authorities (NSAs), and Rail Regulators (RRs), to be responsible for the
execution of the milestone. Besides, the level of workload (listed in the 4th
column) and the period for implementation (listed in the 5thcolumn) are
estimated for each milestone.
The timeline for implementing the Action Plan is between 1 to 5 years. Therefore
long term milestones have an estimated 5 year period, short term milestones up
to two years and medium in between. Since Germany, despite being one of the
Corridor states, is not involved in this study, stakeholders concerned in the
Action Plan are those in Belgium, the Netherlands and in Poland.
While all of these milestones are made for the Corridor, a few of them are of
particular relevance for Belgium. Given this, we deduct from the Action Plan
Complete Version the milestones that are custom-made for Belgium.
1 Reference: NEA (2010), Study ‐ Exploiting the Possibility of creating a rail freight corridor linking Poland and the Netherlands, Zoetermeer, 2010

Study exploiting the possibility of creating a rail freight corridor linking Poland and Belgium
10 R20100134.doc September 2010
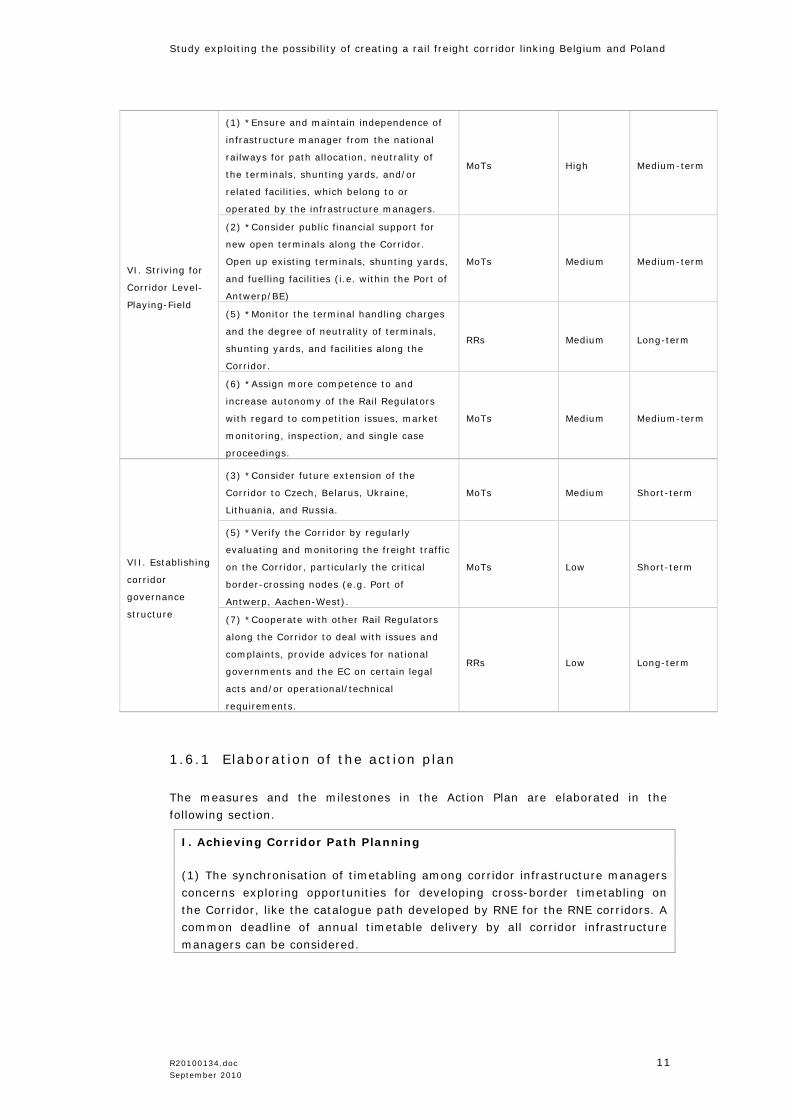
As seen in Table 1.4, in total fourteen milestones focus on Belgium (They are
also marked * in Appendix 6.1).
Table 1.4: Action plan particularly for Belgium on Rail Freight Corridor Belgium -
Poland
Measures Milestones Primary
Stakeholders
Level of
Work-
load
Implemen-
tation
Period
(1) *Improve synchronisation of timetabling
with the Corridor members: taking into
account of, among others, the integrative
planning of alternative routes BE/NL – DE
including part of the ERTMS corridor A, C, &
F, Montzen route, and Iron Rhine.
IMs Medium Short-term
(2) *Extend to the Corridor the Beligum
policy of surcharge of cancelling train-paths
reserved by RUs in order to stimulate RUs
to make efficient planning and avoid
possible discriminative actions.
IMs Medium Short-term I. Achieving
Corridor Path
Planning (5) *Explore possibility to provide updated,
delay-related information (e.g. data from
Europtirail) timely available also to rail
operators who have direct, frequent
contacts with customers, so that rail
operators and LSPs (logistics service
providers) can timely adjust operational &
logistical planning according to new
situations.
IMs Medium Short-term
III. Achieving
Corridor
Capacity
Planning
(2) *Plan medium/long term scenarios of
state financing on removing capacity
bottlenecks, taking into account its
consistency with TEN-T and ERTMS
progress, and with the maintenance,
upgrade, reconstruction, and charging
planning of the Corridor states.
IMs Medium Long-term
IV. Establishing
Corridor
Performance
Regime
(3) *Derive appropriate incentives for IMs
or RUs to improve the reliability and traffic
performance along the Corridor.
IMs Low Medium-term
(1) *Investigate on the possibility for a
single working language on the Corridor
(e.g. English or single code language).
NSAs/IMs High Medium-term
V. Improving
Corridor
Interoperability
(2) Speed up licensing process along the
Corridor to facilitate quicker access of the
RUs to the corridor countries.
NSAs High Short-term
Study exploiting the possibility of creating a rail freight corridor linking Belgium and Poland
R20100134.doc 11 September 2010
(1) *Ensure and maintain independence of
infrastructure manager from the national
railways for path allocation, neutrality of
the terminals, shunting yards, and/or
related facilities, which belong to or
operated by the infrastructure managers.
MoTs High Medium-term
(2) *Consider public financial support for
new open terminals along the Corridor.
Open up existing terminals, shunting yards,
and fuelling facilities (i.e. within the Port of
Antwerp/BE)
MoTs Medium Medium-term
(5) *Monitor the terminal handling charges
and the degree of neutrality of terminals,
shunting yards, and facilities along the
Corridor.
RRs Medium Long-term
VI. Striving for
Corridor Level-
Playing-Field
(6) *Assign more competence to and
increase autonomy of the Rail Regulators
with regard to competition issues, market
monitoring, inspection, and single case
proceedings.
MoTs Medium Medium-term
(3) *Consider future extension of the
Corridor to Czech, Belarus, Ukraine,
Lithuania, and Russia.
MoTs Medium Short-term
(5) *Verify the Corridor by regularly
evaluating and monitoring the freight traffic
on the Corridor, particularly the critical
border-crossing nodes (e.g. Port of
Antwerp, Aachen-West).
MoTs Low Short-term VII. Establishing
corridor
governance
structure (7) *Cooperate with other Rail Regulators
along the Corridor to deal with issues and
complaints, provide advices for national
governments and the EC on certain legal
acts and/or operational/technical
requirements.
RRs Low Long-term
1.6.1 Elaboration of the action plan
The measures and the milestones in the Action Plan are elaborated in the
following section.
I. Achieving Corridor Path Planning
(1) The synchronisation of timetabling among corridor infrastructure managers
concerns exploring opportunities for developing cross-border timetabling on
the Corridor, like the catalogue path developed by RNE for the RNE corridors. A
common deadline of annual timetable delivery by all corridor infrastructure
managers can be considered.
Study exploiting the possibility of creating a rail freight corridor linking Poland and Belgium
12 R20100134.doc September 2010
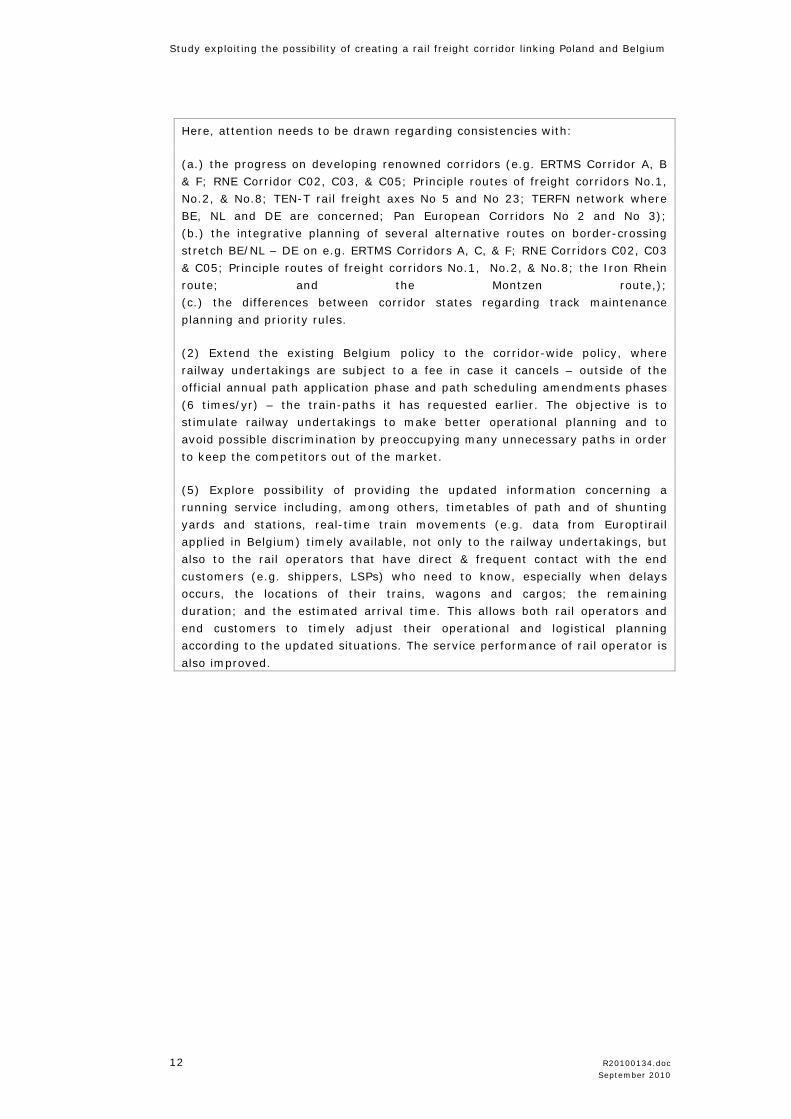
Here, attention needs to be drawn regarding consistencies with:
(a.) the progress on developing renowned corridors (e.g. ERTMS Corridor A, B
& F; RNE Corridor C02, C03, & C05; Principle routes of freight corridors No.1,
No.2, & No.8; TEN-T rail freight axes No 5 and No 23; TERFN network where
BE, NL and DE are concerned; Pan European Corridors No 2 and No 3);
(b.) the integrative planning of several alternative routes on border-crossing
stretch BE/NL – DE on e.g. ERTMS Corridors A, C, & F; RNE Corridors C02, C03
& C05; Principle routes of freight corridors No.1, No.2, & No.8; the Iron Rhein
route; and the Montzen route,);
(c.) the differences between corridor states regarding track maintenance
planning and priority rules.
(2) Extend the existing Belgium policy to the corridor-wide policy, where
railway undertakings are subject to a fee in case it cancels – outside of the
official annual path application phase and path scheduling amendments phases
(6 times/yr) – the train-paths it has requested earlier. The objective is to
stimulate railway undertakings to make better operational planning and to
avoid possible discrimination by preoccupying many unnecessary paths in order
to keep the competitors out of the market.
(5) Explore possibility of providing the updated information concerning a
running service including, among others, timetables of path and of shunting
yards and stations, real-time train movements (e.g. data from Europtirail
applied in Belgium) timely available, not only to the railway undertakings, but
also to the rail operators that have direct & frequent contact with the end
customers (e.g. shippers, LSPs) who need to know, especially when delays
occurs, the locations of their trains, wagons and cargos; the remaining
duration; and the estimated arrival time. This allows both rail operators and
end customers to timely adjust their operational and logistical planning
according to the updated situations. The service performance of rail operator is
also improved.

Study exploiting the possibility of creating a rail freight corridor linking Belgium and Poland
R20100134.doc 13 September 2010
III. Achieving Corridor Capacity Planning
(2) Based on the results of capacity analysis, make medium- and long- term
scenarios of infrastructure financing in order to anticipate capacity growth and
mitigate capacity bottlenecks from technical and operational constraints. These
scenarios need to focus on both the tracks within the country and tracks
linking gates and hubs at border-crossing areas (e.g. Port of Antwerp, terminal
Aachen-West, Port of Rotterdam; Zevenaar – Emmerich; Oldenzaal – Bad
Bentheim; Frankfurt (Oder) – Kunowice; Horka – Bielawa Dolna; Szczecin).
The infrastructure planning also needs to be consistent with the rail projects in
TEN-T (e.g. priority axes No 5), and the progress on ERTMS corridor A, C and
F. This shall also take into account the maintenance, upgrading and
reconstruction, and the charging plan of the corridor states. In Beligum,
current investment plan is for period 2001-2012 and the next investment plan
2013-2025 is under preparation.
IV. Establishing Corridor Performance Regime
(3) Since causes and duration of delays could be monitored via the EPR
(European Performance Regime), implementation of appropriate financial
incentives can be suggested for infrastructure managers or railway
undertakings to improve the traffic performance and the reliability of train
services along the Corridor.
V. Improving Corridor Interoperability
(1) Introduce cross-acceptance of approval procedure of rolling stocks on the
Corridor by using the IRL (International Requirement List) in conformity with
the common checklist according to the EC Directive 2008/57/EC. Scale up the
existing bilateral agreements between NL-DE for cross acceptance of train
crews to a corridor-wide implementation, in conformity with the Directive
2007/59 on engine driver licensing and certification. Consider using the same
approach for cross-acceptance of freight wagon if necessary. Increase time and
cost efficiency of this procedure. Have dialogue with the railway undertakings
for impact assessment of this cross-acceptance action.
(2) Investigate the possibilities to achieve using one single working language
for service operation, for example in English or code language, in accordance
with the TSI regarding working language for service operation that is codified
in TSI Operations Chapter 4.2.1.5. However, it should be born in mind that
compatibility with relevant Belgium legislation (i.e. law of 1962) should be
taken into account.
Study exploiting the possibility of creating a rail freight corridor linking Poland and Belgium
14 R20100134.doc September 2010
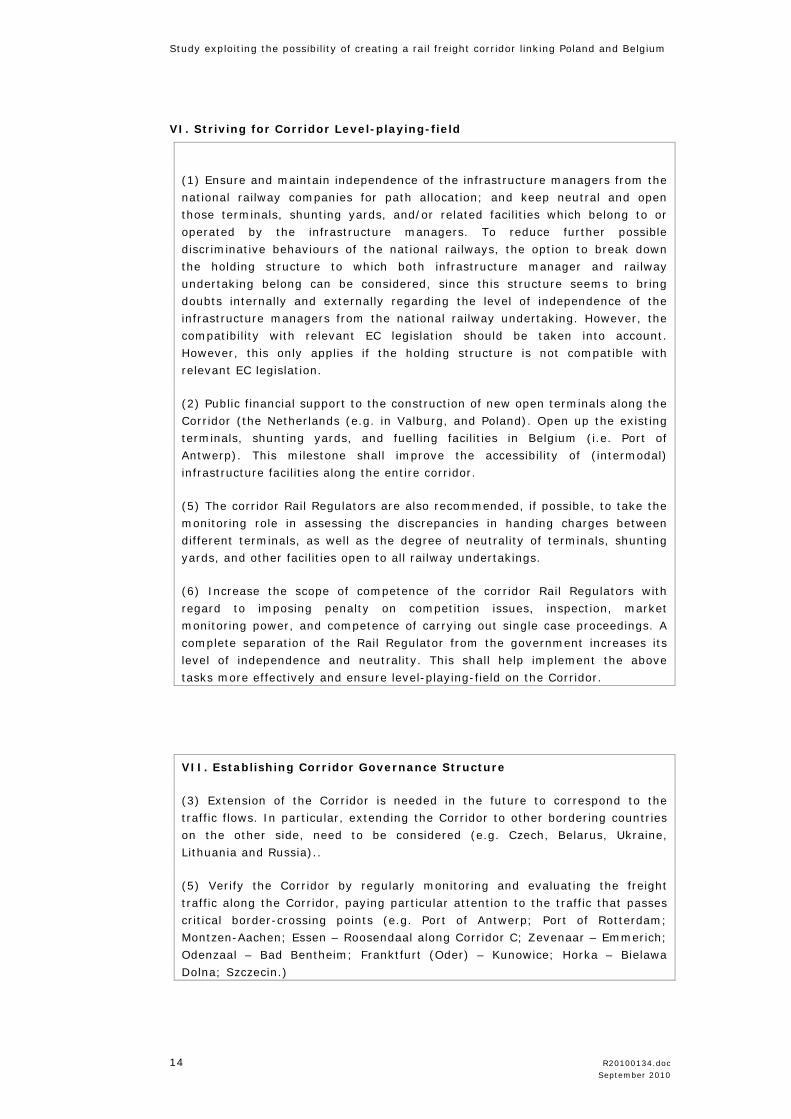
VI. Striving for Corridor Level-playing-field
(1) Ensure and maintain independence of the infrastructure managers from the
national railway companies for path allocation; and keep neutral and open
those terminals, shunting yards, and/or related facilities which belong to or
operated by the infrastructure managers. To reduce further possible
discriminative behaviours of the national railways, the option to break down
the holding structure to which both infrastructure manager and railway
undertaking belong can be considered, since this structure seems to bring
doubts internally and externally regarding the level of independence of the
infrastructure managers from the national railway undertaking. However, the
compatibility with relevant EC legislation should be taken into account.
However, this only applies if the holding structure is not compatible with
relevant EC legislation.
(2) Public financial support to the construction of new open terminals along the
Corridor (the Netherlands (e.g. in Valburg, and Poland). Open up the existing
terminals, shunting yards, and fuelling facilities in Belgium (i.e. Port of
Antwerp). This milestone shall improve the accessibility of (intermodal)
infrastructure facilities along the entire corridor.
(5) The corridor Rail Regulators are also recommended, if possible, to take the
monitoring role in assessing the discrepancies in handing charges between
different terminals, as well as the degree of neutrality of terminals, shunting
yards, and other facilities open to all railway undertakings.
(6) Increase the scope of competence of the corridor Rail Regulators with
regard to imposing penalty on competition issues, inspection, market
monitoring power, and competence of carrying out single case proceedings. A
complete separation of the Rail Regulator from the government increases its
level of independence and neutrality. This shall help implement the above
tasks more effectively and ensure level-playing-field on the Corridor.
VII. Establishing Corridor Governance Structure
(3) Extension of the Corridor is needed in the future to correspond to the
traffic flows. In particular, extending the Corridor to other bordering countries
on the other side, need to be considered (e.g. Czech, Belarus, Ukraine,
Lithuania and Russia)..
(5) Verify the Corridor by regularly monitoring and evaluating the freight
traffic along the Corridor, paying particular attention to the traffic that passes
critical border-crossing points (e.g. Port of Antwerp; Port of Rotterdam;
Montzen-Aachen; Essen – Roosendaal along Corridor C; Zevenaar – Emmerich;
Odenzaal – Bad Bentheim; Franktfurt (Oder) – Kunowice; Horka – Bielawa
Dolna; Szczecin.)
Study exploiting the possibility of creating a rail freight corridor linking Belgium and Poland
R20100134.doc 15 September 2010
(7) Cooperate with other Rail Regulators along the Corridor for identifying
crucial issues and dealing with complaints relevant for the Corridor; based on
which provide advices for national governments and the EC regarding
possibilities of adjusting certain legal acts and/or harmonising certain
operational and technical requirements.

Study exploiting the possibility of creating a rail freight corridor linking Belgium and Poland
R20100134.doc 17 September 2010
2 Current situation on the market and its’ potential for further development
2.1 Freight volumes analysis on the corridor Belgium – Poland / Czech Republic
2.1.1 Background and Methodology
In 2008 about 60 million tons of goods were transported over the Belgian railway
system. The rail freight market in Belgium appears to be very international
oriented as in 2008 63% of the transported tons have an international link. This
% even rises to 74% if we consider tonkm instead of tons1. The focus of this
document lies on the transport flows between Poland and the Czech Republic and
Belgium. Previously, TNO(2008) made a similar scenario calculation for the rail
corridor Netherlands-Poland.
TML produced scenario calculations for rail freight transport (and other modes of
transport) between Belgium and Germany, Poland and the Czech Republic. This
has been done for a number of scenarios (low growth, trend growth and high
growth) and for three time horizons 2020, 2030 and 2040. These scenario
calculations provide good insight in the current and future expected rail freight
flows on the corridor Belgium – Germany – Poland – Czech Republic. Besides, by
analyzing transport of other modes also freight flows can be identified that are
potential for rail freight transport.
Methodology
An important starting point for the scenario calculations are the Traffic Forecasts
Iron Rhine (2007), the TNO study on scenario calculations Rail freight transport
on corridor Netherlands – Poland (2009) and the study by the Bundesamt für
Güterverkehr (2010). Furthermore a study analyzing rail freight flows in Belgium
by FOD Economie, KMO, Middenstand en Energie (2010) and data originating
from the TRANS-TOOLS model2 was also used. Note that both the Traffic
Forecasts for the Iron Rhine and the TNO study made forecasts for rail freight
using the European transport model TRANS-TOOLS as a base.
Scenarios
The background scenarios are the same as in the scenarios used in the Traffic
Forecasts of the Iron Rhine and in the TNO study. They differ in the assumed
economic growth and in the assumed transport policy.
1 FOD Economie, KMO, Middenstand en Energie (2010); Analyse van het goederenvervoer per
spoor in België. 2 http://energy.jrc.ec.europa.eu/transtools/TT_model.html
Study exploiting the possibility of creating a rail freight corridor linking Poland and Belgium
18 R20100134.doc September 2010
Key uncertainties in scenarios
The approach used has a number of uncertainties. More specifically, the following
uncertainties are identified:
• Representativeness and validity of base year
• Socio-economic developments
• Developments in the transport market, including the potential reactivation of
the Iron Rhine
The next sections describe the way these uncertainties have been treated in the
modeling approach.
Representativeness and validity of base year
2007 was chosen as a base year as it is also the base year in the TNO report.
This year was chosen as the base given the recent strong development of rail
transport, which was believed to be structural. Using older data would not take
into account these changes.
We first compared data on transport flows, reported in the following studies:
• the traffic forecasts Iron Rhine (2007)
• the TNO study (2008)
• original Transtools data
• the study by Bundesamt für Güterverkehr (2010)
• the study by FOD Economie (2010)
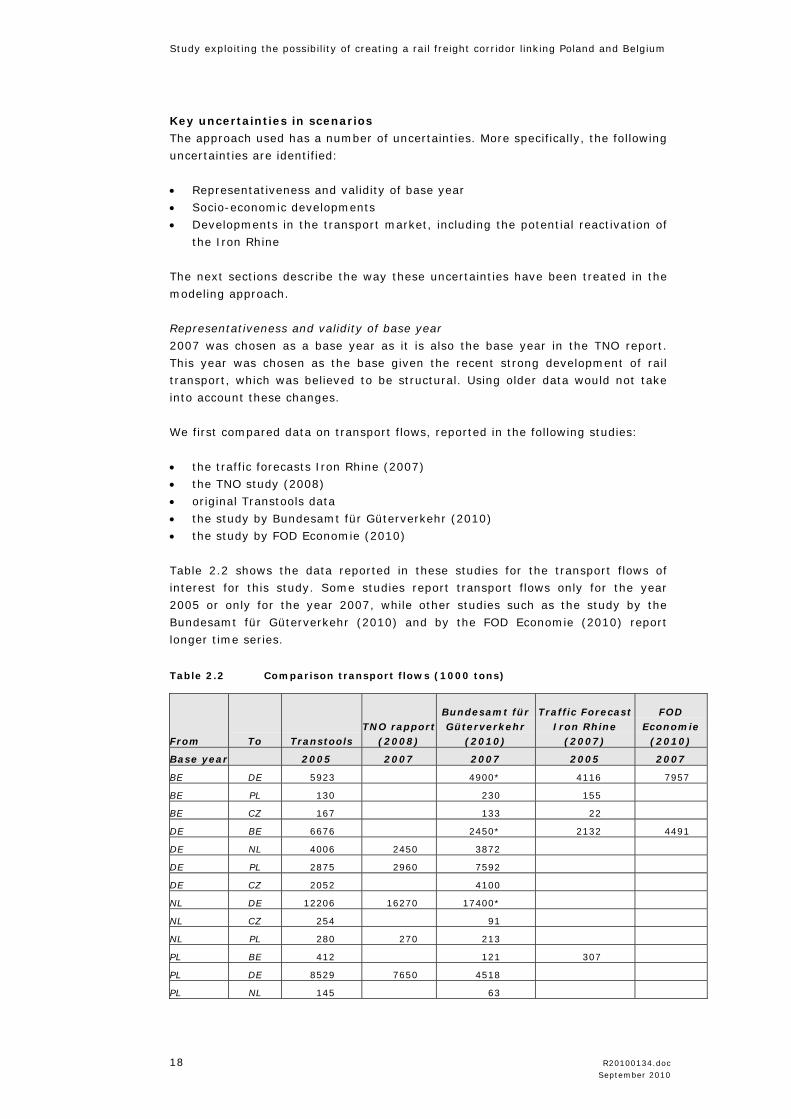
Table 2.2 shows the data reported in these studies for the transport flows of
interest for this study. Some studies report transport flows only for the year
2005 or only for the year 2007, while other studies such as the study by the
Bundesamt für Güterverkehr (2010) and by the FOD Economie (2010) report
longer time series.
Table 2.2 Comparison transport flows (1000 tons)
From To Transtools TNO rapport
(2008)
Bundesamt für Güterverkehr
(2010)
Traffic Forecast Iron Rhine
(2007)
FOD Economie
(2010)
Base year 2005 2007 2007 2005 2007
BE DE 5923 4900* 4116 7957
BE PL 130 230 155
BE CZ 167 133 22
DE BE 6676 2450* 2132 4491
DE NL 4006 2450 3872
DE PL 2875 2960 7592
DE CZ 2052 4100
NL DE 12206 16270 17400*
NL CZ 254 91
NL PL 280 270 213
PL BE 412 121 307
PL DE 8529 7650 4518
PL NL 145 63
Study exploiting the possibility of creating a rail freight corridor linking Belgium and Poland
R20100134.doc 19 September 2010
CZ BE 296 68 92 99
CZ DE 6142 3721
CZ NL 293 65
* Data for 2008 in stead of for 2007
The comparison is not always straightforward as different base years are
reported, but in general the orders of magnitude correspond. Notable are the
differences between the transport flows reported between:
• Belgium and Germany by the German Bundesamt für Güterverkehr (2010)
and the Belgian FOD Economy (2010). Figures stated differ with a factor 1.6
for the direction Belgium-Germany and a factor 1.8 in the direction Germany-
Belgium.
• Belgium and the Czech Republic, where the Bundesamt für Güterverkehr
(2010) reports a transport flow which is about 6 times higher than the
volumes used in the Traffic Forecasts Iron Rhine. Notable here is that the
German study reports transport flows between Belgium and the Czech
Republic of 49 thousand tons in 2005 and of 45 thousand tons in 2009,
making the difference much smaller. Hence, there seems to be a lot of
fluctuations in these transport flow.
• Germany and Poland in the TNO study and the Bundesamt für Güterverkehr
(2010). The number stated by Bundesamt für Gütereverkehr (2010) is about
2.5 times higher than the numbers stated by TNO (2008).
None of the data sources can be used as a single starting point as none of the
studies report data for all links needed. We have opted for freight rail transport
to combine the results of the Traffic Forecasts and the study by the Bundesamt
für Güterverkehr (2010) as this combination leads to the greatest consistency
and as the Traffic Forecast figures where checked with data from B-rail.
Remember that both studies gave very different results for the Czech Republic.
We have opted to use the number stated by the vervoersprognoses as:
• the time series reported by the Bundesamt für Güterverkehr (2010) show
that in most years traffic flows are closer to the 22 thousand tons used in the
Iron Rhine forecasts than the 133 thousand tons reported for the year 2007.
• it was asked to be as consistent as possible with the Iron Rhine forecast
study.
For freight transport using other modes such as road and inland waterways we
relied on TRANS-TOOLS -data.
Apart from the problems with the initial data itself, opting for 2007 also implies
that the recent economic crisis is not taken into account. The study by
Bundesamt für Güterverkehr (2010) clearly shows a sharp decline in rail
transport between 2008 and 2009. For example, the number of goods train in
the year 2009 fell by 21% to 67 trains a day in each direction for east-west
transport operations. During the same period, the volume of transport from
Germany in the direction of the CEE countries fell by almost 50%, mainly due to
a strong decline in transport between Germany and Poland. In westwards
direction, total transport volume decreased by roughly 9% compared to 2008.
Hence, using data for 2009 – if available – would lead to a very different picture.
Study exploiting the possibility of creating a rail freight corridor linking Poland and Belgium
20 R20100134.doc September 2010
Considering both elements, the representativeness and validity of the base year
is one of the key uncertainties in the scenarios.
Socio-economic developments
As far as the socio-economic development is concerned, expectations in a
European trend scenario developed for the European Commission and
implemented, amongst others, in the TRANS-TOOLS project and the Iron Rhine
forecasts are the starting point.
Three distinct scenarios are used, one with a low economic growth (scen 1), one
with a medium growth (scen2) and one with a higher growth (scen3). The lower
growth scenario presumes a growth in Europe 0.5% lower than the growth in the
European trend scenario: 1.80% instead of 2.30% per annum for the EU25
(period 2005-2020). The higher growth scenario presumes a growth in Europe
0.5% higher than growth in the European trend scenario: 2.80% instead of
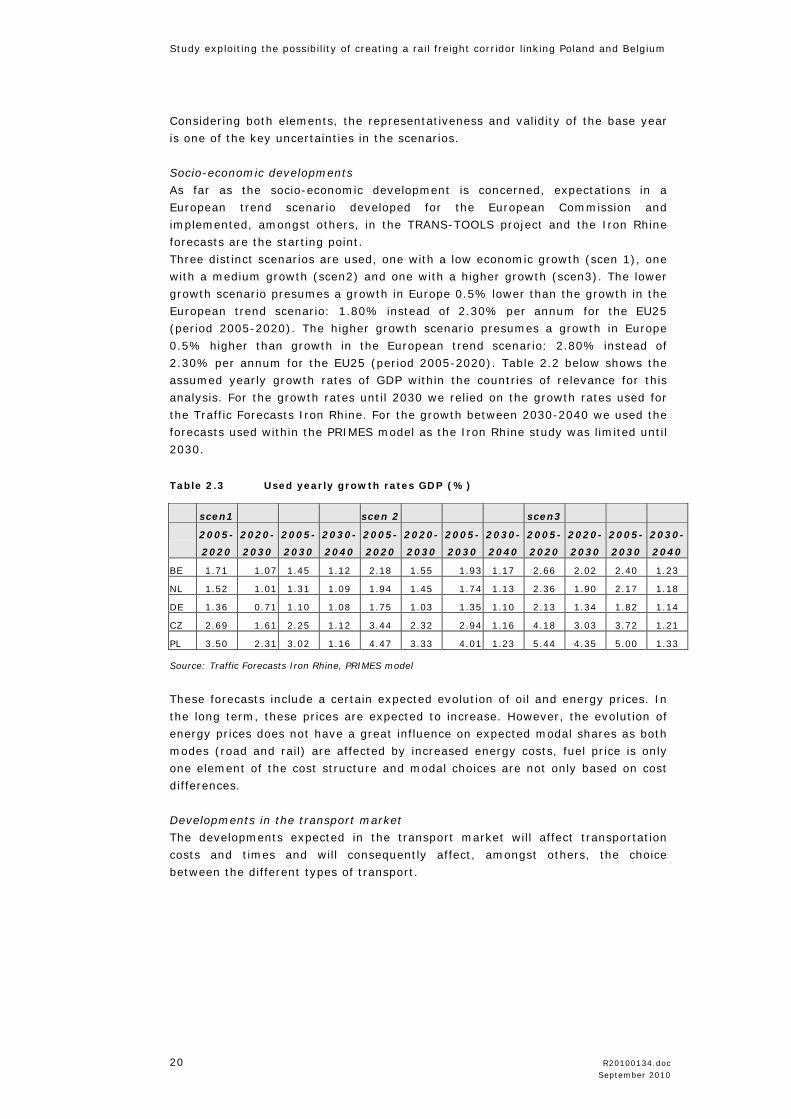
2.30% per annum for the EU25 (period 2005-2020). Table 2.2 below shows the
assumed yearly growth rates of GDP within the countries of relevance for this
analysis. For the growth rates until 2030 we relied on the growth rates used for
the Traffic Forecasts Iron Rhine. For the growth between 2030-2040 we used the
forecasts used within the PRIMES model as the Iron Rhine study was limited until
2030.
Table 2.3 Used yearly growth rates GDP (%)
scen1 scen 2 scen3
2005-
2020
2020-
2030
2005-
2030
2030-
2040
2005-
2020
2020-
2030
2005-
2030
2030-
2040
2005-
2020
2020-
2030
2005-
2030
2030-
2040
BE 1.71 1.07 1.45 1.12 2.18 1.55 1.93 1.17 2.66 2.02 2.40 1.23
NL 1.52 1.01 1.31 1.09 1.94 1.45 1.74 1.13 2.36 1.90 2.17 1.18
DE 1.36 0.71 1.10 1.08 1.75 1.03 1.35 1.10 2.13 1.34 1.82 1.14
CZ 2.69 1.61 2.25 1.12 3.44 2.32 2.94 1.16 4.18 3.03 3.72 1.21
PL 3.50 2.31 3.02 1.16 4.47 3.33 4.01 1.23 5.44 4.35 5.00 1.33
Source: Traffic Forecasts Iron Rhine, PRIMES model
These forecasts include a certain expected evolution of oil and energy prices. In
the long term, these prices are expected to increase. However, the evolution of
energy prices does not have a great influence on expected modal shares as both
modes (road and rail) are affected by increased energy costs, fuel price is only
one element of the cost structure and modal choices are not only based on cost
differences.
Developments in the transport market
The developments expected in the transport market will affect transportation
costs and times and will consequently affect, amongst others, the choice
between the different types of transport.
Study exploiting the possibility of creating a rail freight corridor linking Belgium and Poland
R20100134.doc 21 September 2010
Within the Traffic Forecasts of the Iron Rhine, two distinct scenarios concerning
the developments in the transport market were used:
• A scenario (scenario A) with moderate developments including the
liberalization of rail transport;
• A more extensive scenario (scenario B) including the developments of the
previous scenario and including charges for external costs.
The moderate scenario A is based on a continuation of current policies. This
includes the policy as proposed by the European Commission in its White Paper
(European Commission, 2001), and in addition to it, Keep Europe Moving
(European Commission, 2006). One of the goals of this policy is to achieve a
shift from transportation by road to inland waterways and rail transportation.
For infrastructure, all projects currently in progress and all those that have
passed the definitive decision to be built have been included. For rail, it is
implicitly assumed that the capacity can facilitate any increase in demand, thus
the same transportation time can be offered. There are (except for the well-
known planned projects) no new rail connections expected. With respect to the
reactivation of the Iron Rhine, the traffic forecasts showed that the largest
potential for the Iron Rhine comes from economic growth and shifts from other
rail tracks. The reactivation of the Iron Rhine would cause only a small modal
shift.
The main reason for this small modal shift is that the reactivation of the Iron
Rhine mainly influences transport in the region Antwerp and North-Rhine-
Westfalen. The distance between these areas is relatively short; this is, less than
200 km. For such short distance, no large modal shifts can be expected as – in
general – rail transport is not concurrent on short distances. In summary, the
reactivation of the Iron Rhine does not really influence the scenario forecasts.
For rail transport a user charge of € 2.50 (real) per train kilometer is assumed
for the whole period 2020-2040 throughout Europe. Currently, the rate for most paths is lower in Belgium with prices varying around 1.4-2.5 euro/km1. Prices
vary with traction, time, weight, etc. A rail fee increase is expected in order to
charge all costs caused by the user to the user. A similar charge will be applied
in all countries across Europe. For road, a toll of € 0.15 per vehicle kilometer is
expected for the entire period 2020-2040 for the whole of Europe.
Furthermore, for the whole of Europe liberalization of the rail market across
Europe is expected including the implementation of the so-called "third railway
package". Due to this fact it is expected that the level of rail service will improve
(lower turnaround time and lower transport costs).
In the more extensive scenario B, it is also assumed, in addition to all these
developments, that a charge on external costs is introduced. Table 2.3 shows the
rates for freight.
1 Based on calculations using information stated in Infrabel (2009) for 2 routes and for two time
periods

Study exploiting the possibility of creating a rail freight corridor linking Poland and Belgium
22 R20100134.doc September 2010
Table 2.4 Charges external freight costs.
2020 2030-2040
Road 0,075 euro/vrtgkm 0,15 euro/vrtgkm
Rail 0,005 euro/tkm 0,01 euro/tkm
Inland shipping 0,005 euro/tkm 0,01 euro/tkm
Source: Traffic Forecasts Iron Rhine (2007)
Combination of key uncertainties
By combining the different variants of the socio-economic development (low,
moderate, high) with the variants of the development in the transport market
(moderate, more extensive) 6 different scenarios can be distinguished. The
combination of low economic growth with further developments in the transport
market and the combination of high economic growth with moderate
developments in the transport market will not be used because they add little to
the range of scenarios. Besides that, the combination of moderate economic
growth with further developments in the transport market is not used because
this scenario is slightly distinctive compared to the scenario of moderate
economic growth with moderate developments in the transport market.
Finally, following the TNO study and the Iron Rhine forecasts, the three following
combinations were chosen to be further elaborated:
• Low economic growth, moderate developments in the transport market
(LG scenario);
• Moderate economic growth, moderate developments in the transport
(GG scenario);
• High economic growth, further developments in the transport (HV scenario).
Among these three, the GG scenario can be considered as the reference. This
scenario contains the European trend scenario in terms of economic growth. In
terms of developments in the transport market it is close to the proposed policy
and the anticipated developments of the future. This scenario describes current
and expected future developments, not taking into account 'extreme'
developments. These three scenarios are combined with three time horizons,
namely 2020, 2030 and 2040. This means that there have been made
calculations for 9 scenario situations (3 scenarios for each of the 3 time
horizons).
Table 2.5 Overview of distinguished scenarios
2020 2030 2040
Low economic growth, moderate developments transport market (LG) X X X
Moderate economic growth, moderate developments transport market (GG) X X X
High economic growth, further developments transport markt (HV) X X X
Methodology rail corridor Belgium – Poland/Czech Republic study
For the rail corridor Belgium – Poland/Czech Republic, the transport flows from
the Traffic forecasts Iron Rhine and Bundesamt für Güterverkehr study are the
basis. However, a number of modifications have been made.
Study exploiting the possibility of creating a rail freight corridor linking Belgium and Poland
R20100134.doc 23 September 2010
The modifications mainly concern the base year data. The Iron Rhine study data
is upgraded to the year 2007 using the TNO study and the German study.
Then in a next step new scenario calculations have been made with TRANS-
TOOLS and the results of the TNO study. based on updated base year data. In
the next figure an overview is given of the annual growth of GDP in the European
trendscenario. In the past, total transport grew faster than GDP in the EU25,
while rail transport grew slower than GDP (FOD Economie, 2010).
Concerning the results, it is stressed that the scenario calculations are mainly
based on macro-economic developments. Specific developments in the rail
freight market in this corridor are not taken into account.
2.1.2 Results
Rail freight volumes on the corridor in 2007
First of all the rail freight volumes on the corridor in the year 2007 have been
analysed. In the next two figures the country – to – country volumes of border
crossings on the corridor Belgium – Poland/Czech Republic are illustrated.
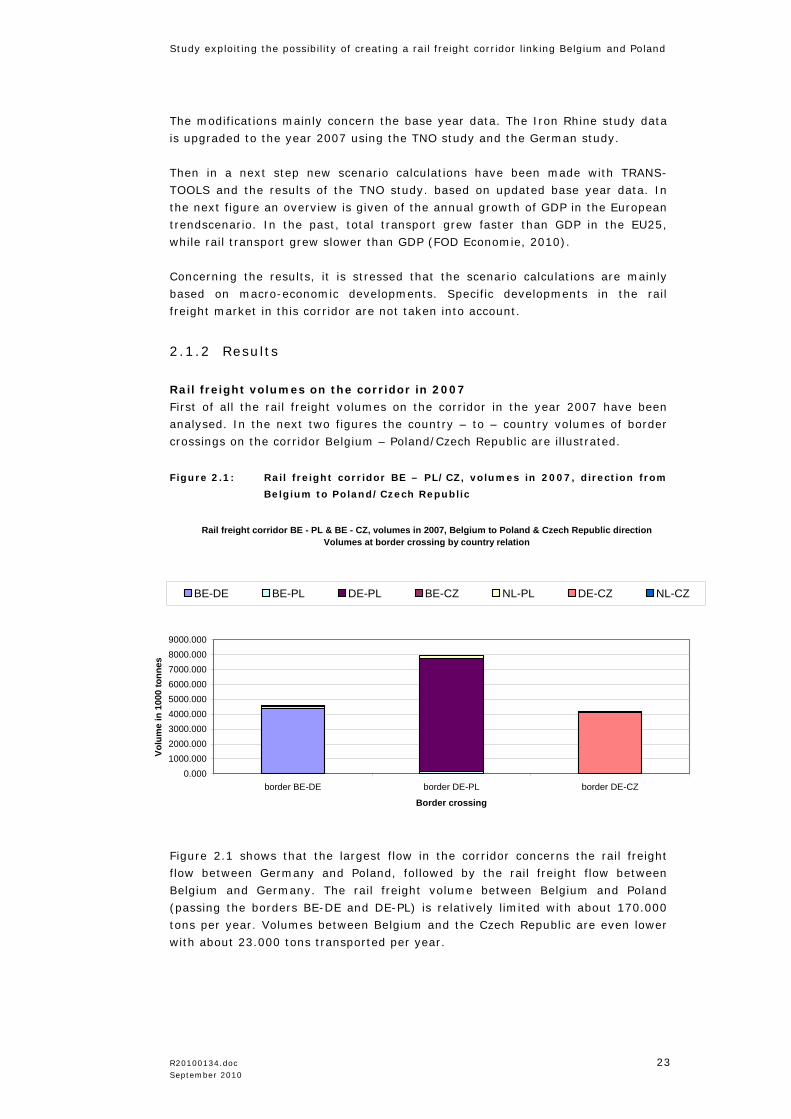
Figure 2.1: Rail freight corridor BE – PL/CZ, volumes in 2007, direction from
Belgium to Poland/Czech Republic
Rail freight corridor BE - PL & BE - CZ, volumes in 2007, Belgium to Poland & Czech Republic directionVolumes at border crossing by country relation
0.0001000.0002000.0003000.0004000.0005000.0006000.0007000.0008000.0009000.000
border BE-DE border DE-PL border DE-CZ
Border crossing
Volu
me
in 1
000
tonn
es
BE-DE BE-PL DE-PL BE-CZ NL-PL DE-CZ NL-CZ
Figure 2.1 shows that the largest flow in the corridor concerns the rail freight
flow between Germany and Poland, followed by the rail freight flow between
Belgium and Germany. The rail freight volume between Belgium and Poland
(passing the borders BE-DE and DE-PL) is relatively limited with about 170.000
tons per year. Volumes between Belgium and the Czech Republic are even lower
with about 23.000 tons transported per year.
Study exploiting the possibility of creating a rail freight corridor linking Poland and Belgium
24 R20100134.doc September 2010
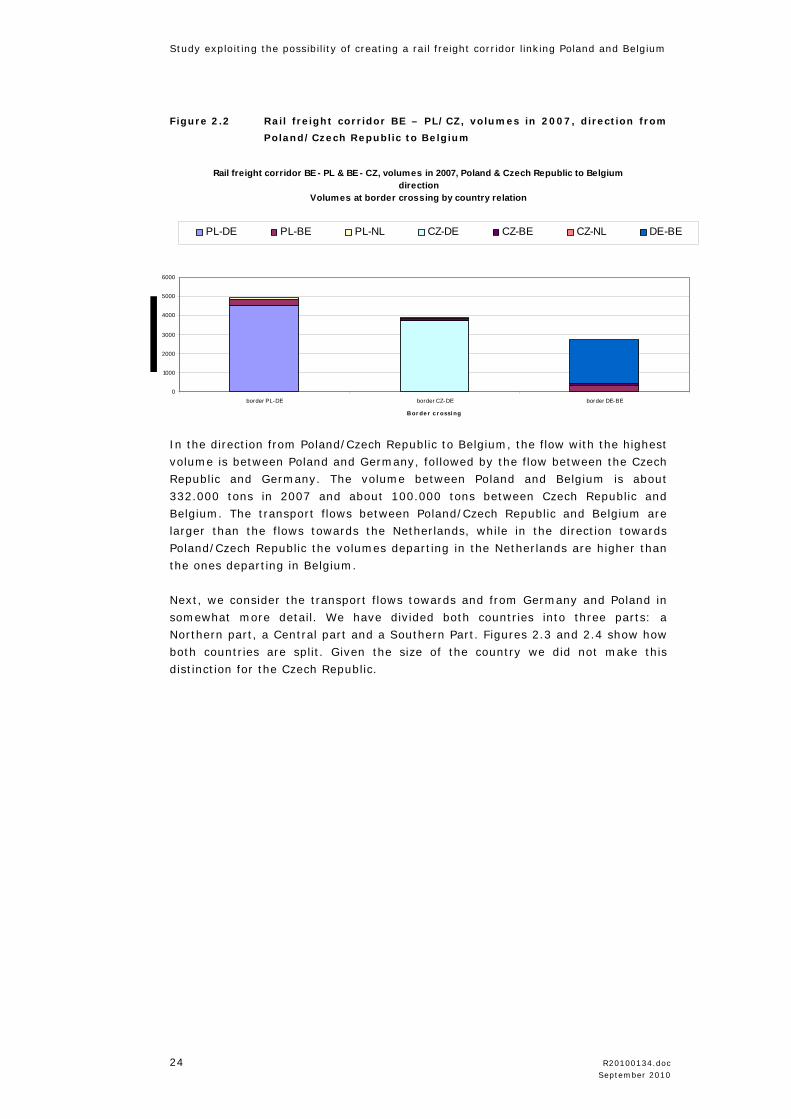
Figure 2.2 Rail freight corridor BE – PL/CZ, volumes in 2007, direction from
Poland/Czech Republic to Belgium
Rail freight corridor BE - PL & BE - CZ, volumes in 2007, Poland & Czech Republic to Belgium direction
Volumes at border crossing by country relation
0
1000
2000
3000
4000
5000
6000
border PL-DE border CZ-DE border DE-BE
B or de r c r ossi ng
PL-DE PL-BE PL-NL CZ-DE CZ-BE CZ-NL DE-BE
In the direction from Poland/Czech Republic to Belgium, the flow with the highest
volume is between Poland and Germany, followed by the flow between the Czech
Republic and Germany. The volume between Poland and Belgium is about
332.000 tons in 2007 and about 100.000 tons between Czech Republic and
Belgium. The transport flows between Poland/Czech Republic and Belgium are
larger than the flows towards the Netherlands, while in the direction towards
Poland/Czech Republic the volumes departing in the Netherlands are higher than
the ones departing in Belgium.
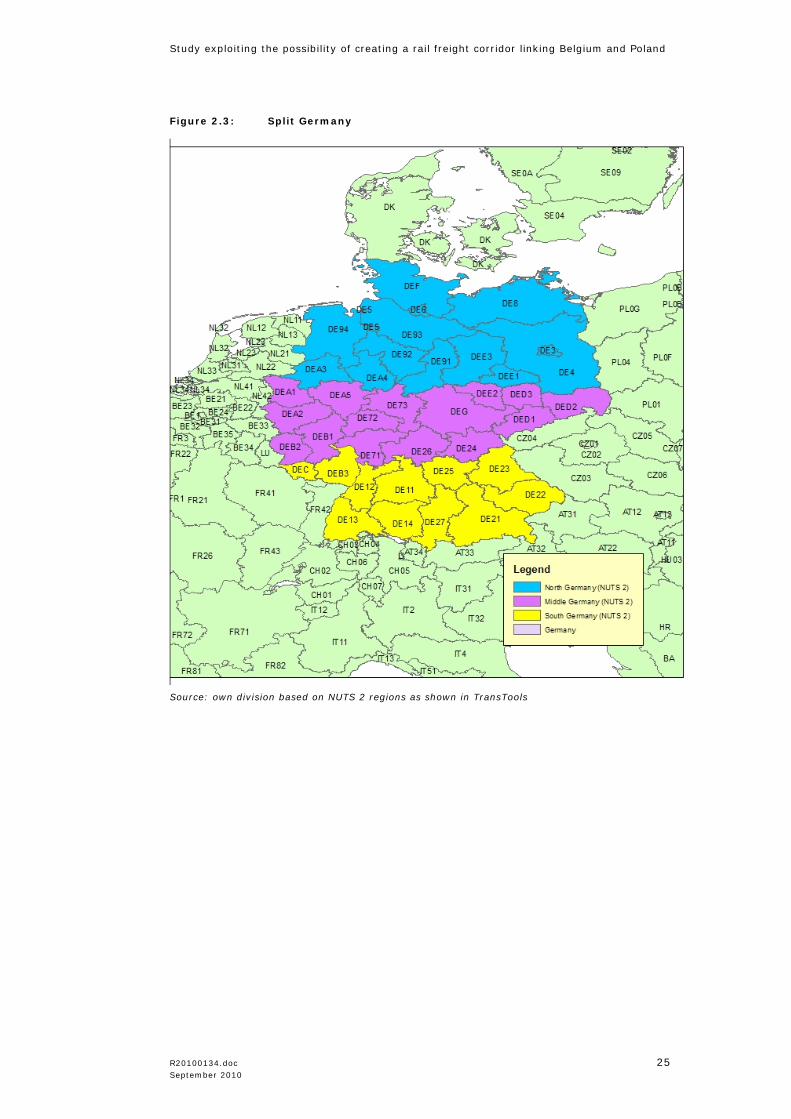
Next, we consider the transport flows towards and from Germany and Poland in
somewhat more detail. We have divided both countries into three parts: a
Northern part, a Central part and a Southern Part. Figures 2.3 and 2.4 show how
both countries are split. Given the size of the country we did not make this
distinction for the Czech Republic.
Study exploiting the possibility of creating a rail freight corridor linking Belgium and Poland
R20100134.doc 25 September 2010
Figure 2.3: Split Germany
Source: own division based on NUTS 2 regions as shown in TransTools
Study exploiting the possibility of creating a rail freight corridor linking Poland and Belgium
26 R20100134.doc September 2010
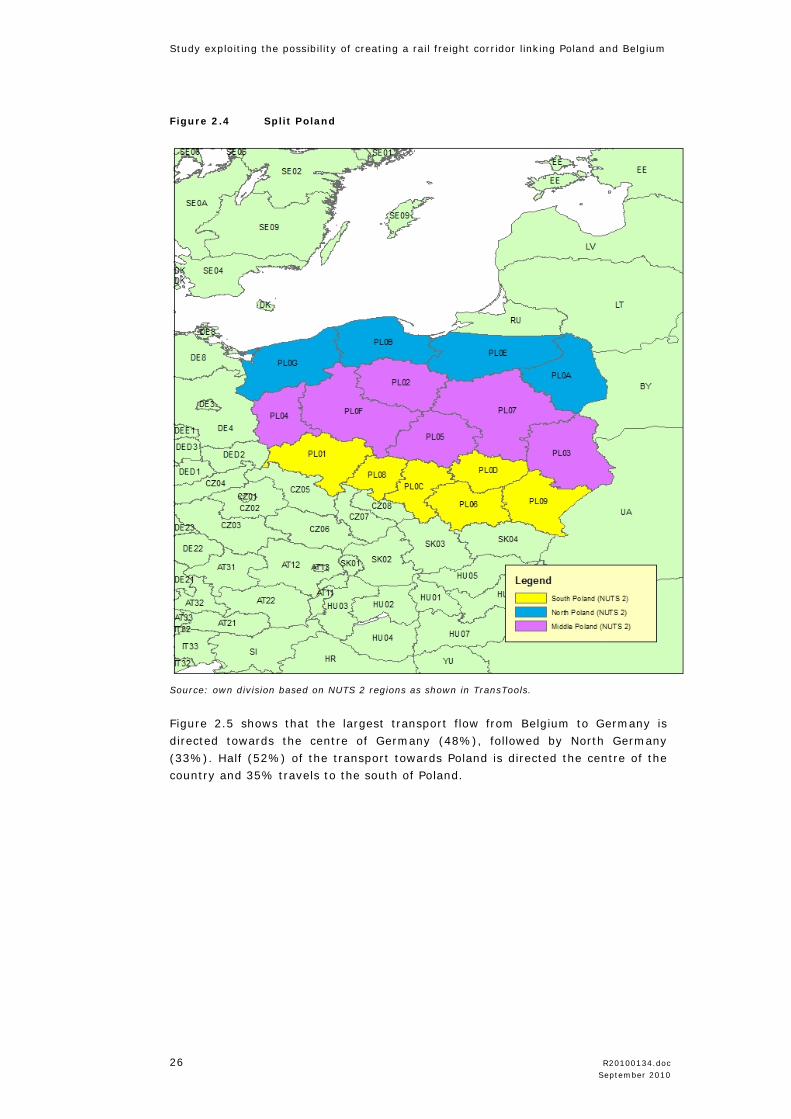
Figure 2.4 Split Poland
Source: own division based on NUTS 2 regions as shown in TransTools.
Figure 2.5 shows that the largest transport flow from Belgium to Germany is
directed towards the centre of Germany (48%), followed by North Germany
(33%). Half (52%) of the transport towards Poland is directed the centre of the
country and 35% travels to the south of Poland.
Study exploiting the possibility of creating a rail freight corridor linking Belgium and Poland
R20100134.doc 27 September 2010
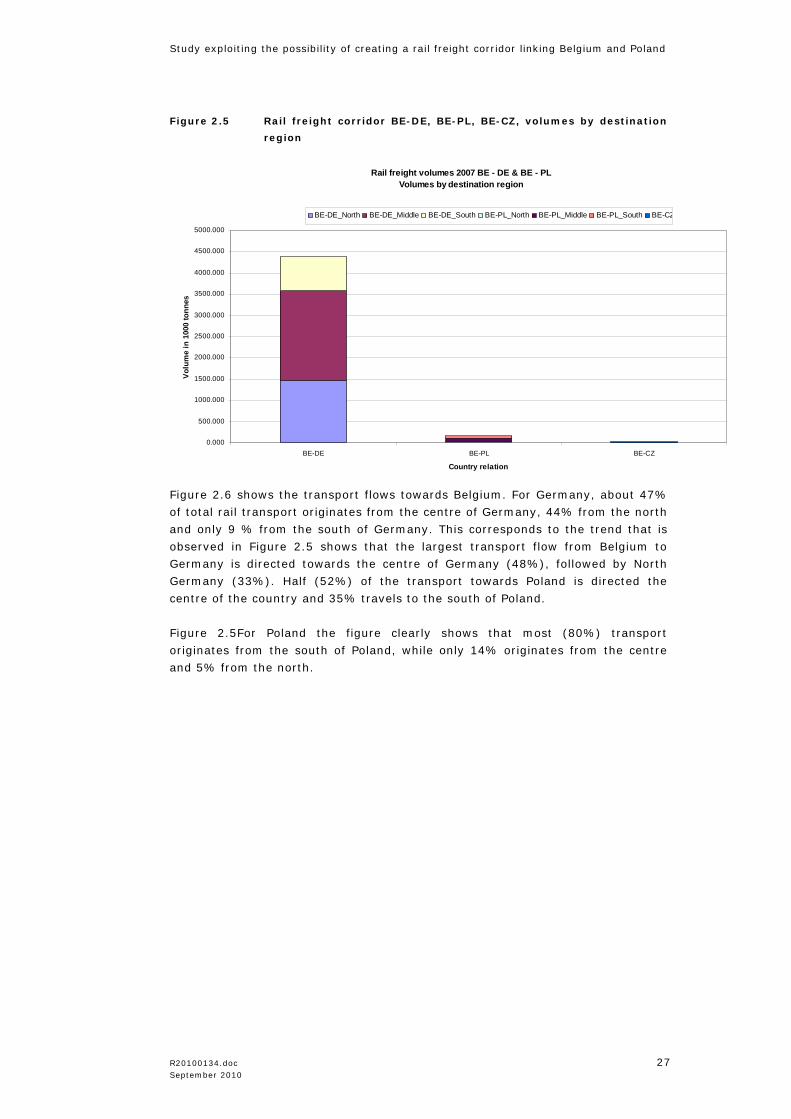
Figure 2.5 Rail freight corridor BE-DE, BE-PL, BE-CZ, volumes by destination
region
Rail freight volumes 2007 BE - DE & BE - PL Volumes by destination region
0.000
500.000
1000.000
1500.000
2000.000
2500.000
3000.000
3500.000
4000.000
4500.000
5000.000
BE-DE BE-PL BE-CZ
Country relation
Vol
ume
in 1
000
tonn
es
BE-DE_North BE-DE_Middle BE-DE_South BE-PL_North BE-PL_Middle BE-PL_South BE-CZ
Figure 2.6 shows the transport flows towards Belgium. For Germany, about 47%
of total rail transport originates from the centre of Germany, 44% from the north
and only 9 % from the south of Germany. This corresponds to the trend that is
observed in Figure 2.5 shows that the largest transport flow from Belgium to
Germany is directed towards the centre of Germany (48%), followed by North
Germany (33%). Half (52%) of the transport towards Poland is directed the
centre of the country and 35% travels to the south of Poland.
Figure 2.5For Poland the figure clearly shows that most (80%) transport
originates from the south of Poland, while only 14% originates from the centre
and 5% from the north.

Study exploiting the possibility of creating a rail freight corridor linking Poland and Belgium
28 R20100134.doc September 2010
Figure 2.6 Rail freight corridor DE-BE, PL-BE, CZ-BE, volumes by destination
region
Rail freight volumes 2007 DE - BE & PL - BE Volumes by destination region
0.000
500.000
1000.000
1500.000
2000.000
2500.000
DE-BE PL-BE CZ-BE
Country relation
Volu
me
in 1
000
tonn
es
DE_North-BE DE_Middle-BE DE_South-BE PL_North-BE PL_Middle-BE PL_South-BE CZ-BE
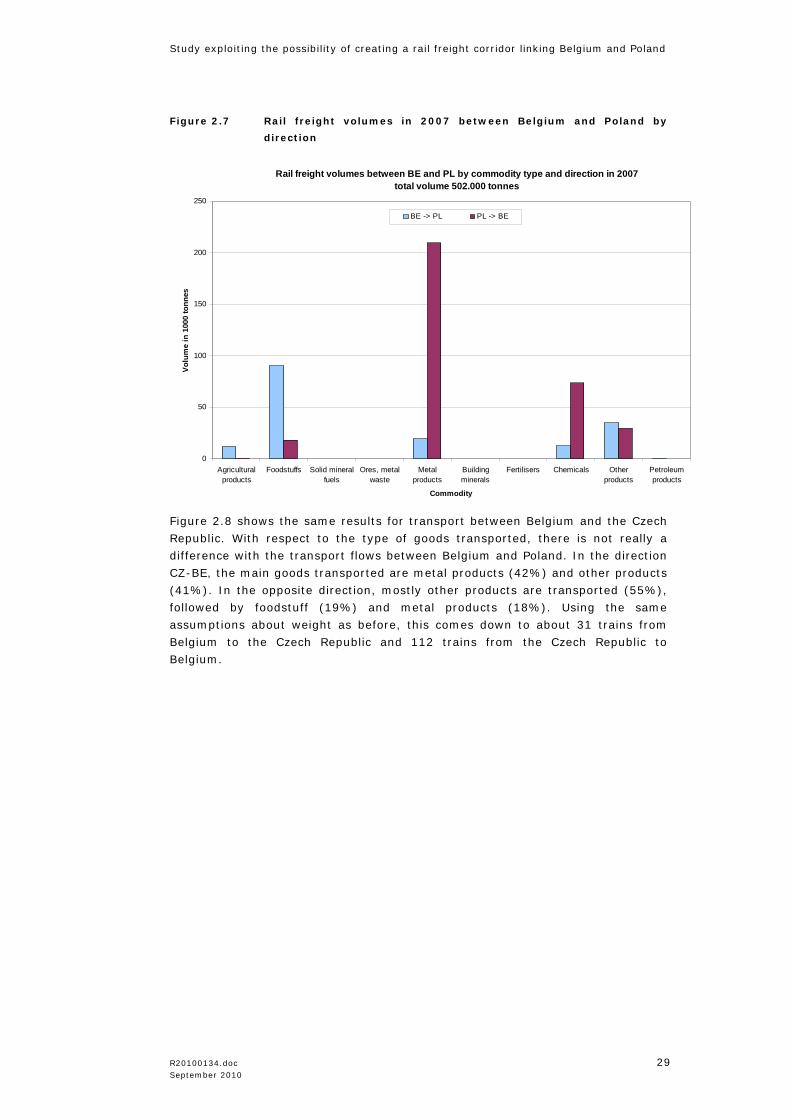
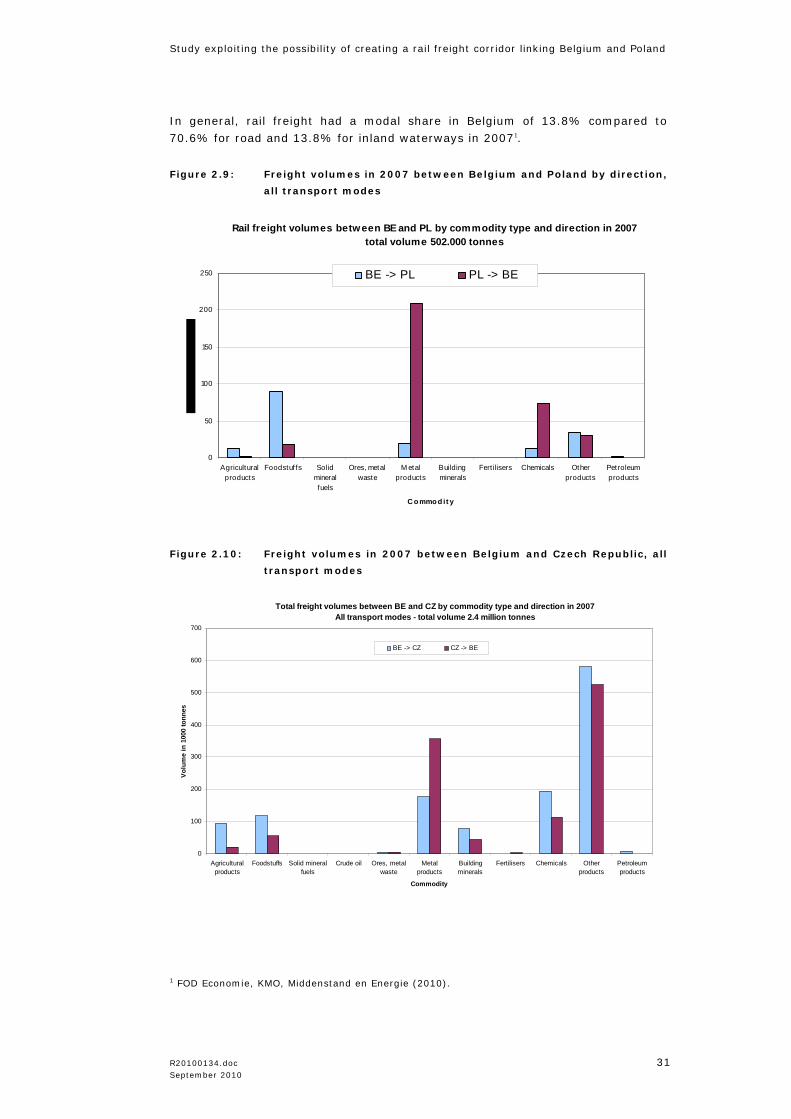
Figure 2.7 shows the rail freight volumes between Belgium and Poland in 2007
by commodity group. The commodity metal products has the highest volumes in
the direction PL-BE, while food stuff and other products have the highest share
in the direction BE-PL. “Other products” concern manufactured goods and
intermediate and final products, these goods are mainly transported in
containers. Lower volumes are transported by rail for the commodities chemicals
and agricultural products. For the other commodities, the volumes are zero or
close to zero. If we assume a loading of 700 ton per train for the goods 0,1,5,8,9
and a loading of about 1200 ton per train for the other types of goods, these
volumes implies that about 223 trains are running from Belgium to Poland and
about 305 trains from Poland to Belgium.
Study exploiting the possibility of creating a rail freight corridor linking Belgium and Poland
R20100134.doc 29 September 2010
Figure 2.7 Rail freight volumes in 2007 between Belgium and Poland by
direction
Rail freight volumes between BE and PL by commodity type and direction in 2007total volume 502.000 tonnes
0
50
100
150
200
250
Agriculturalproducts
Foodstuffs Solid mineralfuels
Ores, metalwaste
Metalproducts
Buildingminerals
Fertilisers Chemicals Otherproducts
Petroleumproducts
Commodity
Volu
me
in 1
000
tonn
es
BE -> PL PL -> BE
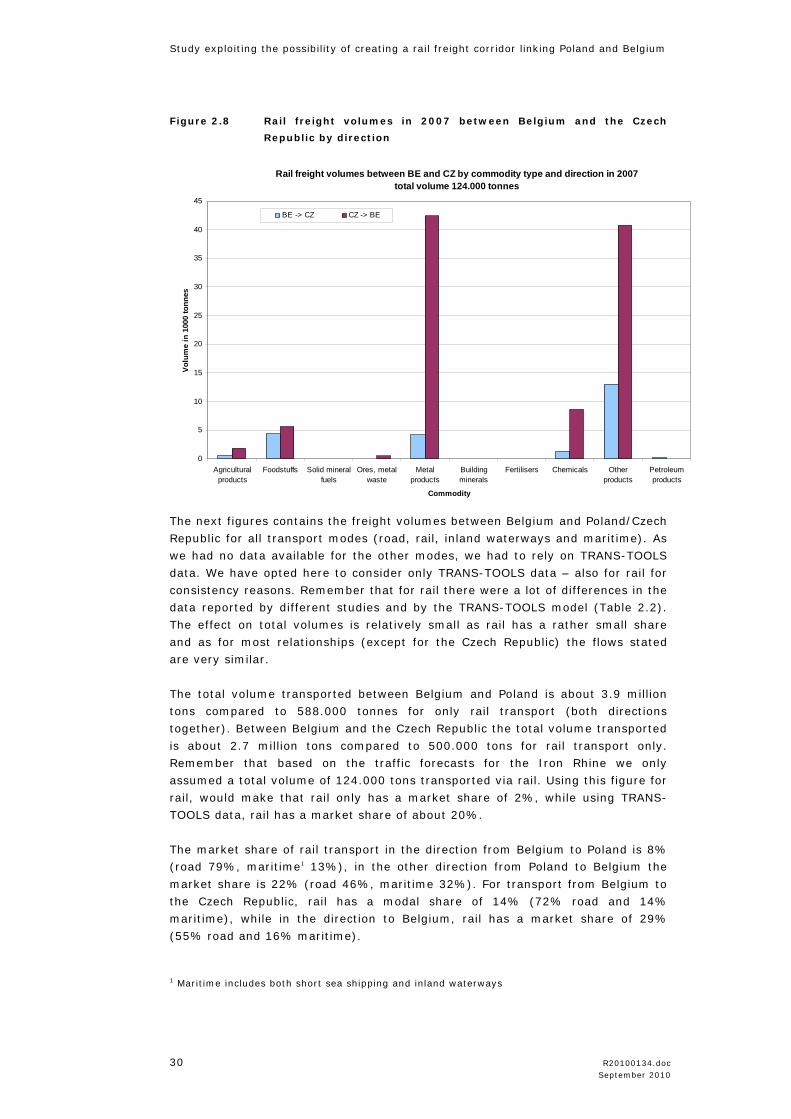
Figure 2.8 shows the same results for transport between Belgium and the Czech
Republic. With respect to the type of goods transported, there is not really a
difference with the transport flows between Belgium and Poland. In the direction
CZ-BE, the main goods transported are metal products (42%) and other products
(41%). In the opposite direction, mostly other products are transported (55%),
followed by foodstuff (19%) and metal products (18%). Using the same
assumptions about weight as before, this comes down to about 31 trains from
Belgium to the Czech Republic and 112 trains from the Czech Republic to
Belgium.
Study exploiting the possibility of creating a rail freight corridor linking Poland and Belgium
30 R20100134.doc September 2010
Figure 2.8 Rail freight volumes in 2007 between Belgium and the Czech
Republic by direction
Rail freight volumes between BE and CZ by commodity type and direction in 2007total volume 124.000 tonnes
0
5
10
15
20
25
30
35
40
45
Agriculturalproducts
Foodstuffs Solid mineralfuels
Ores, metalwaste
Metalproducts
Buildingminerals
Fertilisers Chemicals Otherproducts
Petroleumproducts
Commodity
Volu
me
in 1
000
tonn
es
BE -> CZ CZ -> BE
The next figures contains the freight volumes between Belgium and Poland/Czech
Republic for all transport modes (road, rail, inland waterways and maritime). As
we had no data available for the other modes, we had to rely on TRANS-TOOLS
data. We have opted here to consider only TRANS-TOOLS data – also for rail for
consistency reasons. Remember that for rail there were a lot of differences in the
data reported by different studies and by the TRANS-TOOLS model (Table 2.2).
The effect on total volumes is relatively small as rail has a rather small share
and as for most relationships (except for the Czech Republic) the flows stated
are very similar.
The total volume transported between Belgium and Poland is about 3.9 million
tons compared to 588.000 tonnes for only rail transport (both directions
together). Between Belgium and the Czech Republic the total volume transported
is about 2.7 million tons compared to 500.000 tons for rail transport only.
Remember that based on the traffic forecasts for the Iron Rhine we only
assumed a total volume of 124.000 tons transported via rail. Using this figure for
rail, would make that rail only has a market share of 2%, while using TRANS-
TOOLS data, rail has a market share of about 20%.
The market share of rail transport in the direction from Belgium to Poland is 8% (road 79%, maritime1 13%), in the other direction from Poland to Belgium the
market share is 22% (road 46%, maritime 32%). For transport from Belgium to
the Czech Republic, rail has a modal share of 14% (72% road and 14%
maritime), while in the direction to Belgium, rail has a market share of 29%
(55% road and 16% maritime).
1 Maritime includes both short sea shipping and inland waterways
Study exploiting the possibility of creating a rail freight corridor linking Belgium and Poland
R20100134.doc 31 September 2010
In general, rail freight had a modal share in Belgium of 13.8% compared to
70.6% for road and 13.8% for inland waterways in 20071.
Figure 2.9: Freight volumes in 2007 between Belgium and Poland by direction,
all transport modes
Rail freight volumes between BE and PL by commodity type and direction in 2007total volume 502.000 tonnes
0
50
100
150
200
250
Agriculturalproducts
Foodstuf fs Solidmineralfuels
Ores, metalwaste
M etalproducts
Buildingminerals
Fert ilisers Chemicals Otherproducts
Petroleumproducts
C o mmo d it y
BE -> PL PL -> BE
Figure 2.10: Freight volumes in 2007 between Belgium and Czech Republic, all
transport modes
Total freight volumes between BE and CZ by commodity type and direction in 2007All transport modes - total volume 2.4 million tonnes
0
100
200
300
400
500
600
700
Agriculturalproducts
Foodstuffs Solid mineralfuels
Crude oil Ores, metalwaste
Metalproducts
Buildingminerals
Fertilisers Chemicals Otherproducts
Petroleumproducts
Commodity
Vol
ume
in 1
000
tonn
es
BE -> CZ CZ -> BE
1 FOD Economie, KMO, Middenstand en Energie (2010).
Study exploiting the possibility of creating a rail freight corridor linking Poland and Belgium
32 R20100134.doc September 2010
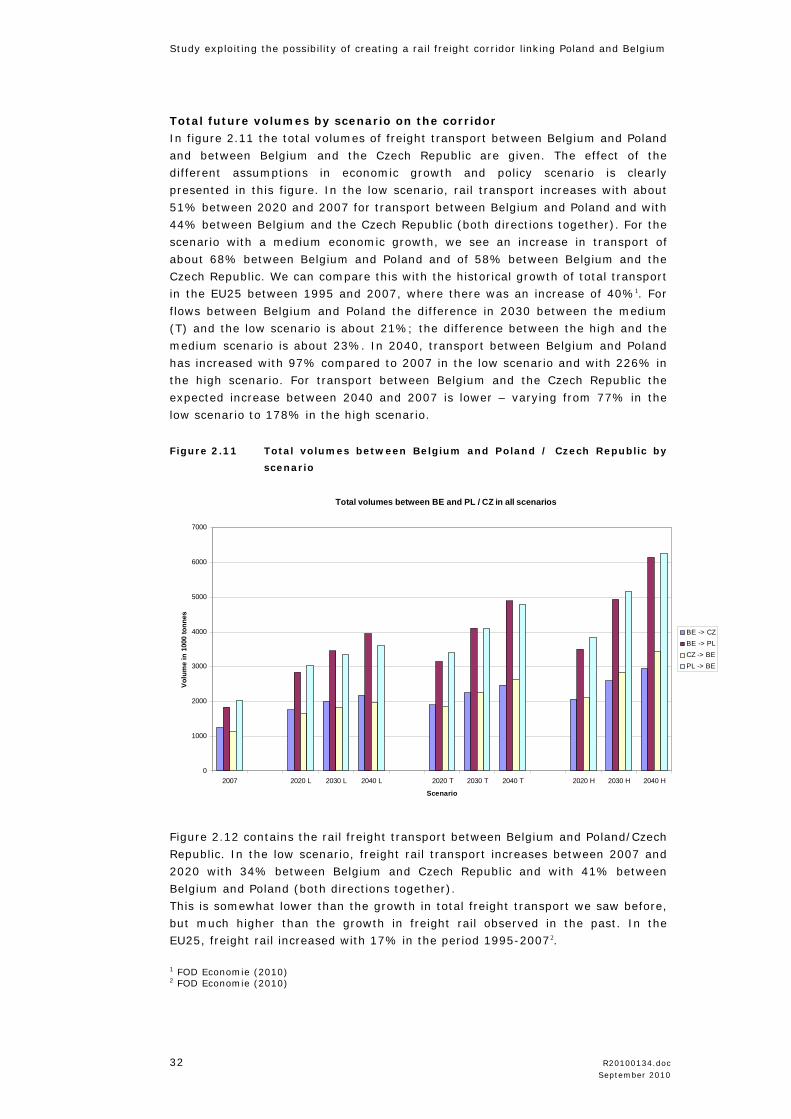
Total future volumes by scenario on the corridor
In figure 2.11 the total volumes of freight transport between Belgium and Poland
and between Belgium and the Czech Republic are given. The effect of the
different assumptions in economic growth and policy scenario is clearly
presented in this figure. In the low scenario, rail transport increases with about
51% between 2020 and 2007 for transport between Belgium and Poland and with
44% between Belgium and the Czech Republic (both directions together). For the
scenario with a medium economic growth, we see an increase in transport of
about 68% between Belgium and Poland and of 58% between Belgium and the
Czech Republic. We can compare this with the historical growth of total transport
in the EU25 between 1995 and 2007, where there was an increase of 40%1. For
flows between Belgium and Poland the difference in 2030 between the medium
(T) and the low scenario is about 21%; the difference between the high and the
medium scenario is about 23%. In 2040, transport between Belgium and Poland
has increased with 97% compared to 2007 in the low scenario and with 226% in
the high scenario. For transport between Belgium and the Czech Republic the
expected increase between 2040 and 2007 is lower – varying from 77% in the
low scenario to 178% in the high scenario.
Figure 2.11 Total volumes between Belgium and Poland / Czech Republic by
scenario
Total volumes between BE and PL / CZ in all scenarios
0
1000
2000
3000
4000
5000
6000
7000
2007 2020 L 2030 L 2040 L 2020 T 2030 T 2040 T 2020 H 2030 H 2040 H
Scenario
Volu
me
in 1
000
tonn
es
BE -> CZBE -> PLCZ -> BEPL -> BE
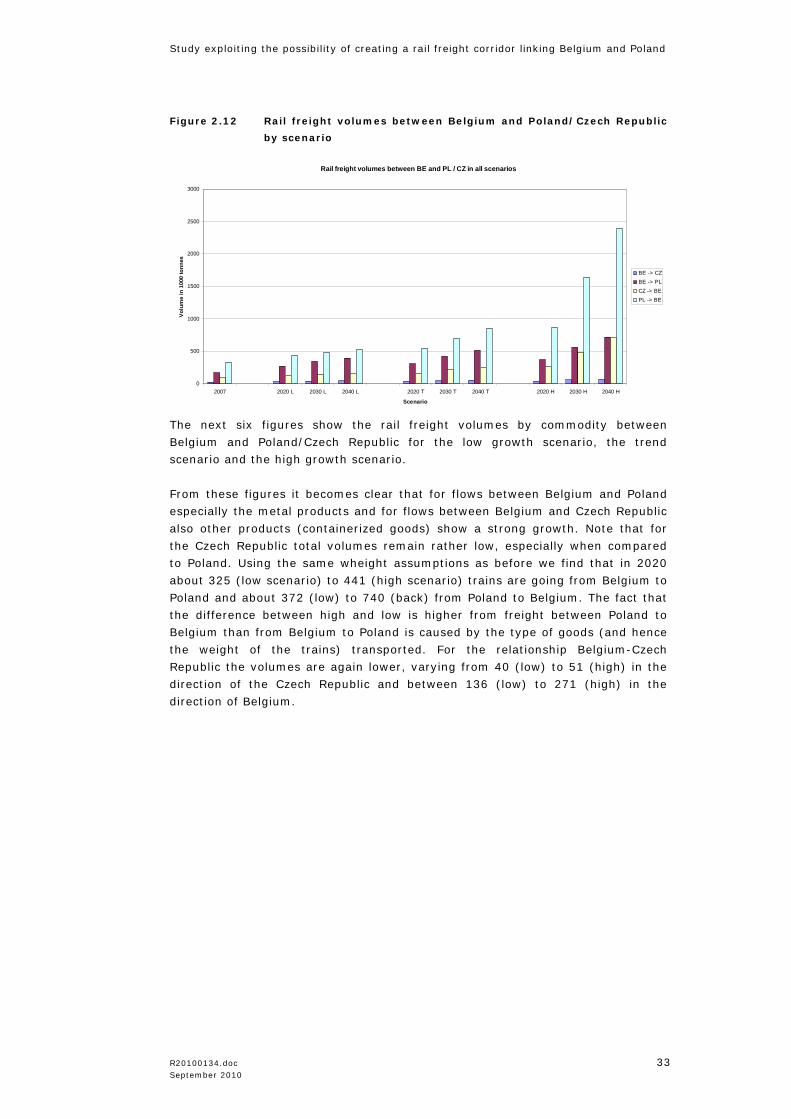
Figure 2.12 contains the rail freight transport between Belgium and Poland/Czech
Republic. In the low scenario, freight rail transport increases between 2007 and
2020 with 34% between Belgium and Czech Republic and with 41% between
Belgium and Poland (both directions together).
This is somewhat lower than the growth in total freight transport we saw before,
but much higher than the growth in freight rail observed in the past. In the
EU25, freight rail increased with 17% in the period 1995-20072.
1 FOD Economie (2010) 2 FOD Economie (2010)
Study exploiting the possibility of creating a rail freight corridor linking Belgium and Poland
R20100134.doc 33 September 2010
Figure 2.12 Rail freight volumes between Belgium and Poland/Czech Republic
by scenario
Rail freight volumes between BE and PL / CZ in all scenarios
0
500
1000
1500
2000
2500
3000
2007 2020 L 2030 L 2040 L 2020 T 2030 T 2040 T 2020 H 2030 H 2040 H
Scenario
Volu
me
in 1
000
tonn
es
BE -> CZBE -> PLCZ -> BEPL -> BE
The next six figures show the rail freight volumes by commodity between
Belgium and Poland/Czech Republic for the low growth scenario, the trend
scenario and the high growth scenario.
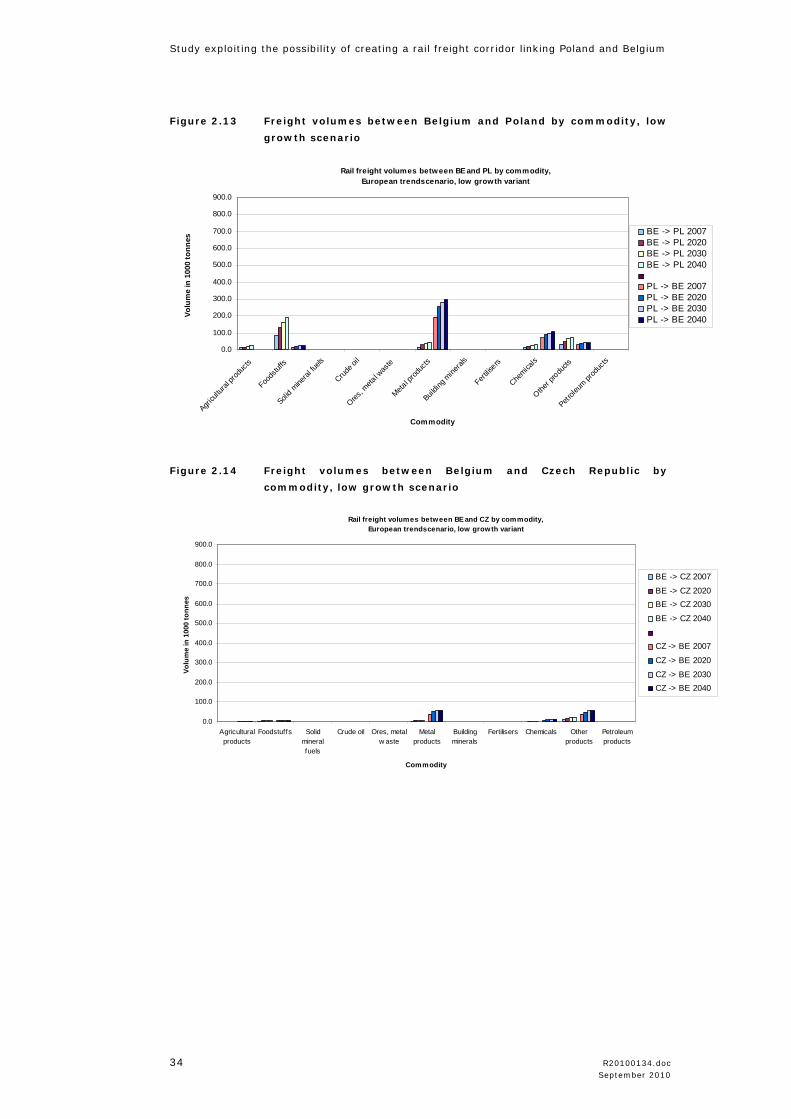
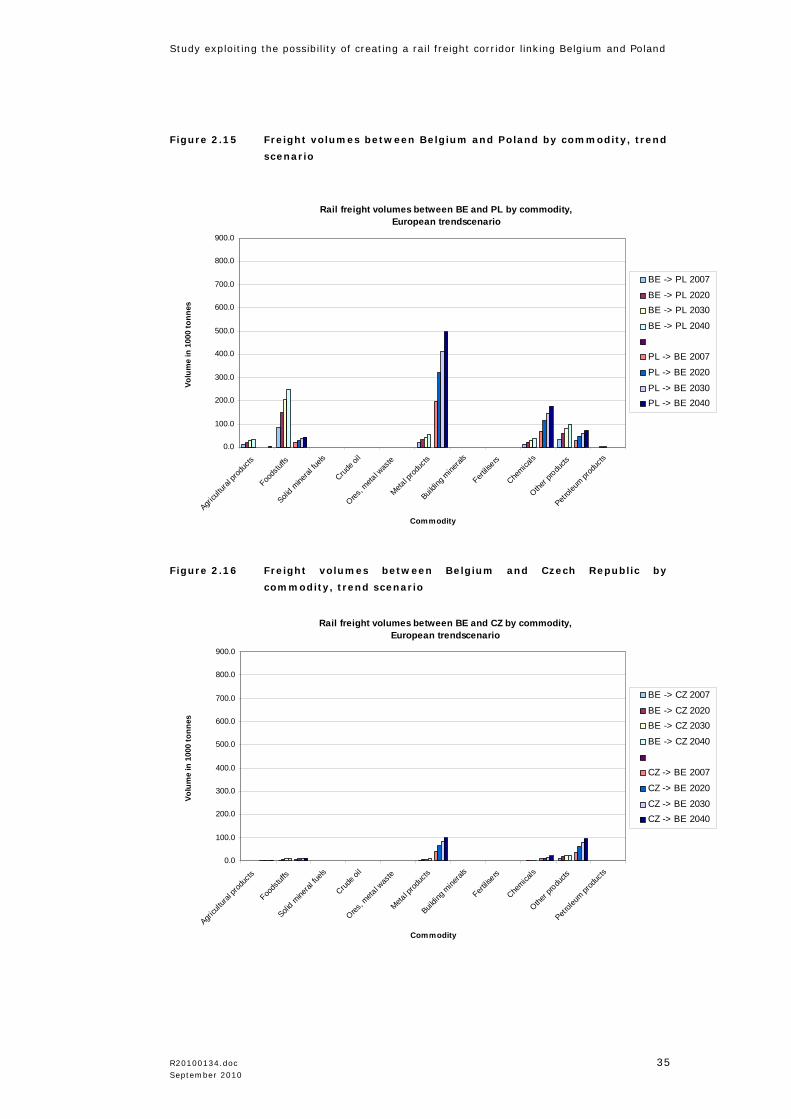
From these figures it becomes clear that for flows between Belgium and Poland
especially the metal products and for flows between Belgium and Czech Republic
also other products (containerized goods) show a strong growth. Note that for
the Czech Republic total volumes remain rather low, especially when compared
to Poland. Using the same wheight assumptions as before we find that in 2020
about 325 (low scenario) to 441 (high scenario) trains are going from Belgium to
Poland and about 372 (low) to 740 (back) from Poland to Belgium. The fact that
the difference between high and low is higher from freight between Poland to
Belgium than from Belgium to Poland is caused by the type of goods (and hence
the weight of the trains) transported. For the relationship Belgium-Czech
Republic the volumes are again lower, varying from 40 (low) to 51 (high) in the
direction of the Czech Republic and between 136 (low) to 271 (high) in the
direction of Belgium.
Study exploiting the possibility of creating a rail freight corridor linking Poland and Belgium
34 R20100134.doc September 2010
Figure 2.13 Freight volumes between Belgium and Poland by commodity, low
growth scenario
Rail freight volumes betw een BE and PL by commodity, European trendscenario, low grow th variant
0.0
100.0
200.0
300.0
400.0
500.0
600.0
700.0
800.0
900.0
Agricu
ltural
prod
ucts
Foods
tuffs
Solid m
ineral
fuels
Crude o
il
Ores, m
etal w
aste
Metal p
roduc
ts
Buildin
g mine
rals
Fertilis
ers
Chemica
ls
Other p
roducts
Petrole
um pr
oduc
ts
Commodity
Volu
me
in 1
000
tonn
es
BE -> PL 2007BE -> PL 2020BE -> PL 2030BE -> PL 2040
PL -> BE 2007PL -> BE 2020PL -> BE 2030PL -> BE 2040
Figure 2.14 Freight volumes between Belgium and Czech Republic by
commodity, low growth scenario
Rail freight volumes between BE and CZ by commodity, European trendscenario, low growth variant
0.0
100.0
200.0
300.0
400.0
500.0
600.0
700.0
800.0
900.0
Agriculturalproducts
Foodstuffs Solidmineralfuels
Crude oil Ores, metalw aste
Metalproducts
Buildingminerals
Fertilisers Chemicals Otherproducts
Petroleumproducts
Commodity
Volu
me
in 1
000
tonn
es
BE -> CZ 2007
BE -> CZ 2020BE -> CZ 2030
BE -> CZ 2040
CZ -> BE 2007
CZ -> BE 2020
CZ -> BE 2030CZ -> BE 2040
Study exploiting the possibility of creating a rail freight corridor linking Belgium and Poland
R20100134.doc 35 September 2010
Figure 2.15 Freight volumes between Belgium and Poland by commodity, trend
scenario
Rail freight volumes between BE and PL by commodity, European trendscenario
0.0
100.0
200.0
300.0
400.0
500.0
600.0
700.0
800.0
900.0
Agricu
ltural
prod
ucts
Foods
tuffs
Solid m
ineral
fuels
Crude o
il
Ores, m
etal w
aste
Metal p
roduc
ts
Buildin
g mine
rals
Fertilis
ers
Chemica
ls
Other p
roducts
Petrole
um pr
oduc
ts
Commodity
Volu
me
in 1
000
tonn
es
BE -> PL 2007
BE -> PL 2020BE -> PL 2030
BE -> PL 2040
PL -> BE 2007
PL -> BE 2020
PL -> BE 2030PL -> BE 2040
Figure 2.16 Freight volumes between Belgium and Czech Republic by
commodity, trend scenario
Rail freight volumes between BE and CZ by commodity, European trendscenario
0.0
100.0
200.0
300.0
400.0
500.0
600.0
700.0
800.0
900.0
Agricu
ltural
prod
ucts
Foods
tuffs
Solid m
ineral
fuels
Crude o
il
Ores, m
etal w
aste
Metal p
roduc
ts
Buildin
g mine
rals
Fertilis
ers
Chemica
ls
Other p
roducts
Petrole
um pr
oduc
ts
Commodity
Volu
me
in 1
000
tonn
es
BE -> CZ 2007
BE -> CZ 2020BE -> CZ 2030
BE -> CZ 2040
CZ -> BE 2007
CZ -> BE 2020
CZ -> BE 2030CZ -> BE 2040
Study exploiting the possibility of creating a rail freight corridor linking Poland and Belgium
36 R20100134.doc September 2010
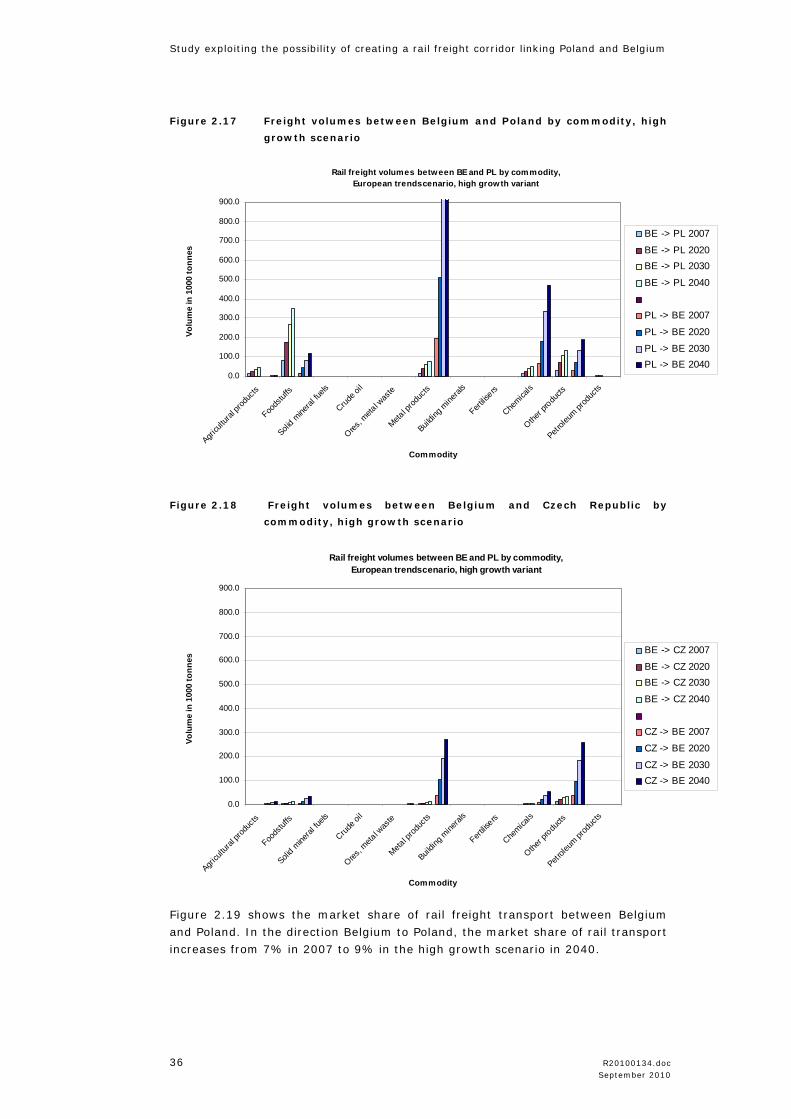
Figure 2.17 Freight volumes between Belgium and Poland by commodity, high
growth scenario
Rail freight volumes between BE and PL by commodity, European trendscenario, high growth variant
0.0
100.0
200.0
300.0
400.0
500.0
600.0
700.0
800.0
900.0
Agricu
ltural
prod
ucts
Foods
tuffs
Solid m
ineral
fuels
Crude o
il
Ores, m
etal w
aste
Metal p
roduc
ts
Buildin
g mine
rals
Fertilis
ers
Chemica
ls
Other p
roducts
Petrole
um pr
oduc
ts
Commodity
Volu
me
in 1
000
tonn
es
BE -> PL 2007
BE -> PL 2020BE -> PL 2030
BE -> PL 2040
PL -> BE 2007
PL -> BE 2020
PL -> BE 2030PL -> BE 2040
Figure 2.18 Freight volumes between Belgium and Czech Republic by
commodity, high growth scenario
Rail freight volumes between BE and PL by commodity, European trendscenario, high growth variant
0.0
100.0
200.0
300.0
400.0
500.0
600.0
700.0
800.0
900.0
Agricu
ltural
prod
ucts
Foods
tuffs
Solid m
ineral
fuels
Crude o
il
Ores, m
etal w
aste
Metal p
roduc
ts
Buildin
g mine
rals
Fertilis
ers
Chemica
ls
Other p
roducts
Petrole
um pr
oduc
ts
Commodity
Volu
me
in 1
000
tonn
es
BE -> CZ 2007
BE -> CZ 2020BE -> CZ 2030
BE -> CZ 2040
CZ -> BE 2007
CZ -> BE 2020
CZ -> BE 2030CZ -> BE 2040
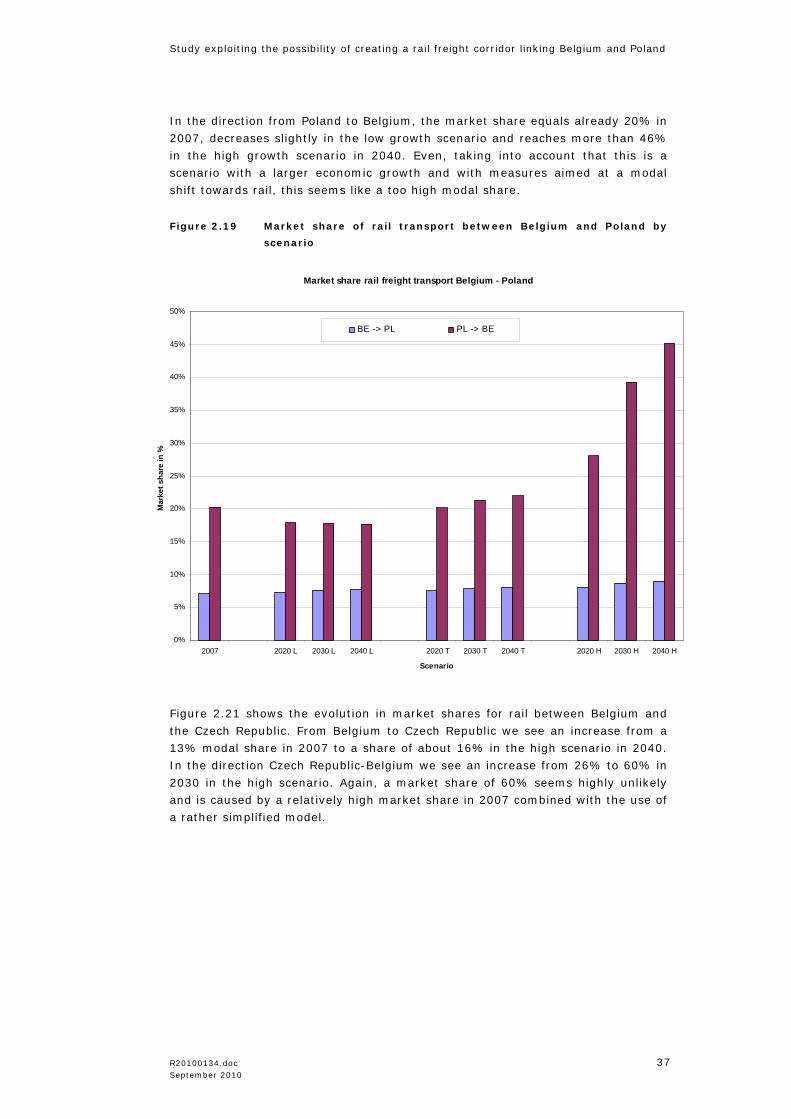
Figure 2.19 shows the market share of rail freight transport between Belgium
and Poland. In the direction Belgium to Poland, the market share of rail transport
increases from 7% in 2007 to 9% in the high growth scenario in 2040.
Study exploiting the possibility of creating a rail freight corridor linking Belgium and Poland
R20100134.doc 37 September 2010
In the direction from Poland to Belgium, the market share equals already 20% in
2007, decreases slightly in the low growth scenario and reaches more than 46%
in the high growth scenario in 2040. Even, taking into account that this is a
scenario with a larger economic growth and with measures aimed at a modal
shift towards rail, this seems like a too high modal share.
Figure 2.19 Market share of rail transport between Belgium and Poland by
scenario
Figure 2.21 shows the evolution in market shares for rail between Belgium and
the Czech Republic. From Belgium to Czech Republic we see an increase from a
13% modal share in 2007 to a share of about 16% in the high scenario in 2040.
In the direction Czech Republic-Belgium we see an increase from 26% to 60% in
2030 in the high scenario. Again, a market share of 60% seems highly unlikely
and is caused by a relatively high market share in 2007 combined with the use of
a rather simplified model.
Market share rail freight transport Belgium - Poland
0%
5%
10%
15%
20%
25%
30%
35%
40%
45%
50%
2007 2020 L 2030 L 2040 L 2020 T 2030 T 2040 T 2020 H 2030 H 2040 H
Scenario
Mar
ket s
hare
in %
BE -> PL PL -> BE

Study exploiting the possibility of creating a rail freight corridor linking Poland and Belgium
38 R20100134.doc September 2010
Figure 2.20 Markets hare of rail transport between Belgium and Czech
Republic by scenario
Market share rail freight transport Belgium - Czech Republic
0%
10%
20%
30%
40%
50%
60%
70%
2007 2020 L 2030 L 2040 L 2020 T 2030 T 2040 T 2020 H 2030 H 2040 H
Scenario
Mar
ket s
hare
in %
BE -> CZ CZ -> BE
Study exploiting the possibility of creating a rail freight corridor linking Belgium and Poland
R20100134.doc 39 September 2010
2.1.3 Conclusions
Overall, it can be concluded that the rail freight volumes in the corridor Belgium
– Poland/Czech Republic are rather limited. Especially compared to other
volumes on the corridor such as between Belgium and Germany or between
Poland and Germany.
In the direction from Belgium to Poland/Czech Republic, the rail freight volume is
169.000 tons or about 223 trains in 2007 towards Poland and 23.000 tons or
about 31 trains towards the Czech Republic. For future years, the volumes
towards Poland ranges between 271.000 tons in the low growth scenario for
2020 (index 1.6) to more than 422,000 tons (index 2.5) in the middle scenario in
2030 to 558.000 tons in the high growth scenario for the year 2030 (index 3.3)
and 718.000 tons (index 4.2) in 2040.
Towards the Czech Republic, volumes vary between 33.000 (index 1.4) in the
low scenario for 2020 and 46,000 (index 1.9) in the middle scenario in 2030 and
57.000 (index 2.4) in 2030 and 69.000 (index 3) in 2040 in the high scenario.
In the other direction from Poland/ Czech Republic to Belgium, the rail freight
volume is 332.000 tons or about 305 trains from Poland and about 100.000 tons
or 112 trains from the Czech Republic in 2007. For future years, the volume from
Poland ranges between 436.000 tons in the low growth scenario for 2020 (index
1.3) to 700,000 tons (index 2.1) in the middle scenario for 2030 to more than
1.629.000 tons in the high growth scenario for the year 2030 (index 4.9) and
2.391.000 tons in 2040 (index 7.2). Volumes from the Czech Republic vary
between 131.000 tons (index 1.3) in the low scenario for 2020, 211,000 tons
(index 2.1) in the middle scenario in 2030 and 490.000 tons in 2030 (index 4.9)
and 720.000 tons in 2040 (index 7.2) in the high scenario.
In the other direction from Poland/ Czech Republic to Belgium, the rail freight
volume is 332.000 tons or 305 trains from Poland and about 100.000 tons or 112
trains from the Czech Republic in 2007. For future years, the volume from Poland
ranges between 436.000 tons in the low growth scenario for 2020 (index 1.3) to
more than 1.629.000 tons in the high growth scenario for the year 2030 (index
4.9). Volumes from the Czech Republic vary between 131.000 tons (index 1.3) in
the low scenario for 2020 and 490.000 tons in the high scenario in 2030 (index
4.9).
Although the rail freight volumes have a strong growth resulting from macro-
economic developments and global developments in the transport market, the
market share of rail increases up to 2040 at most with a couple of percentage
point for the low and the trend scenario. Only in the high scenario with a high
economic growth and measures towards internalization we see rather high
market shares. However, given the set up of the exercise these percentages
should be treated with the utmost care. Note that for example over the scenarios
analysed by Federaal Planbureau, the highest modal share for rail was 17% on
average for Belgium as a whole.
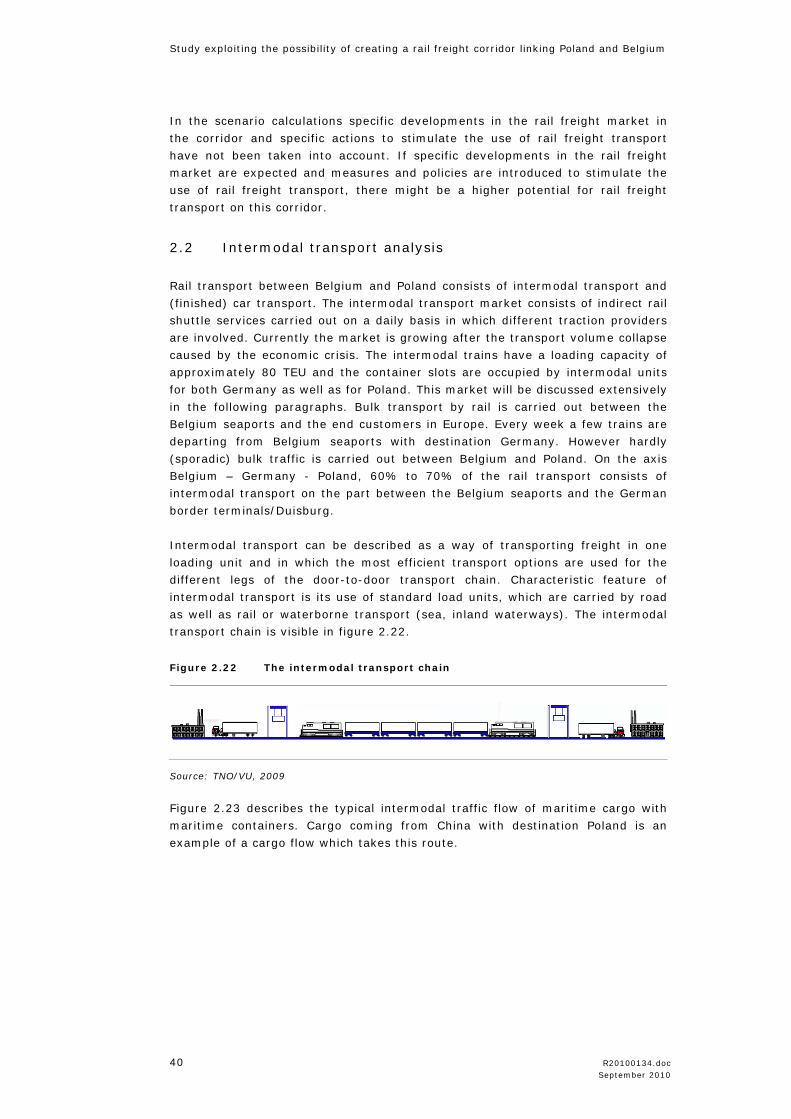
Study exploiting the possibility of creating a rail freight corridor linking Poland and Belgium
40 R20100134.doc September 2010
In the scenario calculations specific developments in the rail freight market in
the corridor and specific actions to stimulate the use of rail freight transport
have not been taken into account. If specific developments in the rail freight
market are expected and measures and policies are introduced to stimulate the
use of rail freight transport, there might be a higher potential for rail freight
transport on this corridor.
2.2 Intermodal transport analysis
Rail transport between Belgium and Poland consists of intermodal transport and
(finished) car transport. The intermodal transport market consists of indirect rail
shuttle services carried out on a daily basis in which different traction providers
are involved. Currently the market is growing after the transport volume collapse
caused by the economic crisis. The intermodal trains have a loading capacity of
approximately 80 TEU and the container slots are occupied by intermodal units
for both Germany as well as for Poland. This market will be discussed extensively
in the following paragraphs. Bulk transport by rail is carried out between the
Belgium seaports and the end customers in Europe. Every week a few trains are
departing from Belgium seaports with destination Germany. However hardly
(sporadic) bulk traffic is carried out between Belgium and Poland. On the axis
Belgium – Germany - Poland, 60% to 70% of the rail transport consists of
intermodal transport on the part between the Belgium seaports and the German
border terminals/Duisburg.
Intermodal transport can be described as a way of transporting freight in one
loading unit and in which the most efficient transport options are used for the
different legs of the door-to-door transport chain. Characteristic feature of
intermodal transport is its use of standard load units, which are carried by road
as well as rail or waterborne transport (sea, inland waterways). The intermodal
transport chain is visible in figure 2.22.
Figure 2.22 The intermodal transport chain
Source: TNO/VU, 2009
Figure 2.23 describes the typical intermodal traffic flow of maritime cargo with
maritime containers. Cargo coming from China with destination Poland is an
example of a cargo flow which takes this route.
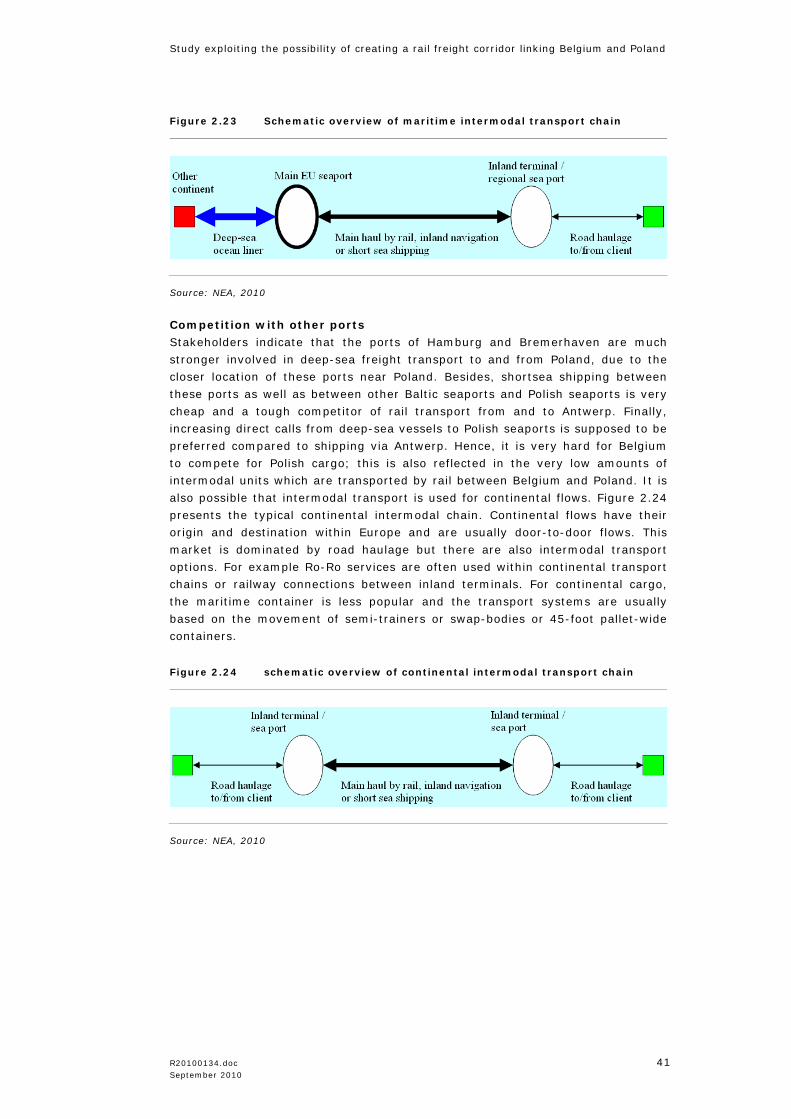
Study exploiting the possibility of creating a rail freight corridor linking Belgium and Poland
R20100134.doc 41 September 2010
Figure 2.23 Schematic overview of maritime intermodal transport chain
Source: NEA, 2010
Competition with other ports
Stakeholders indicate that the ports of Hamburg and Bremerhaven are much
stronger involved in deep-sea freight transport to and from Poland, due to the
closer location of these ports near Poland. Besides, shortsea shipping between
these ports as well as between other Baltic seaports and Polish seaports is very
cheap and a tough competitor of rail transport from and to Antwerp. Finally,
increasing direct calls from deep-sea vessels to Polish seaports is supposed to be
preferred compared to shipping via Antwerp. Hence, it is very hard for Belgium
to compete for Polish cargo; this is also reflected in the very low amounts of
intermodal units which are transported by rail between Belgium and Poland. It is
also possible that intermodal transport is used for continental flows. Figure 2.24
presents the typical continental intermodal chain. Continental flows have their
origin and destination within Europe and are usually door-to-door flows. This
market is dominated by road haulage but there are also intermodal transport
options. For example Ro-Ro services are often used within continental transport
chains or railway connections between inland terminals. For continental cargo,
the maritime container is less popular and the transport systems are usually
based on the movement of semi-trainers or swap-bodies or 45-foot pallet-wide
containers.
Figure 2.24 schematic overview of continental intermodal transport chain
Source: NEA, 2010
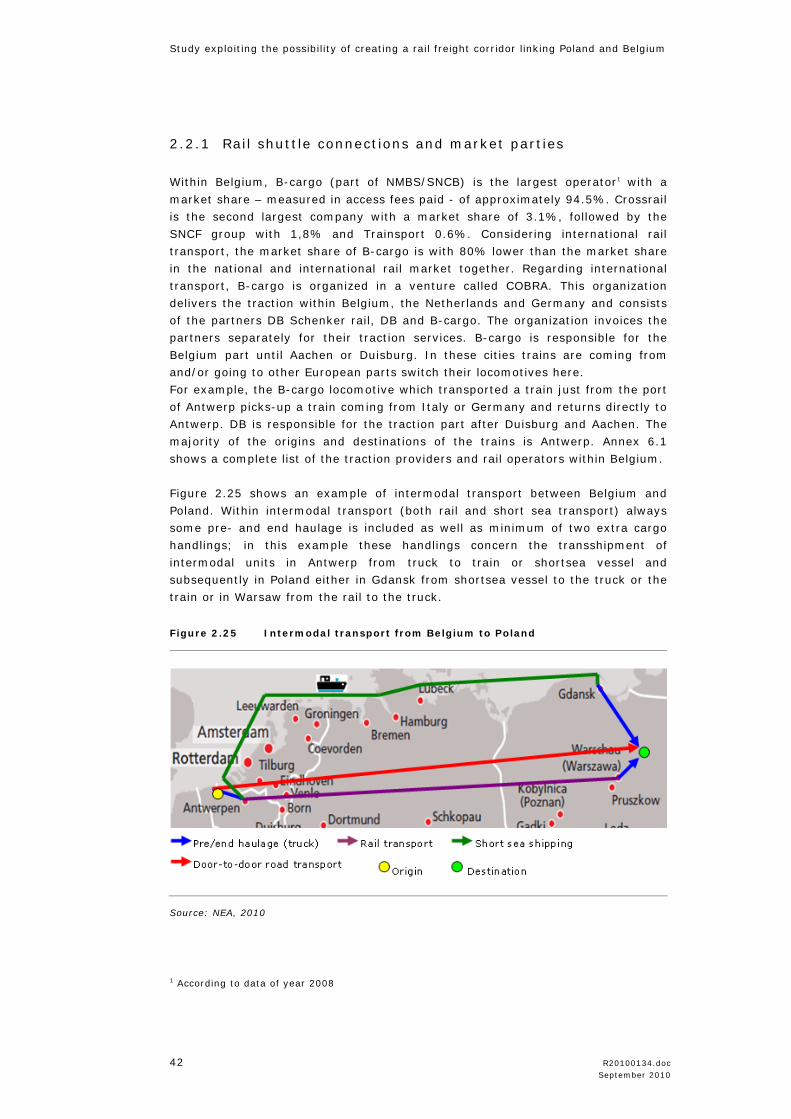
Study exploiting the possibility of creating a rail freight corridor linking Poland and Belgium
42 R20100134.doc September 2010
2.2.1 Rail shuttle connections and market parties
Within Belgium, B-cargo (part of NMBS/SNCB) is the largest operator1 with a
market share – measured in access fees paid - of approximately 94.5%. Crossrail
is the second largest company with a market share of 3.1%, followed by the
SNCF group with 1,8% and Trainsport 0.6%. Considering international rail
transport, the market share of B-cargo is with 80% lower than the market share
in the national and international rail market together. Regarding international
transport, B-cargo is organized in a venture called COBRA. This organization
delivers the traction within Belgium, the Netherlands and Germany and consists
of the partners DB Schenker rail, DB and B-cargo. The organization invoices the
partners separately for their traction services. B-cargo is responsible for the
Belgium part until Aachen or Duisburg. In these cities trains are coming from
and/or going to other European parts switch their locomotives here.
For example, the B-cargo locomotive which transported a train just from the port
of Antwerp picks-up a train coming from Italy or Germany and returns directly to
Antwerp. DB is responsible for the traction part after Duisburg and Aachen. The
majority of the origins and destinations of the trains is Antwerp. Annex 6.1
shows a complete list of the traction providers and rail operators within Belgium.
Figure 2.25 shows an example of intermodal transport between Belgium and
Poland. Within intermodal transport (both rail and short sea transport) always
some pre- and end haulage is included as well as minimum of two extra cargo
handlings; in this example these handlings concern the transshipment of
intermodal units in Antwerp from truck to train or shortsea vessel and
subsequently in Poland either in Gdansk from shortsea vessel to the truck or the
train or in Warsaw from the rail to the truck.
Figure 2.25 Intermodal transport from Belgium to Poland
Source: NEA, 2010
1 According to data of year 2008
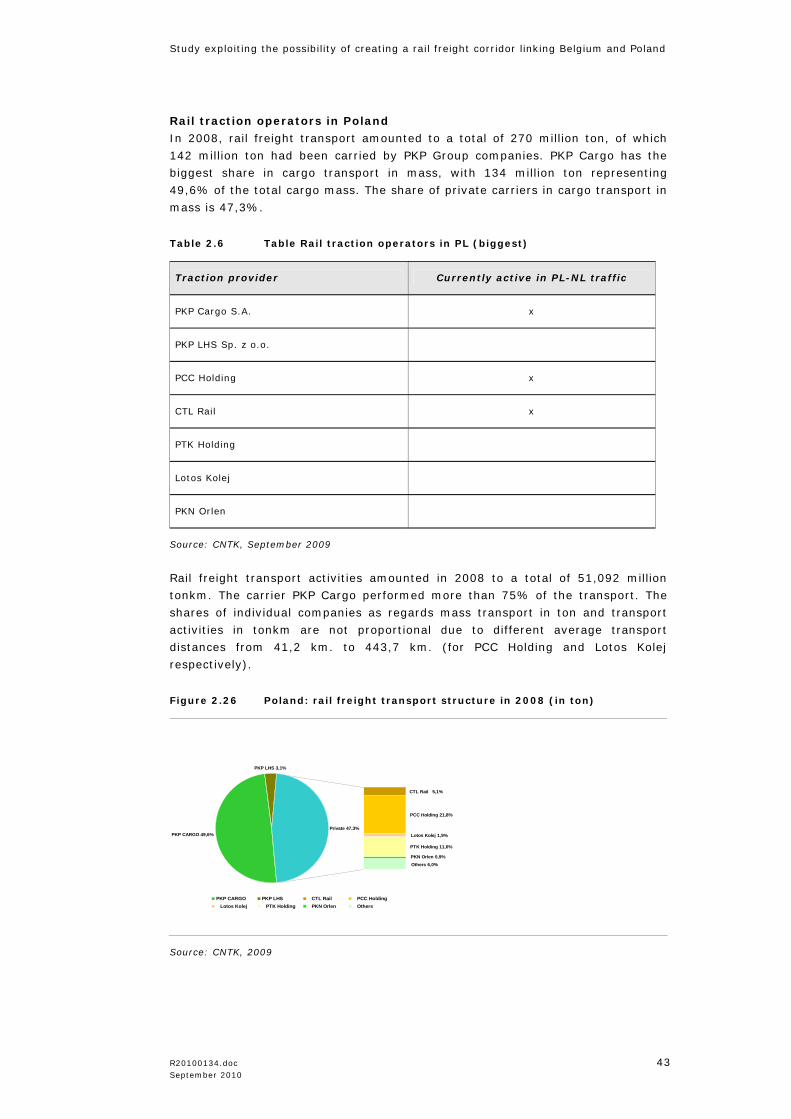
Study exploiting the possibility of creating a rail freight corridor linking Belgium and Poland
R20100134.doc 43 September 2010
Rail traction operators in Poland
In 2008, rail freight transport amounted to a total of 270 million ton, of which
142 million ton had been carried by PKP Group companies. PKP Cargo has the
biggest share in cargo transport in mass, with 134 million ton representing
49,6% of the total cargo mass. The share of private carriers in cargo transport in
mass is 47,3%.
Table 2.6 Table Rail traction operators in PL (biggest)
Traction provider Currently active in PL-NL traffic
PKP Cargo S.A. x
PKP LHS Sp. z o.o.
PCC Holding x
CTL Rail x
PTK Holding
Lotos Kolej
PKN Orlen
Source: CNTK, September 2009
Rail freight transport activities amounted in 2008 to a total of 51,092 million
tonkm. The carrier PKP Cargo performed more than 75% of the transport. The
shares of individual companies as regards mass transport in ton and transport
activities in tonkm are not proportional due to different average transport
distances from 41,2 km. to 443,7 km. (for PCC Holding and Lotos Kolej
respectively).
Figure 2.26 Poland: rail freight transport structure in 2008 (in ton)
PKP CARGO 49,6%
PKP LHS 3,1%
Private 47,3%
Others 6,0%
PTK Holding 11,6%
Lotos Kolej 1,9%
PCC Holding 21,8%
CTL Rail 5,1%
PKN Orlen 0,9%
PKP CARGO PKP LHS CTL Rail PCC Holding Lotos Kolej PTK Holding PKN Orlen Others
Source: CNTK, 2009
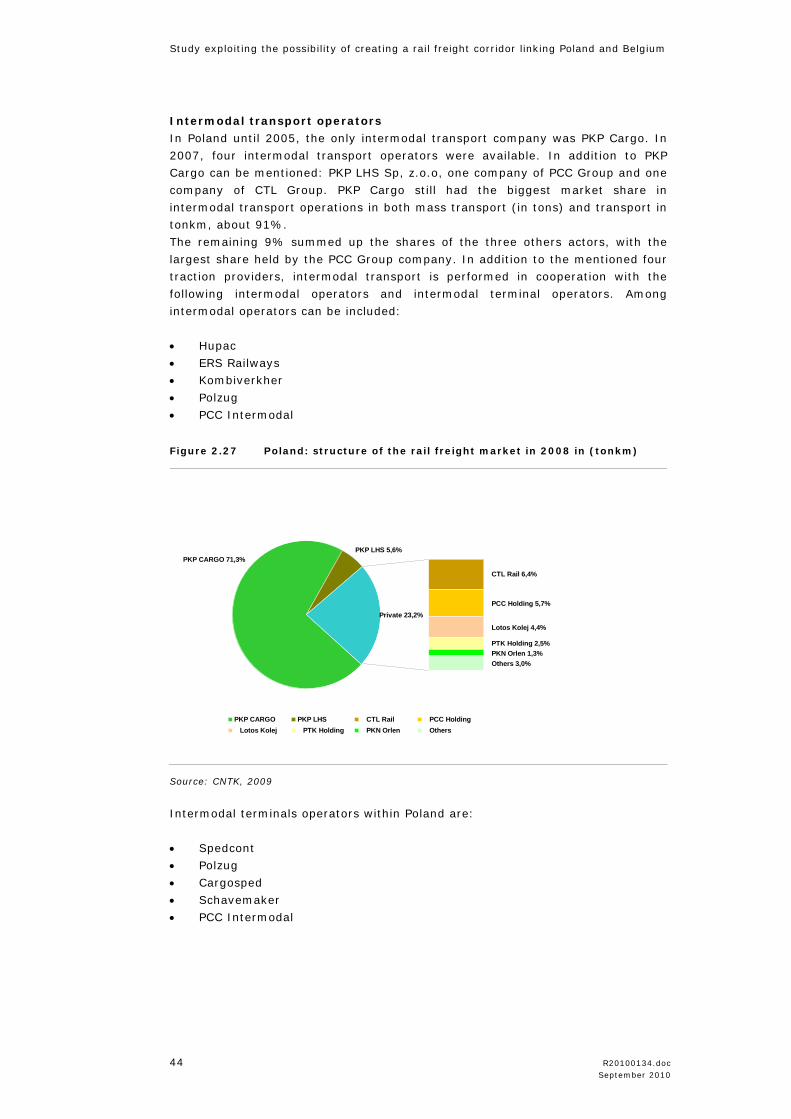
Study exploiting the possibility of creating a rail freight corridor linking Poland and Belgium
44 R20100134.doc September 2010
Intermodal transport operators
In Poland until 2005, the only intermodal transport company was PKP Cargo. In
2007, four intermodal transport operators were available. In addition to PKP
Cargo can be mentioned: PKP LHS Sp, z.o.o, one company of PCC Group and one
company of CTL Group. PKP Cargo still had the biggest market share in
intermodal transport operations in both mass transport (in tons) and transport in
tonkm, about 91%.
The remaining 9% summed up the shares of the three others actors, with the
largest share held by the PCC Group company. In addition to the mentioned four
traction providers, intermodal transport is performed in cooperation with the
following intermodal operators and intermodal terminal operators. Among
intermodal operators can be included:
• Hupac
• ERS Railways
• Kombiverkher
• Polzug
• PCC Intermodal
Figure 2.27 Poland: structure of the rail freight market in 2008 in (tonkm)
PKP LHS 5,6%
Others 3,0%PKN Orlen 1,3%PTK Holding 2,5%
Lotos Kolej 4,4%
PCC Holding 5,7%Private 23,2%
PKP CARGO 71,3%
CTL Rail 6,4%
PKP CARGO PKP LHS CTL Rail PCC Holding Lotos Kolej PTK Holding PKN Orlen Others
Source: CNTK, 2009
Intermodal terminals operators within Poland are:
• Spedcont
• Polzug
• Cargosped
• Schavemaker
• PCC Intermodal
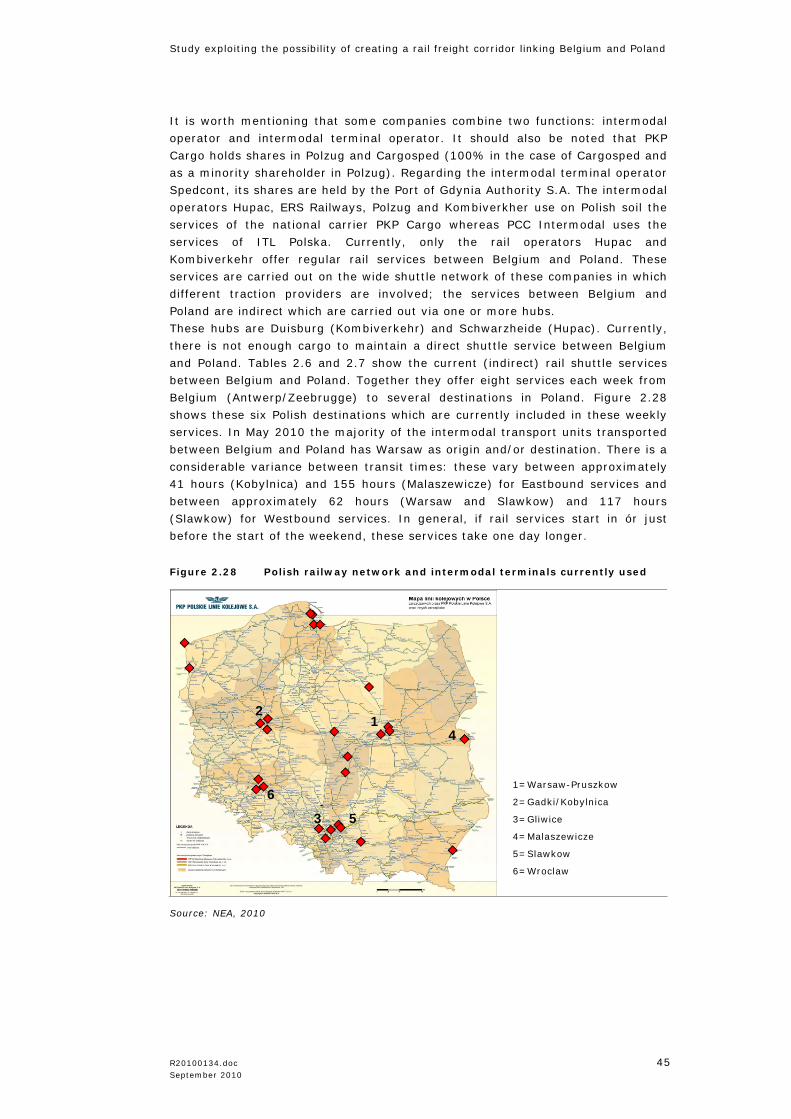
Study exploiting the possibility of creating a rail freight corridor linking Belgium and Poland
R20100134.doc 45 September 2010
It is worth mentioning that some companies combine two functions: intermodal
operator and intermodal terminal operator. It should also be noted that PKP
Cargo holds shares in Polzug and Cargosped (100% in the case of Cargosped and
as a minority shareholder in Polzug). Regarding the intermodal terminal operator
Spedcont, its shares are held by the Port of Gdynia Authority S.A. The intermodal
operators Hupac, ERS Railways, Polzug and Kombiverkher use on Polish soil the
services of the national carrier PKP Cargo whereas PCC Intermodal uses the
services of ITL Polska. Currently, only the rail operators Hupac and
Kombiverkehr offer regular rail services between Belgium and Poland. These
services are carried out on the wide shuttle network of these companies in which
different traction providers are involved; the services between Belgium and
Poland are indirect which are carried out via one or more hubs.
These hubs are Duisburg (Kombiverkehr) and Schwarzheide (Hupac). Currently,
there is not enough cargo to maintain a direct shuttle service between Belgium
and Poland. Tables 2.6 and 2.7 show the current (indirect) rail shuttle services
between Belgium and Poland. Together they offer eight services each week from
Belgium (Antwerp/Zeebrugge) to several destinations in Poland. Figure 2.28
shows these six Polish destinations which are currently included in these weekly
services. In May 2010 the majority of the intermodal transport units transported
between Belgium and Poland has Warsaw as origin and/or destination. There is a
considerable variance between transit times: these vary between approximately
41 hours (Kobylnica) and 155 hours (Malaszewicze) for Eastbound services and
between approximately 62 hours (Warsaw and Slawkow) and 117 hours
(Slawkow) for Westbound services. In general, if rail services start in ór just
before the start of the weekend, these services take one day longer.
Figure 2.28 Polish railway network and intermodal terminals currently used
Source: NEA, 2010
1
1=Warsaw-Pruszkow
2=Gadki/Kobylnica
3=Gliwice
4=Malaszewicze
5=Slawkow
6=Wroclaw
2
3
4
5
6
Study exploiting the possibility of creating a rail freight corridor linking Poland and Belgium
46 R20100134.doc September 2010
Table 2.7 Rail shuttle connections Belgium to Poland
Rail
operator Traction
Weekly
Frequency Terminal BE Terminal PL
Transit time (closing time-
cargo ready for pick-up)
Hupac Crossrail (BE)
Crossrail (DE)
PKP Cargo (PL)
5 x
1. Antwerp
Hupac
Terminal
1. Kobylnica
2. Slawkow
3. Warsaw Praga
41 hours (63.5 hours depart on
Friday)
62 hours (86 hours depart on
Thursday)
48 hours (64 hours depart on
Friday)
Kombi-
verkehr
DB Schenker
3 x
(indirect)
3 x
(indirect)
3 x
(indirect)
1. Zeebrugge
2. Antwerp
Main hub
3. Antwerp
Combinant
terminal
1. Gadki
2. Gliwice
3. Slawkow
4. Warsaw-
Pruszkow
5. Wroclaw
6. Malaszewicze
1. Gadki
2. Gliwice
3. Slawkow
4. Warsaw-
Pruszkow
5. Wroclaw
6. Malaszewicze
1. Gadki
2. Gliwice
3. Slawkow
4. Warsaw-
Pruszkow
5. Wroclaw
6. Malaszewicze
75h. (99 h. depart on Thursday
and 123 h. depart on Friday)
73h. (97 h. depart on Thursday
and 121 h. depart on Friday)
75h. (99 h. depart on Thursday
and 123 h. depart on Friday)
73h. (99 h. depart on Thursday
and 121 h. depart on Friday)
75h. (97 h. depart on Thursday
and 123 h. depart on Friday)
107h. (155 h. depart on Friday)
71h. (95 h. depart on Thursday
and 119 h. depart on Friday)
69h. (93 h. depart on Thursday
and 117 h. depart on Friday)
71h. (95 h. depart on Thursday
and 118 h. depart on Friday)
69h. (95 h. depart on Thursday
and 117 h. depart on Friday)
71h. (93 h. depart on Thursday
and 119 h. depart on Friday)
103h. (151 h. depart on Friday)
61h. (86 h. depart on Thursday
and 109 h. depart on Friday)
59h. (83 h. depart on Thursday
and 107 h. depart on Friday)
60h. (85 h. depart on Thursday
and 108 h. depart on Friday)
59h. (85 h. depart on Thursday
and 107 h. depart on Friday)
61h. (83 h. depart on Thursday
and 109 h. depart on Friday)
93h. (141 h. depart on Friday)
Source: NEA, May 2010

Study exploiting the possibility of creating a rail freight corridor linking Belgium and Poland
R20100134.doc 47 September 2010
Table 2.8 Rail shuttle connections Poland to Belgium
Rail
operator Traction
Weekly
Frequency Terminal BE Terminal PL
Transit time (closing time-
cargo ready for pick-up)
Hupac Crossrail (BE)
Crossrail (DE)
PKP Cargo (PL)
5 x
1. Kobylnica
2. Slawkow
3. Warsaw
Praga
1. Antwerp
Hupac Terminal
68 hours (116 hours depart on
Wednesday, 92 hours depart on
Thursday/Friday)
69 hours (93 hours depart on
Thursday, 117 hours depart on
Wednesday)
68 hours (92 hours depart on
Thursday/Friday, 116 hours
depart on Wednesday)
Kombi-
verkehr
DB Schenker
2 x
(indirect)
2 x
(indirect)
2 x
(indirect)
1. Zeebrugge
2. Antwerp
Main hub
3. Antwerp
Combinant
terminal
1. Gadki
2. Gliwice
3. Slawkow
4. Warsaw-
Pruszkow
5. Wroclaw
6. Malaszewicze
1. Gadki
2. Gliwice
3. Slawkow
4. Warsaw-
Pruszkow
5. Wroclaw
6. Malaszewicze
1. Gadki
2. Gliwice
3. Slawkow
4. Warsaw-
Pruszkow
5. Wroclaw
6. Malaszewicze
77h. (101 h. depart on Friday)
74h. (98 h. depart on Friday)
74h. (98 h. depart on Friday)
75h. (99 h. depart on Friday)
77h. (101 h. depart on Friday)
84h. (108 h. depart on Friday)
72h. (96 h. depart on Friday)
69h. (93 h. depart on Friday)
69h. (93 h. depart on Friday)
70h. (94 h. depart on Friday)
72h. (96 h. depart on Friday)
79h. (103 h. depart on Friday)
65h. (89 h. depart on Friday)
62h. (86 h. depart on Friday)
62h. (86 h. depart on Friday)
63h. (87 h. depart on Friday)
65h. (89 h. depart on Friday)
72h. (96 h. depart on Friday)
Source: NEA, May 2010
Short-sea shipping
The feeder connections between Poland and the Polish ports are operated by
different shipping lines as follows:
• Gdansk Port
- Unifeeder – once a week,
• Gdynia Port
- Unifeeder – once a week,
- Transfennica – once a week.
Study exploiting the possibility of creating a rail freight corridor linking Poland and Belgium
48 R20100134.doc September 2010
Transit time between Polish harbours (Gdansk and Gdynia) and the port of
Antwerp is about 120 to 150 hours. These connections are indirect. Ships to and
from Poland also visit other ports such as Hamburg, Bremerhaven.
Some lines provide service to both Gdansk and Gdynia. Connections with Gdynia
and Gdansk are affected by vessels operating in rotation. These rotating feeder
connections are responsible for the long transit time between Poland and
Antwerp. Feeders operating between Antwerp and the Polish seaports have a
capacity of about 800 to 1,000 TEU.
2.2.2 Rail transport compared to other transport modes
Analyzing rail transport in the scope of transport solutions within logistics
concepts, several important criteria can be distinguished:
1) Transit times
2) Transport costs
3) Reliability
4) Flexibility
5) Other criteria
Depending on the importance each shipper or customer add to the different
criteria of transport in question, he or she will select the transport service which
fits these requirements at best. Practically, this means that sometimes rail
transport is the best transport solution, sometimes road transport and
sometimes short sea transport. If, for example, for importers or exporters the
speed of being present on the market – this is for example true for consumer
electronics – is very important, in general road transport will be used, because
this kind of transport has overall the lowest transit times. Every day not being
present on the market with new fashion or trends means (big) losses for the
manufacturer or wholesaler of these products. On the other hand, if it is
important to ship products as cheap as possible – this can for example be true
for low value commodities – rail or short sea transport will be the best option.
After all it can be concluded that rail transport must fit in the logistic concept
within supply chains in order to choose rail transport between Belgium and
Poland. Among and within different commodity categories, substantial variance
exist regarding the importance of these different criteria.
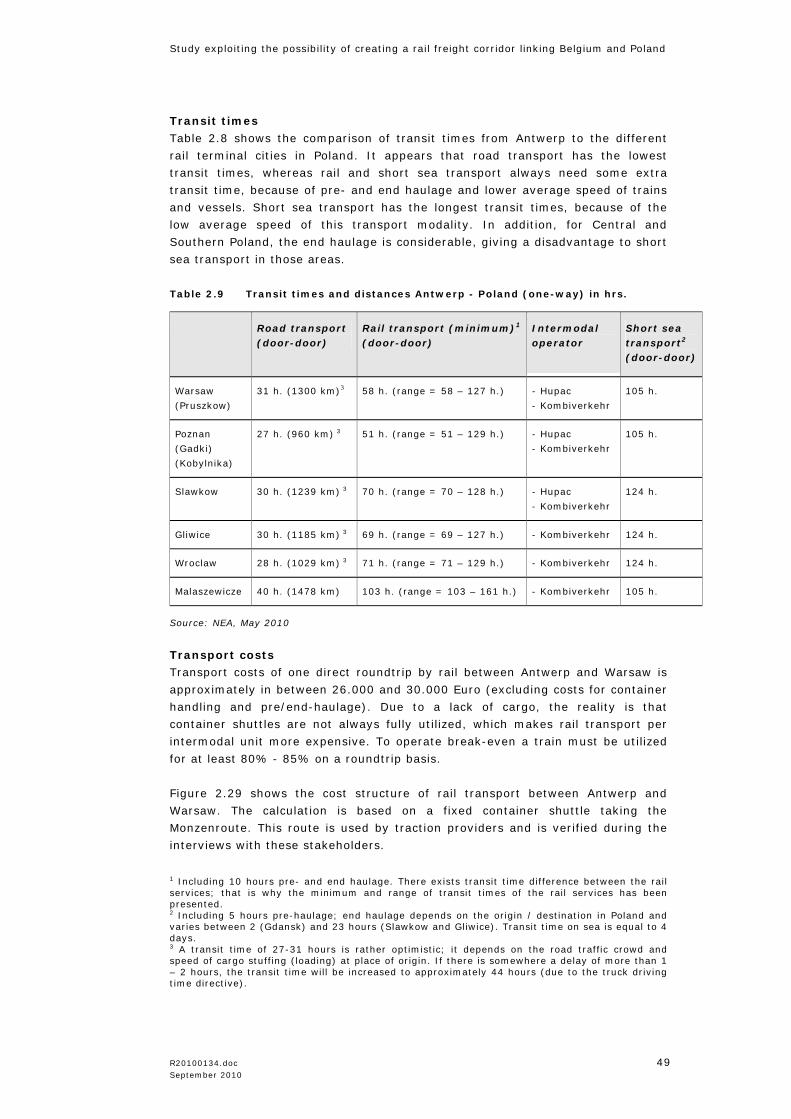
Study exploiting the possibility of creating a rail freight corridor linking Belgium and Poland
R20100134.doc 49 September 2010
Transit times
Table 2.8 shows the comparison of transit times from Antwerp to the different
rail terminal cities in Poland. It appears that road transport has the lowest
transit times, whereas rail and short sea transport always need some extra
transit time, because of pre- and end haulage and lower average speed of trains
and vessels. Short sea transport has the longest transit times, because of the
low average speed of this transport modality. In addition, for Central and
Southern Poland, the end haulage is considerable, giving a disadvantage to short
sea transport in those areas.
Table 2.9 Transit times and distances Antwerp - Poland (one-way) in hrs.
Road transport (door-door)
Rail transport (minimum)1 (door-door)
Intermodal operator
Short sea transport2 (door-door)
Warsaw
(Pruszkow)
31 h. (1300 km)3 58 h. (range = 58 – 127 h.) - Hupac
- Kombiverkehr
105 h.
Poznan
(Gadki)
(Kobylnika)
27 h. (960 km) 3 51 h. (range = 51 – 129 h.) - Hupac
- Kombiverkehr
105 h.
Slawkow 30 h. (1239 km) 3 70 h. (range = 70 – 128 h.) - Hupac
- Kombiverkehr
124 h.
Gliwice 30 h. (1185 km) 3 69 h. (range = 69 – 127 h.) - Kombiverkehr 124 h.
Wroclaw 28 h. (1029 km) 3 71 h. (range = 71 – 129 h.) - Kombiverkehr 124 h.
Malaszewicze 40 h. (1478 km) 103 h. (range = 103 – 161 h.) - Kombiverkehr 105 h.
Source: NEA, May 2010
Transport costs
Transport costs of one direct roundtrip by rail between Antwerp and Warsaw is
approximately in between 26.000 and 30.000 Euro (excluding costs for container
handling and pre/end-haulage). Due to a lack of cargo, the reality is that
container shuttles are not always fully utilized, which makes rail transport per
intermodal unit more expensive. To operate break-even a train must be utilized
for at least 80% - 85% on a roundtrip basis.
Figure 2.29 shows the cost structure of rail transport between Antwerp and
Warsaw. The calculation is based on a fixed container shuttle taking the
Monzenroute. This route is used by traction providers and is verified during the
interviews with these stakeholders.
1 Including 10 hours pre- and end haulage. There exists transit time difference between the rail services; that is why the minimum and range of transit times of the rail services has been presented.
2 Including 5 hours pre-haulage; end haulage depends on the origin / destination in Poland and varies between 2 (Gdansk) and 23 hours (Slawkow and Gliwice). Transit time on sea is equal to 4 days.
3 A transit time of 27-31 hours is rather optimistic; it depends on the road traffic crowd and speed of cargo stuffing (loading) at place of origin. If there is somewhere a delay of more than 1 – 2 hours, the transit time will be increased to approximately 44 hours (due to the truck driving time directive).
Study exploiting the possibility of creating a rail freight corridor linking Poland and Belgium
50 R20100134.doc September 2010
It appears that the access costs - to be paid to the infrastructure manager and
which are non-negotiable - count for approximately one-third of the total costs.
One of the reasons for the high share is the high amount of access costs in
Poland. Fixed costs for locomotives and wagons also count for approximately
one-third of the total costs. Other variable costs and labour costs are responsible
for the remaining one-third of the total costs. If direct transport costs per
kilometer are considered, it is clearly visible in the graph that within Poland
access costs are responsible for 44% of the total costs. For Belgium this share is
approximately 13%, while for Germany the share (30%) is twice as much
compared to the situation in Belgium. The reason why the pictures between the
three countries are different is caused by the different rail transport distances in
each country and different costs of the costs components. While access costs per
kilometer in Germany are less than twice the access costs per kilometer in
Belgium, the share of access costs in Germany is more than two times the share
in Belgium. This due to the fact that access costs increase proportionally with the
rail distance which results in a higher share..In this situation, total (direct) costs
of a containershuttle on the corridor between Belgium and Poland are compared
on country basis. Due to the fact that the total distance in Germany is four times
higher than in Belgium, the share of access costs will be higher than in Germany
and - also due to even higher access costs per kilometer - also in Poland. If
access costs are compared on basis of distance covered (per kilometer), then
access costs in Poland are higher than in both Germany and Belgium.
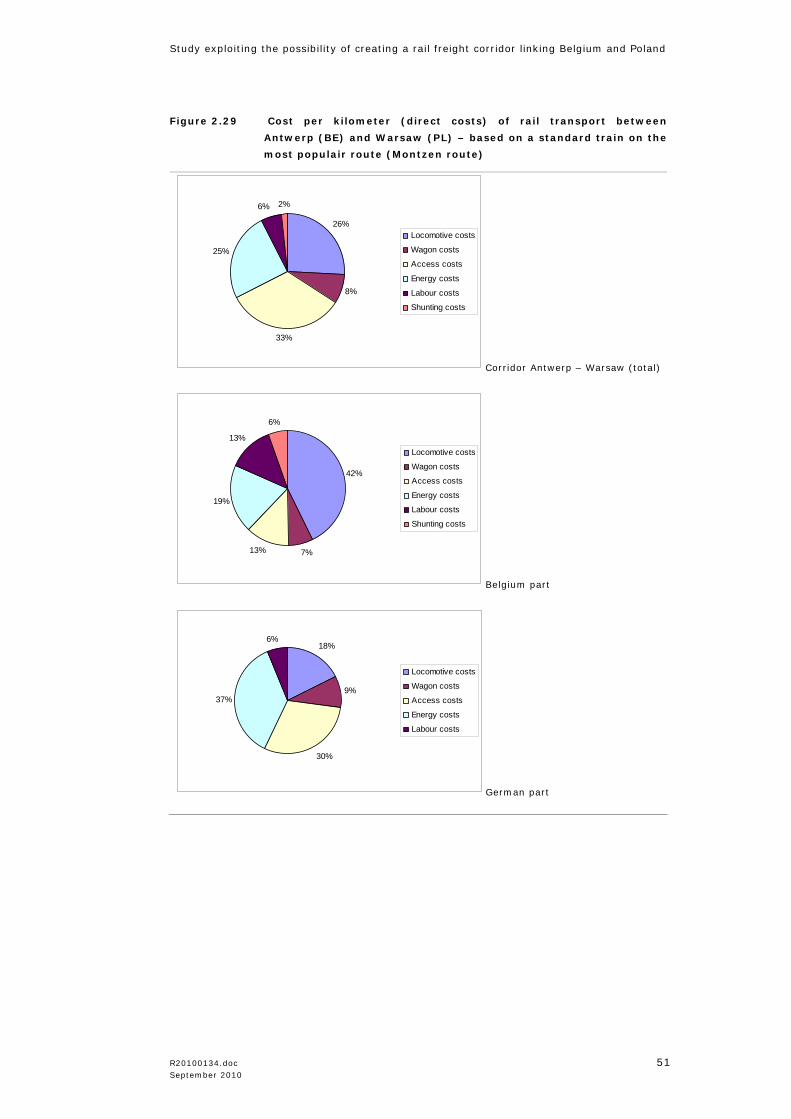
Study exploiting the possibility of creating a rail freight corridor linking Belgium and Poland
R20100134.doc 51 September 2010
Figure 2.29 Cost per kilometer (direct costs) of rail transport between
Antwerp (BE) and Warsaw (PL) – based on a standard train on the
most populair route (Montzen route)
26%
8%
33%
25%
6% 2%
Locomotive costs
Wagon costs
Access costs
Energy costs
Labour costs
Shunting costs
Corridor Antwerp – Warsaw (total)
42%
7%13%
19%
13%
6%
Locomotive costs
Wagon costs
Access costs
Energy costs
Labour costs
Shunting costs
Belgium part
18%
9%
30%
37%
6%
Locomotive costs
Wagon costs
Access costs
Energy costs
Labour costs
German part
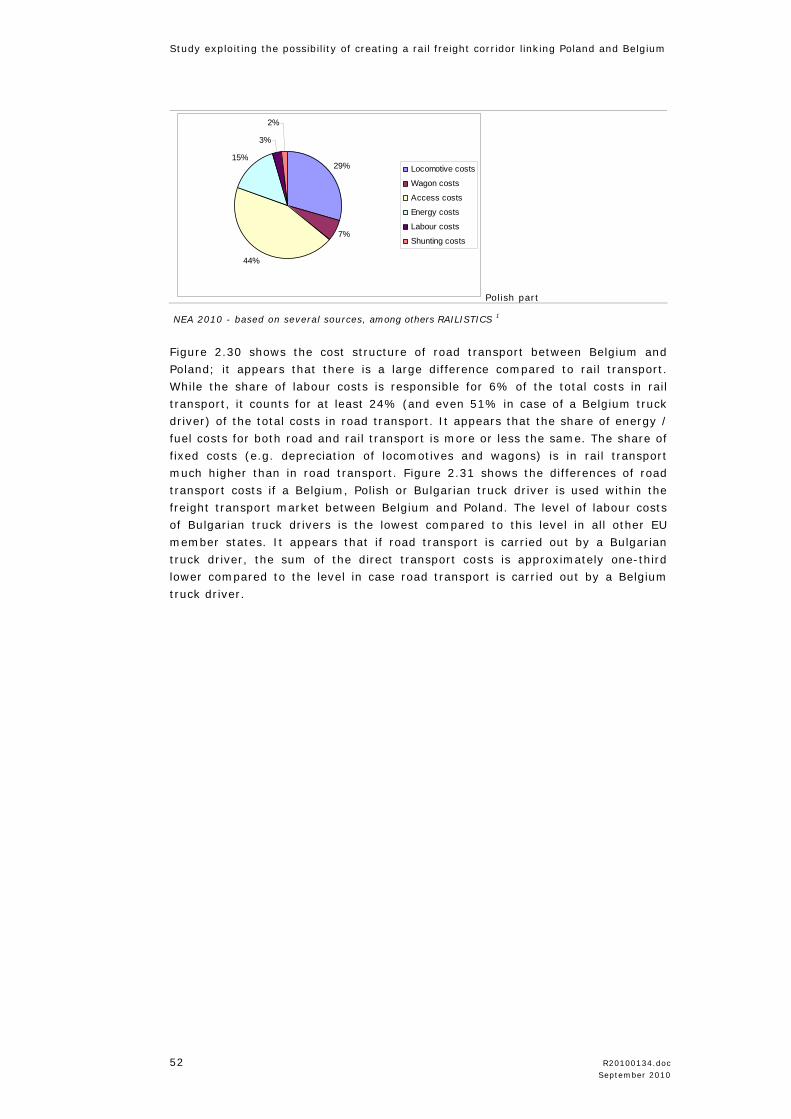
Study exploiting the possibility of creating a rail freight corridor linking Poland and Belgium
52 R20100134.doc September 2010
29%
7%
44%
15%
3%
2%
Locomotive costs
Wagon costs
Access costs
Energy costs
Labour costs
Shunting costs
Polish part
NEA 2010 - based on several sources, among others RAILISTICS 1
Figure 2.30 shows the cost structure of road transport between Belgium and
Poland; it appears that there is a large difference compared to rail transport.
While the share of labour costs is responsible for 6% of the total costs in rail
transport, it counts for at least 24% (and even 51% in case of a Belgium truck
driver) of the total costs in road transport. It appears that the share of energy /
fuel costs for both road and rail transport is more or less the same. The share of
fixed costs (e.g. depreciation of locomotives and wagons) is in rail transport
much higher than in road transport. Figure 2.31 shows the differences of road
transport costs if a Belgium, Polish or Bulgarian truck driver is used within the
freight transport market between Belgium and Poland. The level of labour costs
of Bulgarian truck drivers is the lowest compared to this level in all other EU
member states. It appears that if road transport is carried out by a Bulgarian
truck driver, the sum of the direct transport costs is approximately one-third
lower compared to the level in case road transport is carried out by a Belgium
truck driver.

Study exploiting the possibility of creating a rail freight corridor linking Belgium and Poland
R20100134.doc 53 September 2010
8%
20%
14%
7%
51%
Figure 2.30 Cost structure (direct costs) road transport between Belgium and
Poland (radius 1,000 km) with truck drivers from different EU
countries, valid on the 1st of July 2009
Source: NEA, 2009
1- Labour costs BE: Costs and performance of European rail freight
transportation, NEA 2008
- Labour costs PL: CNTK
- Energy costs BE: Costs and performance of European rail freight
transportation, NEA 2008
- Energy costs PL: CNTK
- Locomotive / equipment costs: Costs and performance of European rail
freight transportation, NEA 2008
- Access charges BE: Infrabel, network statement
- Access charges PL: PKP PLK, network statement
Access charges DE: DB Netz, network statement
12%
32%
22%
10%
24%
10%
26%
18%8%
38%
Fixed costs per year
Fuel costs per year
Variable depreciation &maintenance costs per yearToll charges
Labour Costs per year
Belgium driver Polish driver
Bulgarian driver
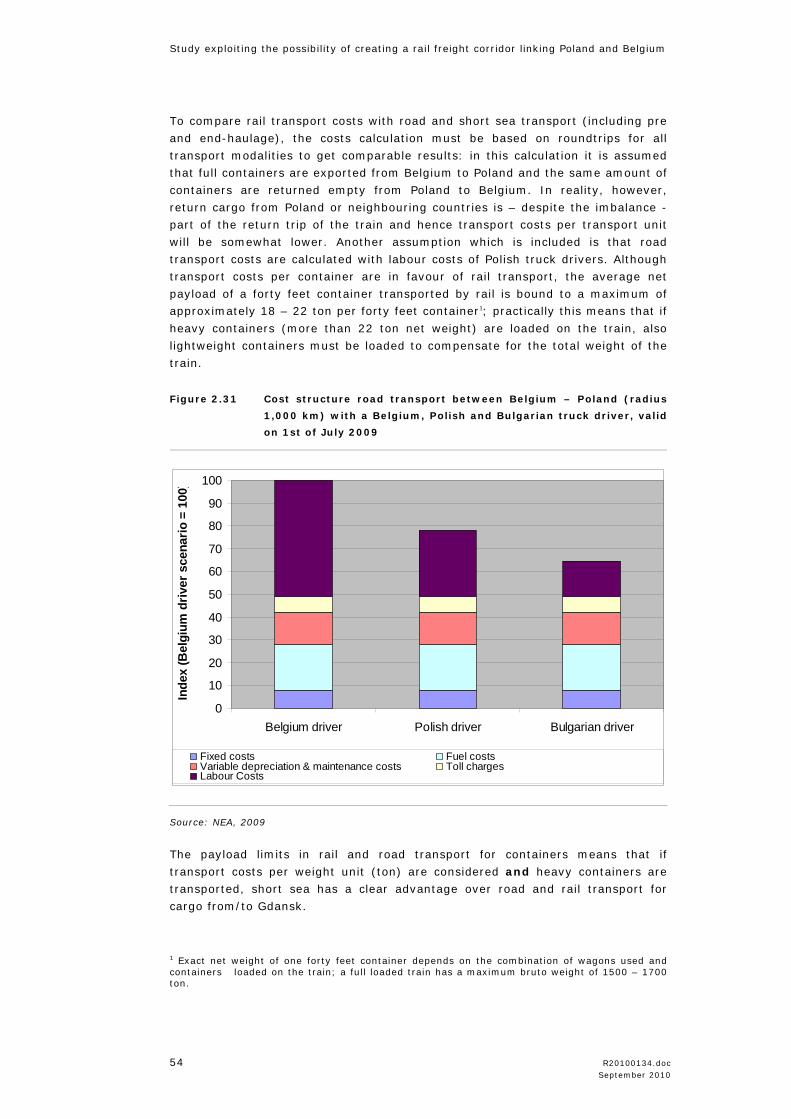
Study exploiting the possibility of creating a rail freight corridor linking Poland and Belgium
54 R20100134.doc September 2010
To compare rail transport costs with road and short sea transport (including pre
and end-haulage), the costs calculation must be based on roundtrips for all
transport modalities to get comparable results: in this calculation it is assumed
that full containers are exported from Belgium to Poland and the same amount of
containers are returned empty from Poland to Belgium. In reality, however,
return cargo from Poland or neighbouring countries is – despite the imbalance -
part of the return trip of the train and hence transport costs per transport unit
will be somewhat lower. Another assumption which is included is that road
transport costs are calculated with labour costs of Polish truck drivers. Although
transport costs per container are in favour of rail transport, the average net
payload of a forty feet container transported by rail is bound to a maximum of
approximately 18 – 22 ton per forty feet container1; practically this means that if
heavy containers (more than 22 ton net weight) are loaded on the train, also
lightweight containers must be loaded to compensate for the total weight of the
train.
Figure 2.31 Cost structure road transport between Belgium – Poland (radius
1,000 km) with a Belgium, Polish and Bulgarian truck driver, valid
on 1st of July 2009
0
10
20
30
40
50
60
70
80
90
100
Belgium driver Polish driver Bulgarian driver
Inde
x (B
elgi
um d
river
sce
nario
= 1
00)
Fixed costs Fuel costs Variable depreciation & maintenance costs Toll chargesLabour Costs
Source: NEA, 2009
The payload limits in rail and road transport for containers means that if
transport costs per weight unit (ton) are considered and heavy containers are
transported, short sea has a clear advantage over road and rail transport for
cargo from/to Gdansk.
1 Exact net weight of one forty feet container depends on the combination of wagons used and containers loaded on the train; a full loaded train has a maximum bruto weight of 1500 – 1700 ton.

Study exploiting the possibility of creating a rail freight corridor linking Belgium and Poland
R20100134.doc 55 September 2010
First of all, this is because short sea shipping on this distance is much cheaper1
than road and rail transport and secondly because the maximum payload in short
sea transport is higher than in rail transport. For freight transport between
Belgium and Poznan/Wroclaw, rail transport has a clear costs advantage over
road and short sea transport. Freight transport between Belgium and Warsaw,
both rail transport and short sea shipping have a clear transport costs advantage
over road transport. The payload limit is also reflected in rail tariffs: the heavier
a container, the more a customer has to pay to the rail operator. In short sea
transport no tariff distinction is made between heavy and lightweight containers.
In short, it can be concluded that if transport costs between Belgium and Poland
per weight unit are considered, short sea transport has a clear advantage over
rail and road transport if origin or destination locations are situated in the
Northern or North-eastern part of Poland. However the dimension of this
advantage depends on the number of intermodal units transported between
Belgium and Poland and hence on the size and utilization rate of the short sea
vessel being in service.
Currently, there are hardly direct short sea services between Belgium and
Poland, which indicates that cargo hardly finds its’ way via short sea shipping
from Belgium to Poland and vice versa; hence it is not possible to maintain
(frequent) direct short sea services. If transport costs on the route between
Belgium and the Central and Southern part of Poland are investigated, rail
transport has a clear advantage over road and short sea transport. The results of
this transport costs comparison are presented in figure 2.32.
1 Assumed that short sea vessels on this corridor are loaded for approximately 90% with a
loading capacity of 500 TEU.
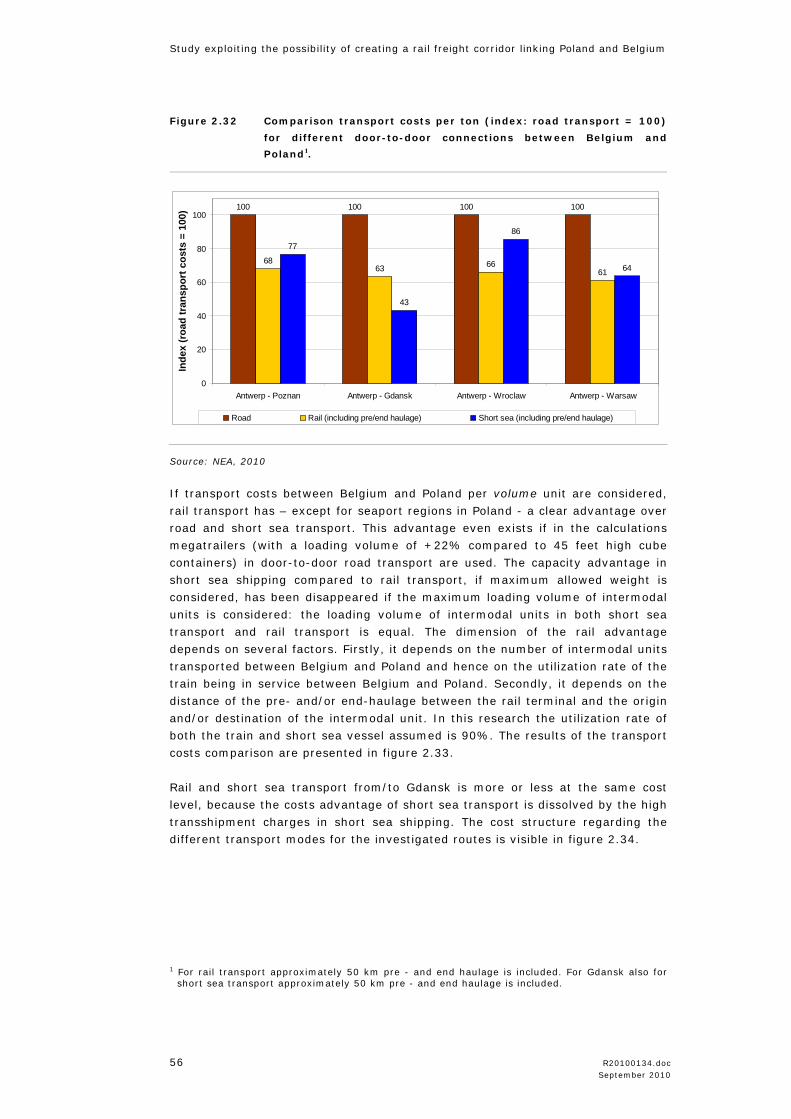
Study exploiting the possibility of creating a rail freight corridor linking Poland and Belgium
56 R20100134.doc September 2010
Figure 2.32 Comparison transport costs per ton (index: road transport = 100)
for different door-to-door connections between Belgium and
Poland1.
100 100 100 100
6863 66
61
77
43
86
64
0
20
40
60
80
100
Antwerp - Poznan Antwerp - Gdansk Antwerp - Wroclaw Antwerp - Warsaw
Inde
x (r
oad
tran
spor
t cos
ts =
100
)
Road Rail (including pre/end haulage) Short sea (including pre/end haulage)
Source: NEA, 2010
If transport costs between Belgium and Poland per volume unit are considered,
rail transport has – except for seaport regions in Poland - a clear advantage over
road and short sea transport. This advantage even exists if in the calculations
megatrailers (with a loading volume of +22% compared to 45 feet high cube
containers) in door-to-door road transport are used. The capacity advantage in
short sea shipping compared to rail transport, if maximum allowed weight is
considered, has been disappeared if the maximum loading volume of intermodal
units is considered: the loading volume of intermodal units in both short sea
transport and rail transport is equal. The dimension of the rail advantage
depends on several factors. Firstly, it depends on the number of intermodal units
transported between Belgium and Poland and hence on the utilization rate of the
train being in service between Belgium and Poland. Secondly, it depends on the
distance of the pre- and/or end-haulage between the rail terminal and the origin
and/or destination of the intermodal unit. In this research the utilization rate of
both the train and short sea vessel assumed is 90%. The results of the transport
costs comparison are presented in figure 2.33.
Rail and short sea transport from/to Gdansk is more or less at the same cost
level, because the costs advantage of short sea transport is dissolved by the high
transshipment charges in short sea shipping. The cost structure regarding the
different transport modes for the investigated routes is visible in figure 2.34.
1 For rail transport approximately 50 km pre - and end haulage is included. For Gdansk also for
short sea transport approximately 50 km pre - and end haulage is included.

Study exploiting the possibility of creating a rail freight corridor linking Belgium and Poland
R20100134.doc 57 September 2010
Figure 2.33 Comparison transport costs per cubic metre (index: road transport
= 100) for different door-to-door connections between Belgium
and Poland.
100 100 100 100
5854 56
52
97
54
108
81
0
20
40
60
80
100
120
Antwerp - Poznan Antwerp - Gdansk Antwerp - Wroclaw Antwerp - Warsaw
Inde
x (r
oad
tran
spor
t cos
ts =
100
)
Road Rail (including pre/end haulage) Short sea (including pre/end haulage)
Source: NEA, 2010
In the field of transport costs, the German Ministry of Transport recently
researched the effect of increasing road transport costs (by increasing the Maut
tariff) and concluded that increasing road taxes will have a very small effect on
shifting freight transport from road to water and rail transport1. Only if an out-of-
proportion tax increase up to 1 Euro per kilometer will be introduced, than
freight transport will significantly shift from road to water and rail. Furthermore,
they concluded that improving the quality of rail transport will result in a
significant modal shift as well. On the other hand, reducing user fees in rail
transport will not result in a significant modal shift to rail transport.
It should however be kept in mind that in this time - just after the economic
crisis - road transport tariffs are decreased to such a low level, on which it is
hard for rail transport to compete with road transport in terms of transport
prices. Above all, road transport tariffs can be reduced more easily than rail
transport tariffs, because road transport is less capital intensive and more labour
intensive (and not dependent on non-negotiable access charges) than rail
transport; if road transport firms ‘switch’ from Belgium to cheap East-European
truck drivers, transport costs can be reduced considerably, while rail transport
operators can hardly respond to such costs reductions. As soon as transport
volumes will grow and hence transport capacity become more scrace, this will be
translated in a tendency towards forcing up (road) transport tariffs.
Rail transport then is not only a competitor of road transport, but also an
additional transport alternative to road transport, which is needed to transport
the growing cargo flows. In the end, these developments will move rail transport
towards a (much) stronger position.
1 Source: Nieuwsblad Transport, 10 September 2009.
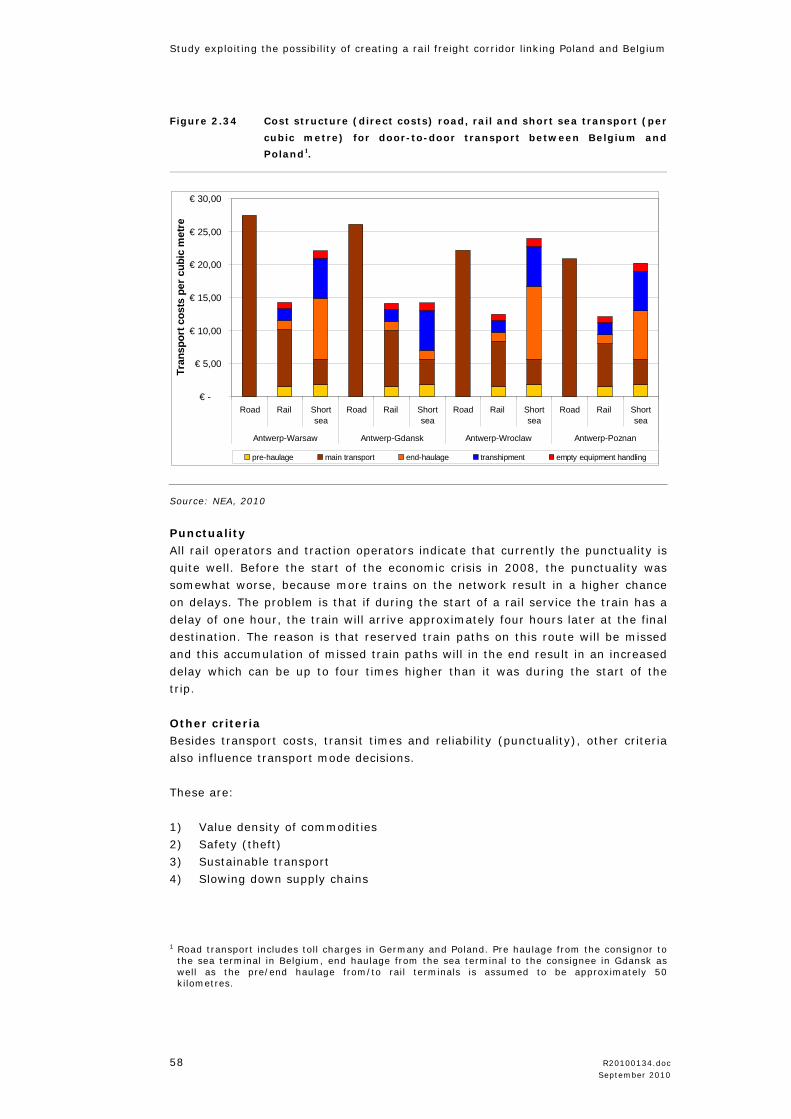
Study exploiting the possibility of creating a rail freight corridor linking Poland and Belgium
58 R20100134.doc September 2010
Figure 2.34 Cost structure (direct costs) road, rail and short sea transport (per
cubic metre) for door-to-door transport between Belgium and
Poland1.
€ -
€ 5,00
€ 10,00
€ 15,00
€ 20,00
€ 25,00
€ 30,00
Road Rail Shortsea
Road Rail Shortsea
Road Rail Shortsea
Road Rail Shortsea
Antwerp-Warsaw Antwerp-Gdansk Antwerp-Wroclaw Antwerp-Poznan
Tran
spor
t cos
ts p
er c
ubic
met
re
pre-haulage main transport end-haulage transhipment empty equipment handling
Source: NEA, 2010
Punctuality
All rail operators and traction operators indicate that currently the punctuality is
quite well. Before the start of the economic crisis in 2008, the punctuality was
somewhat worse, because more trains on the network result in a higher chance
on delays. The problem is that if during the start of a rail service the train has a
delay of one hour, the train will arrive approximately four hours later at the final
destination. The reason is that reserved train paths on this route will be missed
and this accumulation of missed train paths will in the end result in an increased
delay which can be up to four times higher than it was during the start of the
trip.
Other criteria
Besides transport costs, transit times and reliability (punctuality), other criteria
also influence transport mode decisions.
These are:
1) Value density of commodities
2) Safety (theft)
3) Sustainable transport
4) Slowing down supply chains
1 Road transport includes toll charges in Germany and Poland. Pre haulage from the consignor to
the sea terminal in Belgium, end haulage from the sea terminal to the consignee in Gdansk as well as the pre/end haulage from/to rail terminals is assumed to be approximately 50 kilometres.
Study exploiting the possibility of creating a rail freight corridor linking Belgium and Poland
R20100134.doc 59 September 2010
Regarding sustainable transport it is worth mentioning that consumers are more
and more aware of ‘green’ products, which are produced and transported
environment-friendly. Hence, especially for consumer goods, supply chains profit
from sustainable transport solutions like rail transport. In the preceding
paragraph is became clear that especially transport flows of consumer goods are
expected to grow in the future. Hence, rail transport can play an important role
for this kind of transport flows. Slowing down supply chains means that a part of
transport flows within supply chains can be transported by slow transport modes
(e.g. rail), because this part exists of a guaranteed demand. For this guaranteed
demand, transport orders are known well in advance and can be planned
efficiently in intermodal transport chains.
Overall it can be concluded that while rail transport can be cheaper on transport
corridors, this cost advantage is often still too small to compensate for the less
quality of other transport criteria. Only, if rail transport between warehouses
and/or ports fits well in logistic concepts (which in turn are close related to
production and sales concepts) of shippers, this transport modality can be used.
In addition, scale in transport volumes has a positive effect on the utilization
rate of rail (and short sea) transport and hence a positive effect on the transport
costs. Scale is also necessary to maintain direct and frequent rail (and Shortsea)
services.
2.3 Conclusions
Based on the intermodal transport analysis between Belgium and Poland, a
SWOT-analysis1 can be drawn. This analysis is visible in table 2.9.
1 SWOT means: Strengths, Weaknesses, Opportunities and Threats.
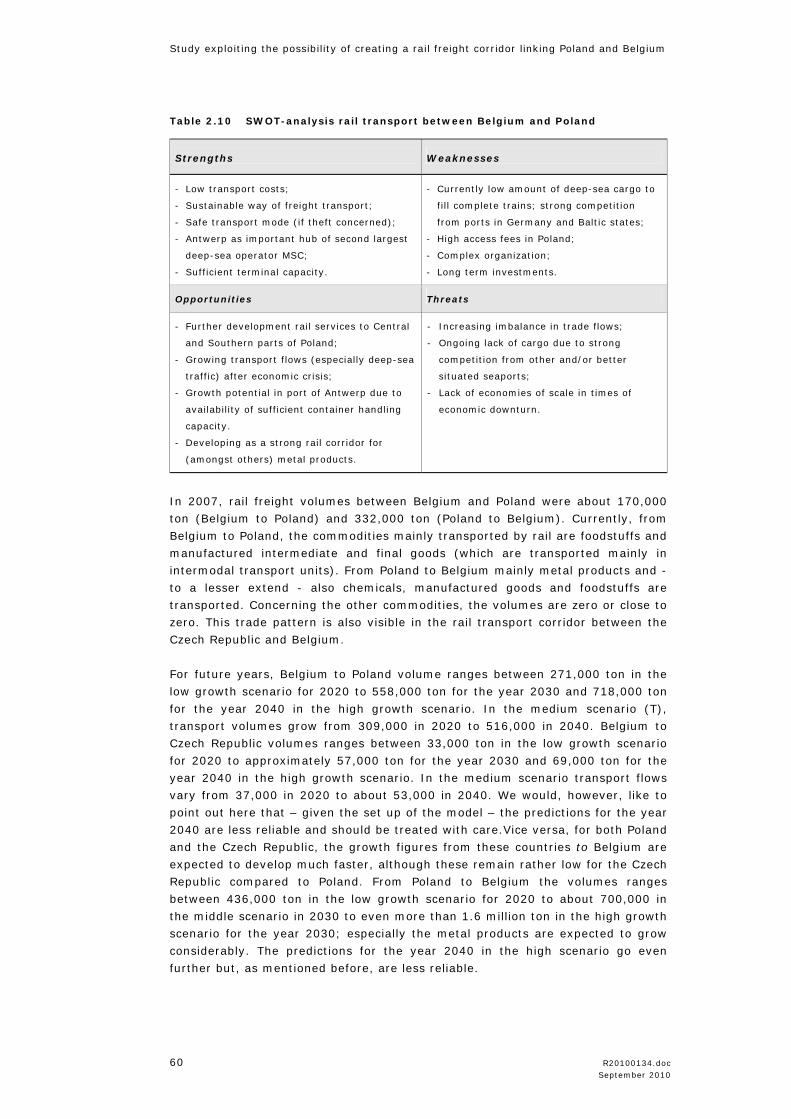
Study exploiting the possibility of creating a rail freight corridor linking Poland and Belgium
60 R20100134.doc September 2010
Table 2.10 SWOT-analysis rail transport between Belgium and Poland
Strengths Weaknesses
- Low transport costs;
- Sustainable way of freight transport;
- Safe transport mode (if theft concerned);
- Antwerp as important hub of second largest
deep-sea operator MSC;
- Sufficient terminal capacity.
- Currently low amount of deep-sea cargo to
fill complete trains; strong competition
from ports in Germany and Baltic states;
- High access fees in Poland;
- Complex organization;
- Long term investments.
Opportunities Threats
- Further development rail services to Central
and Southern parts of Poland;
- Growing transport flows (especially deep-sea
traffic) after economic crisis;
- Growth potential in port of Antwerp due to
availability of sufficient container handling
capacity.
- Developing as a strong rail corridor for
(amongst others) metal products.
- Increasing imbalance in trade flows;
- Ongoing lack of cargo due to strong
competition from other and/or better
situated seaports;
- Lack of economies of scale in times of
economic downturn.
In 2007, rail freight volumes between Belgium and Poland were about 170,000
ton (Belgium to Poland) and 332,000 ton (Poland to Belgium). Currently, from
Belgium to Poland, the commodities mainly transported by rail are foodstuffs and
manufactured intermediate and final goods (which are transported mainly in
intermodal transport units). From Poland to Belgium mainly metal products and -
to a lesser extend - also chemicals, manufactured goods and foodstuffs are
transported. Concerning the other commodities, the volumes are zero or close to
zero. This trade pattern is also visible in the rail transport corridor between the
Czech Republic and Belgium.
For future years, Belgium to Poland volume ranges between 271,000 ton in the
low growth scenario for 2020 to 558,000 ton for the year 2030 and 718,000 ton
for the year 2040 in the high growth scenario. In the medium scenario (T),
transport volumes grow from 309,000 in 2020 to 516,000 in 2040. Belgium to
Czech Republic volumes ranges between 33,000 ton in the low growth scenario
for 2020 to approximately 57,000 ton for the year 2030 and 69,000 ton for the
year 2040 in the high growth scenario. In the medium scenario transport flows
vary from 37,000 in 2020 to about 53,000 in 2040. We would, however, like to
point out here that – given the set up of the model – the predictions for the year
2040 are less reliable and should be treated with care.Vice versa, for both Poland
and the Czech Republic, the growth figures from these countries to Belgium are
expected to develop much faster, although these remain rather low for the Czech
Republic compared to Poland. From Poland to Belgium the volumes ranges
between 436,000 ton in the low growth scenario for 2020 to about 700,000 in
the middle scenario in 2030 to even more than 1.6 million ton in the high growth
scenario for the year 2030; especially the metal products are expected to grow
considerably. The predictions for the year 2040 in the high scenario go even
further but, as mentioned before, are less reliable.

Study exploiting the possibility of creating a rail freight corridor linking Belgium and Poland
R20100134.doc 61 September 2010
These forecasts are much higher than the most optimistic forecast for the
Netherlands in which rail volumes are expected to grow to a maximum of 1.2
million in 2040 (high growth scenario). Hence, these Poland – Belgium forecasts
underline the high potential of the Belgium – Poland rail corridor. From the Czech
Republic to Belgium the volumes ranges between 131,000 ton in the low growth
scenario for 2020 to 211,000 ton in 2030 in the central scenario to 490,000 ton
in the high growth scenario for the year 2030 and even till 720,000 tons in 2040.
In more detail, it can be concluded that especially the metal products (regarding
both Poland and the Czech republic) and containerized goods (between Belgium
and the Czech Republic) show a strong growth on these corridors. Because the
rail freight volumes are expected to grow fast, the market share of rail could
increase from 7% in 2007 to 8% in the middle and 9% in the high growth
scenario in 2030 (Belgium to Poland) and from 20% in 2007 to 21% in the
medium scenario in 2030 and 39% in the high growth scenario in 2030 (Poland
to Belgium). Finally, the market share of rail could increase from 13% in 2007 to
15% in the medium scenario and 16% in the high growth scenario in 2030
(Belgium to Czech Republic) and from 26% in 2007 to 28% in the medium
scenario in 2030 (Czech Republic to Belgium). In the high scenario this share
increases to 51% in 2030. Even taking into account that this is a scenario with
larger economic growth and measures aimed at a model shift towards rail, this
seems to be a too high modal share. Modal shares for 2040 are even higher, but
are likely overestimated in the case of transport from the Czech Republic/Poland
to Belgium.
Analyzing the intermodal transport market between Belgium and Poland, the
highest potential for rail transport is on the corridor between Belgium and the
centre (Poznan - Warsaw) and the South (Wroclaw – Katowice) of Poland. On
these corridors, rail transport has – especially if lightweight cargo is transported
- a cost advantage over short sea shipping via Polish seaports, due to long
distances of pre- and end haulage. Rail transport has also a clear cost advantage
over road transport if pre/end haulage is limited. The more origin and/or
destinations of cargo are located Southwards and near a rail terminal, the higher
is the potential for rail transport. In addition, the majority (87%) of all rail
shipments (measured in weight) from Belgium to Poland currently has a
destination in the central or Southern part of Poland. In the other direction,
these parts in Poland are even stronger involved: 94% of all rail shipments
(measured in weight) from Poland to Belgium has an origin in the central or
Southern part of Poland.
Another important development is the growing consciousness of sustainable
supply chains in which rail transport will play an important role. If cargo transit
times are considered, those supply chains which ‘allow’ some longer transit times
in certain parts of the supply chain, rail transport can be a good transport
alternative. While some rail services have even competitive transit times
compared to road transport, rail transport is for all parts in Poland much faster
than short sea shipping via Polish seaports. Above all, frequencies of rail
transport services between Belgium and Poland are higher than for short sea
shipping.

Study exploiting the possibility of creating a rail freight corridor linking Poland and Belgium
62 R20100134.doc September 2010
There is not enough cargo to load short sea vessels (almost) full every day of the
week, while rail transport offers a daily service between both countries; a higher
transport frequency means a higher degree of flexibility for shippers. Finally, it is
worth mentioning that especially rail services over the weekend have an
advantage over road transport, because of the driving ban on Sunday within
Germany. Table 2.10 shows the strengths and weaknesses of rail transport over
road and short sea shipping. Regarding transport costs it is clear that short sea
shipping only has an advantage over rail transport if origin and/or destinations of
cargo are located in the Northern part of Poland, close to the Polish seaports of
Gdansk/Gdynia.
Strengths and weaknesses of rail transport compared to other transport modes
Transport costs Transit times Flexibility
Rail versus road
lightweight goods + - -
Rail versus short sea
lightweight goods
+ (Southern regions)
- (Northern regions) + +
Rail versus road
heavy goods + - -
Rail versus short sea
heavy goods
+ (Southern regions)
- (Northern regions) + +
In short, rail transport has potential if cargo is or has:
• Originated and/or a destination in Central/Southern Poland;
• High and low weight density; however the advantage towards the other
modalities is stronger for light weight goods, because of weight restrictions.
• Predictable well in advance;
• Expected to be produced and transported in a sustainable way.
Study exploiting the possibility of creating a rail freight corridor linking Belgium and Poland
R20100134.doc 63 September 2010
3 Identification of barriers to further development
3.1 Introduction
The first chapter of this study presented a forecast of the rail freight exchanges
between the Netherlands and Poland. The TNO study clearly highlighted in its
conclusion that if developments, measures and policies were decided in order to
stimulate freight flow, then the perspectives of the Belgium-Polish rail freight
corridor would significantly be improved.
Since trade improvement is a direct consequence of business efficiency, it
appears meaningful and compulsory to tackle the current barriers to
development as seen and felt by the different market players who partly were
presented in the previous chapter.
Consequently, the main purpose of this subchapter is to identify and analyse the
barriers as seen by stakeholders. These barriers will later enable consultants to
elaborate an Action Plan to be enforced across the studied european corridor.
Moreover, the corridor approach, governance and advantages in comparaison
with classical international train routes will also be developped.
3.2 Barriers as viewed by the stakeholders
To identify constraints in international freight transport by rail the consultant
contacted the stakeholders to identify the constraints and barriers from the
perspective of all involved stakeholders. These stakeholders are the current and
possible railway operators, forwarding companies, terminal operating companies,
infrastructure managers and national authorities. A list of iterviewed persons is
in the Annex)
The approach adopted by the Consultant takes into account the fact, that the
opinions of particular “players” can be very subjective. It should be however
noted that these subjective views are very often the basis of real decisions.
The barriers identified can be a perception of a single stakeholder. The scale of
the survey and the limited timeframe made it impossible to verify each barrier.
However as long as these barriers are mentioned, they will hinder rail cargo
transport as perception is an very important element in business.
The barriers identified in the interviews with the stakeholders have been
structured into the following groups:
• institutional barriers,
• technical barriers,
• market barriers,
• operational barriers.
Study exploiting the possibility of creating a rail freight corridor linking Poland and Belgium
64 R20100134.doc September 2010
3.3 Institutional barriers & issues
• Although there has been in the past complain on Infrabel with regard to its
cancellation, under special circumstance, of train path which Infrabel had
already allocated to a private undertaking. But in general, Infrabel tries to be
as independent as possible and Infrabel is considered by most interviewed
market players as neutral in allocating train paths to all the railway
undertakings that are operating in the Belgium market.
• Certain rail operator and undertaking consider the policy of Infrabel
deconstructive, in which a railway undertaking is subject to a fee in case it
cancels – outside of the official annual path application phase (in April) and
path scheduling amendments phases (6 times a year) – the train paths which
it requested earlier and will not use due to changing market and operational
planning. This policy increases the operational costs for the rail operator and
is considered not good for the rail freight market which faces fierce
competition with the road transport. However, others market players and
Infrabel consider it as positive incentive to drive the railway undertakings
and rail operators to make better, efficient, and more realistic organizational
and operational planning, and to prevent unnecessary preoccupation of too
many train paths without using them in the end. Under such policy, paths
can be utilized most efficiently among all the railway undertakings and the
change that certain railway undertaking reserves extra train paths in order
keep the other undertakings out of the market can be avoided.
• The Belgium Rail Regulator (DRS) has the competence of investigating,
monitoring, giving advices, and if necessary penalizing the infrastructure
manger for unlawful practices with regard to different issues (e.g. content of
the Network Statement), access charges, network access. However, it does
not have competence in changing access changes or imposing penalties with
regard to competition issues. In case of strong market distortion or anti-
competitive behaviors observed DRS may transfer these issues to the
Belgium competition authority (Competition Council) where market
competition issues are dealt with.
• In 2007 there was the issue with regard to monopolistic provision of training
facilities and certification of train-drivers by the national railway company
SNCB, which was stipulated in a Belgium national royal decree. This issue has
been resolved for the moment: the national royal decree has been adjusted;
and at the moment three railway companies in Belgium offer training and
certification service for train drivers: (a.) SNCB-Logistics; (b.) Crossrail; (c.)
Trainsport.
• Lack of cross-acceptance of certification for train drivers is still an issue in
Belgium. Besides, railway undertakings from the Netherlands face extra
language requirement with regard to driver certification process for entering
the Belgium market. Furthermore, without cross-acceptance of certification
for train drivers the effort to train a train-driver is very high.
For example, it costs approximately 60,000 Euro excluding salaries and all
equipment costs, takes about 5-6 months training period and 1 year practice
in order to certify a driver in the Netherlands.
Study exploiting the possibility of creating a rail freight corridor linking Belgium and Poland
R20100134.doc 65 September 2010
• There is lack of cross-acceptance of certification for locomotives. Railway
undertaking that invest in multi-system locomotive cannot use it on
international corridor as they need to wait very long time to have this
locomotive certified to drive on the Belgium network. Diesel locomotives are
used in the meantime.
3.4 Operational barriers & issues
• Within the port the most important bridge Lillobrug needs to be closed for
trains to pass and opened for deep-sea vessels to pass. At the moment,
priority is often given to the deep-sea vessels and the trains have to wait.
This affects the transit time and reliability of trains.
• The use of One-Stop-Shop (OSS) for applying train paths on international
corridors is rather limited. In the case where certain company did use OSS, it
did not function properly. Certain private undertaking has tried applying the
same train paths via OSS and via individual infrastructure managers. The
result was that this undertaking received response from the individual
infrastructure managers much quicker than from OSS. The reason that OSS
gives slow response is speculated to be lack of good communication between
the corridor infrastructure managers.
• The speed of infrastructure manager to respond to requests from railway
undertaking for ad-hoc train paths has an impact on the waiting time of the
train service during its operation. Response from ProRail is rather quick;
usually within 45 minutes; response speed from Infrabel is also improved;
response from DB Netz is relatively slower: 6 – 8 hours.
• The yearly-based train path application process is considered rather rigid and
longsome for freight services. This system forces the operational planning
made by the rail operator to be finalized before paths are requested and also
to be fixed one year in advance. This is not always convenient and realistic
for the operator, given the market dynamics, adjustments to service
offerings, frequent fluctuations in volume and economic conditions.
• Terminals in Belgium are not open 24/7. The fact that in the weekends
terminals are closed and tracks are closed for maintenance is not convenient
for the service operation.
• There is some level of information exchange between Infrabel and the railway
undertakings. But there is lack of information exchange down to the rail
operators who have direct contact with the end customers who are the
stakeholders that want to know at any time the location of their
train/wagons/cargoes, how long it will still take to the final destination, and
estimated arrival time.
Study exploiting the possibility of creating a rail freight corridor linking Poland and Belgium
66 R20100134.doc September 2010
3.5 Technical barriers & issues
• Before the stretch Montzen – Aachen West was fully electrified, all trains
(>1100 tons) from Germany needed to be pushed by diesel push-locos from
Aachen West till Montzen due to a steep climb. This increases operational
costs of the railway undertakings. The condition has been improved since the
electrification since January 2009. Big push-locomotives are in most cases
not needed anymore with TRAXX multi-system locomotives. Trains can go
directly to Aachen without the need to stop at Montzen yard for changing
locomotives.
• The infrastructure capacity at Aachen West is considered to be rather limited.
• The rail infrastructure capacity within port of Antwerp is generally saturated.
Besides, the length of the rail track at Noordzee Terminal (913) is considered
to be not long enough. Trains are split up at this terminal for loading and
unloading.
• Maximum train length: the maximum length of freight trains is in principle
600 m excluding traction units (In comparison, the maximum length of
passenger trains: towed units is 400 m or 16 vehicles).
3.6 Market barriers & issues
• In general the rail terminal facilities and shunting yards (e.g. mainhub)
operated by IFB at the Port of Antwerp are considered not open to all parties.
Many private undertakings have limited access to these terminals and yards
and this leads to operational inefficiency. Certain rail operators lose
confidence and decided to use those terminals and shunting yards that are
not operated by IFB.
• Within port of Antwerp there are in total 22 shunting yards, among others,
the main one (mainhub) is owned by SNCB-Logistics. At the moment little
problem is recognized with regard to shunting service at Main hub for Single
Wagon business since SNCB-Logistics is the only party that handles single
wagonloads. However, in the future in case more parties coming in the
market of Single Wagon business, lack of open access to shunting services
might be an issue.
• At the Mainhub in Antwerp, IFB has established National Rail Container
Network (NARCON) with government subsidy. NARCON provides daily
national rail connections between Mainhub and Zeebrugge and five Belgium
inland terminals: Courtrai, Genk, Mouscron, Charleroi, and Athus. The
containers are repositioned at Mainhub (rail-to-rail) according to their final
destinations on both directions. However, the fact that IFB is the only
operator who can use this subsidized NARCON system; any other rail
operator cannot access this system signals market distortion due to
discriminative behavior from the incumbent.
Study exploiting the possibility of creating a rail freight corridor linking Belgium and Poland
R20100134.doc 67 September 2010
• The fuelling system operated by B-Cargo at Port of Antwerp is generally not
open to other private railway undertakings. To respond this issue, several
mobile fuelling systems have been installed in the port to resolve the
problem but are subject to safety and environmental requirements.
Meanwhile, private players are in negotiation with the non-IFB terminal
operators for possibilities of fuelling at their terminals. Crossrail has built its
own fuelling station in Montzen yard on a track rented by Infrabel.
• Maintenance service for wagons and locomotive is also considered as an issue
in Port of Antwerp. However, the situation is expected to improve as the
Dutch maintenance company Shunter took over the Antwerp based
maintenance company Sati.
3.7 Conclusions
The barriers to the transport of goods between Poland and Belgium which have
been presented above, are those reported by the interested parties who are
operating on the market of rail transport.
These barriers are subjective opinions and they do not always coincide with the
opinions of others participants of the market. However, in most cases, the
identified barriers are the same or similar.
The barriers focused on Belgium corridor as there are limited operators running
trains to Poland and the Polish are described in detail in the Netherlands-Poland
corridor study.
When analyzing the railway freight market Belgium and Poland it must be noted
that there is a strong competition with the others means of transport and also
inside the railway market (especially between block trains). This competition
results in the most important feature of the services offered to the customer
being the price of carriages of goods between Belgium and Poland. The vast
majority of the interviewees focused on the fact that as regards transport offers,
customers choose the cheapest offer. Only few times the quality of transport was
more stressed on. Indeed, only a few interviewees declared that in addition to
price, other factors such as quality of transport service play an important role.
In addition, significant importance was given to the inadequacy of infrastructure
and the additional scope of services offered.

Study exploiting the possibility of creating a rail freight corridor linking Belgium and Poland
R20100134.doc 69 September 2010
4 Selection of the Paths and Rail terminals
4.1 Introduction
The current situation of rail freight between Belgium, the Ruhr Area and Poland
has been presented in the previous two chapters. The analysis carried out
revealed that the rail freight transport between the two countries only represents
few percents of the total freight flow. The reasons to this situation have to be
found, among others, in the current barriers which have been reported by
various participant of the rail market in both countries. The fundamental barriers
have been presented in Task 2. However, on the basis of the forecasts realized in
the first chapter and the analysis of identified problems and barriers in the
following chapter, there are noticeable possibilities for improving and developing
rail freight traffic between the two countries. The study will now discuss the
conditions which have to be fulfilled in order to improve the transport of goods
by train and will present a proposal of the potential paths/corridors which could
be realized in the future. Therefore, this chapter will first detail the main
transport corridors from Belgium to the Ruhr Area / Hannover (the corridor
between Germany and Poland is described in the Belgium – Poland corridor
study) used for the carriage of goods, and secondly will describe the main
terminals in Belgium. The development plans of railway infrastructures and
terminals along the transport lines/corridors in Belgium will also be presented.
Before analyzing and detailing all the parameters necessary for suggesting a
coherent and effective rail freight corridor between Belgium and Poland, railways
networks will be displayed.

Study exploiting the possibility of creating a rail freight corridor linking Poland and Belgium
70 R20100134.doc September 2010
Figure 4.1 Rail network Belgium
Source: Infrabel, 2010
Figure 4.2 presents the main currently used rail traffic routes between the
Belgium and Poland. In principle the link port of Antwerp with Central and
Southern Poland through Germany.
Figure 4.2 Main considered rail traffic routes between Belgium and Poland
Bron: NEA, 2010
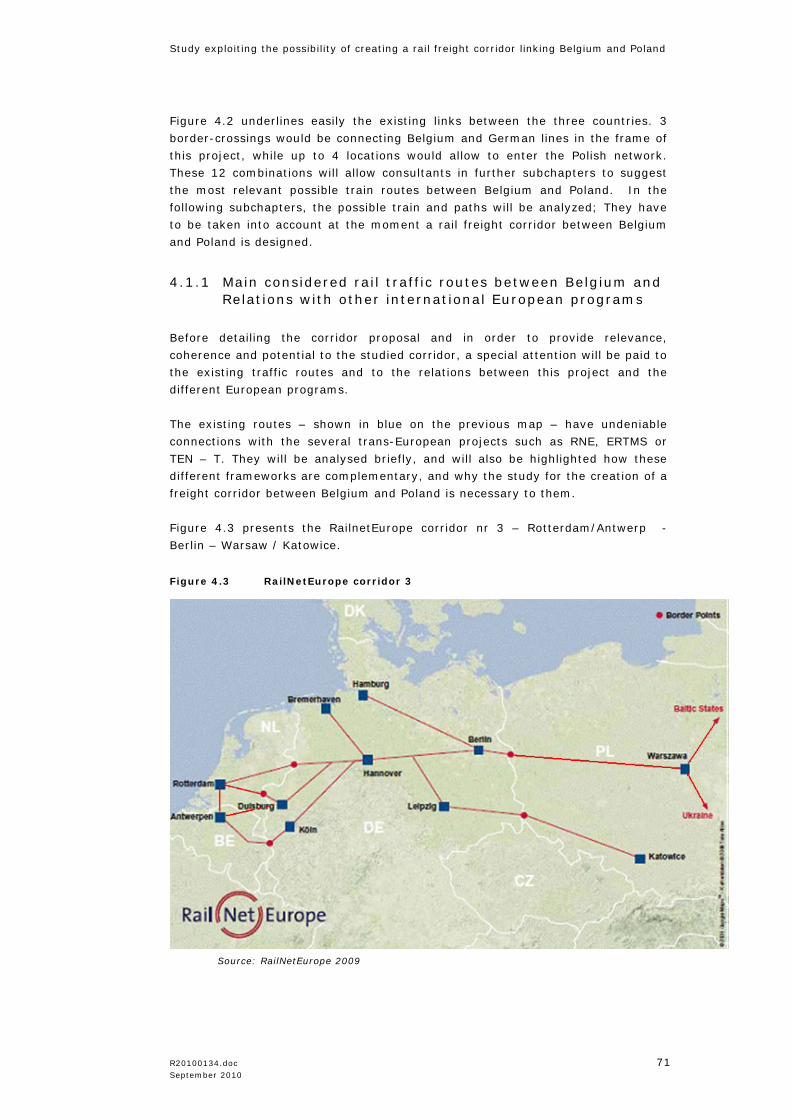
Study exploiting the possibility of creating a rail freight corridor linking Belgium and Poland
R20100134.doc 71 September 2010
Figure 4.2 underlines easily the existing links between the three countries. 3
border-crossings would be connecting Belgium and German lines in the frame of
this project, while up to 4 locations would allow to enter the Polish network.
These 12 combinations will allow consultants in further subchapters to suggest
the most relevant possible train routes between Belgium and Poland. In the
following subchapters, the possible train and paths will be analyzed; They have
to be taken into account at the moment a rail freight corridor between Belgium
and Poland is designed.
4.1.1 Main considered rail traffic routes between Belgium and Relations with other international European programs
Before detailing the corridor proposal and in order to provide relevance,
coherence and potential to the studied corridor, a special attention will be paid to
the existing traffic routes and to the relations between this project and the
different European programs.
The existing routes – shown in blue on the previous map – have undeniable
connections with the several trans-European projects such as RNE, ERTMS or
TEN – T. They will be analysed briefly, and will also be highlighted how these
different frameworks are complementary, and why the study for the creation of a
freight corridor between Belgium and Poland is necessary to them.
Figure 4.3 presents the RailnetEurope corridor nr 3 – Rotterdam/Antwerp -
Berlin – Warsaw / Katowice.
Figure 4.3 RailNetEurope corridor 3
Source: RailNetEurope 2009
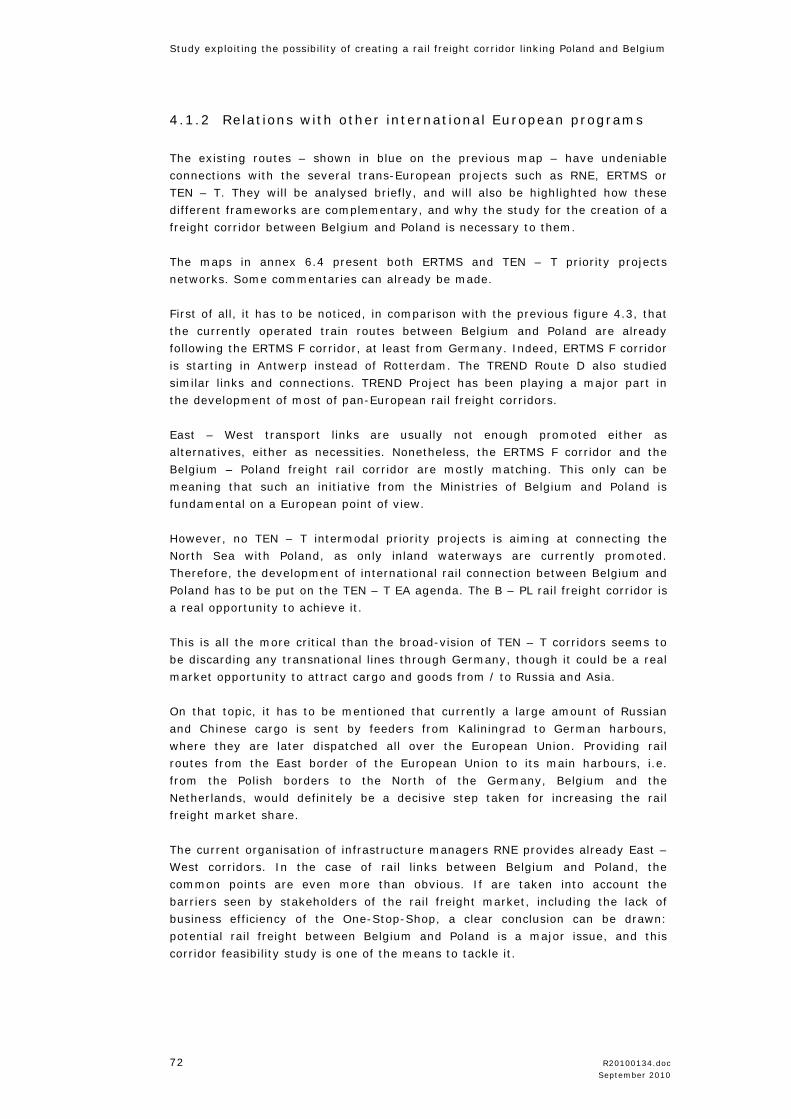
Study exploiting the possibility of creating a rail freight corridor linking Poland and Belgium
72 R20100134.doc September 2010
4.1.2 Relations with other international European programs
The existing routes – shown in blue on the previous map – have undeniable
connections with the several trans-European projects such as RNE, ERTMS or
TEN – T. They will be analysed briefly, and will also be highlighted how these
different frameworks are complementary, and why the study for the creation of a
freight corridor between Belgium and Poland is necessary to them.
The maps in annex 6.4 present both ERTMS and TEN – T priority projects
networks. Some commentaries can already be made.
First of all, it has to be noticed, in comparison with the previous figure 4.3, that
the currently operated train routes between Belgium and Poland are already
following the ERTMS F corridor, at least from Germany. Indeed, ERTMS F corridor
is starting in Antwerp instead of Rotterdam. The TREND Route D also studied
similar links and connections. TREND Project has been playing a major part in
the development of most of pan-European rail freight corridors.
East – West transport links are usually not enough promoted either as
alternatives, either as necessities. Nonetheless, the ERTMS F corridor and the
Belgium – Poland freight rail corridor are mostly matching. This only can be
meaning that such an initiative from the Ministries of Belgium and Poland is
fundamental on a European point of view.
However, no TEN – T intermodal priority projects is aiming at connecting the
North Sea with Poland, as only inland waterways are currently promoted.
Therefore, the development of international rail connection between Belgium and
Poland has to be put on the TEN – T EA agenda. The B – PL rail freight corridor is
a real opportunity to achieve it.
This is all the more critical than the broad-vision of TEN – T corridors seems to
be discarding any transnational lines through Germany, though it could be a real
market opportunity to attract cargo and goods from / to Russia and Asia.
On that topic, it has to be mentioned that currently a large amount of Russian
and Chinese cargo is sent by feeders from Kaliningrad to German harbours,
where they are later dispatched all over the European Union. Providing rail
routes from the East border of the European Union to its main harbours, i.e.
from the Polish borders to the North of the Germany, Belgium and the
Netherlands, would definitely be a decisive step taken for increasing the rail
freight market share.
The current organisation of infrastructure managers RNE provides already East –
West corridors. In the case of rail links between Belgium and Poland, the
common points are even more than obvious. If are taken into account the
barriers seen by stakeholders of the rail freight market, including the lack of
business efficiency of the One-Stop-Shop, a clear conclusion can be drawn:
potential rail freight between Belgium and Poland is a major issue, and this
corridor feasibility study is one of the means to tackle it.
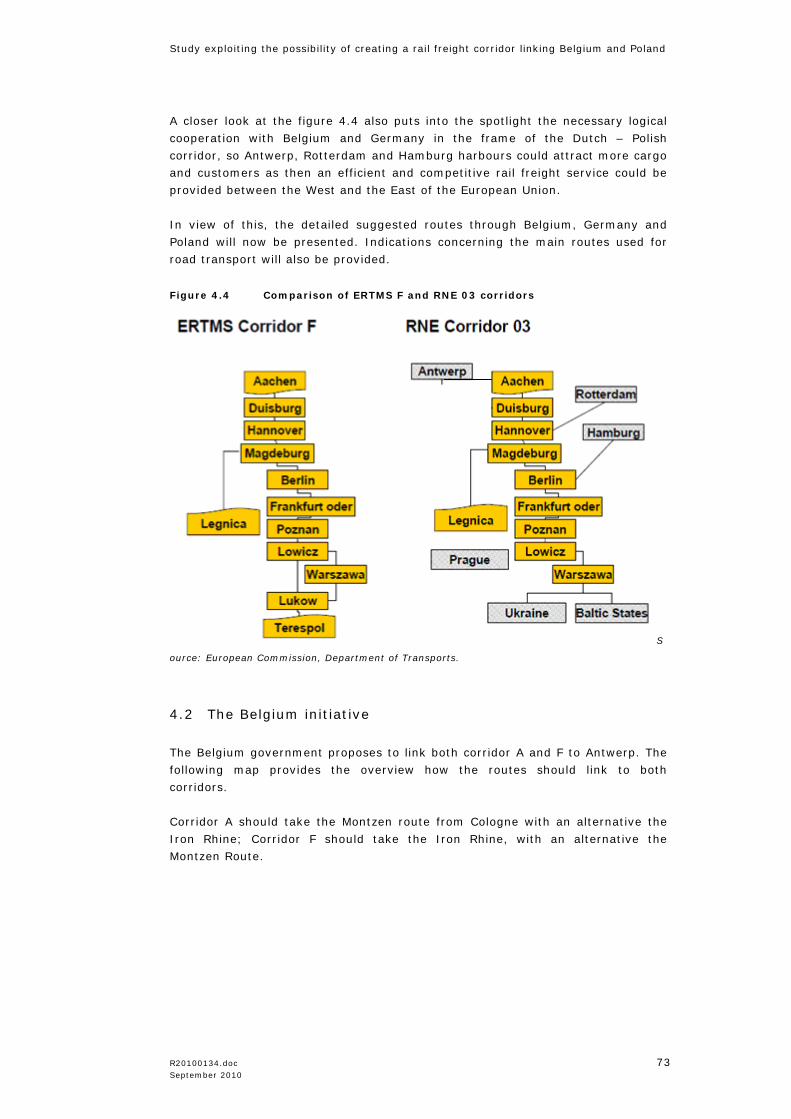
Study exploiting the possibility of creating a rail freight corridor linking Belgium and Poland
R20100134.doc 73 September 2010
A closer look at the figure 4.4 also puts into the spotlight the necessary logical
cooperation with Belgium and Germany in the frame of the Dutch – Polish
corridor, so Antwerp, Rotterdam and Hamburg harbours could attract more cargo
and customers as then an efficient and competitive rail freight service could be
provided between the West and the East of the European Union.
In view of this, the detailed suggested routes through Belgium, Germany and
Poland will now be presented. Indications concerning the main routes used for
road transport will also be provided.
Figure 4.4 Comparison of ERTMS F and RNE 03 corridors
S
ource: European Commission, Department of Transports.
4.2 The Belgium initiative
The Belgium government proposes to link both corridor A and F to Antwerp. The
following map provides the overview how the routes should link to both
corridors.
Corridor A should take the Montzen route from Cologne with an alternative the
Iron Rhine; Corridor F should take the Iron Rhine, with an alternative the
Montzen Route.
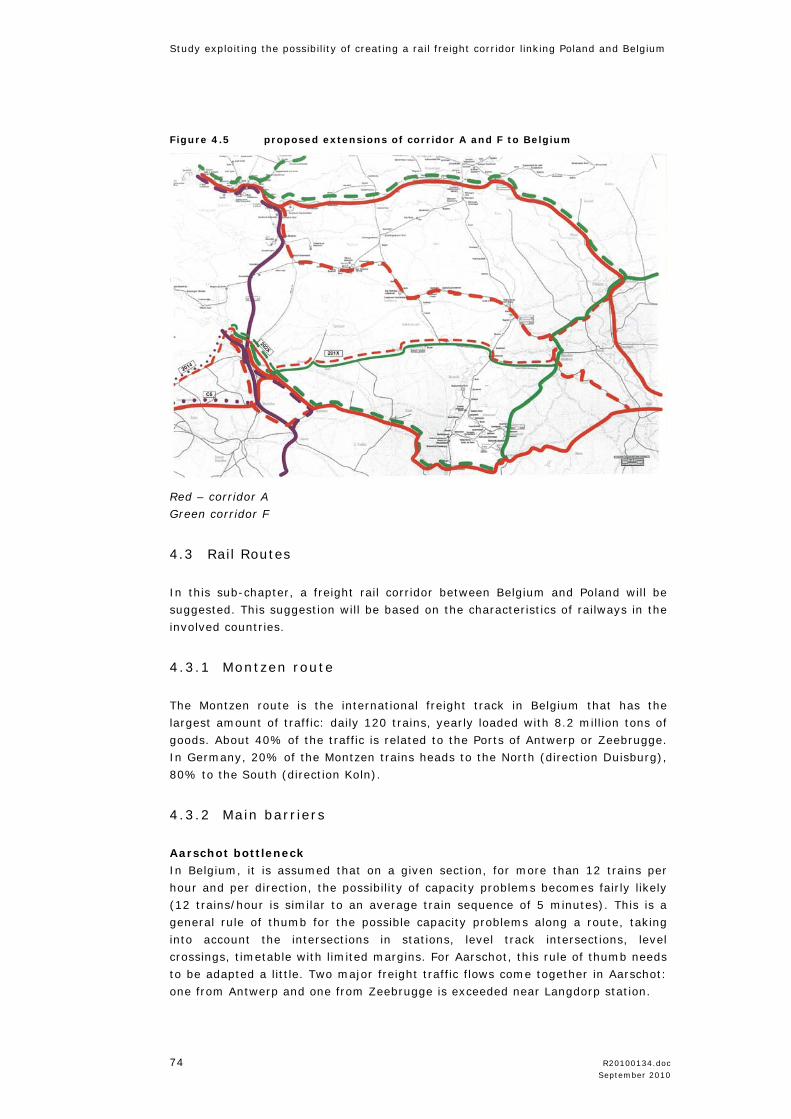
Study exploiting the possibility of creating a rail freight corridor linking Poland and Belgium
74 R20100134.doc September 2010
Figure 4.5 proposed extensions of corridor A and F to Belgium
Red – corridor A
Green corridor F
4.3 Rail Routes
In this sub-chapter, a freight rail corridor between Belgium and Poland will be
suggested. This suggestion will be based on the characteristics of railways in the
involved countries.
4.3.1 Montzen route
The Montzen route is the international freight track in Belgium that has the
largest amount of traffic: daily 120 trains, yearly loaded with 8.2 million tons of
goods. About 40% of the traffic is related to the Ports of Antwerp or Zeebrugge.
In Germany, 20% of the Montzen trains heads to the North (direction Duisburg),
80% to the South (direction Koln).
4.3.2 Main barriers
Aarschot bottleneck
In Belgium, it is assumed that on a given section, for more than 12 trains per
hour and per direction, the possibility of capacity problems becomes fairly likely
(12 trains/hour is similar to an average train sequence of 5 minutes). This is a
general rule of thumb for the possible capacity problems along a route, taking
into account the intersections in stations, level track intersections, level
crossings, timetable with limited margins. For Aarschot, this rule of thumb needs
to be adapted a little. Two major freight traffic flows come together in Aarschot:
one from Antwerp and one from Zeebrugge is exceeded near Langdorp station.
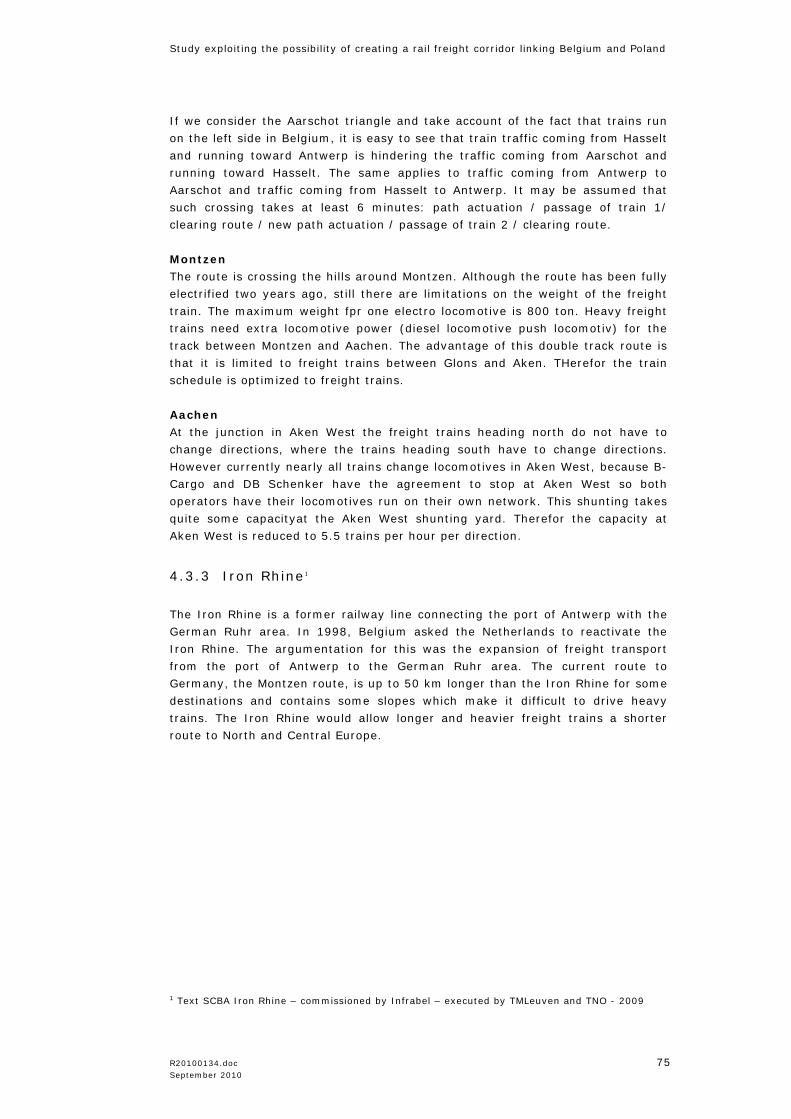
Study exploiting the possibility of creating a rail freight corridor linking Belgium and Poland
R20100134.doc 75 September 2010
If we consider the Aarschot triangle and take account of the fact that trains run
on the left side in Belgium, it is easy to see that train traffic coming from Hasselt
and running toward Antwerp is hindering the traffic coming from Aarschot and
running toward Hasselt. The same applies to traffic coming from Antwerp to
Aarschot and traffic coming from Hasselt to Antwerp. It may be assumed that
such crossing takes at least 6 minutes: path actuation / passage of train 1/
clearing route / new path actuation / passage of train 2 / clearing route.
Montzen
The route is crossing the hills around Montzen. Although the route has been fully
electrified two years ago, still there are limitations on the weight of the freight
train. The maximum weight fpr one electro locomotive is 800 ton. Heavy freight
trains need extra locomotive power (diesel locomotive push locomotiv) for the
track between Montzen and Aachen. The advantage of this double track route is
that it is limited to freight trains between Glons and Aken. THerefor the train
schedule is optimized to freight trains.
Aachen
At the junction in Aken West the freight trains heading north do not have to
change directions, where the trains heading south have to change directions.
However currently nearly all trains change locomotives in Aken West, because B-
Cargo and DB Schenker have the agreement to stop at Aken West so both
operators have their locomotives run on their own network. This shunting takes
quite some capacityat the Aken West shunting yard. Therefor the capacity at
Aken West is reduced to 5.5 trains per hour per direction.
4.3.3 Iron Rhine 1
The Iron Rhine is a former railway line connecting the port of Antwerp with the
German Ruhr area. In 1998, Belgium asked the Netherlands to reactivate the
Iron Rhine. The argumentation for this was the expansion of freight transport
from the port of Antwerp to the German Ruhr area. The current route to
Germany, the Montzen route, is up to 50 km longer than the Iron Rhine for some
destinations and contains some slopes which make it difficult to drive heavy
trains. The Iron Rhine would allow longer and heavier freight trains a shorter
route to North and Central Europe.
1 Text SCBA Iron Rhine – commissioned by Infrabel – executed by TMLeuven and TNO - 2009
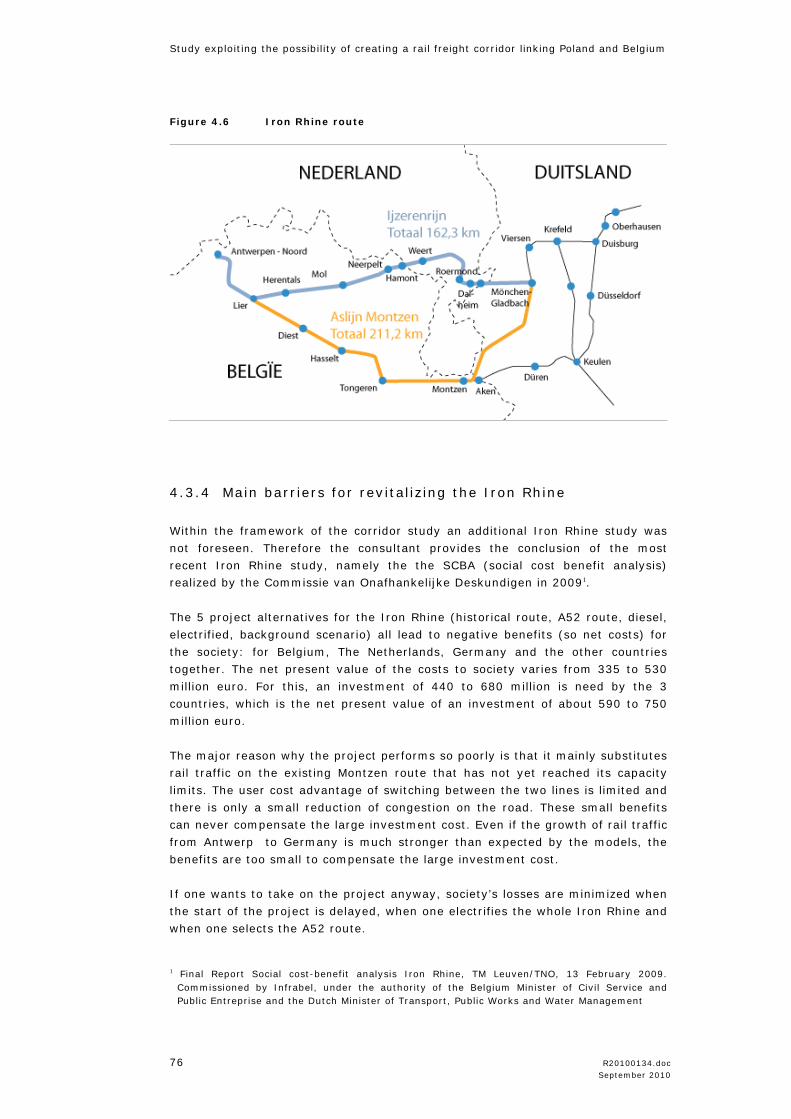
Study exploiting the possibility of creating a rail freight corridor linking Poland and Belgium
76 R20100134.doc September 2010
Figure 4.6 Iron Rhine route
4.3.4 Main barriers for revitalizing the Iron Rhine
Within the framework of the corridor study an additional Iron Rhine study was
not foreseen. Therefore the consultant provides the conclusion of the most
recent Iron Rhine study, namely the the SCBA (social cost benefit analysis)
realized by the Commissie van Onafhankelijke Deskundigen in 20091.
The 5 project alternatives for the Iron Rhine (historical route, A52 route, diesel,
electrified, background scenario) all lead to negative benefits (so net costs) for
the society: for Belgium, The Netherlands, Germany and the other countries
together. The net present value of the costs to society varies from 335 to 530
million euro. For this, an investment of 440 to 680 million is need by the 3
countries, which is the net present value of an investment of about 590 to 750
million euro.
The major reason why the project performs so poorly is that it mainly substitutes
rail traffic on the existing Montzen route that has not yet reached its capacity
limits. The user cost advantage of switching between the two lines is limited and
there is only a small reduction of congestion on the road. These small benefits
can never compensate the large investment cost. Even if the growth of rail traffic
from Antwerp to Germany is much stronger than expected by the models, the
benefits are too small to compensate the large investment cost.
If one wants to take on the project anyway, society’s losses are minimized when
the start of the project is delayed, when one electrifies the whole Iron Rhine and
when one selects the A52 route.
1 Final Report Social cost-benefit analysis Iron Rhine, TM Leuven/TNO, 13 February 2009.
Commissioned by Infrabel, under the authority of the Belgium Minister of Civil Service and Public Entreprise and the Dutch Minister of Transport, Public Works and Water Management
Study exploiting the possibility of creating a rail freight corridor linking Belgium and Poland
R20100134.doc 77 September 2010
Note that the estimate of the investment costs (480 million €) for this variant is
based on the IVV study, while DB Netz estimates the investment costs
amounting to about 500 up to 900 million €.
4.3.5 Via the Netherlands - Rotterdam - Betuwelijn or Osnabruck
This route will lead north from Antwerp to Roosendaal and Rotterdam. At
Rotterdam trains can head north east to Bad Bentheim or East to Duisburg.
Antwerpen - Rotterdam
This route has enough capacity when the High Speed Trains are running on the
new constructed High Speed line which will divert most passenger trains from
the traditional passenger route passing Roosendaal at the moment. A barrier for
taking this route is that the locomotives should be accepted for the Netherlands
as well, instead being adapted only to the Belgium and German safety and
electricity system.
The routes from Rotterdam onwards are described in detail in the Netherlands-
Poland corridor report, to summarize shortly the optional routes including their
main barriers:
Betuwelijn
This route takes the train up north from Antwerp to Rotterdam Kijfhoek, where
the train heads east taking the Betuwelijn to the Ruhr. This route has enough
capacity as the HST will divert most passenger trains from the traditional route
passing Roosendaal The freight trains have to change direction at Rotterdam
Kijfhoek, the Rotterdam shunting area, which is the entrance to the Betuwelijn.
Moreover the locomotive should be equipped with 4 safety systems and be
equipped with the 4 electricity systems as the Betuweroute is equipped with
ETCS and 25KV, therefore the locomotive needs to be equipped with the
Belgium, Dutch, Betuweroute and German system.
Via Osnabruck
This route takes the train up north from Antwerp to Rotterdam Kijfhoek– Gouda
– Breukelen – Amsterdam – Amersfoort – Apeldoorn - Deventer – Almelo - Bad
Bentheim. This route is easily congested as the capactiy is limited passing quite
some big cities in the Netherlands.
Brabantroute
This route takes the train up north from Antwerp - Tilburg – Eindhoven – Venlo
and Monchengladbach. This route is easily congested and if the train is not
routed via Koln, it should change direction in the Ruhr Area. As this is not
regarded as an alternative route, this route will not be elaborated further in
detail.
4.3.6 Comparing routes
In this paragraph the described routes are compared: the 4 routes from Antwerp
to Hannover and Hannover to Warsaw / Katowice.

Study exploiting the possibility of creating a rail freight corridor linking Poland and Belgium
78 R20100134.doc September 2010
Following tables compare the time, distance, track access charges, average
speed and cost (TAC) per km for the different routes between Antwerp and
Hannover and the routes Hannover – Warsaw and Hannover – Katowice.
Table 4.1 Comparing route Antwerp - Hannover
Antwerp – Hannover
Indicative time in hours
Km TAC
Average speed
TAC per km
Antwerp –
Aachen –
Duisburg -
Hannover
9.30 567 €1320
60 €2.32
Antwerp –
Rotterdam –
Osnabruck –
Hannover
7.45 492
€1043
66 2.11
Antwerp -
Rotterdam –
Duisburg –
Hannover
8.50 601
€1387
70
2.30
Iron Rhine (not
revitalished yet)
6.54 483
(depends on
choosen
variant)
€1139 70 €2.35
Source: RailNet Europe & NEA,. Based on following TAC: Belgium €1.40, the Netherlands €1.70,
Germany €2.70.
The three available routes show quite some differences; the route via Rotterdam
and Osnabruck is currently the fastest, the shortest and the cheapest; which will
change with the opening of revitalished Iron Rhine. The Iron Rhine is according
the schedule the fastest, shortest and nearly the cheapest route to Hannover in
future.
Especially the track access charges are (of the existing routes) much lower at
the Rotterdam-Osnabruck route than the other two current options. As track
access charges in Belgium and the Netherlands are cheaper than in Germany, it
reduces TAC costs when taking the route which is avoiding extra kilometers in
Germany. The Iron Rhine is the shortest, but, most probably, due to the higher
German access charges not the cheapest.
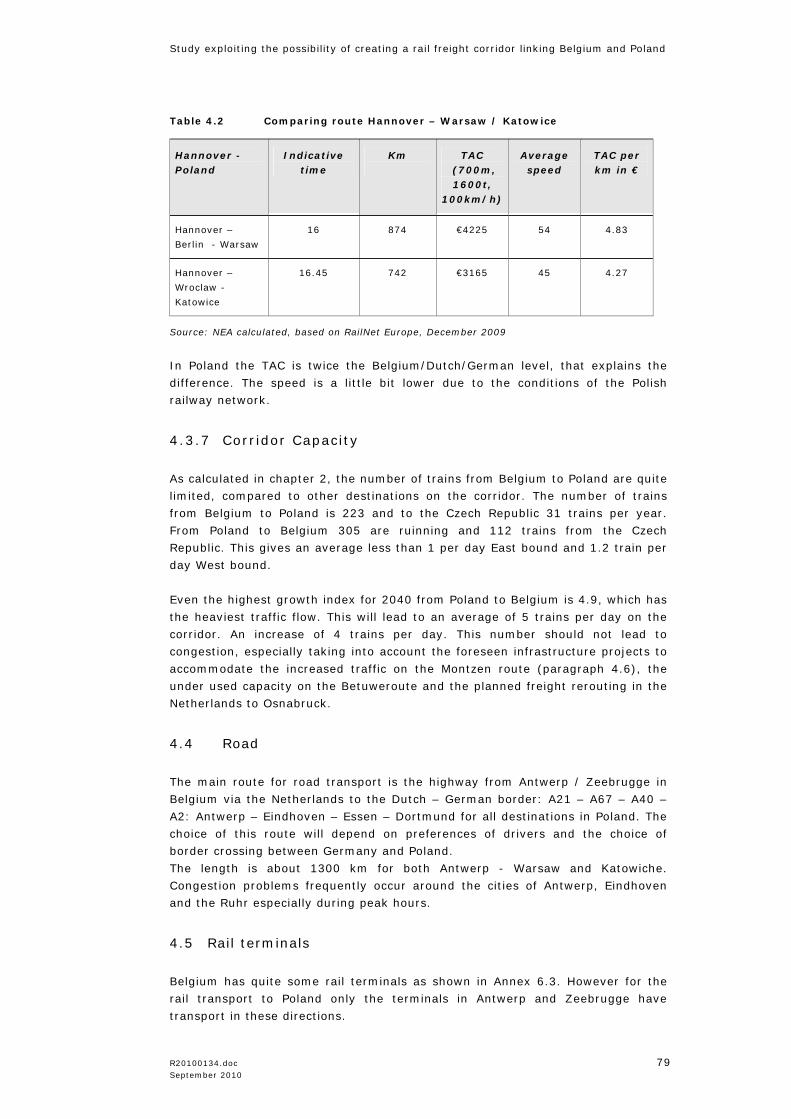
Study exploiting the possibility of creating a rail freight corridor linking Belgium and Poland
R20100134.doc 79 September 2010
Table 4.2 Comparing route Hannover – Warsaw / Katowice
Hannover - Poland
Indicative time
Km
TAC (700m, 1600t,
100km/h)
Average speed
TAC per km in €
Hannover –
Berlin - Warsaw
16 874 €4225 54 4.83
Hannover –
Wroclaw -
Katowice
16.45 742
€3165 45 4.27
Source: NEA calculated, based on RailNet Europe, December 2009
In Poland the TAC is twice the Belgium/Dutch/German level, that explains the
difference. The speed is a little bit lower due to the conditions of the Polish
railway network.
4.3.7 Corridor Capacity
As calculated in chapter 2, the number of trains from Belgium to Poland are quite
limited, compared to other destinations on the corridor. The number of trains
from Belgium to Poland is 223 and to the Czech Republic 31 trains per year.
From Poland to Belgium 305 are ruinning and 112 trains from the Czech
Republic. This gives an average less than 1 per day East bound and 1.2 train per
day West bound.
Even the highest growth index for 2040 from Poland to Belgium is 4.9, which has
the heaviest traffic flow. This will lead to an average of 5 trains per day on the
corridor. An increase of 4 trains per day. This number should not lead to
congestion, especially taking into account the foreseen infrastructure projects to
accommodate the increased traffic on the Montzen route (paragraph 4.6), the
under used capacity on the Betuweroute and the planned freight rerouting in the
Netherlands to Osnabruck.
4.4 Road
The main route for road transport is the highway from Antwerp / Zeebrugge in
Belgium via the Netherlands to the Dutch – German border: A21 – A67 – A40 –
A2: Antwerp – Eindhoven – Essen – Dortmund for all destinations in Poland. The
choice of this route will depend on preferences of drivers and the choice of
border crossing between Germany and Poland.
The length is about 1300 km for both Antwerp - Warsaw and Katowiche.
Congestion problems frequently occur around the cities of Antwerp, Eindhoven
and the Ruhr especially during peak hours.
4.5 Rail terminals
Belgium has quite some rail terminals as shown in Annex 6.3. However for the
rail transport to Poland only the terminals in Antwerp and Zeebrugge have
transport in these directions.
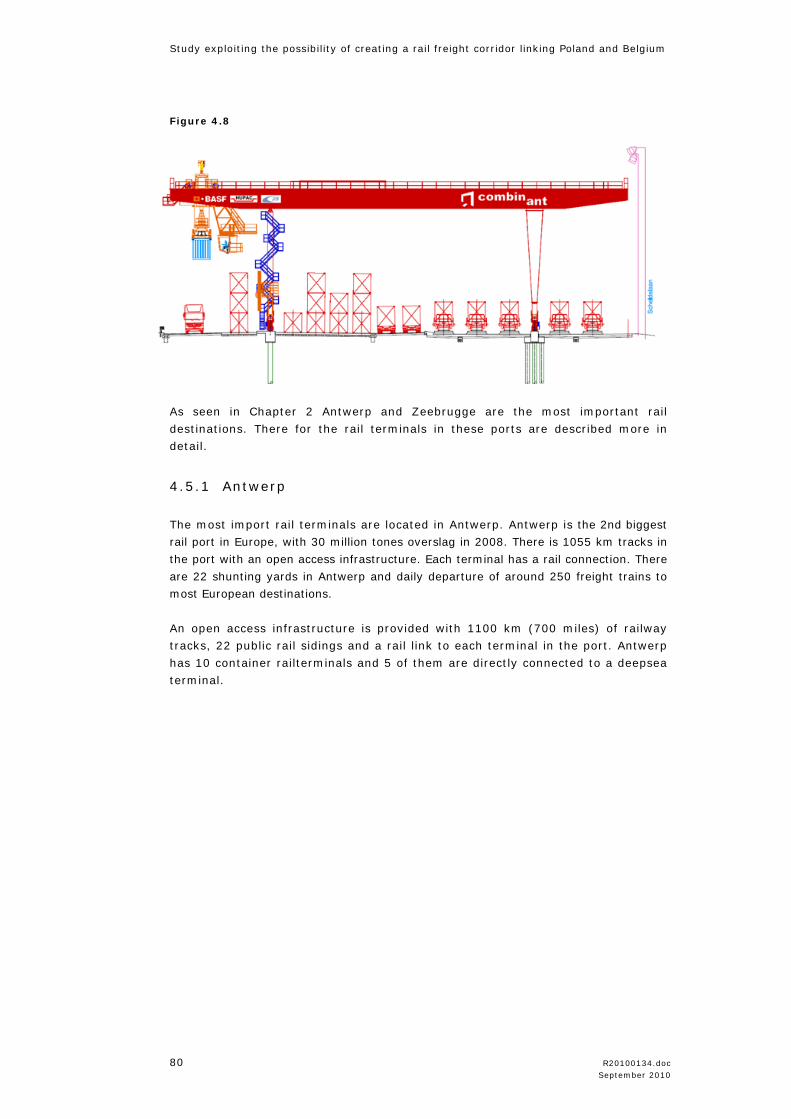
Study exploiting the possibility of creating a rail freight corridor linking Poland and Belgium
80 R20100134.doc September 2010
Figure 4.8
As seen in Chapter 2 Antwerp and Zeebrugge are the most important rail
destinations. There for the rail terminals in these ports are described more in
detail.
4.5.1 Antwerp
The most import rail terminals are located in Antwerp. Antwerp is the 2nd biggest
rail port in Europe, with 30 million tones overslag in 2008. There is 1055 km tracks in
the port with an open access infrastructure. Each terminal has a rail connection. There
are 22 shunting yards in Antwerp and daily departure of around 250 freight trains to
most European destinations.
An open access infrastructure is provided with 1100 km (700 miles) of railway
tracks, 22 public rail sidings and a rail link to each terminal in the port. Antwerp
has 10 container railterminals and 5 of them are directly connected to a deepsea
terminal.
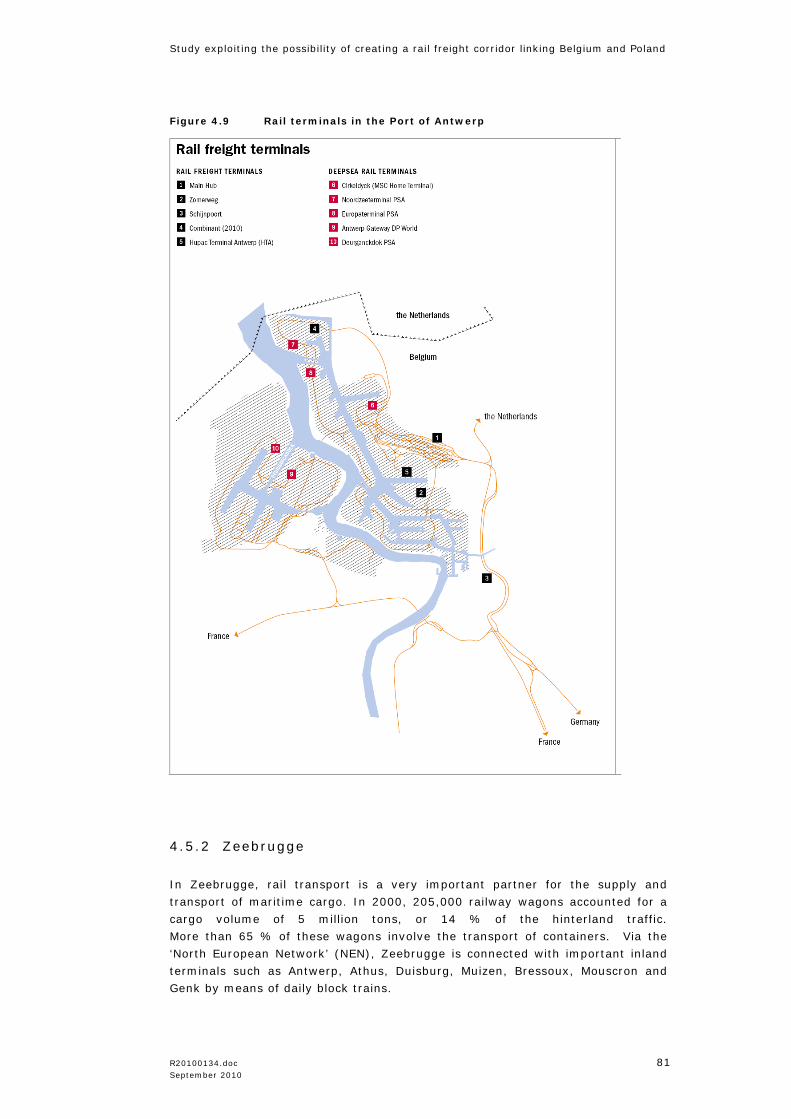
Study exploiting the possibility of creating a rail freight corridor linking Belgium and Poland
R20100134.doc 81 September 2010
Figure 4.9 Rail terminals in the Port of Antwerp
4.5.2 Zeebrugge
In Zeebrugge, rail transport is a very important partner for the supply and
transport of maritime cargo. In 2000, 205,000 railway wagons accounted for a
cargo volume of 5 million tons, or 14 % of the hinterland traffic.
More than 65 % of these wagons involve the transport of containers. Via the
‘North European Network’ (NEN), Zeebrugge is connected with important inland
terminals such as Antwerp, Athus, Duisburg, Muizen, Bressoux, Mouscron and
Genk by means of daily block trains.

Study exploiting the possibility of creating a rail freight corridor linking Poland and Belgium
82 R20100134.doc September 2010
From these railway platforms, the containers are further distributed over the
European continent. The transport of new cars represents about 40,000 wagons
(20 %), whereas combined transport (trailers on track) accounts for 20,000
movements (10 %). Furthermore, rail also plays an important role in the
transport of conventional cargo (fruit, sugar, paper pulp, pipes).
Figure 4.10 Port of Zeebrugge
4.6 Infrastructure Projects
Even though the program of this study includes the realisation of a 5 years
Action Plan which will enable to solve barriers and clear bottlenecks, the success
perspectives of the corridor also depends on how its railways infrastructure and
terminals characteristics evolution has already been planned by the relevant
market participants. Consequently, future plans by country will now be listed.
In both the port of Antwerp and the port of Zeebrugge some rail infrastructure
improvements are ongoing:
• Liefkenshoek railway tunnel
• Second railway access on the right bank
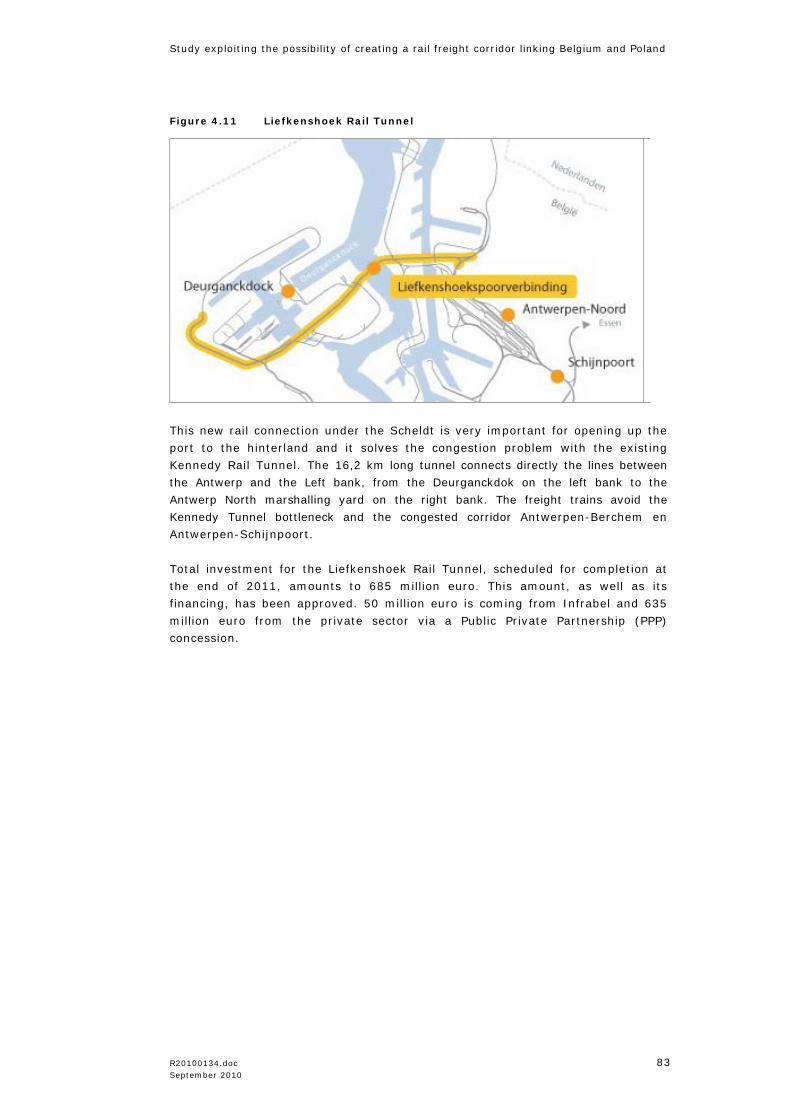
Study exploiting the possibility of creating a rail freight corridor linking Belgium and Poland
R20100134.doc 83 September 2010
Figure 4.11 Liefkenshoek Rail Tunnel
This new rail connection under the Scheldt is very important for opening up the
port to the hinterland and it solves the congestion problem with the existing
Kennedy Rail Tunnel. The 16,2 km long tunnel connects directly the lines between
the Antwerp and the Left bank, from the Deurganckdok on the left bank to the
Antwerp North marshalling yard on the right bank. The freight trains avoid the
Kennedy Tunnel bottleneck and the congested corridor Antwerpen-Berchem en
Antwerpen-Schijnpoort.
Total investment for the Liefkenshoek Rail Tunnel, scheduled for completion at
the end of 2011, amounts to 685 million euro. This amount, as well as its
financing, has been approved. 50 million euro is coming from Infrabel and 635
million euro from the private sector via a Public Private Partnership (PPP)
concession.

Study exploiting the possibility of creating a rail freight corridor linking Poland and Belgium
84 R20100134.doc September 2010
Figure 4.12 Second rail access to Aarschot and the Montzen line
A second step in increasing capacity on the Right Bank is the construction of a
second rail access. This is the continuation of the investments in the Schijn
bifurcation. The 28-km long connection extends from Antwerp-North via Ekeren,
Merksem, Deurne, Schoten, Wijnegem, Wommelgem, Ranst to the railway line
Lier-Aarschot. The construction of the second rail access is essential to the
further development of the Port of Antwerp, and will contribute to improved
mobility since more freight traffic can be handled by train.
The second rail access will be a major priority in the coming investment plan
2008-2012. Despite the elimination of the aforementioned bottlenecks on the
existing goods axis, there is still a need for a second rail access for the Port of
Antwerp in the future. In real terms Infrabel intends to construct a new double-
track goods line, line 16A, that will start at the Antwerp North marshalling yard
in Lier and connect to line 16 with a junction to line 15 (Iron Rhine). For this
project various feasibility studies and technical preliminary studies have already
been conducted at TUC Rail. Various alternatives are still being examined for this
new track route, to have a total length of approx. 25 km at present.)
4.6.1 Zeebrugge
As rail traffic continues to grow, the Port Authority pleads for the construction of
a third track between Zeebrugge and Bruges and for the extension of the section
between Bruges and Ghent by a third and fourth track. In the port itself the
marshalling yard was modernized for the efficient arrangement of wagons into
long block trains.
Study exploiting the possibility of creating a rail freight corridor linking Belgium and Poland
R20100134.doc 85 September 2010
The Zeebruges-Formation station will therefore undergo a modernisation of the
station infrastructure and expansion of its capacity. An additional siding of 16 to
24 tracks will be added from arrival to departure while sidings A (9 tracks) and B
(19 tracks), currently separated by the main lines, will be merged into one siding
of 28 yard tracks. A new signalling box will also be constructed (as part of the
plan to integrate the boxes). This work will improve the safety and efficiency of
port installations.
4.7 Conclusions
This chapter has been presenting the features of the Belgium railways in their
relations to Poland. For each route the advantages and disadvantages are
described including the bottlenecks. The main terminals are described including
some caracteristics and the most important infrastructure projects relevant to
the corridor Belgium – Poland are presented.
An overwiew is provided between the main alternative routes from Antwerp to
Hannover and from Hannover to Poland. Following routes were considered:
• Antwerp – Montzen – Hannover
• Antwerp – Rotterdam – Duisburg – Hannover
• Antwerp – Rotterdam – Osnabruck – Hannover
• Antwerp – Duisburg – Hannover (Iron Rhine)
Based on some categories like speed, distance in kilometers and track acces
charges the revitalished Iron Rhine would be the most optimal, currently the
route via Rotterdam and Bad Bentheim is most optimal. However for this last
route the locomotive has to been adopted with the Dutch safety and energy
system. Moreover, the route can coop with the current level of freight trains, but
faces congestion when traffic rises.
The Anwerp – Montzen – Hannover route is or will be included in the existing and
planned to be implemented European transport rail services corridors such as
ERTMS corridors, TEN-T corridors or RailNetEurope (RNE corridor 3).
The proposed revitalished Iron Rhine Railway line is a future alternative to
Poland being the shortest route to Hannover and much cheaper than the Montzen
route.
In order to allow the efficient implementation of the transport of goods in the
planned corridors, appropriate actions should be proposed and laid down. These
activities should be coordinated one another and should be associated with the
adaptation and adequate maintenance of the railway and terminal
infrastructures.

Study exploiting the possibility of creating a rail freight corridor linking Belgium and Poland
R20100134.doc 87 September 2010
5 References
• Bundesamt für Güterverkehr (2010), Marktbeobachtung Güterverkehr, Ost-
West Eisenbahngüterverkehr
• Chen, M, ea (2007), Vervoersprognose Ijzeren Rijn – Traffic Forecasts Iron
Rhine
• European Commission (2001), White Paper
• European Commission (2006), Keep Europe Moving
• FOD Economie, K.M.O, Middenstand en Energie (2010), Analyse van het
Goederenverkeer per spoor in België
• Hertveldt, B. ea (2009), Langetermijnvooruitzichten voor transport in
België: referentiescenario, Federaal Planbureau België
• Infrabel (2008) Network Statement 2008
• TNO studie (2008), Scenario calculations Rail freight transport on the
corridor Netherlands – Poland.
Websites
• http://energy.jrc.ec.europa.eu/transtools/
• www.railcargo.nl
• www.interferryboats.be
• www.bueker.net
• www.b-rail.be

Study exploiting the possibility of creating a rail freight corridor linking Belgium and Poland
R20100134.doc 89 September 2010
6 Appendix
6.1 Traction providers and rail operators in Belgium
Maritime rail terminal operators at Port of Antwerp
• Noordzeeterminal PSA
• Europaterminal PSA
• Deuganck Terminal PSA
• Cirkeldyk (MSC Home Terminal)
• Antwerp Gateway DP World
Main rail-road terminals at Port of Antwerp
• Hupac Terminal Antwerpen (HTA);
• Mainhub (IFB) (biggest terminal in Antwerp);
• Terminal Zomerweg (IFB);
• Combined Terminal Antwerp (Combinant) (BASF, Hupac, IFB);
• Antwerpen-Schijnpoort (IFB); Rail operators active in the Belgium market
• IFB (BE)
• Xpedys (BE)
• Rail Force (BE)
• Quadrum Raillogistics (BE)
• Ewals Cargo Care
• HUPAC Intermodal (CH)
• MSC Medlog (CH or BE): only for MSC maritime containers
• Naviland Cargo (FR)
• Rail Link Europe (FR)
• Kombiverkehr (DE) Traction providers active and have safety certificates to operate in the Belgium market for the moment
• SNCB-Logistics (BE)
• Crossrail (CH or BE)
• Fret SNCF Benelux (Captrain Benelux)
• Veolia Cargo Nederland (NL) (Captrain Benelux)
• Trainsport (BE) (on FR, BE, DE routes)
• DB Schenker Rail Nederland (NL)
• ERS Railways (NL)
• ACTS (NL)
• Rotterdam Rail Feeding (RFF) (NL)
• CFL Cargo (LUX)
• SNCF (FR) (Captrain Benelux)
Study exploiting the possibility of creating a rail freight corridor linking Poland and Belgium
90 R20100134.doc September 2010
6.2 List of Interviews
Personal interviews
Organization Interviewee
1. B-cargo Jan Wets
2. Captrain Martijn Loois
3. DB Schenker rail Benelux Arend Sonneveld
4. FOD Mobiliteit en Vervoer, Directie Spoorvervoer Joannes Peeters
5. InterFerryBoats Ghislain Bartholomé
6. Infrabel Guy Vernieuwe
7. Port of Antwerp Helen De Wachter
8. Quadrum Patrick Wallays
9. Railforce Daniel Vanparijs
Telephone interviews
Organization Interviewee
1. Hupac Dirk Fleerakkers
2. Kombiverkehr (Optimodal) Wouter van Dijk
3. Xpedys Lieven van den Berge
6.3 A complete list of terminals in Belgium
Renory
Antwerpen Cirkeldyck
Antwerpen Mainhub
Antwerpen Zomerweg
Antwerp Gateway Terminal
Hupac Terminal Antwerpen
Combinant Athus
Brussels Terminal Intermodal
Charleroi logistics center
Genk Euroterminal
Haven Genk
Liege Logistics Intermodal
Dry Port Mouscron / Lille International
Dry Port Muizen
Oostende Port
L.A.R
Container Handling Zeebrugge (CHZ)
APM Terminals Zeebrugge
Zeebrugge Cobelfret
Zeebrugge P&O Ferries
Study exploiting the possibility of creating a rail freight corridor linking Belgium and Poland
R20100134.doc 91 September 2010
6.4 Rail maps
ERTMS and TEN – T intermodal priority projects map.
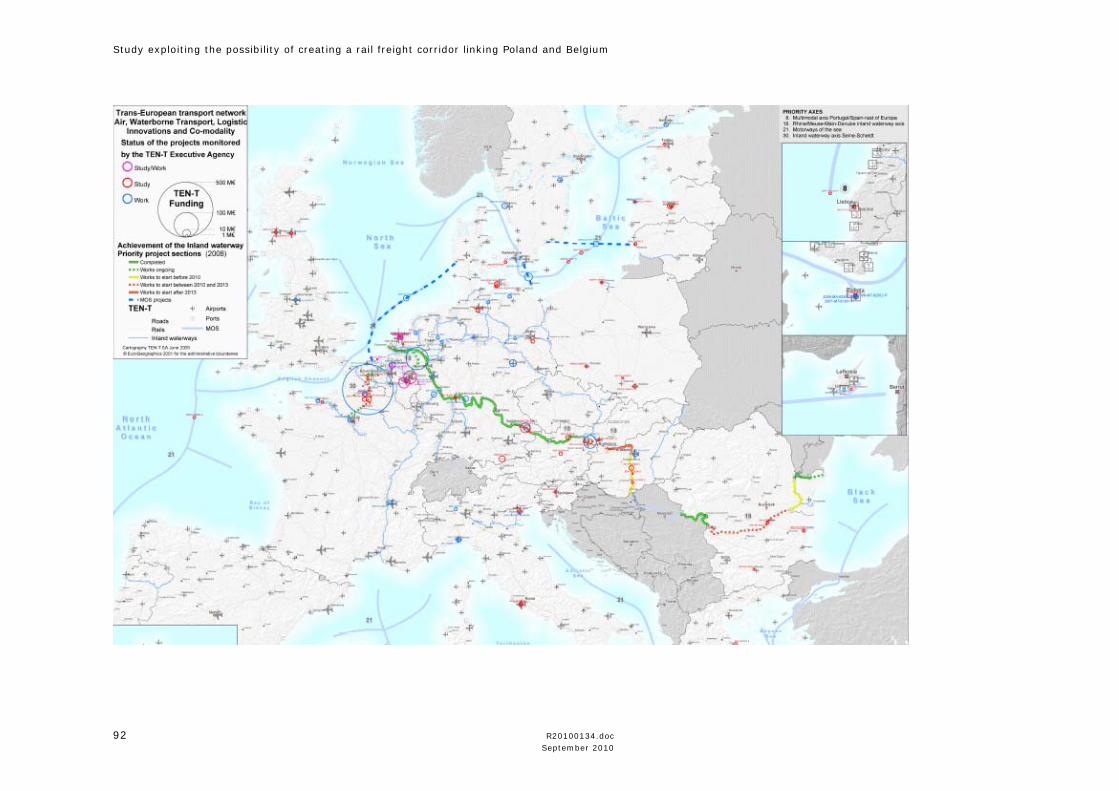
Study exploiting the possibility of creating a rail freight corridor linking Poland and Belgium
92 R20100134.doc September 2010
Source: TEN – T EA, 2009
ERTMS and TEN – T priority projects map.

Study exploiting the possibility of creating a rail freight corridor linking Belgium and Poland
R20100134.doc 93 September 2010
Source: TEN – T EA, 2009
Study exploiting the possibility of creating a rail freight corridor linking Poland and Belgium
94 R20100134.doc September 2010
TEN – T projects and international connections.
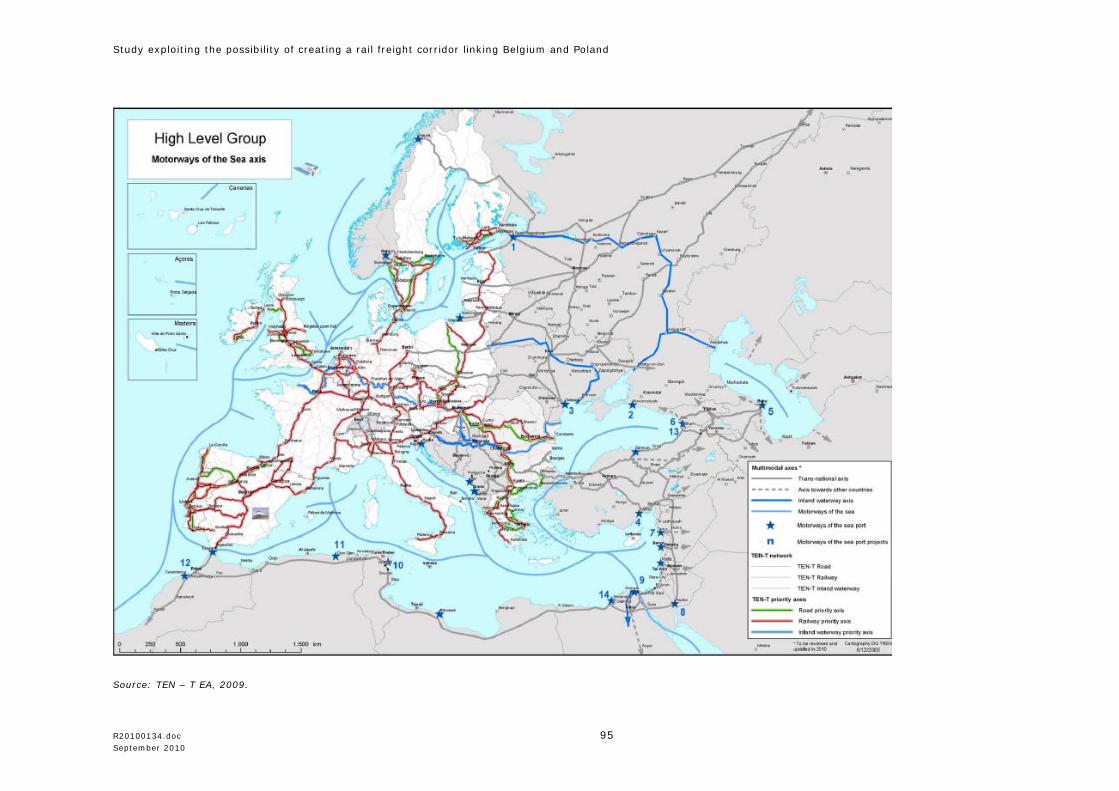
Study exploiting the possibility of creating a rail freight corridor linking Belgium and Poland
R20100134.doc 95 September 2010
Source: TEN – T EA, 2009.
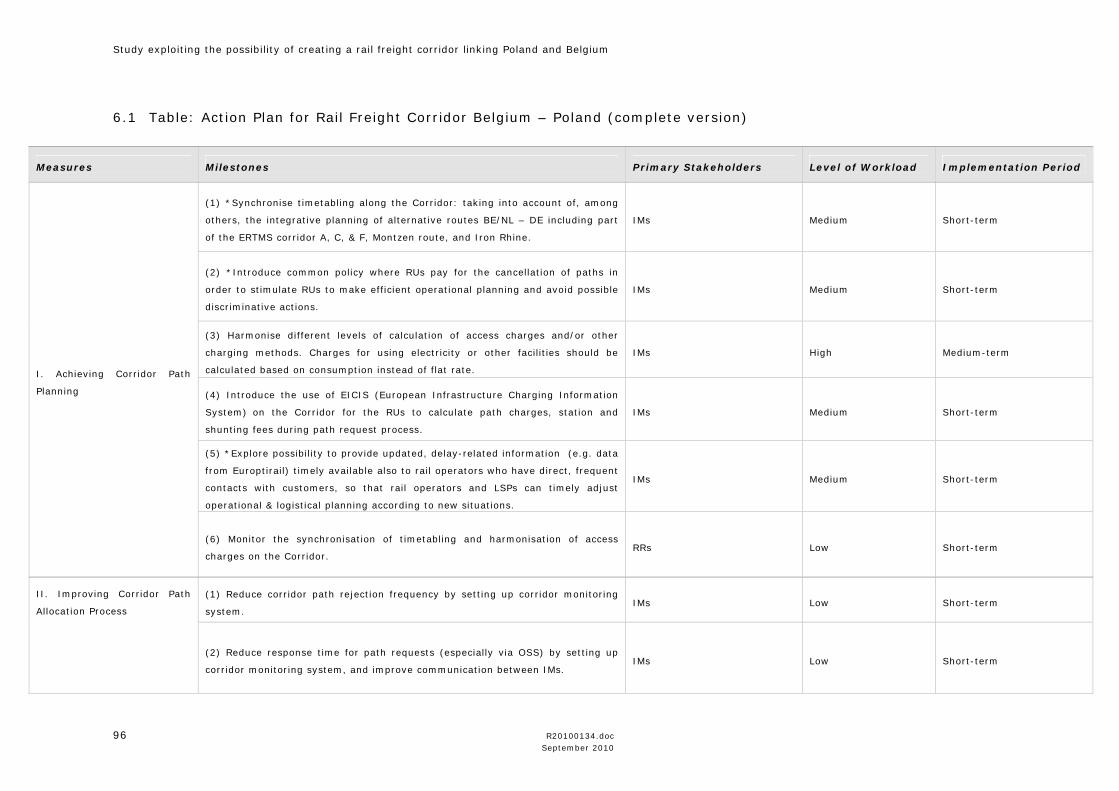
Study exploiting the possibility of creating a rail freight corridor linking Poland and Belgium
96 R20100134.doc September 2010
6.1 Table: Action Plan for Rail Freight Corridor Belgium – Poland (complete version)
Measures Milestones Primary Stakeholders Level of Workload Implementation Period
(1) *Synchronise timetabling along the Corridor: taking into account of, among
others, the integrative planning of alternative routes BE/NL – DE including part
of the ERTMS corridor A, C, & F, Montzen route, and Iron Rhine.
IMs Medium Short-term
(2) *Introduce common policy where RUs pay for the cancellation of paths in
order to stimulate RUs to make efficient operational planning and avoid possible
discriminative actions.
IMs Medium Short-term
(3) Harmonise different levels of calculation of access charges and/or other
charging methods. Charges for using electricity or other facilities should be
calculated based on consumption instead of flat rate.
IMs High Medium-term
(4) Introduce the use of EICIS (European Infrastructure Charging Information
System) on the Corridor for the RUs to calculate path charges, station and
shunting fees during path request process.
IMs Medium Short-term
(5) *Explore possibility to provide updated, delay-related information (e.g. data
from Europtirail) timely available also to rail operators who have direct, frequent
contacts with customers, so that rail operators and LSPs can timely adjust
operational & logistical planning according to new situations.
IMs Medium Short-term
I. Achieving Corridor Path
Planning
(6) Monitor the synchronisation of timetabling and harmonisation of access
charges on the Corridor. RRs Low Short-term
(1) Reduce corridor path rejection frequency by setting up corridor monitoring
system. IMs Low Short-term
II. Improving Corridor Path
Allocation Process
(2) Reduce response time for path requests (especially via OSS) by setting up
corridor monitoring system, and improve communication between IMs. IMs Low Short-term
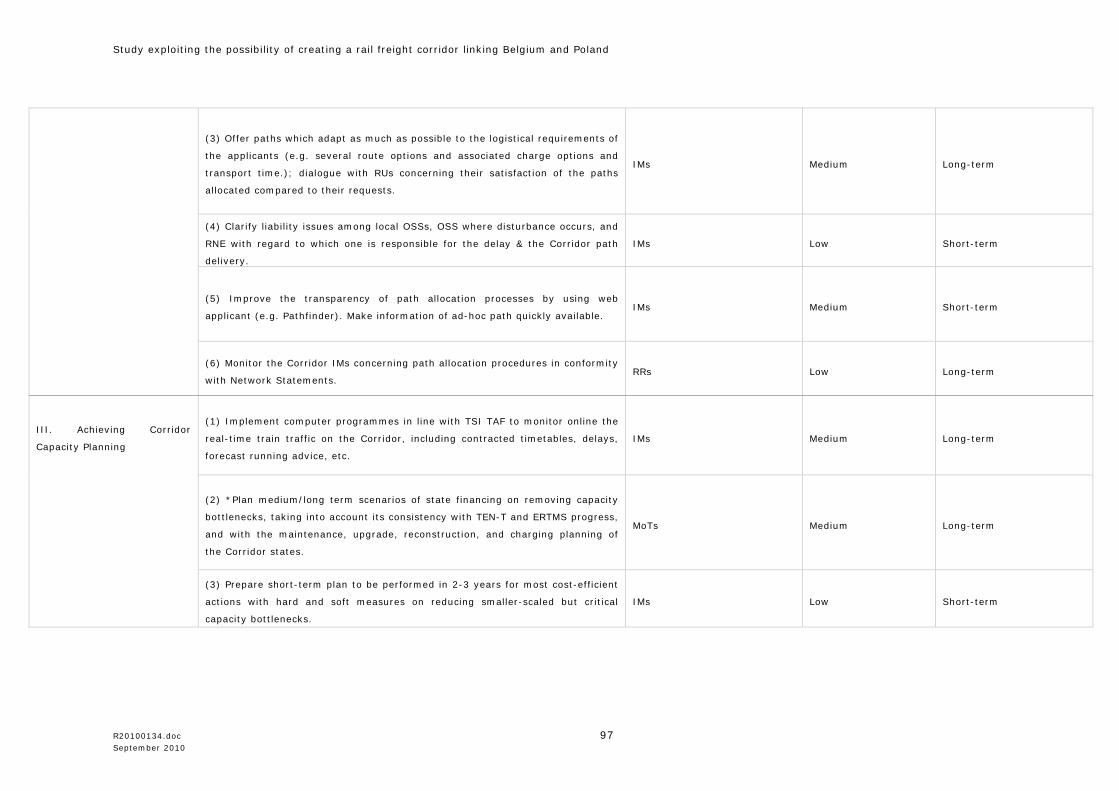
Study exploiting the possibility of creating a rail freight corridor linking Belgium and Poland
R20100134.doc 97 September 2010
(3) Offer paths which adapt as much as possible to the logistical requirements of
the applicants (e.g. several route options and associated charge options and
transport time.); dialogue with RUs concerning their satisfaction of the paths
allocated compared to their requests.
IMs Medium Long-term
(4) Clarify liability issues among local OSSs, OSS where disturbance occurs, and
RNE with regard to which one is responsible for the delay & the Corridor path
delivery.
IMs Low Short-term
(5) Improve the transparency of path allocation processes by using web
applicant (e.g. Pathfinder). Make information of ad-hoc path quickly available. IMs Medium Short-term
(6) Monitor the Corridor IMs concerning path allocation procedures in conformity
with Network Statements. RRs Low Long-term
(1) Implement computer programmes in line with TSI TAF to monitor online the
real-time train traffic on the Corridor, including contracted timetables, delays,
forecast running advice, etc.
IMs Medium Long-term
(2) *Plan medium/long term scenarios of state financing on removing capacity
bottlenecks, taking into account its consistency with TEN-T and ERTMS progress,
and with the maintenance, upgrade, reconstruction, and charging planning of
the Corridor states.
MoTs Medium Long-term
III. Achieving Corridor
Capacity Planning
(3) Prepare short-term plan to be performed in 2-3 years for most cost-efficient
actions with hard and soft measures on reducing smaller-scaled but critical
capacity bottlenecks.
IMs Low Short-term
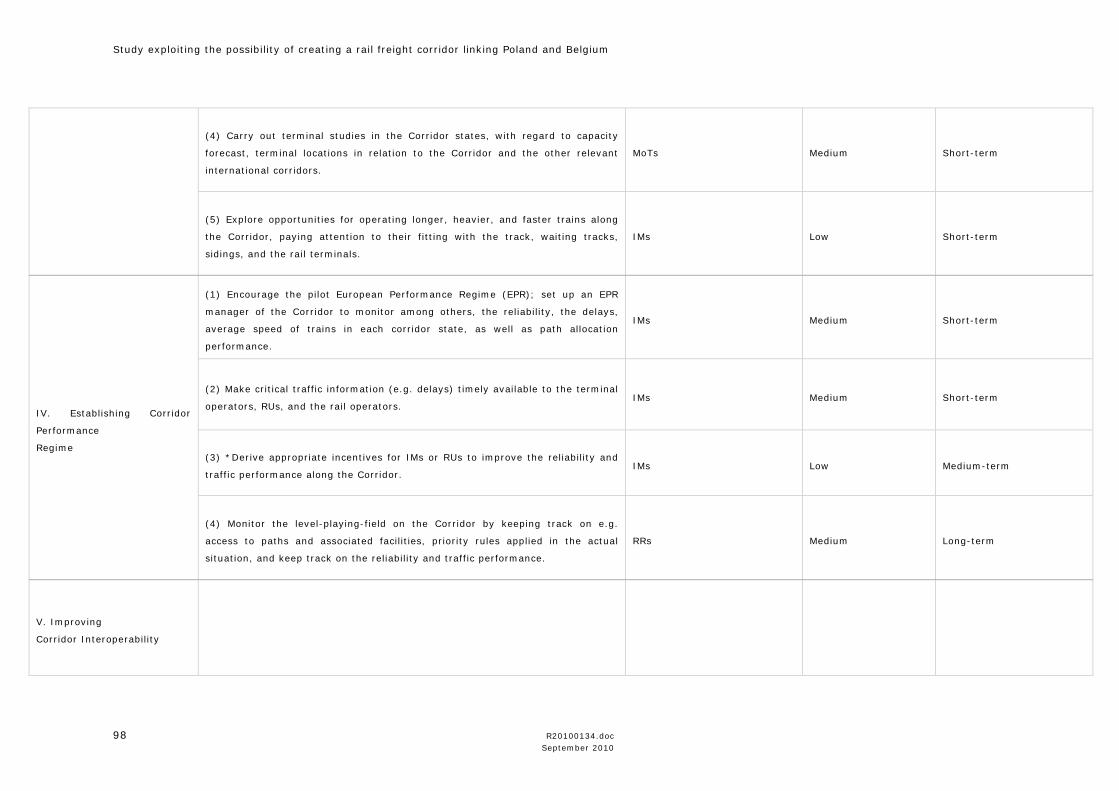
Study exploiting the possibility of creating a rail freight corridor linking Poland and Belgium
98 R20100134.doc September 2010
(4) Carry out terminal studies in the Corridor states, with regard to capacity
forecast, terminal locations in relation to the Corridor and the other relevant
international corridors.
MoTs Medium Short-term
(5) Explore opportunities for operating longer, heavier, and faster trains along
the Corridor, paying attention to their fitting with the track, waiting tracks,
sidings, and the rail terminals.
IMs Low Short-term
(1) Encourage the pilot European Performance Regime (EPR); set up an EPR
manager of the Corridor to monitor among others, the reliability, the delays,
average speed of trains in each corridor state, as well as path allocation
performance.
IMs Medium Short-term
(2) Make critical traffic information (e.g. delays) timely available to the terminal
operators, RUs, and the rail operators. IMs Medium Short-term
(3) *Derive appropriate incentives for IMs or RUs to improve the reliability and
traffic performance along the Corridor. IMs Low Medium-term
IV. Establishing Corridor
Performance
Regime
(4) Monitor the level-playing-field on the Corridor by keeping track on e.g.
access to paths and associated facilities, priority rules applied in the actual
situation, and keep track on the reliability and traffic performance.
RRs Medium Long-term
V. Improving
Corridor Interoperability
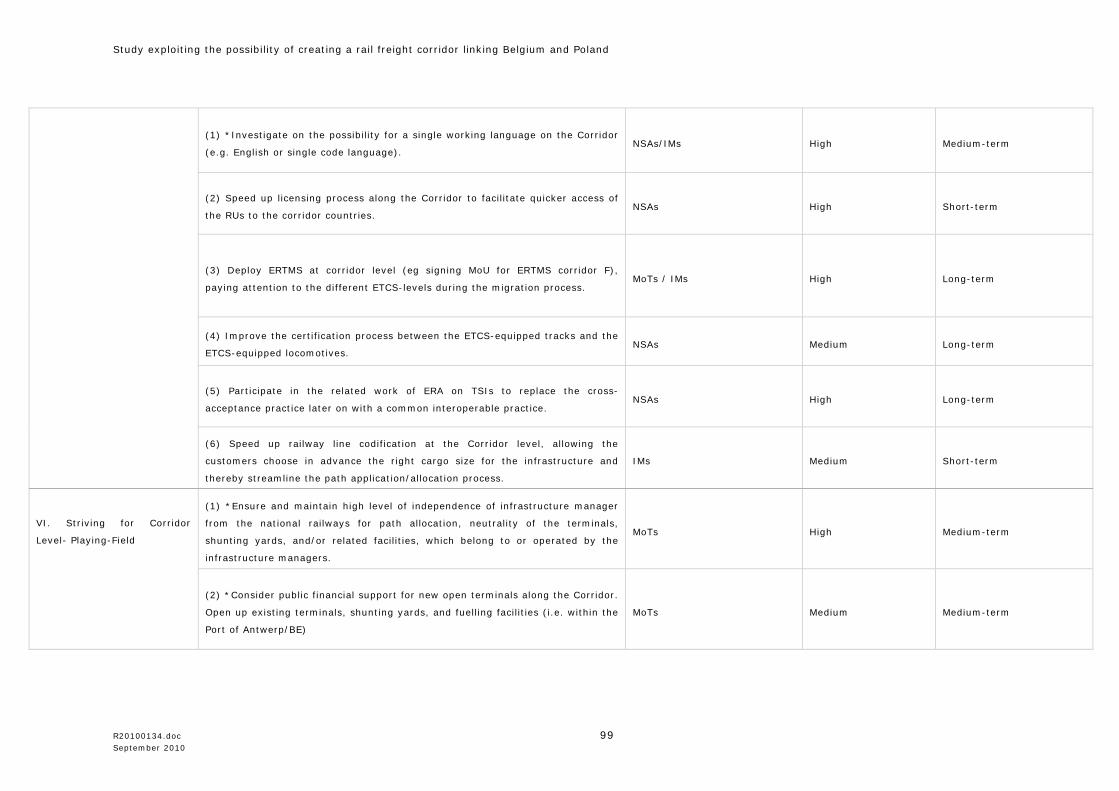
Study exploiting the possibility of creating a rail freight corridor linking Belgium and Poland
R20100134.doc 99 September 2010
(1) *Investigate on the possibility for a single working language on the Corridor
(e.g. English or single code language). NSAs/IMs High Medium-term
(2) Speed up licensing process along the Corridor to facilitate quicker access of
the RUs to the corridor countries. NSAs High Short-term
(3) Deploy ERTMS at corridor level (eg signing MoU for ERTMS corridor F),
paying attention to the different ETCS-levels during the migration process. MoTs / IMs High Long-term
(4) Improve the certification process between the ETCS-equipped tracks and the
ETCS-equipped locomotives. NSAs Medium Long-term
(5) Participate in the related work of ERA on TSIs to replace the cross-
acceptance practice later on with a common interoperable practice. NSAs High Long-term
(6) Speed up railway line codification at the Corridor level, allowing the
customers choose in advance the right cargo size for the infrastructure and
thereby streamline the path application/allocation process.
IMs Medium Short-term
(1) *Ensure and maintain high level of independence of infrastructure manager
from the national railways for path allocation, neutrality of the terminals,
shunting yards, and/or related facilities, which belong to or operated by the
infrastructure managers.
MoTs High Medium-term VI. Striving for Corridor
Level- Playing-Field
(2) *Consider public financial support for new open terminals along the Corridor.
Open up existing terminals, shunting yards, and fuelling facilities (i.e. within the
Port of Antwerp/BE)
MoTs Medium Medium-term
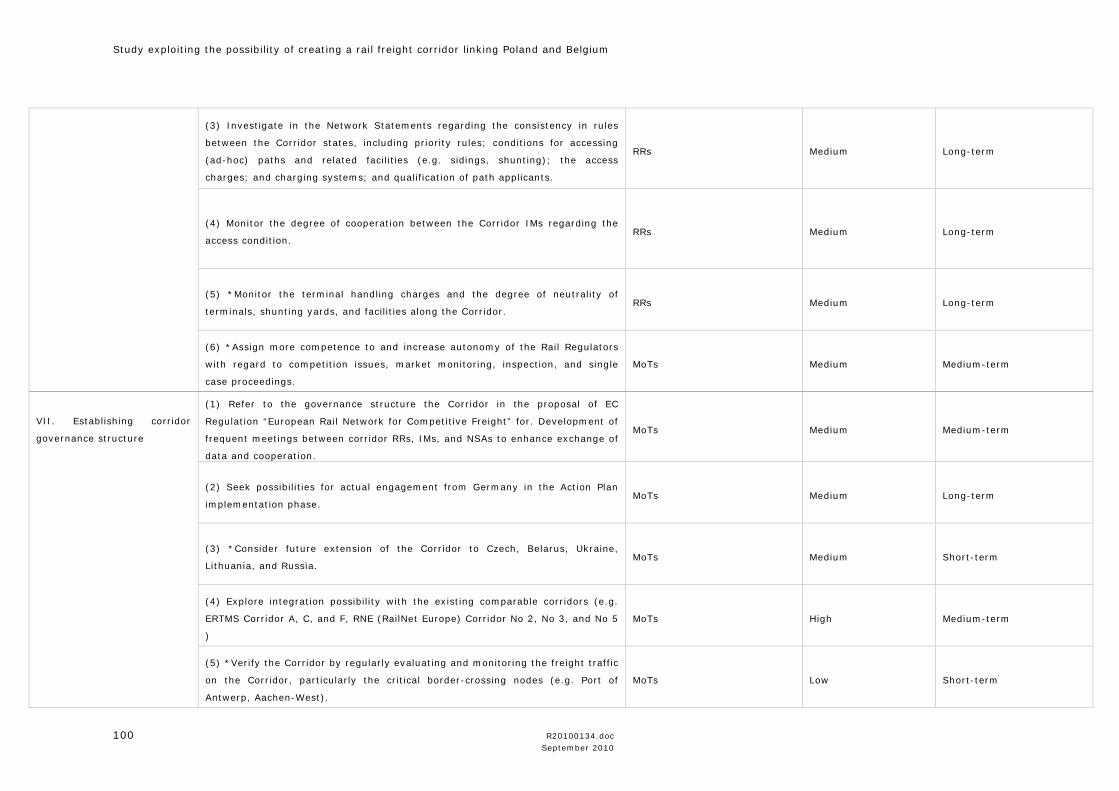
Study exploiting the possibility of creating a rail freight corridor linking Poland and Belgium
100 R20100134.doc September 2010
(3) Investigate in the Network Statements regarding the consistency in rules
between the Corridor states, including priority rules; conditions for accessing
(ad-hoc) paths and related facilities (e.g. sidings, shunting); the access
charges; and charging systems; and qualification of path applicants.
RRs Medium Long-term
(4) Monitor the degree of cooperation between the Corridor IMs regarding the
access condition. RRs Medium Long-term
(5) *Monitor the terminal handling charges and the degree of neutrality of
terminals, shunting yards, and facilities along the Corridor. RRs Medium Long-term
(6) *Assign more competence to and increase autonomy of the Rail Regulators
with regard to competition issues, market monitoring, inspection, and single
case proceedings.
MoTs Medium Medium-term
(1) Refer to the governance structure the Corridor in the proposal of EC
Regulation “European Rail Network for Competitive Freight” for. Development of
frequent meetings between corridor RRs, IMs, and NSAs to enhance exchange of
data and cooperation.
MoTs Medium Medium-term
(2) Seek possibilities for actual engagement from Germany in the Action Plan
implementation phase. MoTs Medium Long-term
(3) *Consider future extension of the Corridor to Czech, Belarus, Ukraine,
Lithuania, and Russia. MoTs Medium Short-term
(4) Explore integration possibility with the existing comparable corridors (e.g.
ERTMS Corridor A, C, and F, RNE (RailNet Europe) Corridor No 2, No 3, and No 5
)
MoTs High Medium-term
VII. Establishing corridor
governance structure
(5) *Verify the Corridor by regularly evaluating and monitoring the freight traffic
on the Corridor, particularly the critical border-crossing nodes (e.g. Port of
Antwerp, Aachen-West).
MoTs Low Short-term

Study exploiting the possibility of creating a rail freight corridor linking Belgium and Poland
R20100134.doc 101 September 2010
(6) Be aware of the measures in this Action Plan and the measures in the
relevant existing legal acts (e.g. the three railway packages, interoperability
directive) and the forthcoming legal act. (i.e. on European Rail Network for
Competitive Freight).
MoTs Low Long-term
(7) *Cooperate with other Rail Regulators along the Corridor to deal with issues
and complaints, provide advices for national governments and the EC on certain
legal acts and/or operational/technical requirements.
RRs Low Long-term
Study exploiting the possibility of creating a rail freight corridor linking Poland and Belgium
102 R20100134.doc September 2010
6.4.1 Elaboration of the action plan
The measures and the milestones in the Action Plan (complete version) are elaborated in the following section.
I. Achieving Corridor Path Planning
Measure “Achieving Corridor Path Planning” concerns a set of seven milestones that deals with ex-ante planning for the use of paths.
(1) The synchronisation of timetabling among corridor infrastructure managers concerns exploring opportunities for developing cross-border
timetabling on the Corridor, like the catalogue path developed by RNE for the RNE corridors. A common deadline of annual timetable delivery by
all corridor infrastructure managers can be considered. Here, attention needs to be drawn regarding consistencies with:
(a.) the progress on developing renowned corridors (e.g. ERTMS Corridor A, B & F; RNE Corridor C02, C03, & C05; Principle routes of freight
corridors No.1, No.2, & No.8; TEN-T rail freight axes No 5 and No 23; TERFN network where BE, NL and DE are concerned; Pan European
Corridors No 2 and No 3);
(b.) the integrative planning of several alternative routes on border-crossing stretch BE/NL – DE on e.g. ERTMS Corridors A, B, & F; RNE
Corridors C02, C03 & C05; Principle routes of freight corridors No.1, No.2, & No.8; the Iron Rhein route; and the Montzen route;
(c.) the differences between corridor states regarding track maintenance planning and priority rules.
(2) Extend the existing Belgium policy to the corridor-wide policy, where railway undertakings are subject to a fee in case it cancels – outside of
the official annual path application phase and path scheduling amendments phases (6 times/yr) – the train-paths it has requested earlier. The
objective is to stimulate railway undertakings to make better operational planning and to avoid possible discrimination by preoccupying many
unnecessary paths in order to keep the competitors out of the market.
(3) Harmonise the level of access charges and/or the charging methods between corridor infrastructure managers. The fact that access charges
differ by country sometimes cause the railway companies to choose suboptimal route just to avoid paying higher access fees at certain country.
Besides, expensive charges make it hard for price-sensitive shippers and LSPs to opt for rail. Striving for a harmonised access charges along a
defined corridor shall increase the attractiveness of this corridor and competitiveness in rail.
Study exploiting the possibility of creating a rail freight corridor linking Belgium and Poland
R20100134.doc 103 September 2010
(4) Introduce corridor-wide infrastructure charging information system (e.g. EICIS – European Infrastructure Charging Information System,
developed by RNE), which calculates the charges of paths, stations, shunting, or other track related services on a particular corridor, and
publicise these information to all railway undertakings. This system increases the transparency of charging process, prevents possible
discrimination against private undertakings, and contributes to the level-playing-field in the rail market.
(5) Explore possibility of providing the updated information concerning a running service including, among others, timetables of path and of
shunting yards and stations, real-time train movements (e.g. data from Europtirail applied in Belgium) timely available, not only to the railway
undertakings, but also to the rail operators that have direct & frequent contact with the end customers (e.g. shippers, LSPs) who need to know,
especially when delays occurs, the locations of their trains, wagons and cargos; the remaining duration; and the estimated arrival time. This
allows both rail operators and end customers to timely adjust their operational and logistical planning according to the updated situations. The
service performance of rail operator is also improved.
(6) Monitor the process of synchronising the timetabling and process of harmonising the charges on the Corridor in the Network Statements of
the Corridor states.
Study exploiting the possibility of creating a rail freight corridor linking Poland and Belgium
104 R20100134.doc September 2010
II. Improving Corridor Path Allocation Process
Measure “Improving Corridor Path Allocation Process” consists of six milestones. It aims at improving the efficiency and coordination during
path allocation, and the quality of paths allocated to the applicants.
(1) Reduce path rejection frequency along the Corridor by setting up a monitoring system.
(2) Reduce the time to respond path requests by setting up a monitoring system. Attention needs to be drawn regarding ad-hoc path requests
and the proper functioning of OSS: it takes generally much longer time to respond to requests via OSS than via individual infrastructure
managers. Communication between infrastructure managers is essential to make OSS service functioning.
(3) Offer the paths that adapt as much as possible the logistical requirements of the applicants. For example, if possible the infrastructure
manager may offer the applicants a few route options and thereby with different routes, access charges and transport time that associated to
the routes. Besides, dialogues with the undertakings concerning their satisfaction on the paths allocated as compared to the path they
requested may be needed to improve the level of path allocation service.
(4) Clarify liability matters between the Corridor infrastructure managers and RNE with regard to corridor path allocation. The railway
undertaking needs to send the ‘Path Order Form’ with its request details to both the local OSS and to the RNE. In case delay occurs, whether it
is the RNE, the local OSS, or the OSS of the Corridor state where disturbance takes place, that is responsible for the delay and for the delivery
of the Corridor path should be clarified.
Besides, either RNE or local OSS is suggested to make information in the ‘Path Order Form’ available to the rail regulators for possible
investigation concerning competition issues.
(5) Improve the transparency of path allocation processes by using e.g. pathfinder, a web application provided by RNE to the infrastructure
managers and path applicants that handles communication and coordination processes for international path requests and offers. Improve the
ad-hoc path allocation process by making the information timely available.
(6) Monitor corridor Infrastructure Managers concerning their path allocation process in conformity with the Network Statements, in particular,
the access to paths and to the related facilities, the use of priority rules, the charges, path allocation response time and rejection frequency.
Study exploiting the possibility of creating a rail freight corridor linking Belgium and Poland
R20100134.doc 105 September 2010
III. Achieving Corridor Capacity Planning
Measure “Achieving Corridor Capacity Planning” concerns the planning, the utilisation and the improvement of infrastructure capacity. In total,
five milestones are developed.
(1) Apply real-time traffic management system (e.g. Europtirails from RNE) in consistency with the development of TAF-TSI (Technical
Specifications for Interoperability on Telematic Applications for Freight services), to monitor and manage online real-time train traffic on the
Corridor, in particular, the contracted timetables, the delays, the forecasts, and the running advice. The real-time train traffic data are then
recorded in order to be used to analyse capacity bottlenecks, and traffic performance along the Corridor.
(2) Based on the results of capacity analysis, make medium- and long- term scenarios of infrastructure financing in order to anticipate capacity
growth and mitigate capacity bottlenecks from technical and operational constraints. These scenarios need to focus on both the tracks within
the country and tracks linking gates and hubs at border-crossing areas (e.g. Port of Antwerp, terminal Aachen-West, Port of Rotterdam;
Zevenaar – Emmerich; Oldenzaal – Bad Bentheim; Frankfurt (Oder) – Kunowice; Horka – Bielawa Dolna; Szczecin). The infrastructure planning
also needs to be consistent with the rail projects in TEN-T (e.g. priority axes No 5), and the progress on ERTMS corridor A, C and F. This shall
also take into account the maintenance, upgrading and reconstruction, and the charging plan of the corridor states. In Beligum, current
investment plan is for period 2001-2012 and the next investment plan 2013-2025 is under preparation.
(3) Make plans for short-term (e.g. 2-3 years) and cost-efficient actions (soft and/or hard measures) to reduce those capacity bottlenecks which
are small-scaled (e.g. under-lines) but have critical impacts on the entire Corridor. These small scale projects require less finance and could be
well considered during economic downturn.
(4) Carry out studies on terminals in the Corridor states, with regard to the capacity forecast, locations of terminals in relation to the
development of the Corridor, and their relevance to the other relevant international corridors (e.g. ERTMS Corridor A, C and F; RNE Corridor No
2, No 5; TEN-T Priority Axes No 1, No 5, No 23; national corridors on the TERFN network; Pan-European Corridor No 2.)
(5) Explore opportunities for operating longer (e.g. >=700 meters), heavier (more axle load), and faster trains on the Corridor. The focus is on
the interface between the length of the tracks, the length of the waiting-tracks (NL: wachtsporen) and sidings, and the length of tracks at rail
terminals.
Study exploiting the possibility of creating a rail freight corridor linking Poland and Belgium
106 R20100134.doc September 2010
IV. Establishing Corridor Performance Regime
Measure “Establishing Corridor Performance Regime” aims at minimising disturbances of railway network operation and train operation. It
addresses the setting up of a performance regime in accordance with the EU Directive 2001/14/EC to monitor the performances of both
infrastructure managers and of the railway undertakings, and create incentives for performance improvement. However, it should be born in
mind that compatibility between this Corridor Performance Regime and the existing National Performance Regime shall first be assessed. To
implement this measure, four milestones are established.
(1) Introduce the pilot of performance regime (e.g. EPR (European Performance Regime) developed by RNE). By developing a set of KPIs, EPR
monitors railway undertakings with regard to their performance of actual path utilisation (e.g. departure punctuality, delay duration). EPR also
monitors the infrastructure managers with regard to their performance of path allocation (e.g. response time, rejection frequency, path
options), and on actual path dispatch (e.g. dispatching the contracted paths and associated facilities).
Other KPIs (e.g. transport time, average train speed, access charges, causes of delays) can be derived as well. The KPI data can be acquired
from both the real-time traffic management system (e.g. Europtirails) and from dialogues with the relevant parties.
(2) Make real-time traffic information (e.g. using particular application like Europtirails that is compatible with TAF-TSI common interface).
timely available to the railway undertakings, terminal operators, rail operators or even the LSPs or shippers. Particularly those information with
regard to disturbances due to congestions, short-noticed track maintenance, which lead to delays of the overall train services needs to be
passed on to the stakeholders down the chain.
(3) Since causes and duration of delays could be monitored via the EPR (European Performance Regime), implementation of appropriate
financial incentives can be suggested for infrastructure managers or railway undertakings to improve the traffic performance and the reliability
of train services along the Corridor.
(4) Based on the EPR findings, the Corridor Rail Regulators are suggested to monitor the level-playing-field on the Corridor in the actual
situations, in particular with regard to the actual access to the paths, to the related facilities, and the priority rules applied during congestion.
Study exploiting the possibility of creating a rail freight corridor linking Belgium and Poland
R20100134.doc 107 September 2010
V. Improving Corridor Interoperability
To implement this measure, a total of eight milestones are established, which aims at improving the level of interoperability on the Corridor. In
total eight milestones generated in this measure.
(1) Investigate possibilities to achieve using one single working language for service operation, for example in English or code language, in
accordance with the TSI regarding working language for service operation that is codified in TSI Operations Chapter 4.2.1.5. However, it should
be born in mind that compatibility with relevant national legislation (i.e. in Belgium: law of 1962) should be taken into account.
(2) The licensing process, in particular licence B, needs be facilitated to enable the railway undertakings to quickly access the market outside of
its own country according to their requests. As such the level of competition on this corridor will increase.
(3) Deploy ERTMS on the Corridor, particularly on the stretch between Germany and Poland. Speed up the MoU process to establish the
principles for defining an EU deployment strategy for ERTMS on the Corridor or the existing ERTMS Corridor F. Take into account large additional
costs incurred to enable the operation of locomotives on different safety systems during the migration phase (e.g. ETCS level-1, ETCS-level 2,
and the existing national systems).
(4) The fitting between the ETCS-equipped tracks and the ETCS-equipped locomotives possibly made by different manufacturers need to be
improved.
(5) Participate in the work of ERA on TSIs in order to replace, in the near future, the cross-acceptance practice by the common interoperability
practice. This includes, among others, the setup of implementation plan on TAF-TSI.
(6) Railway line codification codifies the loading gauge parameters (width & height) and maximum cargo size parameters of the railway lines,
and makes the codification available to the rail customers. This allows potential rail customers to choose in advance the cargo size, intermodal
loading units, or wagons with dimensions that fit on the train tracks.
Study exploiting the possibility of creating a rail freight corridor linking Poland and Belgium
108 R20100134.doc September 2010
The availability of line codification also makes the path application process simplified and efficient, allowing rail customers choosing the right
cargo size, loading units, and wagon in advance & Therefore, speed up railway line codification on the Corridor is necessary. This milestone is
mostly relevant for Poland. In Poland the structural gauge (i.e. axle load) is already available; the maximum cargo/container size still needs to
be completed. There are measures being taken at the moment.
VI. Striving for Corridor Level-playing-field
The Measure “Striving for Corridor Level-playing-field” addresses cooperation between the Rail Regulators in taking active roles to ensure fair
and non-discriminatory market condition along the Corridor. In total six milestones are established for this measure.
(1) Ensure and maintain high independence of the infrastructure managers from the national railway companies for path allocation; and keep
neutral and open those terminals, shunting yards, and/or related facilities which belong to or operated by the infrastructure managers. To
reduce further possible discriminative behaviours of the national railways, the option to break down the holding structure to which both
infrastructure manager and railway undertaking belong can be considered, since this structure seems to bring doubts internally and externally
regarding the level of independence of the infrastructure managers from the national railway undertaking. However, the compatibility with
relevant EC legislation should be taken into account.
(2) Public financial support to the construction of new open terminals along the Corridor (the Netherlands (e.g. in Valburg, and Poland). Open
up the existing terminals, shunting yards, and fuelling facilities in Belgium (i.e. Port of Antwerp). This milestone shall improve the accessibility
of (intermodal) infrastructure facilities along the entire corridor.
(3) Ex-ante investigate the Network Statements with regard to: (a) priority rules applied for the allocation of paths in the annual timetabling, in
framework agreements, in ad-hoc situations, and actual path dispatch in case of onsite disturbances; (b) condition for accessing paths and
related facilities in different situations, particularly access to the sidings; (c) the national path charging system and charges; (d) qualification of
path applicants.
Study exploiting the possibility of creating a rail freight corridor linking Belgium and Poland
R20100134.doc 109 September 2010
(4) The corridor Rail Regulators may not be able to facilitate the cooperation between the infrastructure managers, but they may take the
monitoring role in assessing the degree of cooperation between the infrastructure managers with regard to the allocation and dispatch of train
paths and the related services.
(5) The corridor Rail Regulators are also recommended, if possible, to take the monitoring role in assessing the discrepancies in handing
charges between different terminals, as well as the degree of neutrality of terminals, shunting yards, and other facilities open to all railway
undertakings.
(6) Increase the scope of competence of the corridor Rail Regulators with regard to imposing penalty on competition issues, inspection, market
monitoring power, and competence of carrying out single case proceedings. A complete separation of the Rail Regulator from the government
increases its level of independence and neutrality. This shall help implement the above tasks more effectively and ensure level-playing-field on
the Corridor.
Study exploiting the possibility of creating a rail freight corridor linking Poland and Belgium
110 R20100134.doc September 2010
VII. Establishing Corridor Governance Structure
To be able to implement, manage, and monitor the above six measures, a governance structure with key stakeholders is necessary, this is the
main tone of this measure. In total seven milestones are established for this measure.
(1) Refer to the Corridor organisational structure which has been developed on ERTMS Corridor A as best practice example for the governance
structure for the Corridor.
(2) Development of the Corridor would not be a big success without the support of the transit country Germany. Therefore, it is necessary to
seek actual involvement from key stakeholders in Germany for the implementation of this Action Plan.
(3) Extension of the Corridor is needed in the future to correspond to the traffic flows. In particular, extending the Corridor to other bordering
countries on the other side, need to be considered (e.g. Czech, Belarus, Ukraine, Lithuania and Russia).
(4) Explore possibilities to incorporate the Corridor with other existing corridors have geographic overlaps or intersects. (a) the Corridors that
concern particularly the Dutch and Belgium stretch of the Corridor are: ERTMS Corridor A; ERTMS Corridor C; RNE Corridor No 2; TEN-T Priority
Axes No 5. (b) the corridors that concern the Corridor are: ERTMS Corridor F; RNE Corridor No 5; the TERFN network where corridor countries
are concerned; Pan-European Corridor No 2; (c) TEN-T Priority Axes No 23 intersects the Corridor on Warsaw. TEN-T Priority Axes No 1
intersects the Corridor on Berlin.
(5) Verify the Corridor by regularly monitoring and evaluating the freight traffic along the Corridor, paying particular attention to the traffic that
passes critical border-crossing points (e.g. Port of Antwerp; Port of Rotterdam; Montzen-Aachen; Essen – Roosendaal along Corridor C; Wezet –
Eijsden (to be checked); Zevenaar – Emmerich; Odenzaal – Bad Bentheim; Franktfurt (Oder) – Kunowice; Horka – Bielawa Dolna; Szczecin.)
(6) Be aware of the similarities and distinctions between the measures in this Action Plan and those in the existing directives or regulations
(e.g. the three railway packages, interoperability directive), and the forthcoming regulation (i.e. on European Rail Network for Competitive
Freight, which is expected to be brought about in 2010).
Study exploiting the possibility of creating a rail freight corridor linking Belgium and Poland
R20100134.doc 111 September 2010
(7) Cooperate with other Rail Regulators along the Corridor for identifying crucial issues and dealing with complaints relevant for the Corridor;
based on which provide advices for national governments and the EC regarding possibilities of adjusting certain legal acts and/or harmonising
certain operational and technical requirements.


