

1
Perfecting Strategy Execution
Success through Hoshin Kanri

2
Anthony Shingleton, Principal, BMGI
European Director for Strategy and Hoshin Planning Execution
Country Manager for France and United Kingdom
Confirmed Trainer, Coach and Consultant
Demonstrated success in R&D, Sales, Business Development, Operational Excellence, Finance, & Program Management

3
Agenda… 20 minutes to cover
• What is Hoshin Kanri • What a Hoshin Plan looks like • Top 5 Dos & Don’ts • Why now? • Challenges you will face • How & Where to Start • Questions & Answers • Feedback

4
So, what’s this word ‘Hoshin’ all about?
First, it’s really Japanese. Origins at the Kobe shipyards and at Bridgestone in about 1965-67. The Japanese is actually ‘Ho Shin Kan Ri’. ‘Shining Metal Pointing Direction’.
A Compass! A VISION COMPASS!
What is Hoshin Planning?

5
1. Establish Organizational Vision
2. Strategic Planning: Develop
3-5 Year Breakthrough Objectives
3. Develop Annual Objectives
4. Deploy Annual Objectives
5. Implement Annual Objectives
6. Monthly Review
7. Annual Review
Lean & Other Tools
Self
Diagnosis
P D
C
A
7 Step Hoshin Planning Process Innovation
Tools
Catchball
6
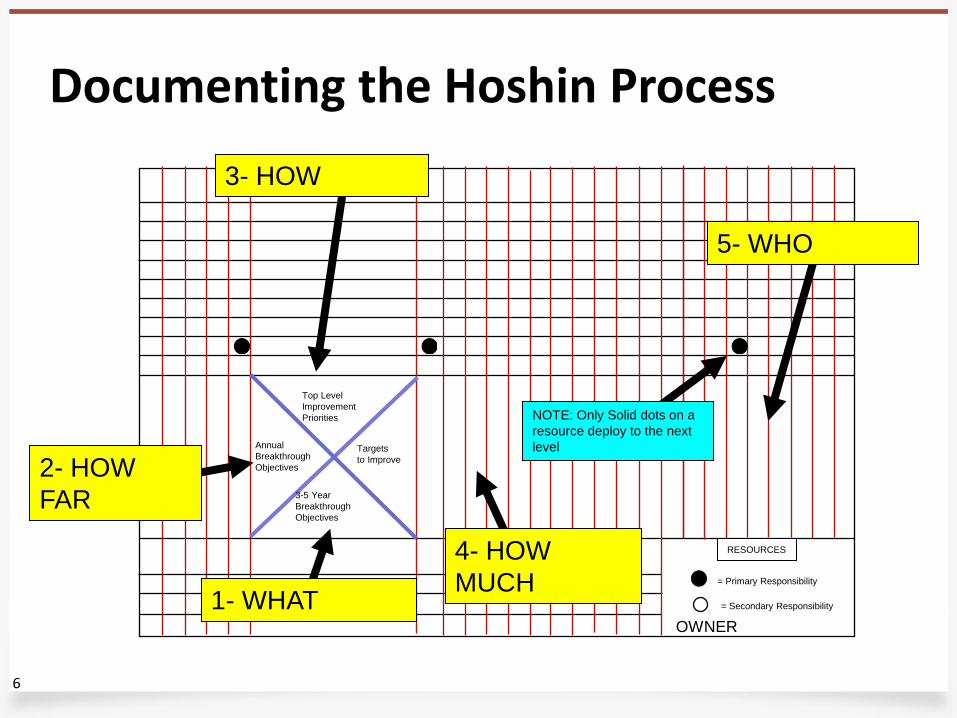
RESOURCES
Annual
Breakthrough
Objectives
Targets
to Improve
3-5 Year
Breakthrough
Objectives
Top Level
Improvement
Priorities
= Primary Responsibility
= Secondary Responsibility
5- WHO
4- HOW
MUCH
3- HOW
2- HOW
FAR
1- WHAT
NOTE: Only Solid dots on a
resource deploy to the next
level
OWNER
Documenting the Hoshin Process

7
The Top Level Matrix Top Level Hoshin Planning Matrix
8 8
= Original Plan x = Progress at Review
Action Step/ Kaizen Events Milestone Jan Feb M ar Apr M ay June July Aug Sept Oct Nov Dec
Improvement Priority Title: *Department/Location:
*
Management Owner:
* Date: *
Core Objective: *
TimelineTarget Improvement
Planned
Dates
Policy Deployment Action Plan
Review Team: * Next Review: *
Environmental Situation Summary: *
Status ( P a st Due i n Re d )
ImpactOwner (Lead is bold)
2003
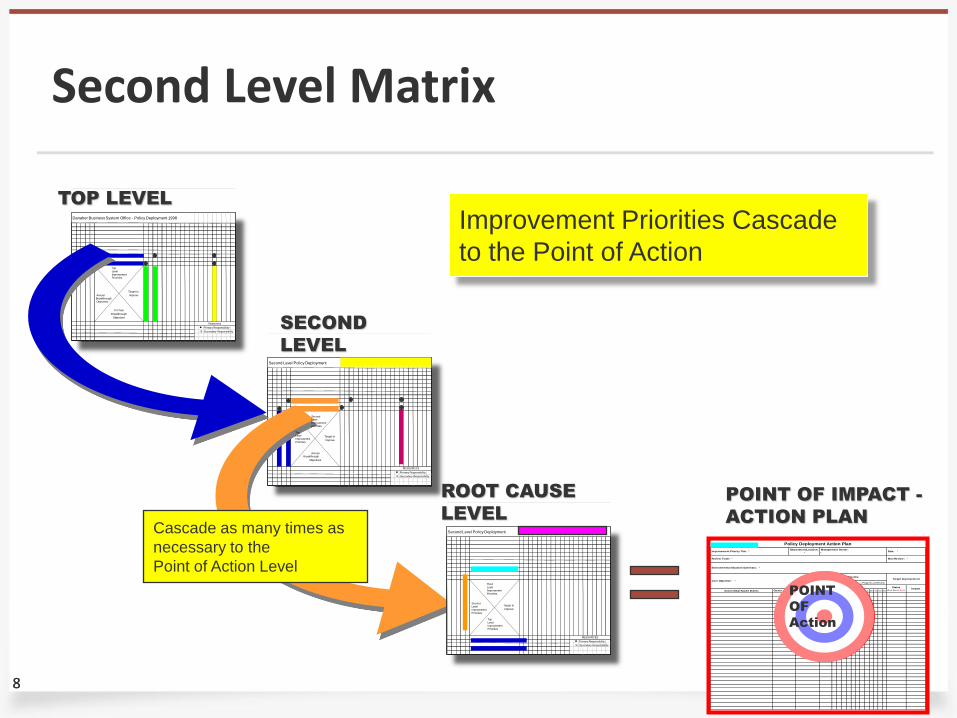
Second Level Policy Deployment
l Primary Responsibility
m Secondary Responsibility
RESOURCES
Target to
Improve
SECOND
LEVEL
Danaher Business System Office - Policy Deployment 1998
l Primary Responsibility
m Secondary Responsibility
Resources
Annual
Breakthrough
Objectives
3-5 Year
Breakthrough
Objectives
Target to
Improve
TOP LEVEL
POINT OF IMPACT -
ACTION PLAN Cascade as many times as
necessary to the
Point of Action Level
POINT
OF
Action
Second Level Policy Deployment
l Primary Responsibility
m Secondary Responsibility
RESOURCES
Target to
Improve
ROOT CAUSE
LEVEL
Annual
Objectives
Breakthrough
Top
Level
Improvement
Priorities
Second
Level
Improvement
Priorities
Top
Level
Improvement
Priorities
Top
Level
Improvement
Priorities
Second
Level
Improvement
Priorities
Third
Level
Improvement
Priorities
Improvement Priorities Cascade
to the Point of Action
Second Level Matrix

9
Symptoms that your Organization would benefit from this
The Organization Will See….
Too many bad projects on-going. Very long lead-times for
improvements. Constantly missed budgets and
forecasts. Senior management vision does not
match organizational activities. Annual objectives rolled out in March
instead of January. Way too many good projects in
process. Year to year plans never seem to
connect. Most employees never seem to feel a
part of the team. Little connection between strategy
and continuous improvement.
Common Issues That Surface
Too many top level objectives Objectives do not cascade deep enough into the organization No action plans in place at the point where cascade ends Infrequent follow up Opinion rather than fact based countermeasures Adding objectives at lower levels that do not tie or link to previous levels. Deployment of daily management as breakthrough objectives Targets not measurable or SMART Fear of stepping outside a comfort zone when setting stretch objectives

BMGI © BMGI All rights reserved. No portion may be copied, rewritten, reproduced, or published
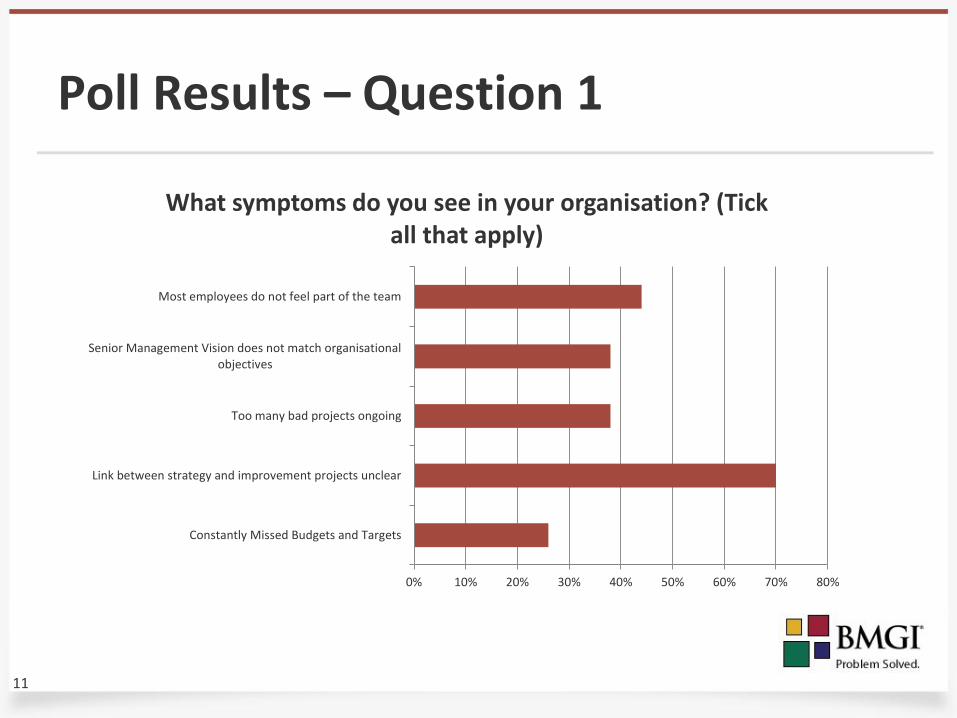
So where do you find yourself?
11
0% 10% 20% 30% 40% 50% 60% 70% 80%
Constantly Missed Budgets and Targets
Link between strategy and improvement projects unclear
Too many bad projects ongoing
Senior Management Vision does not match organisationalobjectives
Most employees do not feel part of the team
What symptoms do you see in your organisation? (Tick all that apply)
Poll Results – Question 1

12
Poll Results – Question 2
0% 10% 20% 30% 40% 50% 60% 70%
Objectives do not cascade deep enough
Pile-up of objectives at lower levels of the organisation
Targets are not SMART
Too many top-level objectives
Resistance to reporting and feedback at lower levels
Which common challenges have you expereienced? (tick all that apply)

13
Dos & Don’ts
Dos 1. Take the time to setup 2. Align with Budget Cycle 3. Census all improvements 4. Use Innovation Tools 5. Pilot in one Business Unit
Don’ts 1. Make this just a Tracking tool 2. Underestimate Resistance to
change 3. Cover just Financial objectives 4. Forget to review the process 5. Do this “alone”

14
Core Market Growth
Bringing better solutions to existing customers to get the job done better
Disruptive Growth
Bring disruption by entering the low-end or new markets with lower performing, cheaper products to non-consumers
Related Market Growth
Bringing newer solutions to existing customers get related or ancillary jobs done
New Market Growth
Bringing newer solutions to perform jobs for which ad hoc or no good solutions exist
CU
RR
EN
T J
OB
S
NE
W J
OB
S
CONSUMER NON-CONSUMER
1 2
4
3 What is my best possible Future?
4 Growth Strategies

15
Breakthrough
Kaizen
Daily
Management
Senior Mgt
Middle Mgmt
Supervisor
Associate
Develop 3-5 Year Objectives

16
l l
l l
l Primary Responsibility
m Secondary Responsibility
Resources
Gillette - Policy Deployment 2003
Annual
Objectives
Benefits
3-5 Year
Breakthrough
Objectives
Target to
Improve
PRIORITY
2003 YTD
ACT
2003
JAN
2003
FEB
2003
MAR
2003
APR
2003
MAY
2003
JUN
2003
JUL
2003
AUG
2003
SEP
2003
OCT
2003
NOV
2003
DEC
SAFETYPlan
Act
QUALITYPlan
Act
Plan
Act
DELIVERYPlan
Act
Plan
Act
COSTPlan
Act
Plan
Act
GROWTHPlan
Act
Plan
Act
<Name of Company >Policy Deployment Top Level Bowling Chart
Top Level Bowling Chart
l l
l Primary Responsibility
m Secondary Responsibility
Resources
2nd Level Policy Deployment Matrix
Annual
Objectives
Benefits
Annual
Objectives
Target to
Improve
PRIORITY 1997 ACT 1998 ACT 1999 ACT JOP
2000 YTD
ACT JAN FEB MAR APR MAY JUN JUL AUG
SAFETYPlan
Act
QUALITYPlan
Act
Plan
Act
DELIVERYPlan
Act
Plan
Act
COSTPlan
Act
Plan
Act
GROWTHPlan
Act
Plan
<Name of Company >Policy Deployments Second Level Bowling Chart
= Plan x = Progress at Review
Action Step/ Kaizen Events Milestone Jan Feb M ar Apr M ay June July Aug Sept Oct Nov Dec
Core Objective: *
TimelineTarget Improvement
Planned
DatesStatus Impact
Owner
Policy Deployment Action Plan
Review Team: * Next Review: **-**-02
Environmental Situation Summary: *
Improvement Priority
Title: *
Department/Location:
* Management Owner: * Date: **-**-02
Second Level Bowling Chart Action Plan
POINT
OF
Action
Linking to Performance

17 17
Background: “Quality of Science” At present, only XX% of current patients have identified biomarkers which make them good
candidates for phase 2 clinical trials. Our objective is to….
This supports the Hoshin Objective of improving the quality of science as measured by
increasing the PTS to 60% by 2013.
Top Level Initiative: Identify biomarker and proof of mechanism in 100%... Date: 8.08.08
Target Conditions: Best in Class Statement: Industry standard for
Biomarkers is 35%.
Industry standard for PTS is 40%,
Issues/ Action Items:
Ben Franklin – 9.30
See detailed counter measure sheet
PTS Drastically off target.
Janice C.- 8.30
Move Frankie to new division… Molecule identification is behind due to resource allocation issue.
Responsibility/ Due Date
Counter Measure Problem
Results/Metrics:
Biomarkers
0%
5%
10%
15%
20%
25%
30%
35%
40%
J F M A M J J A S O N D
Bio
Goal
PTS
0%
2%
4%
6%
8%
10%
12%
14%
16%
J F M A M J J A S O N D
PTS
Goal
PTS
0%
2%
4%
6%
8%
10%
12%
14%
16%
J F M A M J J A S O N D
PTS
Goal
PTS
0%
2%
4%
6%
8%
10%
12%
14%
16%
J F M A M J J A S O N D
PTS
Goal
Action Plan/ Progress to Date:
Publish biomarker geography map to demonstrate…
Have joint training session with……
Identify which molecules have not identified any bio markers….
Determine which molecules currently have the best Bio rates.
Status D N O S A J J M A M F J Major Action Step
Plan
Actual
Hoshin : PTS 15% Bio 40% 09
Targets 20% 50% 10
30% 60% 11

18
Where & How to start?
1. Raise awareness of (lack of) connection between Strategy & Execution at Executive Management Team/Board Level
2. Build the X matrix of the “Current State” (“Oh Nooo” data)
3. Clean & Simplify current state at Senior Mgt Level 4. Devise your Hoshins 5. 2nd Clean & Alignment to Hoshins 6. Proceed with completion of X Matrix for the “Future
State” in one Business Unit 7. Execute!

19
1-day Hoshin Strategy execution Workshops:
• Paris, FR - 22nd March (Innovation 21st March)
• Brussels, BE - 23rd May (Innovation 24th May)
• London, UK - 7th June (Running Kaizens 8th June)
• Amsterdam, NL - 21st June (Change Leadership 22nd June)
Please visit http://www.bmgi.com/training for more information on course content. Email: [email protected]
More information on Hoshin

20
Stay connected.
…on facebook BMGI Page
http://fr.linkedin.com/in/anthonyshingleton

21
Perfecting Strategy Execution
Success through Hoshin Kanri


