
SUPERINTENDENCE OF THE MANAUS
FREE TRADE ZONE - SUFRAMA
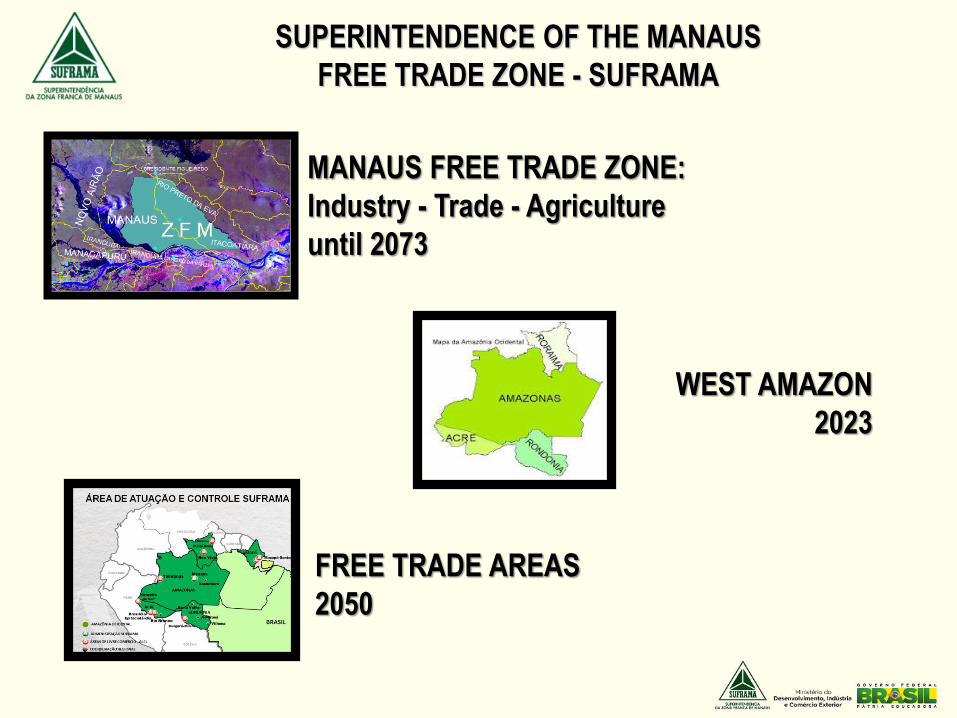
MANAUS FREE TRADE ZONE:
Industry - Trade - Agriculture
until 2073
WEST AMAZON
2023
FREE TRADE AREAS
2050
SUPERINTENDENCE OF THE MANAUS
FREE TRADE ZONE - SUFRAMA
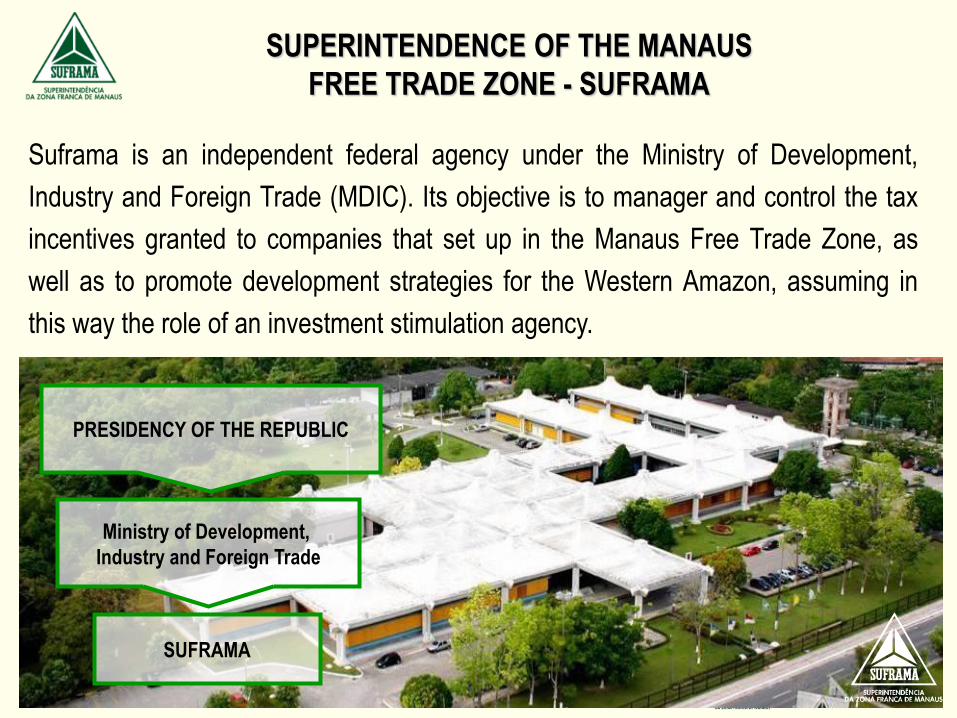
Suframa is an independent federal agency under the Ministry of Development,
Industry and Foreign Trade (MDIC). Its objective is to manager and control the tax
incentives granted to companies that set up in the Manaus Free Trade Zone, as
well as to promote development strategies for the Western Amazon, assuming in
this way the role of an investment stimulation agency.
SUFRAMA
Ministry of Development,
Industry and Foreign Trade
PRESIDENCY OF THE REPUBLIC
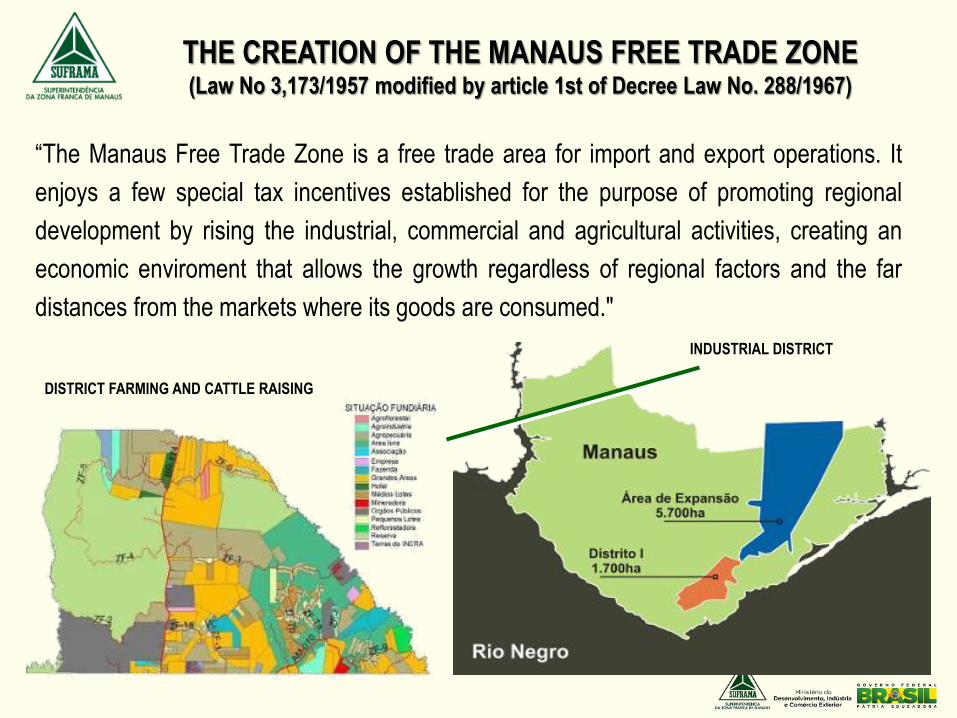
THE CREATION OF THE MANAUS FREE TRADE ZONE(Law No 3,173/1957 modified by article 1st of Decree Law No. 288/1967)
“The Manaus Free Trade Zone is a free trade area for import and export operations. It
enjoys a few special tax incentives established for the purpose of promoting regional
development by rising the industrial, commercial and agricultural activities, creating an
economic enviroment that allows the growth regardless of regional factors and the far
distances from the markets where its goods are consumed."
DISTRICT FARMING AND CATTLE RAISING
INDUSTRIAL DISTRICT
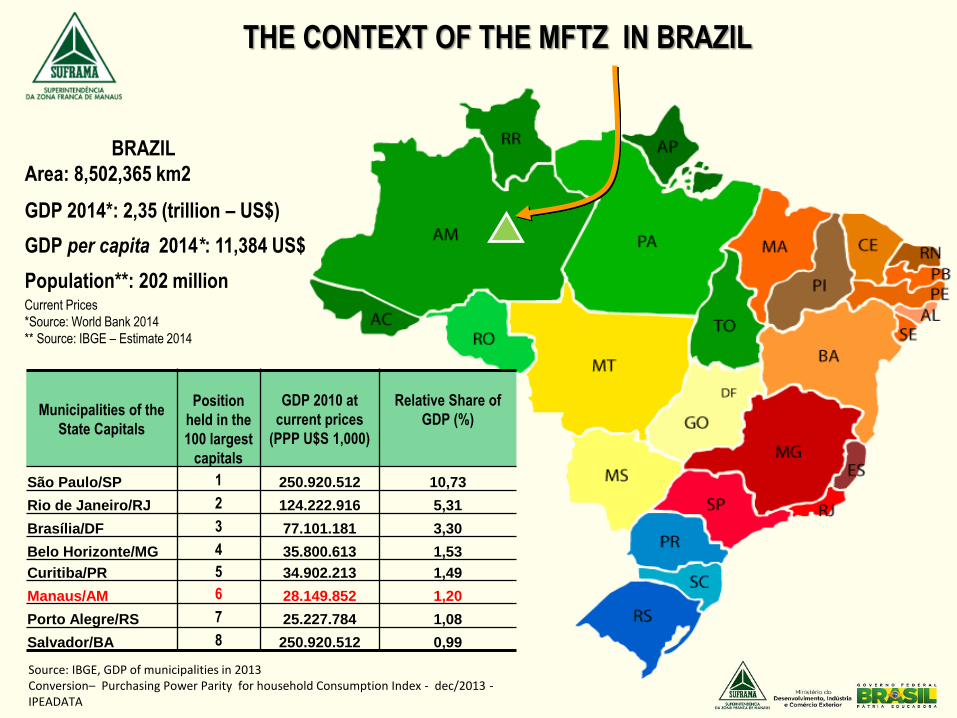
THE CONTEXT OF THE MFTZ IN BRAZIL
BRAZIL
Area: 8,502,365 km2
GDP 2014*: 2,35 (trillion – US$)
GDP per capita 2014*: 11,384 US$
Population**: 202 million
Municipalities of the
State Capitals
Position
held in the
100 largest
capitals
GDP 2010 at
current prices
(PPP U$S 1,000)
Relative Share of
GDP (%)
São Paulo/SP 1 250.920.512 10,73
Rio de Janeiro/RJ 2 124.222.916 5,31
Brasília/DF 3 77.101.181 3,30
Belo Horizonte/MG 4 35.800.613 1,53
Curitiba/PR 5 34.902.213 1,49
Manaus/AM 6 28.149.852 1,20
Porto Alegre/RS 7 25.227.784 1,08
Salvador/BA 8 250.920.512 0,99
Source: IBGE, GDP of municipalities in 2013Conversion– Purchasing Power Parity for household Consumption Index - dec/2013 -IPEADATA
Current Prices
*Source: World Bank 2014
** Source: IBGE – Estimate 2014
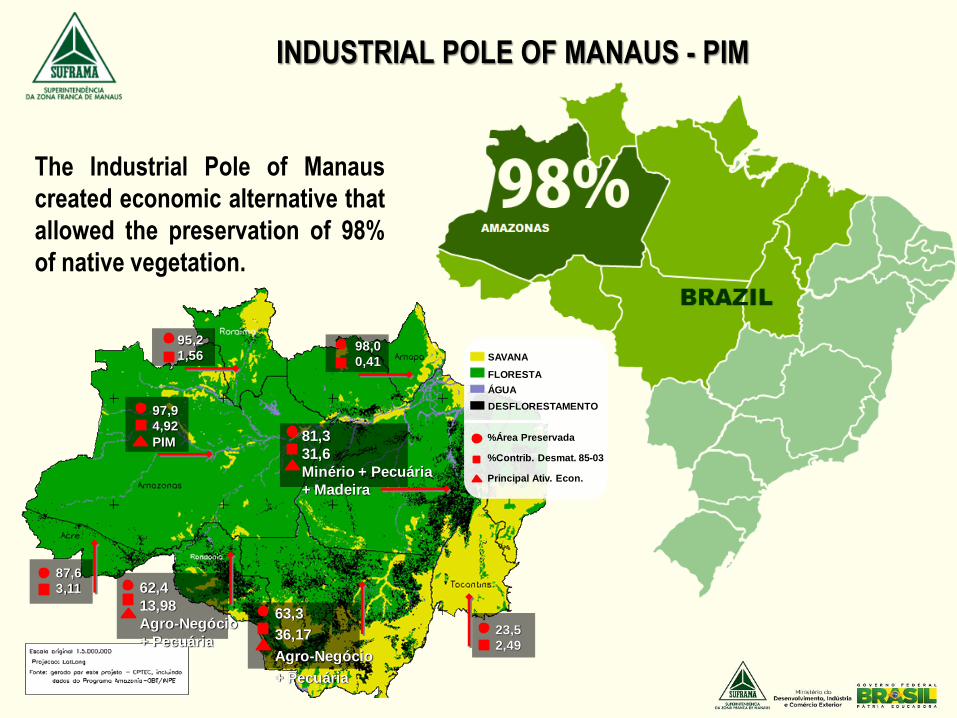
INDUSTRIAL POLE OF MANAUS - PIM
The Industrial Pole of Manaus
created economic alternative that
allowed the preservation of 98%
of native vegetation.
98,0
0,41
95,2
1,56
97,9
4,92
PIM
SAVANA
FLORESTA
ÁGUA
DESFLORESTAMENTO
81,3
31,6
Minério + Pecuária
+ Madeira
%Área Preservada
%Contrib. Desmat. 85-03
Principal Ativ. Econ.
87,6
3,11 62,4
13,98
Agro-Negócio
+ Pecuária
63,3
36,17
Agro-Negócio
+ Pecuária
23,5
2,49
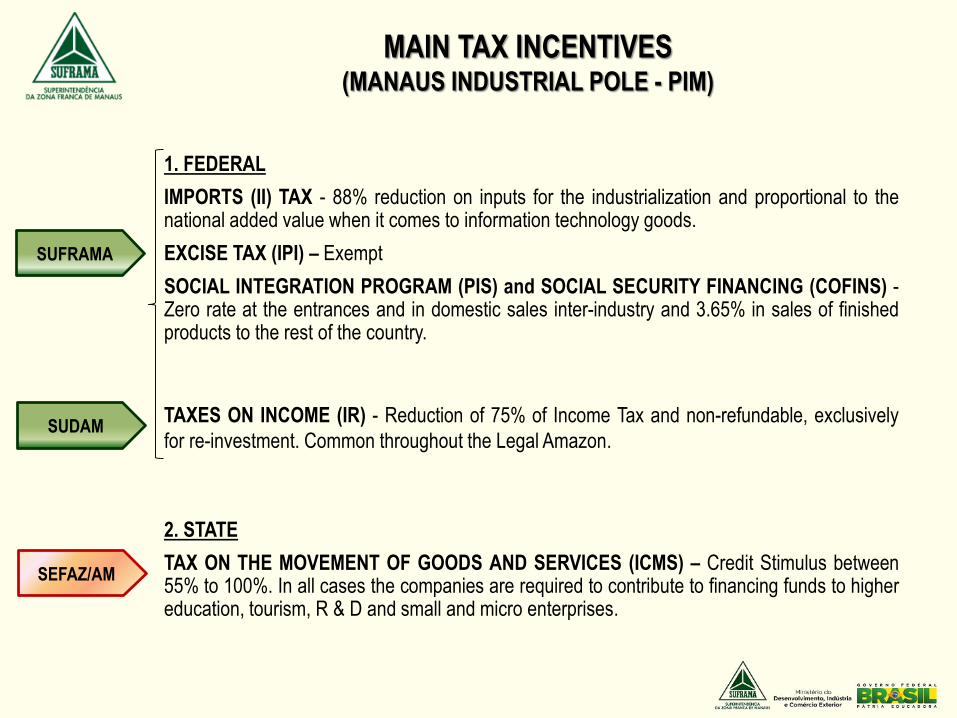
MAIN TAX INCENTIVES(MANAUS INDUSTRIAL POLE - PIM)
1. FEDERAL
IMPORTS (II) TAX - 88% reduction on inputs for the industrialization and proportional to thenational added value when it comes to information technology goods.
EXCISE TAX (IPI) – Exempt
SOCIAL INTEGRATION PROGRAM (PIS) and SOCIAL SECURITY FINANCING (COFINS) -Zero rate at the entrances and in domestic sales inter-industry and 3.65% in sales of finishedproducts to the rest of the country.
SUFRAMA
TAXES ON INCOME (IR) - Reduction of 75% of Income Tax and non-refundable, exclusively
for re-investment. Common throughout the Legal Amazon.SUDAM
2. STATE
TAX ON THE MOVEMENT OF GOODS AND SERVICES (ICMS) – Credit Stimulus between55% to 100%. In all cases the companies are required to contribute to financing funds to highereducation, tourism, R & D and small and micro enterprises.
SEFAZ/AM
COUNTERPARTS REQUIRED BY COMPANIES
CONCESSIONS GRANTED INCENTIVES
• Process compliance Basic Productive (PPB);
• Job creation in the region;
• Granting social benefits to employees;
• Incorporation of product technology and production processes
compatible with state of the art;
• Increasing levels of productivity and competitiveness;
• Reinvestment of profits in the region;
• Investment in training of human resources for the scientific and
technological development; and
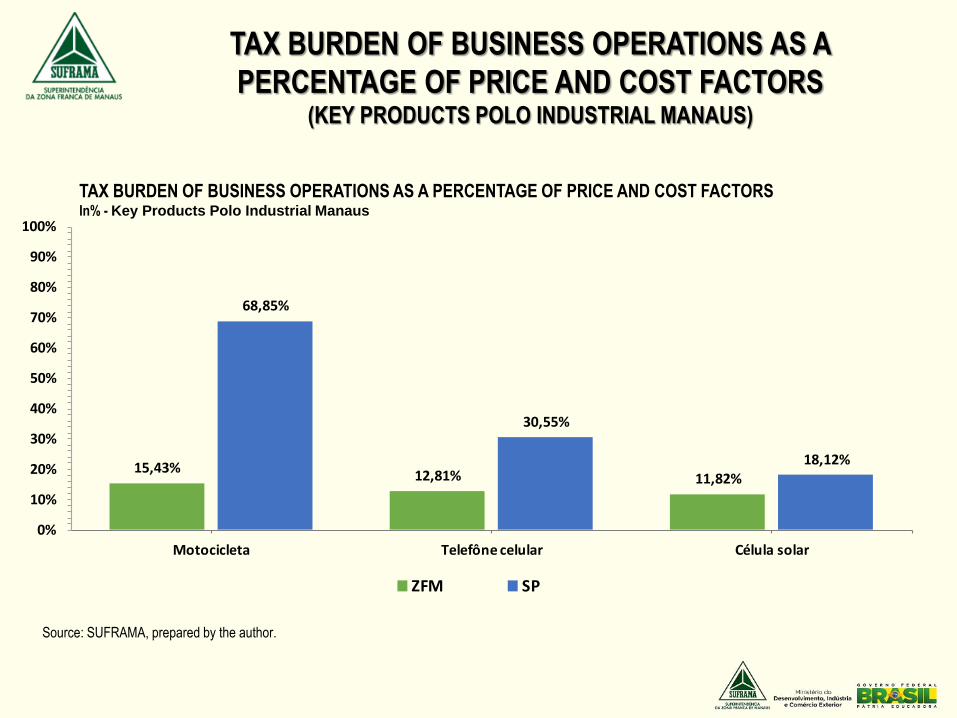
TAX BURDEN OF BUSINESS OPERATIONS AS A
PERCENTAGE OF PRICE AND COST FACTORS(KEY PRODUCTS POLO INDUSTRIAL MANAUS)
Source: SUFRAMA, prepared by the author.
15,43%12,81% 11,82%
68,85%
30,55%
18,12%
0%
10%
20%
30%
40%
50%
60%
70%
80%
90%
100%
Motocicleta Telefône celular Célula solar
ZFM SP
TAX BURDEN OF BUSINESS OPERATIONS AS A PERCENTAGE OF PRICE AND COST FACTORSIn% - Key Products Polo Industrial Manaus
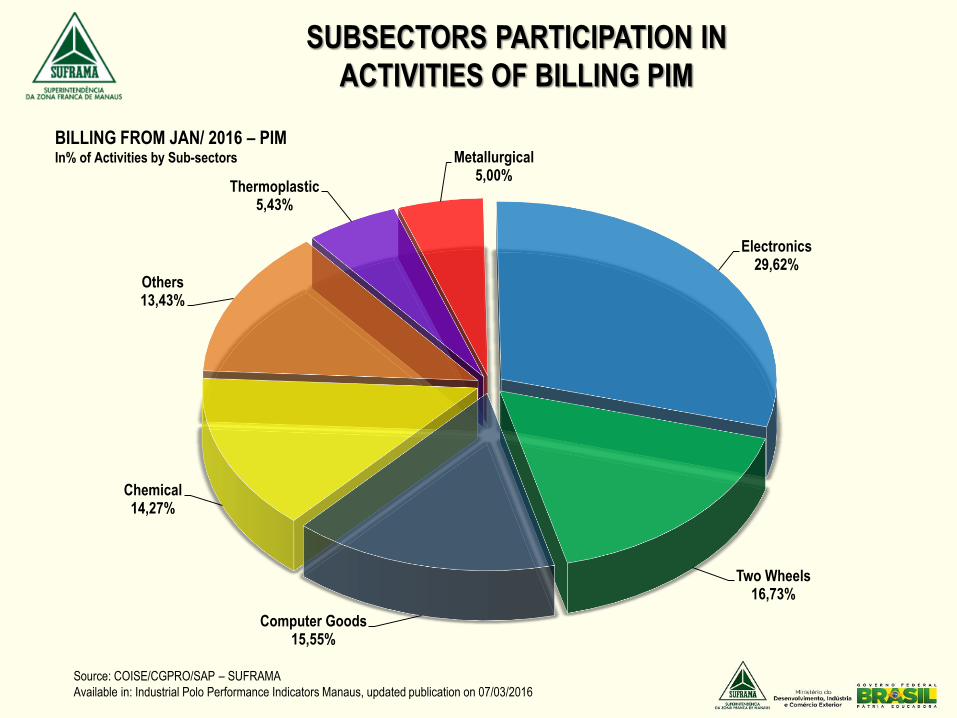
SUBSECTORS PARTICIPATION IN
ACTIVITIES OF BILLING PIM
BILLING FROM JAN/ 2016 – PIMIn% of Activities by Sub-sectors
Source: COISE/CGPRO/SAP – SUFRAMA
Available in: Industrial Polo Performance Indicators Manaus, updated publication on 07/03/2016
Electronics29,62%
Two Wheels16,73%
Computer Goods15,55%
Chemical14,27%
Others13,43%
Thermoplastic5,43%
Metallurgical5,00%
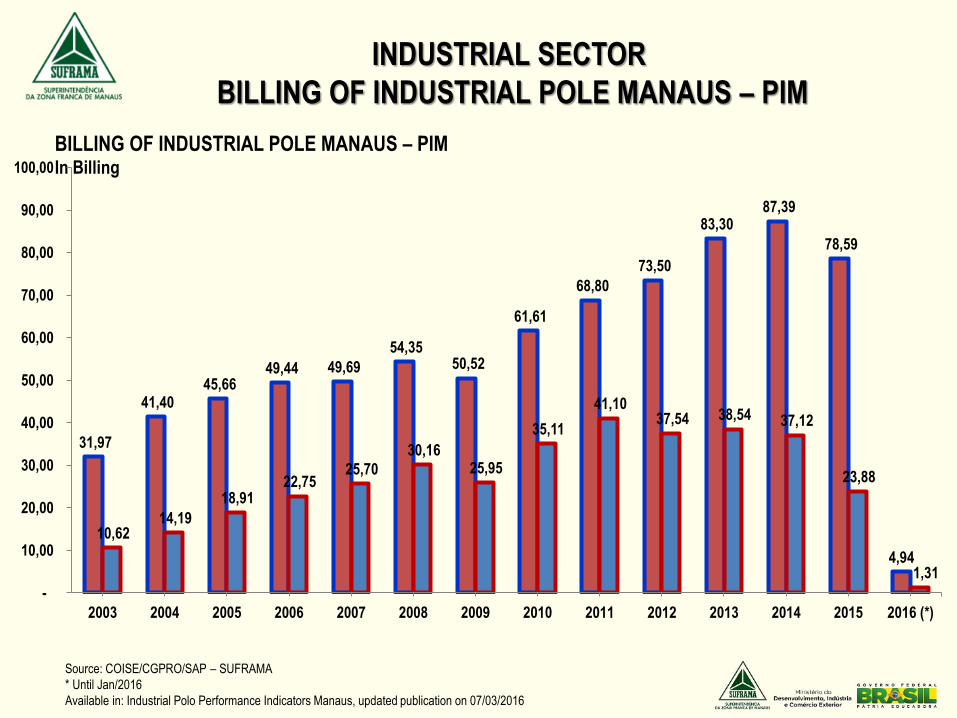
INDUSTRIAL SECTOR
BILLING OF INDUSTRIAL POLE MANAUS – PIM
Source: COISE/CGPRO/SAP – SUFRAMA
* Until Jan/2016
Available in: Industrial Polo Performance Indicators Manaus, updated publication on 07/03/2016
BILLING OF INDUSTRIAL POLE MANAUS – PIMIn Billing
31,97
41,40 45,66
49,44 49,69
54,35 50,52
61,61
68,80
73,50
83,30 87,39
78,59
4,94
10,62 14,19
18,91 22,75
25,70
30,16 25,95
35,11
41,10 37,54 38,54 37,12
23,88
1,31
-
10,00
20,00
30,00
40,00
50,00
60,00
70,00
80,00
90,00
100,00
2003 2004 2005 2006 2007 2008 2009 2010 2011 2012 2013 2014 2015 2016 (*)
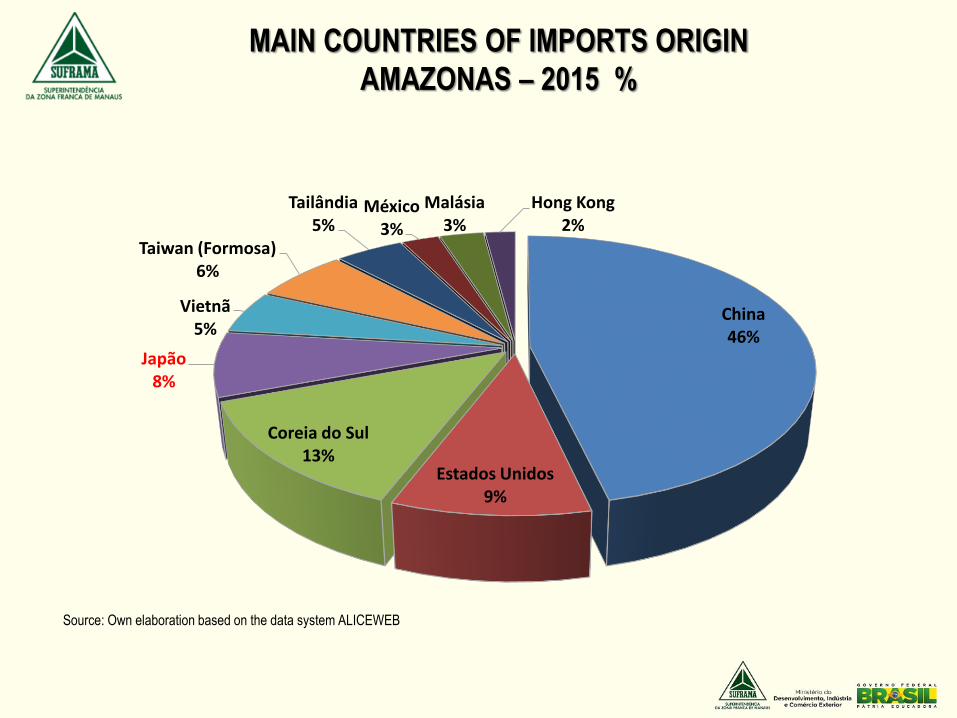
MAIN COUNTRIES OF IMPORTS ORIGIN
AMAZONAS – 2015 %
China46%
Estados Unidos9%
Coreia do Sul13%
Japão8%
Vietnã5%
Taiwan (Formosa)6%
Tailândia5%
México3%
Malásia3%
Hong Kong2%
Source: Own elaboration based on the data system ALICEWEB
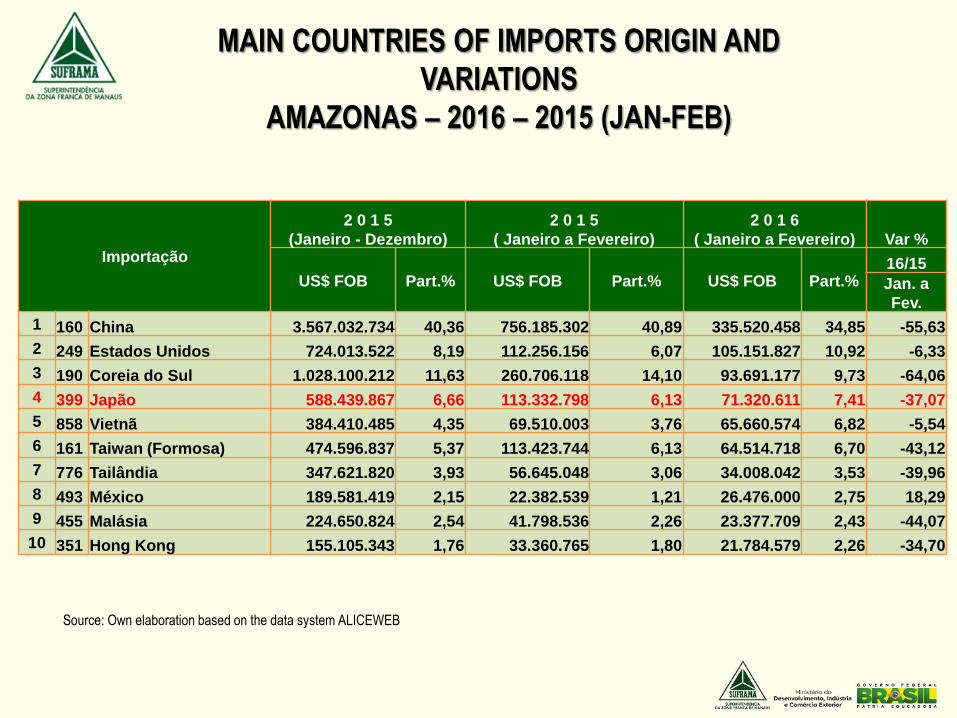
Importação
2 0 1 5
(Janeiro - Dezembro)
2 0 1 5
( Janeiro a Fevereiro)
2 0 1 6
( Janeiro a Fevereiro) Var %
US$ FOB Part.% US$ FOB Part.% US$ FOB Part.%16/15
Jan. a
Fev.
1 160 China 3.567.032.734 40,36 756.185.302 40,89 335.520.458 34,85 -55,63
2 249 Estados Unidos 724.013.522 8,19 112.256.156 6,07 105.151.827 10,92 -6,33
3 190 Coreia do Sul 1.028.100.212 11,63 260.706.118 14,10 93.691.177 9,73 -64,06
4 399 Japão 588.439.867 6,66 113.332.798 6,13 71.320.611 7,41 -37,07
5 858 Vietnã 384.410.485 4,35 69.510.003 3,76 65.660.574 6,82 -5,54
6 161 Taiwan (Formosa) 474.596.837 5,37 113.423.744 6,13 64.514.718 6,70 -43,12
7 776 Tailândia 347.621.820 3,93 56.645.048 3,06 34.008.042 3,53 -39,96
8 493 México 189.581.419 2,15 22.382.539 1,21 26.476.000 2,75 18,29
9 455 Malásia 224.650.824 2,54 41.798.536 2,26 23.377.709 2,43 -44,07
10 351 Hong Kong 155.105.343 1,76 33.360.765 1,80 21.784.579 2,26 -34,70
MAIN COUNTRIES OF IMPORTS ORIGIN AND
VARIATIONS
AMAZONAS – 2016 – 2015 (JAN-FEB)
Source: Own elaboration based on the data system ALICEWEB
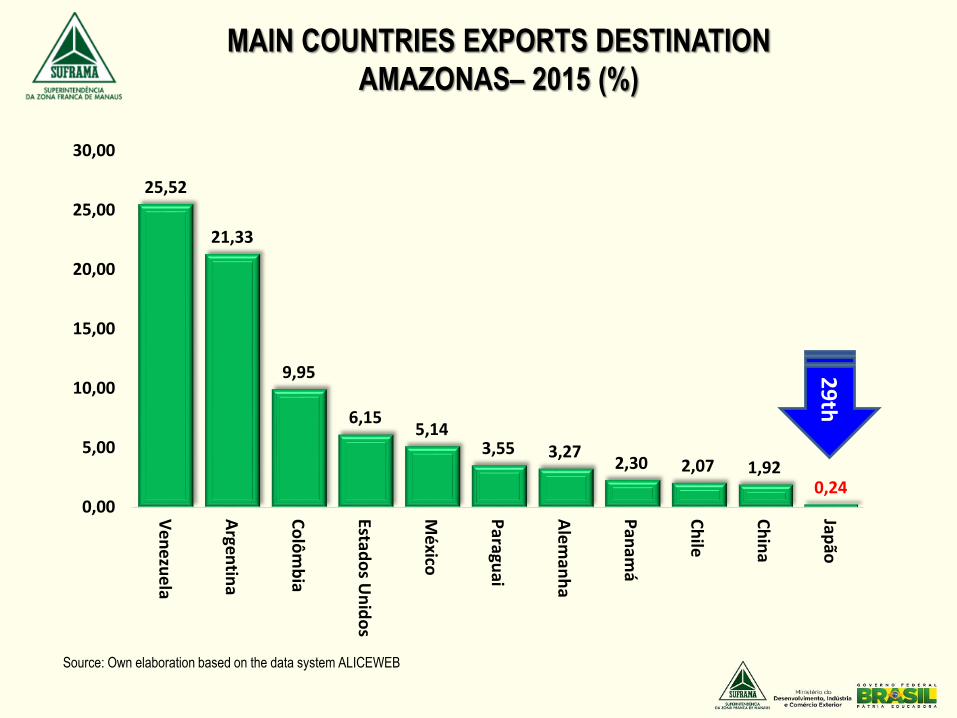
25,52
21,33
9,95
6,155,14
3,55 3,272,30 2,07 1,92
0,240,00
5,00
10,00
15,00
20,00
25,00
30,00
Ve
ne
zue
la
Argen
tina
Co
lôm
bia
Estado
s Un
ido
s
Mé
xico
Paragu
ai
Ale
man
ha
Pan
amá
Ch
ile
Ch
ina
Japão
MAIN COUNTRIES EXPORTS DESTINATION
AMAZONAS– 2015 (%)
Source: Own elaboration based on the data system ALICEWEB
29
th
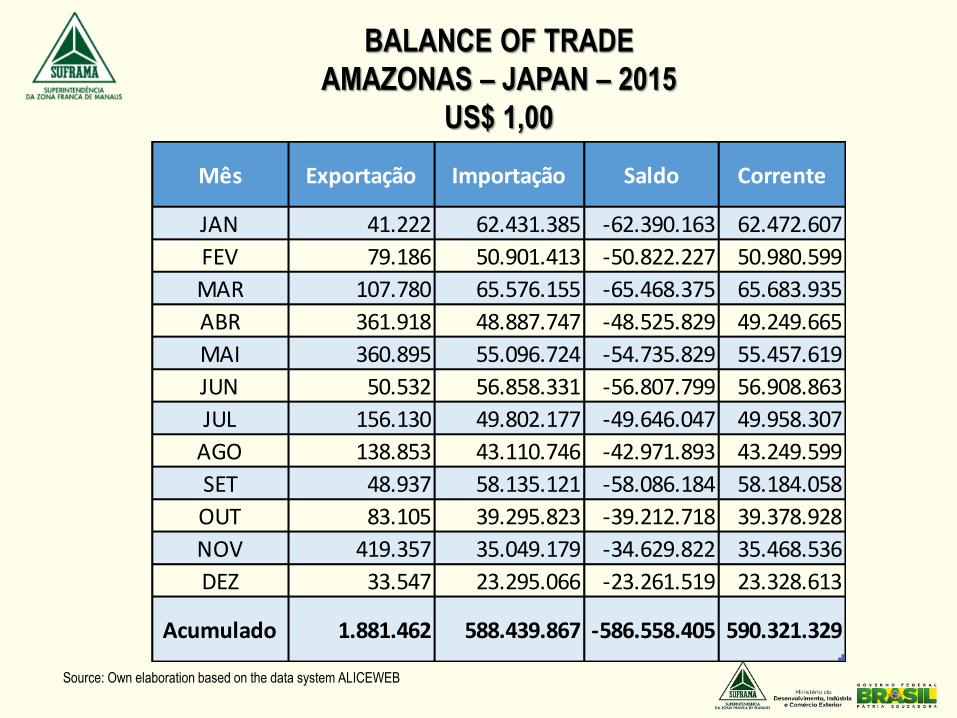
Mês Exportação Importação Saldo Corrente
JAN 41.222 62.431.385 -62.390.163 62.472.607
FEV 79.186 50.901.413 -50.822.227 50.980.599
MAR 107.780 65.576.155 -65.468.375 65.683.935
ABR 361.918 48.887.747 -48.525.829 49.249.665
MAI 360.895 55.096.724 -54.735.829 55.457.619
JUN 50.532 56.858.331 -56.807.799 56.908.863
JUL 156.130 49.802.177 -49.646.047 49.958.307
AGO 138.853 43.110.746 -42.971.893 43.249.599
SET 48.937 58.135.121 -58.086.184 58.184.058
OUT 83.105 39.295.823 -39.212.718 39.378.928
NOV 419.357 35.049.179 -34.629.822 35.468.536
DEZ 33.547 23.295.066 -23.261.519 23.328.613
Acumulado 1.881.462 588.439.867 -586.558.405 590.321.329
BALANCE OF TRADE
AMAZONAS – JAPAN – 2015
US$ 1,00
Source: Own elaboration based on the data system ALICEWEB
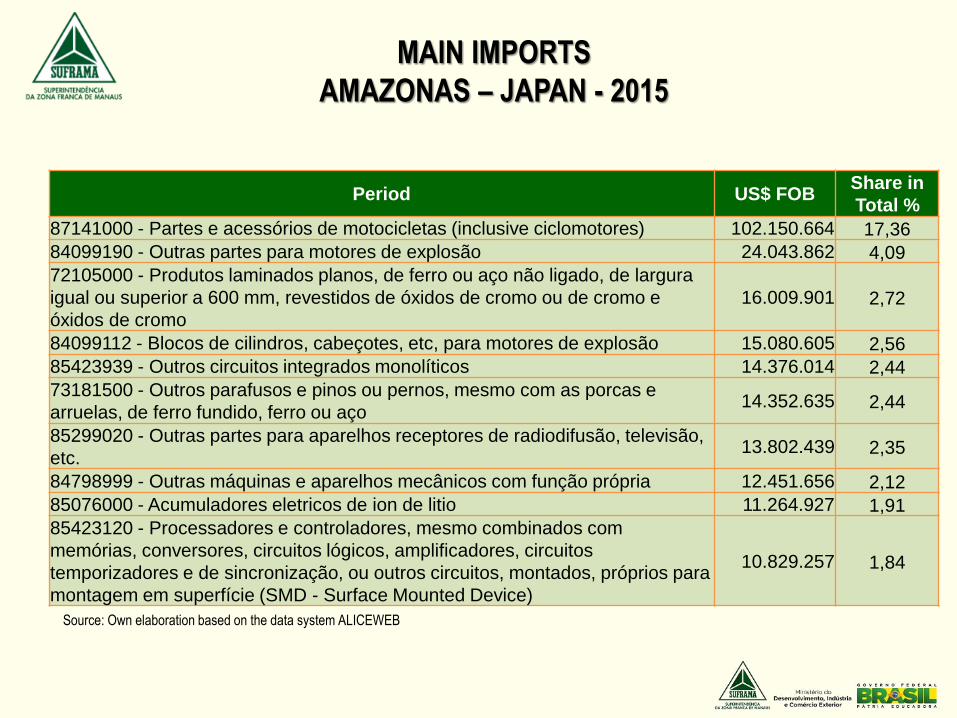
Period US$ FOBShare in
Total %
87141000 - Partes e acessórios de motocicletas (inclusive ciclomotores) 102.150.664 17,36
84099190 - Outras partes para motores de explosão 24.043.862 4,09
72105000 - Produtos laminados planos, de ferro ou aço não ligado, de largura
igual ou superior a 600 mm, revestidos de óxidos de cromo ou de cromo e
óxidos de cromo
16.009.901 2,72
84099112 - Blocos de cilindros, cabeçotes, etc, para motores de explosão 15.080.605 2,56
85423939 - Outros circuitos integrados monolíticos 14.376.014 2,44
73181500 - Outros parafusos e pinos ou pernos, mesmo com as porcas e
arruelas, de ferro fundido, ferro ou aço14.352.635 2,44
85299020 - Outras partes para aparelhos receptores de radiodifusão, televisão,
etc.13.802.439 2,35
84798999 - Outras máquinas e aparelhos mecânicos com função própria 12.451.656 2,12
85076000 - Acumuladores eletricos de ion de litio 11.264.927 1,91
85423120 - Processadores e controladores, mesmo combinados com
memórias, conversores, circuitos lógicos, amplificadores, circuitos
temporizadores e de sincronização, ou outros circuitos, montados, próprios para
montagem em superfície (SMD - Surface Mounted Device)
10.829.257 1,84
MAIN IMPORTS
AMAZONAS – JAPAN - 2015
Source: Own elaboration based on the data system ALICEWEB
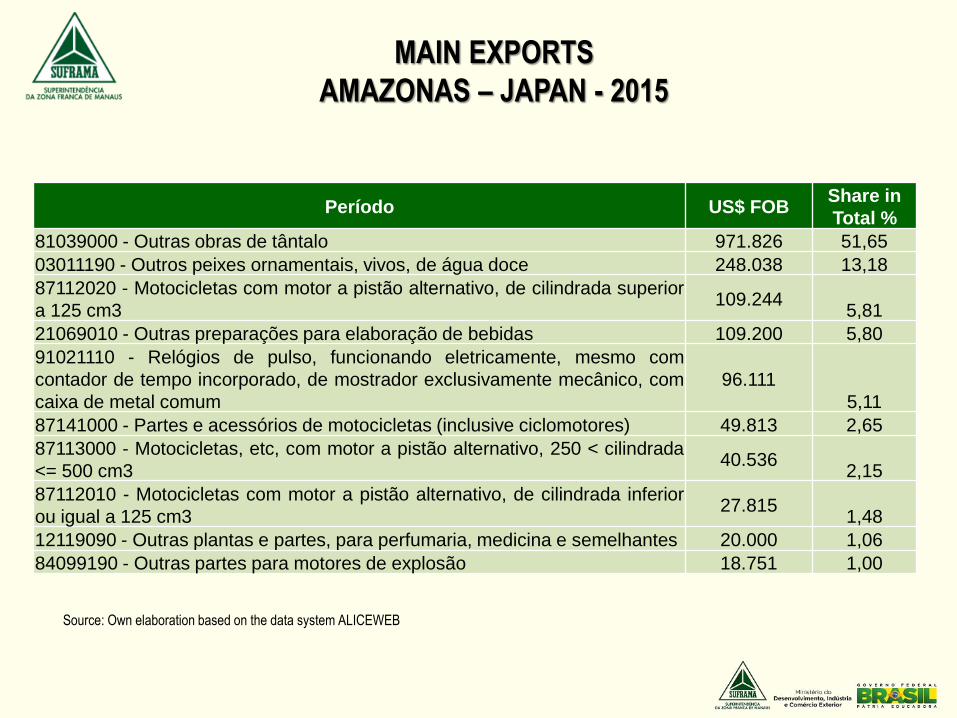
Período US$ FOBShare in
Total %
81039000 - Outras obras de tântalo 971.826 51,65
03011190 - Outros peixes ornamentais, vivos, de água doce 248.038 13,18
87112020 - Motocicletas com motor a pistão alternativo, de cilindrada superior
a 125 cm3109.244
5,81
21069010 - Outras preparações para elaboração de bebidas 109.200 5,80
91021110 - Relógios de pulso, funcionando eletricamente, mesmo com
contador de tempo incorporado, de mostrador exclusivamente mecânico, com
caixa de metal comum
96.111
5,11
87141000 - Partes e acessórios de motocicletas (inclusive ciclomotores) 49.813 2,65
87113000 - Motocicletas, etc, com motor a pistão alternativo, 250 < cilindrada
<= 500 cm340.536
2,15
87112010 - Motocicletas com motor a pistão alternativo, de cilindrada inferior
ou igual a 125 cm327.815
1,48
12119090 - Outras plantas e partes, para perfumaria, medicina e semelhantes 20.000 1,06
84099190 - Outras partes para motores de explosão 18.751 1,00
MAIN EXPORTS
AMAZONAS – JAPAN - 2015
Source: Own elaboration based on the data system ALICEWEB
INSTITUTOS DE PESQUISAS
SIDIA
Amazônia
A FEW OF THE MORE THAN 600 COMPANIES IN THE
INDUSTRIAL POLO MANAUS - PIM
FOREIGN ENTERPRISES
NATIONAL ENTERPRISES
A FEW OF THE MORE THAN 600 COMPANIES IN THE
INDUSTRIAL POLO MANAUS - PIM
Thank You!
REBECCA MARTINS GARCIA
SUPERINTENDENTE DA ZONA FRANCA DE MANAUS - SUFRAMA
Email: [email protected]
Phone: +55 (92) 3321-7020 / 7032
SUPERINTENDENCE OF THE MANAUS
FREE TRADE ZONE - SUFRAMA


