
12. 10. 2006 PFMC 2006, A. Herrmann 1/18
Surface temperature measurement and heat load estimation for targets with plasma
contact and machine protection
A. Herrmann
Max-Planck-Institut für Plasmaphysik, Boltzmannstr. 2, D-85748 Garching, Germany

12. 10. 2006 PFMC 2006, A. Herrmann 2/18
Motivation (I)
• Stationary temperature profiles on short time scales (τeq << ∆tDischarge)
• Typical heat fluxes q = 10-20 MW/m2.
• Safety margin about 40% (CuCrZr)• The sensitive component is inside
the target …• But the surface temperature is
measured.• Correlation to the temperature inside
the bulk by solving the heat conduction equation.
• The machine protection is as good as – the temperature measurement
and – the thermal model of the target.
W7-X target tile (cross section)
21
/100
mMWK
qT≈
∆=−α
Actively cooled target
Heat resistance:
12. 10. 2006 PFMC 2006, A. Herrmann 3/18
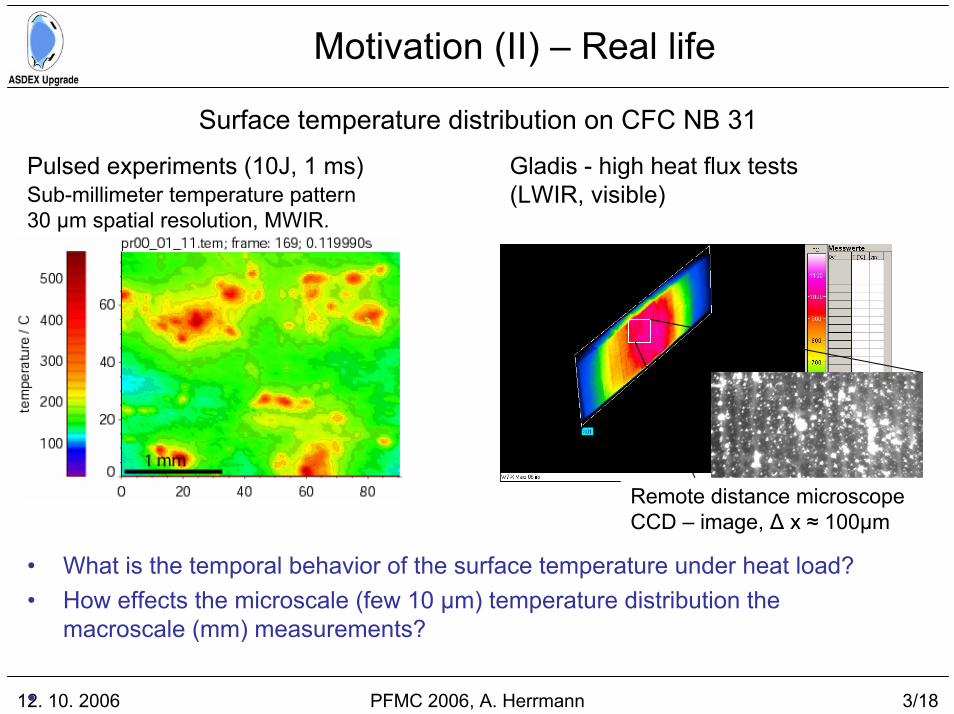
Motivation (II) – Real life
Surface temperature distribution on CFC NB 31
• What is the temporal behavior of the surface temperature under heat load?• How effects the microscale (few 10 µm) temperature distribution the
macroscale (mm) measurements?
•
Sub-millimeter temperature pattern30 µm spatial resolution, MWIR.
Pulsed experiments (10J, 1 ms) Gladis - high heat flux tests(LWIR, visible)
Remote distance microscopeCCD – image, ∆ x ≈ 100µm

12. 10. 2006 PFMC 2006, A. Herrmann 4/18
Outline
• Surface temperature distribution and heat flux– Fine grain graphite (FGG) - the ‚simple‘ case– Carbon fiber composite (CFC) – intrinsic structured– layer effects (due to plasma interaction)
• Conclusions

12. 10. 2006 PFMC 2006, A. Herrmann 5/18
Surface effects are detected by response on heat loads
• Pulsed heat load: – ELMs, disruptions– laser pulse (welding laser)
• Probes– AUG target tile Upper divertor
(FGG)– NB 31 – W7-X
• To do:– Compare measured and expected
(analytical solution) T-evolution.– Calculate the heat flux (2D,
THEODOR).
AUG S8, A1
Experimental details:Herrmann, A., et al., Investigation of infrared emission from carbon microstructure on a 30 micron spatial scale. Physica Scripta, 2004. T 111
12. 10. 2006 PFMC 2006, A. Herrmann 6/18
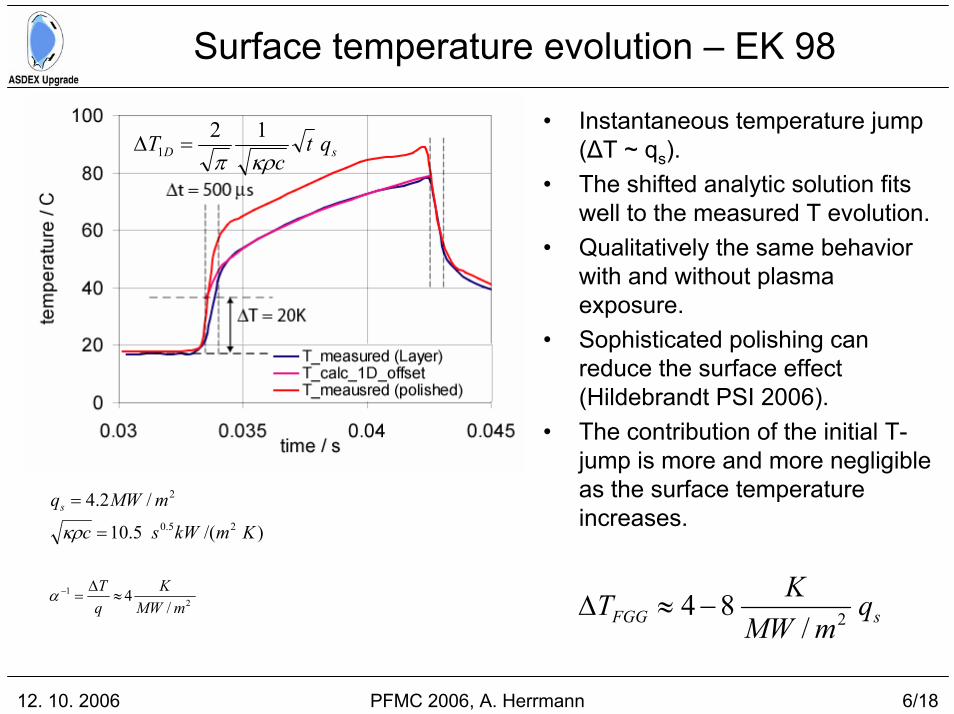
Surface temperature evolution – EK 98
• Instantaneous temperature jump (∆T ~ qs).
• The shifted analytic solution fits well to the measured T evolution.
• Qualitatively the same behavior with and without plasma exposure.
• Sophisticated polishing can reduce the surface effect (Hildebrandt PSI 2006).
• The contribution of the initial T-jump is more and more negligible as the surface temperature increases.
sD qtc
Tκρπ12
1 =∆
)/(5.10
/2.425.0
2
KmkWsc
mMWqs=
=
κρ
sFGG qmMW
KT 2/84−≈∆2
1
/4
mMWK
qT≈
∆=−α

12. 10. 2006 PFMC 2006, A. Herrmann 7/18
Thermal model for heat flux calculation
• The calculated heat flux depends on the thermal model.
• Pure bulk thermal data:– Overestimation of the heat
flux on short time scales.– Compensated by negative
heat flux at the end.• Calculated energy is o.k.
More details: Herrmann, A., Limitations for Divertor Heat Flux Calculations of Fast Events in Tokamaks. EPS 2001Andrew, P., et al., Thermal effects of surface layers on divertor target plates. JNM, 2003. 313.
12. 10. 2006 PFMC 2006, A. Herrmann 8/18
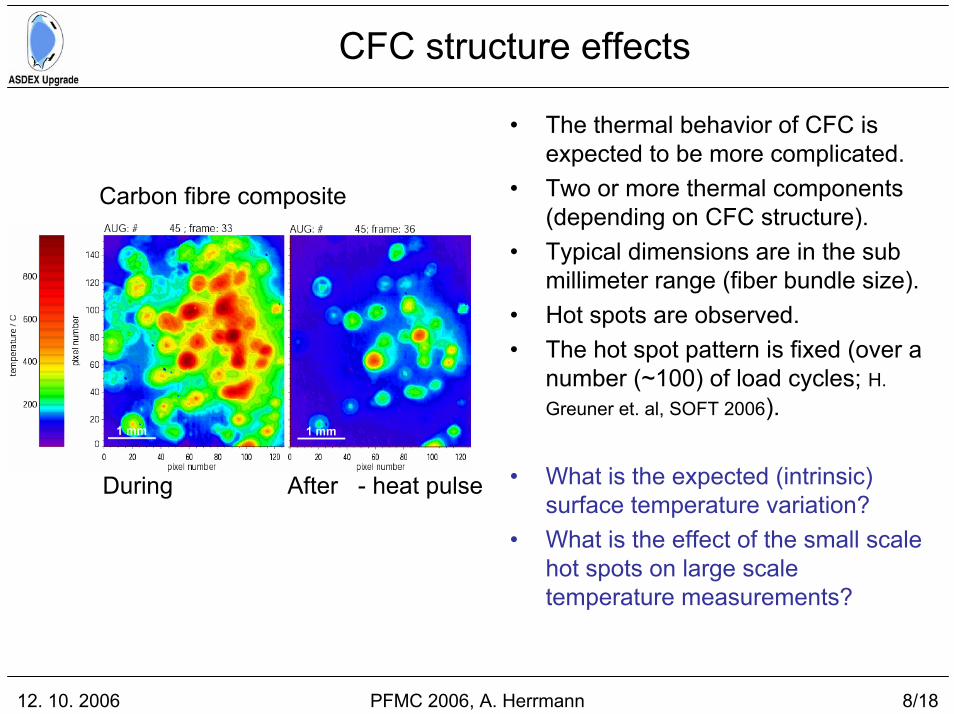
CFC structure effects
• The thermal behavior of CFC is expected to be more complicated.
• Two or more thermal components (depending on CFC structure).
• Typical dimensions are in the sub millimeter range (fiber bundle size).
• Hot spots are observed.• The hot spot pattern is fixed (over a
number (~100) of load cycles; H. Greuner et. al, SOFT 2006).
• What is the expected (intrinsic) surface temperature variation?
• What is the effect of the small scale hot spots on large scale temperature measurements?
During After - heat pulse
Carbon fibre composite

12. 10. 2006 PFMC 2006, A. Herrmann 9/18
Intrinsic temperature modulation on CFC
• Fiber embedded in carbon (FGG) -filler
• Volume fraction 50% (NB31 30% for pitch fibers).
• Heat capacity of the fiber equal to filler.
• Heat pulse 1 ms 20 MW/m2.• Heat conductivity of the fiber adjusted
to get the ‘averaged’ CFC data.
• The heat is transported by the fiber.• CFC heat diffusivity:
temperature (@ 0.5 ms)
KmW
fillerfiber 5005.4 ≈≈ κκ
FibresoffractionVolumefwith
fc
a
V
VFibre
FibreCFC
−
≈ρκ
For more sophisticated models see PEGASUS, PHEMOBRID, S. Pestchanyi, B. Bazylev)
12. 10. 2006 PFMC 2006, A. Herrmann 10/18
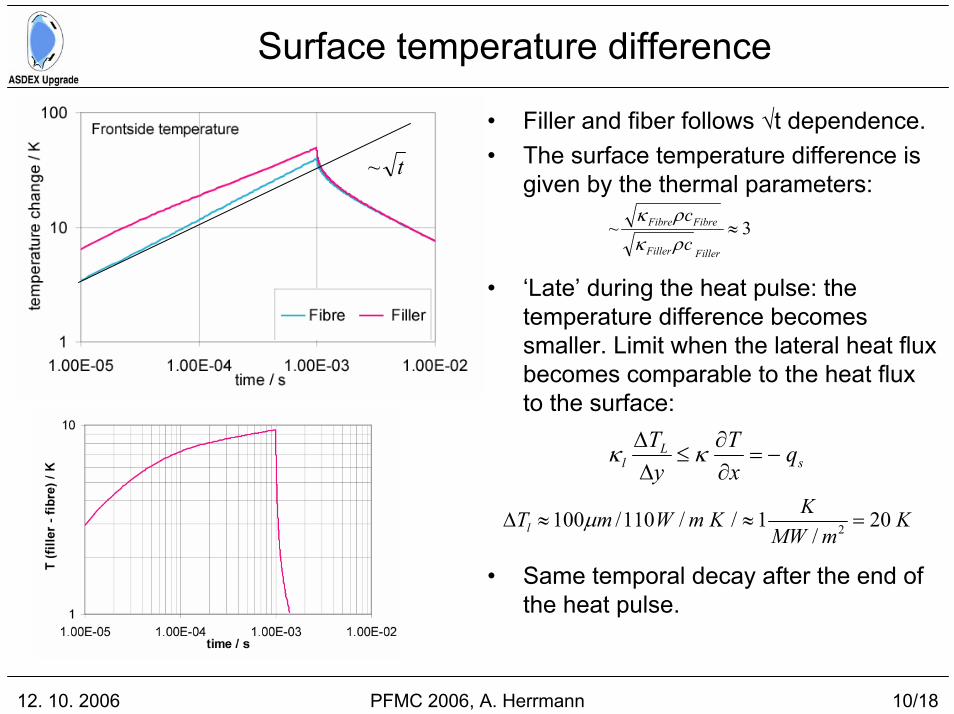
Surface temperature difference
t~
• Filler and fiber follows √t dependence.• The surface temperature difference is
given by the thermal parameters:
• ‘Late’ during the heat pulse: the temperature difference becomes smaller. Limit when the lateral heat flux becomes comparable to the heat flux to the surface:
• Same temporal decay after the end of the heat pulse.
3~ ≈FillerFiller
FibreFibre
cc
ρκρκ
sL
l qxT
yT
−=∂∂
≤∆∆ κκ
KmMW
KKmWmTl 20/
1//110/100 2 =≈≈∆ µ

12. 10. 2006 PFMC 2006, A. Herrmann 11/18
CFC in reality (no plasma effect)
CFC (NB31) • Laser flash experiments• 10 ms – 30 J (10 MW/m2)• 710µs time resolution
start 7 ms afterend

12. 10. 2006 PFMC 2006, A. Herrmann 12/18
Temperature evolution at different CFC parts
• CFC temperature pattern is more complex than expected from two components.
• Filler and fiber shows the T-jump at the start of the heating.
• Additional components with bad heat contact are found.
• Different types of hot spots are found.– thermally equilibrated. Dominated
by heat transmission to the bulk.– Not yet in equilibration after 10
ms. Slow temperature decay.– The filling factor is 2-10%
• Heat flux calculation for the filler and fiber results in 10MW/m2.
• The hot spot temperature is limited by heat conduction not by radiation!
filler
fiber
hot spots t~
2/6
mMWK
2/8
mMWK
2/30
mMWK
12. 10. 2006 PFMC 2006, A. Herrmann 13/18
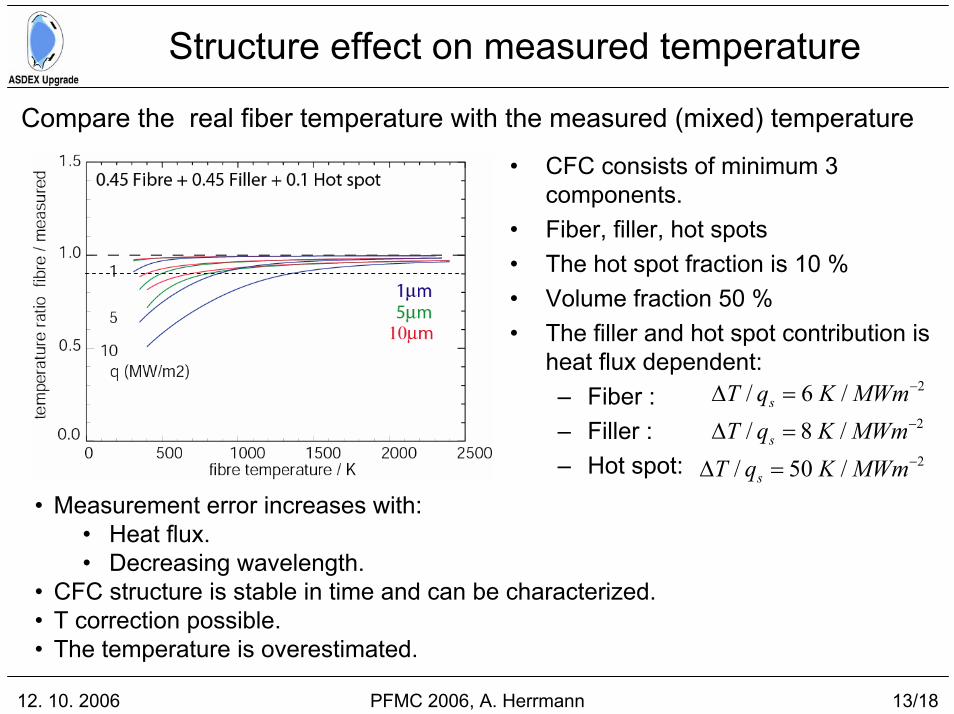
Structure effect on measured temperature
Compare the real fiber temperature with the measured (mixed) temperature
• CFC consists of minimum 3 components.
• Fiber, filler, hot spots• The hot spot fraction is 10 %• Volume fraction 50 %• The filler and hot spot contribution is
heat flux dependent:– Fiber :– Filler : – Hot spot:
2/6/ −=∆ MWmKqT s2/8/ −=∆ MWmKqT s2/50/ −=∆ MWmKqT s
• Measurement error increases with:• Heat flux.• Decreasing wavelength.
• CFC structure is stable in time and can be characterized.• T correction possible.• The temperature is overestimated.
12. 10. 2006 PFMC 2006, A. Herrmann 14/18
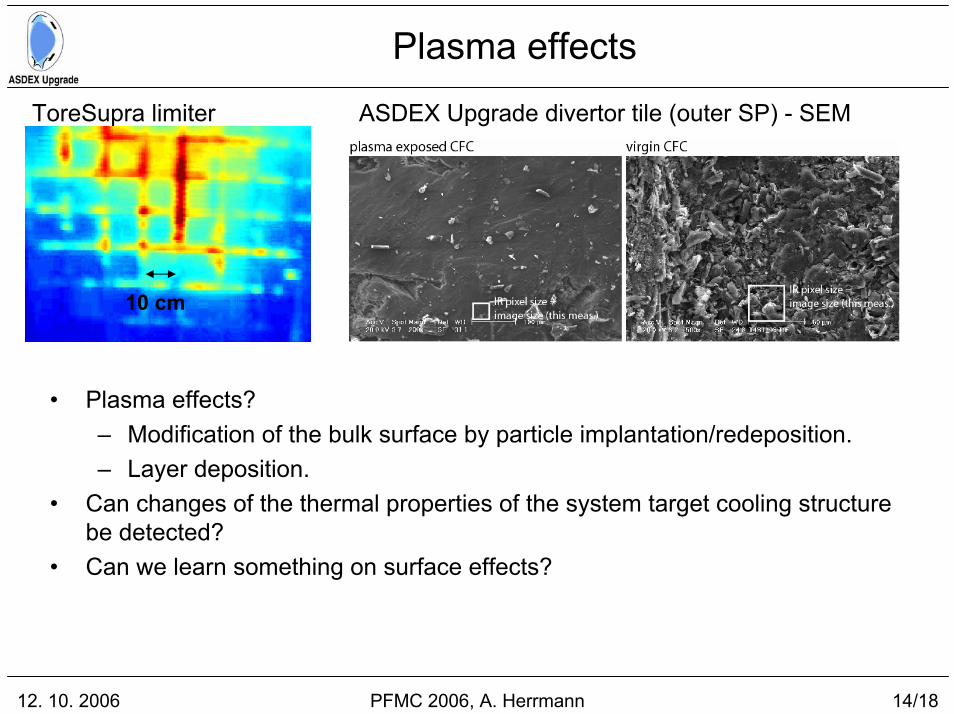
Plasma effects
ASDEX Upgrade divertor tile (outer SP) - SEM
10 cm
ToreSupra limiter
• Plasma effects?– Modification of the bulk surface by particle implantation/redeposition.– Layer deposition.
• Can changes of the thermal properties of the system target cooling structure be detected?
• Can we learn something on surface effects?

12. 10. 2006 PFMC 2006, A. Herrmann 15/18
Plasma effects – simple model
• Thermal model for the target (bulk with surface effects)• Add a layer on it.• Calculate the surface temperature evolution for different thermal parameter sets
(κ = 110 – 22 W/m/K; ρc = 0.1, 1, 10 MJ/m3/K, α-1 = ).• Calculate the heat flux with the standard model (thermal model for the target).
12. 10. 2006 PFMC 2006, A. Herrmann 16/18
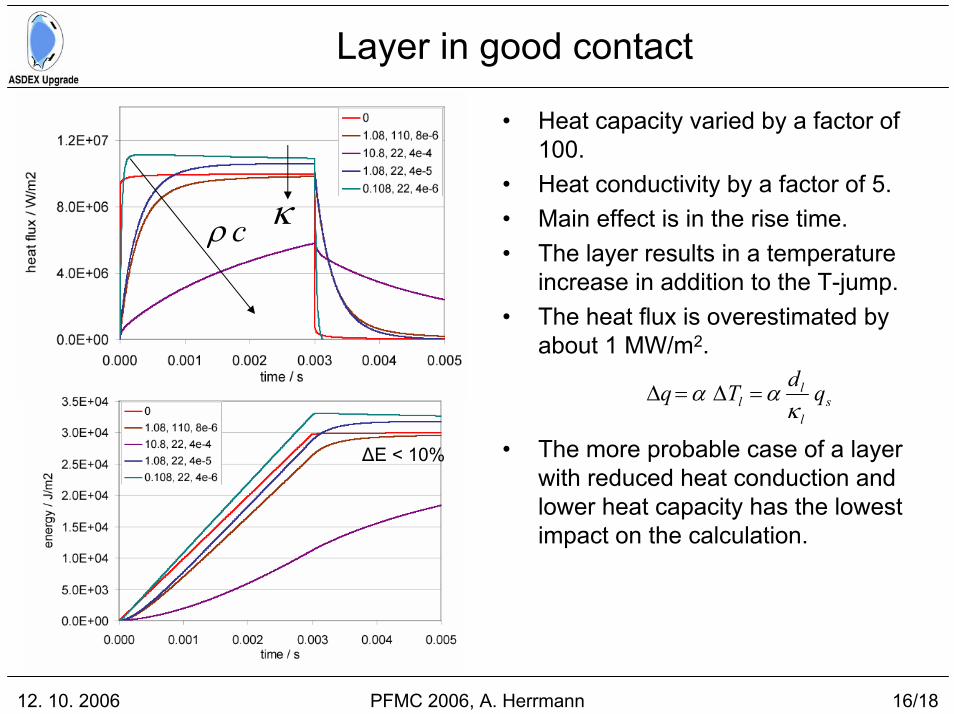
Layer in good contact
• Heat capacity varied by a factor of 100.
• Heat conductivity by a factor of 5.• Main effect is in the rise time.• The layer results in a temperature
increase in addition to the T-jump.• The heat flux is overestimated by
about 1 MW/m2.
• The more probable case of a layer with reduced heat conduction and lower heat capacity has the lowest impact on the calculation.
sl
ll qdTq
καα =∆=∆
cρ κ
∆E < 10%
12. 10. 2006 PFMC 2006, A. Herrmann 17/18
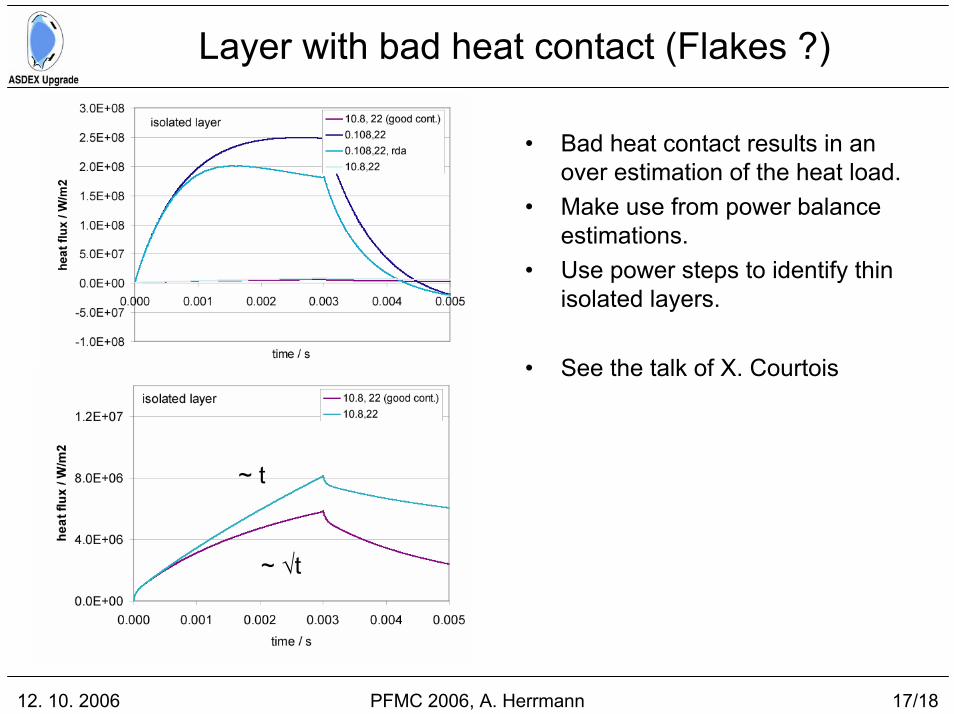
Layer with bad heat contact (Flakes ?)
~ t
~ √t
• Bad heat contact results in an over estimation of the heat load.
• Make use from power balance estimations.
• Use power steps to identify thin isolated layers.
• See the talk of X. Courtois
12. 10. 2006 PFMC 2006, A. Herrmann 18/18
Conclusions
• All effects overestimate the surface temperature!!!• Detection of surface modifications needs additional information:
– Temporal behavior (load changes)– Power balance (input – radiation)
• Carbon materials show an intrinsic temperature increase of about
• Temperature at the CFC surface is more structured:– Filler and fiber with moderate temperature difference.– Hot spots with large temperature excursions (but small size)
• The effect on the measured temperature is about 10% and can be corrected.
• Layers as found in the high heat load region (AUG, JET) have a small impact on the temperature increase.
• Isolated layers may result in significant errors (heat flux).
2/84
mMWKTFGG −≈∆


