

Sustainable steel bridge maintenance: SustaSustainable
Sustainable steel bridge maintenance:
The role of paint in a LCA A":inable steel bridge maintenance:
The role of paint in a LCA":CEPE Annual Conference 2014 in RigaDr. Irmgard Winkels – Sika Deutschland GmbH
Content
• Starting point• Goal and scope• Description of the study• Results of three different scenarios• Conclusions
Starting Point
• CEPE built up an LCI database for coatings raw materials and paint production models. A tool – called Eco Footprint Tool - was developed to calculate footprints of coatings based on this database
• Result: environmental data for 1 kg of liquid paint (cradle to exit gate)

Example for a footprint
Impact categories
Global Warming Potential or Carbon footprint (GWP) 3385.1 g CO2 eq
Ozone Depletion Potential (ODP) 298.2 μg CFC-11 eq
Photochemical Ozone Creation Potential (POCP) 1716.3 mg C2H4 eq Acidification Potential (AP) 20.6 g SO2 eq Eutrophication Potential (EP) 8317.9 mg PO4 eq
Energy Content
Non-renewable 62.5 MJ Renewable 2.7 MJ
Waste
Non-hazardous 26 g Hazardous 11 g
Resource Consumption
Non-renewable 3.9 kg Renewable 6 kg Water 147.5 kg
Protective Coatings sector group decision
Use this LCI database and Eco Footprint Tool to demonstrate how coatings can affect the sustainability of coated goods
Calculate the role of paint concerning the sustainability in steel bridge maintenance

Goal and scope
• Impact of varying coating thicknesses on the sustainability of a steel bridge
• Perspective of an infra-structure responsible department
• Functional unit: Building and maintaining a bridge on a rural road, passing over a motorway, for 100 years

Study and calculation
Done by Ecomatter based on assumptions given by CEPE,
e.g. durability of coating systems, duration of coating application and surface preparation

Alternative coating systems
Coating system 1
Coating system 2
Coating system 3
Zinc rich epoxy 80 µm 80 µm 80 µm
MIO-pigmented intermediate coat, epoxy - 120 µm 80 µm
MIO-pigmented intermediate coat, epoxy - - 80 µm
Acrylic urethane top coat 120 µm 80 µm 80 µm Repainting period / maintenance interval 15 years 25 years 40 years

Scenarios
Scenario 1: Full life cycle Bridge construction, disposal and maintenance,
including traffic disturbances.
Scenario 2: Bridge maintenance Maintenance, including traffic disturbances.
Scenario 3: Only coatingsOnly coating related emissions over the life
cycle.
Bridge Coating
SteelBridge Initial construction
Re-routing of traffic
Bridge disposal and
end of life
Bridge Maintenance
Bridge Coating
Scenario 1
Re-routing of traffic
Concrete
Scenario 3
Scenario 2

Use and maintenance
Maintenance additional activities, equipment and transport have not been included in the model.
Activity Type of road Disturbance Total time Period
Painting: Blasting + Primer coat
Motorway and rural A Road closure 16 h Weekend night
Painting: Intermediate coat Motorway and rural A Road closure 8 h Weekend night
Painting: Top coat Motorway and rural A Road closure 8 h Weekend night
Specification 1 Specification 2 Specification 3
Painting frequency 6 times / 100 years 3 times / 100 years 2 times / 100 years
Total time per activity (all coats) 24 h 32 h 40 h
Rerouting distance per activity 599.455 km 799.259 km 999.074 km
Spec 1 - Comp 1Spec 2 - Comp 1Spec 3 - Comp 1
GWP
TotalBridge Materials
CoatingsEnd of life
Traff ic
Glo
bal W
arm
ing
Pot
entia
l (G
WP
100
yea
rs) 2,400,000.0
2,200,000.0
2,000,000.0
1,800,000.0
1,600,000.0
1,400,000.0
1,200,000.0
1,000,000.0
800,000.0
600,000.0
400,000.0
200,000.0
0.0
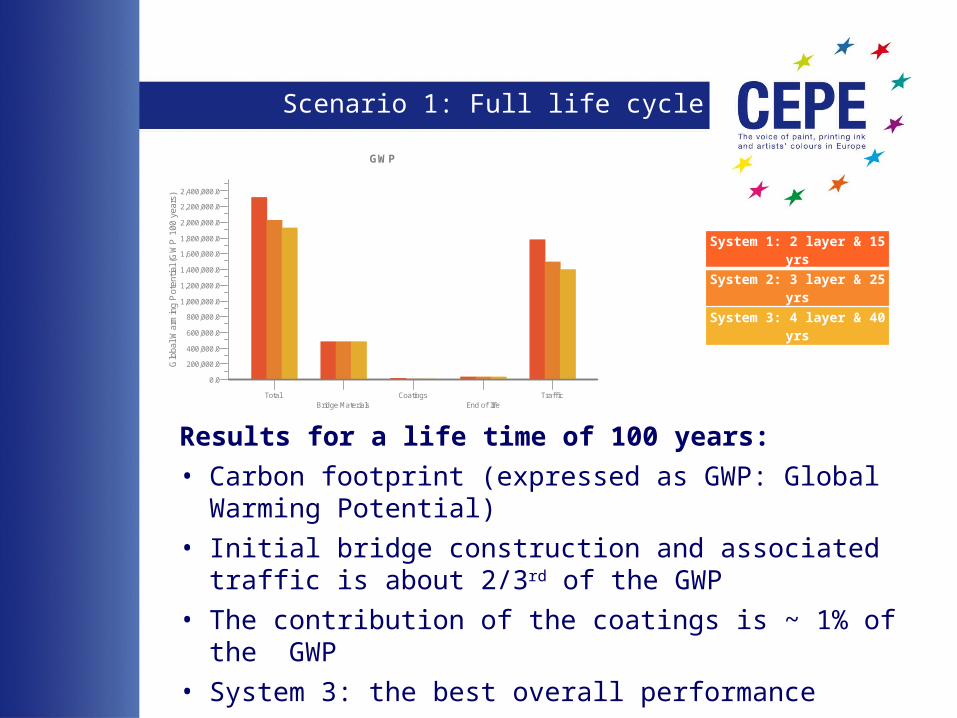
Scenario 1: Full life cycle
Results for a life time of 100 years:
• Carbon footprint (expressed as GWP: Global Warming Potential)
• Initial bridge construction and associated traffic is about 2/3rd of the GWP
• The contribution of the coatings is ~ 1% of the GWP
• System 3: the best overall performance
• Similar conclusions for the other impact categories
System 1: 2 layer & 15 yrs
System 2: 3 layer & 25 yrs
System 3: 4 layer & 40 yrs
Conclusion
Differentiation of coatings systems not possible
Image courtesy of phanlop88 / FreeDigitalPhotos.net
Closer look necessary
Spec 1 - Comp 2Spec 2 - Comp 2Spec 3 - Comp 2
GWP
TotalCoatings
Traff ic
Glo
bal W
arm
ing
Pot
entia
l (G
WP
100
yea
rs) 2,400,000.0
2,200,000.0
2,000,000.0
1,800,000.0
1,600,000.0
1,400,000.0
1,200,000.0
1,000,000.0
800,000.0
600,000.0
400,000.0
200,000.0
0.0
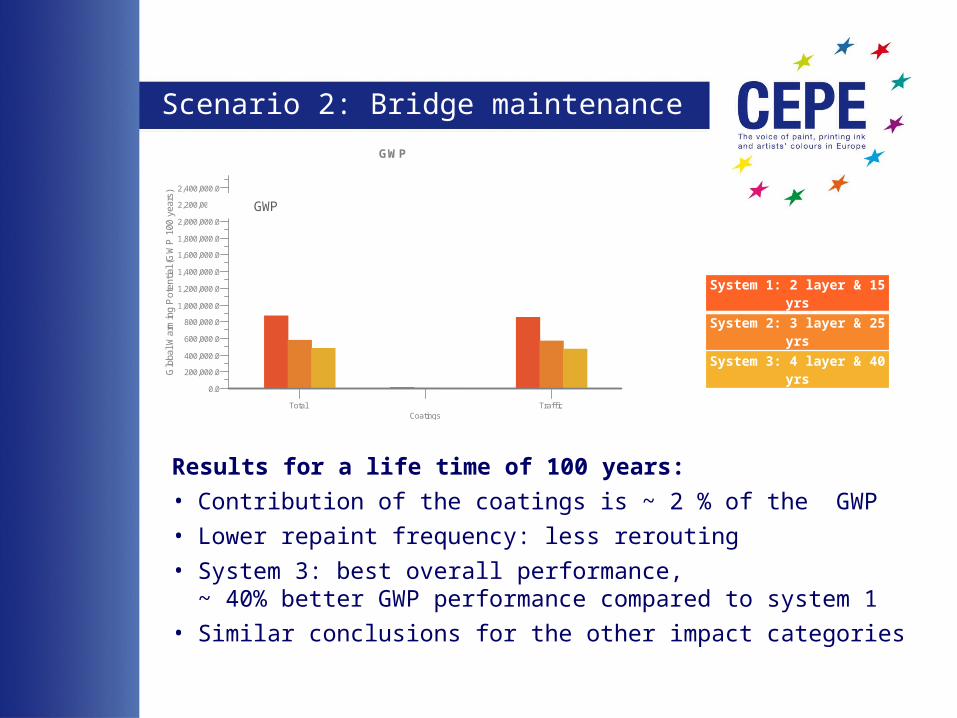
Scenario 2: Bridge maintenance
Results for a life time of 100 years:
• Contribution of the coatings is ~ 2 % of the GWP
• Lower repaint frequency: less rerouting
• System 3: best overall performance, ~ 40% better GWP performance compared to system 1
• Similar conclusions for the other impact categories
System 1: 2 layer & 15 yrs
System 2: 3 layer & 25 yrs
System 3: 4 layer & 40 yrs
GWP
Spec 1 - Comp 2Spec 2 - Comp 2Spec 3 - Comp 2
ADP fossil
TotalCoatings
Traff ic
Abi
otic
Dep
letio
n fo
ssil
10,000,000.0
8,000,000.0
6,000,000.0
4,000,000.0
2,000,000.0
0.0
Spec 1 - Comp 2Spec 2 - Comp 2Spec 3 - Comp 2
ODP, steady state
TotalCoatings
Traff ic
Ozo
ne L
ayer
Dep
letio
n P
oten
tial
.1
Spec 1 - Comp 2Spec 2 - Comp 2Spec 3 - Comp 2
EP
TotalCoatings
Traff ic
Eut
roph
icat
ion
Pot
entia
l
700.0
600.0
500.0
400.0
300.0
200.0
100.0
0.0
Spec 1 - Comp 2Spec 2 - Comp 2Spec 3 - Comp 2
Human tox
TotalCoatings
Traff ic
Hum
an T
oxic
ity P
oten
tial 250,000.0
200,000.0
150,000.0
100,000.0
50,000.0
0.0
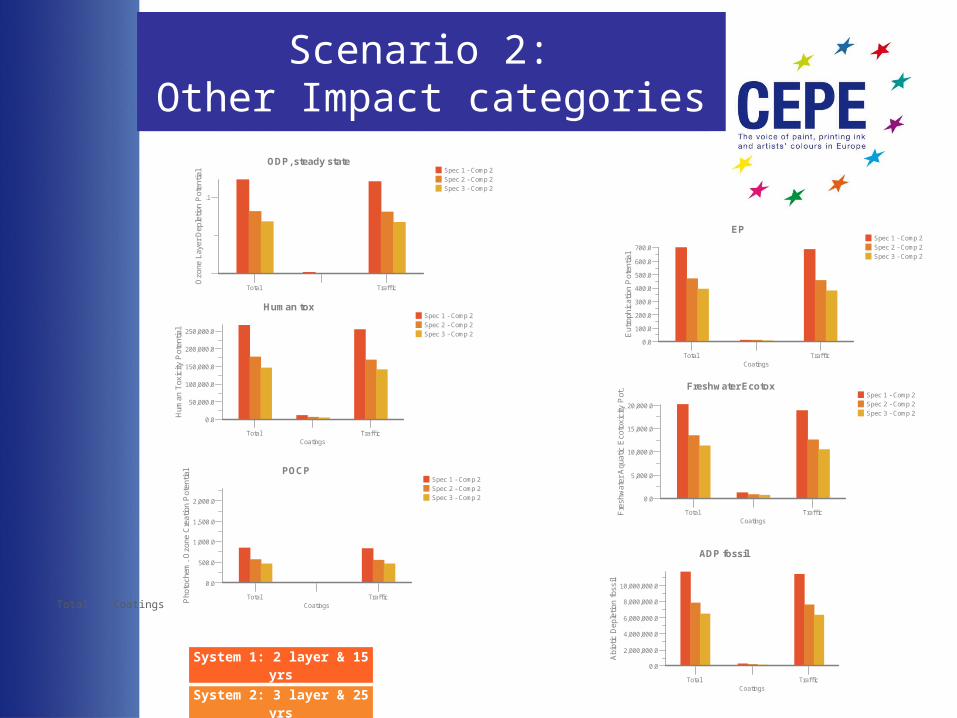
Scenario 2: Other Impact categories
System 1: 2 layer & 15 yrs
System 2: 3 layer & 25 yrs
System 3: 4 layer & 40 yrs
Total Coatings Traffic
Spec 1 - Comp 2Spec 2 - Comp 2Spec 3 - Comp 2
POCP
TotalCoatings
Traff icPho
toch
em.
Ozo
ne C
reat
ion
Pot
entia
l
2,000.0
1,500.0
1,000.0
500.0
0.0
Spec 1 - Comp 2Spec 2 - Comp 2Spec 3 - Comp 2
Freshwater Ecotox
TotalCoatings
Traff icFre
shw
ater
Aqu
atic
Eco
toxi
city
Pot
.
20,000.0
15,000.0
10,000.0
5,000.0
0.0
Spec 1 - Comp 2Spec 2 - Comp 2Spec 3 - Comp 2
AP
TotalCoatings
Traff ic
Aci
dific
atio
n P
oten
tial 2,500.0
2,000.0
1,500.0
1,000.0
500.0
0.0
Spec 1 - Comp 2Spec 2 - Comp 2Spec 3 - Comp 2
Marine Ecotox
TotalCoatings
Traff ic
Mar
ine
Aqu
atic
Eco
toxi
city
Pot
.
60,000,000.0
50,000,000.0
40,000,000.0
30,000,000.0
20,000,000.0
10,000,000.0
0.0
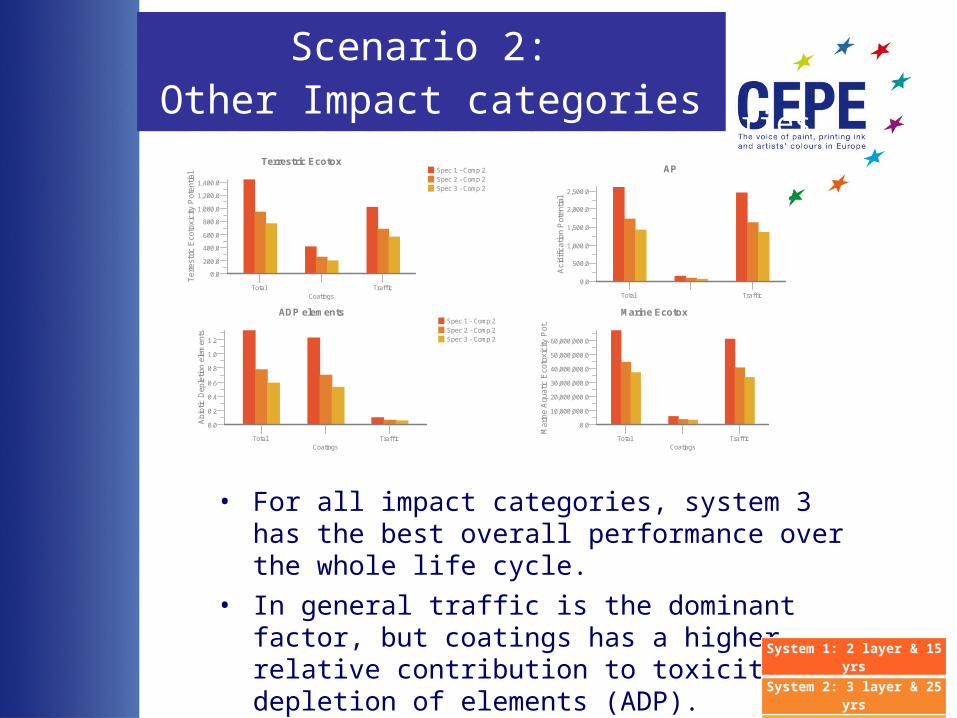
Scenario 2: Other Impact categories
• For all impact categories, system 3 has the best overall performance over the whole life cycle.
• In general traffic is the dominant factor, but coatings has a higher relative contribution to toxicity and depletion of elements (ADP). System 1: 2 layer & 15 yrs
System 2: 3 layer & 25 yrs
System 3: 4 layer & 40 yrs
Spec 1 - Comp 2Spec 2 - Comp 2Spec 3 - Comp 2
ADP elements
TotalCoatings
Traff ic
Abi
otic
Dep
letio
n el
emen
ts
1.2
1.0
0.8
0.6
0.4
0.2
0.0
Spec 1 - Comp 2Spec 2 - Comp 2Spec 3 - Comp 2
Terrestric Ecotox
TotalCoatings
Traff ic
Ter
rest
ric E
coto
xici
ty P
oten
tial
1,400.0
1,200.0
1,000.0
800.0
600.0
400.0
200.0
0.0
Scenario 2: Other Impact categories
Spec 1 - CoatingSpec 2 - CoatingSpec 3 - Coating
GWP
TotalAcrylic Topcoat
MIO IntermediateZinc Rich Primer
Glo
bal W
arm
ing
Pot
entia
l (G
WP
100
yea
rs) 16,000.0
14,000.0
12,000.0
10,000.0
8,000.0
6,000.0
4,000.0
2,000.0
0.0
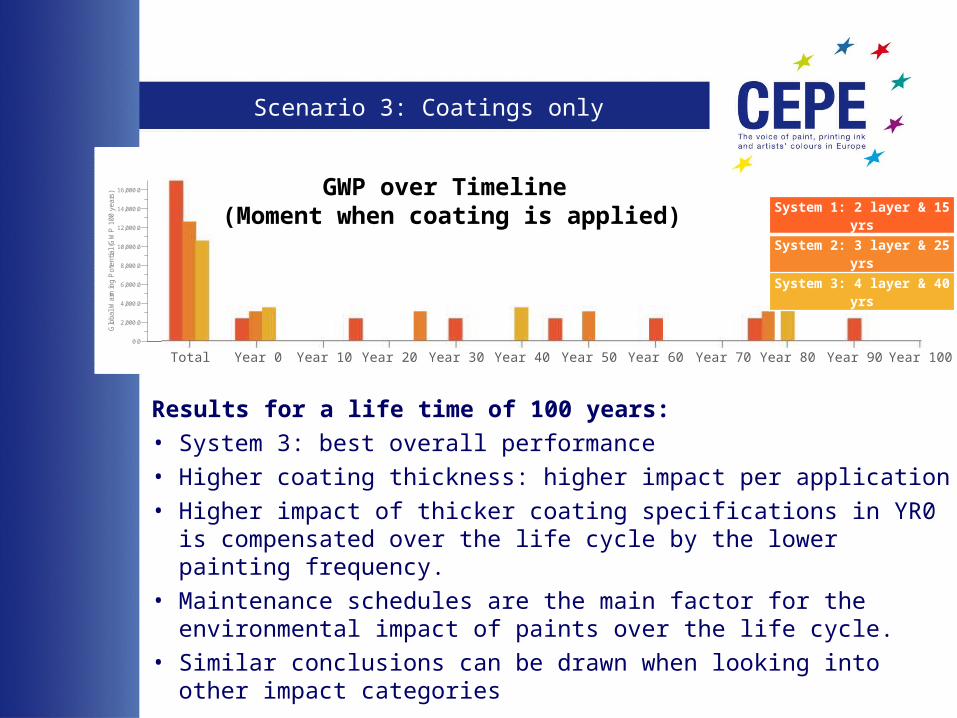
Scenario 3: Coatings only
System 1: 2 layer & 15 yrs
System 2: 3 layer & 25 yrs
System 3: 4 layer & 40 yrs
Total Year 0 Year 10 Year 20 Year 30 Year 40 Year 50 Year 60 Year 70 Year 80 Year 90 Year 100
GWP over Timeline (Moment when coating is applied)
Results for a life time of 100 years:
• System 3: best overall performance
• Higher coating thickness: higher impact per application
• Higher impact of thicker coating specifications in YR0 is compensated over the life cycle by the lower painting frequency.
• Maintenance schedules are the main factor for the environmental impact of paints over the life cycle.
• Similar conclusions can be drawn when looking into other impact categories
Spec 1 - Comp 3Spec 2 - Comp 3Spec 3 - Comp 3
GWP
TotalZinc Rich Primer
Acrylic TopcoatMIO Intermediate
Glo
bal W
arm
ing
Pot
entia
l (G
WP
100
yea
rs) 16,000.0
14,000.0
12,000.0
10,000.0
8,000.0
6,000.0
4,000.0
2,000.0
0.0
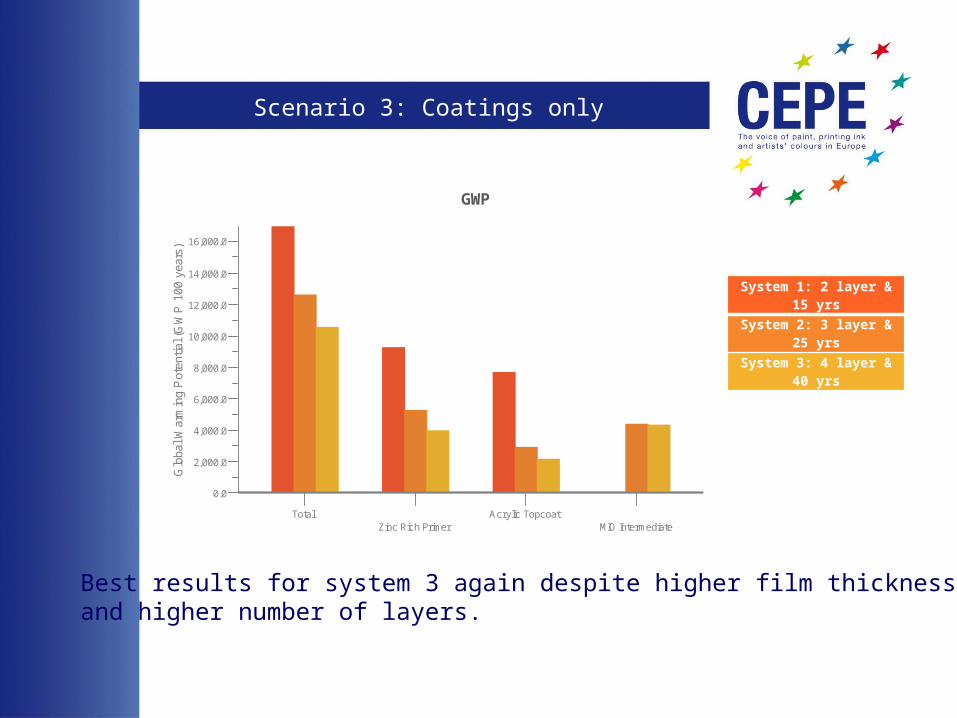
Scenario 3: Coatings only
System 1: 2 layer & 15 yrs
System 2: 3 layer & 25 yrs
System 3: 4 layer & 40 yrs
GWP
Best results for system 3 again despite higher film thickness and higher number of layers.
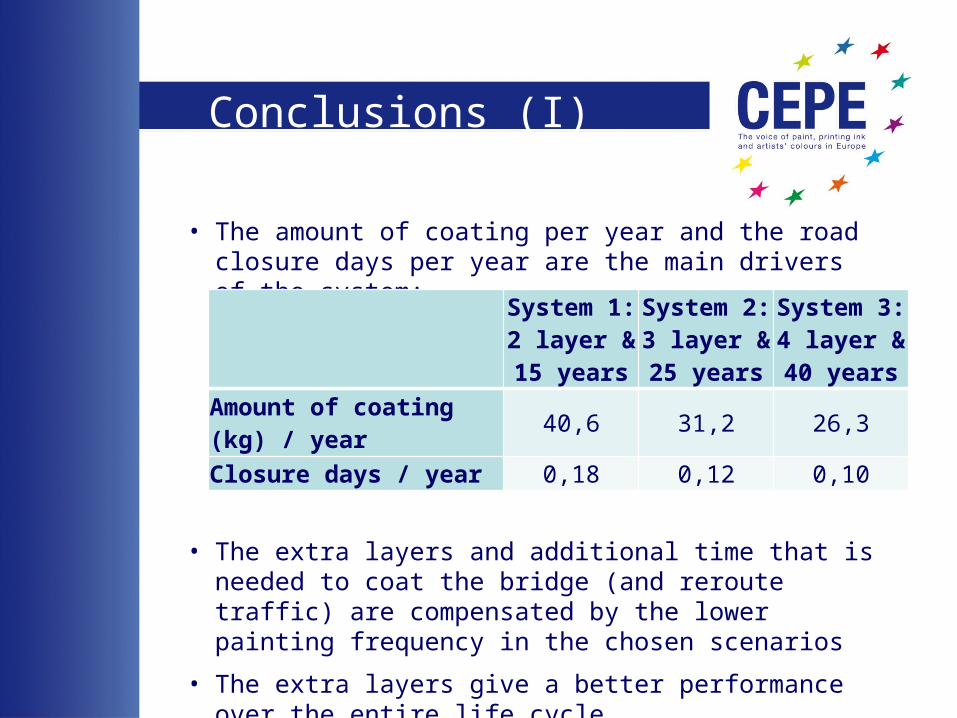
• The amount of coating per year and the road closure days per year are the main drivers of the system:
• The extra layers and additional time that is needed to coat the bridge (and reroute traffic) are compensated by the lower painting frequency in the chosen scenarios
• The extra layers give a better performance over the entire life cycle.
Conclusions (I)
System 1: 2 layer & 15
years
System 2: 3 layer & 25
years
System 3: 4 layer & 40
yearsAmount of coating (kg) / year
40,6 31,2 26,3
Closure days / year 0,18 0,12 0,10
• For all scenarios, System 3 has the best overall performance during 100 years period.
• Direct impact caused by coatings is not significant, compared to the full bridge construction as well as to the need to reroute traffic. Variations in traffic disruptions during maintenance cause the main differences between the three specifications.
• Although the relative impact from building the bridge may change, the trends as presented are valid for different bridge sizes (length and width) if they follow similar maintenance cycles.
• The sustainability of the bridge is strongly determined by the durability of the coating system.
Conclusions (II)

Thank you


