
Proceedings of the ASME 2019 Turbomachinery Technical Conference and ExpositionTurbo Expo 2019
June 17 - 21, 2019, Phoenix, AZ, USA
GT2019-92073
SWIRL DISTORTION USING STREAM VANES FOR BOUNDARY LAYER INGESTIONRESEARCH
Dr. Julia E. StephensNASA Glenn Research Center
Cleveland, OH 44135
Dr. Mark CelestinaDr. Christopher Hughes
NASA Glenn Research CenterCleveland, OH 44135
ABSTRACTThe swirl distortion of a StreamVaneTM was investigated
in the NASA Glenn Research Center W8 test facility. TheStreamVaneTM was designed and generated by Virginia Techbased on CFD simulations and included a center body at theaerodynamic interface plane. The swirl pattern generated by thedistortion was evaluated using a dense grid of 5-hole Pitot probemeasurements captured using a rotating array of probes. Goodagreement was found between the design intent and the resultsat 38.5 kg/s mass flow. The StreamVaneTM swirl results were com-pared to clean facility flow at 5 inlet mass flows and found to beconsistent. Additionally, the axial location of the StreamVaneTM
relative to the measurement plane was investigated to determinethe impact on downstream total pressure loss generated by thevanes. The intent of this work was to assess the viability of usinga StreamVaneTM to generate a Type I or Type II distortion into aBoundary Layer Ingesting propulsor to assess its aerodynamicperformance and aeromechanic response.
INTRODUCTIONFor decades it has been proposed that wake ingestion could
be beneficial to aircraft propulsion similar to its benefit to marinepropulsion. Application of such techniques has been limited inair breathing propulsion for a number of reasons, including fea-sibility of ingesting large enough volumes of the boundary layerfor the benefit to be seen, and building highly efficient enginesthat can withstand the loads generated by the highly distortedflow. In 1993 Smith outlined the math to quantify the potential
benefit of such a coupled airframe-propulsor system [1].The distortion caused by the boundary layer results in two
distinct but highly coupled phenomena which impact engine per-formance. First, the total pressure loss as a result of distor-tion results in decreasing the total pressure in front of the fanand therefore increasing the pressure ratio across it [2]. Totalpressure distortion has been extensively studied, and the use ofpressure screens has been used to simulate the effect in labs fordecades [3, 4]. Second, the swirl changes the incidence angle ofthe flow at the inlet. If this angle variation is large enough, theflow over the fan blades can separate, reducing the efficiency ofthe system.
Measurement of swirl has been a concern for several yearsand there are guidelines for the measurement of swirl for enginedevelopment [5]. The SAE Methodology for Assessing SwirlDistortion [5] includes numerous examples of engines ingestingswirl and the consequences to performance, particularly to mili-tary aircraft applications. Several methods to simulate swirl arealso discussed in the SAE document [5]. These include turn-ing vanes, use of wing tip vortices, and use of swirl chambers.The examples given are for typical swirl patterns (bulk swirl,twin swirl). Simulation of patterns of more complicated flowshas been difficult to create reliably due to the complex structuresneeded and the cost of manufacturing such devices [6].
With recent advances in aircraft designs that include hybrid-wing bodies and electrically driven or enhanced aircraft, the po-tential benefits of Boundary Layer Ingesting aircraft are growing.System studies have shown a number of potential aircraft thatwould benefit from Boundary Layer Ingestion (BLI) technology.
1This material is declared a work of the U.S. Government and is not subject to copyright protection in the United States. Approved forpublic release; distribution is unlimited.
One study by Kawai et al. found that a compact aft-mountedBLI propulsion system could provide 3 - 5 % fuel burn reductionrelative to standard pylon-mounted configurations [7]. In 2012Hardin et al. did system studies on more advanced configura-tions and found up to 10% benefit [8]. Turnbull compiled a listof analyses showing between 3 and 10% benefit [9].
Building on these studies, an integrated Fan and Inlet testwas performed at NASA Glenn Research Center’s 8-foot-by-6-foot wind tunnel. The Boundary Layer Ingesting Inlet/DistortionTolerant Fan (BLI2DTF) test obtained detailed fan performancemeasurements of a distortion tolerant fan designed in conjunc-tion with a boundary layer ingesting inlet [10] and a Variablearea nozzle. Results at Mach 0.78 in NASA GRC’s 8-foot-by-6-ft wind tunnel agreed well with CFD, proved the fan’s robust-ness, and showed better than anticipated performance at designconditions [11].
STREAMVANE DESIGN USING CFDWhile the NASA BLI2DTF fan test was incredibly informa-
tive regarding both the benefits of BLI for fans and the ability offans to withstand the loads associated with this environment, italso exemplified the complexity of the problem faced when inte-grating propulsors with airframe bodies. The propulsor interactswith the incoming flow, changing it, and this interaction is notfully understood. The flow itself is highly complicated, and thestructures impacting the fan are difficult to measure due to accessconstraints. Parsing the impact of swirl, total pressure distortion,and static pressure distortion is very difficult.
Recently Virginia Tech University developed patented tech-nology to produce distinct swirl patterns based on CFD. Theproduct, a StreamVaneTM , creates the swirl by placing curves ev-erywhere perpendicular to the desired flow. The complex struc-tures are created using additive manufacturing. Their ability toproduce the desired flow and be structurally robust has been in-vestigated [6, 12–14].
The purpose of this study was to validate the flow field gen-erated by the StreamVaneTM in NASA Glenn Research Center’sW8 facility. Once the method of StreamVaneTM design and im-plementation in this facility is established, studies of fans behindStreamVanesTM can be utilized to gain initial understandings ofthe impact of various swirl structures on fan performance. Uti-lizing StreamVaneTM technology allows the study of several com-ponents of BLI independently [15]. StreamVanesTM can be pro-duced relatively quickly and relatively inexpensively based onCFD models of the flow. Placing the StreamVaneTM in the inletupstream of a fan will then allow us to study the impact of swirlon fan performance. Total pressure distortion screens can thenbe added to the design of future iterations to obtain representa-tive total pressure distortion with swirl.
To design a StreamVaneTM geometry, first a target distortionprofile at some desired distance downstream of the StreamVaneTM
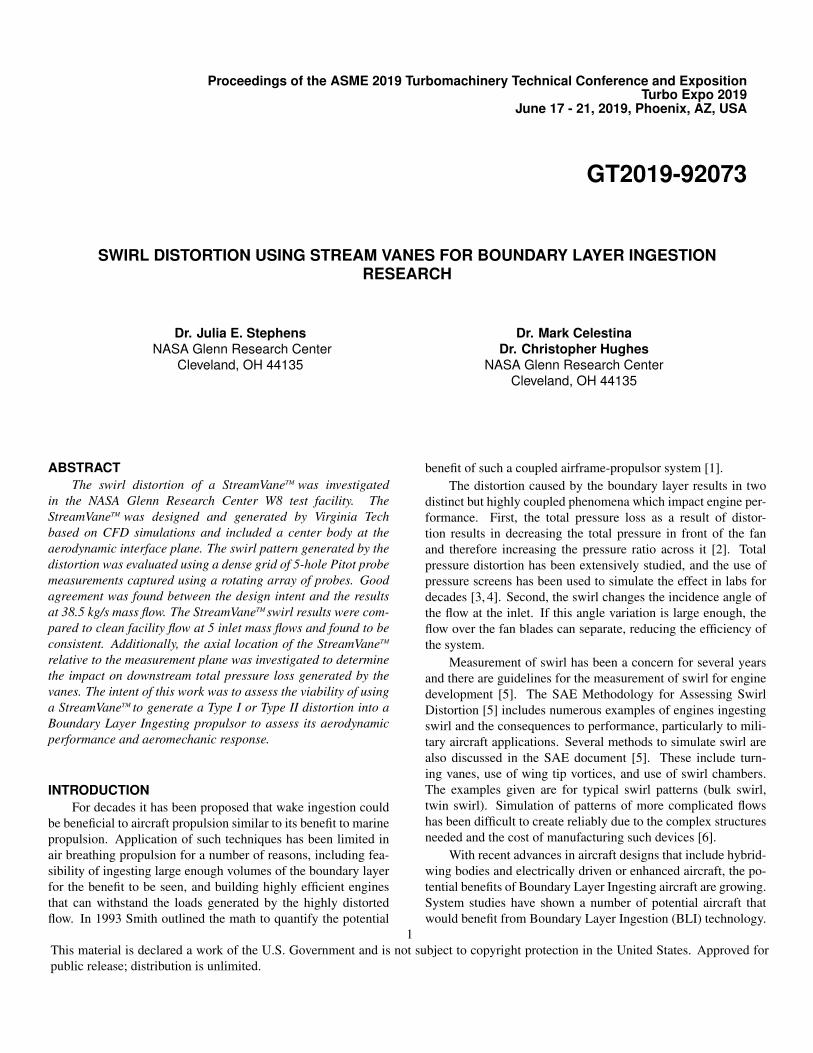
is defined. For this study United Technologies ComputationalFluid Dynamics (UTCFD) simulation of the NASA BLI2DTFFan flow field at the Aerodynamic Interface Plane (AIP) waschosen. This simulated flow field is shown in Fig.1a. Priorto this work, StreamVaneTM swirl distortion generators had beenconstructed to produce the desired swirl in an open, cylindri-cal duct based on a target profile that occupied the entire ductcross-sectional area. In this case, however, the target profilecontains a spinner which produces radially outward flow alongthe spinner and an annular distortion profile. The target profile(at the AIP) was used to produce a corresponding profile at theStreamVaneTM trailing edge, using StreamFlow, a computationalmethod developed at Virginia Tech. A conceptually similar tech-nique, operating on a pressure-velocity formulation and utilizingthe open-source CFD code OpenFOAM, can be found at [16].While the method described was effective at solving the forwardproblem (producing a downstream AIP profile based on a knownStreamVaneTM exit profile), it was not suitable for directly solv-ing the inverse problem (finding the necessary StreamVaneTM exitprofile to produce a desired AIP profile) due to numerical in-stability. A rewritten and unpublished version of StreamFlow,based on the vorticity transport equation and implemented with-out a dependency on OpenFOAM, has been developed at VirginiaTech to accurately solve both the forward and inverse propaga-tion problems. This method was used to perform the propagationfor this case. The output of this method was then validated byusing ANSYS CFX to propagate the StreamVaneTM exit profiledownstream, and compare the resulting profile at the AIP to theAIP target profile.
The expected swirl angles at the AIP when the StreamVaneTM
is placed 0.53 diameters upstream, with an inlet mass flow of 41kg/s (90 lbms/s, test section inlet Mach number of 0.44) basedon the Virginia Tech CFD is shown in Fig.1b. When compar-ing this to the target profile shown in Fig.1a, it is apparent thatthe large scale swirl structures are well matched. However, inthe region between the strongest swirl structures and the center-body the StreamVaneTM produces low magnitude swirl structuresrotating counterclockwise to the boundary layer swirl structuresproduced by the Boundary Layer Ingesting interface.
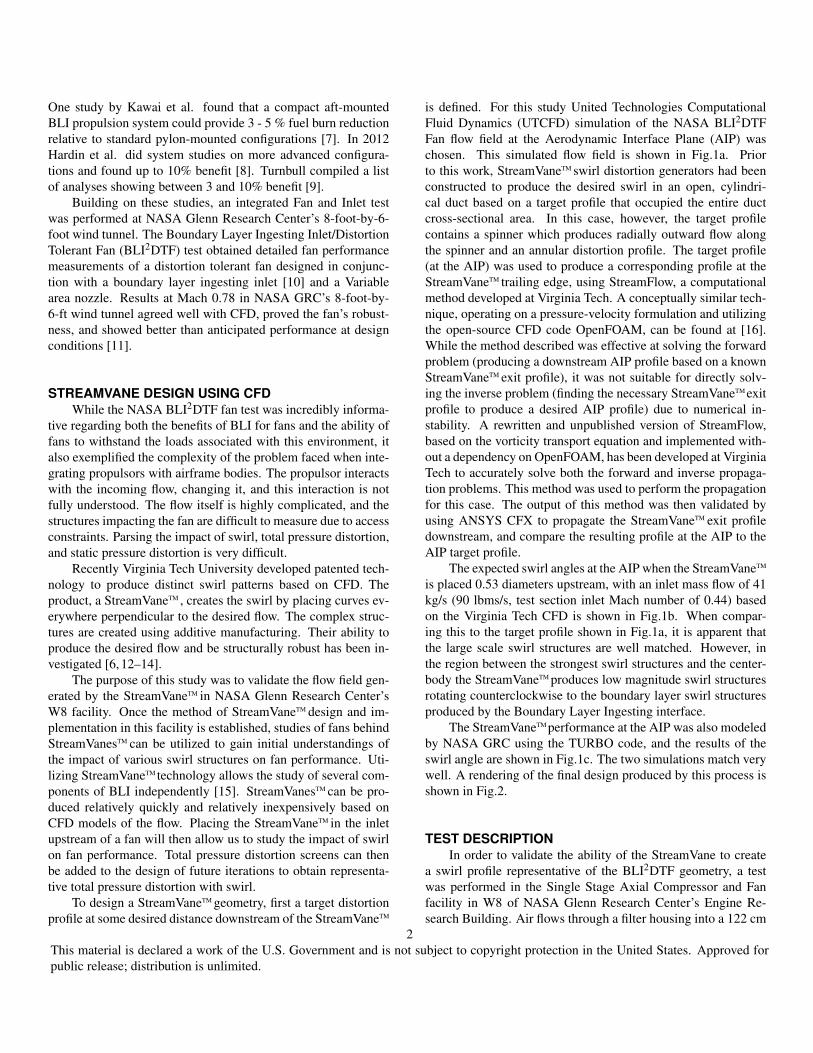
The StreamVaneTM performance at the AIP was also modeledby NASA GRC using the TURBO code, and the results of theswirl angle are shown in Fig.1c. The two simulations match verywell. A rendering of the final design produced by this process isshown in Fig.2.
TEST DESCRIPTIONIn order to validate the ability of the StreamVane to create
a swirl profile representative of the BLI2DTF geometry, a testwas performed in the Single Stage Axial Compressor and Fanfacility in W8 of NASA Glenn Research Center’s Engine Re-search Building. Air flows through a filter housing into a 122 cm
2This material is declared a work of the U.S. Government and is not subject to copyright protection in the United States. Approved forpublic release; distribution is unlimited.
(a) UTCFD PREDICTION OF DESIREDSWIRL ANGLE.
(b) VIRGINIA TECH CFD PREDICTIONOF STREAMVANE PROVIDED SWIRLANGLE.
(c) GRC CFD PREDICTION USINGTURBO OF STREAMVANE PROVIDEDSWIRL ANGLE.
FIGURE 1: CFD PREDICTIONS OF THE THE SWIRL AT THE AIP AT 41 KG/S MASSFLOW.
FIGURE 2: RENDERING OF THE FINAL STREAMVANE DESIGN.
(48 inch) pipe, mass flow is measured using a 88.9 cm (35 inch)orifice plate, the flow is turned through two 90-degree bends,then goes through several screens and honeycomb in to a settlingplenum before being re-accelerated in to a 56 cm (22 inch) di-ameter pipe. The 56 cm diameter test section has a 17.75 cm (7inch) diameter nose cone at the end of the shaft where rotatingmachinery is normally mounted. This nose cone was left in toprovide representative flow for when the propulsor is installedduring later investigations.
Five mass flows that span the available mass flow range ofthe facility were investigated: 13.6, 22.7, 31.8, 38.5, and 45.4kg/s (corresponding to test section inlet Mach numbers of 0.014,
0.23, 0.32, 0.41, and 0.48). Because independent CFD studieswere done at 41 kg/s (90 lbm/s, Mach number of 0.44), the resultspresented focus on the 38.5 kg/s results to be as close as possibleto compare. Table 1 shows the different mass flow and inlet Machnumber values considered for different cases.
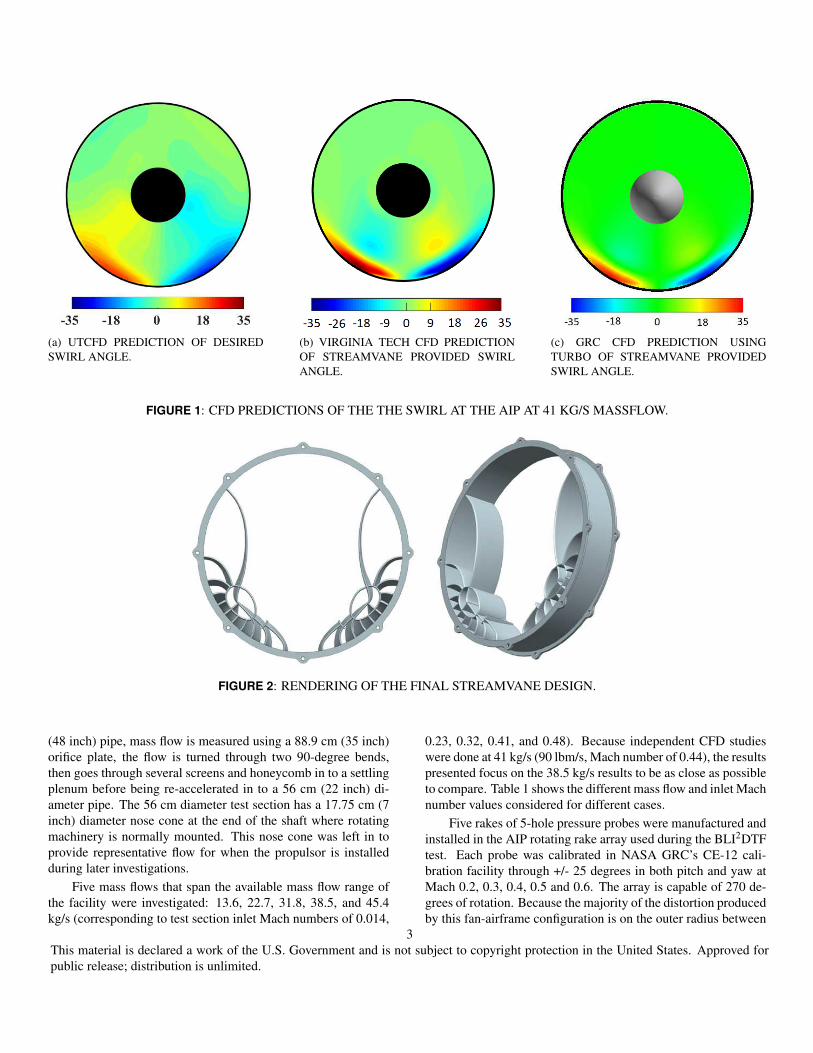
Five rakes of 5-hole pressure probes were manufactured andinstalled in the AIP rotating rake array used during the BLI2DTFtest. Each probe was calibrated in NASA GRC’s CE-12 cali-bration facility through +/- 25 degrees in both pitch and yaw atMach 0.2, 0.3, 0.4, 0.5 and 0.6. The array is capable of 270 de-grees of rotation. Because the majority of the distortion producedby this fan-airframe configuration is on the outer radius between
3This material is declared a work of the U.S. Government and is not subject to copyright protection in the United States. Approved forpublic release; distribution is unlimited.
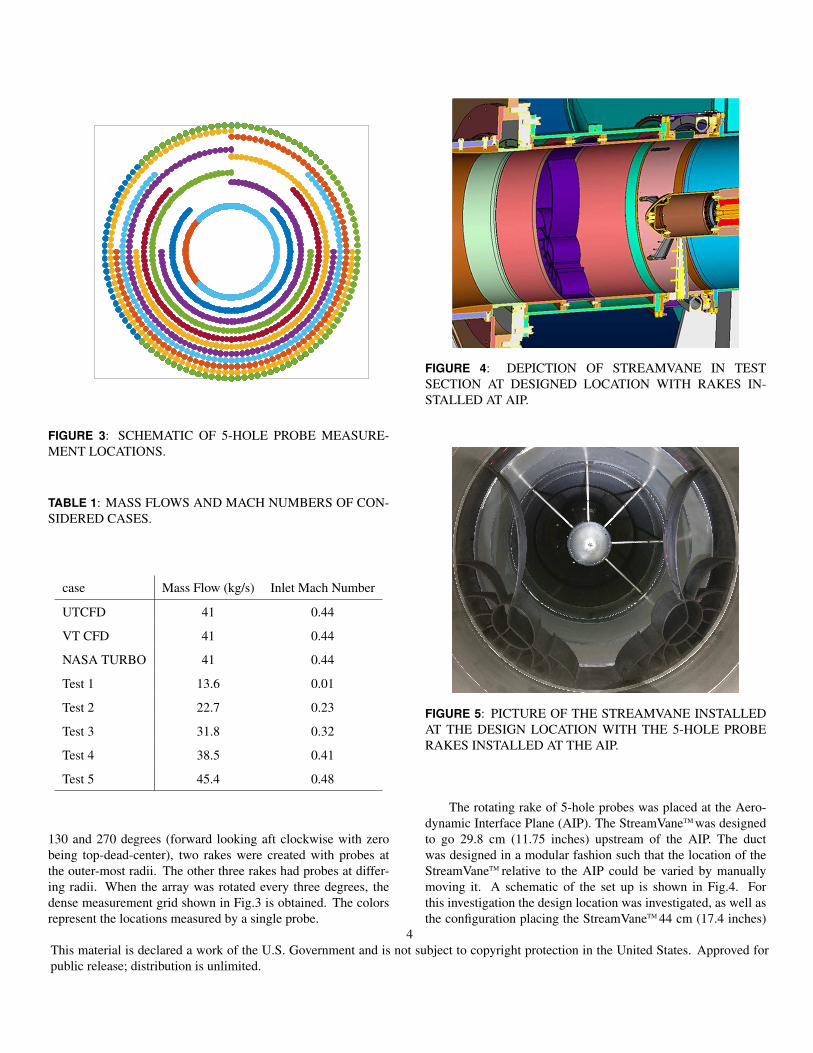
FIGURE 3: SCHEMATIC OF 5-HOLE PROBE MEASURE-MENT LOCATIONS.
TABLE 1: MASS FLOWS AND MACH NUMBERS OF CON-SIDERED CASES.
case Mass Flow (kg/s) Inlet Mach Number
UTCFD 41 0.44
VT CFD 41 0.44
NASA TURBO 41 0.44
Test 1 13.6 0.01
Test 2 22.7 0.23
Test 3 31.8 0.32
Test 4 38.5 0.41
Test 5 45.4 0.48
130 and 270 degrees (forward looking aft clockwise with zerobeing top-dead-center), two rakes were created with probes atthe outer-most radii. The other three rakes had probes at differ-ing radii. When the array was rotated every three degrees, thedense measurement grid shown in Fig.3 is obtained. The colorsrepresent the locations measured by a single probe.
FIGURE 4: DEPICTION OF STREAMVANE IN TESTSECTION AT DESIGNED LOCATION WITH RAKES IN-STALLED AT AIP.
FIGURE 5: PICTURE OF THE STREAMVANE INSTALLEDAT THE DESIGN LOCATION WITH THE 5-HOLE PROBERAKES INSTALLED AT THE AIP.
The rotating rake of 5-hole probes was placed at the Aero-dynamic Interface Plane (AIP). The StreamVaneTM was designedto go 29.8 cm (11.75 inches) upstream of the AIP. The ductwas designed in a modular fashion such that the location of theStreamVaneTM relative to the AIP could be varied by manuallymoving it. A schematic of the set up is shown in Fig.4. Forthis investigation the design location was investigated, as well asthe configuration placing the StreamVaneTM 44 cm (17.4 inches)
4This material is declared a work of the U.S. Government and is not subject to copyright protection in the United States. Approved forpublic release; distribution is unlimited.
upstream of the AIP to determine the impact of distance on theflow structures produced. A picture of the StreamVaneTM with the5-hole probe rakes installed downstream is shown in Fig.5. Thesecond location placed the StreamVane in the region that is pinkupstream of the design location shown in the figure.
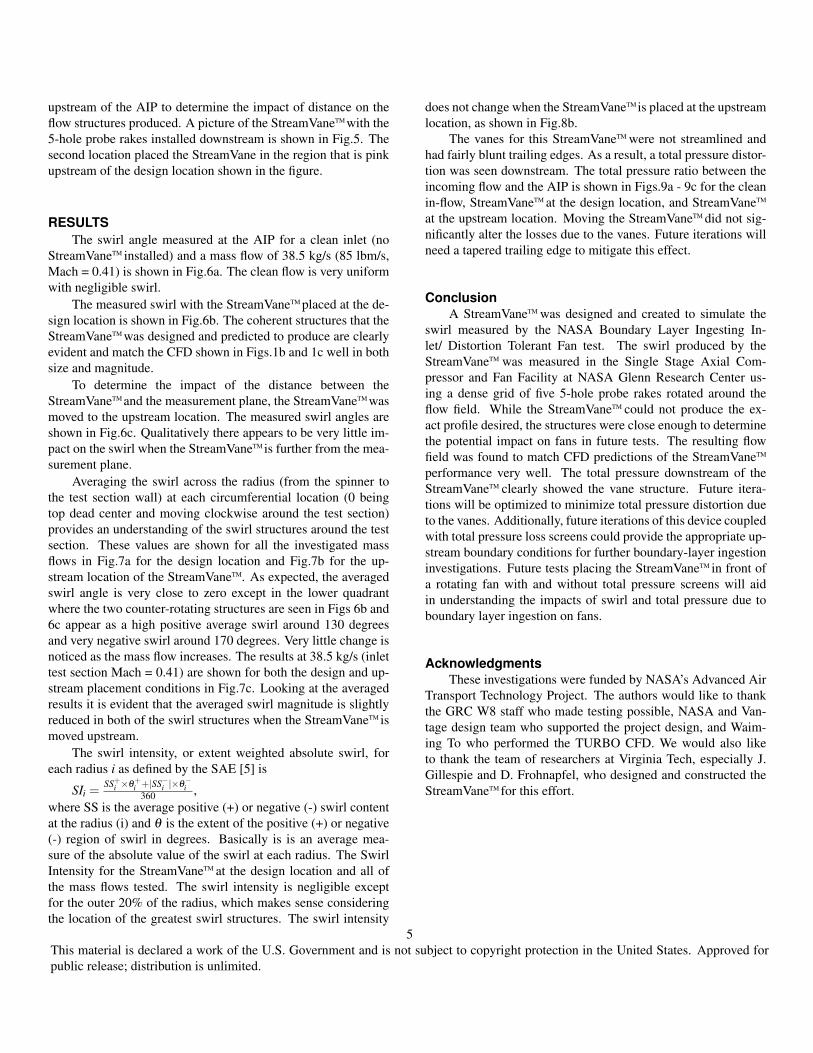
RESULTSThe swirl angle measured at the AIP for a clean inlet (no
StreamVaneTM installed) and a mass flow of 38.5 kg/s (85 lbm/s,Mach = 0.41) is shown in Fig.6a. The clean flow is very uniformwith negligible swirl.
The measured swirl with the StreamVaneTM placed at the de-sign location is shown in Fig.6b. The coherent structures that theStreamVaneTM was designed and predicted to produce are clearlyevident and match the CFD shown in Figs.1b and 1c well in bothsize and magnitude.
To determine the impact of the distance between theStreamVaneTM and the measurement plane, the StreamVaneTM wasmoved to the upstream location. The measured swirl angles areshown in Fig.6c. Qualitatively there appears to be very little im-pact on the swirl when the StreamVaneTM is further from the mea-surement plane.
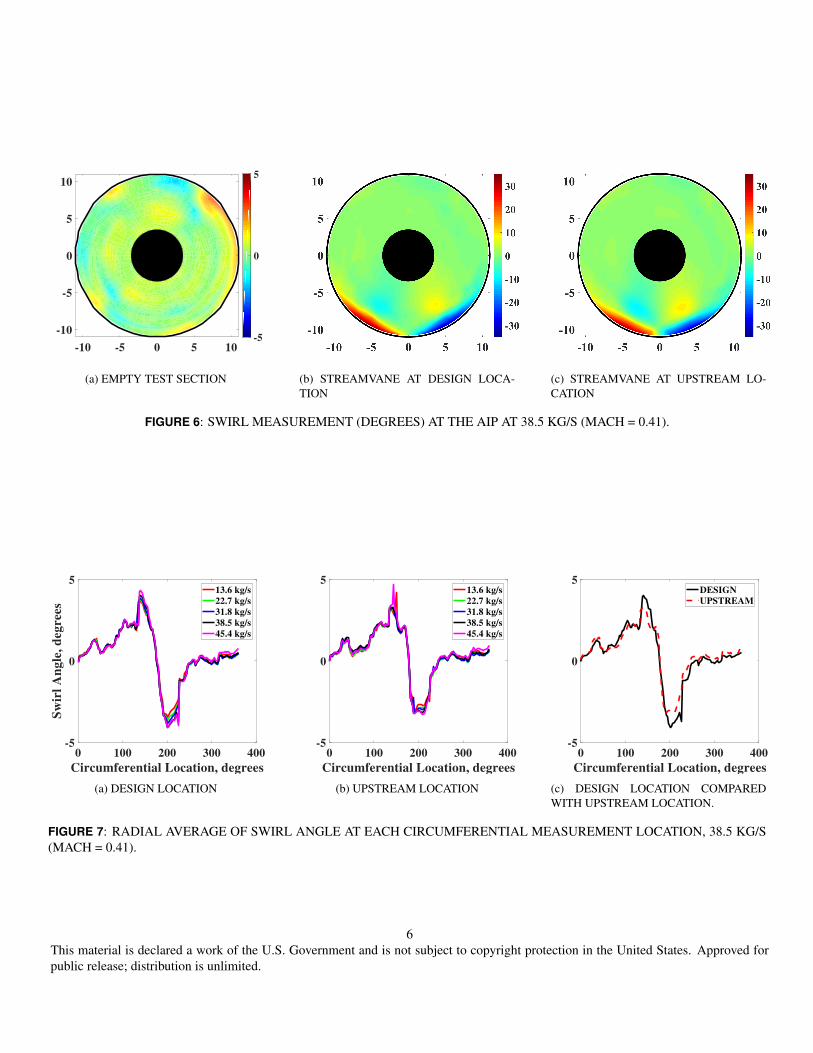
Averaging the swirl across the radius (from the spinner tothe test section wall) at each circumferential location (0 beingtop dead center and moving clockwise around the test section)provides an understanding of the swirl structures around the testsection. These values are shown for all the investigated massflows in Fig.7a for the design location and Fig.7b for the up-stream location of the StreamVaneTM. As expected, the averagedswirl angle is very close to zero except in the lower quadrantwhere the two counter-rotating structures are seen in Figs 6b and6c appear as a high positive average swirl around 130 degreesand very negative swirl around 170 degrees. Very little change isnoticed as the mass flow increases. The results at 38.5 kg/s (inlettest section Mach = 0.41) are shown for both the design and up-stream placement conditions in Fig.7c. Looking at the averagedresults it is evident that the averaged swirl magnitude is slightlyreduced in both of the swirl structures when the StreamVaneTM ismoved upstream.
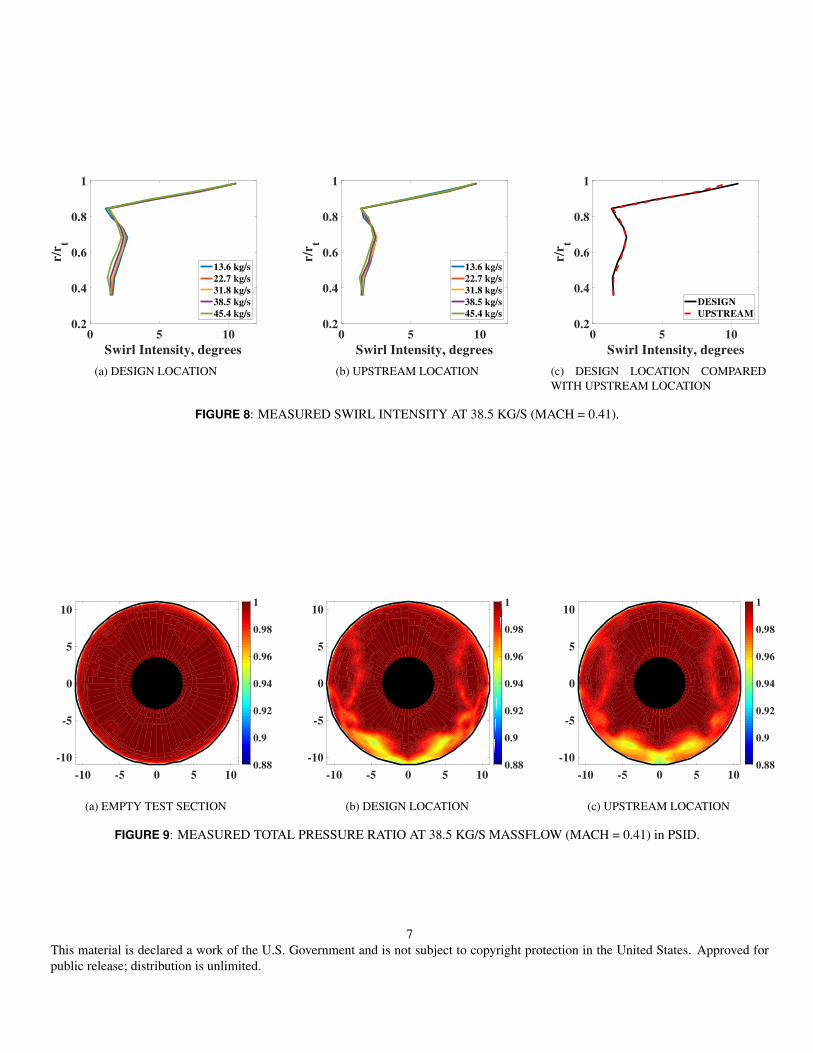
The swirl intensity, or extent weighted absolute swirl, foreach radius i as defined by the SAE [5] is
SIi =SS+i ×θ
+i +|SS−i |×θ
−i
360 ,where SS is the average positive (+) or negative (-) swirl contentat the radius (i) and θ is the extent of the positive (+) or negative(-) region of swirl in degrees. Basically is is an average mea-sure of the absolute value of the swirl at each radius. The SwirlIntensity for the StreamVaneTM at the design location and all ofthe mass flows tested. The swirl intensity is negligible exceptfor the outer 20% of the radius, which makes sense consideringthe location of the greatest swirl structures. The swirl intensity
does not change when the StreamVaneTM is placed at the upstreamlocation, as shown in Fig.8b.
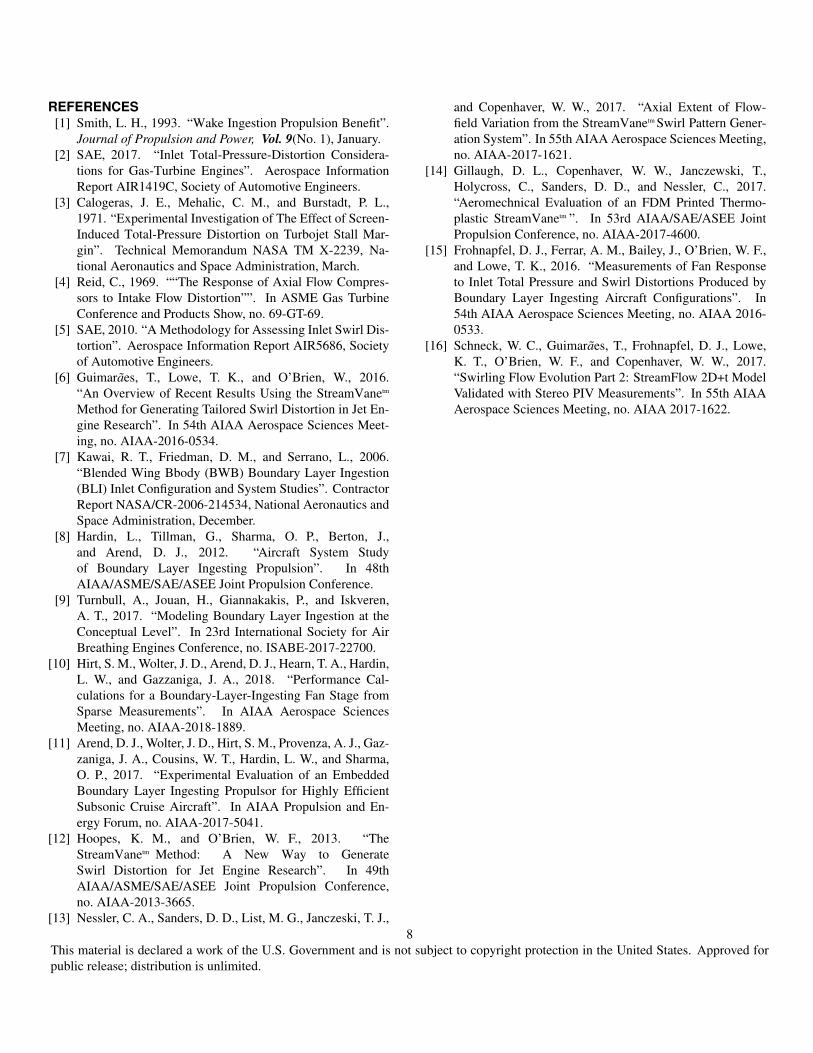
The vanes for this StreamVaneTM were not streamlined andhad fairly blunt trailing edges. As a result, a total pressure distor-tion was seen downstream. The total pressure ratio between theincoming flow and the AIP is shown in Figs.9a - 9c for the cleanin-flow, StreamVaneTM at the design location, and StreamVaneTM
at the upstream location. Moving the StreamVaneTM did not sig-nificantly alter the losses due to the vanes. Future iterations willneed a tapered trailing edge to mitigate this effect.
ConclusionA StreamVaneTM was designed and created to simulate the
swirl measured by the NASA Boundary Layer Ingesting In-let/ Distortion Tolerant Fan test. The swirl produced by theStreamVaneTM was measured in the Single Stage Axial Com-pressor and Fan Facility at NASA Glenn Research Center us-ing a dense grid of five 5-hole probe rakes rotated around theflow field. While the StreamVaneTM could not produce the ex-act profile desired, the structures were close enough to determinethe potential impact on fans in future tests. The resulting flowfield was found to match CFD predictions of the StreamVaneTM
performance very well. The total pressure downstream of theStreamVaneTM clearly showed the vane structure. Future itera-tions will be optimized to minimize total pressure distortion dueto the vanes. Additionally, future iterations of this device coupledwith total pressure loss screens could provide the appropriate up-stream boundary conditions for further boundary-layer ingestioninvestigations. Future tests placing the StreamVaneTM in front ofa rotating fan with and without total pressure screens will aidin understanding the impacts of swirl and total pressure due toboundary layer ingestion on fans.
AcknowledgmentsThese investigations were funded by NASA’s Advanced Air
Transport Technology Project. The authors would like to thankthe GRC W8 staff who made testing possible, NASA and Van-tage design team who supported the project design, and Waim-ing To who performed the TURBO CFD. We would also liketo thank the team of researchers at Virginia Tech, especially J.Gillespie and D. Frohnapfel, who designed and constructed theStreamVaneTM for this effort.
5This material is declared a work of the U.S. Government and is not subject to copyright protection in the United States. Approved forpublic release; distribution is unlimited.
-10 -5 0 5 10
-10
-5
0
5
10
-5
0
5
(a) EMPTY TEST SECTION (b) STREAMVANE AT DESIGN LOCA-TION
(c) STREAMVANE AT UPSTREAM LO-CATION
FIGURE 6: SWIRL MEASUREMENT (DEGREES) AT THE AIP AT 38.5 KG/S (MACH = 0.41).
0 100 200 300 400
Circumferential Location, degrees
-5
0
5
Sw
irl
An
gle
, d
eg
rees
13.6 kg/s
22.7 kg/s
31.8 kg/s
38.5 kg/s
45.4 kg/s
(a) DESIGN LOCATION
0 100 200 300 400
Circumferential Location, degrees
-5
0
513.6 kg/s
22.7 kg/s
31.8 kg/s
38.5 kg/s
45.4 kg/s
(b) UPSTREAM LOCATION
0 100 200 300 400
Circumferential Location, degrees
-5
0
5DESIGN
UPSTREAM
(c) DESIGN LOCATION COMPAREDWITH UPSTREAM LOCATION.
FIGURE 7: RADIAL AVERAGE OF SWIRL ANGLE AT EACH CIRCUMFERENTIAL MEASUREMENT LOCATION, 38.5 KG/S(MACH = 0.41).
6This material is declared a work of the U.S. Government and is not subject to copyright protection in the United States. Approved forpublic release; distribution is unlimited.
0 5 10
Swirl Intensity, degrees
0.2
0.4
0.6
0.8
1
r/r
t
13.6 kg/s
22.7 kg/s
31.8 kg/s
38.5 kg/s
45.4 kg/s
(a) DESIGN LOCATION
0 5 10
Swirl Intensity, degrees
0.2
0.4
0.6
0.8
1
r/r
t
13.6 kg/s
22.7 kg/s
31.8 kg/s
38.5 kg/s
45.4 kg/s
(b) UPSTREAM LOCATION
0 5 10
Swirl Intensity, degrees
0.2
0.4
0.6
0.8
1
r/r
t
DESIGN
UPSTREAM
(c) DESIGN LOCATION COMPAREDWITH UPSTREAM LOCATION
FIGURE 8: MEASURED SWIRL INTENSITY AT 38.5 KG/S (MACH = 0.41).
-10 -5 0 5 10
-10
-5
0
5
10
0.88
0.9
0.92
0.94
0.96
0.98
1
(a) EMPTY TEST SECTION
-10 -5 0 5 10
-10
-5
0
5
10
0.88
0.9
0.92
0.94
0.96
0.98
1
(b) DESIGN LOCATION
-10 -5 0 5 10
-10
-5
0
5
10
0.88
0.9
0.92
0.94
0.96
0.98
1
(c) UPSTREAM LOCATION
FIGURE 9: MEASURED TOTAL PRESSURE RATIO AT 38.5 KG/S MASSFLOW (MACH = 0.41) in PSID.
7This material is declared a work of the U.S. Government and is not subject to copyright protection in the United States. Approved forpublic release; distribution is unlimited.
REFERENCES[1] Smith, L. H., 1993. “Wake Ingestion Propulsion Benefit”.
Journal of Propulsion and Power, Vol. 9(No. 1), January.[2] SAE, 2017. “Inlet Total-Pressure-Distortion Considera-
tions for Gas-Turbine Engines”. Aerospace InformationReport AIR1419C, Society of Automotive Engineers.
[3] Calogeras, J. E., Mehalic, C. M., and Burstadt, P. L.,1971. “Experimental Investigation of The Effect of Screen-Induced Total-Pressure Distortion on Turbojet Stall Mar-gin”. Technical Memorandum NASA TM X-2239, Na-tional Aeronautics and Space Administration, March.
[4] Reid, C., 1969. ““The Response of Axial Flow Compres-sors to Intake Flow Distortion””. In ASME Gas TurbineConference and Products Show, no. 69-GT-69.
[5] SAE, 2010. “A Methodology for Assessing Inlet Swirl Dis-tortion”. Aerospace Information Report AIR5686, Societyof Automotive Engineers.
[6] Guimaraes, T., Lowe, T. K., and O’Brien, W., 2016.“An Overview of Recent Results Using the StreamVanetm
Method for Generating Tailored Swirl Distortion in Jet En-gine Research”. In 54th AIAA Aerospace Sciences Meet-ing, no. AIAA-2016-0534.
[7] Kawai, R. T., Friedman, D. M., and Serrano, L., 2006.“Blended Wing Bbody (BWB) Boundary Layer Ingestion(BLI) Inlet Configuration and System Studies”. ContractorReport NASA/CR-2006-214534, National Aeronautics andSpace Administration, December.
[8] Hardin, L., Tillman, G., Sharma, O. P., Berton, J.,and Arend, D. J., 2012. “Aircraft System Studyof Boundary Layer Ingesting Propulsion”. In 48thAIAA/ASME/SAE/ASEE Joint Propulsion Conference.
[9] Turnbull, A., Jouan, H., Giannakakis, P., and Iskveren,A. T., 2017. “Modeling Boundary Layer Ingestion at theConceptual Level”. In 23rd International Society for AirBreathing Engines Conference, no. ISABE-2017-22700.
[10] Hirt, S. M., Wolter, J. D., Arend, D. J., Hearn, T. A., Hardin,L. W., and Gazzaniga, J. A., 2018. “Performance Cal-culations for a Boundary-Layer-Ingesting Fan Stage fromSparse Measurements”. In AIAA Aerospace SciencesMeeting, no. AIAA-2018-1889.
[11] Arend, D. J., Wolter, J. D., Hirt, S. M., Provenza, A. J., Gaz-zaniga, J. A., Cousins, W. T., Hardin, L. W., and Sharma,O. P., 2017. “Experimental Evaluation of an EmbeddedBoundary Layer Ingesting Propulsor for Highly EfficientSubsonic Cruise Aircraft”. In AIAA Propulsion and En-ergy Forum, no. AIAA-2017-5041.
[12] Hoopes, K. M., and O’Brien, W. F., 2013. “TheStreamVanetm Method: A New Way to GenerateSwirl Distortion for Jet Engine Research”. In 49thAIAA/ASME/SAE/ASEE Joint Propulsion Conference,no. AIAA-2013-3665.
[13] Nessler, C. A., Sanders, D. D., List, M. G., Janczeski, T. J.,
and Copenhaver, W. W., 2017. “Axial Extent of Flow-field Variation from the StreamVanetm Swirl Pattern Gener-ation System”. In 55th AIAA Aerospace Sciences Meeting,no. AIAA-2017-1621.
[14] Gillaugh, D. L., Copenhaver, W. W., Janczewski, T.,Holycross, C., Sanders, D. D., and Nessler, C., 2017.“Aeromechnical Evaluation of an FDM Printed Thermo-plastic StreamVanetm ”. In 53rd AIAA/SAE/ASEE JointPropulsion Conference, no. AIAA-2017-4600.
[15] Frohnapfel, D. J., Ferrar, A. M., Bailey, J., O’Brien, W. F.,and Lowe, T. K., 2016. “Measurements of Fan Responseto Inlet Total Pressure and Swirl Distortions Produced byBoundary Layer Ingesting Aircraft Configurations”. In54th AIAA Aerospace Sciences Meeting, no. AIAA 2016-0533.
[16] Schneck, W. C., Guimaraes, T., Frohnapfel, D. J., Lowe,K. T., O’Brien, W. F., and Copenhaver, W. W., 2017.“Swirling Flow Evolution Part 2: StreamFlow 2D+t ModelValidated with Stereo PIV Measurements”. In 55th AIAAAerospace Sciences Meeting, no. AIAA 2017-1622.
8This material is declared a work of the U.S. Government and is not subject to copyright protection in the United States. Approved forpublic release; distribution is unlimited.


