
( 4 R 1 3 1 1 2 ) SYNTHESIS AND ANALYSIS OF N77- 12230 JPT P3EL FROll S H A L E OIL AND COAL SidCRUDES (Atlantic R i c h f i e l d Co., Harvey, Ill.)
64 p HC A04/KP A01 CSCL 2 1 D Uacl a s
* . ,- - G3/2d 56913
NASA CR-135112
, -\ 1
0
Synthesis and Analysis of Jet Fuel from Shale Oil and Coal Syncrudes
by J. P. ~allagher, T. A. Collins T. J. Nelson, M.4 Pedersen M. G. Rob in , L. J. Wisinski
Harvey Technical Center Atlantic Richfid Company
prepared for
NATIONAL AERONAUTICS AND SPACE ADMINISTRATION
NASA Lewis Research Center Contract N AS 3- 19747
https://ntrs.nasa.gov/search.jsp?R=19770005287 2018-07-15T12:50:06+00:00Z
1. Report No. I 2, Government Accnrion No. 1 3. Recipient's Catalog No. I
Synthesis and Analysis o f J e t Fuels from Shale 01 1 and Coal Sync rudes
CR 135112 I 4. Title and Subtitle
I
1 8. Performing Organization Report No.
5. Report Date
15. Supplementary Notes
Project Manager, A. C. Antoine, NASA Lewis Research Center, Cleveland, Ohio
J. P. Gallagher, T. A. Col l ins, T. J. Nelson, M.J. Pedersen, M. G. Robison, L. J. Wisinski
,
9. Performing Organization Name and Address
A t l a n t i c Richf ie ld Company Harvey Technical Center 400 E. Sibley Blvd. Harvey, 11 1 i noi s 60426
12. Sponsrrring Agency Name and Address
National Aeronautics and Space Administrat ion dashington, D.C. 20546
16. Abstract
Thirty-two j e t fue l samples o f varying propert ies were produced from shale o i l and coal syncrudes, and analyzed t o assess t h e i r s u i t a b i l i t y f o r use. TOSCU I 1 shale o i l and H-COAL and COED syncrudes were used as s t a r t i n g materials. The processes used were among those common1 y i n use i n petroleum processing-disti 1 l a t i on , hydrogenation and c a t a l y t i c hydrocracking. The processing condit ions required t o meet two leve ls o f spec i f i ca t ions regarding aromatic, hydrogen, su l fu r and n i trogec contents a t two y i e l d 1 eve1 s were deter- mined and found t o be more demanding than normally required i n petroleum processing. Analysis o f the samples produced indicated tha t if the more s t r ingent speci f i c a t i ons o f 13.5% hydrogen (min.) 2nd 0.02% ni t rogen (max. ) were met, products s i m i l a r i n proper t ies t o conventional j e t fuels were obtained. I n general, shale o i l was easier t o process (ca ta lys t deact ivat ion was seen when processing coal syncrudes) , consumed 1 ess hydrogen I and y ie lded superior prgducts. Based on these considerations, shale o i l appears t o be preferred t o coal as a petroleum subst i tu te for j e t f ue l production. 1
M1.76-1
10. Work Unit NO.
11. Contract or Grant No. NAS3-19747
13. Type of Report and Period Cove1
Contractor Report
14. Sponsoring Agency Code
17. Key Words (Suggested by Autho~ (s) )
Je t Fuel Hydrocrack i ng Turbine Fuel Hydrotreat i ng Shale O i l Coki ng Coal Syncrude Ref i n i ng Hydrogenation Analysi s
18. Distribu?ion Statement
Unclassi f ied - unl imi ted
' For sale by the Natlonal Technical Information Service, Sprinefleld. V ~ r e ~ n i a 22151
I 19. Security Classif. \of this report)
Unclassif ied 20. Security Classif. (of this page)
Unclassi f ied 21. No. of Pages
L
22. Price"

I I. Int roduct ion
TABLE OF CONTENTS
Page No.
111. Shale O i l A. Experimental Procedure
1. Feedstock Preparation and Analysi s 2. Hydrotreating o f Shale O i 1 Fract ions 3. Hydrocracking of Denitrogenated 616-783OK (650-950°F)
Shale O i l Fract ion 4. F ina l Blending and Fract ionat ion o f Shale O i l Products 5. Delayed Coking o f Shale O i 1 Bottoms
B. Results 1. Hydrotreating o f Shale O i l Fract ions 2. Hydrocracki ng o f the Deni trogenated 616-783OK (650-950'~)
Shale O i l Fract ion 3. F ina l Product Yields and Analysis 4 . Addi t ional Processing Options t o Increase J e t Fuel Yields
from Shale O i l
I V . Coal Syncrudes A. Experimental Procedure
1. Feedstock Preparation and Analysis 2. Hydrotreat i ng o f Coal Syncrudes 3. Hydrocracki ng o f the 561-700°K ( 5 5 0 - 8 0 0 ~ ~ ) Fract ion of
COED Syncrude 4. Final Blending and Fract ionat ion o f Coal Syncrude Products
6. Results 39. 1. Hydrotreat i ng o f Coal Syncrudes 2. Hydrocracki ng o f the 5 6 1 - 7 0 0 ~ ~ (550-800°F) Fract ion of
COED Syncrude 3. F ina l Product Yields and Analysis
V. Discussion o f Results
V I . Summary o f Results
V I I. References

I. SUMMARY
Within the broad range objective of evaluation of a1 ternat i ve hydrocarbon sources t o crude petroleum, the speci f ic objective of t h i s program was the production and analysis of j e t fuel samples of various properties from shale o i l and coal syncrudes.
One shale o i l (TOSCO 11) and two coal syncrudes (H-COAL and COED) were used as s t a r t ing materials. The processes used were among those c o m n l y i n use in petroleum processing-disti l la t ion, hydrogenation and ca ta ly t i c hydrocracki ng . The sample properti es which were varied on a control : ~d basis were boi 1 i ng range and percent hydrogen and nitrogen. Aromatics content and percent sulfur also varied as a resul t . The amount of j e t fuel produced from a given amount of syncrude a lso was varied. In one case, the 311-616OK (100-650°F) boi 1 i ng range materi a1 existing i n the syncrude was hydro- treated t o meet specifications. The yield was then augmented by hydro- cracking some of the heavier syncrude fractions to 6160K (650'~) and l ighter products.
The processing conditions required to make various specification products were determined and found to be considerably more severe than a re normally required in petroleum processing. In part icular , the amount of ca ta lys t required, pressure and hydrogen consumption were unusual ly h i g h . Space velocities of 0.3-1.0 and hydrogen pressures i n the 13.8-17.2 x 10⁶ ~ /m2 (2000-2500 PSIG) range were generally necessary, as c mpared to the more g usual ranges of 1-4 space velocity and 3.45-6.90 x 10 ~ / m 2 (500-1000 PSIG). Thi rty-two .0076 m3 (two gallon) samples of various properties were prepared and analyzed t o assess t he i r su i t ab i l i ty fo r use as j e t fuel . The program demonstrated tha t products which may be useful as j e t fuels can be made from these petroleum substi tutes by hydrotreating and hydrocracking to meet the more str ingent of the specifications used i n the program of 13.5% hydrogen ( m i n . ) and 0.02% nitrogen (max.). If these a re met, the additional specifications of 0.2% sulfur (max. ) and 20% aromatics (max. ) 1
were also eas i ly sa t is f ied . Hydrogen consumption ranged from 185 t o 388 m3/m3 (SO0 to 2300 SCF/B), two t o four times the normal values when processing pe crol eum derived stocks.
In general, shale o i l was eas ier t o process (ca ta lys t deactivation was seen when processing coal syncrudes) and yielded superior products, '4
primarily in terms of smoke point. Hydrogen consumption with shale oi 1 9:
was substantial ly lower a lso , part icularly i f calculated using coal as the s tar t ing material. 9 ,
r "j
Technical and economic optimization of these processes was not a part of 'P .t
th i s program, b u t i t appears that shale o i l would be preferred t o coal h
,% as the original hydrocarbon source for j e t fuel production.
f i i i*
I
?2

I I. INTRODUCTION
As a r e s u l t of cu r ren t l y dec l in ing supplies o f domestic crude petroleum, which u l t ima te l y w i 11 become world-wide, po ten t ia l a1 ternate hydrocarbon sources are being evaluated f o r the production o f j e t fuel. I n t h i s program one shale o i l and two coal syncrudes were used as s t a r t i n g materials f o r production o f j e t f ue l samples o f vary in propert ies. These samples were extensively analyzed, and .0038 m3 ?one gal Ion) port ions o f each were furnished t o the NASA Lewis Research Center f o r t he i r fu r the r eval uation.
The sample spec i f i ca t ions included b o i l i n g range ( i n i t i a l b o i l i n g p o i n t defined by vapor pressure and f lash po in t ) , content of aromatics, hydrogen, n i t rogen and su l fu r , and y i e l d o f product. Yields were based on the por t ion o f the product b o i l i n g i n the range o f 422-561oK (300-550°F), and samples were t o be produced a t two levels , 20 and 40 w t . % (min. ) based on s t a r t i n g syncrude. At each y i e l d leve l , a 311-616OK ( 1 0 0 - 6 5 0 ~ ~ ) f r a c t i o n was t o be produced a t high and low processing sever i t ies so as t o conform w i th the fo l lowing speci f icat ions:
Low Severi ty High Severi ty
Vol. % Aromatics (max.) 40 W t . % Hydrogen (mi n. ) 12.75 W t . % Su l fu r (max.) 0.5 W t . % Nitrogen (max. ) 0.2
Each of these 311-616OK (100-650°F) b o i l i n g range products were then t o be d i s t i l l e d as required t o produce f i n a l product samples o f the fo l low ing v o l a t i l i t y speci f icat ions:
Flash Point (min.) - 3 1 1 ~ ~ - 311°K ( 10OOF) ( 1000F )
Reid Vapor Pressure 2x10⁴ ~ / m 2 - 2x10⁴ ~ / m 2 - (max. ) (3 p s i ) (3 p s i )
ASTM Final Bo i l i ng Po in t 561°K 561°~ 6 160K 616 '~ (max. ) (550°F) (550'~) ( 6 5 0 ~ ~ ) (650°F)
This resu l ted i n a t o t a l requirement o f t h i r t y - two d i f f e r e n t samples.

The processes used t o produce these samples were t o be conventional processes such as would be used i n the production o f j e t f ue l from crude petroleum; those used were d i s ti 1 l a t i on , hydrogenation and c a t a l y t i c hydrocracking. Some t e s t data were a lso obtained on delayed coking, bu t t h i s process was not used i n the actual pre- parat ion o f the samples.
Other work has a lso been performed i n the same eneral area P (1,2,3,4),
but t h i s program i s not d ~ r e c t l f ~ t j e l a t e d , excep i n t h a t some previous work performed i n t h i s f a c i l i t y was used t o i n i t i a l l y def ine the general processing scheme and condit ions f o r the coal syncrude phase.

111. SHALE OIL
A. Experimental Procedure
1. Feedstock Preparat ion and Analysis
For the shale o i l phase o f t he program, the s t a r t i n g mate r ia l was a sample o f f u l l range shale o i l prepared i n the TOSCO I 1 process p i l o t p l an t . Analyses obtained on t h i s ma te r i a l a re shown i n Table 11. (Ana l y t i ca l methods used i n t h i s program are shown i n Table I). To prepare the necessary f r a c t i o n s f o r f u r t h e r ana lys is and f o r pr-ocessing, a charge o f 533.9 Kg (1177 I bs . ) was f r a c t i o n - a ted successively i n a .203 m (8") d ia . and a . I02 m (.;' ') d ia . s t i l l t o produce cu ts o f 311-422 (100-300), 422-561 (300-550), 561-616 (550-650), 616-700 (650-800), and 700°K+ (800°F+) TBP. Anal ses o i these cu ts a re a lso shown i n Table I I. The 700°~+ i( (800 F+) bottoms f r a c t i o n was then f u r t h e r separated i n t o 700-783 (800-950) and 7830K+ (9500Ft) f r a c t i o n s i n a continuous vacuum f lash s t i l l . A p l o t o f wt . % overhead vs. temperature, ca l cu l a ted from these f r a c t i o n a t i o n s and corrected f o r losses, i s shown i n F igure 1. These cu ts were then composited t o produce a 311-6160K (100-650°F) s tock f o r d i r e c t hydro t rea t ing t o the j e t f u e l spec i f i ca t i ons , and a 616-7830K (650-950°~) feedstock f o r hydrocracking t o increase the j e t f u e l y i e l d from the o r i g i n a l sha le o i l .
2. Hydrot reat ing o f Shale O i l Fract ions
The i n i t i a l hydro t rea t ing work on the IBP-616~~ (650°F) and the 616-783OK ( 6 5 0 - 9 5 0 ~ ~ ) shale o i l f r a c t i o n s invo lved sho r t exper i - mental programs t o determine the processing cond i t i ons necessary t o meet product requ i rements . Based on previous experience, the n i t r ogen l e v e l was i d e n t i f i e d as the c o n t r o l 1 i n g product speci fi - c a t i o n f o r t r e a t i n g t h i s shale syncrude, and processing cond i t i ons were se lected and ad justed dur ing both experimental an3 product ion runs on t h i s bas is .
The feed was t r ea ted i n a .025 m ( 1 " ) diameter isothermal, continuous f l ow reac to r over .06 Kg o f American Cyanamid HDS-3A, a commercial .0016 m (1/16") Ni-Mo/A120 c a t a l y s t . The c a t a l y s t was un i fo rm ly d i l u t e d 2: 1 w i t h t abu la r a ? umina t o form a .51 m (20 inch) packed bed. A f r esh charge o f c a t a l y s t was used f o r each feed. Tests were conducted over a range o f opera t ing cond i t i ons so t h a t a t rend could be es tab l i shed r e l a t i n g product n i t r ogen l e v e l t o processing seve r i t y . When the necessary process condi t i o n s had been defined, l a r g e sca le product ion runs (%.076 m3, 220 ga ls . product ) were made on both feedstocks i n .051 m (two i nch ) diameter reactors . The same! type o f NiMo c a t a l y s t was used f o r both runs. A l l c a t a l y s t charges were p resu l f i ded w i t h a 10" H2S/9Oo!) H2 b lend before processing was i n i t i ated.

TABLE I
ANALYTICAL METHODS USED IN PROGRAM
I METHOD
WT. % CARBON, COMBUSTION WT. % HYDROGEN, COMBUSTION WT. % SULFUR, X-RAY FLUORESCENCE p.p.m. SULFUR, DOHRMANN WT. % NITROGEN KJELDAHL WT. % OXYGEN, UNTERZAUCHER GRAVITY, OAPI (ASTM 0-287) SPECIFIC GRAVITY 60'60 (ASTM D-1217) DISTILLATION, ATM. (ASTM D-86) DISTILLATION, VAC. (ASTM D-1160) DISTILLATION, SIMULATED TBP BY
GAS CHROMATOGRAPHY REID VAPOR PRESSURE (ASTM D-323) FLASH POINT (ASTM D-56) KINEMATIC VISCOSITY (ASTM D-88) SAYBOLT VISCOSITY (ASTM D-445) PENTANE INSOLUBLES WT. % ASH (ASTM D-482) % MONOCYCLIC, % POLYCYCLIC, AROMATICS, % NAPHTHALENES - COMBINATION CHROMATOGRAPHY AND MASS SPECTROMETER % AROMATICS (ASTM D-1319) % OLEFINS (ASTM D-1319) NET HEAT OF COMBUSTION (ASTM D-2382) EXISTING GUM (ASTM D-381) THERMAL STABILITY (ASTM 0-3241 SMOKE POINT (ASTM 0.1322) FREEZING POINT (ASTM D-2386) POUR POINT (ASTM D-97) RING & BALL SOFTENING POINT (ASTM D-361 REFRACTIVE INDEX @ 2 0 ' ~ (ASTM D-1218) WT. % CHLORINE, WET ANALYSIS
ABBREVIATION
% C % H % S
PPm S % ( P P ~ ) N % 0 OAP l SPECIFIC GRAVITY DIST. D-86 DIST. D-1160
G.C. DIST. R.V.P. FLASH PT. KV SFS C5 INSOL.
NONE % AROM. % OLEF. NET HEAT COMB. EXISTING GUM THERMAL STAB. SMOKE PT. FREEZING PT. POUR PT. RING & BALL SOFTENING PT. R. I. @ 2 0 ' ~ % CI

TA
BL
E II
TOS
CO
II S
HA
LE O
IL A
NA
LYS
ES
DN
~
No.
Sam
ple
No.
+
Fm
aion
, O
K
(OF
I T
i. W
t %
Gm
iw,
Kg/
m3
(OA
PI)
Sp.
Gr.
60m
* dm
1
KC
% H
% S
% N
% 0
Pour
Pt,
OK
(O
F)
KV
Io
cS
KV
1100
cS
KV
lZlO
cS
SfS
nlO
cS
NCg
lnrd
.. m
. %
%A
sh
-die
A
ro~
vu
tia
. Vd
. %
Pd
yc
yd
k
Vd
. X
03
63
0
3322
7
To
tal
100.
0
939.
6 (1
9.1)
83.88
10.7
4 0.
683
2.10
1.
23
277 (40)
29.2
3 4.
34
0.00
7
-
3323
4
Wet
Gas
0.68
D-3
633
3323
9
IBP
-425
(I B
P-3
05)
9.37
774.
9 (5
1.1)
86.8
3 13
.17
0.77
0 0.
391
5
0.78
1.25
1
0.0
03
63
4
3323
6
425561
(305
5501
18
.41
861.
2 (3
2.8)
84.5
8 12
.14
0.73
5 1.
39
1.26
10.5
8 2.
1 10
0.0
0.2
D-3
635
3323
7
561-
616
(55@
6501
6.
56
923.
0 (2
2.3)
84.6
8 11
.37
0.67
3 2.
12
1.35
12.2
1 2.
431
0.0
12.9
14.6
0-3
643
3324
5
616-
700
(650800)
12.1
0
937.
7 (1
9.4)
85.3
8 1 1.
32
0.64
3 1.
96
1.13
48.7
6 5.
232
0.0
11.3
17.5
12
.2
7007
83
@O
fM5O
) 19
.0
- i
3325
4
700+
(&
OD
c)
52.8
8
1.03
01
85.8
3 9.
58
0.53
2.
6 7
1.63
62.7
3 20
.732
0.
04
5.8

FIGURE 1 TOSCO II
FULL RANGE SHALE OIL DISTILLATION CURVE
TEMPERATURE O F O K
0 10 20 30 40 50 60
WT. % OVERHEAD

a. 311-616'~ (100-650'~) Shale 01 1 Frac t ion
The fo l low ing mat r i x of operat ing condi t ions was chosen f o r the pre l iminary i nves t i ga t i on as a range l i k e l y t o y i e l d products meeting the requi red spec i f i ca t i ons :
Temperature, OK 630-658 (675-725'~)
Pressure, ~ / m 2 13.8 x 10⁶ (2000 PSIG)
Hz Rate, m 3/m3** 1.35 x l o 3 (8000 SCFIB') (no recyc le)
* Weight hour ly space ve loc i t y , g. feed/hr./g. ca ta l ys t .
** Cubic meters @ 273O~, 10.1 x 10⁴ ~ l m 2 per cubic meter o f feed.
'Standard Cubic Feet @ 60°F. 760 mm Hg. per 42 ga l . bar re l o f feed.
The resu l t s of these tes t s were used t o estimate processing seve r i t i es requi red t o meet the two product q u a l i t y l eve l s f o r the product ion run. A ,300 Kg ca ta l ys t charge was used, and fo r the low sever i t y operat ion (29.2% N product) a reac tor temperature o f 6160K (650°F) and a WHSV o f 1.5 h r -1 were chosen as i n i t i a l condit ions. Pressure was s.aintained a t 13.8 x 10⁶ ~ / m 2 (2000 PSIG) and once-through hydrogen r a t e a t 1350 m3/m3 (8000 SCFIB). These condi t ions were ~ 2 5 percent more severe than the experimental study ind ica ted t o be necessary t o achieve the spec i f ied maximum product n i trogen l eve l of 0.2%. I n i t i a l products, however, id not meet r e uiremests and i t was necessary a t o increase the temperature t o 625 K (665 F) for the remainder o f the low sever i t y operation.
Since deni t rogenat ion o f t h i s mater ia l d i d no t prove excessively d i f f i c u l t , the ob jec t i ve o f the h igh sever i t y operat ion was changed w i ;h the concurrence o f NASA t o a 0.02%product n i t r , ?en l eve l ra the r than the 0.1% o r i g i n a l l y intended. Fol lowing the low sever i t y segment o f the run, the temperature was increased t o 6520K (715OF) t o make the second product. Approximately .076 m3 (20 gal lons) of feed were t reated a t each of the two severi t y 1 eve1 s .

b. 616-783'~ ( 6 5 0 - 9 5 0 ~ ~ ) Shale O i 1 Fract ion
Since the purpose o f t h i s processing step was t o prep\.r-s t h i s f rac t ion f o r a subsequent hydrocracking step, a product n i t rogen l e v e l o f 400 ppm o r less was required. The pre l iminary experi - mental program covered the f o l lowing range o f process variables :
Temperature, OK 644-666 (700-740°F)
Pressure, ~ / m 2 13.8 x l o6 (2000 PSIG)
WHSV 0.75-0.33
H2 Rate, m31m3 1350 (8000 SCFIB)
Based on the resu l t s of these tests, processing c ~ i i d i t i o n s for the production run were i n i t i a l l y se t a t 6 j 0 ~ (7400F), 0.43 WHSV, 5 13.8 x 10⁶ ~ / m 2 (2000 PSIG) and 1350 m3lm (8000 SCF/B) hydrogen rate. This run used a .700 Kg charge o f NiMo ca ta lys t .
I n i t i a l r esu l t s from t h i s run, as i n the 311-616OK (100-650'~) feed run, again showed t h a t the conversion obtained w i t h t h i s ca ta l ys t charge was somewhat 1 ower than noted during the experi - mental run. I n order t o achieve the proper prcdllct n i t rogen leve l , I t was therefore necessary t o increase the temperature t o 6 7 5 ' ~ (755O~) and reduce the WHSV t o 0.36. Operation a t these severe condit ions resu l ted 1 n deact ivat ion o f the ca ta l ys t during the course o f the run. Approximately 20-251 o f the i n i t i a l ca ta l ys t a c t i v i t y was l o s t during the 309 hours o f operation. A t o t a l o f .068 m3 (18 gal lons) o f product was obtained from t h i s run, w i t h a n i t rogen content of 233 ppm.
3. Hydrocracking - o f Deni trogenated 616-7830K (650-950°F) Shale O i 1 Fract ion
The hydrocracki ng process was conducted i n a s ing le stage hydrocracking p i l o t plant, consis t ing of two reactors i n ser ies. The f i r s t reactor was charged w i th hydrodenitrogenation (HDN) ca ta l ys t t o fu r ther reduce the feed organic n i t rogen content from 233 ppm t o 50 ppm. The t o t a l e f f l u e n t (gas and l i q u i d ) from t h i s reactor was then passed over the hydrocracki ng ca ta l ys t i n the second reactor, where the hydrocracki ng react ions take place. Both ca ta lys ts employed i n t h i s process are propr ietary, and are commercially avai l ab le under l icenss.

I n order t o determine the condit ions necessary t o y i e l d a su i tab le organic n i t rogen leve l i n the feed t o the hydrocracking zone and t o obta in sui tab1 e hydrocrackate y ie lds , short process var iable programs were run p r i o r t o the production run. Process var iable work was run f i r s t i n the hydrotreat ing zone wh i le the hydrocracking zone was being condit ioned by passing the e f f l u e n t gas from the ?ydrotreat ing zone over the hydrocracking ca ta lys t . This equ i l i brates t : i d hydrocracking ca ta l ys t w i th the ammonia and hydrogen s u l f i d e i n t h i s gas stream. The hydrocracking process var iable work was then done us in the complete 4 s ing le stage system. Pressure was f i xed a t 13.8 x 10⁶ k/m (2000 PSIG), H2 r a t e a t 1685 m31m3 ( 10,000 SCFIB) , and space ve loc i t y se t t o minimize conversion o f feed t o 3110K (1000F) and l i g h t e r i n the hydrotreater and maximize the 311-616OK (100-6500F) y i e l d i n the hydrocracker. Process tem eraturgs f o r the hydrotreat ing runs varied be twe~n 625 (665) and ! 652 K (715 F), and based upon the resu l t s of these tes ts the processing condit ions were se t a t 639% (690'~) and 1 WHSV.
Process condit ions f o r the hydrocracking zone i n the experimental s ing le stage tes ts were 616-630°K (650-675OF) and 1.0 WHSV. The shale gas o i l was easier t o hydrocrack t h a ~ had been ant ic ipated and only the lowest temperature produced a conversion t o 616OK- (6500F') low enough t o use f o r lanning. Based on t h i s po in t and an assumed ac t i va t i on B energy o f 2.5 x 10 joule/Kg. mole (60 kcallgm. mole), the process condit ions were se t a t 622O~ (660°F) and 0.75 WHSV f o r 80% conversion tc 6160K (6500F) and 1 ighter . The production run was performed using .051 m (2" ) I.D. reactor;; the hydrodeni trogenation reactor contained .300 Kg of ca ta l ys t and the hydrocracki ng reactor contained .400. Both were d i 1 uted w i t h i n e r t tabular a1 umina , w i th a constant ca ta l ys t l d i l uen t r a t i o throughout the bed, (%.001 m3). Due t o the l i m i t a t i o n s of time and feedstock quant i ty , the a c t i v i t y of the hydrocracking ca ta l ys t was not completely s tabi 1 i zed, and the i n i t i d 1 por t ion o f the production run was done wh i le t h i s ca ta lys t rc ta ined a high f l ush a c t i v i t y . Because of t h i s high a c t i v i t y , the temperature i n the hydrocracking zone had to be lowered t o obta in the desired conversion leve l . As the f lush a c t i v i t y diminished the tempzrature was ra ised up t o the i n i t i a l l y determined 6160K ( 6 5 0 ~ ~ ) . During t h i s period o f f 1 ush a c t i v i t y , some overcrackin occurred, resu l t i ng i n higher than normal losses t o 3110K (lOO°F 7 and l i g h t e r products. About ,061 m3 (16 gals. ) of feed were processed i n t h i s manner.

4. Final Blendinq and Fract ionat ion o f Shale O i l Products
The hydrocracked 616-783OK (650-9500F) shale o i l was f rac t ionated i n a .051 m (2") . 15 g l a t e vacuum jacketed glass column t o produce 311-616O (100-650°) and 616 K+ (650°~+) f rac t ions . I n order t o make the h igh y i e l d samples, por t ions o f t h i s f r a c t i o n were blended w i th por t ions of the high and low n i trogen 311-616OK (100-650oF) hydrotreatgd products i n a r a t i o of 31.5% hydrocrackate/68.5% 311-616'~ (100-650 F) HDN product, which i s i n y i e l d propor t ion t o the feed f rac t ions . The low i e l d $: * samples consis t so le ly o f the hydrotreated 311-616OK (10G-650 F) HDN products. The four 311-616'~ ( 100-650°F) hydrotreated products ( i . e. , low y ie ld -h igh N; low y ie ld- low N; high y ie ld -h igh N and high y i e l d - low N) were then f ract ionated i n the .051 m ( 2 inch) d i s t i l l a t i o n column t o produce the f i n a l samples. Two f rac t ionat ions were required t o produc four samples from each 31 1-616OK (100-650°F) product. The 2 2 x 10 N i d (3 p s i ) R V P / ~ I ~ O K EP spec i f i ca t i on was s a t i s f i e d by the unfract ionated mater ia l . The f i r s t f r ac t i ona t i on removed the 3940K ( 2 5 0 ~ ~ ) - f r a c t i o n t o meet the 311°K ( 1 0 0 ~ ~ ) f l a ~ h / 6 1 6 ~ ~ E.P. spec. I n the second, appropri t e overhead cuts were taken and blended B backoto meet the 2 x 10 N/m2 (3 p s i ) R V P / ~ ~ ~ ~ K (550'~) EP and 311°h (100 F) flash/561°K EP specs.
5. Delayed Coking o f 783 '~ (950°~)+ Shale O i l Bottoms
I n order t o obta in an estimate o f the add i t iona l y i e l d tha t could be obtained if the 7 8 3 0 ~ (950°F)+ bottoms were process2d by delayed coking, a run was made i n a p i l o t p lan t a t t yp i ca l commercial coker condit ions: 721°K (839'~) drum temperature, 27.6 x 10⁴ N/m2 (40 PSIG) drum pressure, 1.1/1.0 recycle r a t i o ( t o t a l feedffresh feed) and a f l a s h s t i l l recyc le cu t po in t o f 714-727OK (825-850°F), which i s equivalent t o a TBP end po in t o f $755'~ (%900°F). Fresh feed r a t e was .848 Kg./hour (.933 Kg/ hour combined feed) f o r a t o t a l o f 4.240 Kg during the 5 hour run period
B. Results
1. Hydrotreating
a. 311-616OK (100-653'~) Shale Oi 1
The HDN resu l t s from the experimental and production runs on the 311-616'~ (100-650O~j f r a c t i o n o f shale o i l are shown i n Figure 2. This i s a f i r s t order k ine t i cs representation, i n which the l o g o f feed n i t rogen content/product n i t rogen content i s p lo t ted against a sever i ty factor . This sever i ty factor i s the product o f 1IWHSV and a temperature fac tor (FT, F i ure 3), which corrects data a t other temperatures t o 644OK (70O0FY. The temperature fac to r i s obtained by determining the r a t i o o f space ve loc i t i es required t o obta in the same conversion a t a temperature, TN, r t o a baseline ternperat* re, To. I n t h i s case, FTN =
K a t constant

conversion. Comparison o f the two l i n e s f o r the experimental and production runs c l e a r l y shows the d i f ference i n operat ing sever i ty required to obta in a given n i t rogen leve l . This di f ference i n required sever i ty i s equivalent t o an e f f e c t i v e overa l l ca ta l ys t a c t i v i t y i n the product ion run o f 4 0 % o f t h a t observed i n the prel iminary run. Possible explanations f o r t h i s might be poorer ca ta lys t contact ing i n the l a rge r diameter reactor o r a less e f fec t ive i n i t i a l a c t i v a t i o n o f the ca ta lys t charge. From the slope of the l i n e i n Figure 3, the overa l l apparent a c t i v a t i o n energy f o r the deni trogenation react ions was calculated as 1.07 x 10⁸ jouleIKg. mol (25.6 kcal/g. mol!. An increase i n temperature of o22OK ( 4 0 ' ~ ) w i l l double the reac t ion rate.
No loss o f a c t i v i t y was observed during the length o f the production run. The three points p lo t ted on Figure 2 a t greater than 1500 ppm product n i t rogen represent both s t a r t and f i n i s h o f the low sever i ty por t ion o f the run. The po in t a t 120 ppm was obtained wel l i n t o the high sever i ty segment. A l l l i n e up wel l on the co r re la t i on trend. The two points between 200 and 500 ppm came a t the s t a r t o f high sever i ty operation. Apparently the ca ta l ys t surface had not y e t completely equ i l ib ra ted w i th the f t o d a t the new higher temperature and these points represent a l i neou t period.
The analyses o f the 311-616OK (100-650'~) shale o i l feed and the composite o f the low and high sever i ty production runs are shown i n Table 111. As ant ic ipated, a l l other spec i f i ca t ions fo r hydro- t reated products were eas i l y met. Hydrogen consumed i n the preparat ion o f these two products was 158 and 185 m3/m3 (940 and 1100 SCF/B) , respect ively.
b. 616-783O~ (650-9500F) Shale O i 1
The resu l t s o f the experimental and production HDN runs on the 616-783'~ ( 6 5 0 - 3 5 0 ~ ~ ) f r a c t i o n o f shale o i l , preparatory t o the hydrocracking step, are shown i n Figure 4. As w i t h the 311-616OK ( 1 0 0 - 6 5 0 ~ ~ ) cu t data, a f i r s t order k i n e t i c representat ion i s used, but w i th an added correct ion fac to r i n the sever i ty term f o r ca ta lys t a c t i v i t y (a) . Defined on a r e l a t i v e space ve loc i t y basis t o a standard a c t i v i t y , ao, i .e.,
- W H S V ( a ~ ) a t constant conversion. a N -
The e f f e c t o f temperature on n i t rogen removal i s shown i n tb? form o f an Arrhenius p l o t i n Figure 5. The apparent overa l l ac t i va t i on energy i s 1.66 x 10⁸ joule/Kg mole (39.6 Kcal/g mole), corresponding

TABLE Ill
FEED AND PRODUCT INSPECTIONS
IBP-B~G~K (650'~) SHALE SYNCRUDE
SAMPLE NO. J-
GRAVITY, K ~ / M I (OAPI)
HYDROGEN, %
SULFUR, %
NITROGEN, %
REID VAPOR PRESSURF.
NIM~ (PSI)
FLASH POINT, OK (OF)
DlSTl LLATION
FEED, D-3638
0-86
LOW SEVERITY PRODUCT
284 (52) GC (SIMULATED TBP)~
HIGH SEVERITY PRODUCT

14.
FIGURE 2 SHALE OIL HYDROTREATINO
31 1-616OK (100-660°F) Fraction
- -
- -
0 Expwimmml run - 0 Production run -
1.38 x ~O'NIM~ (2000prig)
1348 W3/M3 (8000 SCF lB Hz)
0 0.2 0.4 0.6 0.8 1.0 SEVERITY = F,/WHSV
FIGURE 3
IBP-616OK SHALE OIL HY OROTREATING
1.53 1.55 1.57 1.59 1.61 OK x 1d T m .

t o a required temperature increase o f 1 5 O ~ (27OF) t o double the r,s!action ra te . This value f o r the a c t i v a t i o n energy i s subs tan t i a l l y I ~ l g h e r than tha t observed f o r the 311-616OK ( 1 0 0 - 6 5 0 ~ ~ ) f r a c t i o n o f l.07 x 108 joule/Kg mole (25.6 kcal/gm mole), which i s a more usual ralue for t h i s react ion. This, together w i t h the curvature i n the co r re la t i on l i n e i n Figure 4, which indicates a deviat ion from f i r s t order k ine t ics , suggests some poisoning e f fec t o f the NH3 produced i n t h i s react ion. Addi t ional work would be required t o conf i rm t h i s , however.
' \ standard ca ta l ys t a c t i v i t y check on a mid-continent f l u i d c a t a l y t i c i g h t cyc le o i l which was run before and a f t e r the experimental program
In the shale o i 1 ind ica ted no detectable c a t a l y s t deact ivat ion dur ing the course o f t h i s run. I n Figure 4, therefore, a value o f 1.0 has been assigned t o the parameter " ca ta l ys t a c t i v i t y " f o r the data points from t h i s run. The i n i t i a l a c t i v i t y observed i n the product ion run was somewhat lower, however, as i s shown i n Figure 6 by the value o f 0.8 fo r ca ta l ys t a c t i v i t y a t the beginning of the run. Cata lyst a c t i v i t y continued t o decl ine during the run, robably as a r e s u l t E of the high operat ing temperature (676OK - 755 F). The r a t e o f ca ta l ys t deact ivat ion, as show? i n F i ure 6, would requ i re a r a t e a o f temperature increase o f 3-4OK (5-6 F)/week t o maintain a constant l eve l o f denitrogenation. The values f o r ca ta l ys t a c t i v i t y used t o ca lcu la te the sever i ty f a c t o r f o r the data points from the product ion run i n Figure 4 are obtained from Figure 6. Analyses of the 616-7830K ( 6 5 0 - 9 5 0 ~ ~ ) raw shale o i l f r a c t i o n and the composi t~ product from the production rq:t.l are shown i n Table I V . Hydro en consumption dur ing the produc: ion run was 329 m3/m3 (1950 SCF/B 3 .
2. Hydrocracking o f the Deni trogenated 616-783O~ (650-950°F) Shale O i 1 Sract ion --
The i ?i t i a l tes ts i n the hydrotreat i ng zone t o determine requi red condit ions gave the fo l low ing resu l ts :
Temperat: r z , O K (OF) 625 (665) 639 (690) 652 (715)
Ppr Y ~n Product 8 2 29 2 1
,,onversion t o 3 1 1 0 ~ ( 1 0 0 ~ ~ ) -----------------ni 1 --------------- and L igh ter
, ,~ese I-esul t s i nd i c3 te a s i g n i f i c a n t reduct ion i n the r a t e o f deni trogenation as n i t rogen remrval approaches 99.9% o f the feed ni trogen. This effect i s commonly seen i n HDN processing a t h igh conversions.
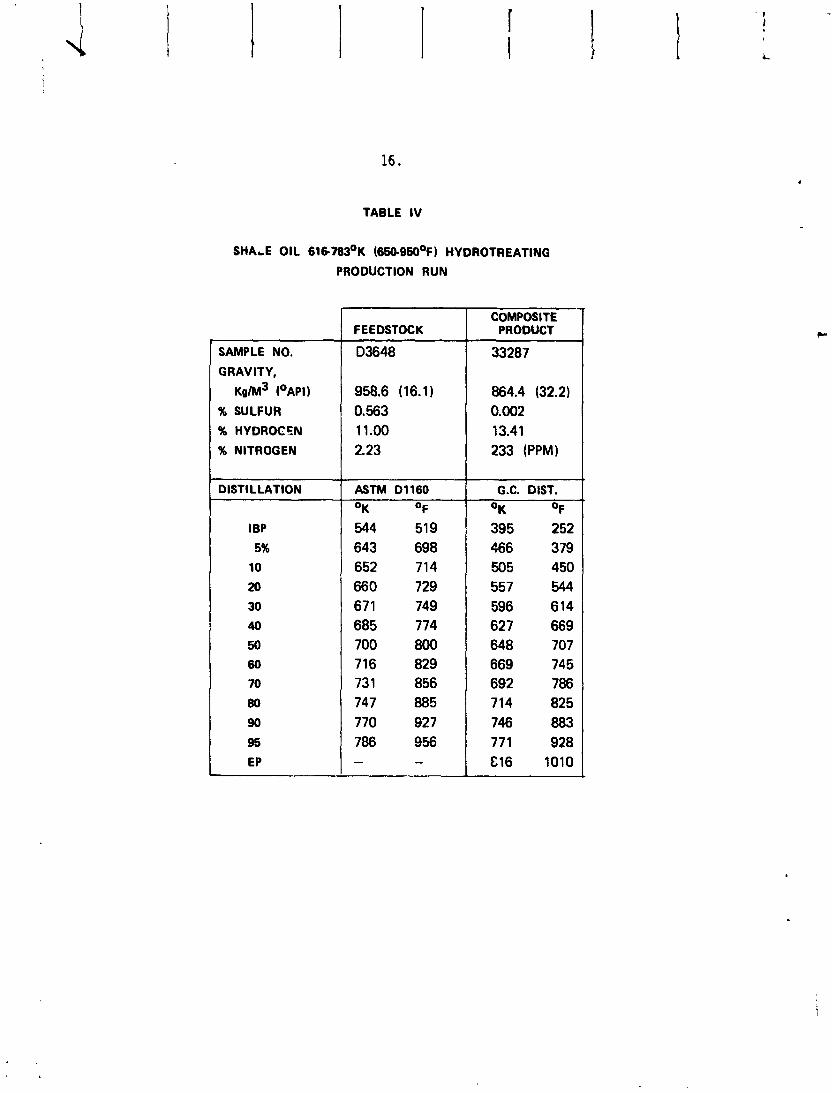
TABLE IV
SHALE OIL 616783'~ (650950'~I HYDROTREATING
PRODUCTION RUN
SAMPLE NO.
GRAVlT Y,
K ~ / M ~ (OAPI)
% SULFUR
% HYDROCEN
% NITROGEN
DlSTl LLATION
I BP
5%
10
20
30
40
50 60
70
80
90
95
EP
FEEDSTOCK
D3648
958.6 (16.1) 0.563 1 1 .oo 2.23
ASTM 01160
OK OF
544 519 643 698 652 71 4 660 729 67 1 749 685 774 700 800 716 829 73 1 856 747 885 770 92 7 786 956 - -
COMPOSITE PRODUCT
33287
864.4 (32.2) 0.002 13.41 233 (PPM)
G.C. DIST.
OK OF
395 252 466 379 505 450 557 544 596 614 627 669 648 707 669 745 692 786 714 825 746 883 771 928 C16 1010
&

FIGURE 4
SHALE OIL HYDROTREATING 616-783OK (650-950°F) FRACTION
NITROGEN REMOVAL VS. SEVERITY
13.8 x o6 N / M ~ (2000 PSIG) 3 1348 M I M ~ (8000 SCFIB) H2
EXP'TL. RUN CAT. ACT. = 1.0
0 PR0D:N. RUN
SEVERITY = WHSV
FIGURE 5
OIL HYDROTREATING 616-783OK (650-950°F) TEMPERATURE FACTOR
FIGURE 6
I SHALE OIL HYDROTREATING 61 6-783OK (650-950°F) FRACTION
CATALYST ACTIVITY VS. TIME PRODUCTION PUN
EXPT'L RUN ACTIVITY = 1.0 I
I HOURS ON OIL I

Table V shows the data f o r the weight balanced y i e l d tes ts made dur ing the hydrocracki ng production run and a1 so the p re l i m i nary process var iab le run. Since both temperature and ca ta l ys t a c t i v i t y were changing during the production run, an unambiguous k i n e t i c analysis o f the data i s no t possible. However if f i r s t order k ine t i cs (Figure 7) and an a c t i v a t i o n energy o f 2.5 x 10d Joule/Kg mole (60 kcallgm. mole) (Figure 8) are assumed (based on petroleum gas o i 1 hydrocracking data), ca ta l ys t a c t i v i t y as a funct ion o f t ime can be calculated, which i s shown i n Figure 9. A1 though t h i s p l o t ind icates a decl ine i n ca ta l ys t a c t i v i t y by two orders o f magnitude, t h i s i s a loss o f i n i t i a l " f lush" a c t i v i t y , and does no t appear t o be e n t i r e l y unreasonable f o r the f i r s t 200 hours of operat ion based on past experience w i th t h i s ca ta l ys t system.
I n Figure 10, the y i e l d o f the 422-561°K (300-550°F) f rac t i on as a w t . % o f feed i s p l o t t e d as a funct ion o f conversion t o 6160K (650°F) and 1 igh ter . A maximum 422-561°K (300-550"~) y i e l d appears a t approximate1 v 70% conversion. Figure 11 i s a p l o t of the 311-6i6OK (100-650°F) y i e l < on feed, again as a func t ion o f conversion t o 616 K (650'~) and l i g h t e r . The y i e l d o f t h i s f r a c t i o n increases w i t h conversion over the e n t i r e range, bu t not l i n e a r l y . As conversion increases, losses t o 311°K (lOo°F)- a lso increase. H2 consumption as a fun- t ion o f c nversion t o 6160K (650°F)-, S as shown i n Figure 12, ranges from 51 t o 135 m3/m (300-800 SCF/B) . These y i e l d s are based on the data obtained a f t e r 50 hours on o i l when the conversion l eve l was i n a normal range. .-.
The product from the roduct ion run was composi ted t o make a l i q u i d 5 product o f 797.2 Kg/m (46.0 OAPI) g rav i ty , i n a y i e l d o f 81.08% by weight and 87.90% by volume, The b o i l i n g p o i n t d i s t r i b u t i o n o f 311°K (lOO°F)+ 1 i q u i d product as weight percent y i e l d on h drocracker feed i s 5 shown i n Figure 13. The y i e l d o f 311-616OK (100-650 F) f r a c t i o n was 52.7 w t . % o f the feed.
These y i e l d s are unusually low due t o the excessive cracking t o 311°K (1000F)- products during the f i r s t two days o f the run. I f ca ta l ys t a c t i v i t y had been s tab i 1 ized and conversion held a t 70% t o 6160K ( 6 5 0 ~ ~ ) - , the l i q u i d p r o d x t y i e l d would have been 95.8 w t . % o r 103.9 vol . %. Yield o f 100-650'~ f r a c t i o n would have been 65.8 w t . % on feed, as shown i n Figure 11.
TABLE V
616.783'~ (650-950'~) SHALE OIL HYDROCRACKING 13.8 x l o6 NIM~ (2000 BIG) , 1685 M31M3 (10.000 SCFJB) H2
TEST NO. HOURS ON OIL TEMP
OK HDN OF
OK HCK OF
WHSV HDN REACTOR HCK REACTOR
YIELDS, WT. % ON FEED
C3- (=a C5
31 0.422'~ (100-300~~) 422-472'~ (300390'~) 472-561'~ (390.550'~) 561-616'~ (550-650~~1 616+OK (~M)+OF) H2 CONS., WT. %
1
EXPTL.
1 -
639 690 63 1 676
1.01 1.01
2.61 13.14 11.75
14.24
56.93
3.43
0
0 2.13
RUN
2 -
639 690 616 650
0.99 0.99
0.57 2.94 2.77
20.93
15.06
22.84
9.16
26.80 1.09
1 50
639 690 551 533
1.03 0.77
0.37 1.41 1.30
10.04
8.39
17.88
PRODUCTION RUN
2 7 7
639 690 577 580
1.03 0.77
0.21 0.27 0.19
12-27 I 48.92, 55.73 0 . 6 0 0.58
3 1 00
639 690 589 600
1.01 0.76
0.15 0.49 0.56
47.45 0.68
50.17 0.58
4 106
639 690 595 612
1.01 0.76
0.18 0.74 0.78
31.56 21.47 1 0 . 9 5 1 1.37
I 3.00 1 6.75 8.36
8.44
20.94
13.77
21.26 1.38
5.24
18.87
17.04
7.46
20.56
14.40
1
7 188
639 690 623 662
1.01 0.76
0.76 4.72 4.78
5 1 30
639 690 606 632
1 .oo 0.75
0.33 1.90 2.01
33.14
15.85
15.1 1
5.72
6 1 54
639 690 615 648
1.03 0.77
0.64 4.29 4.52
18.93
13.88
21.95
32.92
15.07
15.60

I- V)
5 a
' l - a U
FIGURE 9 FIGURE 10 C
HY DROCRACKING OF 616-783OK (650-950°F)
SHALE OIL
Calculated Activity of Hydrocracking Catalyst
HOURS ON Ol L
SINGLE STAGE HYDROCRACKING 61 6-783OK (650-950°F
SHALE GAS OIL
- L 0
3 rn
6: C'JW - LL
A
A Experimental Run 0 Productton Run
Wt. % Conversion to 616OK (650 '~) -

FIGURE 11
SINGLE STAGE HYDROCRACKING 61 6-783OK (650-950°F)
SHALE GAS OIL
A EXPERIMENTAL RUN G PRODUCTION RUN
45 -/ Wt. % Conversion to 6 1 6 ' ~ ( 6 5 0 ~ ~ ) - 40
40 45 50 55 60 65 70 75 8(
21.
FIGURE 13
OF 1 OK SHALE 0 I
Final - 800 31 1°K (100' P;oduct Yield ~istribution
9 0 0 1 -750
100 <.5% YIELD of 311'1 1100~~1 i 1 I I I
20 30 40 50 60 70 80 90 100
YIEL.D, WT. % OF HYDROCRACKER FEED
FIGURE 12 "1 ~ ~ , ~ ~ - 1 4 0 SHALE OIL
-Irn H2 CONSUMP'TION @ 13.8 x lo6 N / M ~ (2000 PSIG)
700 - 120 - 110 A Expt'l. Run
0 Prod'n. Run
URIGINAL PAGE DS OF POOR Q u a

3. F ina l Product Yields and Analyses
The blending and f r ac t i ona t i ons t o produce the f i n a l products were based on the wt. % y i e l d s on the o r i g i n a l shale o i l charge a c t u a l l y obtained. As noted i n the previous sect ion, however, the y i e l d s obtained from the hydrocracking operat ion were abnormally low due t o excessive crack ing dur ing the i n i t i a l p a r t of the run. The y i e l d s a c t u a l l y obtained a re shown i n the f o l l ow ing tab le , and the cor rec t ions f o r the low hydrocracking y i e l d a re noted .
W t . % Y i e l d on F u l l Range Shale O i l
Analyses o f a l l the f i n a l product samples a re g iven i n Table V I .
SAMPLE
B o i l i n g Range, OK
9 OF
LOW YIELD SAMPLES, NO.
311-422'~ (100-300'~) 422-561°K (300-550°F) 561-616'~ (550-650OF)
TOTAL
HIGH YIELD SAMPLES, NO.
311-422'~ (100-300'~) 422-561°K (300-5500F) 561-616'~ (550-650°F)
TOTAL
* I f the hydrocracking operat ion had been c a r r i e d ou t e n t i r e l y w i t h normal c a t a l y s t a c t i v i t y and a t 70% conversion t o 616OKm, the h igh y i e l d values f o r the 311-616'~ range samples would have been 14.92% 311-422, 30.57% 422-561, and 9.63% 561 -616~~ ; a t o t a l o f 55.12% on shale o i 1.
LOW SEVERITY
311-516 100-650
33315
7.82 21.09 6.01
34.92
33365
13.62~ 29.11 8.47
51.20
HIGH SEVERITY
311-616 100-650
33340
8.28 21.61
5.03
34.92
33408
14.08 29.64 7.49
51.20
394-616 250-650
33116
3.81 21.09 6.01
30.91
33366
5.44 29.11 8.47
43.02
394-616 250-650
33341
4.58 21.61
5.03
31.22
33409
5.78 29.64
7.49
42.91
311-561 100-550
33318
7.82 21.09
- 28.91
33368
13.62 29.11
- 42.73
394-561 250-550
33317
3.81 21.09
- 24.90
33367
5.44 29.11
- 34.55
311-561 100-550
33343
8.28 21.61
- 29.89
33411
14.08 29.64 - 43.72
394-561 250-550
33342
4.58 21.61
- 26.19
33410
5.78 29.64
- 35.42

TABLE V I (p. 1)
SAMPLE NO.
SAMPLE NO.
SHALE SYNCRUDE PRODUCT DlSTlLLATlONS (ASTM 0-86)
LOW YIELD PRODUCTS
HIGH YIELD PRODUCTS

I4,L LC) X
&)
-1311 1
3r U
IV IsF
-a (2
) (jasv~ 1(d904 ~
O~
HL
~W
1
3r W
~A
S
LC
-a 11)

4. Addi t ional Processing Options t o Increase J e t Fuel Yields from Shale O i l
a. Hydrocracki
Based on data from ex t i nc t i on recycle hydrocracking o f petroleum gas o i l s , i n which the 616OK+ (650°F+) product would be recycled t o the hydrocracker, the product d i s t r i b u t i o n a t 100% conversion t o 6160K- (6500F-) i s c lose ly approximated by the product d i s t r i b u t i o n o f cracked products o f orce through conversion a t the same conversion per pass. Based on t h i s assumption, we ca lcu la te tha t the high y i e l d products would be increased by the f o l l r :ing amounts:
A Yield, Fract ion W t . % on Shale O i l
b. Delayed Coking o f the 7 8 3 0 ~ (9500F)t Shale O i l Bottoms
I n ~ d e r t o ob ta in the desired 40% y i e l d o f 422-561°K (300-550'~) mater ial , some o f the 783OK (950°F)t f r a c t i o n (34% of the shale o i 1 ) would have t o be converted. One o f the comnonly proposed processes f o r upgrading o f raw shale o i 1 i s delayed coking. One t e s t run was made i n a delayed coking p i l o t p lan t on the 783O~ (950°F)+ raw shale bottoms. None o f the product from t h i s run was used to prepare any o f the f i n a l product samples, bu t the data were used t o ca lcu la te po tent ia l increased y ie lds o f j e t f ue l i f t h i s process were incorporated i n the overa l l scheme.
Yields from the delayed coking run o f the 7830K (9500F)t raw shale are shown below.

The d i s t i l l a t i o n curve of the 311-755'~ ( 1 0 0 - 9 0 0 ~ ~ ) 1 i q u i d product i s shown i n F igure 14.
Product
Gas
I B P - ~ ~ Z ~ K (IBP-355'~)
452-527OK (355-4900F)
527-589'~ (490-600'~)
589-755'~ (600-900°F)
Hzs Coke
The dens i t i es of t h e f r a c t i o n s of the product from the coking run a re somewhat lower than those o f the equiva lent py ro l ys i s shale o i l f r ac t i ons . Based on t h i s observat ion and o ther past experience, the processing cha rac te r i s t i c s and product y i e l d s and q u a l i t i e s were assumed t o be about the same fo r the coker product and py ro l ys i s o i l f r a c t i o n s of the same b o i l i n g range. On t h i s basis, t he f o l l ow ing incremental y i e l d s have been ca lcu la ted.
W t . % on Feed
7.97
10.25
7.85
8.27
21.75
0.07
43.84
Kg/m3
- 749.5
831.4
885.4
951.0
- -
OAPI
- 57.3
38.7
28.3
17.3
- -

Maximum Y ie ld Case
r
LOW YIELD PRODUCTS
Frac t ion
311-422'~ ( 100-300°F) 394-422'~ (250-300'~) 422-561'~ (300-550°F) 561-616'~ (550-650'~)
Using both o f the above process a1 ternates, i .e., coking o f the 783O~+ shale o i l bottoms and e x t i n c t i o n recyc le conversion o f the 616-783OK shale and coker gas o i l s , the fo l lowing maximum y i e l d s (average f o r h igh and lower seve r i t y HDh) should be a t ta inab le .
A Yield, W t . % on Shale O i l
.me-.
2.42 1.19 5.17 2.34
HIGH YIELD PRODUCTS (Hydrocracki ng o f 616-783'~ Coker Gas O i l t o 100% Conversion t o 616O~-)
Frac t ion
311-422'~ ( 100-300'~) 394-422'~ (250-300'~) 422-561°K (300-550°F) 561-616'~ (550-650°F)
311-616'~ (100-650'~) L
311-422OK (100-300'~) 394-422'~ (250- 3000F) 422 ~ 5 1 ~ ~ (300-550'~) 561-6 lS°K (550-650'~)
4.10 2.25 8.43 3.26
W t . % on F u l l Range Shale O i l
LOW YIELD
10.5 4.2
26.5 7.9
44.9
HIGH YIELD
21.5 11.2 43.8 14.2
79.5

FIGURE 14
DELAYED COKING OF 7 8 3 ' ~ (950'~) + SHALE OIL
LIQUID PRODUCT DISTILLATION
100 - (LIQUID PRODUCT = 48.12 Wt. % of 783'~+ Charge)
90 - 80 ,- 0
> 60 - 0
40 -
100 200 300 400 500 600 700 800 900 OF
TBP

I V . - COAL SYNCRUDES
A. Experimental Procedure
1. Feedstock Preparat ion and Analysis
I n t h e coal syncrude phase o f the program, i t was found necessary t o use two feedstocks, p r e p a r d by the H-COAL and COED processes. O r i g i n a l l y i t was planned t o use thr. '1-Coal syncrude exc lus ive ly , b u t - :
the on l y sample was no t ava i l ab le i n s u f f i c i e n t quan t i t y t o prepare a l l the requ i red samples. It was a l s o a low conversion smp le , con- t a i n i n g 39% 6 1 6 ' ~ (650°F) and li h t e r mater ia l , essent i?? l y no 6 1 6 - 7 0 0 ~ ~ 8 \650-8000F), and the balance 700 K (800°F)+ vacuum bottoms. This l a t t e r mate r ia l was a s o l i d , low hydrogen content mate r ia l conta in ing 14.6% ash, and any at tempt t o process i t was considered imp rac t i ca l . For t h i s reason, the H-Coal 616OK (6500F)- syncrude was chosen t o pro- duce the low y i e l d samples only. The on ly o ther coal syncrude r e a d i l y ava i l ab le was a COED product, and a s u f f i c i e n t quan t i t y o f t h i s mat- e r i a l was obtained t o produce the h igh y i e l d products.
The H-coal sample obtained was der ived from I 1 1 i no i s #6 Coal, prepared i n the HRI PDU a t ~ 3 . 1 Kg coallhr.rn3 reac to r volume (%50 lbs . c o a l l h r . f t 3 ) . This i s a s e v e r i t y in te rmed ia te between normal syncrude and f u e l o i l operat ions. The ~ v e r h e a d (616OK-) and bottoms f r a c t i o n s (700°K+) were rece ived separately. The overhead f r a c t i o n was f r ac t i ona ted on a labora to ry column i n t o IBP-422, 422-561, 561-616 and 616OK+ (IBP-300, 300-550, 550-650 and 650°F+) cuts. The analyses o f t he t o t a l overhead, the d i s t i l l a t i o n cu t s and the vacuum bottoms as rece ived a re g iven i n Table V I I . The d i s t i l l a t i o n curve o f the overhead i s shown i n F igure 15. The t o t a l overhead 1 i q u i d as rece ived was used as feedstock t o the hyd ro t rea t i ng step.
b. COED - 485 Kg (1070 Lbs.) o f COED syncrude (der ived from Utah Coal) were charged t o the .203 m (8") batch f rac t iona to r , used e a r l i e r on the shale o i l runs. Overhead was taken u n t i l overhead temperature i nd i ca ted a 6 1 6 ' ~ (650 '~) c u t po in t .

Water was no t present as a separate phase i n the charge stock, bu t approximately 16 w t . % water was separated by decanting from the overhead f rac t ions . Recovery was only 92 w t . %, bu t s ince water was found i n the traps o f the vacuum system i t i s l i k e l y t ha t the 8% loss a lso represents water.
The water apparently gave fa l se ind ica t ions o f temperatures, and the bottoms from the .203 m (8") s t i l l had an i n i t i a l b o i l i n g po in t of approximately 561°K ( 5 5 0 ~ ~ ) . These were run on the ,102 m (4") s t i l l t o a 7 0 0 ~ ~ (800°F) cu t po in t . Yields based on a water free t o t a l syncrude charge are p lo t ted against temperature i n Figure 16.
A1 1 5 6 1 - 7 0 0 ~ ~ (550-800'~) product from the . lo2 m (4") s t i 11 was composi ted as the feedstock t o the hydrocracking step. The IBP-561°k (550'~) f rac t ions were composi ted and f i 1 tered t h r u supercel l t o remove any remaining water. This stock was used as the feedstock t o the hydrotredter.
Because o f the water present i n the i n i t i a l f r ac t i ona t i on o f the COED o i l , an IBP-422O~ ( 3 0 0 ~ ~ ) f r a c t i o n was not obtained f o r analysis. A small por t ion o f the f i r s t two f rac t ions from t h a t run were blended proport ional t o y i e l d and rerun i n a .051 rn (2") Oldershaw s t i l l .
Analyses o f the syncrude and f rac t i ons are given i n Table V I I I . A completely d r ied sample o f the syncrude could no t be prepared, so some o f the values f o r the syncrude had t o be calculated from the analyses o f the f rac t ions .
2. Hydrotreat i ng o f Coal Syncrudes
a. H-Coal Syncrude Hydrotreat inq
I n the case o f coal syncrude, processing t o meet the hydrogen content spec i f i ca t i on was found t o be the l i m i t i n g factor . There- fore, product hydrogen was used t o monitor product q u a l i t y and t o determine when adjustments i n operat ing condi t ions were needed t o maintain su i tab le qua1 i t y .

31.
TABLE VII
H-COAL COMPOSITE FEED AND FRACTIONS
GRAVITY, ~ g l h t l ~ (OAPI)
% HYDROGEN
% CARBON
% SULFUR
NITROGEN, ppm
% OXYGEN
% ASH
POUR POINT, OK (OF)
RING 81 BALL
SOFTENING PT. OK (OF)
KINEMATIC VISCOSITY, cs
@ 255 '~ (0'~) @ 311°K ( 1 0 0 ~ ~ )
8 3 7 2 ' ~ ( 2 1 0 ~ ~ ) % OF TOTAL LIQUID
% OF TOTAL SYNCRUDE % OF TOTAL SYNCRUDE,
ASH FREE % MONOAROMATICS
% POLYCYCLIC AROMATICS
- FEED
870.8 (31.0) 11.8 87.1 0.1 70 1722 0.48 0.0 <211 (<-80)
4.658 1.343
100 28.44
38.91
422-561 OK
30@550
890.0 (27.5) 11.2 87.2 0.073 1749
IBP-422'~ I B P - ~ ~ O ~ F
778.4 (50.3) 13.3 86.6 0.1 29 659 0.6 1 -
1.373
25 7.11
9.73 14.1
0
VACUUM BOTTOMS - - 5.75 74.39 1.93
661 -616 '~ 550-650
969.2 (14.5) 10.0 89.2 0.1 10
616+O~ 650+
1033.6 (5.4) 9.0 89.2 0.199
l*oo I - -
1651 0.49
-
137.5 7.50 5.2 1.48
2.02 10.6
52.7
5.749 1.532
61.4 17.46
23.89 44.9
6.4
5044 1.16% 1.34 I 4.60
14.62
390 (243)
- 71.56
61.09
7.313 1.887 8.1 2.30
3.15 29.2
42.2

TABLE Vll l
GRAVITY, K Q / M ~ (OAPI)
% HYDROGEN % CARBON % SULFUR NITROGEN, ppm
% OXYGEN % ASH POUR POINT OK (OF)
COED OIL COMPOSITE FEED AND FRACTIONS
FEED
KINEMATIC VISCOSITY, CS
1 I
SAYBOLT VISCOSITY @ 3 7 2 ' ~ (210°F), CS 1 I
12.42 2.228 -
I
17.7
% RESINS % MONO AROMA1 ICS % POLYAROMATICS
% OF TOTAL
1.449 - -
@ 2 5 5 ' ~ (oOF) @ 3 1 1 ' ~ (100'~) @ 3 7 2 ' ~ (210'~)
- 9.128 2.092
- 11.81 -
C 'Back Calculated from Analyses of Fractions
100
- 41.06 4.860
- 16.2 0.0 4.0
- 51 .o 8.1 32.5
9.0 34.4 25.1 18.0
9.1 20.0 37.4 27.0
21.8 14.1 34.8 18.5

33.
FIGURE 15
H-COAL LIQUID PRODUCT AS RECEIVED
(38.91% OF TOTAL PRODUCT)
0 10 20 30 40 50 60 70 80 90 100
WT. % OH
FIGURE 16
COED SYNCRUDE DISTILLATION CURVE
lWk WT. % OVERHEAD

A shor t pre l iminary run was made t o determine what processing condit ions would be required to hydrotreat the H-Coal feed t o the spec i f ied 12.75 and 13.5 percent product hydrogen leve ls . A . I00 Kg charge of HDS-3A c a t a l y s t was d i l u t e d on a gradient w i th tabu1 a r a1 umi na t o he1 p cont ro l temperature increases resu l t i ng from exothermic hydrogenation react ions, p a r t i c u l a r l y aromatic saturat ion. The mixture ranged from 3 par ts o f alumina f o r each p a r t o f ca ta l ys t a t the i n l e t of the bed t o a r a t i o o f 1.8 a t the ou t l e t . The fo l low ing matr ix o f con- d i t ions was selected f o r inves t iga t ion during the experimental run:
Temperature, OK (OF) 616-644 (650-700)
Pressure, ~ / m 2 (PSIG) 13.8-17.2 x 10⁶ (2000-2500)
WHSV, h r -1 0.33-1.0
Hz Rate. m3/m3 (SCFIB) 1348 (8000)
The hydrotreat ing production run on the H-Coal feed was made using a .500 Kg charge o f HDS-3A c a t a l y s t t h a t was d i l u t e d w i t h alumina on the same d i s t r i b u t i o n gradient used f o r the pre l iminary run. The h igh hydrogen product run was made f i r s t t o take advantage o f f resh c a t a l y s t a c t i v i t y . Based on the resu l t s o f the experimental run, the high seve r i t y po r t i on o f the run was i n i t i a t e d a t the fo l low ing se t o f condit ions:
Temperature, OK (OF) 630 (675)
Pressure, ~ / m 2 (PSIG) 17.2 x 10⁶ (2500)
WHSV, h r - 1 0.5
H2 Rate, m3/m3 (SCFIB) 1348 (8000)
By the end o f t h i s segment of the run, temperature had been increased t o 636OK (685'~) and WHSV had been reduced t o 0.45 h r -1 i n order t o maintain required product qua l i t y . The low sever i ty hydrogenation fol lowed imnediately on the same ca ta l ys t charge. Operating condit ions f o r t h i s por t ion o f the run were se t at :

Temperature, OK (OF) 611 (640)
Pressure, ~ / m ~ (PSIG) 13.8 x l o 6 (2000)
WHSV, hr ' l 0.5
Hp Rate, m3/m3 (SCFIB) 1348 (8000)
Approximately .038 m3 ( ten gal lons) of feed were t reated a t each sever i ty l eve l .
b. I B P - ~ ~ ~ ~ K (5500F) COED Syncrude Hydrotreat i np
The I B P - ~ ~ ~ ~ K (550'~) f r a c t i o n o f COED Syncrude was hydrogenated a t high and low sever i ty condit ions p r i o r t o blending w i t h hydrocracked product t o produce the high y i e l d coal syncrude j e t f ue l samples. Feed inspections are presented i n Table X.
Preparatory t o the production run, a shor t experimental program was conducted t o determi ne what operat i ng condi t ions would be necessary t o make the desired products. As w i th the H-Coal feed, hydrogen content i s the l i m i t i n g f a c t o r i n meeting required product qua1 i t y leve ls . The pre l iminary tes ts were made i n a one inch diameter isothermal reactor over a .I00 Kg charge o f ca ta lys t . To a i d i n cont ro l 1 i n g temperature increases resul t i n from the exothermic hydrogenation react ions, the .0016 m 4 1/16") ca ta l ys t was d i l u t e d on a gradient, w i th 3 par ts tabular alumina t o 1 p a r t ca ta l ys t a t the top o f the bed ranging t o a 1:8 r a t i o a t the ou t l e t . Process condit ions selected f o r t h i s i nves t i ga t i on included:
Temperature, OK (OF) 616,630,644 (650,675,700)
Pressure, ~ / m ~ (ps ig) 13.8 x lo6 (2000)
WHSV, g. feed/hr./g. ca ta l ys t 0.5, 1.0
Hz Rate, rn31.3 (SCFIB) 1348 (8000)

The hyd ro t r ea t i ng product ion r un on IBP-561°K (550'~) COED o i 1 was conducted us ing .500 Kg o f c a t a l y s t i n a ,051 m ( two i nch ) diameter isothermal reac to r . The c a t a l y s t was d i l u t e d on t he same d i s t r i b u t i o n g rad ien t used f o r the experimental run. The h i gh s e v e r i t y samples were produced f i r s t t o take advantage o f f resh c a t a l y s t a c t i v i t y . The i n i t i a l cond i t i ons :
Temperature, OK (OF) 641 (695)
Pressure, ~ / m 2 (PSIG) 13.8 x 10⁶ (2000)
Hz Rate, m3/m3 (SCF/B) 1348 (8000)
were se lected on the bas is of t he r e s u l t s of the experimental run. I n i t i a l l y , c a t a l y s t a c t i v i t y was b l i g h t l y h igher than t h a t observed dur ing the experimental run, bu t a c t i v i t y dec l ined a t an average r a t e o f 11% per day (on a r e l a t i v e WHSV bas i s ) du r ing t he h i gh s e v e r i t y operat ion. To compensate, i t was necessary t o increase reac to r temperature t 3 647OK (705'~) by the end o f t h i s p o r t i o n of the program. Low s e v e r i t y t r e a t i n g t o produce t he 12.75 percent hydrogen product f o l lowed imrnedi a t e l y on the same c a t a l y s t charge. Condi t ions were s e t a t :
Temperature, OK (OF) 616 (650)
Pressure, ~ / m ~ ( ps i g ) 13.8 x 10⁶ (2000)
WHSV, h r ' l 0.8
Hz Rate, m3/m3 (SCFIB) 1348 (8000)
Due t o t he ex ten t o f c a t a l y s t deact ivat iL l , , ..n increase i n temperature t o 6 2 2 ' ~ ( 6 6 0 ~ ~ ) and a reduc t ion i n WHSV t o 0.7 h r -1 was requ i red before spec i f i ca t i on q u a l i t y product was obtained. Ca ta lys t a c t i v i t y decl i ne cont inued dur ing the 1 ow s e v e r i t y program a t a r a t e o f 8% per day, r e q u i r i n g a f u r t h e r reduc t ion i n WHSV t o 0.65 h r - l by the end of the run.
Approximately .042 m3 (11 ga l l ons ) o f feed were t r ea ted a t each of the s e v e r i t y l eve l s .
c. Hydrotrea ti ng of 5 6 1 - 7 0 0 ~ ~ (550-800'~) COED Qncrude
I n o rder t o prevent deac t i va t i on o f the c a t a l y s t du r i ng the hydrocracki n! step, hydrodeni t rogenat ion o f the 5 6 1 - 7 0 0 ~ ~ (550-800'~) COED o i 1 f r a c t i o n was requi red. Previous work on s i m i l a r heavy COED o i l f r a c t i o n s i nd i ca ted d i f f i c u l t y i n ach iev ing t he product n i t r ogen l e v e l s of 200-400 ppm which were des i red i n t h i s step. Therefore, no experimental t e s t s were made, bu t the product ion r un on t h i s mate r ia l was i n i t i a t e d d i = e c t l y a t r e l a t i v e l y severe cond i t i ons . Using .700 Kg of HDS-3A ca ta l ys t , the process cond i t i ons o f 6 5 8 ' ~ 725OF),
I S 6 0.75 WHSV .5 5 Kg/hr. feed r a t e ) , 13.8 x 10⁶ N/m (2000 PSIG) and 1348 m /m (8000 SCFIB) hydrogen r a t e which were se lected resu l t ed i n a product n i t r ogen l e v e l of 175-200 ppm. Th is r u n was terminated a f t e r approximately f o u r days, however, due t o r eac to r plugging. The ca!lse o f t h i s p lugging was found t o be a wh i t e s o l i d mate r ia l which deposi ted i n the e x i t , i n e from the reac to r . A f t e r p lugging again occurred on a second c a t a l y s t charge, the r un was r e s t a r t e d w i t h precaut ions taken t o thoroughly d ry the feedstock and r e l i e v e the r e s t r i c t e d area i n the r eac to r e x i t l i n e . Plugging again occurred, bu t the r un was completed a f t e r f r ee i ng t he reac to r e x i t o f so l i ds . The a c t i v i t y o f the c a t a l y s t samples used t o complete the run was somewhat lower than the a c t i v i t y noted dur ing the f i r s t f ou r days o f the run. Therefore, i n o rder t o achieve the proper product n i t r o en l e v e l , i t was necessary t o r a i s e the temperature a t o 664OK (735 F) and lower the WHSV t o 0.70.
A t o t a l o f . I32 m3 (35 ga l l ons ) of hydro t rea ted 561-700'~ ( 5 5 0 - 8 0 0 ~ ~ ) COED o i l product was obtained from t h i s run. Feed analyses a re shown i n Table X I .
3. Hydrocracking o f the 5 6 1 - 7 0 0 ~ ~ ( 5 5 0 - 8 0 0 ~ ~ ) F rac t i on G T COED Syncrude
The hydrocracking p o r t i o n o f the study t o prepare the h i gh y i e l d coa l syncrude samples was performed i n a s i n g l e stage u n i t . This cons is ted hf two reac to rs i n se r ies . The f i r s t r eac to r deni t rogenates the feed t o a l e v e l t h a t i s s u i t a b l e f o r the second reac to r , which i s the hydrocracker. The t o t a l e f f l u e n t from the f i r s t r eac to r i s passed d i r e c t l y t o the second where the hydrocracking reac t ions take place. Both ca ta l ys t s are p rop r i e t a r y and a re commercial ly a v a i l a b l e under 1 i cense.

Prel Jm i nary experimental work was necessary t o determine the condit ions needed f o r the hydrocracking product ion run. Corre lat ions from the f i r s t pass hydrot reat ing data were used t o estimate the hydrot reat ing reac tor condit ions required t o reduce the 237 ppm N feed t o ~ 2 0 ppm. The condi t ions f o r the pro\:uction run were set a t the fo l low ing values:
1.05 WHSV i.300 Kglhr.)
1685 m3 tI2/m3 (10,QOO SCF Hz/BBL)
13.8 x l o6 ~ / m 2 (2000 PSIG)
These condit ions produced an organic n i t rogen content i n the product 9 f 22 ppm.
Two tes ts o f the hydrocracking zone were performed i n order t o detei-mine the process condit ions f o r the p r o d u c t i ~ n run. The tes t condit ions are shown below:
Test No. 1 2 Pressure, ~ / m 2 (PSIG) 13.8 x 10⁶ (2000)------ WHSV l.o-------------------- Hydrogen Flow, m31m3 (SCFIB) 1685 (10,000)---------- Temperature, OK (OF) 619 (654) 607 (634)
Based on these tes s t h process condit ions chosen fo r t h product ion 6 t 3 4 run were 13.8 x 10 N/m (2900 PSIG), 1.0 WHSV, 1685 m /m (10,000 SCFIB) H2 and 6 0 7 ~ ~ (634OF) f o r 97% conversion t o 616OK (6500F) and l i g h t e r .
The product ion run was performed using .051 m (2 " ) I .D. reactors: the hydrodeni t rogenat ion reactor contained .284 Kg of c a t a l y s t and the hydrocracking reactor contained .300 Kg. Both were d i l u t e d w i t h i n e r t tabu la r alumina i n a i inear manner t o make up the reqb ,red rea r to r vollrme (.001 m3). The f l ush a c t i v i t y o f the ca ta iys ts was rernoved by procesi ing a medium bo i 1 i n g range gas o i 1 over the c a t a l y s t f o r 72 hours before the product ion run. Tests of the f i r s t reactor e f f luen t showed t h a t the ca ta l ys t was not act ive, necessi ta t ing replacement. A new charge o f the hydrodeni t rogenat ion ca ta l ys t was i n s t a l l e d and subsequent tes ts showed i t had i t s normal a c t i v i t y .

The COED o i l was then s ta r ted over the ca ta lys t . After a shor t 1 i n i n g out period, a sample o f the second reactor e f f l u e n t was taken. This sample showed t h a t the second reactor c a t a l y s t had l o s t sr.ne of i t s a c t i v i t y due t o the poor performar~ce o f the f i r s t charge o f hy4rotreat i ng ca ta lys t . The conversion t o 616OK (650°F) and l ighteb had dropped from 97% t o 79%, i nd i ca t i ng an a c t i v i t y loss o f 50% o f i t s o r i g i n a l value. However, the 79% conversion l eve l was maintained. During the l a s t quar ter o f the production run the feed r a t e was ra ised t o .400 Kgjhr., w i th su i tab le correct ions made i n the reactor temperatures t o maintain conversion. Corrections i n the hydrocracki ng reactor temperature were a1 so necessary during the course o f the run t o compensate f o r ca ta l ys t aging. Over the 330 hrs. o f the production run the temperature was ra ised because o f t h i s aging by 23OK (420F); other condit ions remained constant (except f o r the WHSV change previously described). Approximately . I17 m j (31 gals.) o f feed were processed i n t h i s step.
4. Final Blending and Fract ionat ion
The two 311-6160K ( 1 0 0 - 6 5 0 ~ ~ ) hydrotreated H-Coal products ( i .e., high and low H content) were f rac t ionated t o produce the f i n a l samples i n the same manner as described i n Section 111-A-4 f o r the 'hale o i l products.
The hydrocracked 5 6 1 - 7 0 0 ~ ~ (550-800°F) COED o i 1 was f ract ionated i nto 311-616 b100-650) atid 616'~ (650°F)+ f rac t ions . ihe 3 1 1 - 6 1 6 ~ ~ (100-650 F) f r a c t i o n was obtained i n 70.2 w t . % y i e l d on hydrocracker feed, o r 27.0 w t . % y i e l d on COED syncrude. Port ions o f t h i s mater ia l were blended w i th the hydrotreated 311-561°K 1 0 0 - 5 5 0 ~ ~ ) COED products 6 i n a 45% hydrocrackate/55% 311-561°K (100-550 F) HDN product r a t i o t o produce the high y i e l d coal syn~rude samples a t two sever i ty (H content) levels . These 311-616 K (100-650'~) composites were then f ract ionated as were the shale and H-Coal products t o produce the f i n a l samples.
B. Results
1. Hydrotreating o f Coal Syncrudes
a. H-Coal Syncrude Hydrotreat ing
Results from the experimental run were used t o develop the r e l a t i onshi p between product hydrogen content and operat i ng sever i ty shown i n Figure 17. The e f f e c t o f temperature on the hydrogenation react ions i s presented i n Arrhenius form i n Figure 18. From th i s , an a c t i v i t y energy of 94 x 106 joule/Kg mole (22.5 kcal/g mol ) was calculated. An increase i n temperature of about 25O~ (45'~) has an effect equivalent t o doubling the reactor residence time. Differences i n pressure a lso had an

effect on the r a t e of hydrogenation and a factor has been included i n the co r re la t i on t o adjust f o r t h a t (Figure 17).
An important r e s u l t o f t h i s run was the demonstration t h a t the high hydrogen content spec i f i ca t i on o f 13.5 percent could be a t ta ined a t severe but p rac t i ca l operating condit ions i n a s ing le pass operation. I t had been ant ic ipated t h a t a two- stage process might be required t o achieve the necessary l eve l o f hydrogenation.
As Figure 17 shows, there i s a l i m i t i n g value t o hydrogen content @ f a13.7 percent, and as i t i s approached, la rge increases i n sever i ty a re required t o make detectable gains i n hydrogenation 1 eve1 . A t the con i ti ons employed, i .e. , 616-644OF (650-700°F) g and 13.8-17.2 x 10 ~ / m 2 (2000-2500 PSIG), the thermodynamics of b i c y c l i c aromatics ind ica te about 99% conversion t o the perhydro product a t equi 1 i b r i um. Therefore, t h i s 1 i m i t i ng value o f 13.7% H i s a s to ich iometr ic rather than an equ i l ib r ium 1 i m i t, and could not be increased by changing condit ions (e. g. , higher pressure).
I n i t i a l a c t i v i t y o f the production run ca ta l ys t was about equal t o t h a t observed i n the experimental run. Cata lyst deact ivat ion during the run, however, made necessary the increases i n operating sever i ty mentioned ea r l i e r . To compensate f o r loss o f a c t i v i t y , an average severi t y increase equivalent t o 1 .7O~ (3.O0F)/day during the high sever i ty operation, and 1. 1°K ( 2.0°F)/ day a t the low sever i ty condit ions was required.
The products from the high and low sever i ty operations were each composited t o form the t o t a l product samples. Inspections o f the feed and product composites are presented i n Table I X . Hydrogen consumption was calculated a t a y u t 185 m3/rn3 (1100 SCF/B) f o r the high sever i ty tests and 108 m3/m (640 SCF/B) f o r the low sever i ty operat i on.
*F = W H S v ( 2 q - a t constant conversion. P2000 Kv( ;soo

41.
TABLE IX
FEED AND PRODUCT INSPECTIONS
H-COAL LIQUID COMPOSITE
HIGH SEVERITY PRODUCT
5-3336 1 833.8 (38.2) 13.60 0.0006 0 0.04
r
SAMPLE NO.
GRAVITY, K ~ I M ~
(OAPI)
% HYDROGEN % SULFUR
% NITROGEN % OXYGEN
FEED
5-33276 870.8 (31.0) 11.81 0.1 70 0.1722 0.63
DlSTl L LATION BY GAS CHROMATOGRAPH
LOW SEVERITY PRODUCT
J-33359 849.3 (35.1) 12.75 0.0004 0.0005 0.1 1
33g°K 151°F 36 7 20 1 389 240 41 1 280 434 322 453 356 470 386 487 4 18
i! 1 594 609 662
I BP
5%
10 20 30 40 50 60 70 80
90 95
EP
3 3 9 ' ~ 150°F 36 7 20 1 389 240 410 2 79 434 322 455 359 473 392 49 1 425 51 3
536 !! 572 600 620 6 70

42. FIGURE 17
I H-COAL HY DROTREATING
- 13.5 - I-
D-3649 H-COAL FEEC
HDS-3A CATALYST
1348M3/M3 18000 SCFIB) H 2
PRESSURE FACTOR (Fp)
0 1.0 2.0 3.0 u
SEVERITY = F~ F~
FIGURE 18 TEMPERATIIRE FACTOR FOR H-COAL HYDROGENATION
1 lo4 TEMPERATURE

b. IBP-561°~ (550°F) COED Syncrude Hydro t rea t i ng
The c o r r e l a t i o n between hydrogen con ten t and opera t ing s e v e r i t y shown i n F igure 19 was develoned from r e s u l t s obtained du r i ng t h e experimental run. Th is feed was a lower b o i l i n g f r a c t i o n than t he H-Coal sample co r re l a ted i n F igure 17. Therefore, as a comparison o f t he two f i gu res shows, the spec i f i ed h i gh hydrogen content o f 13.5 percent was no t as c lose t o t he s a t u r a t i o n l i m i t f o r t he COED f r a c t i o n as f o r t he H-Coal f r a c t i o n . However, desp i te the c lose approach t o the sa tu ra t i on 1 im i t and a lower feed hydrogen content, 1 ess severe opera t ing cond i t i ons were requ i red t o meet product s p e c i f i c a t i o n s w i t h the H-Coal feed than w i t h t h i s COED sample.
A curve de i c t i n g the e f f e c t o f temperature on the hydrogenation g o f iBP-561 K (550°F) COED o i 1 has been presented i n F igure 20. Th is curve i s no t t he s t r a i g h t l i n e genera l l y associated w i t h Arrhenius p l o t s . However, any e f f e c t s o f c rack ing a t h igher temperatures, which would i ncrease product hydrogen content, have no t been excluded from the r e l a t i o n s h i p . D i f ferences between t he d i s t i l l a t i o n s o f the products show a s i g n i f i c a n t increase i n c rack ing a t the h igher temperature. Cracking of C-C bonds r e s u l t s i n products w i t h a h igher H/C r a t i o . I f the a c t i v a t i o n energy o f the hydrocracking r e a c t i o n i s g rea te r than t h a t o f hydrogenation o f aroma t i c compounds, a temperature c o e f f i c i e n t curve f o r t he o v e r a l l r eac t i on o f the observed shape would r e s u l t . Th is r e l a t i o n s h i p o f apparent hydrogenat ion r a tes a t 616 (650) and 6 4 4 O ~ ( 7 0 0 ~ ~ ) was l a t e r subs tan t ia ted by r e s u l t s of t he product ion run.
F igure 21 shows the r e l a t i o n s h i p between hydrogen consumption and product hydrogen content .
Analyses o f the h igh and low s e v e r i t y hydrot reated products and t he feedstock a re shown i n Table X .
The ra tes o f c a t a l y s t deac t i va t i on observed dur ing the product ion runs a re unusual ly high, f o r no immediately apparent reason. If they were t o cont inue, opera t ion would on ly be poss ib le f o r a few weeks be fo re t he c a t a l y s t a c t i v i t y had dec l ined t o the p o i n t t h a t regenerat ion o r c a t a l y s t replacement would be requi red. It i s poss ib le , however, t h a t a c t i v i t y might s t a b i l i z e a t some lower value and permi t runs o f p r a c t i c a l du ra t ion . Longer term aging s tud ies would be requ i red t o reso lve these quest ions.

FEED AND PRODUCT INSPECTIONS
I B P - ~ ~ ~ ~ K ( 5 5 0 ~ ~ ) COED SYNCRUDE
SAMPLE NO.
GRAVITY K ~ / M ~ (OAPI)
HYDROGEN, %
SULFUR, ppm
NITROGEN. ppm
R.I. @ 2 0 ' ~
HIGH SEVERITY PRODUCT
33478 832.8 (38.4) 13.47 3.4 4 -
FEED
33439 887.7 (27.9) 12.32 240 3338 1.49165
LOW SEVERITY PRODUCT
33487 851.4 (34.7) 12.77 2.2 5 -

FIGURE 19
A 13.50 - t- L1 3
13.8 x lo6 N / M ~ (2000 PSIGI 1348 M ~ / M ~ (8000 SCFIB) H2
0 1 2 3
45. FIGURE 20
TEMPERATURE FACTOR FOR I B P - ~ ~ I ~ K ( 5 5 0 ~ ~ ) COED OIL HYDROGENATION
SEVERITY = FT/wHsV
FIGURE n 1 ~ ~ - 5 6 1 ~ ~ ( 5 5 0 ~ ~ 1 COED OIL HYDROTREATING
HYDROGEN CONSUMPTION RATE
1000 t ::"-3677 FEED
800
PRODUCT HYDROGEN CONTENT (WT. %I
c. Hydro t rea t i ng of 561-700'~ (550-800°F) COED Syncrude
Because of the frequent r eac to r p lugging and run r e s t a r t s , adequate data t o prepare a sever i ty /convers ion c o r r e l a t i o n was no t obtained. It i s poss ib le , however t o make a s i n g l e p o i n t comparison between the s e v e r i t y requ i red f o r the COED syncrude and the 616-783OK (650-9500F) sha le f r a c t i o n . A t the cond i t i ons r u n ( 550K, 720°F; 5 0.75 WHSV; 13.8 x 10⁶ ~ /m2, 2000 PSIG; and 1348 m3/m , 8000 SCF/B H z ) n i t r ogen removal from the COED syncrude was 95%, w h i l e shale o i l den i t rogenat ion would be 89% (F igure 4 ) . However, i f a l low- ance i s made f o r the almost ten fo ld h igher feed n i t r ogen content and the 830K (150°F) h igher end p o i n t o f t he sha le o i l , we est imate t h a t COED syncrude i s i n f a c t about 1.3 times more d i f f i c u l t t o deni t rogenate than shale o i 1.
The w h i l e s o l i d mate r ia l which was respons ib le f o r p lugging the reac to r was p o s i t i v e l y i d e n t i f i e d by x-ray d i f f r a c t i o n as being predominantly ammonium ch lo r i de , w i t h smal l q u a n t i t i e s o f i r o n s a l t s and organic mate r ia l a l so detected by microscopica l exam- i na t i on . Analyses o f the 5 6 1 - 7 0 0 ~ ~ ( 5 5 0 - 8 0 0 ~ ~ ) COED o i l feed- stock and hydrot reated product f o r c h l o r i n e i n Table X I show t h a t c h l o r i n e was removed from the feedstock i n the hydro- t r e a t i n g reac to r , presumably as HC1, which reacted w i t h amon ia t o form a s o l i d depos i t of ammonium c h l o r i d e i n the coo le r zone of the r eac to r e x i t . F i l t r a t i o n and molecular s ieve d r y i ng treatments o f the 561-7000K (550-800°F) hydro t rea te r feedstock were unsuccessful i n prevent ing reac to r p lugging and, the re fo re , i n removing ch lo r ine . However, a water washing procedure u t i l i z i n g equal volumes of water and 561-700°K (550-800'~) COED o i l was found t o reduce the ch lo r i ne content o f the 5 6 1 - 7 0 0 ~ ~ ( 5 5 0 - 8 0 0 ~ ~ ) f r a c t i o n from 0.039 t o 0.008 w t . %. This i nd i ca tes t h a t t he c h l o r i n e was present as a water so lub le compound which i s r e a c t i v e a t the cond i t i ons of the hydro t rea te r . The o r i g i n o f t h i s ma te r i a l i s unknown.
Feed and composite product analyses a re shown i n Table X I . Hydrogen consumption was approximately 320 m3/m3 (1900 SCF/B). A c a t a l y s t deac t i va t ion r a t e was d i f f i c u l t t o c a l c u l a t e as a r e s u l t of the r eac to r p lugging problems which were encountered. However, the re was a no t i ceab le loss i n c a t a l y s t a c t i v i t y , as i s apparent from the increase i n product n i t r ogen values from %175 t o rb300 ppm, recorded dur ing the run. The n i t r ogen content o f the composi ted product was 237 ppm. I n add i t i on , the G.C. s imulated d i s t i l l a t i o n s show t h a t appreciable crack ing occurred, r esu l t i n g i n approximately 20% conversion t o 5 6 1 ° ~ (5500F) and l i g h t e r ma te r i a l . Tota l l i q u i d product y i e l d , however, was essen t ia l l y 100 ~ e r c e n t .

47.
TABLE XI
COED 561-700'~ ( 5 5 0 - 8 0 0 ~ ~ ) HYDROTREATING
PRODUCTION RUN
r
SAMPLE NO. GRAVITY K ~ / M ~
(OAPI 1 % SULFUR
% HYDROGEN
PPM NITROGEN
% CHLORINE
- DlSTl LLATION (G.C.)
ISP
5%
10
20 30 4C
50
60 70
80
90
95
EP
FEEDSTOCK
33358 951.6 (1 7.2) 0.025 10.63 3578 0.039
OK
560 57 1 576 589 602 6 16 630 644 658 673 694 708 739
COMPOSITE PRODUCT
33386 916.4 (22.9) 0.002 11.91 237 0.01 1
OF
548 569 578 60 1 625 6 50 675 699 725 752 789 81 5 87 1
OK
3 79 50 7 53 7 564 58 1 59 7 615 632 650 669 69 1 705 733
OF
222 453 507 556 586 616 64 7 6 78 71 0 744 78 5 809 860
2. Hydrocracking o f the 5 6 1 - 7 0 0 ~ ~ ( 5 5 0 - 8 0 0 ~ ~ ) F rac t i on o f COED Syncrude
Since the conversions t o 6 1 6 ' ~ (€50°F)- were too h igh i n t h e experimental runs t o be determined accura te ly (%95%), and c a t a l y s t a c t i v i t y was cons tan t l y changing dur ing the product ion run (Table XII), an i n d i r e c t approach was necessary t o de r i ve the k i n e t i c s of the hydrocracki ng reac t ion . Using the experimental run data, a temperature c o e f f i c i e n t of r eac t i on was obtained f o r the f i r s t o rder r a t e constants o f con- ve rs ion t o 4 7 2 ' ~ (3900F)-. Using t h i s temperature c o e f f i c i e n t , c a t a l y s t a c t i v i t y f o r conversion t o 472O~ (390°F)- as a func t ion of t ime on stream dur ing the product ion run was ca lcu la ted . This a c t i v i t y cor - r e l a t i o n i s shown i n F igure 22. Assuming t h a t a c t i v i t y f o r conversion t o 616OK (650°F)- products was p ropor t iona l , a temperature coe f f i c i en t f o r conversion t o 6160K ( 6 5 0 ~ ~ ) - products was ca l cu l a ted (F igure 23). and the f i r s t o rder c o r r e l a t i o n f o r conversicn t o 616OK (65O0F)- i n c o r p o r a t i r ~ g these f ac to r s i s shown i n F igure 24.
The a c t i v i t y , a, i s def ined as the r e l a t i v e WHSV requ i red t o ob ta i n constant conversion. A t the end o f t he t es t , c a t a l y s t a c t i v i t y was down t o 0.13 r e l a t i v e t o the a c t i v i t y observed dur ing the experimental t e s t . Th is r a t e o f c a t a l y s t d e c r t i v a t i o n would be a ser ious obstac le t o any commercial a p p l i c a t i o n o f t h i s process. I t i s normal, w i t h t h i s c a t a l y s t system, t o have a r a t e of a c t i v i t y dec l ine a t the beginning o f a run per iod t h a t i s r e l a t i v e l y g rea te r than i s observed l a t e r i n the run. However, i n t h i s case we have an a c t i v i t y dec l ine of 75% i n 350 hours (neg lec t ing the i n i t i a l d e a c t i v a ~ i a n due t o the HDN c a t a l y s t malfunction:, which i s excessive. Whether t h i s a c t i v i t y dec l ine would lessen and the c a t a l y s t s t a b i l i z e if the run was continued beyond 350 hours cannot be pred ic ted. A reduc t ion i n the feed endpoint t o 644-6720K (700-7500F) may be one poss ib le way t o m i t i g a t e t h i s problem.
The a c t i v i t y dec l i ne a lso a f f ec ted product d i s t r i b u t i o n . As temperature was increased t o mainta in conversion constant a t ~ 8 0 w t . % t o 6 1 6 ~ ~ (650°F), 1 i ghter products ( 4 2 2 ° ~ ( 3 0 0 0 ~ ) ) increased a t t he expense of the heavier, p r i m a r i l y 422-472'~ (300-390°F). Th is e f f e c t i s shown i n F igure 25.
Because most o f the product ion run was made a t a constant conversion, 80%, the component y i e l d s and H z consumption r e l a t i v e t o conversion cannot be defined. A t 80% conversion t o 616OK- (650°F), H z consumpti on was %227-236 m3/m3 (~1350-1400 SCFIB) . Due t o some confusion as t o the exact weights of t o t a l feed and product, the o v e r a l l y i e l d on feed of the hydrocrackate was assumed t o be 95%, which was the average y i e l d o f the weight balanced t e s t s made dur ing the product ion run.

The product from the product ion run was composited, and the b o i l i n g p o i n t d i s t r i b u t i o n of the 311oK+ ( l O o O ~ + ) l i q u i d product as a f unc t i on o f w t . % on h y d r o c r a c ~ e r feed i s shown i n F igure 26. The 311-616OK (100-650°F) product was produced i n 70.2 w t . % y i ~ l d on feed, 27.1% on COED syncrude; and the 422-561oK (300-550°Fj i n 26 w t . % y i e l d on feed, 10.0% on syncrude.
3. F ina l Product Yields and Analyses
a. H-Coal Products
WT. % YIELD ON TOTAL H-COAL SYNCRUDE
(Low Y ie l d Coal Syncrude Samples)
Sample No.
B o i l i n g Range, OK
, OF
TOTAL
LOW SEVERITY
-xq-GG H I G H SEVERITY
Gq-iG-
Analyses o f a l l f i n a l product samples a re given i n Table X I I I .
b. COED P r ~ d u c t s - WT. % YIELD ON TOTAL COED SYNCRUDE
(High Y ie l d Coal Syncrude Samples )
1 Sample NO.
B o i l i n g Range, OK 9 OF
TOTAL
LOW SEVERITY -
33516 33517 33519 33518
H I G H SEVERITY

50.
TABLE XI1
581-700'~ (550-800~~) COED SYNCRUDE HYDROCRACKING
13.8 i lo6 NIM~ (2000 PSIGI, 1685 hh31M3 (10,000 SCFIBI H2
TEST NO.
HOURS ON OIL
TEMP. HDN
OK
(OF I
WHSV
HDN REACTOR
HCK REACTOR
YIELDS, WT. %
ON FEED
c3-
c4
( 1 0 @ 3 0 0 ~ ~ I
422.561'~
(300-550°F)
561-616'~
(550-650~~)
616+OK
(650+OF
Hp CONS., WT. 91
EXPT'L RUN 1 PRODUCT ION RUN 1

51.
FIGURE 22
HYDROCRACKING CATALYST SINGLE STAGE ACTIVITY HYDROCRACKING
EXP. TEST RUN d = 1.0 561-700°K (550-800'F) COED Ol L
I HRS. ON STREAM I
FIGURE 23
HYDROCRACKING OF 561-700'~ (550-800'~) COtD SYNCRUDE
TEMPERATURE COEFFICIENT
a EXP. RUN 0 PROD'N. RUN
2.0 -
1.58 1.60 1.62
.87 .W .89 .90 .91 .92
HYDROCRACKING OF 561 - 7 0 0 ' ~ (550-800'~)
COED SYNCRUDE
98 13.8 x lo6 N / M ~ (2000 PSIG) 1685 M ~ / M ~ (10,000 SCF/B) H2

FIGURE 25
HYDROCRACKlNG OF 561 - 7 0 0 ' ~ (550-800'~) - COED OIL YIELDS,
WT. % OF 6 1 6 ' ~ (~~cOF)-PRODUCT - 80 WT. % CONVERSION TO 6 1 6 ' ~ - 18
16 - 14 -
; 12 -
HYDROCRACKlNG TEMPERATURE

FIGURE 26
1 I I 1 I I 1 I 1 I 0 10 20 30 40 50 60 10 80 90 1
WT. % YIELD ON HYDROCRACKER FEED
OF
HYDROCRACKING OF 561-700'~ (550-800'~)
COED SYNCRUDE
Final 31 1°K ( 1 0 0 ~ ~ ) + Product Distribution
OK
800 '0° t I :::

The y i e l d o f 422-561°K ( 3 0 0 - 5 5 0 ~ ~ ) product f a l l s s l i g h t l y shor t of the 40 w t . % on syncrude as ca l led fo r i n the o r i g ina l plan. Once again, z as described i n Section 111-B-4 on sources o f addi t ional y i e l d from shale o i l , hydrocracking o f the 5 6 1 - 7 0 0 ~ ~ ( 5 5 0 - 8 0 0 ~ ~ ) COED o i l t o 100% conversion t o 6160K (650°F) by recycle t o ex t i nc t i on o f the 6160Kt (650°F+) por t ion would be possible, and would be probably pract iced commercially. I n t h a t case, we would expect the fo l lowing t o t a l y i e l d s on syncrude:
Fract ion W t . % Y ie ld
TOTAL 71.71
Analyses o f a l l f i n a l product samples are given i n Table XIII.

SAMPLE NO.
SAMPLE NO.
TABLE Xll l (p.1)
COAL SYNCRUDE PRODUCT DISTILLATIONS (ASTM 0-86)
LOW YIELD PRODUCTS
HIGH YIELD k2ODUCTS
33419 OK OF
380 225 400 261 410 278 41 7 292 425 305 439 331 452 355 464 375
392 247 402 264 41 1 280 422 300
33430 OK OF
383 230 402 265 411 280 416 290 425 305
' 439 330 454 357
3341 8 OK OF
416 290 432 319 437 328 441 334 444 339 453 356 462 372 470 387
3341 6 OK OF
376 218 399 258 406 272 41 1 281 422 301 439 331 455 360 469 384
33431 OK OF
424 304 436 325 440 332 444 340 449 349 457 363 466 379
483 410 499 438 521 479
33432 OK OF
424 304 438 329 443 338 447 346 452 355 461 371 470 387
3341 7
No Result
Too Much Foaming
476 398 1 470 387 1 437 328 493 428 482 409 1 459 366
425 505 450 494 429 j 477 400
Too
/ 551 532 - 553 5361
439 330 444 340 451 352 465 377
468 383 475 395 1 482 409 486 416i 497 436 502 444 / 521 478
481 406 496 434 500 440
1
33433 OK OF
380 224 394 250 403 266 41 1 280 419 295 437 327 457 364
439 331 443 338 449 349 455 359
475 395 ( 479 402
559 547
470 386 480 404 491 425 505 449
1 516 469 524 484 557 544
489 420 1 487 41 8
390 243 400 260 405 270 415 288
530 495 Too Much
542 51 6 558 545 - -
499 438 512 462 532 499
535 504 547 526 , 599 61 9 i Foaming 604 628 j i 624 663 5 5 0 2 557 543 61 - 5 648 1
392 246 403 266 413 284 424 303
544 51 9 545 522
439 330 ! 442 336 i 390 233 445 342 447 345 1 400 261 454 358 452 355 1 406 271 461 371 1 457 364 415 288
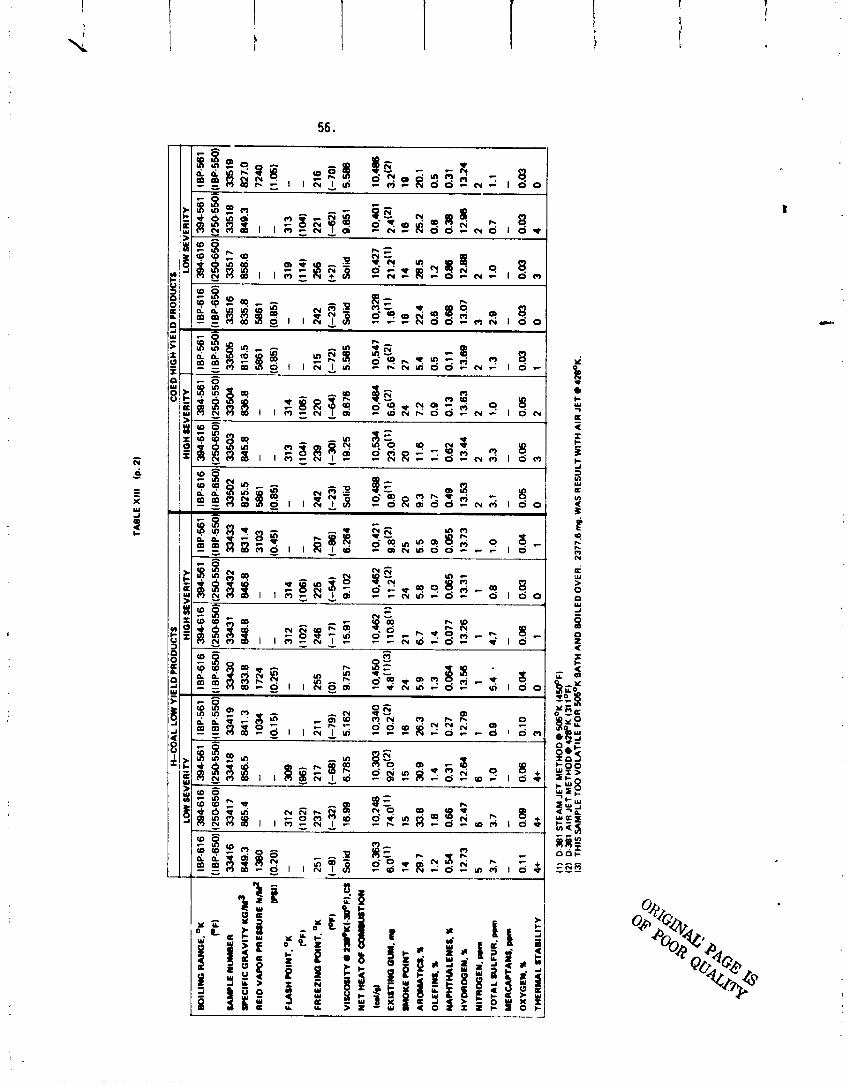
TA
BL
E X
lll
(p. 2
)
BO
ILIN
G R
AN
GE
. OK
PF
)
UM
ILE
NW
R
~~
~C
IF~
CG
RA
V~
NK
GI+
RE
ID V
AP
OR
PR
ES
SU
RE
N&
H-C
OA
L LO
W Y
12)
D-J
B1
AIR
JE
T M
ET
HO
D
4w
K I3
1 1°F
) 13
) T
HIS
SA
MP
LE T
OO
VO
UT
ILE
FO
R 5
06
'~ B
AT
H A
ND
BO
ILE
D O
VE
R.
2377
.8 m
p. W
AS
RE
SU
LT W
ITH
AIR
JE
T e
42
8°~
.
IBP
-616
(I
BP
-650
) 33
416
849.
3 13
80
lE L
D P
RO
DU
CTS
C
OE
D
(1)
D.3
61 S
TEA
M J
ET
ME
TH
OD
5
06
~~
H
WF
)
HIG
H Y
IEL
D
18P
-561
(1
8P
-550
) 33
505
818.
5 58
61
IBP
-616
(1
8P-6
50)
3343
0 83
3.8
1724
(0
.25)
- - 25
5 (0
) 9.
757
10.4
50
4.~
(')(
~)
24
5.9
1.3
0.06
4 13
.56
1 5.
4 .
- 0.04
0
IBP
-616
(I
8P-6
50)
3350
2 82
5.5
5861
(0
.85)
- - 24
2 (-
23)
Sol
id
10,4
88
0.8
(l)
20
9.3
0.7
0.49
13
.53
2 3.1 - 0.05
0
f.U) (
0.20
) F
LA
SH
PO
INT
. OK PF
) ! I
(0.8
5)
- - 215
(-72
) 5.
565
10,5
47
7.
~(
~)
27
5.
4 0.
5 0.
11
13.6
9 2 1.
3 - 0.03
1
LOW
3946
16
(250
650)
33
417
865.
4 - - 312
(102
1 23
7 (-32)
16.9
9
10,2
48
74
.0~
~)
15
33.8
1.
8 0.
66
12.4
7 6 3.
7 - 0.09
4+
FR
EE
ZIN
G C
O(N
T. O
K
PF
)
VIS
CO
UN
~~
J.K
(.~
F).
CIS
O~
~~
N
ET
HIE
AT
OF
-IO
N
IcJN
E
XIS
TIN
G G
UM
.
SM
OK
E C
OlN
T
AR
-~U
. %
OLE
FIN
S. X
N*P
HT
HA
uN
ES
. %
HV
DA
WE
N. X
NIT
RO
GE
N. p
~m
TO
TA
L S
UL
FU
R. p
pm
YE
RU
PT
AN
S.
p~
m
OX
YG
EN
. X
TH
ER
MA
L S
TA
ILIT
Y
PR
OD
UC
TS
HIG
H
394-
616
(250
650)
33
503
845.
8 - - 313
(104
) 23
9 (-3
01
19.2
5
10,5
34
23
.0(l
) 20
11
.6
1.1
0.62
13
.44
2 3.3 - 0.05
3
12
51
(-
8)
10.3
63
6.0
(')
14
29.7
1.
2 0.
54
12.7
3 5 3.
7 - 0.
11
4+
SE
VE
RIT
Y
3945
61
(25
05
50
) 33
418
856.
5 - - 30
9 (9
6)
217
(-68
) 6.
785
10,3
03
92
.0(~
) 15
30
.9
1.4
0.31
12
.64
6 1.0
- 0.06
4+
SE
VE
RIT
V
394-
561
(250
-550
) 33
504
836.
8 - - 31
4 (1
06)
220
(-64)
9.67
6
10,4
84
6.6
(2)
24
7.2
0.9
0.13
13
.63
2 1 .o
- 0.05
2
18P
-561
(1
8P
-550
) 33
433
831.
4 31
03
(0.4
5)
- - 207
(-86)
6.26
4
10.4
21
g.g
(z)
25
5.5
0.9
0.05
5 13
.73
1 1 .o
-
0.04
1
HIG
H
3946
16
(250
650)
33
431
848.
8 - - 312
(102
) 24
6 (-
17)
15.9
1
10,4
62
110.
8(1)
21
6.
7 1.
4 0.
077
13.2
6 1
4.7 - 0.06
1
IBP
-561
(I
BP
-550
) 33
419
841.
3 10
34
(0.1
5)
- -
211
(-79
) 5.
162
10,3
40
10
.2(~
) 16
26
.3
1.2
0.27
12
.79
1 0.9 - 0.10
3
IBP
-616
(I
BP
-650
) 33
516
835.
8 58
61
(0.8
5)
- - 242
(-23
) S
olid
10,3
28
1.6
(l)
16
22.4
0.
6 0.
68
13.0
7 3 2.
9 - 0.03
0
SE
VE
RIT
Y
3945
61
(250
550)
33
432
846.
8 - - 31
4 (1
06)
225
(-54)
9.10
2
10,4
62
11.2
12)
24
5.8
1.0
0.06
5 13
.31
1 0.
8 - 0.03
,o
LOW
394-
616
1250
650)
33
517
858.
6 - - 31
9 (1
14)
256
(+2)
S
olid
10,4
27
21
.2(l
) 14
28
.5
1.2
0.86
12
.88
2 1.0 - 0.03
3
SE
VE
RIT
Y
394-
561
(250
-550
) 33
518
849.
3 - - 31
3 (1
04)
221
(-6
2)
9.85
1
10,4
01
2.4(
2)
16
25.2
0.
8 0.
38
12
96
2 0.
7 - 0.03
4
IBP
-561
(IB
P-5
%
3351
9 82
7.0
7240
11
.05)
- -
216
(-70
) 5.
586
10,4
86
3.2(
2)
I9
20.1
0.
5 0.
31
13.2
4 2 1.
1 - 0.03
0

V. DISCUSSION OF RESULTS
The o b j e c t i v e o f t h i s p r o j e c t was the product ion o f samples o f j e t f u e l o f var ious p rope r t i es from shale o i 1 and coal syncrudes, us ing convent ional petroleum processing technology. These samples were analyzed t o assess t h e i r p o t e n t i a l f o r use as j e t f u e l . No at tempt was made t o opt imize the pro- cess i ng systems, e i t h e r techn ica l l y o r economical l y . The program has demonstrated t h a t products which may be use fu l as j e t fue ls can be produced from tnese petroleum subs t i t u t es by hyd ro t r ea t i ng and hydro- crack ing a t s u i t a b l y severe condi t ions. The products from h igh s e v e r i t y hydro t rea t ing o f shale o i l appear t o be more s u i t a b l e than those from low s e v e r i t y processing. Besides the h igh n i t r ogen content o f the l a t t e r , which cou ld r e s u l t i n undes i rab ly h igh NOx emissions, e x i s t i n g gum and smoke p o i n t a re a lso poor. Lcng term storage s tab i 1 i t y may a lso be a problem. The hydroprocess i ng techno1 ogy f o r the product ion o f these ma te r i a l s i s l a r g e l y developed and does no t appear t o present any severe techn ica l problems.
The samples produced from the coal syncrudes a t h i gh hydrogenation s e v e r i t y would appear t o be l ess des i rab le as j e t f ue l s , p r i m a r i l y w i t h respect t o smoke po in t . The low s e v e r i t y p r ~ d u c t s a re somewhat poorer i n a l l respects. The technology f o r processing o f coal syncrudes i s no t as completely developed as t h a t f o r sha le o i l , and some a d d i t i o n a l process research and development would be requi red, p a r t i c u l a r l y i n t he area o f c a t a l y s t a c t i v i t y and s t a b i - l i t y .
These processes, however, a re sub jec t t o severe economic problems. Hi?h c a p i t a l and processing costs a re associated w i t h the h i gh pressures and low space v e l o c i t i e s requi red. I n add i t i on , l a r g e q u a n t i t i e s o f hydrogen a re consumed i n o rder t o y i e l d reasonable q u a l i t y products. Current costs f o r manufactured hydrogen by steam reforming o f f u e l gas o r naphtha a re ~$2-$2 .50 per 168.5 cubic meters (thousand cubic fee t ) . Based on t h i s value, the hydrogen c o s t f o r h y d r o t r e a t i ng t he e x i s t i n g 311-616O~ (100-650°F) f r a c t i o n o f sha le o r coal syncrude i s a$2.50/. 16 m3 (Bbl ), (185 m3/m3, 1100 SCFIB). I n the case o f coal syncrude, t h i s i s i n a d d i t i o n t o t he subs tan t ia l hydrogen consumption o f the 1 i quefact ion process i t s e l f .
If heavier f r ac t i ons a re hydrocracked, hydrogen costs increase r a p i d l y . I n t he shale o i l case, i t increases t o ~ $ 4 per .16 n3 ( b a r r e l ) o f product (292 m3, 1735 SCF), o r $6.50 per incremental .16 m3 ( b a r r e l ) of product. For coal syncrude, o v e r a l l hydrogen c o s t becomes ~ $ 5 per .16 m3 ( b a r r e l ) o f product (393 m3, 2330 SCF), o r a$8 per incremental .16 m3 ( b a r r e l ) o f product-agai n i n a d d i t i o n t o the hydrogen consumed i n the 1 i q u e f a c t i o n process.

The above considerat ions emphasize the importance o f op t im iza t ion o f these processes. Both the hydrotreating-hydrocracki ng system and a1 t e r n a t i ve process schemes requ i re add i t i ona l data and evaluat ion. Options which have p o t e n t i a l t o s i g n i f i c a n t l y reduce hydrogen costs would be o f p a r t i c u l a r i n t e r e s t , such as improved processes f o r the product ion of hydrogen from res idua l f r ac t i ons o r coke. M i l d hydro t rea t ing fo l lowed by f l u i d c a t a l y t i c crack ing may be an a t t r a c t i v e a l t e r n a t i v e t o hydrocracking, reducing both hydrogen consumption and capi t a l requirement, a1 be i t a t some reduct ion i n y i e l d .
Based upon hydrogen consumption and product q u a l i t y , i t appears t h a t j e t fuel product ion from shale o i l would be p re fe r red t o us ing coal as the o r i g i n a l hydrocarbon source. A complete evaluat ion o f the r e l a t i v e costs of these a l t e rna t i ves should be made, and f u tu re work concentrated upon the more e f f i c i e n t o f the two.

V I . SUMMARY OF RESULTS
The ob jec t i ve o f t h i s p r o j e c t was the product ion of samples of j e t f u e l of var ious p rope r t i es f rom shale o i l and coal syncrudes, us ing convent ional petroleum processing technology. These samples were analyzed t o assess t h e i r p o t e n t i a l f o r use as j e t f u e l . The program has demonstrated t h a t products which may be use fu l as j e t fue ls can be produced from these petroleum sub- s t i t u t e s by hyd ro t r ea t i ng and hydrocracking a t s u i t a b l y severe cond i t i ons . Some prorni s i n g products were produced from TOSCO I1 shale o i 1 by hydro- t r e a t i n g a 311-6160~ (100-6500F) bo i 1 i ng f r a c t i o n over NiMo/A1203 c a t a l y s t a t 652OK (715OF), 1.5 WHSV, 13.8 x 10⁶ N/m2 (2000 PSIG) and 1348 m3/m3 (8000 SCF/B) Hz. Processing a t l e ss severe cond i t i ons ( i .e., lower temper- a t u r e and/or h igher WHSV) y i e l d e d a marginal product w i t h a h igh n i t r ogen content, h i gh e x i s t i n g gum and h i gh smoke p o i n t .
An a d d i t i o n a l quan t i t y o f j e t f u e l was produced by hydrocracking t he 616-7830K ( 6 5 0 - 9 5 0 ~ ~ ) f r a c t i o n o f t he shale o i l . This invo lved two successive hydrodeni t rogenat ion steps a t t he f o l lowi ng cond i t i ons :
Temperature, OK (OF) 675 (755) 639 (690)
These were fo l lowed by the hydrocracking s tep prop r a t 6 2 2 ' ~ ( 6 6 0 ° ~ ) , J 0.75 WHSV, 13.8 x 10⁶ N/m2 (2000 F S I G ) , and 1685 m /m3 (10,000 SCF/B) HZ. The 311-616OK (100-650°F) product from t h i s processing sequence was combined w i t h t he hydrot reated 311-616OK (100-650°F) c u t descr ibed i n the preceding paragraph t o produce another s e t o f samples.
Data were a l so obtained t h a t i nd i ca ted another source of increased y i e l d would be delayed cok ing of the 7 8 3 ' ~ (950°F)+ shale o i l bottoms, fo l l owed by hyd ro t r ea t i ng and hydrocracking o f t h e coker 1 i q u i d product. No samples were a c t u a l l y produced by t h i s means, however.
A sample o f H-Coal process syncrude was obtained which cons is ted o f a 311-616'~ (100-6500F) b o i l i n g range l i q u i d , and a s o l i d 7 0 0 ~ ~ (800°F)+ bottoms product which was deemed imp rac t i ca l t o rocess. The 1 i q u i d was
E hyd o t rea ted a t i n i t i a l cond i t i ons o f 6 3 0 ~ ~ (675 F), 0.5 WHSV, 17.2 x 10⁶ N/m (2500 PSIG) and 1348 rn3/m3 (8000 SCF/B) Hz, bu t subs tan t i a l c a t a l y s t deac t i va t i on was observed dur ing the process per iod. The product was of reasonably good qua1 i t y a1 though smoke p o i n t was low. Lower s e v e r i t i e s produced correspondingly poorer product.

A syncrude made from Utah coal by the COED process was a l so obtained and processed. The 311-56.!OK (100-550°F) r a c t i o n was hydrot reated 6 a t 641°K (695OF), 0.5 WHSV, 13.8 x 10⁶ N/m (2000 PSIG) and 1348 m3/m3 (8000 SCF/B). The 561-7000K (550-800°F) f r a c t i o n was hydrocracked i n th ree steps as fo l l ows :
HDN- 1 HDN-2 HC K
Temperature, OK (OF) 658 (725) 644 (700) 608 (635)
WHSV 0.75 1.05 1.0
~ / m ~ (PSIG) 13.8 x 10⁶ (2000)-----------------------
HZ, m3/m3 (SCF/B) 1348 (8000) 1685 (10,000)-----------
Again, these were i n i t i a l cond i t i ons and severe c a t a l y s t deac t i va t i on was observed dur ing a l l processing of the COED syncrude.
The hydrot reated 3~1-561°K (100-550'~) f r a c t i o n was combined w i t h the 311-616OK (100-650 F) product from hydrocracking and a p o t e n t i a l j e t f u e l product was obtained, a1 though smoke p o i n t was somewhat low.
Concl ud i ng Remarks
The hydroprocessi ng techno1 ogy requ i red t o produce p o t e n t i a l j e t fue ls from shale o i l i s l a r g e l y developed, and does no t appear t o present any severe techn ica l problems. The products from coal syncrude processing a re o f somewhat poorer qual i t y , and the technology i s no t as completely developed. Some add i t i ona l process research and development woul d be requ i red, p a r t i - c u l a r l y i n the area o f c a t a l y s t a c t i v i t y and s t a b i l i t y .
These processes are, however, sub jec t t o severe economic problems. H i gh c a p i t a l and opera t ing costs are associated w i t h the h igh pressures and low space v e l o c i t i e s requi red. I n add i t i on , l a r g e q u a n t i t i e s of hydrogen a re consumed i n o rder t o y i e l d reasonable q u a l i t y products. Based on a cos t of manufactured hydrogen o f $2 per 168.5 cub ic meters (thousand cub ic f e e t ) the cos t o f hydrogen f o r shale o i l processing would be $2.50-84 per .16 m 3 ( ba r re l ) o f product, depending on y i e l d obtained. For coal syncrude process: ng , the costs a re $2.50-$5 per .16 m3 ( b a r r e l ) of product, i n a d d i t i o n t o the subs tan t ia l hydrogen consumption o f the l i q u e f a c t i o n process i t s e l f .
The above cons iderat ions emphasize the importance o f techn ica l and economic op t im i za t i on of these processes, a task which was no t a p a r t o f t h i s program. Based upon hydrogen consumption and product qual i t y , however, i t appears t h a t hale o i l would be prefer red t o coal as the o r i g i n a l hydrocarbon source f o r j e t f u e l product ion.

FE
ED
-C
AN
z i
I S
CA
LE
[
FE
ED
PU
MP
Fig
ure
2
7
Hyd
rotr
eati
ng
U
nit
Flo
w
Dia
gra
m
fi R
EA
CT
OR
PR
ES
SU
RE
C
ON
TR
OL
LE
R
GA
S
SA
MP
LIN
G
FL
AS
HIS
TR
IPP
ER
G
F S
W
ET
TE
ST
ME
TE
R
- m
w
PA
CK
ED
WA
TE
R
ST
RIP
PIN
G
C___11
LIQ
UID
LE
VE
L
CO
NT
RO
LL
ER
S
TR
IPP
ING
N
ITR
OG
EN
0
HY
DR
OG
EN
FL
OW
C
ON
TR
OL
L
IQU
ID
PR
OD
UC
T
V I I. REFERENCES
(1 ) Shaw, H. , e t . a1 . , "Eva lua t ion o f Methods t o Produce A v i a t i o n Turbine Fuels f rom Syn the t i c Crude O i l s - Phase I", Repart t o U.S. A i r Force under Cont rac t F33615-74-C-2036, March, 1975.
(2 ) Eisen, F. S., "Preparat ion o f Gas Turb ine Engine Fuel from Syn the t i c Crude O i l Der ived f rom Coal - Phase I", Report t o U.S. Navy under Cont rac t N00140-74-C-0568, Oct. 15, 1974.
( 3 ) Greene, M. F., e t . a l . , "Low S u l f u r Syn the t i c Crude O i l f rom Coal", Presented a t ACS Na t iona l Meeting, Div. o f Fuel Chemistry, Los Angeles, Cal i f o r n i a , Apr i 1 1974.
(4) Wachtel , S. J., e t . a1 . , "Eva lua t ion o f Hydrot reated COED Syncrude". Report t o FMC Corp., Subcontract 1212-2, Prime Con t rac t 14-32-0001-1212, Dept. o f I n t e r i o r , O f f i c e o f Coal Research, Jan., 1973.


