
Synthesis and study of polyaniline/MWCNT compositefor optoelectronic application
ATUL KUMAR SHARMA1,*, ANUP KUMAR SHARMA2 and RITU SHARMA1
1 ECE Department of Malviya National Institute of Technology, Jaipur 302017, India2 EIE Department, National Institute of Technology, Silchar 788010, India
*Author for correspondence ([email protected])
MS received 30 July 2020; accepted 23 November 2020
Abstract. In this study, the effect of multi-walled carbon nanotubes (MWCNTs) addition on optical bandgap of
polyaniline (PANI) was reported. Pure PANI and 5 mg MWCNTs/PANI, 10 mg MWCNTs/PANI and 15 mg MWCNTs/
PANI composite samples were synthesized by in-situ polymerization process. Synthesized composite sample and pure
PANI sample were characterized by X-ray diffraction, scanning electron microscopy, Fourier transform-infrared and UV–
visible spectroscopy. Optical bandgap, molar absorptivity coefficient are estimated for pristine MWCNTs sample, pure
PANI sample and composite samples using UV–visible spectroscopy data and Tauc plot. It is observed that optical
bandgap of PANI decreases on increasing the concentration of MWCNTs, while keeping the concentration of PANI
constant. Lowest bandgap of 3.55 eV is obtained for 15 mg MWCNTs/PANI composite sample. Strong interaction
between p-bonded surface of MWCNTs and quinoid rings of PANI is found, as indicated by the obtained results of FTIR
and UV–visible spectroscopy. The information on the optical bandgap of the composite samples is of great importance for
the development of optical antenna and other optoelectronic devices.
Keywords. Carbon nanotubes; UV–visible spectroscopy; optical bandgap; absorption; conducting polymer.
1. Introduction
Carbon nanotubes having excellent electrical, optical and
mechanical properties stimulated multi and interdisciplinary
research in various fields of science [1]. Many researchers
have done research by incorporating carbon nanotubes in
optoelectronic and electronic applications, such as solar
cells [2], supercapacitors [3], Schottky diodes [4], etc.
Recent studies have shown that introduction of carbon
nanotubes in conducting polymer matrix will enhance
comprehensive properties of polymer. Conducting polymers
have lots of interesting properties, such as light weight,
corrosion resistance, flexibility and variable conductivity,
which can be used in various electronic applications,
biomedical engineering [5,6], supercapacitors [7,8], energy
storage devices [9,10], and so on [11].
Among the several conducting polymers, polyaniline
(PANI) have shown remarkable research interest due to its
high electrical conductivity, abundant raw materials, ease of
synthesis, good environmental stability, cost effectiveness
and simple redox chemistry [12,13]. The CNT/PANI com-
posites have studied for gas sensors [14,15], biosensors
[16–18], supercapacitor [19–21], solar cell [4], fuel cell
[22,23] and so on. It was shown that a strong site selective
interaction between PANI and CNTs takes place by
introduction of nanotubes during in-situ chemical poly-
merization process [3].
In this research publication, we explore the synthesis and
characterization of CNT/PANI composite material by
introduction of MWCNTs during the in-situ chemical
polymerization process. It reports that the optical bandgap
of PANI changed with the amount of MWCNTs introduced
during the in-situ chemical polymerization process. This
research can be further used for development of optical
antenna and other optoelectronic devices by varying the
optical bandgap of conducting polymers.
2. Materials and methods
2.1 Materials
There were several methods to synthesize MWCNT/PANI
composite. In this study, in-situ chemical polymerization of
aniline with several wt% of functionalized MWCNT was
used. Three samples were prepared for the reported work
containing 5, 10 and 15 mg MWCNT with 0.5 ml aniline.
Pure PANI sample and functionalized CNT samples were
also prepared for reference purpose. Synthesized MWCNT
obtained from chemical vapour deposition method after
Bull. Mater. Sci. (2021) 44:121 � Indian Academy of Scienceshttps://doi.org/10.1007/s12034-021-02388-4Sadhana(0123456789().,-volV)FT3](0123456789().,-volV)
functionalization and double-distilled aniline monomer
(C6H5NH2; 99% purity, Merck) has been used as composite
materials, in which polymerized aniline was used as matrix
material and CNT was used as filler material. To start the
in-situ chemical polymerization, strong oxidant catalyst
ammonium peroxodisulphate [(NH4)2S2O8 or APS; 98%
purity, Merck] was used. Deionized water was used as
solvent, and for acidic dopant, sulphuric acid (H2SO4;
purity 98%, Merck make), nitric acid (HNO3, Fisher Sci-
entific; Qualigens make) and hydrochloric acid (HCl; 37%
purity, Merck) were used.
2.2 Functionalization of MWCNT
MWCNTs were synthesized using chemical vapour depo-
sition method, in which acetylene was used as carbon
containing gas and cobalt thin film was used as catalyst
[24–27]. In order to reduce the strong Vander-Wall force
and to increase the dispersion of MWCNT in composite
solution, functionalization of MWCNTs has been done
using acid solution. The functionalized MWCNT
(COOH-MWCNTs) has been obtained by treatment of as-
synthesized MWCNTs with 3:1 ratio of H2SO4 and HNO3.
The dispersion was kept for stirring for 2 h maintaining
temperature at 80�C. Then the suspension was cooled to
room temperature and washed several times using deionized
water to remove acid and neutralize the pH of material.
Washing and filtering have been done using centrifuge
process. Samples were collected in clean glass beaker, and
dried first in hot air oven for 6 h and then kept in vacuum
oven for 24 h. The dried f-MWCNT powder was collected
in clean vials.
2.3 Synthesis of MWCNT/PANI composite
In-situ chemical polymerization of aniline along with dis-
persed functionalized MWCNT was done for preparation of
MWCNT and PANI composite [28]. Three samples with
different weight concentrations of MWCNTs 5, 10 and 15
mg with 0.5 ml aniline were prepared in the reported study.
Functionalized MWCNT were dispersed with known con-
centration in 10 ml volume of 1 N HCl and kept for
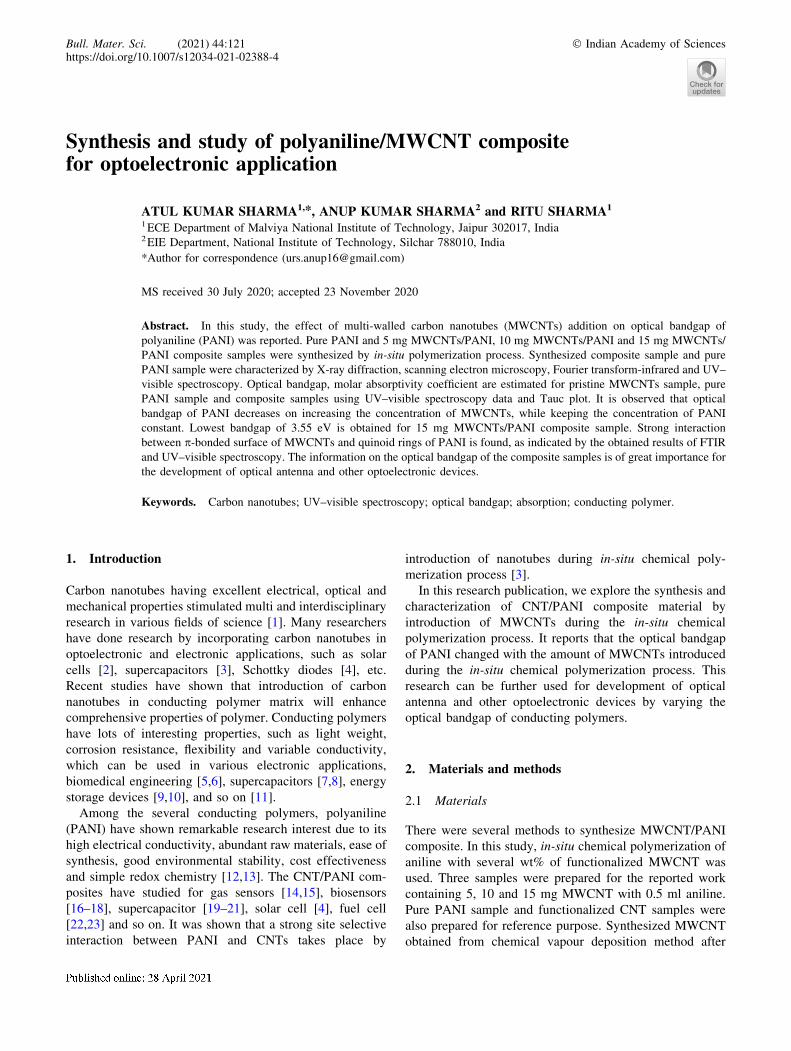
Figure 1. SEM images of (a) pristine MWCNT, (b) PANI, (c) 5 mg
MWCNT/PANI, (d) 10 mg MWCNT/PANI and (e) 15 mg MWCNT/PANI
samples.
121 Page 2 of 8 Bull. Mater. Sci. (2021) 44:121

ultrasonication for 1 h to get homogeneous dispersion. After
that the suspension was kept in ice bath to maintain the
temperature at 0�C. Aniline monomer, 0.5 ml, was added
slowly into CNT suspension with continuous stirring in the
next step. A freshly prepared solution of 1.14 g strong
oxidant ammonium persulphate (APS) (NH4)2S2O8 in 10 ml
water was added into the suspension. After few minutes,
colour of suspension turned into green from dark colour,
which indicates the good initiation of polymerization
reaction. The reaction was kept in continuation for 6 h by
maintained stirring and ice bath and after that dark green
material was washed several times with deionized water and
acetone to remove any unreacted monomers and oxidants.
After filtering, the material was kept for vacuum drying at
80�C for overnight to get dry PANI–CNT composite.
2.4 Synthesis of PANI
In-situ chemical polymerization has been done for prepar-
ing pure PANI sample for reference purpose. The same
procedure was followed as explained in the section 2.3
without addition of MWCNT.
After the process was completed, in total five samples
were prepared which includes functionalized CNT, 5 mg
MWCNT/PANI, 10 mg MWCNT/PANI, 15 mg MWCNT/
PANI and pure PANI. All were collected in clean vials.
2.5 Characterization
All the as-prepared five samples were characterized to obtain
details of the composition, morphology, optical and electrical
properties. Morphological properties were examined by
scanning electron microscopy (SEM) image of the samples.
SEM measurements were carried out under field-emission
scanning electron microscope. The cross-sectional images of
the PANI and f-MWCNTs filled PANI nanocomposites were
taken at 5000-X, 20000-X and 50000-X. Fourier transform
infrared (FTIR) spectroscopy gives the structural properties
of PANI and MWCNT/PANI composite. To investigate the
optical properties, UV–visible spectroscopy technique is
used for all samples and bandgap was calculated by absorp-
tion spectra of sample using Tauc Plot method. The absorp-
tion spectra of matrix material were recorded using
ultraviolet–visible spectroscopy (200–800 nm). Powder
X-ray diffraction (PXRD) patterns of MWCNTs, PANI and
MWCNT/PANI samples were collected with the help of high-
resolution X-ray diffractometry (XRD; PaNalytical X’Pert
Pro, Cu Ka radiation, wavelength = 1.54 A). The XRD data
were collected in the 2h range from 10� to 90�; step size 0.02�with a scan rate of 0.7 s.
3. Results
3.1 Morphological analysis
Morphological details of samples can be examined from
SEM image of samples as shown in figure 1.
Figure 2 shows the morphology of pristine MWCNT.
Average diameter of MWCNTs was in the range 15–55 nm.
As per reported morphological study of single-wall nan-
otubes in various literatures, the diameter of single-wall
nanotube is around 1–3 nm and diameter of MWCNT varies
between 3 and 60 nm. The estimation of diameter of
MWCNTs was done using ImageJ analysis tool as shown in
figure 2.
Figure 1b shows large and thick flakes of pure PANI,
while figure 1c shows the morphology of 5 mg MWCNT/
PANI sample, in which CNTs were overlapped by the
polymer that ensures the good chemical polymerization on
the surface of MWCNTs. Figure 1d and e shows the mor-
phology of 10 and 15 mg MWCNT/PANI sample, in which
one particular CNT was in focus. A long single CNT can be
examined in both SEM images (10 and 15 mg MWCNT/
PANI samples) having smooth surface and enhanced
thickness due to polymerization. SEM images show wrap-
ping of PANI over MWCNTs. The polymer composites
Figure 2. SEM image of pristine MWCNT.
Figure 3. Digital images of as-prepared samples.
Bull. Mater. Sci. (2021) 44:121 Page 3 of 8 121

synthesized by grafting PANI on outer wall of MWCNTs
producing thick layer PANI on MWCNT resulted in elon-
gated granular form. Figure 3 shows the digital image of as-
prepared samples.
3.2 XRD analysis
XRD was a very powerful tool to analyse the crystal
structure and the inter-atomic spacing. Information related
to structural and crystallinity of PANI, f-MWCNT and 15
mg MWCNT/PANI composite can be analysed using XRD
pattern, as shown in figure 4a–c. Figure 4a shows XRD
pattern of PANI, in which occurrence of crystalline peaks at
2h = 15.3�, 20.41� and 25.5� corresponding to (011), (020)
and (200) plane are shown, which indicate the formation of
conductive PANI [29]. XRD spectra of CNTs show a
diffraction peak at 26.4�, corresponding to the characteristic
peak (002) of the MWCNTs having d-spacing 0.34 nm
(figure 4b) [30,31].
On analysing the XRD patterns, it was observed that the
MWCNT/PANI composites have similar XRD pattern as of
pure PANI XRD pattern. On comparing the XRD pattern of
pure PANI and MWCNT/PANI composites, it was observed
that the sharpness of the peaks increased with an increase in
MWCNT content. It indicates that an additional crystalline
order has been introduced into the composites as aniline
polymerizes along the axis of the CNT [32]. In addition, the
intensity of amorphous peak of PANI at angle 20.4� reduces
for MWCNT/PANI composites.
3.3 FTIR spectroscopy
FTIR spectroscopy of samples 5 mg MWCNT/PANI, 10 mg
MWCNT/PANI, 15 mg MWCNT/PANI and functionalized
MWCNT are shown in figure 5, which shows the trans-
mission spectra of all samples. The peak at around 3441
cm–1 in all the spectra’s was corresponding to N–H
stretching and/or O–H stretching modes. IR spectra of
MWCNTs have band at around 2922 cm–1, which was
associated to asymmetric and symmetric CH2 stretching. IR
spectra of MWCNTs have peak at 1722 cm–1 corresponding
to the C=O stretching vibrations [33]. During oxidation and
purification processes, functional groups may be introduced
on the sidewalls of MWCNTs. All bands in the 1050–1300
cm-1 region, corresponds to C–O group.
The peak position at 1563 and 1476 refers to the C=C
stretching vibration bands of quinoid ring and C=C
stretching deformation of benzenoid ring, respectively (Red
Spectra) [33,34]. The shoulder position at 1323 cm-1 and
peak at 1294 cm-1 were associated with asymmetric C–N
stretching of aromatic amine and C–N stretching of sec-
ondary aromatic amine, respectively [35]. The shoulder
Figure 4. XRD spectra of (a) pure PANI, (b) MWCNT and (c) XRD
pattern of MWCNT/PANI composites.
121 Page 4 of 8 Bull. Mater. Sci. (2021) 44:121

position at 1235 cm–1 refers to C–N? stretching vibration in
the polaron structure of PANI, which indicates doped form
of PANI [36–38], and the dominating absorption peak at
wavelength 1121 cm–1 associated with in-plane bending
vibration of aromatic C–H [39,40]. The comparison of the
occurred peak with data provided in related references
confirms the successful formation of MWCNT/PANI
composite.
3.4 UV–visible spectroscopy
UV–visible spectroscopy of functionalized MWCNT, pure
PANI and 5 mg MWCNT/PANI, 10 mg MWCNT/PANI
and 15 mg MWCNT/PANI samples are shown in figure 6.
The peak obtained at 350 nm in UV–visible spectrum of
pure PANI corresponds to p–p* transition [41]. Effect of
MWCNT concentration can be observed in UV–visible
spectroscopy by analysing sample with different concen-
trations of MWCNT in constant concentration of PANI. A
red shift can be observed from 350 nm to towards 400 nm
with increasing p–p* transition bond intensity along with
concentration of CNT, which reveal that new excitation
energy levels were formed by addition of MWCNTs near
the bandgap of the material. Another characteristic peak of
doped PANI and pure PANI was observed at 430 nm, which
corresponds to polaron–p* transition [33]. It is well-known
fact that pure MWCNTs have the characteristics absorption
peak at 260 nm corresponding to the 1D van Hove singu-
larities [42], and other composite samples show the red peak
shift around 280, which verify the presence of CNT in
composition. UV–visible spectrum of CNT does not possess
any other absorption peak in region 350–1000 nm and the
peaks found in the region 350–1000 nm was due to the
presence of PANI [39]. There was red shift of band as
concentration of CNT increases in composite. The satis-
factory results obtained from UV–visible spectrum validate
the strong interaction between the polymer and CNT.
3.5 Optical bandgap calculation
Optical bandgap was calculated using Tauc relation, which
is plot of energy hv (eV) against square of absorption (ahv)2
[39]. The Tauc relation was given by expression:
ahm ¼ B hm� Eg
� �c ð1Þ
where Eg is the optical bandgap, m the frequency of incident
photon, c the index value that is equal to � for direct
allowed transition, B is the band tailing parameter, a con-
stant and a the absorption coefficient [43]. Bandgap of
samples were calculated directly from spectrum of UV–
visible by extrapolating a straight line over absorption peak
to horizontal energy (hv) axis, which are shown in fig-
ure 7a–e).
Comparison analysis of different samples can be done
by bandgap values given in table 1. It can be noted that
as amount of MWCNTs is increased in polymer sample,
the value of bandgap is decreased. This reduction is due
to the new excitation energy levels created below the
regular bandgap because of charge transfer from MWNT
to PANI [44–46]. It can be observed that the bandgap
shift depends on the ratio of material in composite and
desired bandgap can be obtained by selecting proper ratio
of composition.
In figure 8, it was clearly observed that plot has
decreasing nature with the increase in the weight concen-
tration of CNT in composite sample. A steep decrement of
bandgap is shown in plot from no concentration (pure
PANI) to 10 mg concentration in composite sample and
Figure 5. IR spectra of MWCNTs, 5 mg MWCNT/PANI, 10 mg
MWCNT/PANI and 15 mg MWCNT/PANI.
Figure 6. UV–visible absorbance spectra of MWCNT, pure
PANI, 5, 10 and 15 mg MWCNT/PANI samples.
Bull. Mater. Sci. (2021) 44:121 Page 5 of 8 121

after that slop moves approximately flat from 10 mg sample
to pure CNT sample. These data points can be easily fitted
using exponential decaying regression function curve
with goodness of fit (R2) value 0.95, which is shown in
figure 8b.
4. Conclusion
Composites of MWCNTs and PANI have been prepared by
introduction of MWCNTs during the in-situ chemical poly-
merization process and their structural, UV absorbance, and
optical bandgap studies were carried out. The UV–visible
Figure 7. Calculation of the bandgaps for pristine MWCNT, pure PANI sample, 5 mg MWCNT/PANI, 10 mg
MWCNT/PANI and 15 mg MWCNT/PANI samples, obtained from UV–visible spectra by plotting (ahm)2 (eV-cm-1)2
vs. hm (eV). The energy gap was obtained by the intercept on the abscissa of the best fitting of equation (1).
Table 1. Bandgap values of samples.
Samples PANI CNT 5 mg 10 mg 15 mg
Bandgap (eV) 4.17 3.49 4 3.6 3.55
121 Page 6 of 8 Bull. Mater. Sci. (2021) 44:121

spectra and FTIR spectra of different composites revealed
that strong interaction between MWCNTs and PANI takes
place. The optical bandgap for PANI and different MWCNT/
PANI composites sample have been measured by using UV–
visible results and Tauc plot. It is observed that the optical
bandgap decreases with the increase in concentration of
MWCNTs in composites, while keeping the concentration of
PANI constant during the in-situ polymerization process.
These material constants were of great importance for the
engineering of optical antenna and other optoelectronic
devices based on composites of MWCNTs and a conducting
polymer. The change in electronic properties of conducting
polymer by introducing MWCNTs provides a pathway for
applications of composites of nanotubes and conducting
polymer in optical antenna and other optoelectronic devices.
Acknowledgements
The MNIT, Jaipur, is acknowledged for the MRC support
for the synthesis of CNTs using chemical vapour deposition
method. Composite sample preparation, characterization
using SEM and XRD, spectroscopic study using FTIR and
UV–visible were performed at OEMD Laboratory, Depart-
ment of MEMS, IIT Bombay. We are also very thankful to
Dr M P Gururajan (Department of MEMS, IITB, India) and
Ashwini Yella (Department of MEMS, IITB, India) for their
valuable guidance during the whole work for this article.
We acknowledge the AICTE-CRS sanctioned project
(1-5748447161) under TEQIP-III grant by NPIU, MHRD,
India, for funding of this research work.
References
[1] Aqel A, El-Nour K M, Ammar R A and Al-Warthan A 2012
Arab. J. Chem. 5 1
[2] Macpherson H 2019 Johnson Matthey Tech. 63 281
[3] Peng C, Zhang S, Jewell D and Chen G Z 2008 Prog. Natl.Sci. 18 77
[4] Yang X and Chahal P 2011 IEEE 61st Electronic compo-nents and technology conference (ECTC) IEEE p 2158
[5] Rivers T J, Hudson T W and Schmidt C E 2002 Adv. Funct.Mater. 12 33
[6] Nambiar S and Yeow J T 2011 Biosens. Bioelectron. 261825
[7] Shown I, Ganguly A, Chen L C and Chen K H 2015 EnergySci. Eng. 3 2
[8] Ghosh S O and Inganas O 1999 Adv. Mater. 11 1214
[9] Pan L, Qiu H, Dou C, Li Y, Pu L, Xu J et al 2010 Int. J. Mol.Sci. 11 2636
[10] Nyholm L, Nystrom G, Mihranyan A and Strømme M 2011
Adv. Mater. 23 3751
[11] Gurunathan K, Murugan A V, Marimuthu R, Mulik U P and
Amalnerkar D P 1999 Mater. Chem. Phys. 61 173
[12] Palaniappan S and John A 2008 Prog. Poly. Sci. 33 732
[13] Tang L, Duan F and Chen M 2016 RSC Adv. 69 65012
[14] Xie L, Asiri A M and Sun X 2017 Sens. Actuators B: Chem.244 11
[15] Abdulla S, Mathew T L and Pullithadathil B 2015 Sens.Actuators B: Chem. 221 1523
[16] Dhand C, Arya S K, Datta M and Malhotra B D 2008 Anal.Biochem. 383 194
[17] Gopalan A I, Lee K P, Ragupathy D, Lee S H and Lee J W
2009 Biomaterials 30 5999
[18] Zhong H, Yuan R, Chai Y, Li W, Zhong X and Zhang Y
2011 Talanta 85 104
[19] Zhang J, Kong L B, Wang B, Luo Y C and Kang L 2009
Synth. Met. 159 260
[20] Cheng Q, Tang J, Shinya N and Qin L C 2013 J. PowerSources 241 423
[21] Gupta V and Miura N 2006 Electrochim. Acta 52 1721
[22] Pillalamarri S K, Blum F D, Tokuhiro A T, Story J G and
Bertino M F 2005 Chem. Mater. 17 227
[23] Liu J, Lai L, Sahoo N G, Zhou W, Shen Z and Chan S H
2012 Aust. J. Chem. 65 1213
[24] Sharma R, Sharma A K and Sharma V 2015 Cogent Eng. 21094017
Figure 8. (a) Plot of bandgap (eV) values for different samples and (b) fitted curve using exponential decaying
regression function curve with goodness of fit (R2) value 0.95.
Bull. Mater. Sci. (2021) 44:121 Page 7 of 8 121

[25] Sharma R, Sharma A K, Sharma V and Sharma G 2015 J.Optoelectron. Adv. M. 17 1728
[26] Sharma A K and Sharma R 2018 J. Electron. Mater. 47 3037
[27] Kong L B, Zhang J, An J J, Luo Y C and Kang L 2008 J.Mater. Sci. 43 3664
[28] Sharma A K, Sharma R and Chaudhary U 2017 FullerNanotub. Car. N. 25 397
[29] Elnaggar E M, Kabel K I, Farag A A and Al-Gamal A G
2017 J. Nanostruct. Chem. 7 75
[30] Woo S, Kim Y R, Chung T D, Piao Y and Kim H 2012
Electrochim. Acta 59 509
[31] Siddheswaran R, Manikandan D, Avila R E, Jeyanthi C E
and Mangalaraja R V 2015 Fuller Nanotub. Car. N. 23 392
[32] Tanty N, Patra A, Maity K P and Prasad V 2019 Bull. Mater.Sci. 42 198
[33] Nguyen V H and Shim J J 2015 J. Spectrosc., https://doi.org/
10.1155/2015/297804
[34] Wu Z, Chen X, Zhu S, Zhou Z, Yao Y, Quan W et al 2013
Sens. Actuators B: Chem. 178 485
[35] Gunasekaran S and Anita B 2008 Indian J. Pure Appl. Phys.46 833
[36] Ni Q Q, Zhu Y F, Yu L J and Fu Y Q 2015 Nanoscale Res.Lett. 10 174
[37] Quillard S, Louam G, Buisson J P, Boyer M, Lapkowski M,
Pron A et al 1997 Synth. Met. 84 805
[38] Konyushenko E N, Stejskal J, Trchova M, Hradil J,
Kovarova J, Prokes J et al 2006 Polymer 47 5715
[39] Lei Y, Qiu Z, Liu J, Li D, Tan N, Liu T et al 2019 Polymers11 85
[40] Trchova M and Stejskal J 2011 Pure Appl. Chem. 831803
[41] Cho M S, Park S Y, Hwang J Y and Choi H J 2004 Mater.Sci. Eng. C 24 15
[42] Yu J, Grossiord N, Koning C E and Loos J 2007Carbon 45 618
[43] Mir F A, Rehman S, Asokan K, Khan S H and Bhat G M
2014 J. Mater. Sci.: Mater. Electron. 25 1258
[44] Almasi M J, Sheikholeslami T F and Naghdi M R 2016
Compos. Part B: Eng. 96 63
[45] Chatterjee M J, Ghosh A, Mondal A and Banerjee D 2017
RSC Adv. 7 36403
[46] Brza M A, Aziz S B, Anuar H and Al-Hazza M H 2019 Int.J. Mol. Sci. 20 3910
121 Page 8 of 8 Bull. Mater. Sci. (2021) 44:121


