
Dynamic Article LinksC<Soft Matter
Cite this: Soft Matter, 2011, 7, 10910
www.rsc.org/softmatter PAPER
Dow
nloa
ded
by U
nive
rsité
Lav
al o
n 17
Mar
ch 2
013
Publ
ishe
d on
30
Sept
embe
r 20
11 o
n ht
tp://
pubs
.rsc
.org
| do
i:10.
1039
/C1S
M06
113E
View Article Online / Journal Homepage / Table of Contents for this issue
Tailoring the pore size of hypercrosslinked polymers†
Buyi Li, Ruini Gong, Yali Luo and Bien Tan*
Received 14th June 2011, Accepted 22nd August 2011
DOI: 10.1039/c1sm06113e
We report here a practical method to tailor the pore size of hypercrosslinked poly(divinylbenzene-co-
vinylbenzyl chloride) (HCP-DVB-VBC) by adjusting the DVB content in poly(divinylbenzene-co-
vinylbenzyl chloride) (DVB-VBC) precursors, and then hypercrosslinking these DVB-VBC precursors.
With the DVB content varying from 0–10%, the pore size of HCP-DVB-VBC decreases, the pore size
distribution becomes narrower and the micropore volume content increases from 6.82 to 61.90%.When
the DVB content is higher than 7%, the HCP-DVB-VBC changes to pure microporous organic
polymer.
Introduction
The porous materials with extraordinary high surface area have
attracted extensive attention these days due to their diverse
potential applications in separators,1 heterogeneous catalysts2,3
and gas storage.4–7 Various new methodologies are being
developed and older ones being improved to produce diverse
classes of porous material, including zeolites, activated carbons,
silica, and metal organic frameworks (MOFs), covalent organic
frameworks (COFs)8,9 etc.
Porous organic polymers10 exhibit the unique properties of
large surface areas, low skeleton density and high chemical
stabilities compared to other kinds of porous materials and are
thus gradually becoming an important and attractive class of
porous materials. Very recently, various synthetic strategies have
been reported to produce a variety of new porous organic
polymers, such as polymers of intrinsic microporosity (PIMs)
with dioxane units,5 microporous polymers, such as conjugated
microporous polymer (CMP),11,12 porous aromatic frameworks
(PAF)13 by cross-coupling reaction of aromatic compounds,
element–organic frameworks (EOF) via an organometallic
polymer synthesis route,14 knitting aromatic compound poly-
mers (KAPs) by external crosslinking,15 polymerization of tri-
merization of ethynyl groups16 or nitrile groups,17 and amide or
imide or imine formation.18–21 However, the transition metal
catalysts or noble metal catalysts used for the synthesis of CMPs,
PAFs and other porous organic polymers are rare and expensive
thus limiting the practical application of these synthetic strate-
gies. Although changing the rigid building block unit can adjust
College of Chemistry and Chemical Engineering, Huazhong University ofScience and Technology, Wuhan, 430074, China. E-mail: [email protected]; Fax: +86 27 87543632; Tel: +86 27 87558172
† Electronic supplementary information (ESI) available: The FE-SEMimage of fracture section of samples with 0%, 0.5%, 1%, 2%, 5% and10% DVB before and after hypercrosslinking reaction. See DOI:10.1039/c1sm06113e
10910 | Soft Matter, 2011, 7, 10910–10916
the pore size in the range of micropore to mesopore scale11 for
porous organic polymers mentioned above, it is hard to get
a uniformmicroporous structure, which restricts the applications
of porous organic polymers in molecular sieves, high-perfor-
mance liquid chromatography (HPLC) column packing mate-
rials, and selective catalysis etc.
Davankov resins, i.e., hypercrosslinked styrene-type polymers
(HCPs) synthesized via Friedel–Crafts reaction,22 were one of the
earliest porous organic polymers, which found their way to
industry by the end of 1990s.23 Since then various improved
HCPs have been used in broad applications. In addition to the
use of HCPs to adsorb and thus remove toxic organic24,25 and
inorganic26,27 contaminations in solution, they have been used to
remove toxic gases and as gas storage materials28 (hydrogen gas
adsorption).29 They have also been used as the stationary phase
in chromatography.30,31 The matrix of HCPs has also been used
to prepare nanocomposites and exhibit particular catalytic31 and
magnetic properties.32 Initially, HCPs have been mainly prepared
by hypercrosslinking of linear22 or lightly cross-linked gel-type
polystyrenes using external electrophiles to introduce the new
crosslinks.33,34 The resulting hyper-cross-linked polystyrene
materials possess very high microporosity and thus high surface
area. They also show interesting swelling properties, despite the
high degree of cross-linking. Moreover, the resins swell to similar
degrees in both good and poor solvents for polystyrene. Subse-
quently, poly(divinylbenzene-co-vinylbenzyl chloride) (DVB-
VBC) are proved as excellent precursors for the synthesis of
hypercrosslinked poly(divinylbenzene-co-vinylbenzyl chloride)
(HCP-DVB-VBC) where the –CH2–Cl substituent actually yields
an internal electrophile to form the basis of the crosslinks using
SnCl4 as catalyst.35 Sherrington and his co-workers have opti-
mized the synthesis conditions, including the ratios of different
vinylbenzyl chloride monomers,36 catalyst,37 and obtained the
HCP-DVB-VBCwith amaximum surface area up to 2000 m2 g�1.
Despite extensive work on the synthesis of microporous HCP-
DVB-VBC, the control over the pore size and pore distribution is
This journal is ª The Royal Society of Chemistry 2011

Scheme 1 Bulk polymerization of DVB-VBC precursor and hyper-
crosslinking reaction pathway.
Dow
nloa
ded
by U
nive
rsité
Lav
al o
n 17
Mar
ch 2
013
Publ
ishe
d on
30
Sept
embe
r 20
11 o
n ht
tp://
pubs
.rsc
.org
| do
i:10.
1039
/C1S
M06
113E
View Article Online
rarely reported. In our previous work,7 we reported that the
uniform nanoparticle morphology can help to create smaller and
more uniform pore structure due to similar hypercrosslinking
reaction circumstances for each nanoparticle, however, the
control over the pore size was very limited.
Here we report a simple method to produce HCP-DVB-VBC
with a fair control over the pore size and the pore size distribu-
tion, and to eventually generate a polymer with a uniform
microporous structure. The different pore structures of these
materials possess interesting and distinctive gas adsorption
Table 1 Composition, porosity of samples.g,h,i
No.DVBmol (%)
SBETa
m2 g�1
SL.b
m2 g�1
PVc
cm3 g�1
M.A.d
m2 g�1
MPVe
cm3 g�1
MPVf
%
1 0 1420 1930 1.29 232 0.088 6.822 0.5 1790 2480 1.86 75 0.0045 0.243 1 1860 2560 1.26 235 0.078 6.194 1.5 1890 2610 1.20 280 0.098 8.175 2 2060 2850 1.23 271 0.086 7.006 3 1920 2640 1.10 461 0.19 17.287 4 1840 2520 1.04 617 0.26 25.008 5 1760 2410 0.99 639 0.27 27.279 6 1520 2060 0.82 866 0.39 47.5610 7 1430 1930 0.77 813 0.37 48.0511 8 1370 1830 0.70 864 0.39 55.7112 10 1260 1680 0.63 859 0.39 61.90
a Surface area calculated from nitrogen adsorption isotherms at 77.3 Kusing BET equation. b Surface area calculated from nitrogenadsorption isotherms at 77.3 K using Langmuir equation. c Porevolume calculated from nitrogen isotherm at P/P0 ¼ 0.995, 77.3 K. d t-Plot micropore area. e t-Plot micropore volume. f micropore volume (t-Plot)/Pore volume (calculated from nitrogen isotherm at P/P0 ¼ 0.995,77.3 K) *100%. g N2 uptake determined volumetrically usinga Micromeritics ASAP 2020 M analyzer at 1 bar and 77.3 K. h H2
uptake determined volumetrically using a Micromeritics ASAP 2020 Manalyzer at 1.13 bar and 77.3 K. i CO2 uptake determinedvolumetrically using a Micromeritics ASAP 2020 M analyzer at 1.00bar and 273.15 K.
This journal is ª The Royal Society of Chemistry 2011
properties. In order to explore the essential method to tune the
pore size and to eliminate interferences of many factors by
traditional suspension polymerization, for example, residual
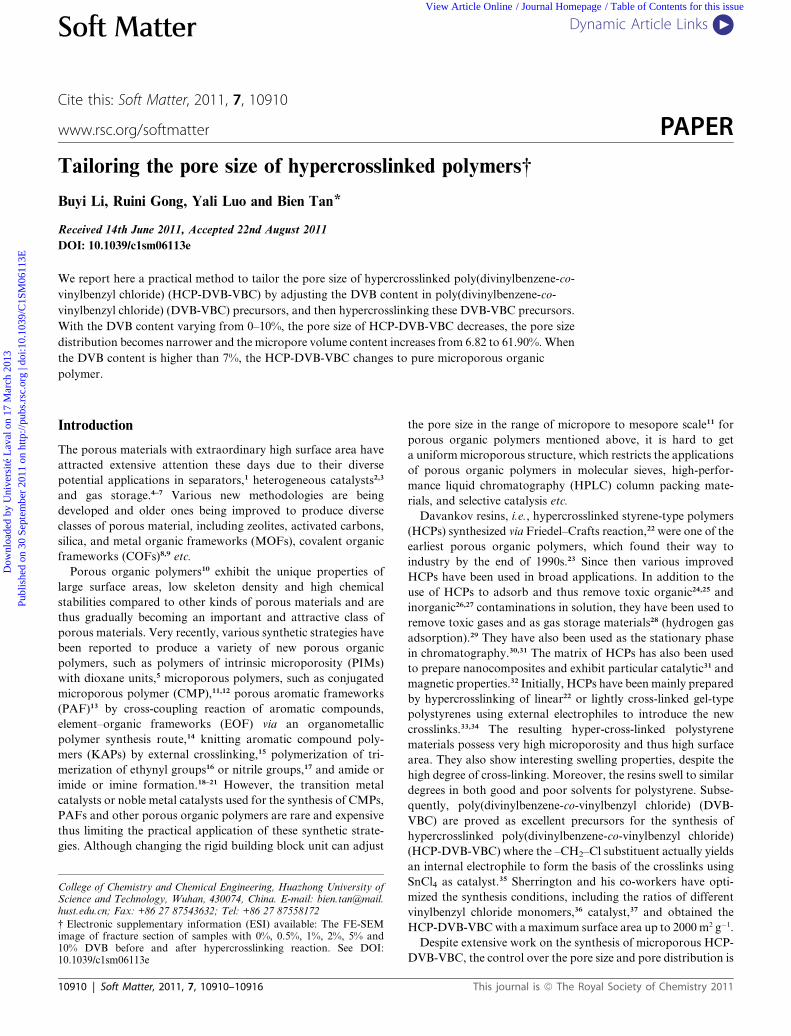
Fig. 1 A FE-SEM image of fracture section of samples with 0%, 0.5%,
1%, 2%, 5% and 10% DVB before (a, scale 200 nm) and after (b, scale
100 nm) hypercrosslinking reaction. (Original images are shown as
Fig. S1–S12†).
Soft Matter, 2011, 7, 10910–10916 | 10911

Dow
nloa
ded
by U
nive
rsité
Lav
al o
n 17
Mar
ch 2
013
Publ
ishe
d on
30
Sept
embe
r 20
11 o
n ht
tp://
pubs
.rsc
.org
| do
i:10.
1039
/C1S
M06
113E
View Article Online
stabilizer, polydisperse particle size and so on, we chose bulk
polymerization to synthesize a series of DVB-VBC precursors,
and then hypercrosslink them to produce HCP-DVB-VBC as
model materials.
Experiment
Materials
Vinylbenzyl chloride (VBC, Aldrich, 98% grade, 30 : 70 w/w
mixtures of p-VBC and m-VBC isomers), divinylbenzene (DVB,
Aldrich, 80% grade), 2,2-azobis-(isobutyronitrile) (AIBN,
Fisher) was recrystallized from methanol prior to drying under
Fig. 2 Nitrogen adsorption (solid circle) and desorption (open c
10912 | Soft Matter, 2011, 7, 10910–10916
reduced pressure. FeCl3 (anhydrous, analytical grade) was
obtained from National Medicines Corporation Ltd. of China.
Synthesis of HCP-DVB-VBC
The synthesis route was shown in Scheme 1.
(i) Synthesis of DVB-VBC precursor. The DVB-VBC precursor
was prepared by free radical bulk polymerization. The quantities
of DVB (0–10 mol % based on VBC) and VBC (4 g) are
summarized in Table 1 and AIBN was 0.5 wt% based on
monomers for each reaction. The mixture of DVB, VBC and
AIBN was heated at 60 �C for 12 h, followed by drying in
ircle) isotherms at 77.3 K of samples with 0% to 10% DVB.
This journal is ª The Royal Society of Chemistry 2011

Dow
nloa
ded
by U
nive
rsité
Lav
al o
n 17
Mar
ch 2
013
Publ
ishe
d on
30
Sept
embe
r 20
11 o
n ht
tp://
pubs
.rsc
.org
| do
i:10.
1039
/C1S
M06
113E
View Article Online
a vacuum oven at 60 �C for 24 h to remove unreacted co-
monomers.
(ii) Preparation of HCP-DVB-VBC. The DVB-VBC precursor
(2 g) was swollen in 1, 2 -dichloroethane (DCE, 40 ml) under N2
for 24 h. FeCl3 (2 g) was added to the solution and then heated at
80 �C for 18 h. The resulting HCP-DVB-VBC was filtered and
washed three times with ethyl ether and methanol, washed with
methanol in a Soxhlet for 24 h, and finally dried in vacuum oven
Fig. 3 Pore size distributions calculated using DFT methods (slit pore
models, differential pore volumes. pore width) of samples with 0% to 10%
DVB. (a) Pore size distribution in the range between 4–3000 �A, (b) Pore
size distribution in the range between 4–30 �A.
This journal is ª The Royal Society of Chemistry 2011
at 60 �C for 24 h. The final products are brown irregularly shaped
powder particles.
Characterization
Polymer surface areas, N2 adsorption isotherm (77.3 K), pore
size distributions, CO2 uptake volumetric analysis (1 bar, 273.15
K) and H2 uptake volumetric analysis (1.13 bar, 77.3 K) were
measured using a Micromeritics ASAP 2020 M surface area and
porosity analyzer. Before analysis, the samples were degassed at
110 �C for 8 h under vacuum (10�5 bar). Polymer morphologies
were investigated using a FEI Sirion 200 field emission scanning
electron microscope (FE-SEM). For FE-SEM analysis, DVB-
VBC precursor fragments or HCP-DVB-VBC powders were
mounted on aluminum studs using adhesive graphite tape and
sputter-coated with platinum before analysis.
Result and discussion
Morphology of DVB-VBC precursor and HCP-DVB-VBC
FE-SEM images of DVB-VBC precursors and HCP-DVB-VBC
are shown in Fig. 1. The fracture section of DVB-VBC precursor
with 0% DVB (Fig. 1)is very smooth and have no visible porous
structure. The fracture section of DVB-VBC precursor with 0.5%
and 1% DVB shows obvious coarse surface and possess non
uniform pores smaller than 200 nm. By increasing DVB contents,
the fracture section of DVB-VBC precursors, with 2%, 5% and
10% DVB, resulted in smooth surface with no obvious porous
structure. After hypercrosslinking reaction, the fracture section
of HCP-DVB-VBC with 0% DVB exhibited visible pores of less
than 50 nm; the fracture section of HCP-DVB-VBC with 0.5%
DVB shows visible pores of about several nanometres; the frac-
ture section of Davankove resins with 1% DVB possess quite
similar pore structure with the one produced with 0.5%DVB, but
the visible pore size is smaller; the fracture sections of HCP-
DVB-VBC with 2%, 5% and 10% DVB do not indicate visible
pore structure, and by increasing the DVB contents, the fracture
section became smoother, for the fracture section of HCP-DVB-
VBC with 10%, there is no obvious coarse surface even on 20 000
times amplification factor.
Surface area and pore size distribution
FE-SEM images can only show visible pore structure, but
micropores (less than 2 nm) are too small to be observed using
FE-SEM. Hence the nitrogen gas adsorption method was used to
calculate the surface area and the pore size distribution. The BET
surface area, Langmuir surface area, pore volume, t-Plot
micropore area, t-Plot micropore volume and micropore content
are summarized in Table 1. The DVB-VBC precursors have
a nominal surface area of �2 m2 g�1 while the surface area of
HCP-DVB-VBC increases sharply to a remarkably high value
after the hypercrosslinking reaction of DVB-VBC precursors,
which is consistent with previous reports.37 By increasing DVB
concentration, the surface area of HCP-DVB-VBC initially
increases and then decreases. The HCP-DVB-VBC with 2%DVB
has the highest surface area up to 2064 m2 g�1, and the data agree
well with the previous reports.37 By increasing the DVB contents
(when DVB concentration is less than 2%), the surface area
Soft Matter, 2011, 7, 10910–10916 | 10913

Table 2 Gas adsorption properties of samples
No.DVBmol (%)
N2 uptakea
mmol g�1 (wt %)H2 uptake
b
mmol g�1 (wt %)CO2 uptake
c
mmol g�1 (wt %)
1 0 37.14 (103.50) 6.00 (1.20) 2.26 (9.93)2 0.5 53.80 (150.62) 6.40 (1.28) 2.27 (10.01)3 1 36.38 (101.88) 6.95 (1.39) 2.27 (10.02)4 1.5 34.68 (97.10) 7.00 (1.40) 2.28 (10.05)5 2 35.64 (99.80) 7.20 (1.42) 2.29 (10.07)6 3 31.63 (88.57) 7.35 (1.47) 2.52 (11.09)7 4 30.06 (84.17) 7.40 (1.48) 2.57 (11.32)8 5 28.60 (80.09) 7.50 (1.50) 2.57 (11.32)9 6 23.67 (66.28) 7.25 (1.45) 2.61 (11.50)10 7 22.21 (62.18) 7.15 (1.43) 2.70 (11.89)11 8 20.10 (56.28) 7.15 (1.43) 2.76 (12.17)12 10 18.28 (51.20) 7.10 (1.42) 2.82 (12.41)
a N2 uptake determined volumetrically using aMicromeritics ASAP 2020M analyzer at 1 bar and 77.3 K. b H2 uptake determined volumetricallyusing a Micromeritics ASAP 2020 M analyzer at 1.13 bar and 77.3 K.c CO2 uptake determined volumetrically using a Micromeritics ASAP2020 M analyzer at 1.00 bar and 273.15 K.
Dow
nloa
ded
by U
nive
rsité
Lav
al o
n 17
Mar
ch 2
013
Publ
ishe
d on
30
Sept
embe
r 20
11 o
n ht
tp://
pubs
.rsc
.org
| do
i:10.
1039
/C1S
M06
113E
View Article Online
increases. Using 0.5% DVB, the surface area was increased from
1417 to 1790 m2 g�1. However, by increasing the DVB contents
(when DVB concentration is more than 2%), the –CH2Cl content
decreases, which results in a decrease in the surface area. The
nitrogen adsorption isotherms/desorption isotherms at 77.3 K
(Fig. 2) and pore size distribution analysis of HCP-DVB-VBC
Scheme 2 Sketch map of HCP-DVB-VBC with 0% DVB (a), precursor
of HCP-DVB-VBC with some DVB (less, (b); more, (c)).
10914 | Soft Matter, 2011, 7, 10910–10916
with various DVB contents were calculated using DFT methods
(slit pore models, Differential Pore Volume vs. Pore Width,
Fig. 3), which agree well with their pore structure shown in FE-
SEM images (Fig. 1). As shown in Fig. 2, the adsorption
isotherms of all samples show a steep nitrogen gas uptake at low
relative pressure (P/P0 < 0.001) thus reflecting abundant micro-
porous structure. Nitrogen adsorption and desorption isotherms
of HCP-DVB-VBC with 0% and 0.5% DVB have a clear
hysteresis loop, which indicated the mesoporous structure, and
exhibited a remarkable rise in the medium and high pressure
regions (P/P0 ¼ 0.8–1.0), which shows the presence of macro-
pores in the materials.38 The pore size distribution also shows the
presence of micropores, mesopores and macropores in the
materials simultaneously. By increasing the DVB contents (1–
6%), the hysteresis loop disappears gradually, which implies that
the mesoporous structure is diminishing and the mild rise in the
medium and high pressure regions (P/P0 ¼ 0.8–1.0) shows the
existence of a few macropores. The peaks beyond 2 nm of pore
size become weaker by increasing the DVB contents, indicating
again that by increasing DVB content, the meso- and macropores
are significantly reduced. When the DVB concentration is over
7%, the nitrogen adsorption and desorption isotherm line with
a very flat course in the intermediate section is a typical Type I
according to the IUPAC classification and there are no peaks in
meso- and macropore regions in the pore size distribution, an
indication of a sheer microporous materials.38 Besides the
disappearance of macro- and mesoporous structures, smaller
micropores are also obtained by increasing the DVB content as
the peaks obviously shift to a lower value, shown in the pore size
distribution at region below 2 nm. Table 2 summarizes a series of
quantitative pore properties. Apart from HCP-DVB-VBC with
0% DVB, by increasing the DVB content the total pore volume
decreases, but the micropore volume and micropore proportion
in total pore volume increases. All the above results indicate that
the increase of DVB content can effectively produce a more
uniform and narrower microporous structure.
There are several reasons to explain the variation in the surface
area and pore size distribution of these polymeric materials.
According to the previous reports,23 in order to form the cross-
bridge –CH2–, (i) the intermolecular cross-bridges emerge at the
very beginning with the same probability as the intramolecular
crosslinks; (ii) two phenyl rings belonging to two different chains
(or to distant segments of the same chain) of polymers react with
the cross-linking agent to form a cross-bridge; (iii) formation of
a second bridge between two neighboring rings of the same
chains (or segments) is improbable, since it would imply a closure
of a stressed cycle. It means in the neighbourhood of a bridge,
a phenyl ring would be more likely interact with phenyls of a
third chain (or of distant segments of the same chain). It is thus
a random process to form intermolecular cross-bridges in distant
segments of the same chain or intramolecular cross-bridges when
several macromolecular chains twist together coincidentally
under the above three pre-conditions. As shown in Scheme 2(a),
for the DVB-VBC precursor with 0% DVB, the loose and
disordered twisted macromolecular chains dissolve well in
solvent, the distance between two neighbouring chains (or two
space neighbours but distant segments of one chain, as shown in
Scheme 2(a) is random. It implies that every –CH2Cl group does
not possess neighbouring benzene ring satisfying these rules,
This journal is ª The Royal Society of Chemistry 2011

Table 3 Adsorption capacities of H2 or CO2 on various materials reported
Materials SBET m2 g�1 PV cm3 g�1 MPV cm3 g�1
H2 uptakea
mmol g�1 (wt %)CO2 uptake
b mmol g�1
(wt %)1 bar or 30 bar References
AC Norit UOK A 1195 0.65 0.47 8.35 (1.67) 39AC Norit SX 1 G 1176 0.83 0.40 8.35 (1.67) 39AC Norit SX plus 1051 0.79 0.35 7.35 (1.47) 39AC Norit SX 1G AIR 1030 0.68 0.36 7.63 (1.53) 39MCM-41 1017 1.04 0.00 2.90 (0.58) 39HCP-1 1646 1.26 0.66 1.7 (7.48); 13.3 (58.52) 40HCP-2 1684 1.47 0.64 1.7 (7.48); 12.6 (55.44) 40HCP-3 1531 1.44 0.60 1.6 (7.48); 11.6 (51.04) 40HCP-4 1642 1.74 0.59 1.6 (7.48); 10.6 (44.26) 40
a H2 uptake determined at 1 bar and 77 K quoted by references. b CO2 uptake determined at 1 bar or 30 bar and 298 K quoted by references.
Dow
nloa
ded
by U
nive
rsité
Lav
al o
n 17
Mar
ch 2
013
Publ
ishe
d on
30
Sept
embe
r 20
11 o
n ht
tp://
pubs
.rsc
.org
| do
i:10.
1039
/C1S
M06
113E
View Article Online
which results in random hypercrosslinking density and the
appearance of macropores in HCP-DVB-VBC, as shown in FE-
SEM images (Fig. 1) and pore size distribution graphs (Fig. 3).
For the DVB-VBC precursor containing DVB, it is almost fully
swollen in solvent and every chain lightly-crosslinked by DVB is
not so free to disperse in solvent, which reduces the distance
between them; for the lower crosslinked DVB-VBC precursor
(e.g., precursor with 0.5% and 1% DVB), the chains are fixed to
each other by DVB, but the chains are also very loose so that the
distance between two chains is not uniform everywhere, hence, it
still has quite similar a situation to the DVB-VBC precursor with
0% DVB in terms of formation of an uneven pore structure.
Besides, limited DVB can only crosslink a restricted number of
chains into a network, therefore, there are many tiny and non-
uniform pores on the polymer surface and its bulk, as shown in
FE-SEM images of the polymer with 0.5% and 1% DVB (Fig. 1).
The heterogeneous precursor texture remains after hyper-
crosslinking to some degree because it is too far to form the
cross-bridge between the tiny bulks. In other words, the hyper-
crosslinking reaction usually occurs in a compact polymer chains
region. For these two reasons, the HCP-DVB-VBC with lower
DVB content presents a heterogeneous pore structure, as shown
in FE-SEM images (Fig. 1) and pore size distribution graphs
(Fig. 3). The non-linear crosslinked precursor with higher DVB
content presents a more uniform texture, as shown in FE-SEM
images (Fig. 1), which favoured a uniform pore structure after
the hypercrosslinking reaction. On the other hand, the precursor
with a higher crosslinking degree possess a more rigid network,
and the distance between each chain tended to be more identical
at every location (comparing Schemes 2(b) and (c)), which means
the hypercrosslinking degree will be more uniform throughout
the polymer. The fracture section of HCP-DVB-VBC with 2% to
10% DVB (Fig. 1) thus represents smoother, narrower and more
uniform pore size distribution (Fig. 3).
Gas adsorption properties
As shown in the Table 2, nitrogen gas, hydrogen gas and carbon
dioxide gas adsorption properties are different for different
samples. HCP-DVB-VBC with 2% DVB possesses the best
nitrogen gas adsorption properties (53.80 mmol g�1, 150.62 wt
%), HCP-DVB-VBC with 5% DVB shows the greatest hydrogen
gas adsorption (7.50 mmol g�1, 1.50 wt%), and HCP-DVB-VBC
with 10% DVB adsorbs the most carbon dioxide gas (2.82 mmol
This journal is ª The Royal Society of Chemistry 2011
g�1, 12.41 wt%). There are many factors affecting the gas
adsorption properties, such as the nature of adsorbate and
chemical structure, surface area, pore morphology, pore size and
pore size distribution of the adsorbent material. The materials
studied in this work should have, in principle, the quite similar
chemical structure and pore morphology; therefore, if they show
different adsorption properties for the same gas adsorbate, the
most crucial factors should be the surface area (calculated by
nitrogen gas adsorption at 77.3 K) and pore size and pore size
distribution. For HCP-DVB-VBC with similar surface areas, the
hydrogen gas and carbon dioxide gas adsorption are higher for
those with a smaller micropore size and higher microporous
volume, for example, the HCP-DVB-VBC with 0.5% DVB (1790
m2 g�1; H2 uptake, 1.28 wt%; CO2 uptake, 10.01 wt%) and HCP-
DVB-VBC with 5% DVB (1760 m2 g�1; H2 uptake, 1.50 wt%;
CO2 uptake, 11.32 wt%), the HCP-DVB-VBC with 1% DVB
(1858 m2 g�1; H2 uptake, 1.39 wt%; CO2 uptake, 10.02 wt%) and
HCP-DVB-VBC with 4% DVB (1841 m2 g�1; H2 uptake, 1.48 wt
%; CO2 uptake, 11.32 wt%). That smaller pore size and higher
microporous volume facilitate gas adsorption is consistent with
literature reports on other classes of porous materials. Nijkamp
and co-workers have systemically researched zeolites and
activated carbons and found out for analogs, the higher the
micropore volume is, the higher the H2 adsorption is.39 Mart�ın
and co-workers have researched the hypercrosslinked polymers
based on co-polycondensation of p-dichloroxylene (p-DCX) and
4,4-bis(chloromethyl)-1,10-biphenyl (BCMBP) and found out
that CO2 uptakes at atmospheric pressure and ambient temper-
ature seem to correlate better with narrow micropore volumes.40
The gas uptake data of materials mentioned above have been
summarized in Table 3.
Conclusion
In this report, we have demonstrated that the pore structure of
HCP-DVB-VBC can be adjusted from macropore to micropore
scale by changing the DVB contents. When the DVB concen-
tration is up to 7%, sheer microporous structure can be obtained.
The mechanism of effect of DVB content in controlling the pore
structure is proposed. The experimental data indicate that the
smaller micropore size and higher microporous volume favors
the H2 and CO2 gas adsorption. Compared to other costly
porous organic materials, these cost-efficient polymers (HCP-
DVB-VBC) with a tunable pore structure would have broad
Soft Matter, 2011, 7, 10910–10916 | 10915

Dow
nloa
ded
by U
nive
rsité
Lav
al o
n 17
Mar
ch 2
013
Publ
ishe
d on
30
Sept
embe
r 20
11 o
n ht
tp://
pubs
.rsc
.org
| do
i:10.
1039
/C1S
M06
113E
View Article Online
feasible applications as molecular sieves, chromatographic
column packing materials, selective catalysis etc.
Acknowledgements
We thank Analysis and Testing Center, Huazhong University of
Science and Technology for characterization assistance. This
work was financially supported by the program for New Century
Excellent Talents in University (NCET-10-0389), Shanghai
Tongji Gao Tingyao Environmental Science & Technology
Development Foundation (STGEF) and National Natural
Science Foundation of China (No. 50973037 and No. 51173058).
References
1 N. B. McKeown and P. M. Budd, Chem. Soc. Rev., 2006, 35, 675.2 X. Du, Y. Sun, B. Tan, Q. Teng, X. Yao, C. Su and W. Wang, Chem.Commun., 2010, 46, 970.
3 D. Dang, P. Wu, C. He, Z. Xie and C. Duan, J. Am. Chem. Soc., 2010,132, 14321.
4 H. Furukawa and O. M. Yaghi, J. Am. Chem. Soc., 2009, 131, 8875.5 N. B. McKeown, B. Gahnem, K. J. Msayib, P. M. Budd,C. E. Tattershall, K. Mahmood, S. Tan, D. Book, H. W. Langmiand A. Walton, Angew. Chem., 2006, 118, 1836.
6 C. D. Wood, B. Tan, A. Trewin, F. Su, M. J. Rosseinsky,D. Bradshaw, Y. Sun, L. Zhou and A. I. Cooper, Adv. Mater.,2008, 20, 1916.
7 B. Li, X. Huang, L. Liang and B. Tan, J. Mater. Chem., 2010, 20,7444.
8 A. P. Cote, A. I. Benin, N. W. Ockwig, M. O’Keeffe, A. J. Matzgerand O. M. Yaghi, Science, 2005, 310, 1166.
9 H. M. El-Kaderi, J. R. Hunt, J. L. Mendoza-Cortes, A. P. Cote,R. E. Taylor, M. O’Keeffe and O. M. Yaghi, Science, 2007, 316, 268.
10 J.-X. Jiang and A. Cooper, in Functional Metal–Organic Frameworks:Gas Storage, Separation and Catalysis, ed. M. Schr€oder, Springer,Berlin/Heidelberg, 2010, p. 1.
11 J. X. Jiang, F. Su, A. Trewin, C. D. Wood, H. Niu, J. T. A. Jones,Y. Z. Khimyak and A. I. Cooper, J. Am. Chem. Soc., 2008, 130, 7710.
12 J. Schmidt, M. Werner and A. Thomas, Macromolecules, 2009, 42,4426.
13 T. Ben, H. Ren, S. Ma, D. Cao, J. Lan, X. Jing, W. Wang, J. Xu,F. Deng, J. Simmons, S. Qiu and G. Zhu, Angew. Chem., Int. Ed.,2009, 48, 9457.
14 M. Rose, W. Bohlmann, M. Sabo and S. Kaskel, Chem. Commun.,2008, 2462.
15 B. Li, R. Gong, W. Wang, X. Huang, W. Zhang, H. Li, C. Hu andB. Tan, Macromolecules, 2011, 44, 2410.
10916 | Soft Matter, 2011, 7, 10910–10916
16 S. W. Yuan, B. Dorney, D. White, S. Kirklin, P. Zapol, L. P. Yu andD. J. Liu, Chem. Commun., 2010, 46, 4547.
17 P. Kuhn, M. Antonietti and A. Thomas, Angew. Chem., Int. Ed.,2008, 47, 3450.
18 J. Weber, M. Antonietti and A. Thomas, Macromolecules, 2008, 41,2880.
19 P. Pandey, A. P. Katsoulidis, I. Eryazici, Y. Wu, M. G. Kanatzidisand S. T. Nguyen, Chem. Mater., 2010, 22, 4974.
20 F. J. Uribe-Romo, J. R. Hunt, H. Furukawa, C. Kl€ock, M. O’Keeffeand O. M. Yaghi, J. Am. Chem. Soc., 2009, 131, 4570.
21 Y. Luo, B. Li, L. Liang and B. Tan, Chem. Commun., 2011, 47, 7704.22 V. A. Davankov, S. V. Rogozhin and M. P. Tsyurupa, US 3729457,
1971.23 M. P. Tsyurupa and V. A. Davankov, React. Funct. Polym., 2006, 66,
768.24 C.-F. Chang, C.-Y. Chang, K.-E. Hsu, S.-C. Lee and W. H€oll, J.
Hazard. Mater., 2008, 155, 295.25 V. Davankov, L. Pavlova, M. Tsyurupa, J. Brady, M. Balsamo and
E. Yousha, J. Chromatogr., Biomed. Appl., 2000, 739, 73.26 M. P. Tsyurupa, O. G. Tarabaeva, A. V. Pastukhov and
V. A. Davankov, Int. J. Polym. Mater., 2003, 52, 403.27 B. Li, F. Su, H.-K. Luo, L. Liang and B. Tan, Microporous
Mesoporous Mater., 2011, 138, 207.28 C. Long, Q. Li, Y. Li, Y. Liu, A. Li and Q. Zhang, Chem. Eng. J.,
2010, 160, 723.29 J. Y. Lee, C. D. Wood, D. Bradshaw, M. J. Rosseinsky and
A. I. Cooper, Chem. Commun., 2006, 2670.30 V. Davankov, M. Tsyurupa,M. Ilyin and L. Pavlova, J. Chromatogr.,
A, 2002, 965, 65.31 C. S. Sychov, M. M. Ilyin, V. A. Davankov and K. O. Sochilina, J.
Chromatogr., 2004, 1030, 17.32 S. N. Sidorov, L. M. Bronstein, V. A. Davankov, M. P. Tsyurupa,
S. P. Solodovnikov, P. M. Valetsky, E. A. Wilder andR. J. Spontak, Chem. Mater., 1999, 11, 3210.
33 V. A. Davankov and M. P. Tsyurupa, React. Polym., 1990, 13, 27.34 M. P. Tsyurupa and V. A. Davankov, React. Funct. Polym., 2002, 53,
193.35 P. Veverka and K. Jerabek, React. Funct. Polym., 1999, 41, 21.36 N. Fontanals, J. Cortes, M. Galia, R. M. Marce, P. A. G. Cormack,
F. Borrull and D. C. Sherrington, J. Polym. Sci., Part A: Polym.Chem., 2005, 43, 1718.
37 J. H. Ahn, J. E. Jang, C. G. Oh, S. K. Ihm, J. Cortez andD. C. Sherrington, Macromolecules, 2006, 39, 627.
38 K. S. W. Sing, D. H. Everett, R. A. W. Haul, L. Moscou,R. A. Pierotti, J. Rouquerol and T. Siemieniewska, Pure Appl.Chem., 1985, 57, 603.
39 M. G. Nijkamp, J. Raaymakers, A. J. van Dillen and K. P. de Jong,Appl. Phys. A: Mater. Sci. Process., 2001, 72, 619.
40 C. F. Mart�ın, E. St€ockel, R. Clowes, D. J. Adams, A. I. Cooper,J. J. Pis, F. Rubiera and C. Pevida, J. Mater. Chem., 2011, 21, 5475.
This journal is ª The Royal Society of Chemistry 2011


