Owen West
European Digital Trends -‐ Shi5ing Consump8on Habits
Tanya Khandurova Russia Business Development Director [email protected]
Kiev 2012
2 © comScore, Inc. Proprietary.
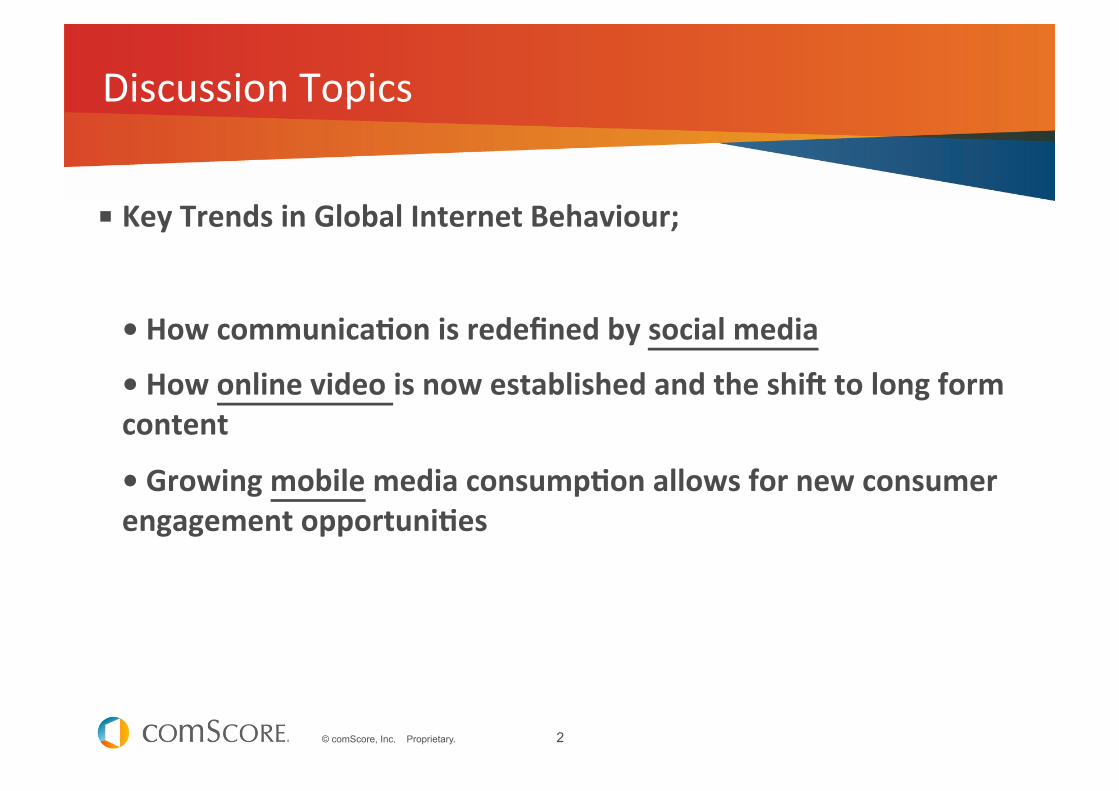
Discussion Topics
§ Key Trends in Global Internet Behaviour;
• How communica8on is redefined by social media
• How online video is now established and the shi5 to long form content
• Growing mobile media consump8on allows for new consumer engagement opportuni8es
3 © comScore, Inc. Proprietary.
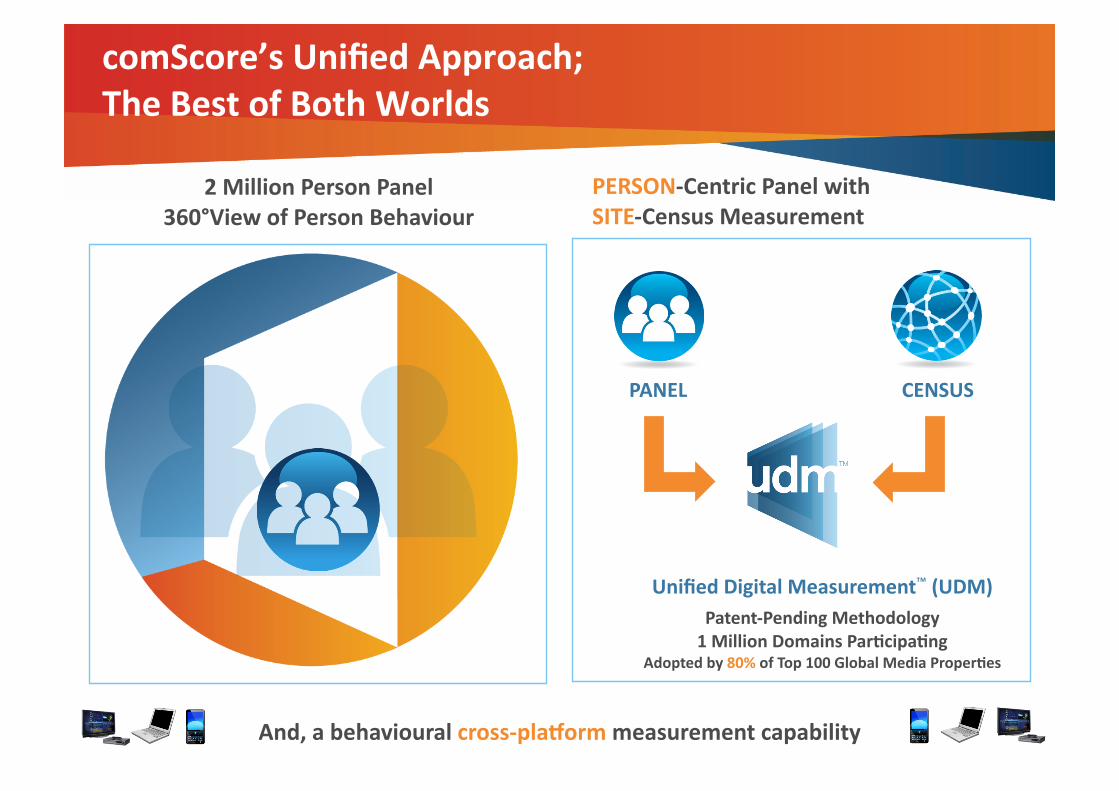
comScore’s Unified Approach; The Best of Both Worlds
2 Million Person Panel 360°View of Person Behaviour
CENSUS
Unified Digital Measurement™ (UDM) Patent-‐Pending Methodology 1 Million Domains Par8cipa8ng
Adopted by 80% of Top 100 Global Media Proper8es
PANEL
PERSON-‐Centric Panel with SITE-‐Census Measurement
V0411 And, a behavioural cross-‐pla`orm measurement capability
4 © comScore, Inc. Proprietary.
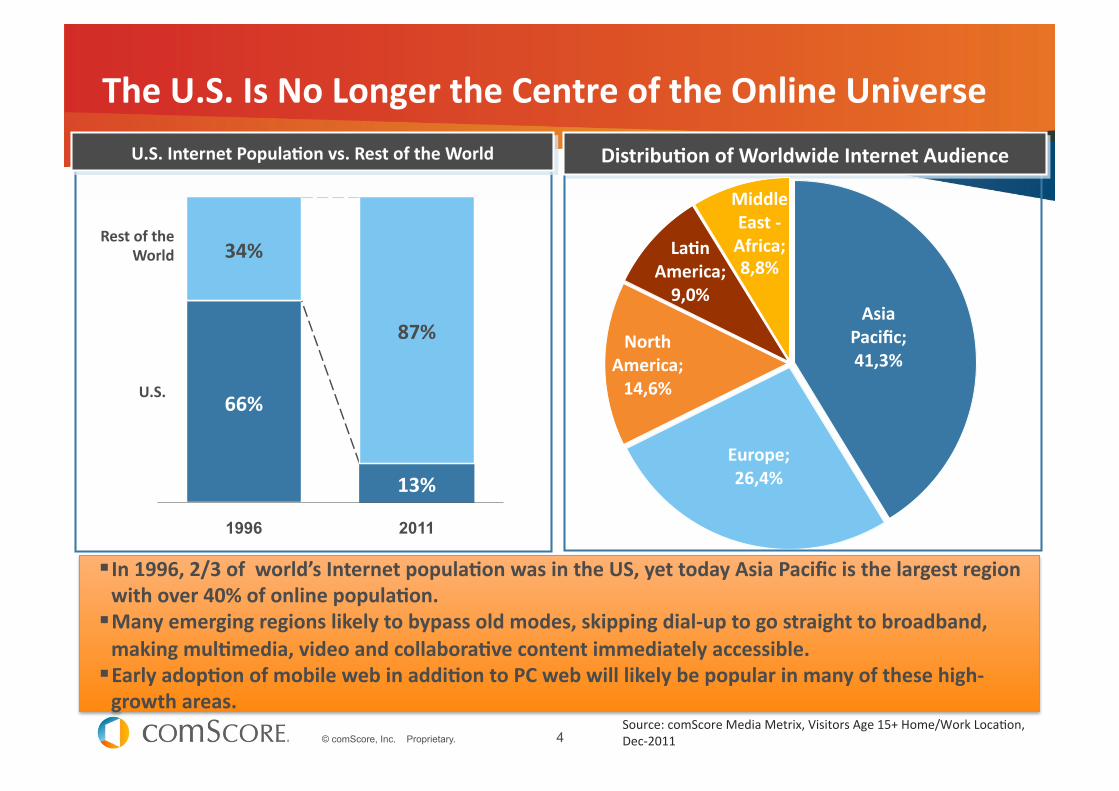
§ In 1996, 2/3 of world’s Internet popula8on was in the US, yet today Asia Pacific is the largest region with over 40% of online popula8on.
§ Many emerging regions likely to bypass old modes, skipping dial-‐up to go straight to broadband, making mul8media, video and collabora8ve content immediately accessible.
§ Early adop8on of mobile web in addi8on to PC web will likely be popular in many of these high-‐growth areas.
Asia Pacific
Distribu8on of Worldwide Internet Audience
66%
13%
34%
87%
1996 2011
U.S. Internet Popula8on vs. Rest of the World
Rest of the World
U.S.
The U.S. Is No Longer the Centre of the Online Universe
Source: comScore Media Metrix, Visitors Age 15+ Home/Work LocaJon, Dec-‐2011
Asia Pacific; 41,3%
Europe; 26,4%
North America; 14,6%
La8n America; 9,0%
Middle East -‐ Africa; 8,8%
5 © comScore, Inc. Proprietary.
Online Landscape in Europe
Source: comScore Media Metrix, Europe Age 15+, January 2012
384 million Europeans go online for 29.8 hours
each month

6 © comScore, Inc. Proprietary.
595 381
210 129 126
534 361
203 112 111
Asia Pac Europe North America La8n America Middle east Africa
Dec-11 Dec-10
Significant Growth in Size of Internet Audience outside North America and Europe
§ Growth expected to con8nue as home broadband penetra8on increases in Asia and La8n America
§ Growth slows in North America
§ European growth mostly driven by Russia
+11%
+3% +6%
+15% +14%
Worldwide Online Popula8on (Millions)
Internet Audience 15+ accessing Internet from Home or Work Source: comScore Media Metrix, Dec 2010 and Dec 2011
1,323 1,444
2010 Dec 2011 Dec
+9%

SOCIAL NETWORKING
8 © comScore, Inc. Proprietary.
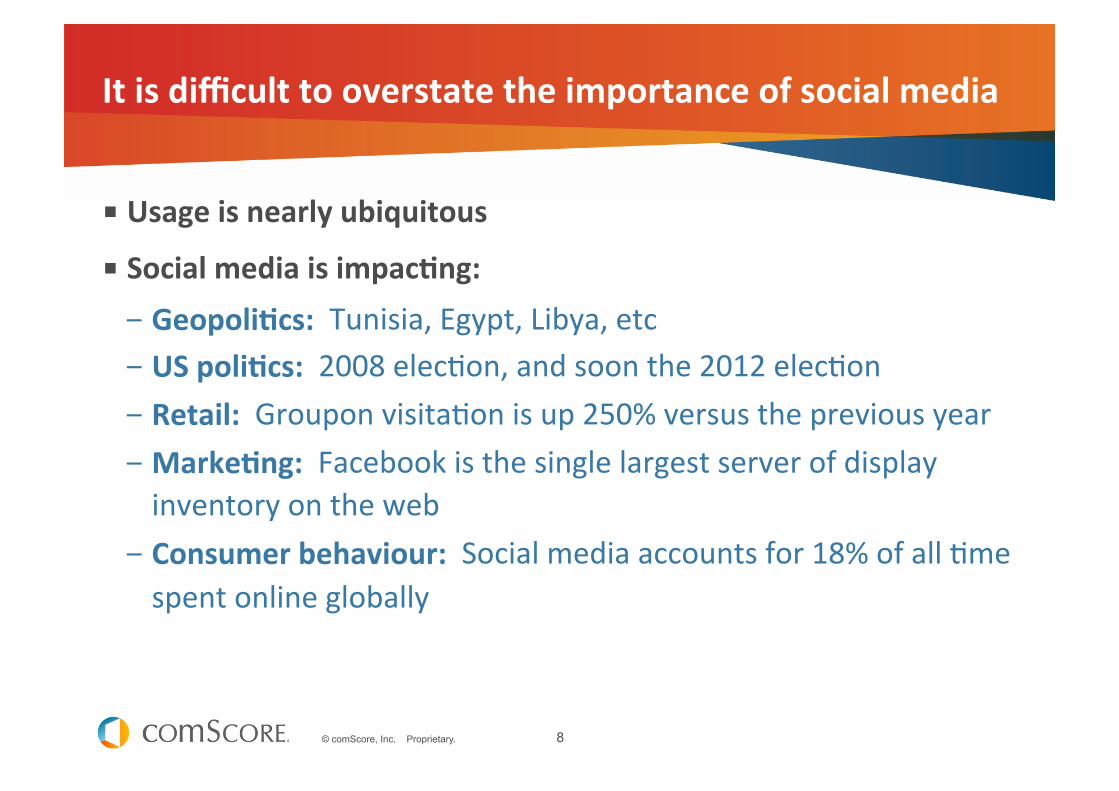
It is difficult to overstate the importance of social media
§ Usage is nearly ubiquitous § Social media is impac8ng: – Geopoli8cs: Tunisia, Egypt, Libya, etc – US poli8cs: 2008 elecJon, and soon the 2012 elecJon – Retail: Groupon visitaJon is up 250% versus the previous year – Marke8ng: Facebook is the single largest server of display inventory on the web
– Consumer behaviour: Social media accounts for 18% of all Jme spent online globally

9 © comScore, Inc. Proprietary.
The Rise of the Global Social Networking Audience
0
200
400
600
800
1 000
1 200
1 400
1 600
2011 2012 2013 2014 2015
Worldwide Total Unique Visitors (MM)
+88% Total Internet
+174% Social Networking
10 © comScore, Inc. Proprietary.
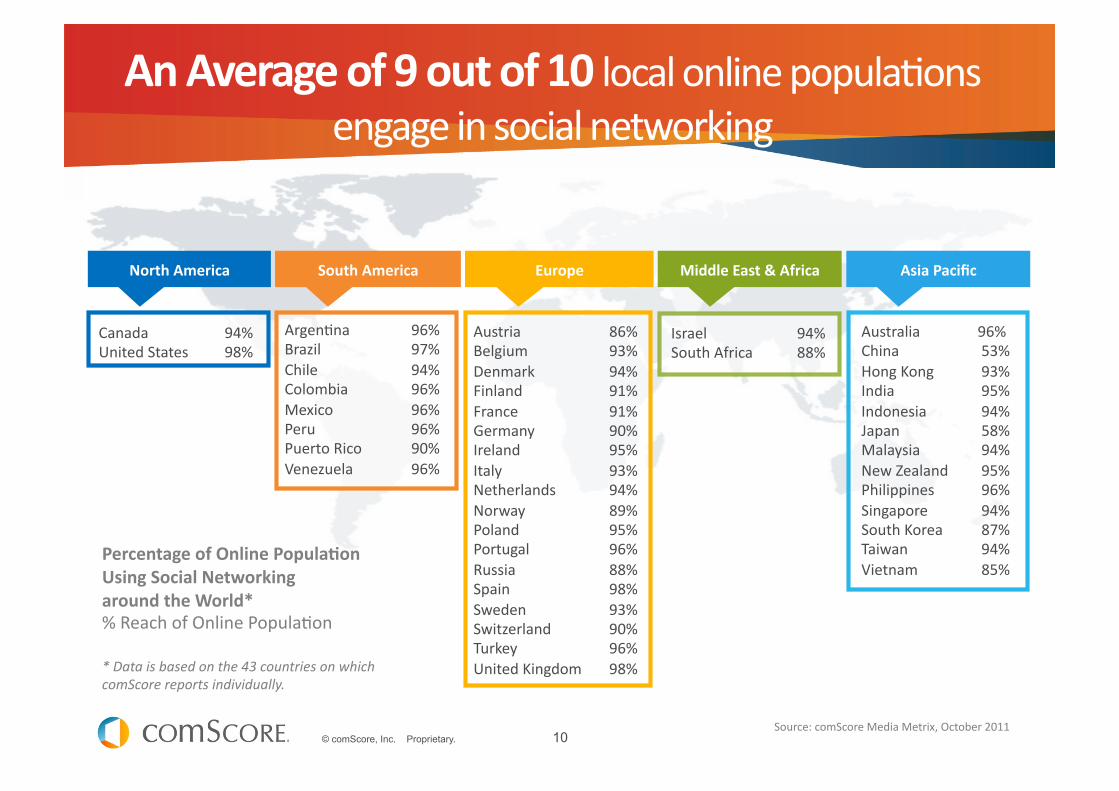
Austria 86% Belgium 93% Denmark 94% Finland 91% France 91% Germany 90% Ireland 95% Italy 93% Netherlands 94% Norway 89% Poland 95% Portugal 96% Russia 88% Spain 98% Sweden 93% Switzerland 90% Turkey 96% United Kingdom 98%
Australia 96% China 53% Hong Kong 93% India 95% Indonesia 94% Japan 58% Malaysia 94% New Zealand 95% Philippines 96% Singapore 94% South Korea 87% Taiwan 94% Vietnam 85%
Canada 94% United States 98%
ArgenJna 96% Brazil 97% Chile 94% Colombia 96% Mexico 96% Peru 96% Puerto Rico 90% Venezuela 96%
Israel 94% South Africa 88%
North America South America Europe Middle East & Africa Asia Pacific
Percentage of Online Popula8on Using Social Networking around the World* % Reach of Online PopulaJon
* Data is based on the 43 countries on which comScore reports individually.
An Average of 9 out of 10 local online populaJons engage in social networking
Source: comScore Media Metrix, October 2011

2008 2009 2010 2011
Time Spent on Key Categories Online Worldwide Hours per Month (Billions)
35
30
25
Nearly in 4 minutes online is spent on social networks today
1
Social Networking
Search/Naviga8on
Retail
Communica8ons (Email/IM)
Other Content
Source: comScore Media Metrix, March 2007 -‐ October 2011

Social Networking is Redefining the European Online Landscape
Source: comScore Media Metrix, Europe Age 15+, January 2011 to 2012
15,9%
11,7%
6,6%
4,6% 0,0%
5,0%
10,0%
15,0%
20,0%
25,0%
Share of 8me spent among top web categories Social Networking Services Portals Mul8media E-‐mail
25.8%
13 © comScore, Inc. Proprietary.
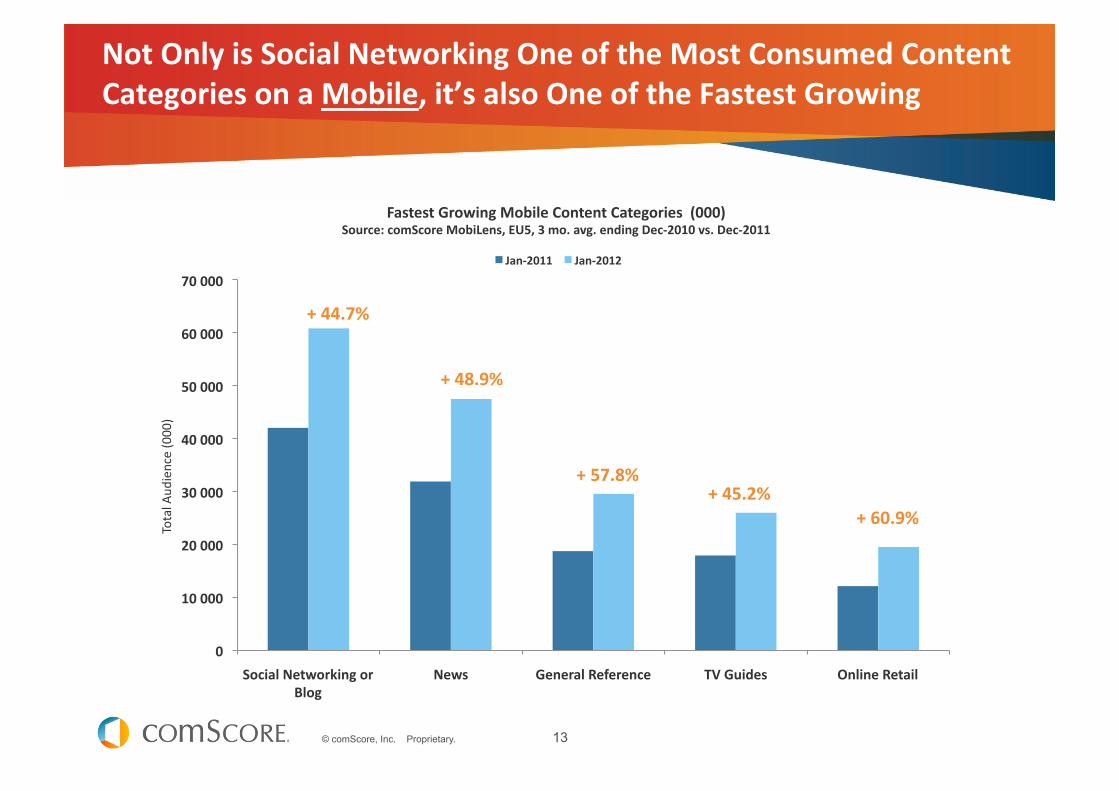
Not Only is Social Networking One of the Most Consumed Content Categories on a Mobile, it’s also One of the Fastest Growing
0
10 000
20 000
30 000
40 000
50 000
60 000
70 000
Social Networking or Blog
News General Reference TV Guides Online Retail
Total A
udience (000)
Fastest Growing Mobile Content Categories (000) Source: comScore MobiLens, EU5, 3 mo. avg. ending Dec-‐2010 vs. Dec-‐2011
Jan-‐2011 Jan-‐2012
+ 44.7%
+ 48.9%
+ 57.8% + 45.2%
+ 60.9%
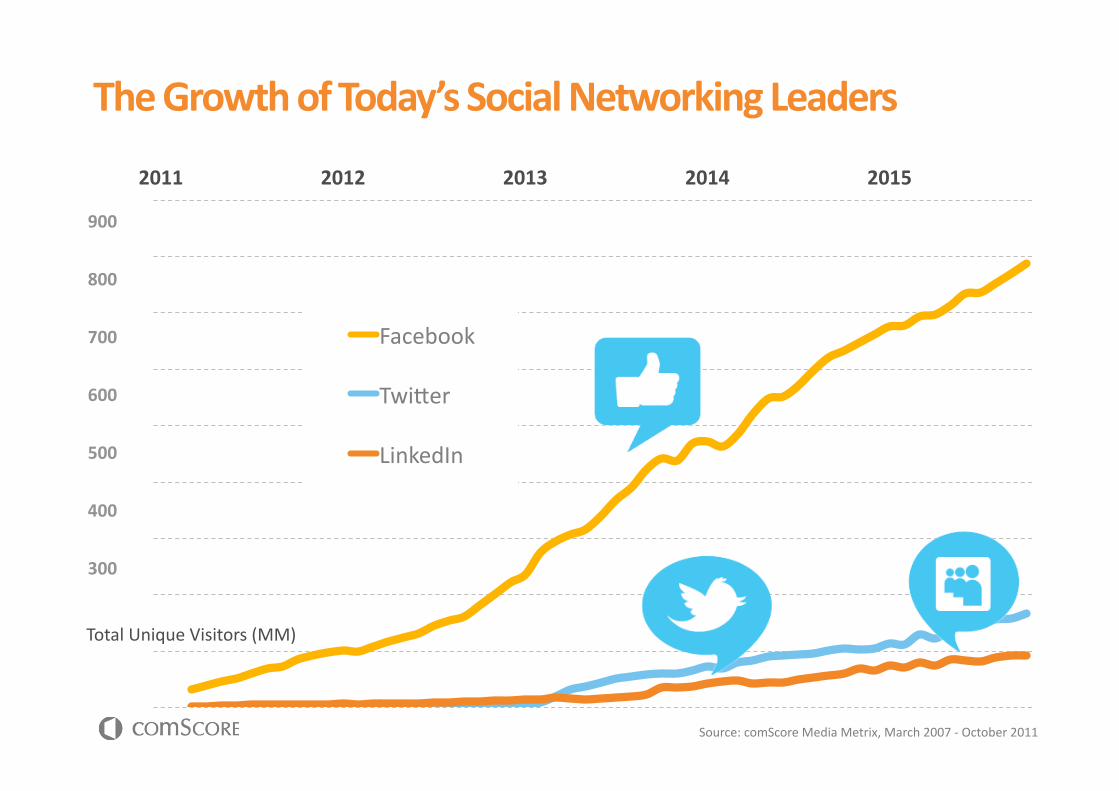
2011 2012 2013 2014 2015
Twiger
The Growth of Today’s Social Networking Leaders
Source: comScore Media Metrix, March 2007 -‐ October 2011
900
800
700
600
500
400
300
Total Unique Visitors (MM)
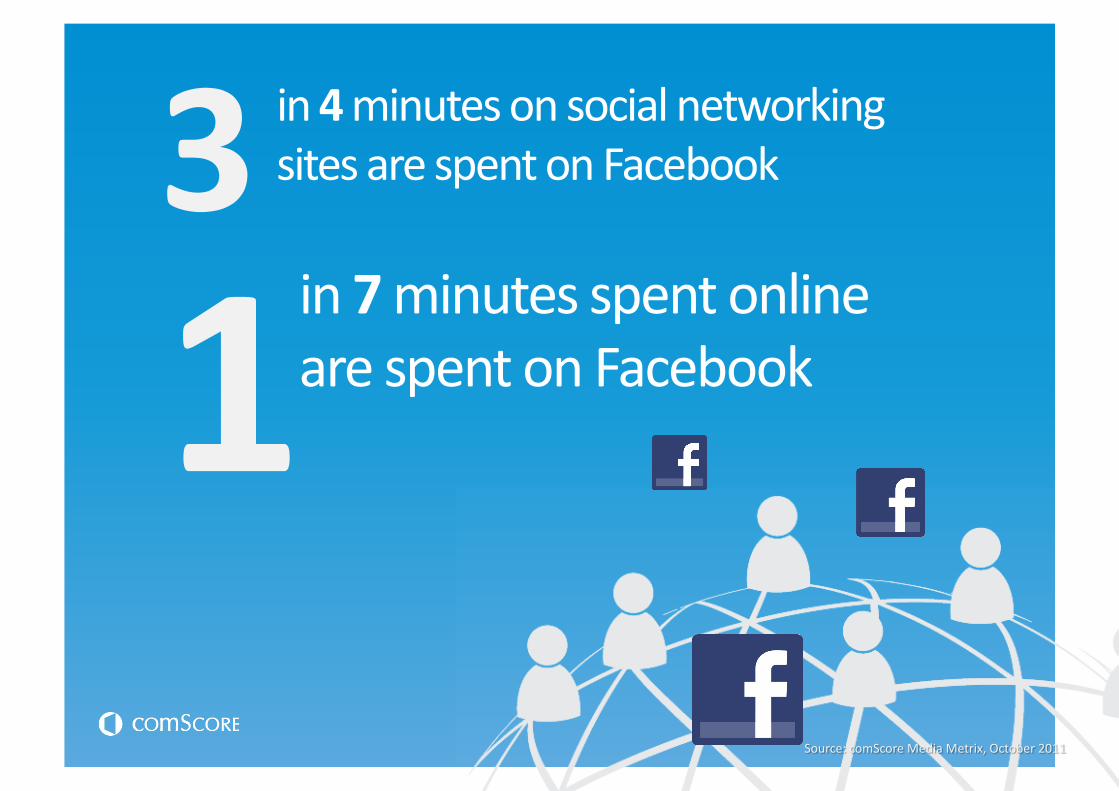
3 in 4 minutes on social networking sites are spent on Facebook
1 in 7 minutes spent online are spent on Facebook

471MM
788MM
Jan-2010 Apr-2010 Jul-2010 Oct-2010 Jan-2011 Apr-2011 Jul-2011 Oct-2011
Facebook overtakes StudiVZ in Germany
Facebook overtakes Orkut in India
Facebook overtakes
Windows Live in Mexico
Facebook overtakes Hyves in Holland
Facebook overtakes
Windows Live in Portugal
Facebook overtakes Yahoo! Wretch in Taiwan
Facebook’s Ascent in Recent Years Total Unique Visitors (MM)
Source: comScore Media Metrix, January 2010 -‐ October 2011
Since 2010, Facebook Has Taken the Lead in 6 New Markets Across Asia, La8n America and Europe

Today, there are only 5 markets where Facebook is not the leading social network ( in 2011 it finally took over in Poland and Brazil)
Source: comScore Media Metrix, October 2011
Russia
Japan
Vietnam South Korea
China
18 © comScore, Inc. Proprietary.
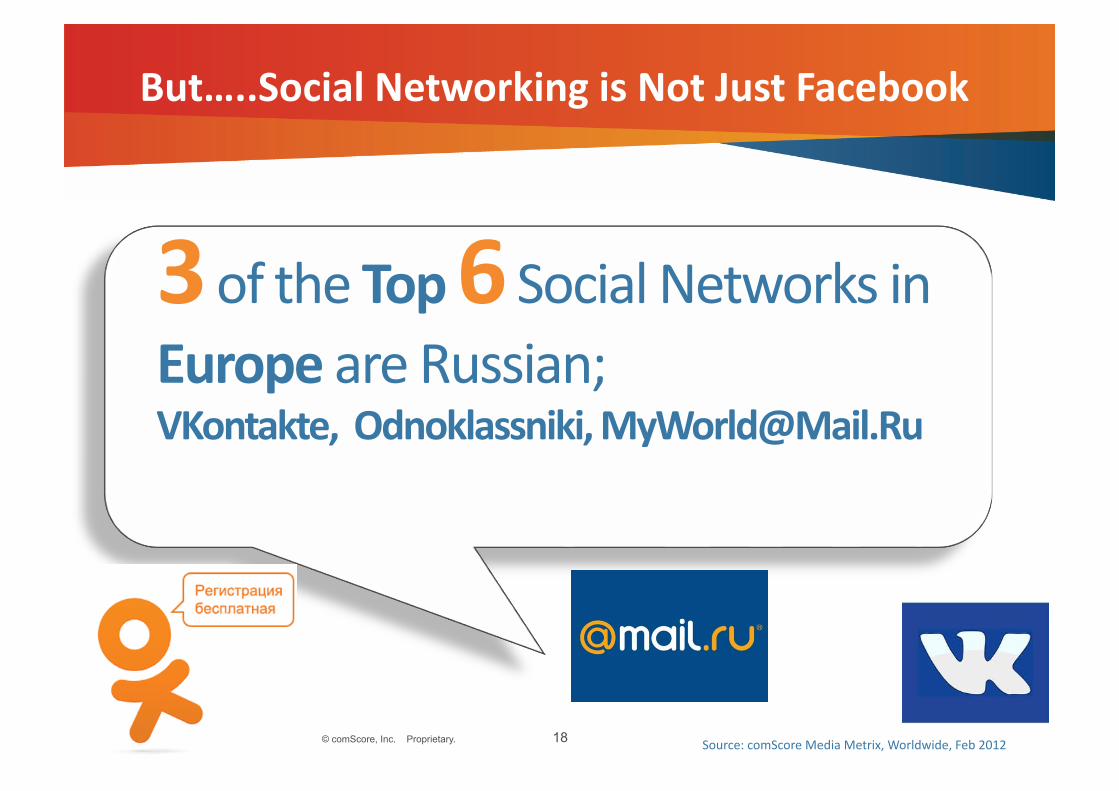
3 of the Top 6 Social Networks in Europe are Russian; VKontakte, Odnoklassniki, [email protected]
Source: comScore Media Metrix, Worldwide, Feb 2012
But…..Social Networking is Not Just Facebook
Social Networking is the Most Popular Online AcJvity Worldwide 1
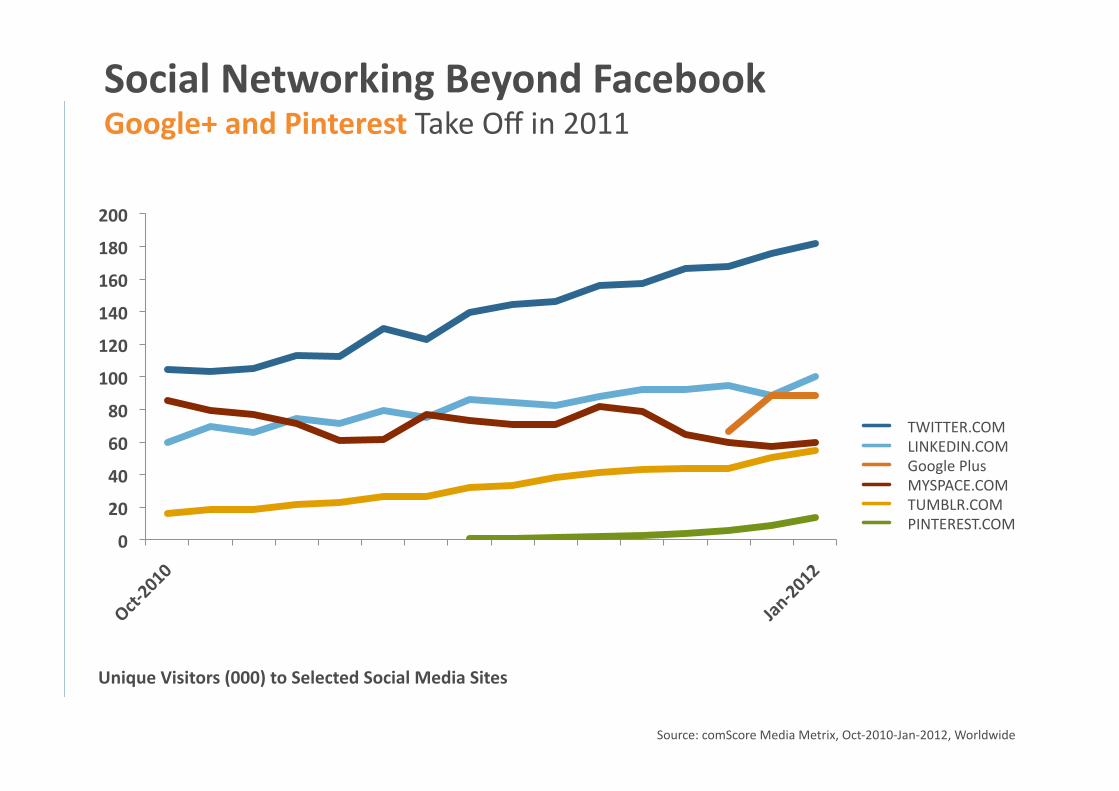
Social Networking Beyond Facebook Google+ and Pinterest Take Off in 2011
Source: comScore Media Metrix, Oct-‐2010-‐Jan-‐2012, Worldwide
Unique Visitors (000) to Selected Social Media Sites
0
20
40
60
80
100
120
140
160
180
200
TWITTER.COM LINKEDIN.COM Google Plus MYSPACE.COM TUMBLR.COM PINTEREST.COM
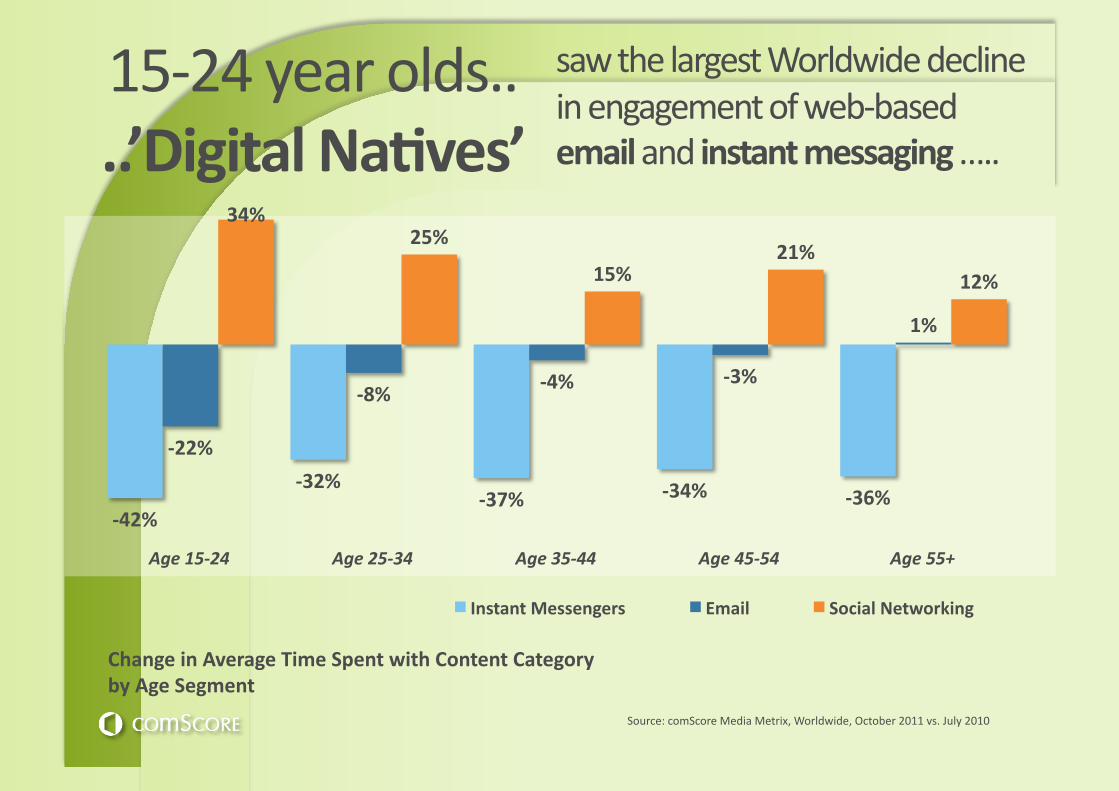
-‐42%
-‐32% -‐37% -‐34% -‐36%
-‐22%
-‐8% -‐4% -‐3%
1%
34% 25%
15% 21%
12%
Age 15-‐24 Age 25-‐34 Age 35-‐44 Age 45-‐54 Age 55+
Instant Messengers Email Social Networking
saw the largest Worldwide decline in engagement of web-‐based email and instant messaging …..
Change in Average Time Spent with Content Category by Age Segment
Source: comScore Media Metrix, Worldwide, October 2011 vs. July 2010
15-‐24 year olds.. ..’Digital Na8ves’

-‐42%
-‐32% -‐37% -‐34% -‐36%
-‐22%
-‐8% -‐4% -‐3%
1%
34% 25%
15% 21%
12%
Age 15-‐24 Age 25-‐34 Age 35-‐44 Age 45-‐54 Age 55+
Instant Messengers Email Social Networking
…and the highest increase in engagement of social networking
Source: comScore Media Metrix, Worldwide, October 2011 vs. July 2010
Change in Average Time Spent with Content Category by Age Segment
67,1
264,7
483,0
Instant Messengers
Social Networking
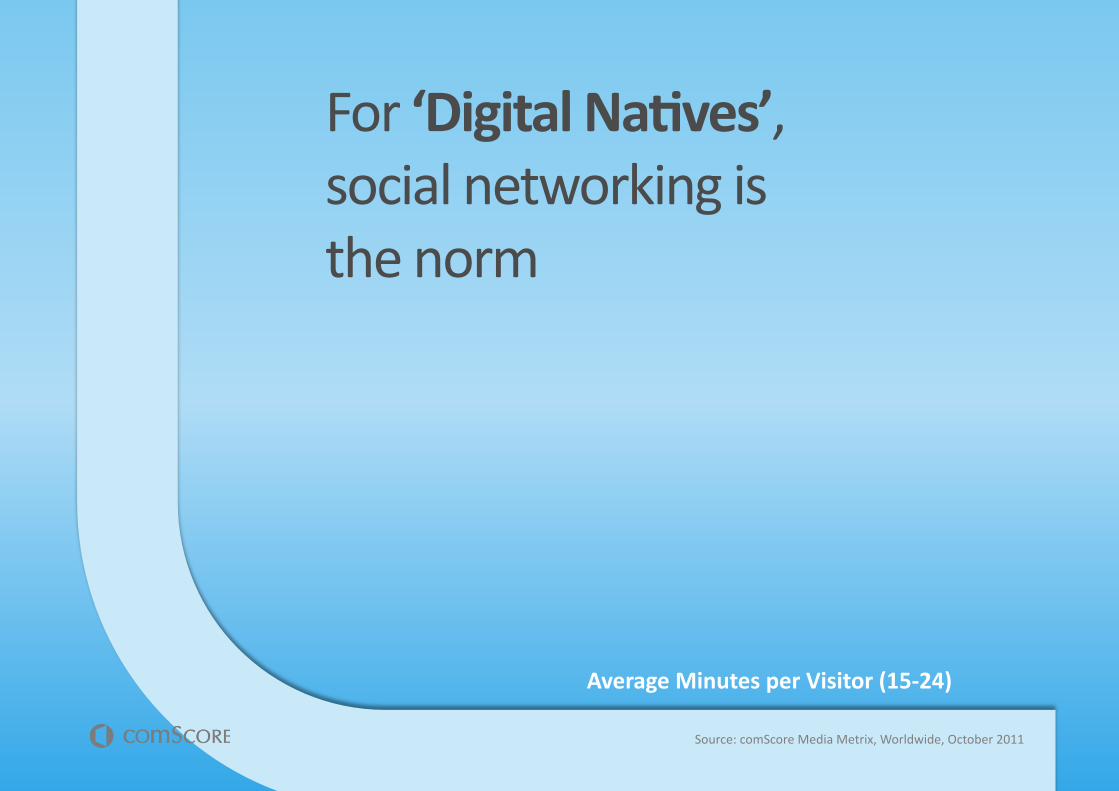
Average Minutes per Visitor (15-‐24)
For ‘Digital Na8ves’, social networking is the norm
Source: comScore Media Metrix, Worldwide, October 2011

23 © comScore, Inc. Proprietary.
ONLINE VIDEO

24 © comScore, Inc. Proprietary.
Online Video is Now a Huge Global Market
Source: comScore Video Metrix, Aged 15+, Feb 2012
1.2 Billion people watched an average of
18 hours each of Online Video in February
Worldwide
25 © comScore, Inc. Proprietary.
Social Networking is the Most Popular Online AcJvity Worldwide 1
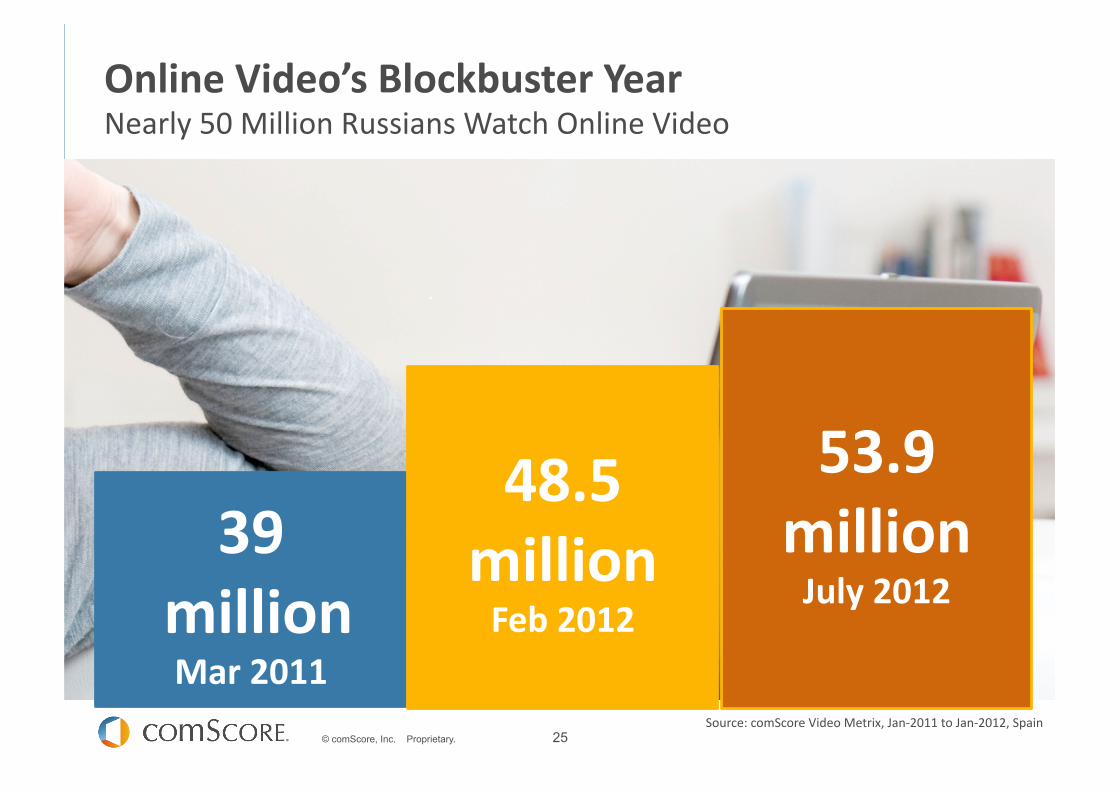
Online Video’s Blockbuster Year Nearly 50 Million Russians Watch Online Video
Source: comScore Video Metrix, Jan-‐2011 to Jan-‐2012, Spain
39 million Mar 2011
48.5 million Feb 2012
53.9 million July 2012

26 © comScore, Inc. Proprietary.
Social Networking is the Most Popular Online AcJvity Worldwide 1
Total Videos Viewed Increase 20% in Spain in 12 months
Average Viewer Watched 153 Videos in Feb 2012
Source: comScore Video Metrix, Feb-‐2011 to Feb-‐2012, Spain
2.5 billion Feb 2011
3 billion Feb 2012
27 © comScore, Inc. Proprietary.
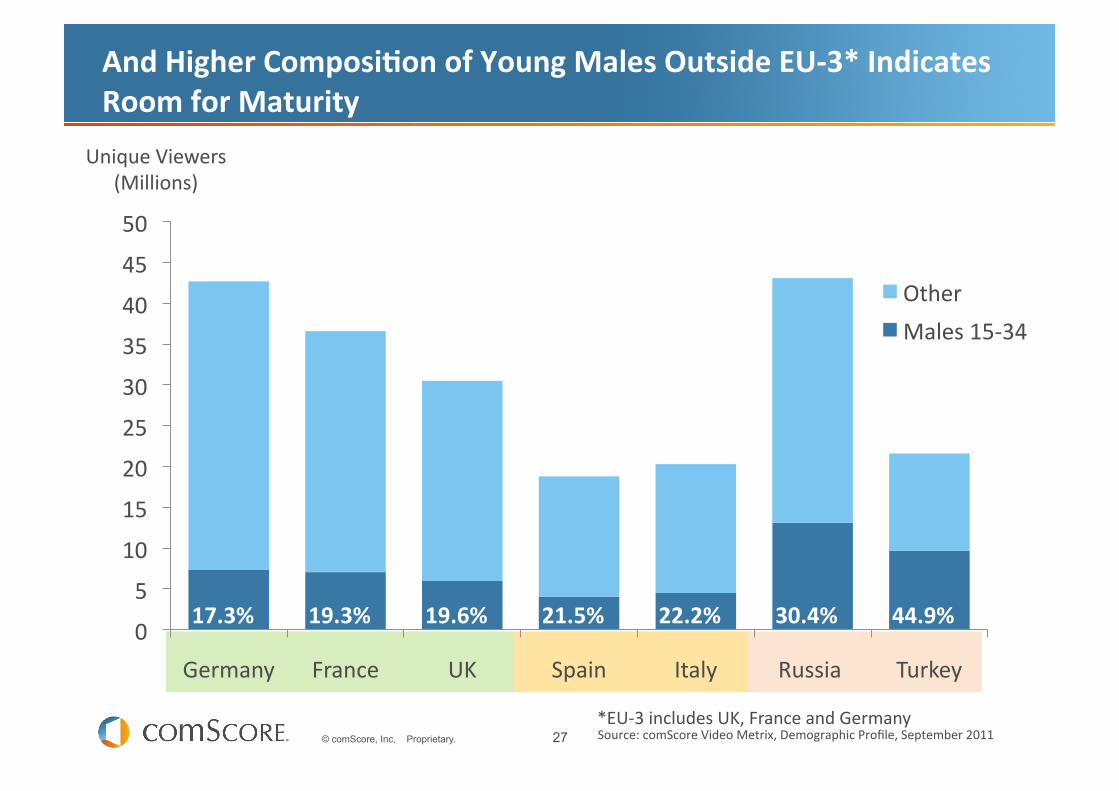
And Higher Composi8on of Young Males Outside EU-‐3* Indicates Room for Maturity
0
5
10
15
20
25
30
35
40
45
50
Germany France UK Spain Italy Russia Turkey
Other Males 15-‐34
17.3% 19.3% 19.6% 21.5% 22.2% 30.4% 44.9%
Source: comScore Video Metrix, Demographic Profile, September 2011
Unique Viewers (Millions)
*EU-‐3 includes UK, France and Germany
28 © comScore, Inc. Proprietary.
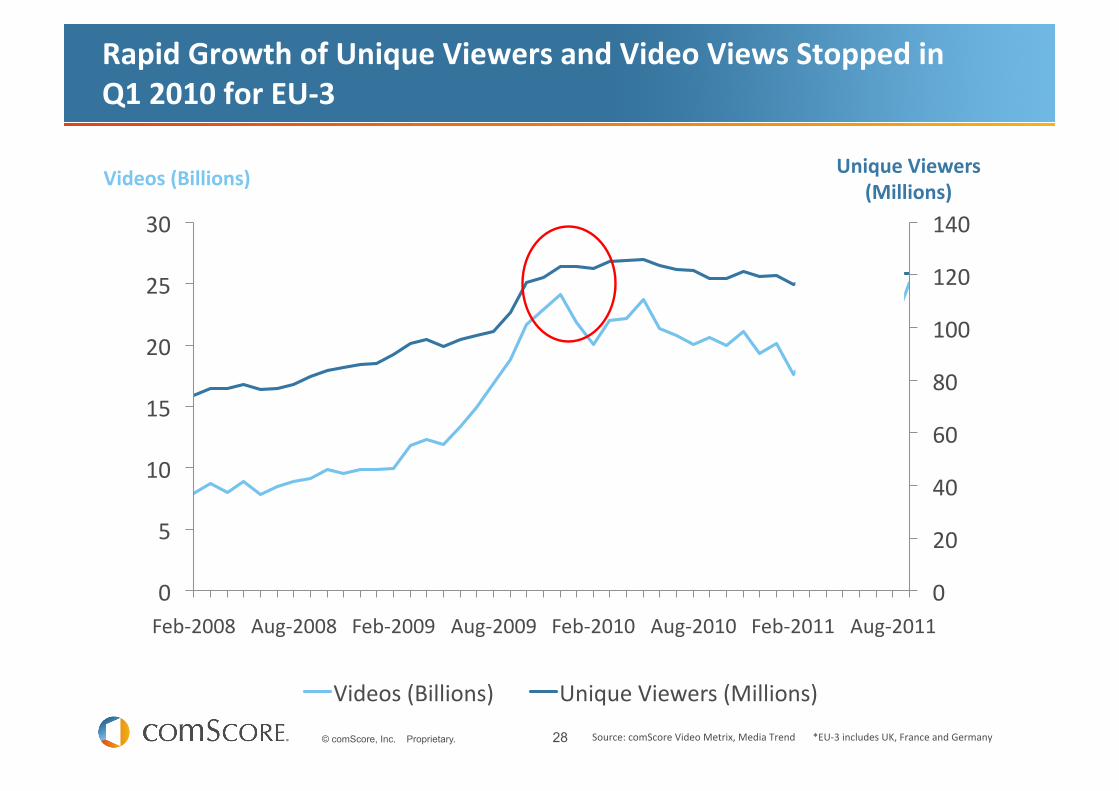
Rapid Growth of Unique Viewers and Video Views Stopped in Q1 2010 for EU-‐3
0
20
40
60
80
100
120
140
0
5
10
15
20
25
30
Feb-‐2008 Aug-‐2008 Feb-‐2009 Aug-‐2009 Feb-‐2010 Aug-‐2010 Feb-‐2011 Aug-‐2011
Videos (Billions) Unique Viewers (Millions)
Source: comScore Video Metrix, Media Trend *EU-‐3 includes UK, France and Germany
Videos (Billions) Unique Viewers (Millions)
29 © comScore, Inc. Proprietary.
19.2%
14.2%
7.5%
2.3%
8.2%
0
20
40
60
80
100
120
140
0
5
10
15
20
25
30
Feb-‐2008 Aug-‐2008 Feb-‐2009 Aug-‐2009 Feb-‐2010 Aug-‐2010 Feb-‐2011 Aug-‐2011
Videos (Billions) Unique Viewers (Millions)
Source: comScore Video Metrix, Media Trend *EU-‐3 includes UK, France and Germany
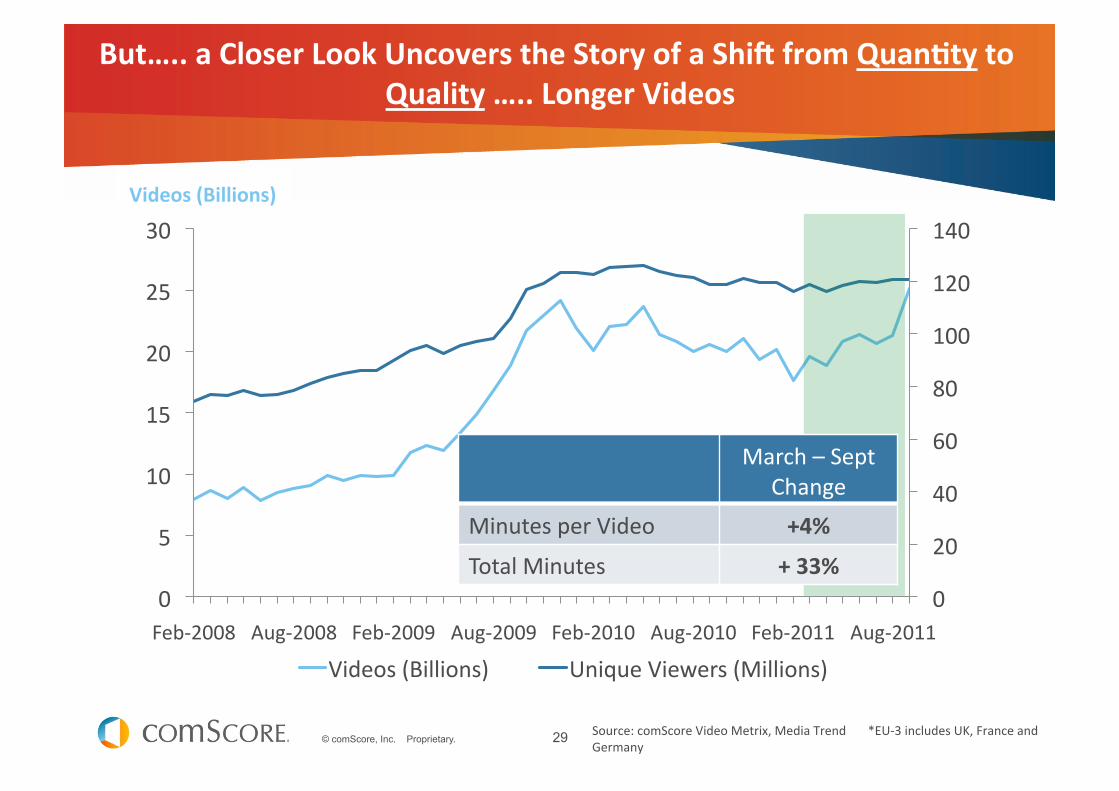
Videos (Billions)
March – Sept Change
Minutes per Video +4%
Total Minutes + 33%
But….. a Closer Look Uncovers the Story of a Shi5 from Quan8ty to Quality ….. Longer Videos
A Quality Viewing Experience A Choice of Quality Content Convenient and Accessible
A Price Worth Paying
A New Era of Online Video……

31 © comScore, Inc. Proprietary.
A Quality Viewing Experience: Online Video has Come a Long Way
UGC/’Numa Numa’ Song PREMIUM/FROZEN PLANET

32 © comScore, Inc. Proprietary.
A Choice of Quality Content: The Two Ends of the Quality Spectrum are Well Defined
UGC PREMIUM
Shorter format Low budget Low quality Low talent/interest Unknown content Minimally mone8sed
Longer format High budget High quality
High talent/interest Known content Well mone8sed
33 © comScore, Inc. Proprietary.
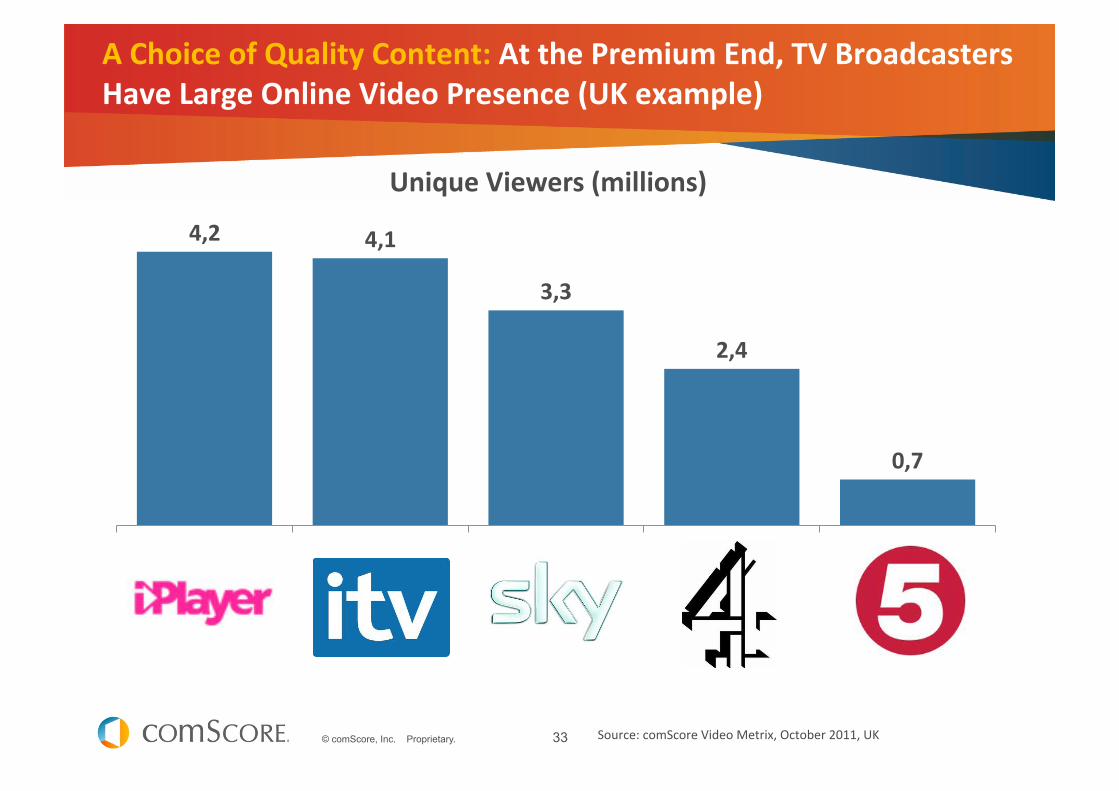
A Choice of Quality Content: At the Premium End, TV Broadcasters Have Large Online Video Presence (UK example)
4,2 4,1
3,3
2,4
0,7
Unique Viewers (millions)
Source: comScore Video Metrix, October 2011, UK

34 © comScore, Inc. Proprietary.
Sources: comScore Custom MarkeJng SoluJons Study (US 2011)
Convenient and Accessible: Online Video is Social and Publishers can Leverage the Power of Social Media
• 1 in 3 video viewers comment
• 2 in 5 upload videos
• 1 in 2 regularly share videos
• More than 1 in 2 view online video with others

35 © comScore, Inc. Proprietary.
A Price Worth Paying: Video Adver8sing Has Nearly Tripled in One Year (UK example)
19.2%
14.2%
7.5%
2.3%
8.2%
Source: comScore Video Metrix, UK, Age 6+, February 2011 vs 2012
Video Content Video Ads
With people spending more 8me viewing long-‐form content
the pla`orm is ripe for brand adver8sing
36 © comScore, Inc. Proprietary.
MOBILE

THE RISE OF SMARTPHONES; EU5 LEADS THE US
Source: comScore MobiLens, EU5 and US, 3 mon. avg. ending Oct 2011
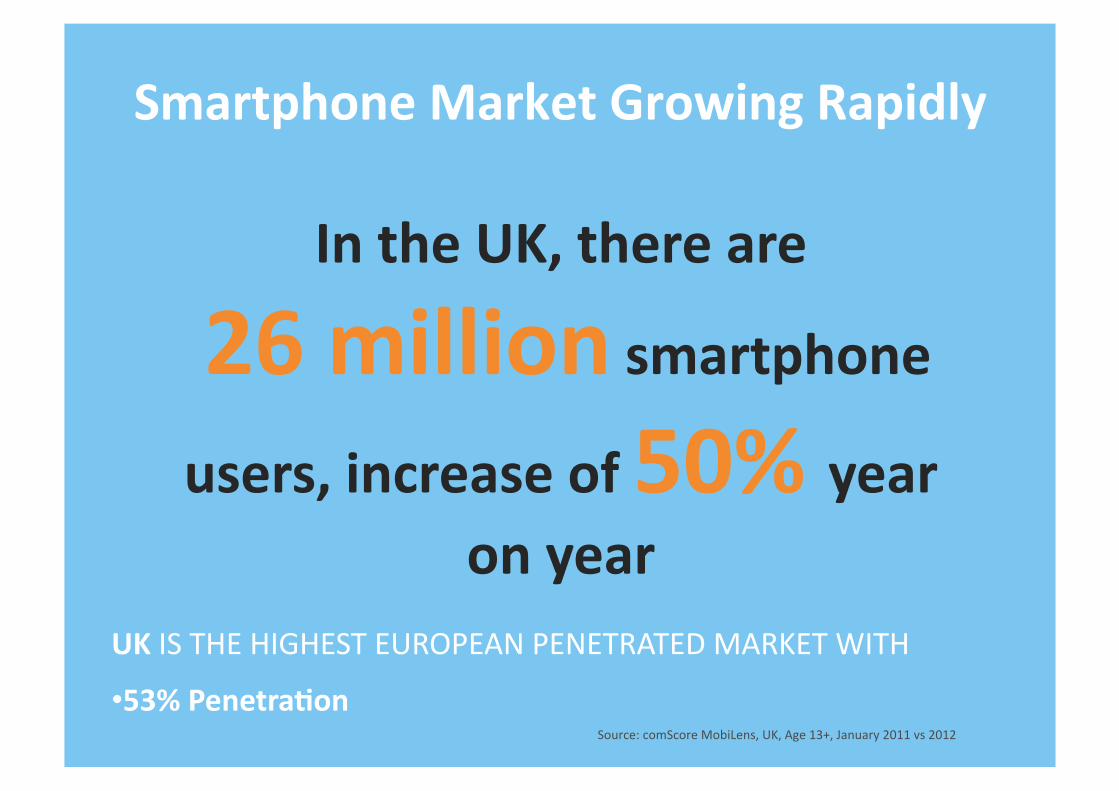
In the UK, there are
26 million smartphone
users, increase of 50% year on year
Smartphone Market Growing Rapidly
Source: comScore MobiLens, UK, Age 13+, January 2011 vs 2012
UK IS THE HIGHEST EUROPEAN PENETRATED MARKET WITH
• 53% Penetra8on

39 © comScore, Inc. Proprietary.
All Communica8ons and Social Media accessed show double-‐digital growth
19.2%
14.2%
7.5%
2.3%
8.2%
Source: comScore MobiLens, UK, Age 13+, January 2011 vs 2012
40 © comScore, Inc. Proprietary.
19.2%
14.2%
7.5%
2.3%
8.2%
Source: comScore Device EssenJals, UK, January 2012
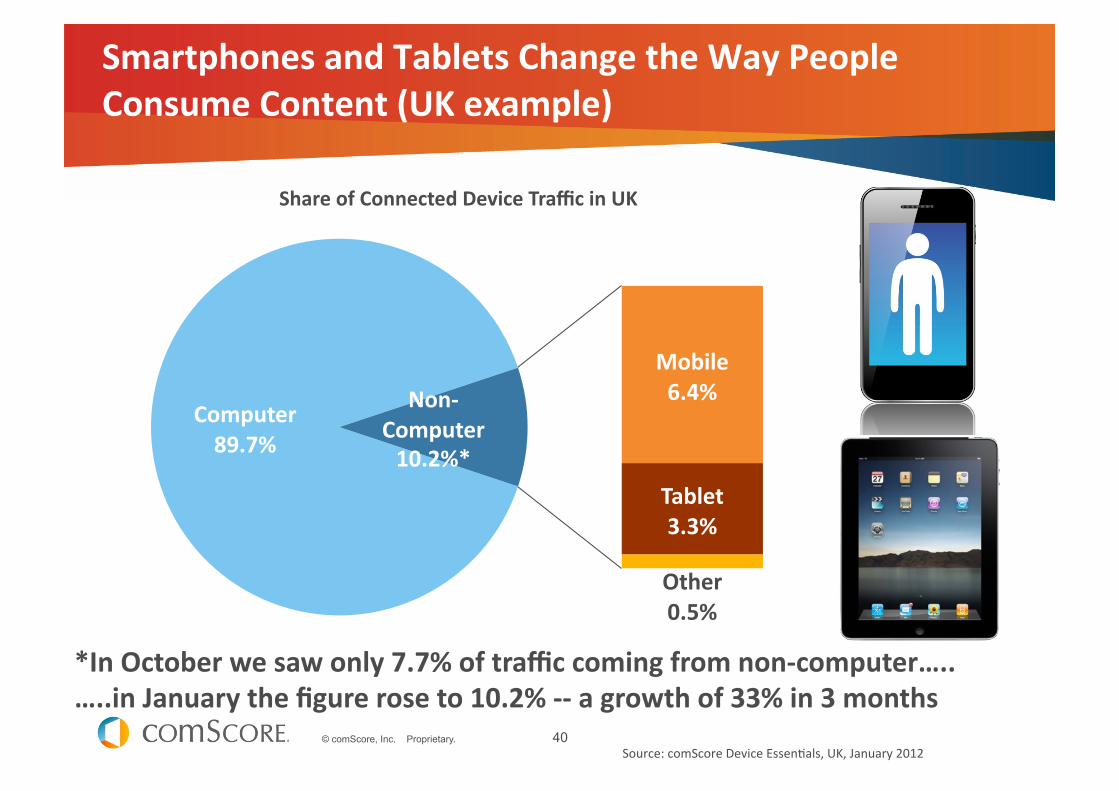
Smartphones and Tablets Change the Way People Consume Content (UK example)
Computer 89.7%
Mobile 6.4%
Tablet 3.3%
Other 0.5%
Non-‐Computer 10.2%*
Share of Connected Device Traffic in UK
*In October we saw only 7.7% of traffic coming from non-‐computer….. …..in January the figure rose to 10.2% -‐-‐ a growth of 33% in 3 months
41 © comScore, Inc. Proprietary.
19.2%
14.2%
7.5%
2.3%
8.2%
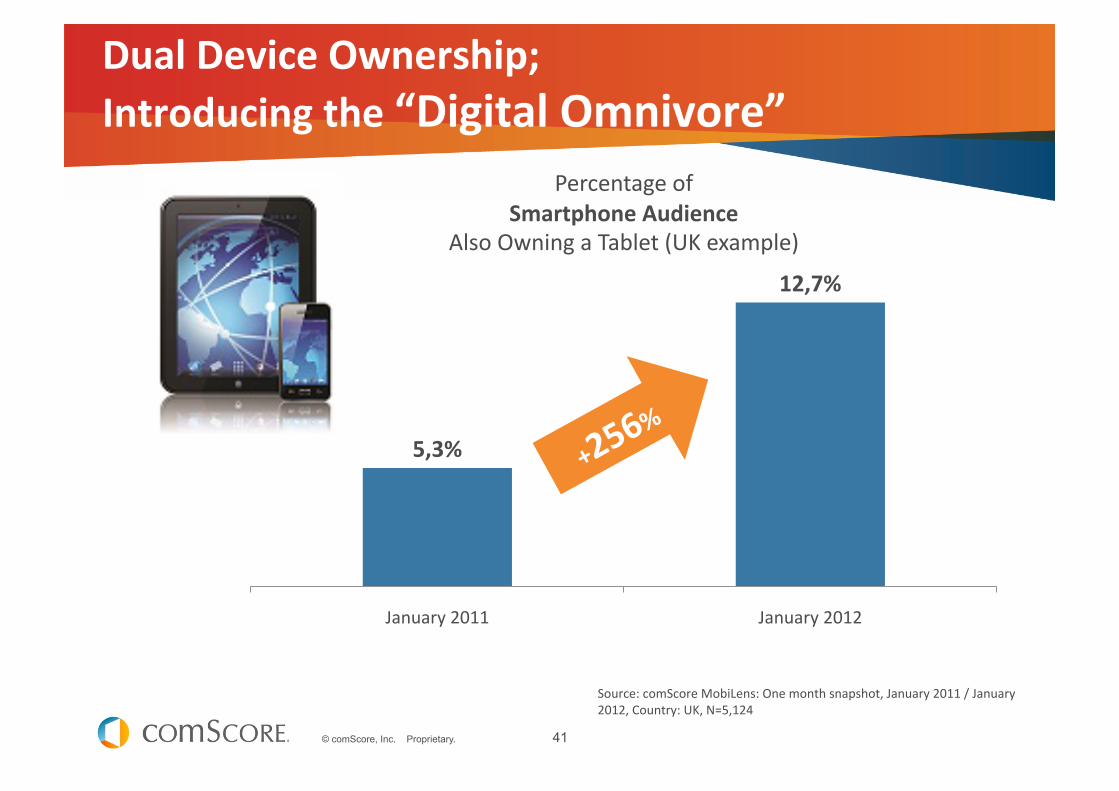
Source: comScore MobiLens: One month snapshot, January 2011 / January 2012, Country: UK, N=5,124
Dual Device Ownership; Introducing the “Digital Omnivore”
5,3%
12,7%
January 2011 January 2012
Percentage of Smartphone Audience
Also Owning a Tablet (UK example)
42 © comScore, Inc. Proprietary.
Conclusions
§ The digital world is expanding rapidly, driven by new users in some regions and / or by growth in 8me spent in others
§ Younger consumers are leading the revolu8on, with higher engagement coming from 15-‐34 age segments
§ Social Networking is a key driver of computer and Mobile ac8vity, cannibalizing many other ac8vi8es
§ Video & Mobile’s 8me is now