
Management Accounting Project Report
vs
Submitted to
Indian Institute of Management, Kozhikode
Submitted by
Anirban Tewary - ePGP-03-101.
N K Ashok - ePGP-03-105.
Sivakumar Lakshminarayanan - eMEP-10-063.
Soumen Sen -ePGP-03-174.
Objective : Objective of the Project is to do a Financial Statement Analysis between Tata Steel and JSW Steel
and try to conclude about both the Companies. Tata Steel is the Leader in the Steel industry and JSW Steel
is upcoming Steel company.
Balance Sheet JSW Steel Tata Steel
Mar '09
Mar '10
Mar '09 Mar '10 Sources Of Funds Total Share Capital 537.01 527.11 6,203.45 887.41 Equity Share Capital 248.08 248.08 730.79 887.41 Share Application Money 0 0 0 0 Preference Share Capital 288.93 279.03 5,472.66 0 Reserves 7,422.24 9,179.23 23,501.15 36,281.34 Revaluation Reserves 0 0 0 0 Networth 7,959.25 9,706.34 29,704.60 37,168.75 Secured Loans 8,214.61 8,987.51 3,913.05 2,259.32 Unsecured Loans 3,058.02 2,597.59 23,033.13 22,979.88 Total Debt 11,272.63 11,585.10 26,946.18 25,239.20 Total Liabilities 19,231.88 21,291.44 56,650.78 62,407.95
Application Of Funds
Gross Block 16,896.75 21,795.58 20,057.01 22,306.07 Less: Accum. Depreciation 3,810.31 4,929.44 9,062.47 10,143.63 Net Block 13,086.44 16,866.14 10,994.54 12,162.44 Capital Work in Progress 9,242.06 6,684.27 3,487.68 3,843.59 Investments 1,250.11 1,768.35 42,371.78 44,979.67 Inventories 2,051.42 2,585.77 3,480.47 3,077.75 Sundry Debtors 398.14 563.25 635.98 434.83 Cash and Bank Balance 207.91 117.4 463.58 500.3 Total Current Assets 2,657.47 3,266.42 4,580.03 4,012.88 Loans and Advances 1,980.02 2,216.05 5,884.61 6,678.55 Fixed Deposits 212.05 169.71 1,127.02 2,733.84 Total CA, Loans & Advances 4,849.54 5,652.18 11,591.66 13,425.27 Deffered Credit 0 0 0 0 Current Liabilities 9,115.34 9,415.28 8,965.76 8,699.34 Provisions 80.93 264.22 2,934.19 3,303.68 Total CL & Provisions 9,196.27 9,679.50 11,899.95 12,003.02 Net Current Assets -4,346.73 -4,027.32 -308.29 1,422.25 Miscellaneous Expenses 0 0 105.07 0 Total Assets 19,231.88 21,291.44 56,650.78 62,407.95
Contingent Liabilities
8,170.64
6,990.48
12,188.55 13,184.61 Book Value (Rs) 410.07 504 331.68 418.94
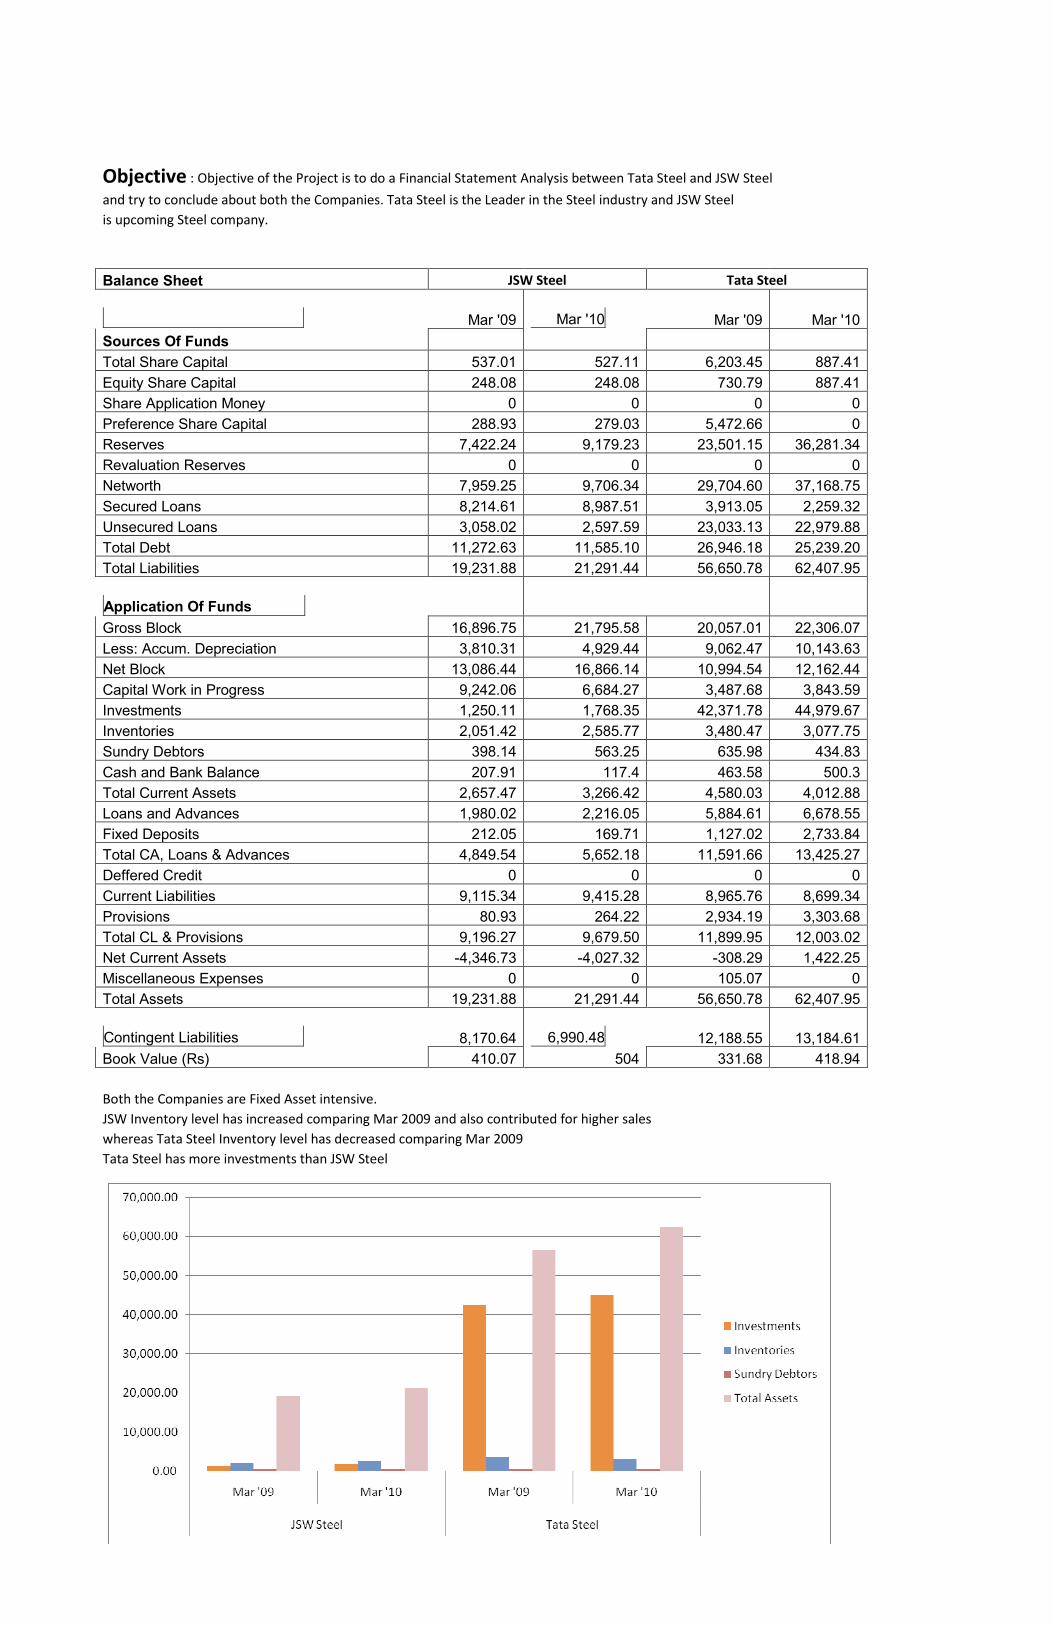
Both the Companies are Fixed Asset intensive.
JSW Inventory level has increased comparing Mar 2009 and also contributed for higher sales
whereas Tata Steel Inventory level has decreased comparing Mar 2009
Tata Steel has more investments than JSW Steel
Profit & Loss account JSW Steel Tata Steel
Mar '09 Mar '10 Mar '09 Mar '10
Income
Sales Turnover 15,179.29 19,456.6
4 26,843.5
3 26,757.60 Excise Duty 1,172.70 1,289.18 2,495.21 1,816.95
Net Sales 14,006.59 18,167.4
6 24,348.3
2 24,940.65 Other Income -608.47 474.25 603.07 1,241.08 Stock Adjustments 285.22 64.74 289.27 -134.97
Total Income 13,683.34 18,706.4
5 25,240.6
6 26,046.76 Expenditure
Raw Materials 9,386.47 11,415.8
6 8,568.71 8,356.45 Power & Fuel Cost 673.07 1,014.82 1,222.48 1,383.44 Employee Cost 288.75 365.2 2,305.81 2,361.48 Other Manufacturing Expenses 194.03 249.6 2,127.48 2,419.89 Selling and Admin Expenses 717.74 724.63 400.24 417.9 Miscellaneous Expenses 170.58 188.53 1,180.08 1,287.04 Preoperative Exp Capitalised 0 0 -343.65 -326.11
Total Expenses 11,430.64 13,958.6
4 15,461.1
5 15,900.09
Operating Profit
2,861.17 4,273.56
9,176.44
8,905.59 PBDIT 2,252.70 4,747.81 9,779.51 10,146.67 Interest 836.82 900.26 1,489.50 1,848.19 PBDT 1,415.88 3,847.55 8,290.01 8,298.48 Depreciation 827.66 1,123.41 973.4 1,083.18 Other Written Off 0 0 0 0 Profit Before Tax 588.22 2,724.14 7,316.61 7,215.30 Extra-ordinary items 176.8 96.03 0 0 PBT (Post Extra-ord Items) 765.02 2,820.17 7,316.61 7,215.30 Tax 306.52 797.43 2,114.87 2,168.50 Reported Net Profit 458.5 2,022.74 5,201.74 5,046.80 Total Value Addition 2,044.17 2,542.78 6,892.44 7,543.64 Preference Dividend 28.99 28.92 109.45 45.88 Equity Dividend 18.71 177.7 1,168.95 709.77 Corporate Dividend Tax 8.11 34.31 214.1 122.8 Per share data (annualised) Shares in issue (lakhs) 1,870.49 1,870.49 7,305.92 8,872.14 Earning Per Share (Rs) 22.96 106.59 69.7 56.37 Equity Dividend (%) 10 95 160 80 Book Value (Rs) 410.07 504 331.68 418.94
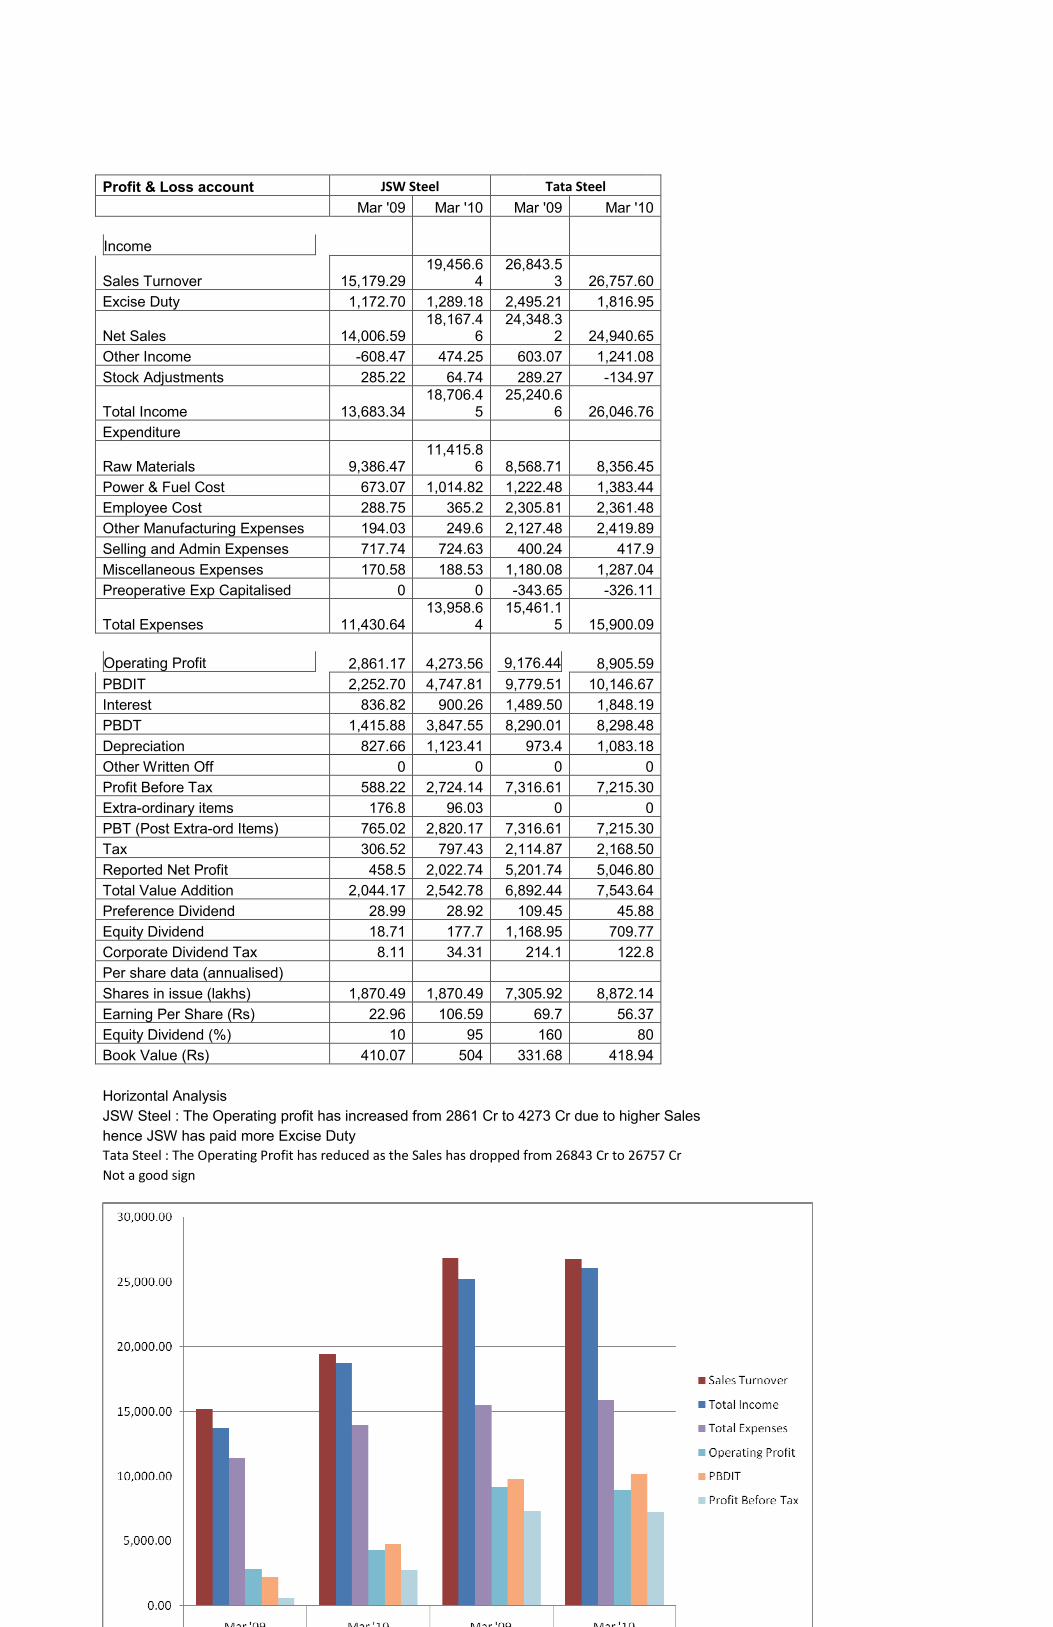
Horizontal Analysis JSW Steel : The Operating profit has increased from 2861 Cr to 4273 Cr due to higher Sales
hence JSW has paid more Excise Duty Tata Steel : The Operating Profit has reduced as the Sales has dropped from 26843 Cr to 26757 Cr
Not a good sign
Cash Flow JSW Steel Tata Steel
Mar '09 Mar '10 Mar '09 Mar '10
12 mths 12
mths 12 mths 12
mths
Net Profit Before Tax 677.63 2819.6
5 7315.61 7214.3
Net Cash From Operating Activities 4056.12 3297.7
6 7397.22 8369.2
2 Net Cash (used in)/from
-5834.9 -3147.8 -9428.1 -5254.8 Investing Activities Net Cash (used in)/from Financing Activities 1848.53 -261.78 3156.42 -1473.1
Net (decrease)/increase In Cash and Cash Equivalents 69.79 -111.8 1125.56 1641.2
5
Opening Cash & Cash Equivalents 306.82 376.61 465.04 1592.8
9
Closing Cash & Cash Equivalents 376.61 264.81 1590.6 3234.1
4
Profit Margins JSW Steel Tata Steel
Mar '09
Mar '10
Mar '09 Mar '10
Sales Turnover 15,179.29 19,456.64 26,843.53 26,757.60
Raw Materials 9,386.47 11,415.86 8,568.71 8,356.45
Power & Fuel Cost 673.07 1,014.82 1,222.48 1,383.44
Employee Cost 288.75 365.20 2,305.81 2,361.48
Other Manufacturing Expenses 194.03 249.60 2,127.48 2,419.89
Cost of Goods Sold 10,542.32 13,045.48 14,224.48 14,521.26
Gross Profit 4,636.97 6,411.16 12,619.05 12,236.34
Gross Profit Margin %
30.55
32.95
47.01 45.73
Operating Profit 2,861.17 4,273.56 9,176.44 8,905.59
Operating Profit %
18.85 21.96 34.18 33.28
Profit before Interest 2,252.70 4,747.81 9,779.51 10,146.67
Profit before Interest % 14.84 24.40 36.43 37.92
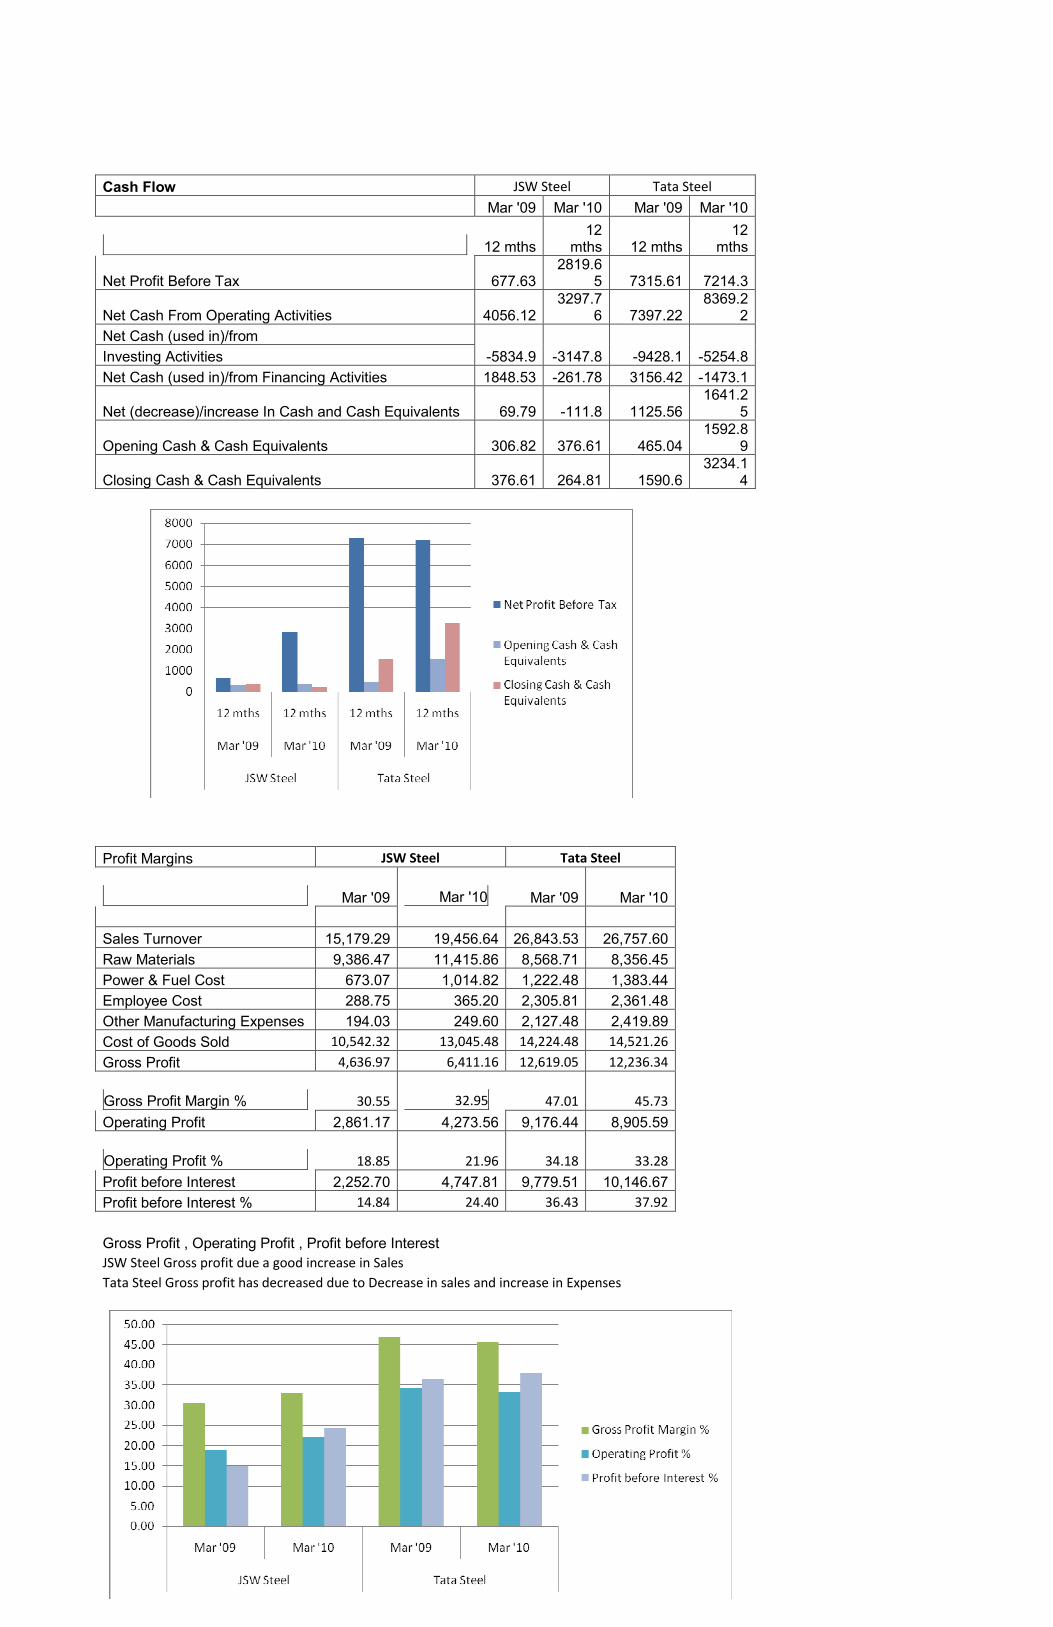
Gross Profit , Operating Profit , Profit before Interest
JSW Steel Gross profit due a good increase in Sales
Tata Steel Gross profit has decreased due to Decrease in sales and increase in Expenses
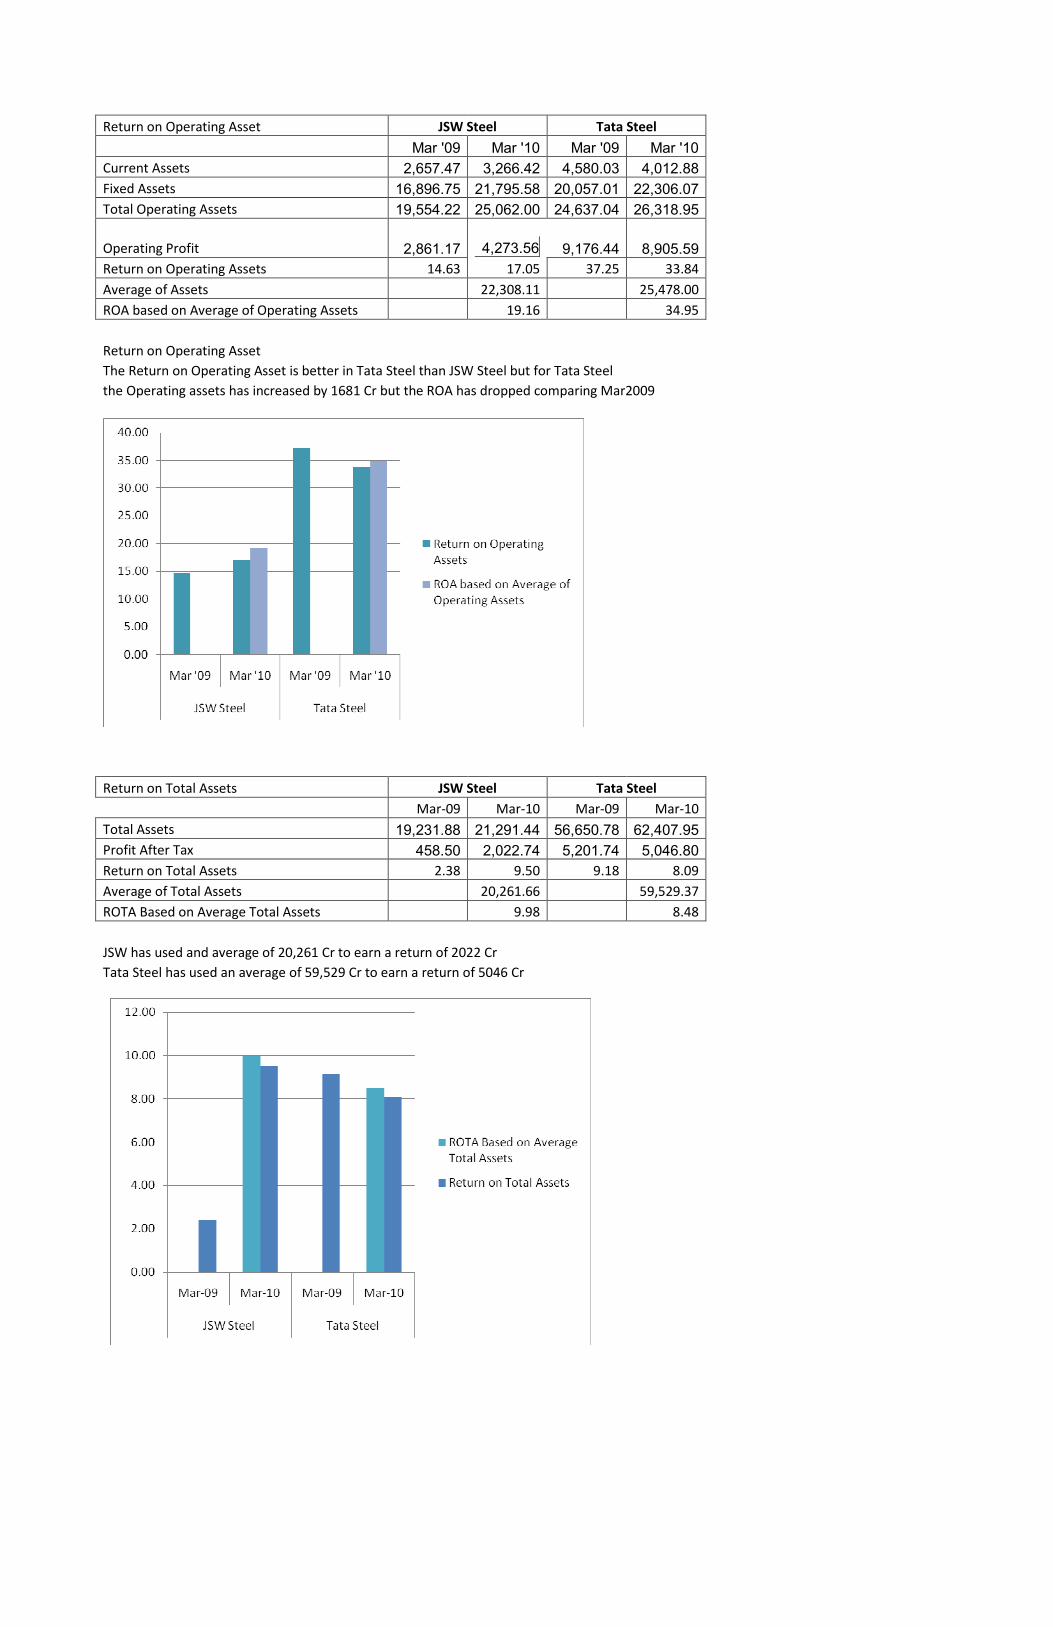
Return on Operating Asset JSW Steel Tata Steel
Mar '09 Mar '10 Mar '09 Mar '10 Current Assets 2,657.47 3,266.42 4,580.03 4,012.88 Fixed Assets 16,896.75 21,795.58 20,057.01 22,306.07 Total Operating Assets 19,554.22 25,062.00 24,637.04 26,318.95
Operating Profit 2,861.17
4,273.56
9,176.44 8,905.59 Return on Operating Assets 14.63 17.05 37.25 33.84
Average of Assets 22,308.11 25,478.00
ROA based on Average of Operating Assets 19.16 34.95
Return on Operating Asset
The Return on Operating Asset is better in Tata Steel than JSW Steel but for Tata Steel
the Operating assets has increased by 1681 Cr but the ROA has dropped comparing Mar2009
Return on Total Assets JSW Steel Tata Steel
Mar-09 Mar-10 Mar-09 Mar-10
Total Assets 19,231.88 21,291.44 56,650.78 62,407.95 Profit After Tax 458.50 2,022.74 5,201.74 5,046.80 Return on Total Assets 2.38 9.50 9.18 8.09
Average of Total Assets 20,261.66 59,529.37
ROTA Based on Average Total Assets 9.98 8.48
JSW has used and average of 20,261 Cr to earn a return of 2022 Cr
Tata Steel has used an average of 59,529 Cr to earn a return of 5046 Cr
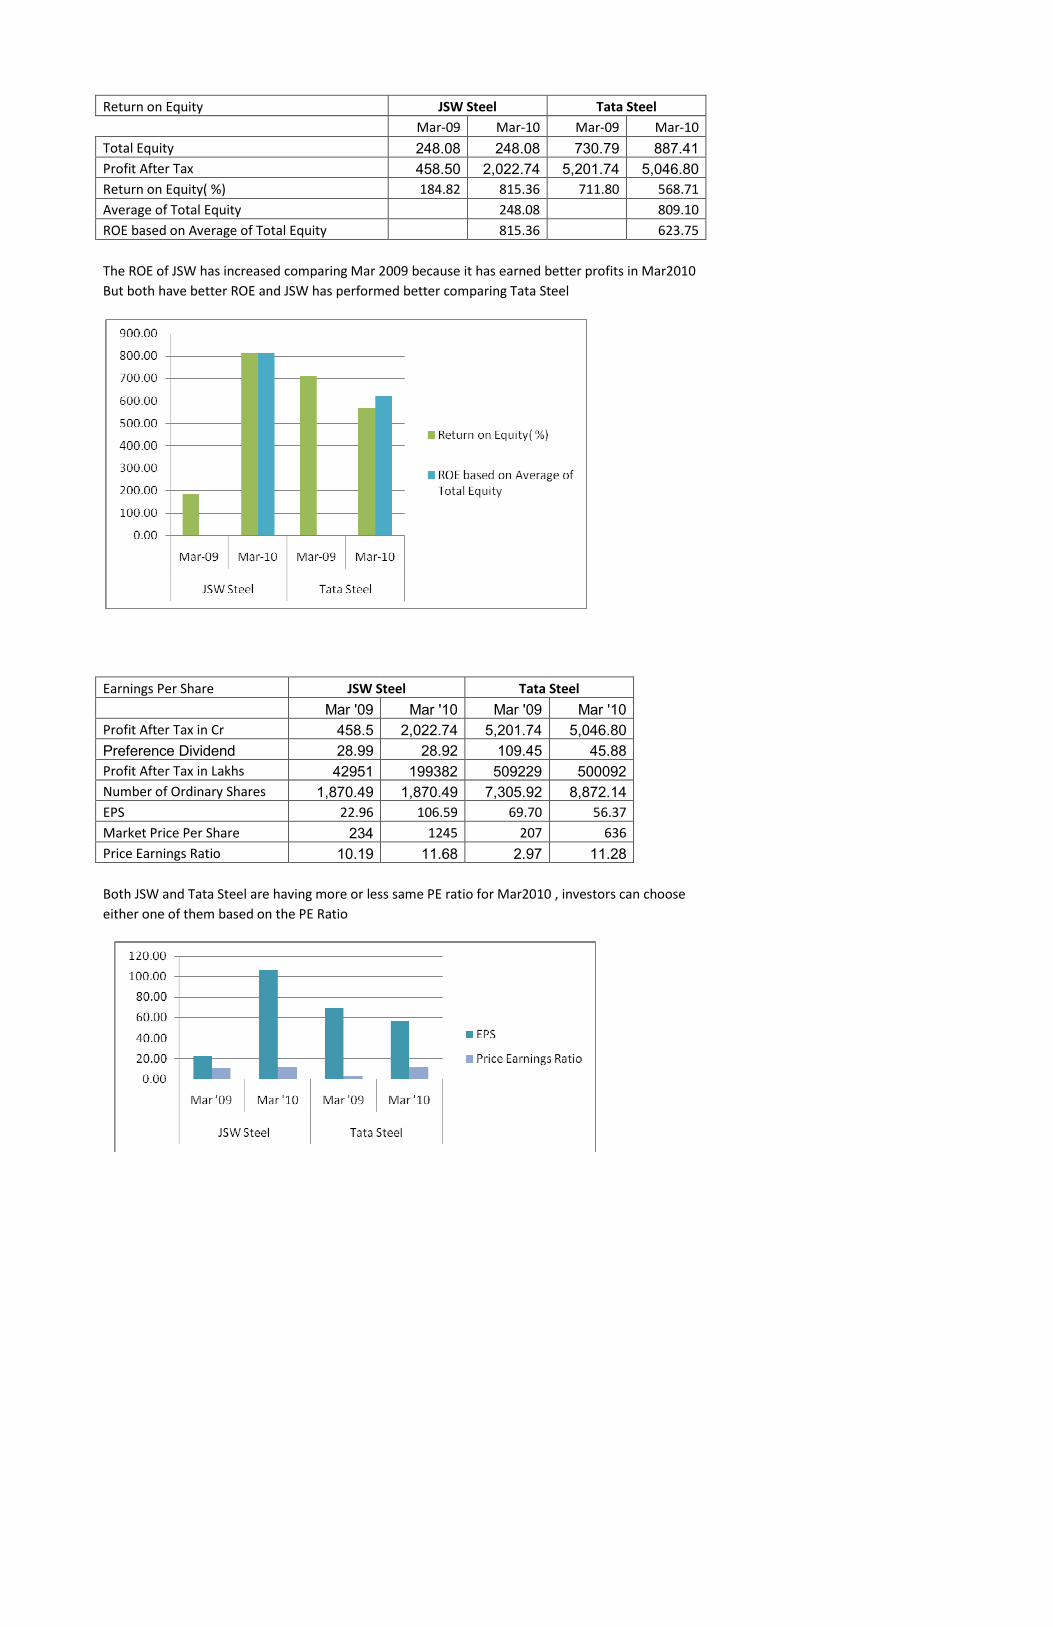
Return on Equity JSW Steel Tata Steel
Mar-09 Mar-10 Mar-09 Mar-10
Total Equity 248.08 248.08 730.79 887.41 Profit After Tax 458.50 2,022.74 5,201.74 5,046.80 Return on Equity( %) 184.82 815.36 711.80 568.71
Average of Total Equity 248.08 809.10
ROE based on Average of Total Equity 815.36 623.75
The ROE of JSW has increased comparing Mar 2009 because it has earned better profits in Mar2010
But both have better ROE and JSW has performed better comparing Tata Steel
Earnings Per Share JSW Steel Tata Steel
Mar '09 Mar '10 Mar '09 Mar '10 Profit After Tax in Cr 458.5 2,022.74 5,201.74 5,046.80 Preference Dividend 28.99 28.92 109.45 45.88 Profit After Tax in Lakhs 42951 199382 509229 500092 Number of Ordinary Shares 1,870.49 1,870.49 7,305.92 8,872.14 EPS 22.96 106.59 69.70 56.37
Market Price Per Share 234 1245 207 636
Price Earnings Ratio 10.19 11.68 2.97 11.28
Both JSW and Tata Steel are having more or less same PE ratio for Mar2010 , investors can choose
either one of them based on the PE Ratio
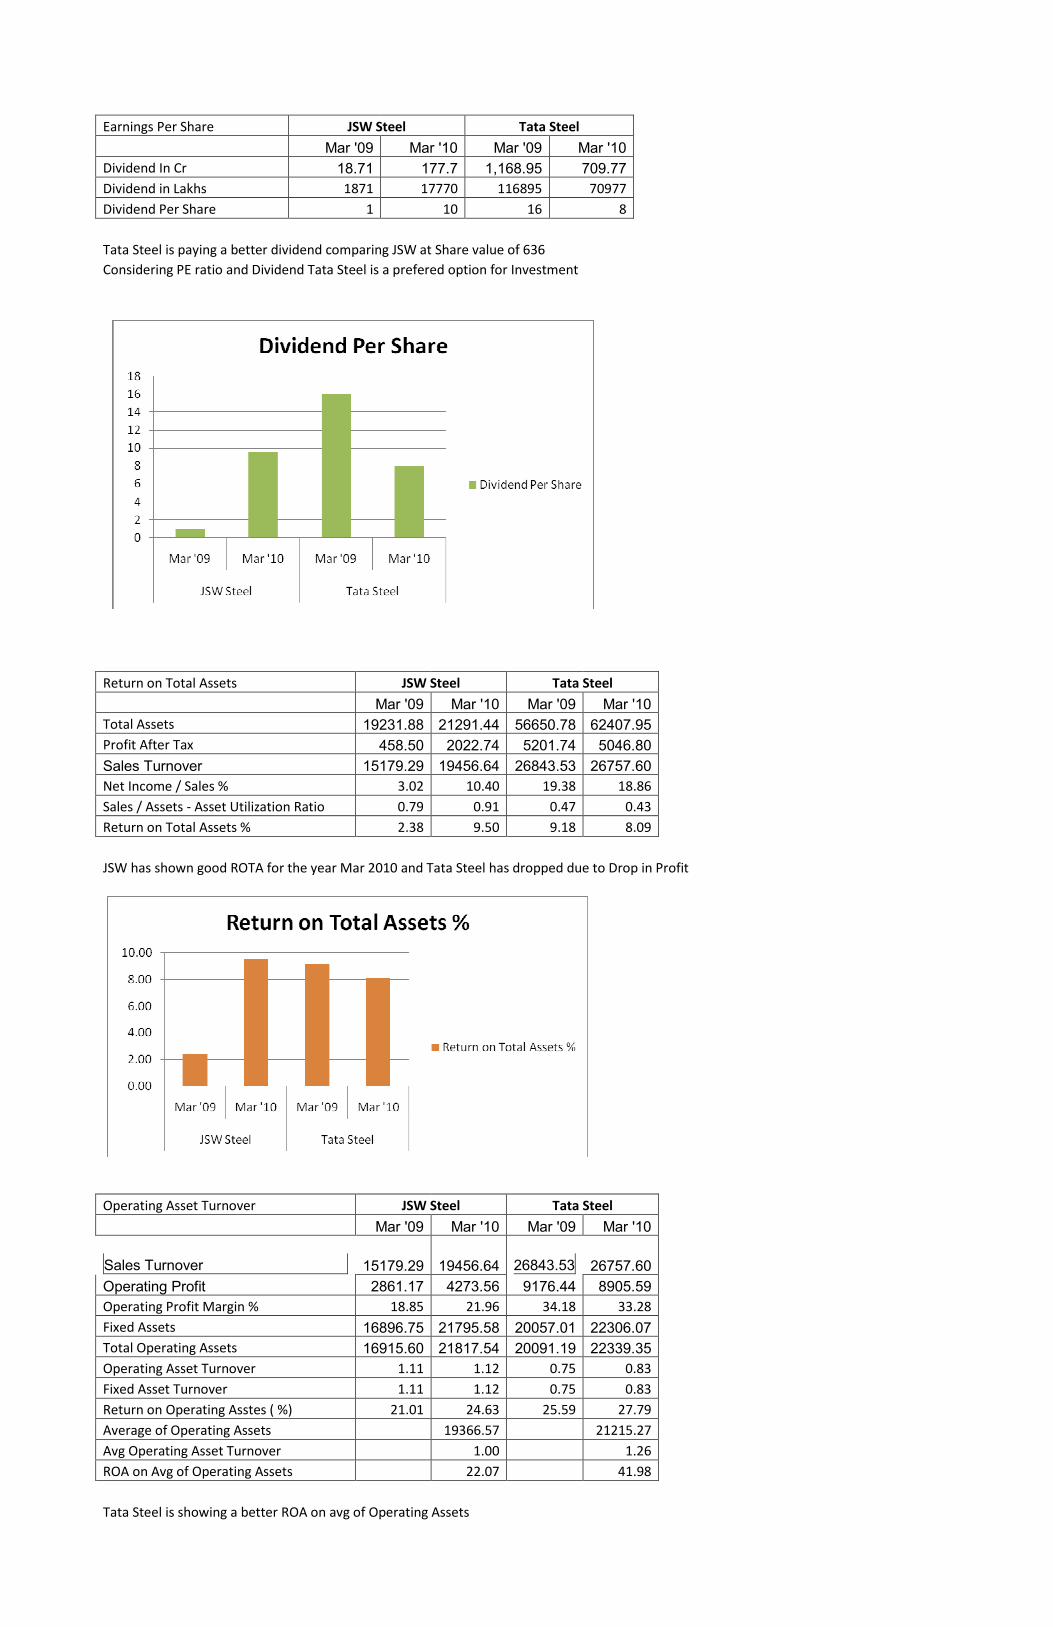
Earnings Per Share JSW Steel Tata Steel
Mar '09 Mar '10 Mar '09 Mar '10 Dividend In Cr 18.71 177.7 1,168.95 709.77 Dividend in Lakhs 1871 17770 116895 70977
Dividend Per Share 1 10 16 8
Tata Steel is paying a better dividend comparing JSW at Share value of 636
Considering PE ratio and Dividend Tata Steel is a prefered option for Investment
Return on Total Assets JSW Steel Tata Steel
Mar '09 Mar '10 Mar '09 Mar '10 Total Assets 19231.88 21291.44 56650.78 62407.95 Profit After Tax 458.50 2022.74 5201.74 5046.80 Sales Turnover 15179.29 19456.64 26843.53 26757.60 Net Income / Sales % 3.02 10.40 19.38 18.86
Sales / Assets - Asset Utilization Ratio 0.79 0.91 0.47 0.43
Return on Total Assets % 2.38 9.50 9.18 8.09
JSW has shown good ROTA for the year Mar 2010 and Tata Steel has dropped due to Drop in Profit
Operating Asset Turnover JSW Steel Tata Steel
Mar '09 Mar '10 Mar '09 Mar '10
Sales Turnover
15179.29 19456.64
26843.53
26757.60 Operating Profit 2861.17 4273.56 9176.44 8905.59 Operating Profit Margin % 18.85 21.96 34.18 33.28
Fixed Assets 16896.75 21795.58 20057.01 22306.07 Total Operating Assets 16915.60 21817.54 20091.19 22339.35 Operating Asset Turnover 1.11 1.12 0.75 0.83
Fixed Asset Turnover 1.11 1.12 0.75 0.83
Return on Operating Asstes ( %) 21.01 24.63 25.59 27.79
Average of Operating Assets 19366.57 21215.27
Avg Operating Asset Turnover 1.00 1.26
ROA on Avg of Operating Assets 22.07 41.98
Tata Steel is showing a better ROA on avg of Operating Assets
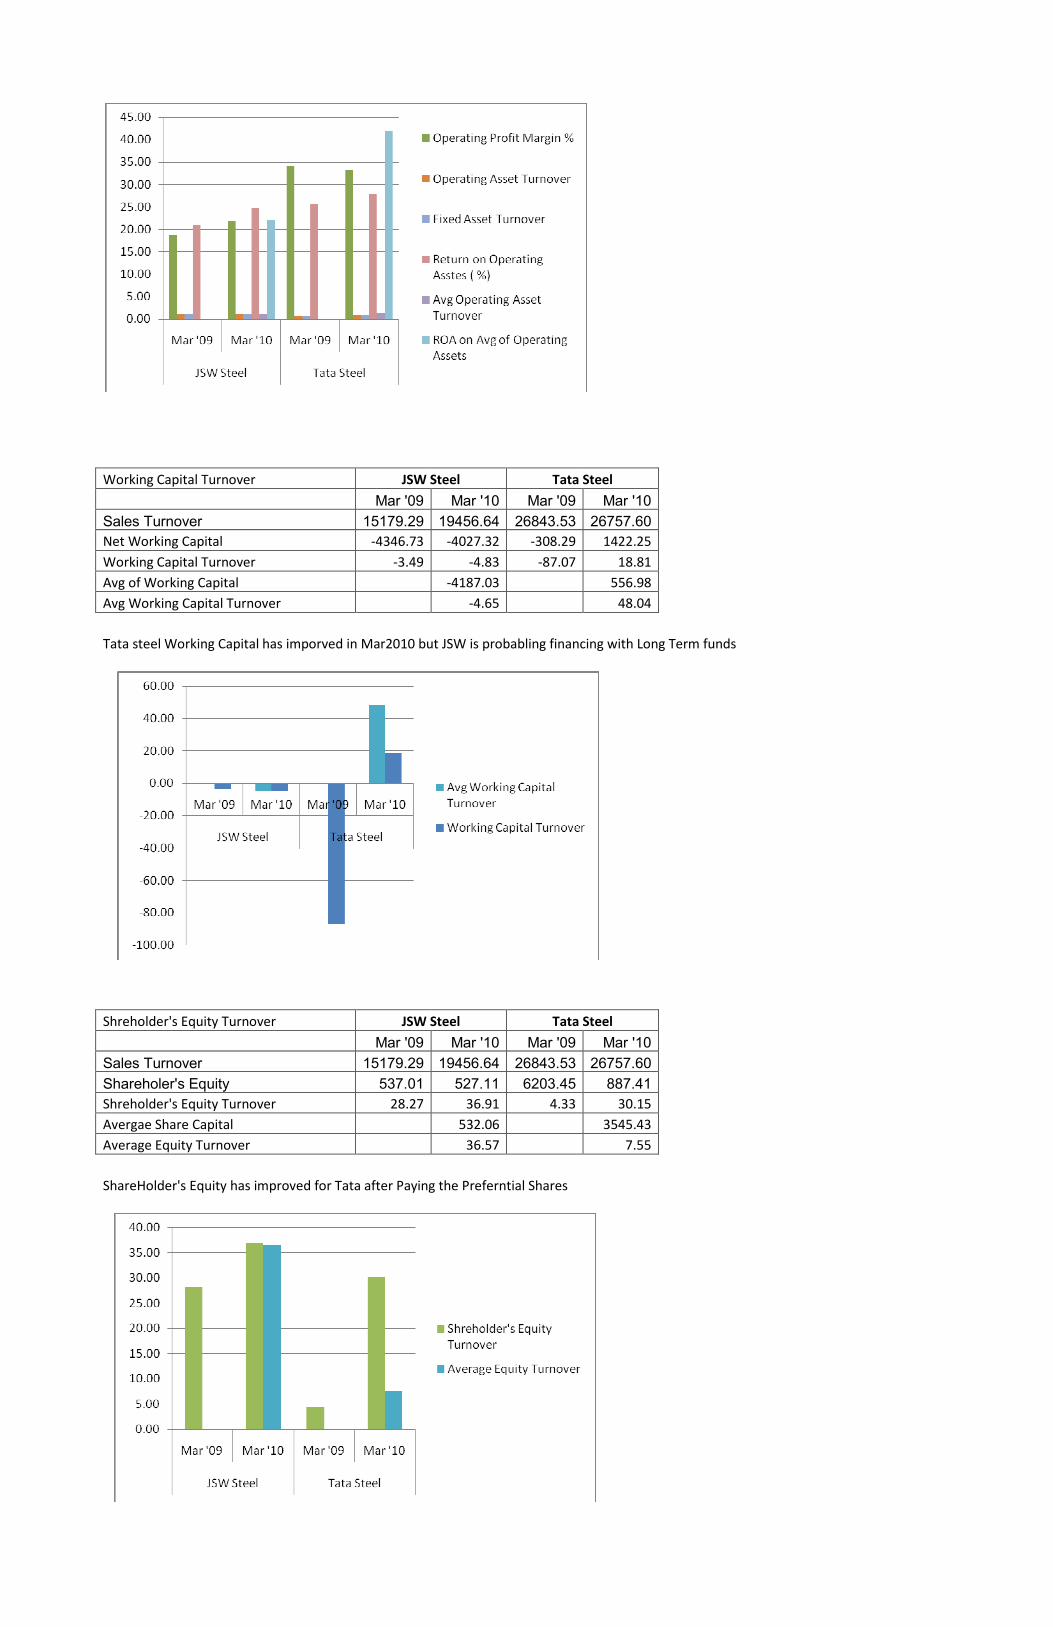
Working Capital Turnover JSW Steel Tata Steel
Mar '09 Mar '10 Mar '09 Mar '10 Sales Turnover 15179.29 19456.64 26843.53 26757.60 Net Working Capital -4346.73 -4027.32 -308.29 1422.25
Working Capital Turnover -3.49 -4.83 -87.07 18.81
Avg of Working Capital -4187.03 556.98
Avg Working Capital Turnover -4.65 48.04
Tata steel Working Capital has imporved in Mar2010 but JSW is probabling financing with Long Term funds
Shreholder's Equity Turnover JSW Steel Tata Steel
Mar '09 Mar '10 Mar '09 Mar '10 Sales Turnover 15179.29 19456.64 26843.53 26757.60 Shareholer's Equity 537.01 527.11 6203.45 887.41 Shreholder's Equity Turnover 28.27 36.91 4.33 30.15
Avergae Share Capital 532.06 3545.43
Average Equity Turnover 36.57 7.55
ShareHolder's Equity has improved for Tata after Paying the Preferntial Shares
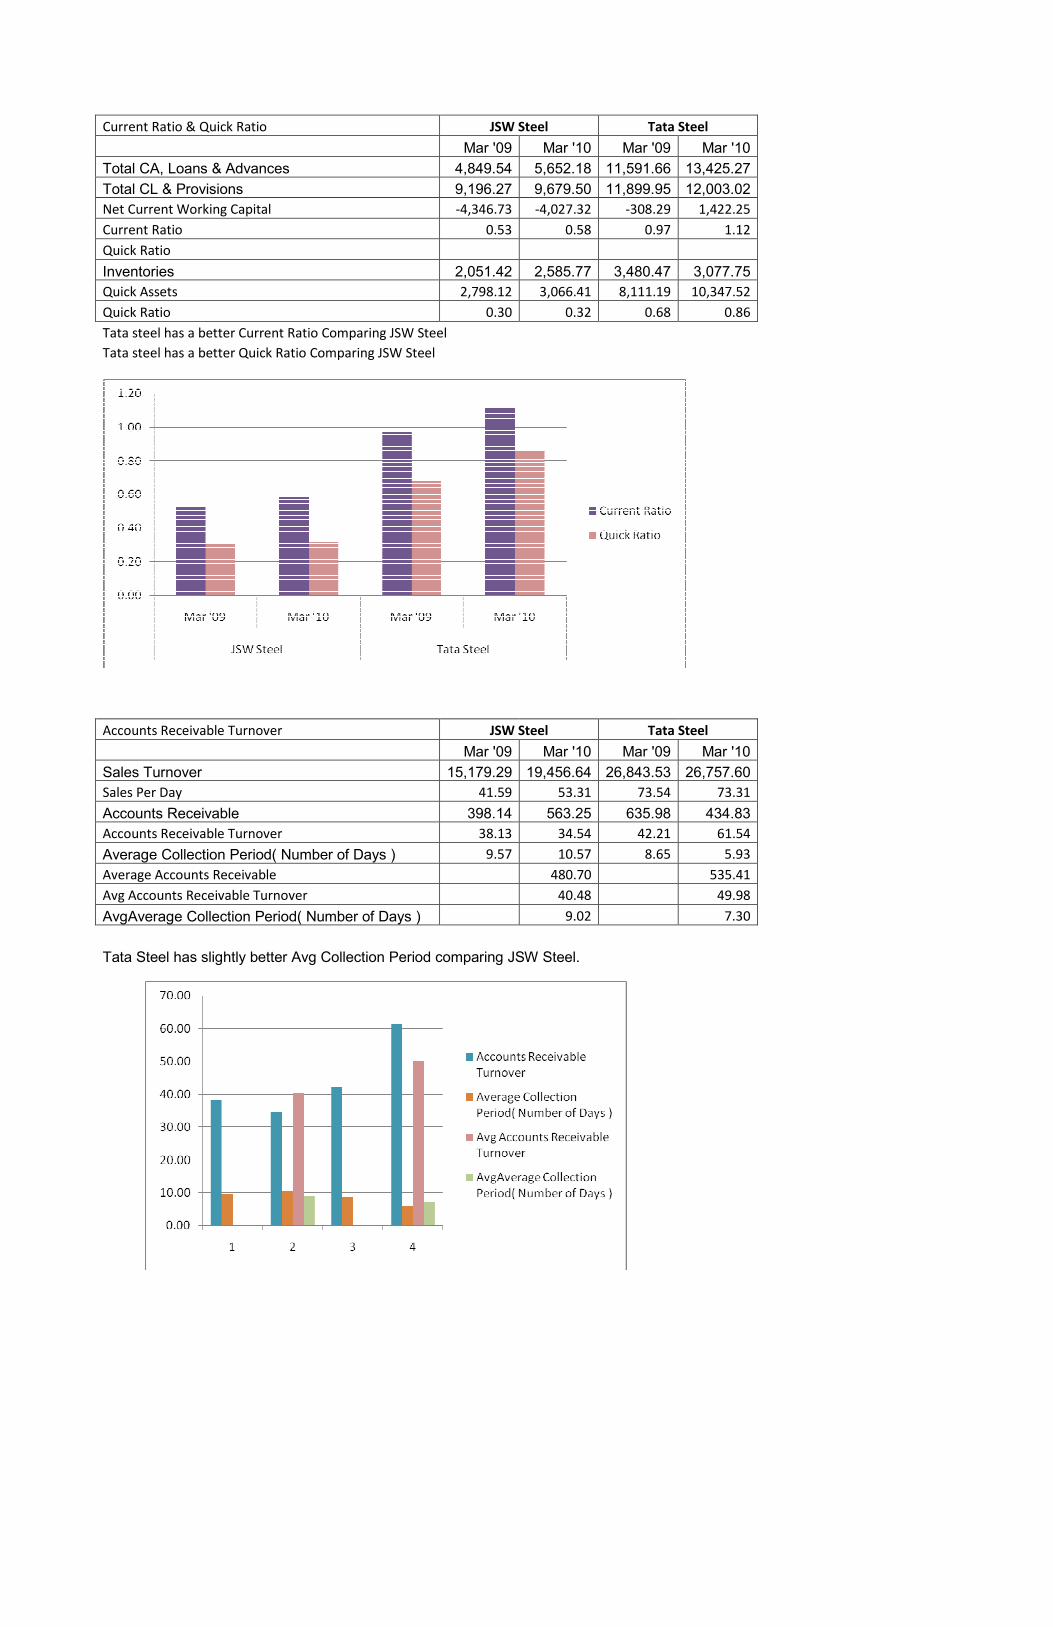
Current Ratio & Quick Ratio JSW Steel Tata Steel
Mar '09 Mar '10 Mar '09 Mar '10 Total CA, Loans & Advances 4,849.54 5,652.18 11,591.66 13,425.27 Total CL & Provisions 9,196.27 9,679.50 11,899.95 12,003.02 Net Current Working Capital -4,346.73 -4,027.32 -308.29 1,422.25
Current Ratio 0.53 0.58 0.97 1.12
Quick Ratio
Inventories 2,051.42 2,585.77 3,480.47 3,077.75 Quick Assets 2,798.12 3,066.41 8,111.19 10,347.52
Quick Ratio 0.30 0.32 0.68 0.86
Tata steel has a better Current Ratio Comparing JSW Steel
Tata steel has a better Quick Ratio Comparing JSW Steel
Accounts Receivable Turnover JSW Steel Tata Steel
Mar '09 Mar '10 Mar '09 Mar '10 Sales Turnover 15,179.29 19,456.64 26,843.53 26,757.60 Sales Per Day 41.59 53.31 73.54 73.31
Accounts Receivable 398.14 563.25 635.98 434.83 Accounts Receivable Turnover 38.13 34.54 42.21 61.54
Average Collection Period( Number of Days ) 9.57 10.57 8.65 5.93
Average Accounts Receivable 480.70 535.41
Avg Accounts Receivable Turnover 40.48 49.98
AvgAverage Collection Period( Number of Days ) 9.02 7.30
Tata Steel has slightly better Avg Collection Period comparing JSW Steel.
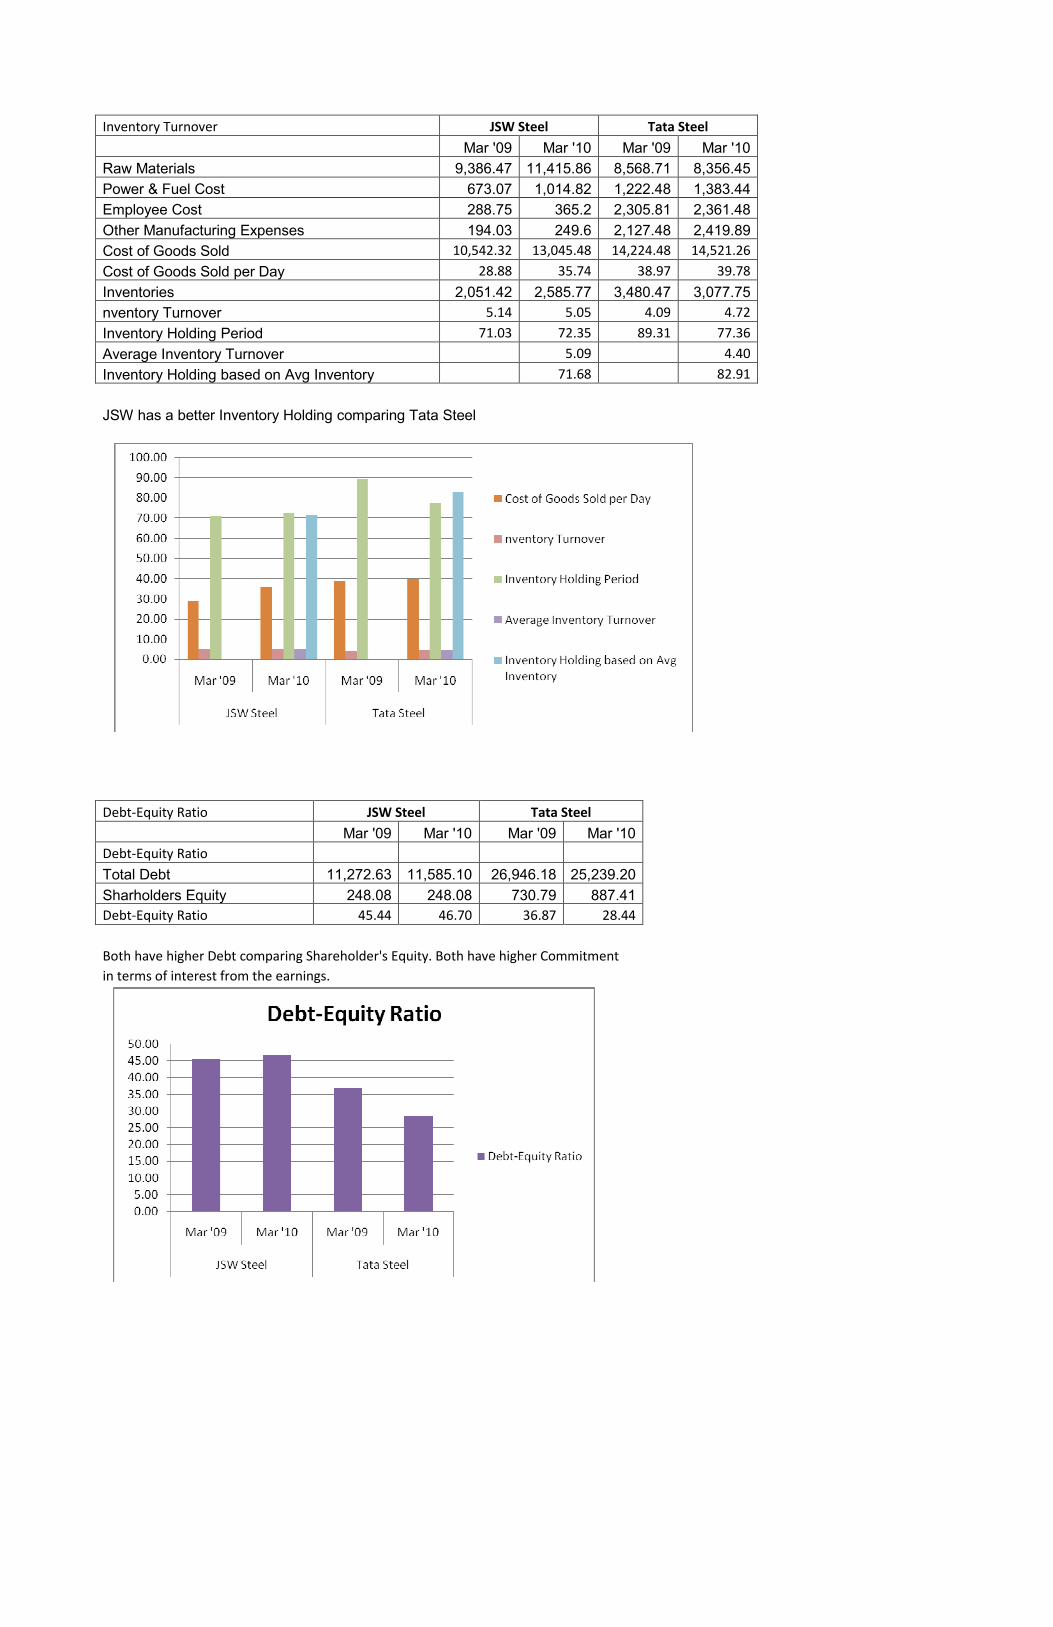
Inventory Turnover JSW Steel Tata Steel
Mar '09 Mar '10 Mar '09 Mar '10 Raw Materials 9,386.47 11,415.86 8,568.71 8,356.45 Power & Fuel Cost 673.07 1,014.82 1,222.48 1,383.44 Employee Cost 288.75 365.2 2,305.81 2,361.48 Other Manufacturing Expenses 194.03 249.6 2,127.48 2,419.89 Cost of Goods Sold 10,542.32 13,045.48 14,224.48 14,521.26
Cost of Goods Sold per Day 28.88 35.74 38.97 39.78
Inventories 2,051.42 2,585.77 3,480.47 3,077.75 nventory Turnover 5.14 5.05 4.09 4.72
Inventory Holding Period 71.03 72.35 89.31 77.36
Average Inventory Turnover 5.09 4.40
Inventory Holding based on Avg Inventory 71.68 82.91
JSW has a better Inventory Holding comparing Tata Steel
Debt-Equity Ratio JSW Steel Tata Steel
Mar '09 Mar '10 Mar '09 Mar '10 Debt-Equity Ratio
Total Debt 11,272.63 11,585.10 26,946.18 25,239.20 Sharholders Equity 248.08 248.08 730.79 887.41 Debt-Equity Ratio 45.44 46.70 36.87 28.44
Both have higher Debt comparing Shareholder's Equity. Both have higher Commitment
in terms of interest from the earnings.
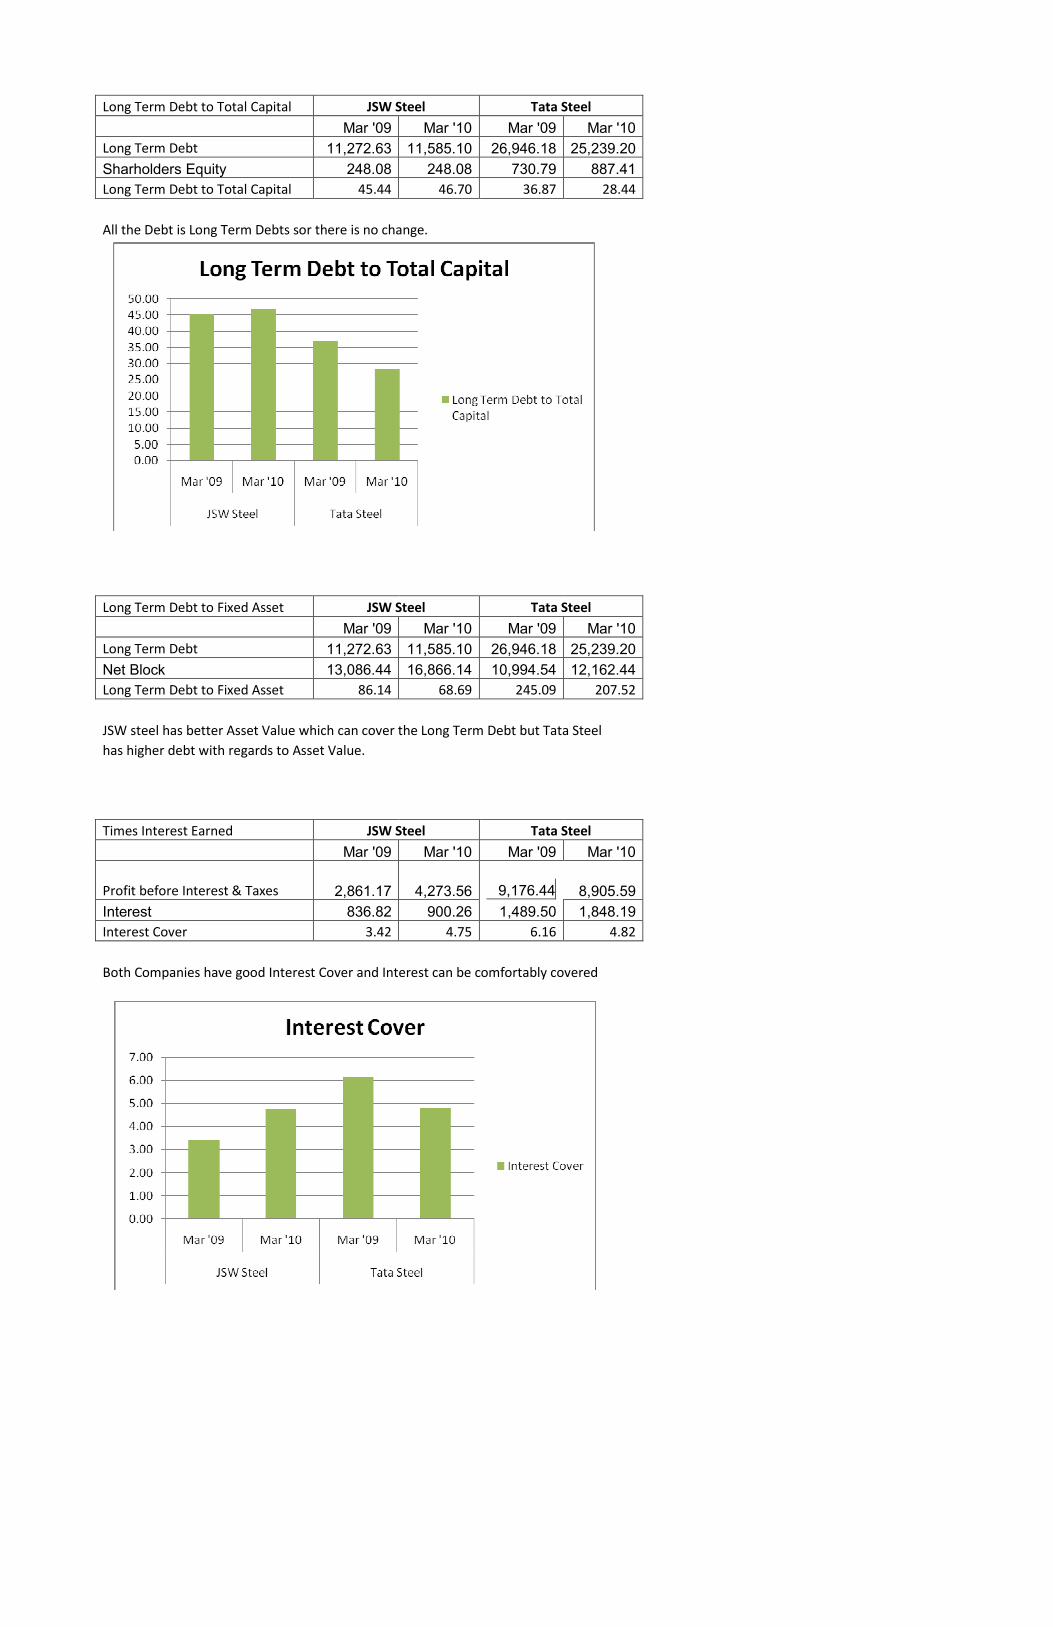
Long Term Debt to Total Capital JSW Steel Tata Steel
Mar '09 Mar '10 Mar '09 Mar '10 Long Term Debt 11,272.63 11,585.10 26,946.18 25,239.20 Sharholders Equity 248.08 248.08 730.79 887.41 Long Term Debt to Total Capital 45.44 46.70 36.87 28.44
All the Debt is Long Term Debts sor there is no change.
Long Term Debt to Fixed Asset JSW Steel Tata Steel
Mar '09 Mar '10 Mar '09 Mar '10 Long Term Debt 11,272.63 11,585.10 26,946.18 25,239.20 Net Block 13,086.44 16,866.14 10,994.54 12,162.44 Long Term Debt to Fixed Asset 86.14 68.69 245.09 207.52
JSW steel has better Asset Value which can cover the Long Term Debt but Tata Steel
has higher debt with regards to Asset Value.
Times Interest Earned JSW Steel Tata Steel
Mar '09 Mar '10 Mar '09 Mar '10
Profit before Interest & Taxes 2,861.17 4,273.56
9,176.44
8,905.59 Interest 836.82 900.26 1,489.50 1,848.19 Interest Cover 3.42 4.75 6.16 4.82
Both Companies have good Interest Cover and Interest can be comfortably covered
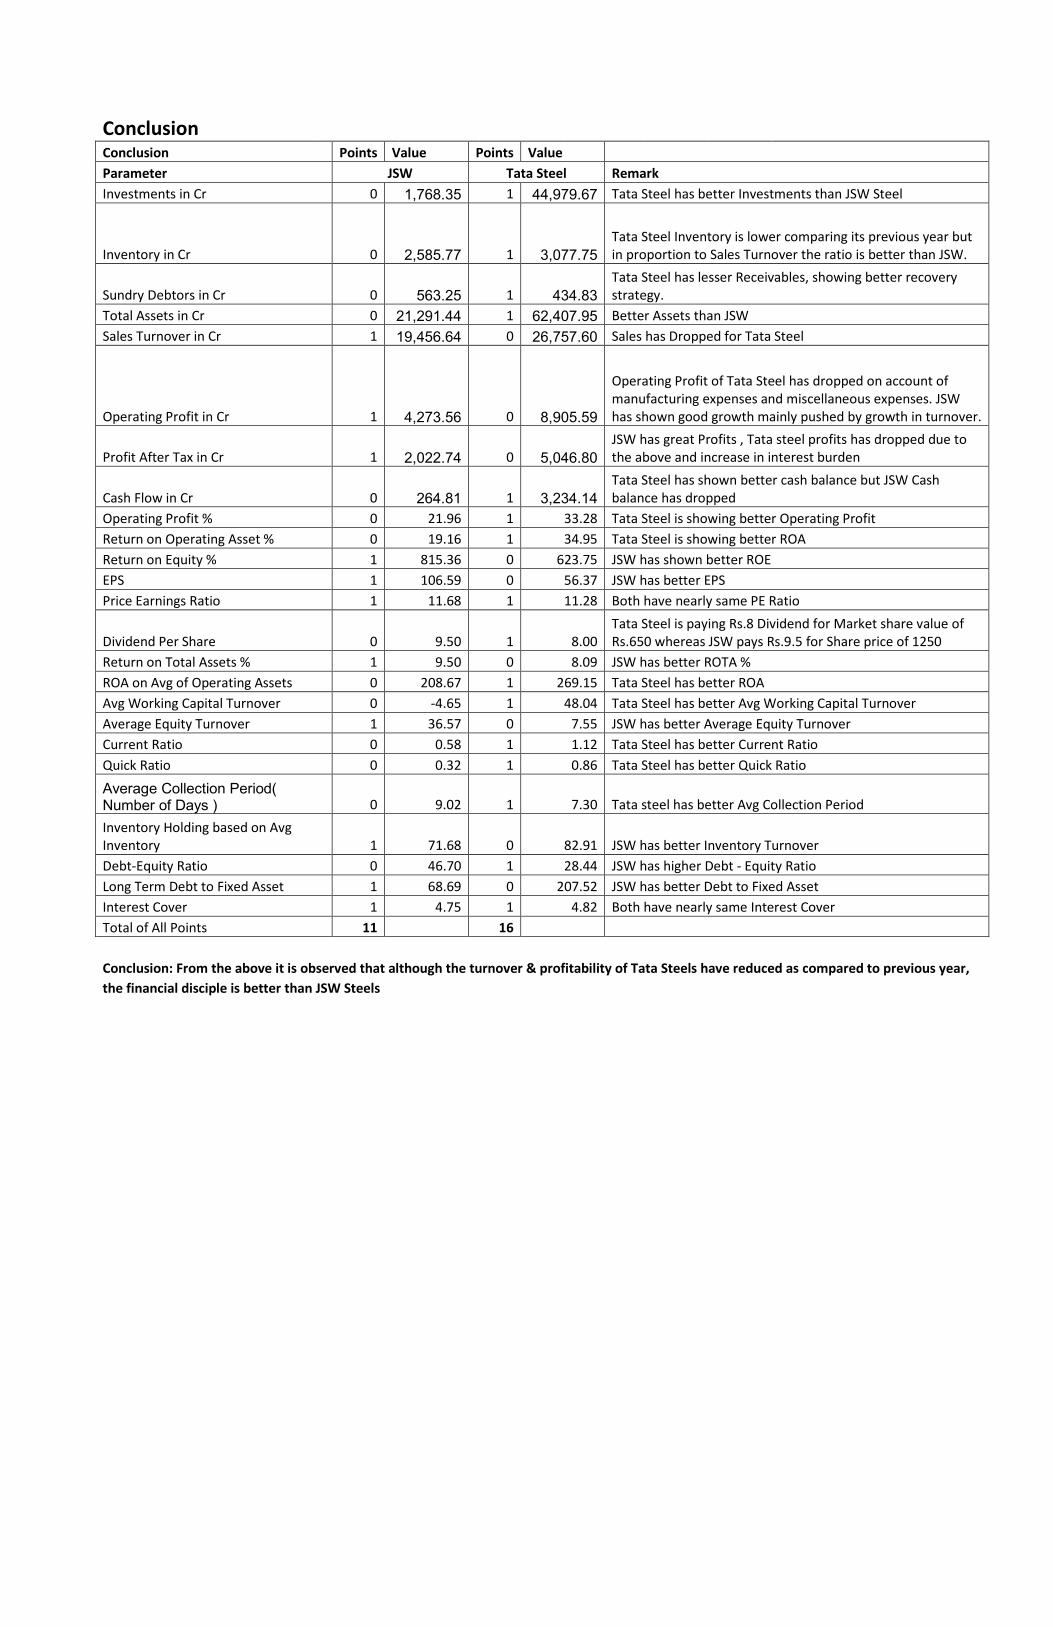
Conclusion Conclusion Points Value Points Value
Parameter JSW Tata Steel Remark
Investments in Cr 0 1,768.35 1 44,979.67 Tata Steel has better Investments than JSW Steel
Inventory in Cr 0 2,585.77 1 3,077.75
Tata Steel Inventory is lower comparing its previous year but
in proportion to Sales Turnover the ratio is better than JSW.
Sundry Debtors in Cr 0 563.25 1 434.83
Tata Steel has lesser Receivables, showing better recovery
strategy.
Total Assets in Cr 0 21,291.44 1 62,407.95 Better Assets than JSW
Sales Turnover in Cr 1 19,456.64 0 26,757.60 Sales has Dropped for Tata Steel
Operating Profit in Cr 1 4,273.56 0 8,905.59
Operating Profit of Tata Steel has dropped on account of
manufacturing expenses and miscellaneous expenses. JSW
has shown good growth mainly pushed by growth in turnover.
Profit After Tax in Cr 1 2,022.74 0 5,046.80
JSW has great Profits , Tata steel profits has dropped due to
the above and increase in interest burden
Cash Flow in Cr 0 264.81 1 3,234.14
Tata Steel has shown better cash balance but JSW Cash
balance has dropped
Operating Profit % 0 21.96 1 33.28 Tata Steel is showing better Operating Profit
Return on Operating Asset % 0 19.16 1 34.95 Tata Steel is showing better ROA
Return on Equity % 1 815.36 0 623.75 JSW has shown better ROE
EPS 1 106.59 0 56.37 JSW has better EPS
Price Earnings Ratio 1 11.68 1 11.28 Both have nearly same PE Ratio
Dividend Per Share 0 9.50 1 8.00
Tata Steel is paying Rs.8 Dividend for Market share value of
Rs.650 whereas JSW pays Rs.9.5 for Share price of 1250
Return on Total Assets % 1 9.50 0 8.09 JSW has better ROTA %
ROA on Avg of Operating Assets 0 208.67 1 269.15 Tata Steel has better ROA
Avg Working Capital Turnover 0 -4.65 1 48.04 Tata Steel has better Avg Working Capital Turnover
Average Equity Turnover 1 36.57 0 7.55 JSW has better Average Equity Turnover
Current Ratio 0 0.58 1 1.12 Tata Steel has better Current Ratio
Quick Ratio 0 0.32 1 0.86 Tata Steel has better Quick Ratio
Average Collection Period( Number of Days ) 0 9.02 1 7.30 Tata steel has better Avg Collection Period
Inventory Holding based on Avg
Inventory 1 71.68 0 82.91 JSW has better Inventory Turnover
Debt-Equity Ratio 0 46.70 1 28.44 JSW has higher Debt - Equity Ratio
Long Term Debt to Fixed Asset 1 68.69 0 207.52 JSW has better Debt to Fixed Asset
Interest Cover 1 4.75 1 4.82 Both have nearly same Interest Cover
Total of All Points 11 16
Conclusion: From the above it is observed that although the turnover & profitability of Tata Steels have reduced as compared to previous year,
the financial disciple is better than JSW Steels


