
ESG Metrics and Tools for Investors
Presented by
Katherine Schrank, J.D. Founder and CEO of Sustainability Partners Inc. (SPI)

AGENDA
• What are ESG metrics?
• What key ESG issues raised during 2014 & 2015 proxy seasons?
• Benchmark results to show how ESG metrics raise new questions and insights for investors, and can proxy a company’s: o Efficient use of natural resources; o Preparedness to live in low carbon economy; o Ability to attract & retain the best and brightest?
• Key point: investors in the driver’s seat
January 23, 2015 Page # 2 SPI - It matters how we live and work together in this world.
WHAT ARE ESG METRICS?
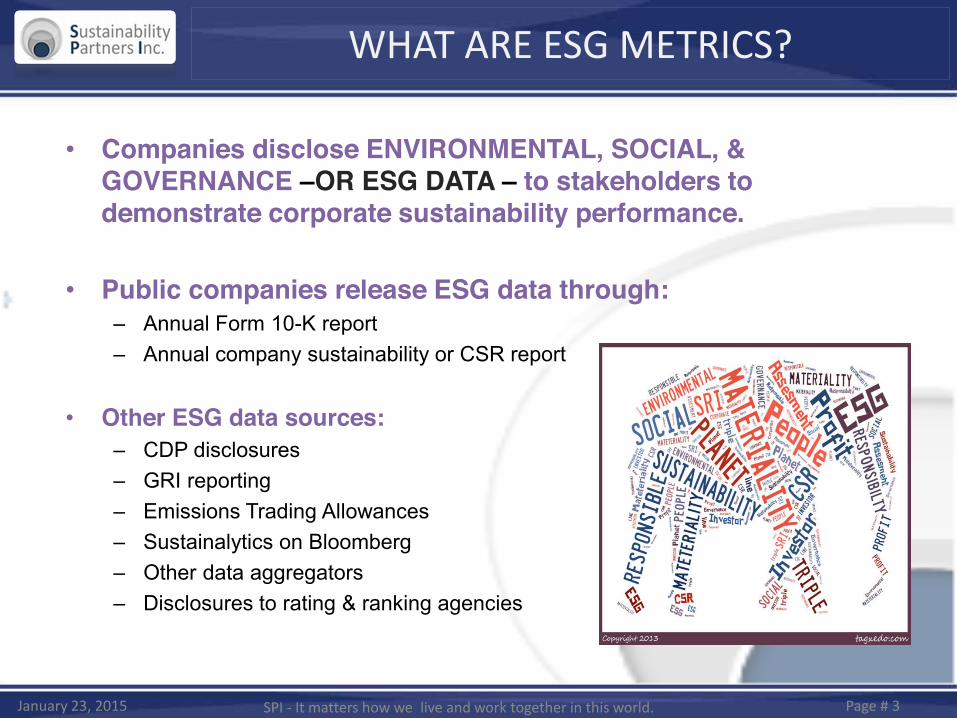
• Companies disclose ENVIRONMENTAL, SOCIAL, & GOVERNANCE –OR ESG DATA – to stakeholders to demonstrate corporate sustainability performance.
• Public companies release ESG data through: – Annual Form 10-K report – Annual company sustainability or CSR report
• Other ESG data sources:
– CDP disclosures – GRI reporting – Emissions Trading Allowances – Sustainalytics on Bloomberg – Other data aggregators – Disclosures to rating & ranking agencies
January 23, 2015 SPI - It matters how we live and work together in this world. Page # 3
BLOOMBERG IS A ESG DATA AGGREGATOR
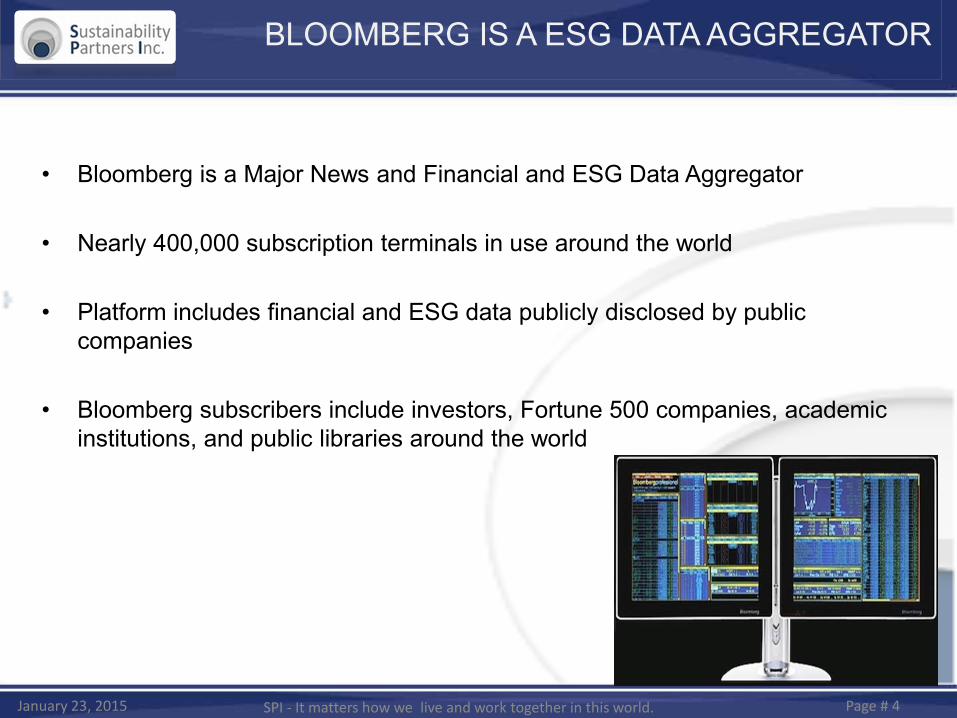
• Bloomberg is a Major News and Financial and ESG Data Aggregator
• Nearly 400,000 subscription terminals in use around the world
• Platform includes financial and ESG data publicly disclosed by public companies
• Bloomberg subscribers include investors, Fortune 500 companies, academic institutions, and public libraries around the world
January 23, 2015 SPI - It matters how we live and work together in this world. Page # 4

Environment
• GHG emissions/ Scope 1,2,3, and verified
• Climate change (CC) policy
• CC Risks/ Opportunities
• Water Usage/ Water Recycled
• Waste/Hazardous/ Waste Recycled
• Energy/Renewable Energy
• Environmental Fines/Spills
• $ Invested in Sustainable Ops.
Social
• No. employees • Women in work
force • Women in
management • TRIR/Fatalities • Community
spending
Governance
• Executive compensation
• Board independence
• No. Women Board • Board committees • Shareholder rights
CDP Data
• CDP score • Emissions Reported • Emissions Traded
Risks and opportunities
• Emissions reduction
• Governance and targets
• Fuel use
Ratios/Derived fields
• Bloomberg
disclosure scores • GHG intensity • Water Intensity • Energy intensity • Waste Intensity • % recycled material
in raw materials
January 23, 2015 SPI - It matters how we live and work together in this world. Page # 5
800 ESG METRICS ON BLOOMBERG PLATFORM
KEY ESG ISSUES RAISED DURING 2014 PROXY SEASON
• The Proxy Preview 2014 report (www.proxypreview.org ) – 40% of the 417 resolutions filed on environmental and social
issues were related to climate change and greenhouse gas (GHG) emissions.
– 33% of the 417 resolutions filed were related to political spending disclosures, where investors are looking for evidence that corporate political spending , words, and actions meet.
– Resolutions related to increasing women’s presence on the board and other human right issues made up most of the rest.
January 23, 2015 Page # 6 SPI - It matters how we live and work together in this world.

KEY ESG ISSUES BEING RAISED DURING THE 2015 PROXY SEASON
• 2015 proxy resolutions on environmental and social issues, according to the Ceres Investor Network, and ISS and Glass Lewis voting policy updates, primarily focus on: – GHG emissions, climate change proposals
• Followed by:
– Executive compensation – Sustainability reporting – Shareholder proxy voting policies – Political contributions – Director independence – Sustainability reporting
January 23, 2015 Page # 7 SPI - It matters how we live and work together in this world.

ESG DISCLOSURE TRENDS ASSIST DUE DILIGENCE
Page # 8
CHEMICAL COMPANIES ESG DISCLOSURE SCORES ESG Disclosure
Score Trend 2009 2010 2011 2012 2013
COMPANY A 26 41 29 31 38 Improving
COMPANY B 43 48 43 50 53 Improving
COMPANY C 37 46 44 50 49 Improving
COMPANY D 33 43 52 31 41 Improving
COMPANY E 15 29 33 37 38 Improving
COMPANY F 27 31 32 31 31 Slightly Improving
COMPANY G 22 24 26 24 23 Flat
AVERAGE 29 37 37 36 39 Improving
KEY: • COMPANY BENCHMARKED • Top Peer Disclosures
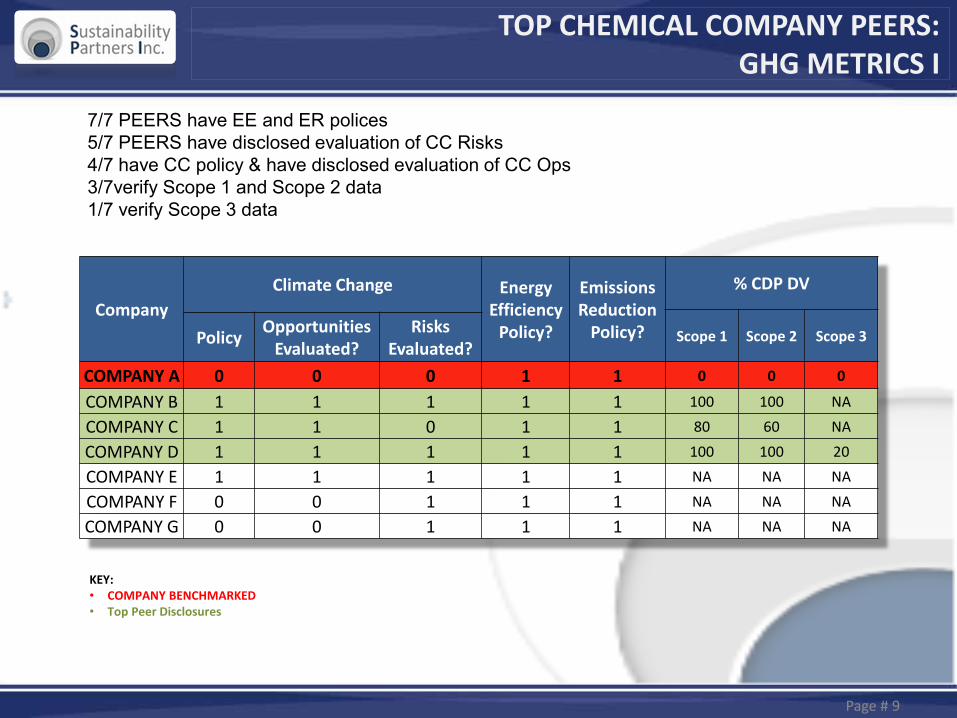
TOP CHEMICAL COMPANY PEERS: GHG METRICS I
Page # 9
Company Climate Change Energy
Efficiency Policy?
Emissions Reduction
Policy?
% CDP DV
Scope 1 Scope 2 Scope 3 Policy Opportunities Evaluated?
Risks Evaluated?
COMPANY A 0 0 0 1 1 0 0 0
COMPANY B 1 1 1 1 1 100 100 NA
COMPANY C 1 1 0 1 1 80 60 NA
COMPANY D 1 1 1 1 1 100 100 20
COMPANY E 1 1 1 1 1 NA NA NA
COMPANY F 0 0 1 1 1 NA NA NA
COMPANY G 0 0 1 1 1 NA NA NA
KEY: • COMPANY BENCHMARKED • Top Peer Disclosures
7/7 PEERS have EE and ER polices 5/7 PEERS have disclosed evaluation of CC Risks 4/7 have CC policy & have disclosed evaluation of CC Ops 3/7verify Scope 1 and Scope 2 data 1/7 verify Scope 3 data

TOP PEERS GHG METRICS II
Company GHG Emissions (A) GHG Intensity (B)
Total GHG Scope 1 Scope 2 Scope 3 Total GHG/Sales
Scope 1 GHG/Sales
COMPANY A 7,190 NA NA NA 887 NA COMPANY B 13,500 NA NA 2,800 1302 NA OMPANY C 1,310 680 630 NA 216 112
COMPANY D 18,505 13,561 4,944 3,173 518 379 COMPANY E 4,037 NA NA NA 1,042 NA COMPANY F 3,478 2,309 1169 NA 314 208 COMPANY G 5,500 NA NA NA 854 NA
AVERAGE 733 233
(A) Thousands of metric tons (B) Total GHG Emissions per sales (millions)
KEY: • COMPANY BENCHMARKED • Top Peer Disclosures
7/7 disclose Total GHG Emissions 7/7 have GHG Intensity metrics 3/7 disclose Scope 1 & Scope 2 emissions, and all 3 report Scope 1 exceeds Scope 2 emissions 3/7 have Scope 1 Intensity metric 2/7 disclose Scope 3 emissions, which < Scope 1

TOP PEERS KEY ENVIRONMENTAL METRICS I
Page # 11
Company Total
Electricity Used (A)
% Renewable Energy (A)
NOx Emissions (B)
SO2 Emissions (B)
VOC Emissions (B)
Total Water
Withdrawal (C)
Total Water Usage (C)
Water Recycled (C)
Water Intensity/Sales
COMPANY A 588 NA 11 22 0.01 NA NA NA NA COMPANY B 19,000 4 2 0 0.00 NA 52,100 94 4,369 COMPANY C 28,305 NA 4 NA 0.00 NA 67,500 NA 3,338 COMPANY D NA NA 156 NA 0.09 198,000 NA NA NA COMPANY E NA NA NA NA NA NA 118,000 NA 624 COMPANY F 3,137 NA NA NA NA NA NA NA NA
AVERAGE 2,777
(A) thousands of MWh
(B) thousands of metric tons (C) thousands of cubic metres
KEY: • COMPANY BENCHMARKED • Top Supplier Disclosures
4/6 disclose Total Electricity 4/6 disclose VOCs, Total Water Used & have Water Intensity metrics. 4/6 disclose NOx 2/6 disclose SOx, Total Water Withdrawn,Total Water Recycled, and % Renewable Energy Used
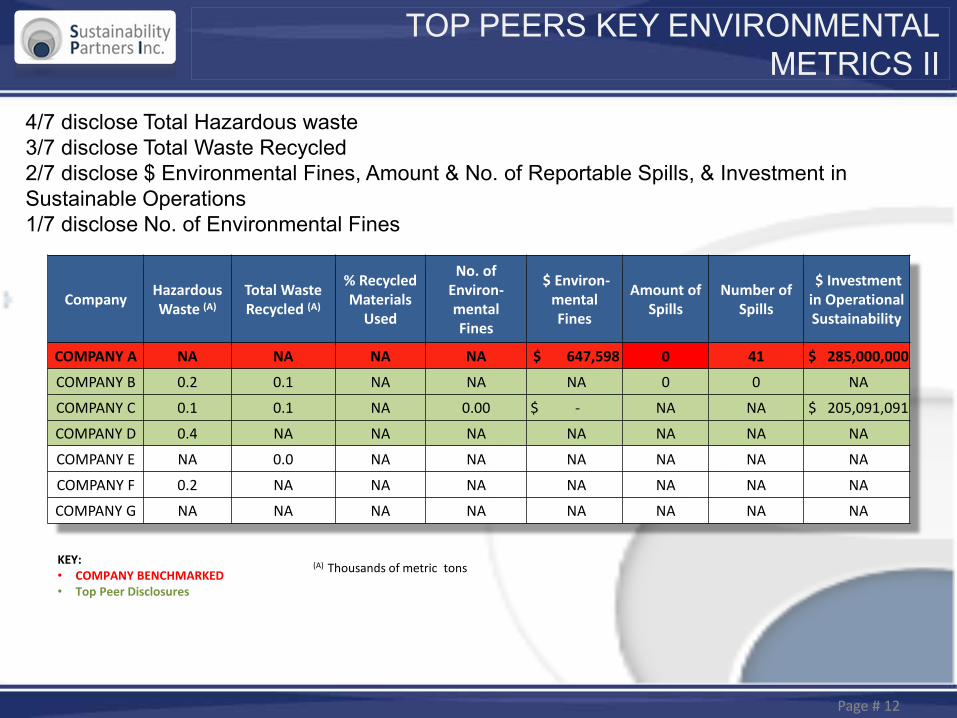
TOP PEERS KEY ENVIRONMENTAL METRICS II
Page # 12
Company Hazardous Waste (A)
Total Waste Recycled (A)
% Recycled Materials
Used
No. of Environ- mental Fines
$ Environ- mental Fines
Amount of Spills
Number of Spills
$ Investment in Operational Sustainability
COMPANY A NA NA NA NA $ 647,598 0 41 $ 285,000,000
COMPANY B 0.2 0.1 NA NA NA 0 0 NA
COMPANY C 0.1 0.1 NA 0.00 $ - NA NA $ 205,091,091
COMPANY D 0.4 NA NA NA NA NA NA NA
COMPANY E NA 0.0 NA NA NA NA NA NA
COMPANY F 0.2 NA NA NA NA NA NA NA
COMPANY G NA NA NA NA NA NA NA NA
(A) Thousands of metric tons KEY: • COMPANY BENCHMARKED • Top Peer Disclosures
4/7 disclose Total Hazardous waste 3/7 disclose Total Waste Recycled 2/7 disclose $ Environmental Fines, Amount & No. of Reportable Spills, & Investment in Sustainable Operations 1/7 disclose No. of Environmental Fines
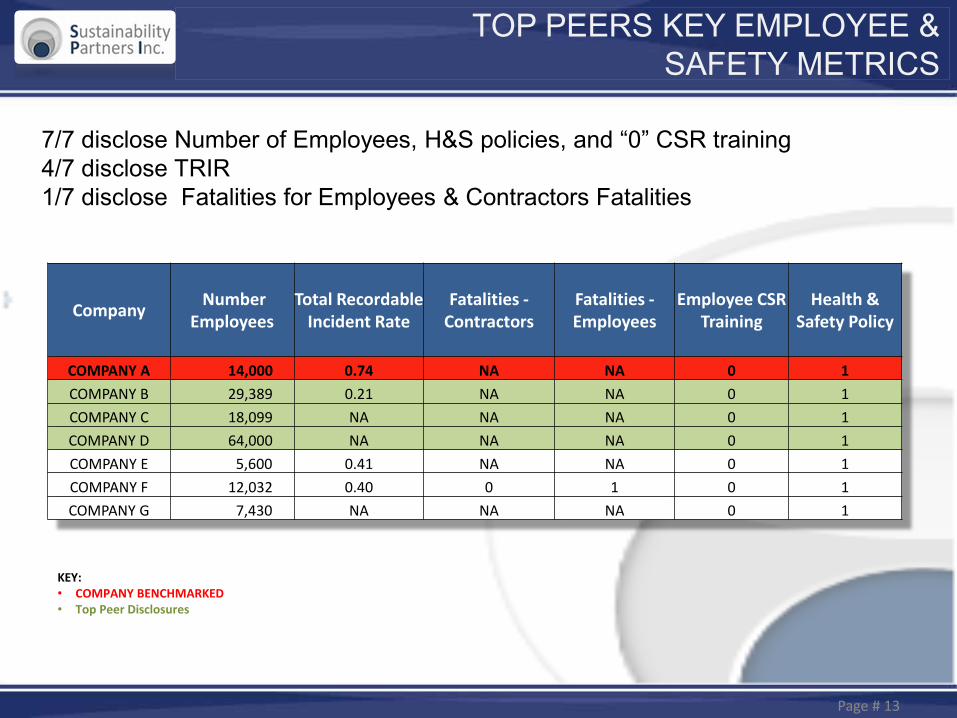
TOP PEERS KEY EMPLOYEE & SAFETY METRICS
Page # 13
Company Number Employees
Total Recordable Incident Rate
Fatalities -Contractors
Fatalities -Employees
Employee CSR Training
Health & Safety Policy
COMPANY A 14,000 0.74 NA NA 0 1 COMPANY B 29,389 0.21 NA NA 0 1 COMPANY C 18,099 NA NA NA 0 1 COMPANY D 64,000 NA NA NA 0 1 COMPANY E 5,600 0.41 NA NA 0 1 COMPANY F 12,032 0.40 0 1 0 1 COMPANY G 7,430 NA NA NA 0 1
KEY: • COMPANY BENCHMARKED • Top Peer Disclosures
7/7 disclose Number of Employees, H&S policies, and “0” CSR training 4/7 disclose TRIR 1/7 disclose Fatalities for Employees & Contractors Fatalities
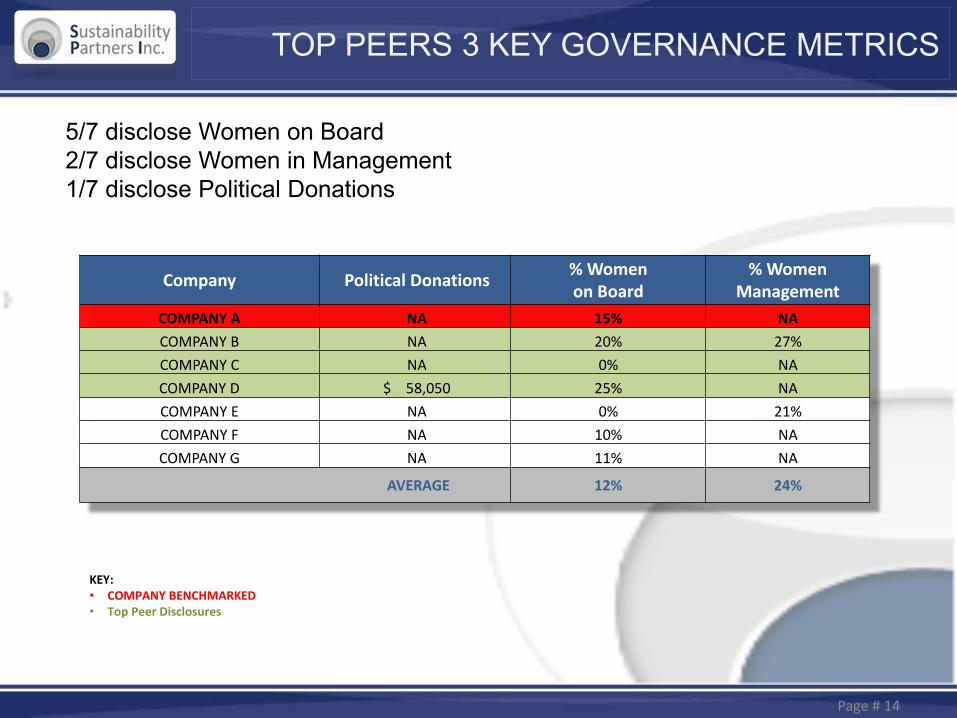
TOP PEERS 3 KEY GOVERNANCE METRICS
Page # 14
Company Political Donations % Women on Board
% Women Management
COMPANY A NA 15% NA COMPANY B NA 20% 27% COMPANY C NA 0% NA COMPANY D $ 58,050 25% NA COMPANY E NA 0% 21% COMPANY F NA 10% NA COMPANY G NA 11% NA
AVERAGE 12% 24%
KEY: • COMPANY BENCHMARKED • Top Peer Disclosures
5/7 disclose Women on Board 2/7 disclose Women in Management 1/7 disclose Political Donations
Contact Information
[email protected] LinkedIn Mobile: 630-363-1133 Twitter: SustainPartners SeekingAlpha Contributor
January 23, 2015 15 SPI - It matters how we live and work together in this world.
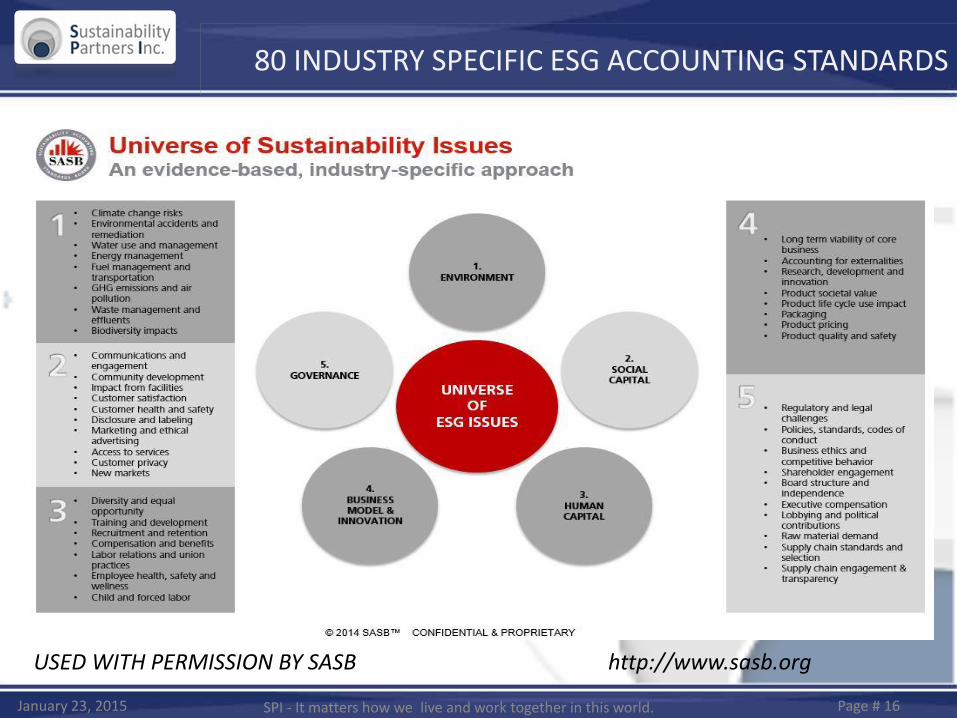
80 INDUSTRY SPECIFIC ESG ACCOUNTING STANDARDS
January 23, 2015 Page # 16 SPI - It matters how we live and work together in this world.
USED WITH PERMISSION BY SASB http://www.sasb.org
17
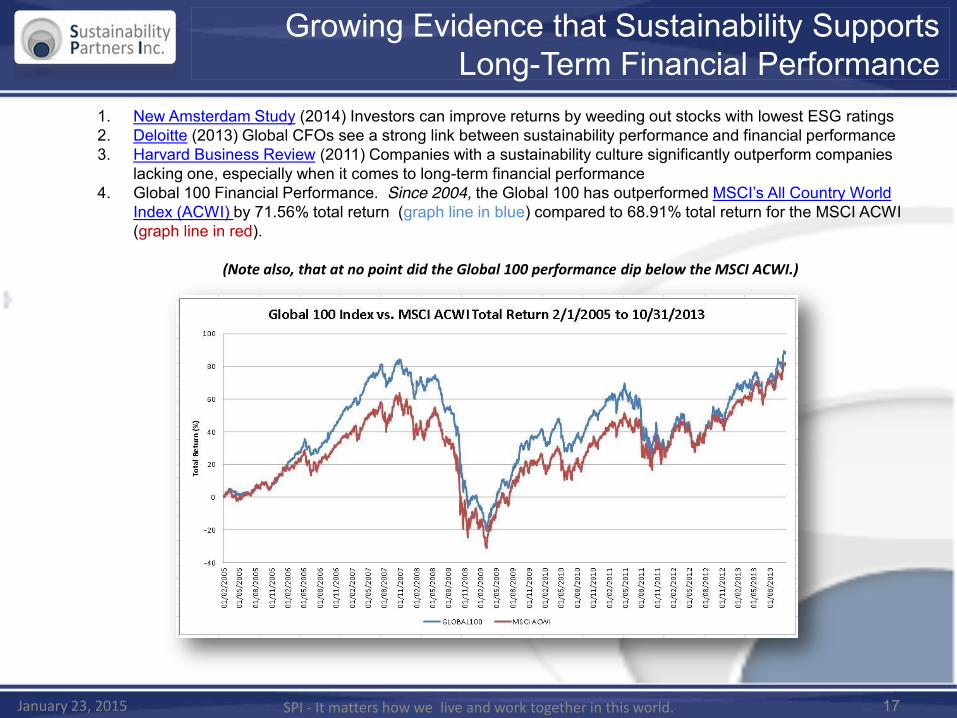
1. New Amsterdam Study (2014) Investors can improve returns by weeding out stocks with lowest ESG ratings 2. Deloitte (2013) Global CFOs see a strong link between sustainability performance and financial performance 3. Harvard Business Review (2011) Companies with a sustainability culture significantly outperform companies
lacking one, especially when it comes to long-term financial performance 4. Global 100 Financial Performance. Since 2004, the Global 100 has outperformed MSCI’s All Country World
Index (ACWI) by 71.56% total return (graph line in blue) compared to 68.91% total return for the MSCI ACWI (graph line in red).
(Note also, that at no point did the Global 100 performance dip below the MSCI ACWI.)
January 23, 2015
Growing Evidence that Sustainability Supports Long-Term Financial Performance
SPI - It matters how we live and work together in this world.


