
TD BANK GROUP • THIRD QUARTER 2016 • EARNINGS NEWS RELEASE Page 1
TD Bank Group Reports Third Quarter 2016 Results Earnings News Release • Three and Nine months ended July 31, 2016
THIRD QUARTER FINANCIAL HIGHLIGHTS, compared with the third quarter a year ago:
Reported diluted earnings per share were $1.24, compared with $1.19.
Adjusted diluted earnings per share were $1.27, compared with $1.20.
Reported net income was $2,358 million, compared with $2,266 million.
Adjusted net income was $2,416 million, compared with $2,285 million.
YEAR-TO-DATE FINANCIAL HIGHLIGHTS, nine months ended July 31, 2016, compared with the corresponding period a year ago:
Reported diluted earnings per share were $3.47, compared with $3.25.
Adjusted diluted earnings per share were $3.64, compared with $3.47.
Reported net income was $6,633 million, compared with $6,185 million.
Adjusted net income was $6,945 million, compared with $6,577 million.
THIRD QUARTER ADJUSTMENT (ITEMS OF NOTE)
The third quarter reported earnings figures included the following item of note:
Amortization of intangibles of $58 million after tax (3 cents per share), compared with $62 million after tax (3 cents per share) in the third quarter a
year ago.
TORONTO, August 25, 2016 – TD Bank Group ("TD" or the "Bank") today announced its financial results for the third quarter ending July 31, 2016, reflecting
growth in retail and wholesale earnings.
"TD's results demonstrate the strength of our diversified business model, with adjusted earnings of $2.4 billion, up 6% from the third quarter last year," said
Bharat Masrani, Group President and Chief Executive Officer. "Our performance reflects both organic growth and a focus on expense management."
Canadian Retail
Canadian Retail net income was $1.5 billion compared with $1.6 billion in the same quarter last year. Revenue grew 3% compared with the third quarter last year
and was more than offset by higher insurance claims largely due to the Fort McMurray wildfire, and a higher effective tax rate.
U.S. Retail
U.S. Retail net income was $788 million (US$609 million) this quarter compared with $674 million (US$543 million) on a reported basis and $650 million
(US$524 million) on an adjusted basis in the third quarter last year.
The U.S. Retail Bank, which excludes the Bank's investment in TD Ameritrade, generated net income of $663 million (US$512 million), an increase of 14%
(9% in U.S. dollars) on a reported basis and 19% (14% in U.S. dollars) on an adjusted basis compared with the third quarter last year. Earnings reflect revenue
and customer balance growth and a focus on expense management.
TD Ameritrade contributed $125 million (US$97 million) in earnings to the segment, an increase of 36% (31% in U.S. dollars) compared with the third quarter
last year reflecting asset growth, higher trading volumes, and a favourable tax liability adjustment, partially offset by higher operating expenses.
Wholesale Banking
Wholesale Banking net income was $302 million, an increase of 26% compared with the third quarter last year, reflecting higher origination activity across debt and
equity capital markets, corporate lending growth and trading-related revenue.
Capital
Common Equity Tier 1 Capital ratio on a Basel III fully phased-in basis was 10.4%, compared with 10.1% last quarter.
Conclusion
"This quarter we were pleased to mark a milestone of 500,000 downloads of our TD MySpend money management app, which helps our customers track their
spending and saving," said Masrani. "We remain focused on going above and beyond for our customers by providing legendary service and convenience while
investing for the future to meet their evolving needs." The foregoing contains forward-looking statements. Please refer to the "Caution Regarding Forward-Looking Statements" on page 2.
This quarterly earnings news release should be read in conjunction with the Bank's unaudited Third Quarter 2016 Report to Shareholders for the three and
nine months ended July 31, 2016, prepared in accordance with International Financial Reporting Standards (IFRS) as issued by the International Accounting
Standards Board (IASB), which is available on our website at http://www.td.com/investor/. This analysis is dated August 24, 2016. Unless otherwise indicated,
all amounts are expressed in Canadian dollars, and have been primarily derived from the Bank's Annual or Interim Consolidated Financial Statements
prepared in accordance with IFRS. Certain comparative amounts have been reclassified to conform to the presentation adopted in the current period.
Additional information relating to the Bank is available on the Bank's website at http://www.td.com, as well as on SEDAR at http://www.sedar.com and on the
U.S. Securities and Exchange Commission's (SEC) website at http://www.sec.gov (EDGAR filers section).
Reported results conform to generally accepted accounting principles (GAAP), in accordance with IFRS. Adjusted measures are non-GAAP measures.
Refer to the "How the Bank Reports" section of the Third Quarter 2016 Management's Discussion and Analysis (MD&A) for an explanation of reported and
adjusted results.

TD BANK GROUP • THIRD QUARTER 2016 • EARNINGS NEWS RELEASE Page 2
Caution Regarding Forward-Looking Statements
From time to time, the Bank (as defined in this document) makes written and/or oral forward-looking statements, including in this document, in other filings with
Canadian regulators or the United States (U.S.) Securities and Exchange Commission (SEC), and in other communications. In addition, representatives of the
Bank may make forward-looking statements orally to analysts, investors, the media and others. All such statements are made pursuant to the "safe harbour"
provisions of, and are intended to be forward-looking statements under, applicable Canadian and U.S. securities legislation, including the U.S. Private Securities
Litigation Reform Act of 1995. Forward-looking statements include, but are not limited to, statements made in this document, the Management's Discussion and
Analysis ("2015 MD&A") in the Bank's 2015 Annual Report under the heading "Economic Summary and Outlook", for each business segment under headings
"Business Outlook and Focus for 2016", and in other statements regarding the Bank's objectives and priorities for 2016 and beyond and strategies to achieve
them, the regulatory environment in which the Bank operates, and the Bank's anticipated financial performance. Forward-looking statements are typically identified
by words such as "will", "should", "believe", "expect", "anticipate", "intend", "estimate", "plan", "may", and "could".
By their very nature, these forward-looking statements require the Bank to make assumptions and are subject to inherent risks and uncertainties, general and
specific. Especially in light of the uncertainty related to the physical, financial, economic, political, and regulatory environments, such risks and uncertainties –
many of which are beyond the Bank's control and the effects of which can be difficult to predict – may cause actual results to differ materially from the expectations
expressed in the forward-looking statements. Risk factors that could cause, individually or in the aggregate, such differences include: credit, market (including
equity, commodity, foreign exchange, and interest rate), liquidity, operational (including technology and infrastructure), reputational, insurance, strategic,
regulatory, legal, environmental, capital adequacy, and other risks. Examples of such risk factors include the general business and economic conditions in the
regions in which the Bank operates; the ability of the Bank to execute on key priorities, including the successful completion of acquisitions, business retention, and
strategic plans and to attract, develop and retain key executives; disruptions in or attacks (including cyber-attacks) on the Bank's information technology, internet,
network access or other voice or data communications systems or services; the evolution of various types of fraud or other criminal behaviour to which the Bank is
exposed; the failure of third parties to comply with their obligations to the Bank or its affiliates, including relating to the care and control of information; the impact of
new and changes to, or application of, current laws and regulations, including without limitation tax laws, risk-based capital guidelines and liquidity regulatory
guidance; the overall difficult litigation environment, including in the U.S.; increased competition, including through internet and mobile banking and non-traditional
competitors; changes to the Bank's credit ratings; changes in currency and interest rates (including the possibility of negative interest rates); increased funding
costs and market volatility due to market illiquidity and competition for funding; critical accounting estimates and changes to accounting standards, policies, and
methods used by the Bank; existing and potential international debt crises; and the occurrence of natural and unnatural catastrophic events and claims resulting
from such events. The Bank cautions that the preceding list is not exhaustive of all possible risk factors and other factors could also adversely affect the Bank's
results. For more detailed information, please refer to the "Risk Factors and Management" section of the 2015 MD&A, as may be updated in subsequently filed
quarterly reports to shareholders and news releases (as applicable) related to any transactions or events discussed under the heading "Significant Events" in the
relevant MD&A, which applicable releases may be found on www.td.com. All such factors should be considered carefully, as well as other uncertainties and
potential events, and the inherent uncertainty of forward-looking statements, when making decisions with respect to the Bank and the Bank cautions readers not to
place undue reliance on the Bank's forward-looking statements.
Material economic assumptions underlying the forward-looking statements contained in this document are set out in the 2015 MD&A under the headings
"Economic Summary and Outlook", and for each business segment, "Business Outlook and Focus for 2016", each as may be updated in subsequently filed
quarterly reports to shareholders.
Any forward-looking statements contained in this document represent the views of management only as of the date hereof and are presented for the purpose of
assisting the Bank's shareholders and analysts in understanding the Bank's financial position, objectives and priorities and anticipated financial performance as at
and for the periods ended on the dates presented, and may not be appropriate for other purposes. The Bank does not undertake to update any forward-looking
statements, whether written or oral, that may be made from time to time by or on its behalf, except as required under applicable securities legislation.
This document was reviewed by the Bank's Audit Committee and was approved by the Bank's Board of Directors, on the Audit Committee's recommendation, prior to its release.
TD BANK GROUP • THIRD QUARTER 2016 • EARNINGS NEWS RELEASE Page 3
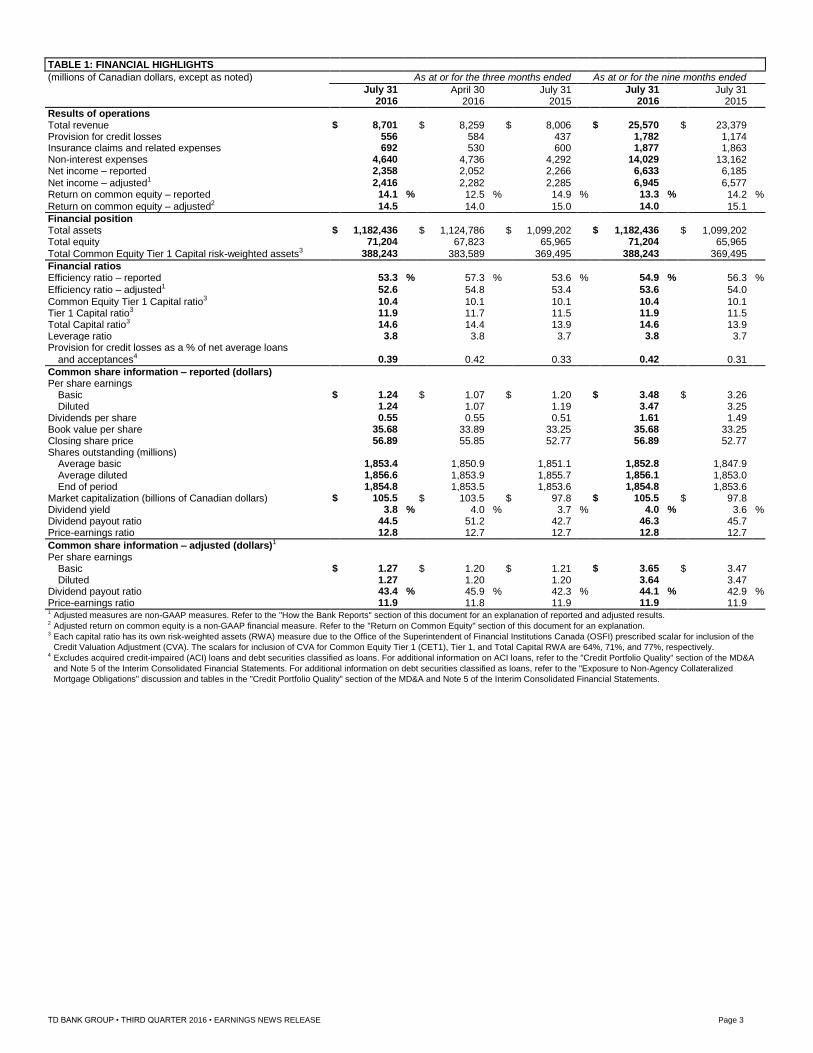
TABLE 1: FINANCIAL HIGHLIGHTS
(millions of Canadian dollars, except as noted) As at or for the three months ended As at or for the nine months ended
July 31 April 30 July 31 July 31 July 31 2016 2016 2015 2016 2015
Results of operations Total revenue $ 8,701 $ 8,259 $ 8,006 $ 25,570 $ 23,379 Provision for credit losses 556 584 437 1,782 1,174 Insurance claims and related expenses 692 530 600 1,877 1,863 Non-interest expenses 4,640 4,736 4,292 14,029 13,162 Net income – reported 2,358 2,052 2,266 6,633 6,185
Net income – adjusted1 2,416 2,282 2,285 6,945 6,577 Return on common equity – reported 14.1 % 12.5 % 14.9 % 13.3 % 14.2 %
Return on common equity – adjusted2 14.5 14.0 15.0 14.0 15.1
Financial position Total assets $ 1,182,436 $ 1,124,786 $ 1,099,202 $ 1,182,436 $ 1,099,202 Total equity 71,204 67,823 65,965 71,204 65,965
Total Common Equity Tier 1 Capital risk-weighted assets3 388,243 383,589 369,495 388,243 369,495
Financial ratios Efficiency ratio – reported 53.3 % 57.3 % 53.6 % 54.9 % 56.3 %
Efficiency ratio – adjusted1 52.6 54.8 53.4 53.6 54.0
Common Equity Tier 1 Capital ratio3 10.4 10.1 10.1 10.4 10.1 Tier 1 Capital ratio3 11.9 11.7 11.5 11.9 11.5 Total Capital ratio3 14.6 14.4 13.9 14.6 13.9 Leverage ratio 3.8 3.8 3.7 3.8 3.7 Provision for credit losses as a % of net average loans
and acceptances4 0.39 0.42 0.33 0.42 0.31
Common share information – reported (dollars) Per share earnings Basic $ 1.24 $ 1.07 $ 1.20 $ 3.48 $ 3.26 Diluted 1.24 1.07 1.19 3.47 3.25 Dividends per share 0.55 0.55 0.51 1.61 1.49 Book value per share 35.68 33.89 33.25 35.68 33.25 Closing share price 56.89 55.85 52.77 56.89 52.77 Shares outstanding (millions) Average basic 1,853.4 1,850.9 1,851.1 1,852.8 1,847.9 Average diluted 1,856.6 1,853.9 1,855.7 1,856.1 1,853.0 End of period 1,854.8 1,853.5 1,853.6 1,854.8 1,853.6 Market capitalization (billions of Canadian dollars) $ 105.5 $ 103.5 $ 97.8 $ 105.5 $ 97.8 Dividend yield 3.8 % 4.0 % 3.7 % 4.0 % 3.6 % Dividend payout ratio 44.5 51.2 42.7 46.3 45.7 Price-earnings ratio 12.8 12.7 12.7 12.8 12.7
Common share information – adjusted (dollars)1 Per share earnings Basic $ 1.27 $ 1.20 $ 1.21 $ 3.65 $ 3.47 Diluted 1.27 1.20 1.20 3.64 3.47 Dividend payout ratio 43.4 % 45.9 % 42.3 % 44.1 % 42.9 % Price-earnings ratio 11.9 11.8 11.9 11.9 11.9 1 Adjusted measures are non-GAAP measures. Refer to the "How the Bank Reports" section of this document for an explanation of reported and adjusted results. 2 Adjusted return on common equity is a non-GAAP financial measure. Refer to the "Return on Common Equity" section of this document for an explanation. 3 Each capital ratio has its own risk-weighted assets (RWA) measure due to the Office of the Superintendent of Financial Institutions Canada (OSFI) prescribed scalar for inclusion of the
Credit Valuation Adjustment (CVA). The scalars for inclusion of CVA for Common Equity Tier 1 (CET1), Tier 1, and Total Capital RWA are 64%, 71%, and 77%, respectively. 4 Excludes acquired credit-impaired (ACI) loans and debt securities classified as loans. For additional information on ACI loans, refer to the "Credit Portfolio Quality" section of the MD&A
and Note 5 of the Interim Consolidated Financial Statements. For additional information on debt securities classified as loans, refer to the "Exposure to Non-Agency Collateralized
Mortgage Obligations" discussion and tables in the "Credit Portfolio Quality" section of the MD&A and Note 5 of the Interim Consolidated Financial Statements.
TD BANK GROUP • THIRD QUARTER 2016 • EARNINGS NEWS RELEASE Page 4
HOW WE PERFORMED How the Bank Reports
The Bank prepares its Interim Consolidated Financial Statements in accordance with IFRS, the current GAAP, and refers to results prepared in accordance with
IFRS as "reported" results. The Bank also utilizes non-GAAP financial measures referred to as "adjusted" results to assess each of its businesses and to measure
the Bank's overall performance. To arrive at adjusted results, the Bank removes "items of note", net of income taxes, from reported results. The items of note relate
to items which management does not believe are indicative of underlying business performance. The Bank believes that adjusted results provide the reader with a
better understanding of how management views the Bank's performance. The items of note are disclosed in Table 3. As explained, adjusted results differ from
reported results determined in accordance with IFRS. Adjusted results, items of note, and related terms used in this document are not defined terms under IFRS
and, therefore, may not be comparable to similar terms used by other issuers.
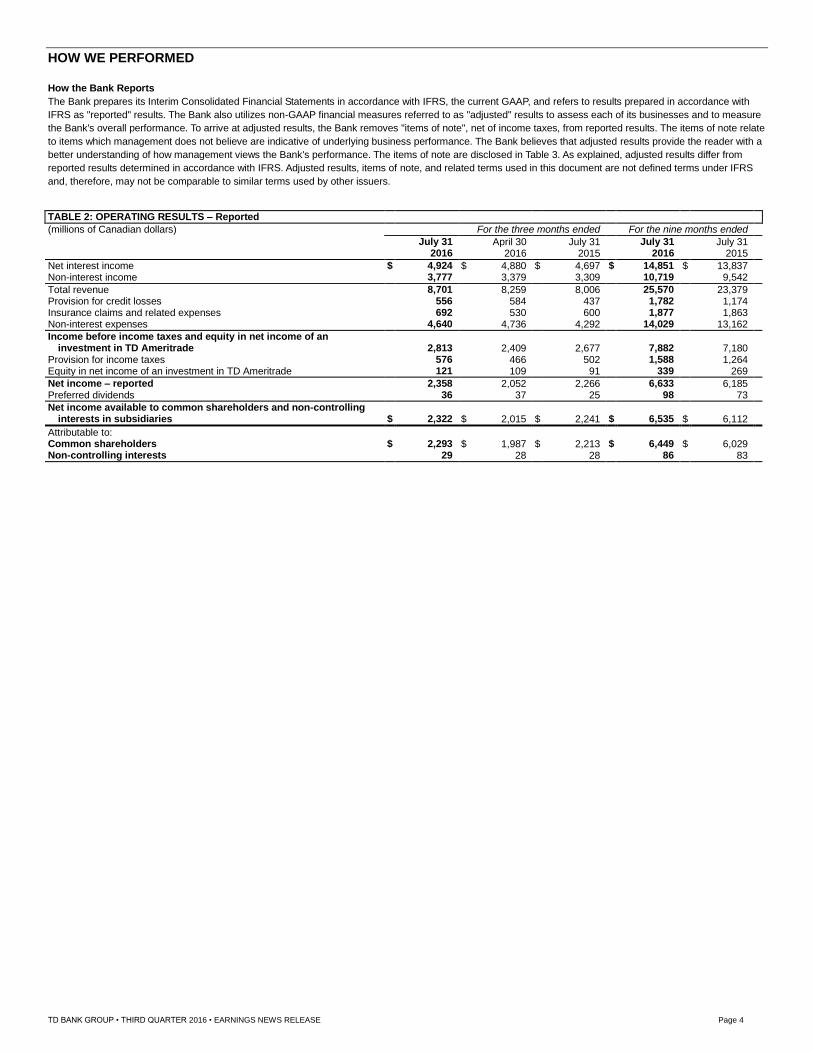
TABLE 2: OPERATING RESULTS – Reported
(millions of Canadian dollars) For the three months ended For the nine months ended
July 31 April 30 July 31 July 31 July 31 2016 2016 2015 2016 2015
Net interest income $ 4,924 $ 4,880 $ 4,697 $ 14,851 $ 13,837 Non-interest income 3,777 3,379 3,309 10,719 9,542
Total revenue 8,701 8,259 8,006 25,570 23,379 Provision for credit losses 556 584 437 1,782 1,174 Insurance claims and related expenses 692 530 600 1,877 1,863 Non-interest expenses 4,640 4,736 4,292 14,029 13,162
Income before income taxes and equity in net income of an investment in TD Ameritrade 2,813 2,409 2,677 7,882 7,180 Provision for income taxes 576 466 502 1,588 1,264 Equity in net income of an investment in TD Ameritrade 121 109 91 339 269
Net income – reported 2,358 2,052 2,266 6,633 6,185 Preferred dividends 36 37 25 98 73
Net income available to common shareholders and non-controlling interests in subsidiaries $ 2,322 $ 2,015 $ 2,241 $ 6,535 $ 6,112
Attributable to: Common shareholders $ 2,293 $ 1,987 $ 2,213 $ 6,449 $ 6,029 Non-controlling interests 29 28 28 86 83

TD BANK GROUP • THIRD QUARTER 2016 • EARNINGS NEWS RELEASE Page 5
The following table provides a reconciliation between the Bank's adjusted and reported results.
TABLE 3: NON-GAAP FINANCIAL MEASURES – Reconciliation of Adjusted to Reported Net Income
(millions of Canadian dollars) For the three months ended For the nine months ended
July 31 April 30 July 31 July 31 July 31
2016 2016 2015 2016 2015
Operating results – adjusted
Net interest income $ 4,924 $ 4,880 $ 4,697 $ 14,851 $ 13,837
Non-interest income1 3,777 3,437 3,288 10,731 9,504
Total revenue 8,701 8,317 7,985 25,582 23,341
Provision for credit losses 556 584 437 1,782 1,174
Insurance claims and related expenses 692 530 600 1,877 1,863
Non-interest expenses2 4,577 4,556 4,261 13,712 12,596
Income before income taxes and equity in net income of an
investment in TD Ameritrade 2,876 2,647 2,687 8,211 7,708
Provision for income taxes3 597 491 508 1,654 1,445
Equity in net income of an investment in TD Ameritrade4 137 126 106 388 314
Net income – adjusted 2,416 2,282 2,285 6,945 6,577
Preferred dividends 36 37 25 98 73
Net income available to common shareholders and non-controlling
interests in subsidiaries – adjusted 2,380 2,245 2,260 6,847 6,504
Attributable to:
Non-controlling interests in subsidiaries, net of income taxes 29 28 28 86 83
Net income available to common shareholders – adjusted 2,351 2,217 2,232 6,761 6,421
Adjustments for items of note, net of income taxes
Amortization of intangibles5 (58) (63) (62) (186) (190)
Fair value of derivatives hedging the reclassified available-for-sale
securities portfolio6 – (51) 19 (10) 34
Impairment of goodwill, non-financial assets, and other charges7 – (116) – (116) –
Restructuring charges8 – – – – (228)
Litigation and litigation-related charge(s)/reserve(s)9 – – 24 – (8)
Total adjustments for items of note (58) (230) (19) (312) (392)
Net income available to common shareholders – reported $ 2,293 $ 1,987 $ 2,213 $ 6,449 $ 6,029
1 Adjusted non-interest income excludes the following items of note: second quarter 2016 – $58 million loss due to change in fair value of derivatives hedging the reclassified available-for-
sale (AFS) securities portfolio as explained in footnote 6; first quarter 2016 – $46 million gain due to change in fair value of derivatives hedging the reclassified AFS securities portfolio;
third quarter 2015 – $21 million gain due to change in fair value of derivatives hedging the reclassified AFS securities portfolio; second quarter 2015 – $17 million gain due to change in
fair value of derivatives hedging the reclassified AFS securities portfolio. These amounts were reported in the Corporate segment. 2 Adjusted non-interest expenses excludes the following items of note: third quarter 2016 – $63 million amortization of intangibles, as explained in footnote 5; second quarter 2016 –
$69 million amortization of intangibles; $111 million impairment of goodwill, certain intangibles, other non-financial assets, and other charges, as further explained in footnote 7; first
quarter 2016 – $74 million amortization of intangibles; third quarter 2015 – $70 million amortization of intangibles; $39 million recovery of litigation losses, as explained in footnote 9;
second quarter 2015 – $73 million amortization of intangibles; $337 million due to the initiatives to reduce costs, as explained in footnote 8; $52 million of litigation charges; first quarter
2015 – $73 million amortization of intangibles. These amounts were reported in the Corporate segment, with the exception of litigation and litigation-related charge(s)/reserve(s) which
were reported in the U.S. Retail segment. 3 For a reconciliation between reported and adjusted provision for income taxes, refer to the "Non-GAAP Financial Measures – Reconciliation of Reported to Adjusted Provision for Income
Taxes" table in the "Income Taxes" section of the MD&A. 4 Adjusted equity in net income of an investment in TD Ameritrade excludes the following items of note: third quarter 2016 – $16 million amortization of intangibles, as explained in
footnote 5; second quarter 2016 – $17 million amortization of intangibles; first quarter 2016 – $16 million amortization of intangibles; third quarter 2015 – $15 million amortization of
intangibles; second quarter 2015 – $16 million amortization of intangibles; first quarter 2015 – $14 million amortization of intangibles. These amounts were reported in the Corporate
segment. 5 Amortization of intangibles relate to intangibles acquired as a result of asset acquisitions and business combinations. Although the amortization of software and asset servicing rights are
recorded in amortization of intangibles, they are not included for purposes of the items of note. 6 The Bank changed its trading strategy with respect to certain trading debt securities and reclassified these securities from trading to the AFS category effective August 1, 2008. These
debt securities are economically hedged, primarily with credit default swap and interest rate swap contracts which are recorded on a fair value basis with changes in fair value recorded in
the period's earnings. Management believes that this asymmetry in the accounting treatment between derivatives and the reclassified debt securities results in volatility in earnings from
period to period that is not indicative of the economics of the underlying business performance in Wholesale Banking. The Bank may from time to time replace securities within the
portfolio to best utilize the initial, matched fixed term funding. As a result, the derivatives are accounted for on an accrual basis in Wholesale Banking and the gains and losses related to
the derivatives in excess of the accrued amounts are reported in the Corporate segment. Adjusted results of the Bank exclude the gains and losses of the derivatives in excess of the
accrued amount. 7 In the second quarter of 2016, the Bank recorded impairment losses on goodwill, certain intangibles, other non-financial assets and deferred tax assets, as well as other charges relating
to the Direct Investing business in Europe that has been experiencing continued losses. These amounts are reported in the Corporate segment. 8 During 2015, the Bank commenced its restructuring review and recorded restructuring charges of $337 million ($228 million after tax) and $349 million ($243 million after tax) on a net
basis, in the second quarter and fourth quarter of 2015, respectively. The restructuring initiatives were intended to reduce costs and manage expenses in a sustainable manner and to
achieve greater operational efficiencies. These measures included process redesign and business restructuring, retail branch and real estate optimization, and organizational review. The
restructuring charges have been recorded as an adjustment to net income within the Corporate segment. 9 As a result of an adverse judgment and evaluation of certain other developments and exposures in the U.S. in 2015, the Bank took prudent steps to reassess its litigation provision.
Having considered these factors, including related or analogous cases, the Bank determined, in accordance with applicable accounting standards, that an increase of $52 million
($32 million after tax) to the Bank’s litigation provision was required in the second quarter of 2015. During the third quarter of 2015, distributions of $39 million ($24 million after tax) were
received by the Bank as a result of previous settlements reached on certain matters in the U.S., whereby the Bank was assigned the right to these distributions, if and when made
available. The amount in the third quarter of 2015 reflects this recovery of previous settlements.

TD BANK GROUP • THIRD QUARTER 2016 • EARNINGS NEWS RELEASE Page 6
TABLE 4: RECONCILIATION OF REPORTED TO ADJUSTED EARNINGS PER SHARE (EPS)1
(Canadian dollars) For the three months ended For the nine months ended
July 31 April 30 July 31 July 31 July 31 2016 2016 2015 2016 2015
Basic earnings per share – reported $ 1.24 $ 1.07 $ 1.20 $ 3.48 $ 3.26
Adjustments for items of note2 0.03 0.13 0.01 0.17 0.21
Basic earnings per share – adjusted $ 1.27 $ 1.20 $ 1.21 $ 3.65 $ 3.47
Diluted earnings per share – reported $ 1.24 $ 1.07 $ 1.19 $
3.47 $ 3.25
Adjustments for items of note2 0.03 0.13 0.01 0.17 0.22
Diluted earnings per share – adjusted $ 1.27 $ 1.20 $ 1.20 $ 3.64 $ 3.47
1 EPS is computed by dividing net income available to common shareholders by the weighted-average number of shares outstanding during the period. 2 For explanations of items of note, refer to the "Non-GAAP Financial Measures – Reconciliation of Adjusted to Reported Net Income" table in the "How We Performed" section of this
document.
TABLE 5: NON-GAAP FINANCIAL MEASURES – Reconciliation of Reported to Adjusted Provision for Income Taxes
(millions of Canadian dollars, except as noted) For the three months ended For the nine months ended
July 31 April 30 July 31 July 31 July 31 2016 2016 2015 2016 2015
Provision for income taxes – reported $ 576 $ 466 $ 502 $ 1,588 $ 1,264
Adjustments for items of note: Recovery of (provision for) income taxes1,2 Amortization of intangibles 21 23 23 69 71 Fair value of derivatives hedging the reclassified available-for-sale securities portfolio – 7 (2) 2 (4) Impairment of goodwill, non-financial assets, and other charges – (5) – (5) – Restructuring charges – – – – 109 Litigation and litigation-related charge(s)/reserve(s) – – (15) – 5
Total adjustments for items of note 21 25 6 66 181
Provision for income taxes – adjusted $ 597 $ 491 $ 508 $ 1,654 $ 1,445
Effective income tax rate – adjusted3 20.8 % 18.5 % 18.9 % 20.1 % 18.7 % 1 For explanations of items of note, refer to the "Non-GAAP Financial Measures – Reconciliation of Adjusted to Reported Net Income" table in the "How We Performed" section of this
document. 2 The tax effect for each item of note is calculated using the effective statutory income tax rate of the applicable legal entity.
3 Adjusted effective income tax rate is the adjusted provision for income taxes before other taxes as a percentage of adjusted net income before taxes.
Return on Common Equity
The Bank's methodology for allocating capital to its business segments is aligned with the common equity capital requirements under Basel III. The capital
allocated to the business segments is based on 9% CET1 Capital.
Adjusted return on common equity (ROE) is adjusted net income available to common shareholders as a percentage of average common equity.
Adjusted ROE is a non-GAAP financial measure as it is not a defined term under IFRS. Readers are cautioned that earnings and other measures adjusted to a
basis other than IFRS do not have standardized meanings under IFRS and, therefore, may not be comparable to similar terms used by other issuers.
TABLE 6: RETURN ON COMMON EQUITY
(millions of Canadian dollars, except as noted) For the three months ended For the nine months ended
July 31 April 30 July 31 July 31 July 31 2016 2016 2015 2016 2015
Average common equity $ 64,595 $ 64,536 $ 58,891 $ 64,568 $ 56,932
Net income available to common shareholders – reported 2,293 1,987 2,213 6,449 6,029 Items of note, net of income taxes1 58 230 19 312 392
Net income available to common shareholders – adjusted 2,351 2,217 2,232 6,761 6,421
Return on common equity – adjusted 14.5 % 14.0 % 15.0 % 14.0 % 15.1 % 1 For explanations of items of note, refer to the "Non-GAAP Financial Measures – Reconciliation of Adjusted to Reported Net Income" table in the "How We Performed" section of this
document.

TD BANK GROUP • THIRD QUARTER 2016 • EARNINGS NEWS RELEASE Page 7
HOW OUR BUSINESSES PERFORMED
For management reporting purposes, the Bank reports its results under three key business segments: Canadian Retail, which includes the results of the Canadian
personal and commercial banking, wealth, and insurance businesses; U.S. Retail, which includes the results of the U.S. retail and commercial banking operations,
wealth management services, and the Bank's investment in TD Ameritrade; and Wholesale Banking. The Bank's other activities are grouped into the Corporate
segment.
Results of each business segment reflect revenue, expenses, assets, and liabilities generated by the businesses in that segment. Where applicable, the Bank
measures and evaluates the performance of each segment based on adjusted results and ROE, and for those segments the Bank indicates that the measure is
adjusted. For further details, refer to the "How the Bank Reports" section of this document, the "Business Focus" section in the 2015 MD&A, and Note 30 of the
Bank's Consolidated Financial Statements for the year ended October 31, 2015. For information concerning the Bank's measure of ROE, which is a non-GAAP
financial measure, refer to the "How We Performed" section of this document.
Effective the first quarter of 2016, the presentation of the U.S. strategic cards portfolio revenues, provision for credit losses (PCL), and expenses in the
U.S. Retail segment includes only the Bank's agreed portion of the U.S. strategic cards portfolio, while the Corporate segment includes the retailer program
partners' share. Certain comparative amounts have been recast to conform with this revised presentation. There was no impact on the net income of the segments
or on the presentation of gross and net results in the Bank's Interim Consolidated Statement of Income.
Net interest income within Wholesale Banking is calculated on a taxable equivalent basis (TEB), which means that the value of non-taxable or tax-exempt
income, including dividends, is adjusted to its equivalent before-tax value. Using TEB allows the Bank to measure income from all securities and loans consistently
and makes for a more meaningful comparison of net interest income with similar institutions. The TEB increase to net interest income and provision for income
taxes reflected in Wholesale Banking's results are reversed in the Corporate segment. The TEB adjustment for the quarter was $79 million, compared with
$91 million in the third quarter last year, and $82 million in the prior quarter. The TEB adjustment for the nine months ended July 31, 2016, was $226 million,
compared with $322 million in the same period last year.
TABLE 7: CANADIAN RETAIL
(millions of Canadian dollars, except as noted) For the three months ended For the nine months ended
July 31 April 30 July 31 July 31 July 31 2016 2016 2015 2016 2015
Net interest income $ 2,519 $ 2,418 $ 2,480 $ 7,428 $ 7,284 Non-interest income 2,622 2,469 2,531 7,631 7,404
Total revenue 5,141 4,887 5,011 15,059 14,688 Provision for credit losses 258 262 237 748 666 Insurance claims and related expenses 692 530 600 1,877 1,863 Non-interest expenses 2,133 2,095 2,104 6,307 6,264
Net income $ 1,509 $ 1,464 $ 1,557 $ 4,486 $ 4,442
Selected volumes and ratios Return on common equity 41.9 % 41.7 % 44.6 % 42.0 % 42.9 % Margin on average earning assets (including securitized assets) 2.79 2.77 2.88 2.79 2.88 Efficiency ratio 41.5 42.9 42.0 41.9 42.6
Assets under administration (billions of Canadian dollars) $ 337 $ 321 $ 314 $ 337 $ 314 Assets under management (billions of Canadian dollars) 265 254 249 265 249
Number of Canadian retail branches 1,152 1,152 1,166 1,152 1,166 Average number of full-time equivalent staff 38,852 37,987 39,180 38,383 39,365
Quarterly comparison – Q3 2016 vs. Q3 2015
Canadian Retail net income for the quarter was $1,509 million, a decrease of $48 million, or 3%, compared with the third quarter last year. Revenue growth was
more than offset by higher insurance claims, a higher effective tax rate, increased non-interest expenses and higher PCL. The annualized ROE for the quarter was
41.9%, compared with 44.6% in the third quarter last year.
Canadian Retail revenue is derived from the Canadian personal and commercial banking, wealth, and insurance businesses. Revenue for the quarter was
$5,141 million, an increase of $130 million, or 3%, compared with the third quarter last year. Net interest income increased $39 million, or 2%, reflecting loan and
deposit volume growth, partially offset by lower margins. Non-interest income increased $91 million, or 4%, reflecting wealth asset-based fee growth, changes in
the fair value of investments supporting claims liabilities and higher fee-based revenue in personal and commercial banking. Margin on average earning assets
was 2.79%, a 9 basis points (bps) decrease, primarily reflecting competitive pricing in lending.
Average loan volumes increased $19 billion, or 5%, compared with the third quarter last year, comprised of 4% growth in personal loan volumes and 10%
growth in business loan volumes. Average deposit volumes increased $20 billion, or 8%, compared with the third quarter last year, comprised of 7% growth in
personal deposit volumes, 8% growth in business deposit volumes and 15% growth in wealth deposit volumes.
Assets under administration (AUA) were $337 billion as at July 31, 2016, an increase of $23 billion, or 7%, and assets under management (AUM) were
$265 billion as at July 31, 2016, an increase of $16 billion, or 6%, compared with the third quarter last year, both reflecting new asset growth and increases in
market value.
PCL for the quarter was $258 million, an increase of $21 million, or 9%, compared with the third quarter last year. Personal banking PCL was $248 million, an
increase of $43 million, or 21%, reflecting higher provisions in the auto lending portfolio in the current quarter. Business banking PCL was $10 million, a decrease
of $22 million. Annualized PCL as a percentage of credit volume was 0.28%, or an increase of 1 basis point. Net impaired loans were $732 million, an increase of
$26 million, or 4%. Net impaired loans as a percentage of total loans were 0.20%, or flat compared with July 31, 2015.
Insurance claims and related expenses for the quarter were $692 million, an increase of $92 million, or 15%, compared with the third quarter last year. The
increase reflects the net impact of the Fort McMurray wildfire as well as other weather-related claims, and changes in the fair value of investments supporting
claims liabilities, partially offset by more favourable prior years’ claims development.
Non-interest expenses were $2,133 million, an increase of $29 million, or 1%, compared with the third quarter last year. The increase reflected business growth,
higher employee-related expenses including revenue-based variable expenses in the wealth business and technology spend, partially offset by productivity
savings.
The efficiency ratio for the quarter was 41.5%, compared with 42.0% in the third quarter last year.

TD BANK GROUP • THIRD QUARTER 2016 • EARNINGS NEWS RELEASE Page 8
Quarterly comparison – Q3 2016 vs. Q2 2016
Canadian Retail net income increased $45 million, or 3%, compared with the prior quarter, reflecting increased revenue, partially offset by higher insurance claims
and increased non-interest expenses. The annualized ROE for the quarter was 41.9%, compared with 41.7% in the prior quarter.
Revenue increased $254 million, or 5%, compared with the prior quarter. Net interest income increased $101 million, or 4%, reflecting loan and deposit volume
growth, additional days in the quarter, and seasonal factors, partially offset by lower margins. Non-interest income increased $153 million, or 6%, reflecting
changes in the fair value of investments supporting claims liabilities, seasonality of insurance premiums, wealth asset-based fee growth, higher fee-based revenue
in personal and commercial banking, and additional days in the quarter. Margin on average earning assets was 2.79%, or a 2 bps increase, primarily reflecting
higher seasonal revenue, partially offset by lower lending margins.
Average loan volumes increased $5 billion, or 1%, compared with the prior quarter, comprised of 1% growth in personal loan volumes and 2% growth in
business loan volumes. Average deposit volumes increased $10 billion, or 4%, comprised of 2% growth in personal deposit volumes, 7% growth in business
deposit volumes and 4% growth in wealth deposit volumes.
AUA were $337 billion as at July 31, 2016, an increase of $16 billion, or 5%, and AUM were $265 billion as at July 31, 2016, an increase of $11 billion, or 4%,
compared with the prior quarter-end, both reflecting increases in market value and new asset growth.
PCL for the quarter decreased $4 million, or 2%, compared with the prior quarter. Personal banking PCL for the quarter decreased $4 million, or 2%, primarily
reflecting lower delinquencies in the current quarter. Business banking PCL was flat. Annualized PCL as a percentage of credit volume was 0.28%, or a 2 bps
decrease. Net impaired loans decreased $25 million, or 3%. Net impaired loans as a percentage of total loans were 0.20%, compared with 0.21% as at
April 30, 2016.
Insurance claims and related expenses for the quarter increased $162 million, or 31%, compared with the prior quarter. The increase reflects the net impact of
the Fort McMurray wildfire as well as other weather-related claims, seasonal increases in claims and changes in the fair value of investments supporting claims
liabilities, partially offset by more favourable prior years’ claims development.
Non-interest expenses increased $38 million, or 2%, reflecting business growth, additional days in the quarter and higher technology spend.
The efficiency ratio for the quarter was 41.5%, compared with 42.9% in the prior quarter.
Year-to-date comparison – Q3 2016 vs. Q3 2015
Canadian Retail net income for the nine months ended July 31, 2016, was $4,486 million, an increase of $44 million, or 1%, compared with the same period last
year. The increase in earnings reflects revenue growth, partially offset by the impact of a higher effective tax rate, higher PCL and increased non-interest
expenses. The annualized ROE for the period was 42.0%, compared with 42.9% in the same period last year.
Revenue was $15,059 million, an increase of $371 million, or 3%, compared with the same period last year. Net interest income increased $144 million, or 2%,
reflecting loan and deposit volume growth, partially offset by lower margins. Non-interest income increased $227 million, or 3%, reflecting wealth asset-based fee
growth, higher fee-based revenue in personal and commercial banking, a change in mix of reinsurance contracts, and higher insurance premiums, partially offset
by changes in the fair value of investments supporting claims liabilities. Margin on average earning assets was 2.79%, a 9 bps decrease, reflecting lower margins
and competitive pricing.
Average loan volumes increased $19 billion, or 6%, compared with the same period last year, comprised of 5% growth in personal loan volumes and 10%
growth in business loan volumes. Average deposit volumes increased $16 billion, or 6%, comprised of 6% growth in personal deposit volumes, 5% growth in
business deposit volumes and 13% growth in wealth deposit volumes.
PCL was $748 million, an increase of $82 million, or 12%, compared with the same period last year. Personal banking PCL was $725 million, an increase of
$98 million, or 16%, reflecting higher provisions in the auto lending portfolio. Business banking PCL was $23 million, a decrease of $16 million. Annualized PCL as
a percentage of credit volume was 0.28%, an increase of 2 bps, compared with the same period last year.
Insurance claims and related expenses were $1,877 million, an increase of $14 million, or 1%, compared with the same period last year.
Non-interest expenses were $6,307 million, an increase of $43 million, or 1%, compared with the same period last year. The increase reflects higher employee-
related expenses including revenue-based variable expenses in the wealth business, business growth and technology spend, partially offset by productivity
savings.
The efficiency ratio was 41.9%, compared with 42.6% in the same period last year.
TD BANK GROUP • THIRD QUARTER 2016 • EARNINGS NEWS RELEASE Page 9
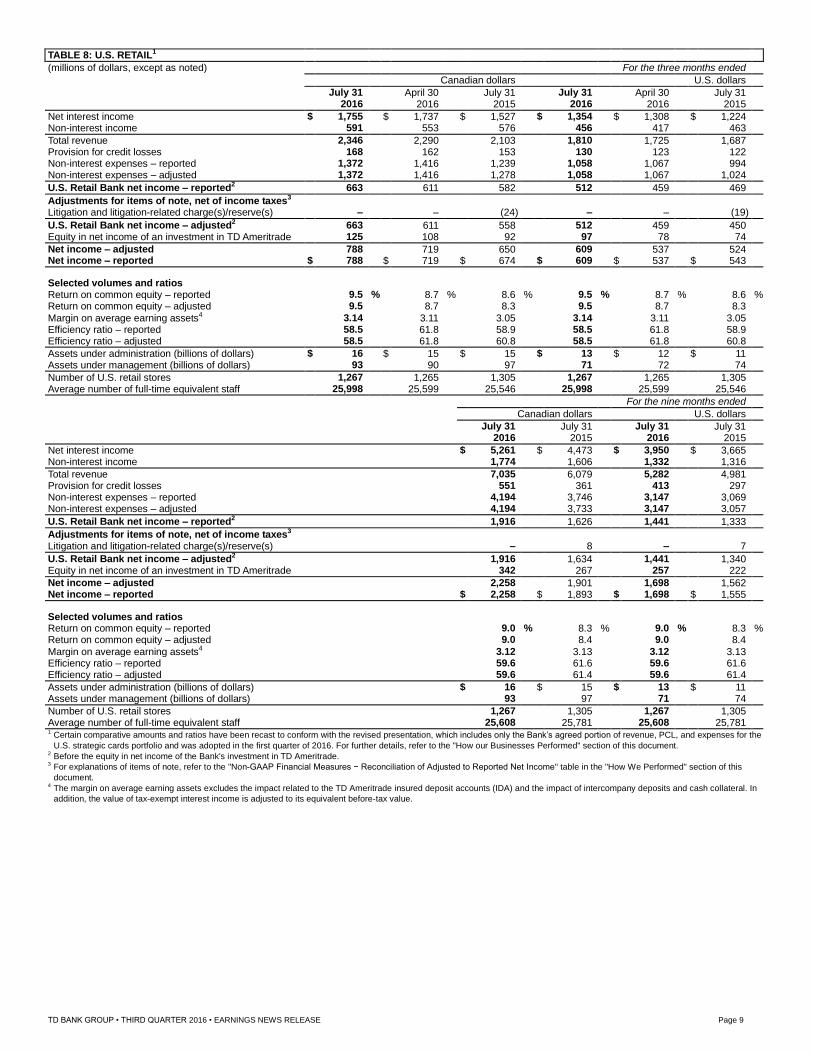
TABLE 8: U.S. RETAIL1
(millions of dollars, except as noted) For the three months ended
Canadian dollars U.S. dollars
July 31 April 30 July 31 July 31 April 30 July 31 2016 2016 2015 2016 2016 2015
Net interest income $ 1,755 $ 1,737 $ 1,527 $ 1,354 $ 1,308 $ 1,224 Non-interest income 591 553 576 456 417 463
Total revenue 2,346 2,290 2,103 1,810 1,725 1,687 Provision for credit losses 168 162 153 130 123 122 Non-interest expenses – reported 1,372 1,416 1,239 1,058 1,067 994 Non-interest expenses – adjusted 1,372 1,416 1,278 1,058 1,067 1,024
U.S. Retail Bank net income – reported2 663 611 582 512 459 469
Adjustments for items of note, net of income taxes3 Litigation and litigation-related charge(s)/reserve(s) – – (24) – – (19)
U.S. Retail Bank net income – adjusted2 663 611 558 512 459 450 Equity in net income of an investment in TD Ameritrade 125 108 92 97 78 74
Net income – adjusted 788 719 650 609 537 524 Net income – reported $ 788 $ 719 $ 674 $ 609 $ 537 $ 543
Selected volumes and ratios Return on common equity – reported 9.5 % 8.7 % 8.6 % 9.5 % 8.7 % 8.6 % Return on common equity – adjusted 9.5 8.7 8.3 9.5 8.7 8.3
Margin on average earning assets4 3.14 3.11 3.05 3.14 3.11 3.05 Efficiency ratio – reported 58.5 61.8 58.9 58.5 61.8 58.9 Efficiency ratio – adjusted 58.5 61.8 60.8 58.5 61.8 60.8
Assets under administration (billions of dollars) $ 16 $ 15 $ 15 $ 13 $ 12 $ 11 Assets under management (billions of dollars) 93 90 97 71 72 74
Number of U.S. retail stores 1,267 1,265 1,305 1,267 1,265 1,305 Average number of full-time equivalent staff 25,998 25,599 25,546 25,998 25,599 25,546
For the nine months ended
Canadian dollars U.S. dollars
July 31 July 31 July 31 July 31 2016 2015 2016 2015
Net interest income $ 5,261 $ 4,473 $ 3,950 $ 3,665 Non-interest income 1,774 1,606 1,332 1,316
Total revenue 7,035 6,079 5,282 4,981 Provision for credit losses 551 361 413 297 Non-interest expenses – reported 4,194 3,746 3,147 3,069 Non-interest expenses – adjusted 4,194 3,733 3,147 3,057
U.S. Retail Bank net income – reported2 1,916 1,626 1,441 1,333
Adjustments for items of note, net of income taxes3 Litigation and litigation-related charge(s)/reserve(s) – 8 – 7
U.S. Retail Bank net income – adjusted2 1,916 1,634 1,441 1,340 Equity in net income of an investment in TD Ameritrade 342 267 257 222
Net income – adjusted 2,258 1,901 1,698 1,562 Net income – reported $ 2,258 $ 1,893 $ 1,698 $ 1,555
Selected volumes and ratios Return on common equity – reported 9.0 % 8.3 % 9.0 % 8.3 % Return on common equity – adjusted 9.0 8.4 9.0 8.4
Margin on average earning assets4 3.12 3.13 3.12 3.13 Efficiency ratio – reported 59.6 61.6 59.6 61.6 Efficiency ratio – adjusted 59.6 61.4 59.6 61.4
Assets under administration (billions of dollars) $ 16 $ 15 $ 13 $ 11 Assets under management (billions of dollars) 93 97 71 74
Number of U.S. retail stores 1,267 1,305 1,267 1,305 Average number of full-time equivalent staff 25,608 25,781 25,608 25,781 1 Certain comparative amounts and ratios have been recast to conform with the revised presentation, which includes only the Bank’s agreed portion of revenue, PCL, and expenses for the
U.S. strategic cards portfolio and was adopted in the first quarter of 2016. For further details, refer to the "How our Businesses Performed" section of this document. 2 Before the equity in net income of the Bank's investment in TD Ameritrade. 3 For explanations of items of note, refer to the "Non-GAAP Financial Measures − Reconciliation of Adjusted to Reported Net Income" table in the "How We Performed" section of this
document. 4 The margin on average earning assets excludes the impact related to the TD Ameritrade insured deposit accounts (IDA) and the impact of intercompany deposits and cash collateral. In
addition, the value of tax-exempt interest income is adjusted to its equivalent before-tax value.
TD BANK GROUP • THIRD QUARTER 2016 • EARNINGS NEWS RELEASE Page 10
Quarterly comparison – Q3 2016 vs. Q3 2015
U.S. Retail net income for the quarter was $788 million (US$609 million), which included net income of $663 million (US$512 million) from the U.S. Retail Bank
and $125 million (US$97 million) from the Bank's investment in TD Ameritrade. U.S. Retail reported earnings increased US$66 million, or 12%, compared with the
third quarter last year, while adjusted earnings were up US$85 million, or 16%. In addition to U.S. dollar earnings growth, U.S. Retail Canadian dollar earnings
benefited from the strength of the U.S. dollar with reported earnings up $114 million, or 17%, and adjusted earnings up $138 million, or 21%. The reported and
adjusted annualized ROE for the quarter was 9.5%, compared with 8.6% and 8.3%, respectively, in the third quarter last year.
U.S. Retail Bank reported net income for the quarter increased US$43 million, or 9%, compared with the third quarter last year, due to higher loan and deposit
volumes, positive operating leverage, and good credit quality, partially offset by recovery of litigation losses in the same period last year. U.S. Retail Bank adjusted
net income increased US$62 million, or 14%. The contribution from TD Ameritrade of US$97 million was up US$23 million, or 31%, reflecting asset growth, higher
trading volumes and a favourable tax liability adjustment, partially offset by higher operating expenses.
U.S. Retail Bank revenue is derived from retail and commercial banking operations, wealth management services, and investments. Revenue for the quarter
was US$1,810 million, an increase of US$123 million, or 7%, compared with the third quarter last year. Net interest income increased US$130 million, or 11%,
reflecting loan and deposit growth, higher margins, and the benefit of an acquisition in the strategic cards portfolio. Margin on average earning assets was 3.14%,
a 9 bps increase, due to the December 2015 Fed rate increase (the "Rate Increase"), positive hedging impact, and favourable balance sheet mix, partially offset by
lower loan margins. Non-interest income decreased US$7 million, or 2%, reflecting fee income growth in personal banking and wealth management, and the
benefit of an acquisition in the strategic cards portfolio, offset by unfavourable hedging impact and lower overdraft fees attributable to a change in time order
posting of customer transactions.
Excluding an acquisition in the strategic cards portfolio, average loan volumes increased US$13 billion, or 11%, compared with the third quarter last year due to
growth in business and personal loans of 17% and 4%, respectively. Average deposit volumes increased US$19 billion, or 9%, reflecting 7% growth in business
deposit volumes, 9% growth in personal deposit volumes and 11% increase in sweep deposit volume from TD Ameritrade.
AUA were US$13 billion as at July 31, 2016, an increase of 11%, compared with the third quarter last year, primarily due to increases in private banking
balances. AUM were US$71 billion as at July 31, 2016, a decrease of 4%, primarily due to declines in international equity markets.
PCL for the quarter was US$130 million, an increase of US$8 million, or 7%, compared with the third quarter last year. Personal banking PCL was
US$80 million, an increase of US$4 million, or 4%, primarily related to auto lending and credit card loans. Business banking PCL was US$49 million, a
US$4 million increase, or 9%, primarily due to portfolio growth. PCL associated with debt securities classified as loans was US$1 million, flat compared with the
third quarter last year. Net impaired loans, excluding ACI loans and debt securities classified as loans, were US$1.5 billion, an increase of US$101 million, or 7%.
The increase was related to certain legacy performing home equity loans that were classified as impaired due to concerns about the borrowers' ability to continue
to pay under modified terms. As the borrowers demonstrate an ability to perform under the modified terms, the loans are returned to performing status. Net
impaired loans, excluding ACI loans and debt securities classified as loans, as a percentage of total loans were 1.1% as at July 31, 2016. Net impaired debt
securities classified as loans were US$672 million, a decrease of US$140 million, or 17%.
Non-interest expenses for the quarter were US$1,058 million. Reported non-interest expenses increased US$64 million, or 6%, compared with the third quarter
last year, reflecting higher employee costs, business initiatives, and recovery of litigation losses in the same period last year, partially offset by productivity savings.
Adjusted non-interest expenses increased US$34 million, or 3%.
The reported and adjusted efficiency ratios for the quarter were 58.5%, compared with 58.9% and 60.8%, respectively, in the third quarter last year.
Quarterly comparison – Q3 2016 vs. Q2 2016
U.S. Retail earnings increased US$72 million, or 13%, compared with the prior quarter. U.S. Retail Canadian dollar earnings were up $69 million, or 10%. The
annualized ROE for the quarter was 9.5%, compared to 8.7% in the prior quarter.
U.S. Retail Bank net income for the quarter increased US$53 million, or 12%, compared with the prior quarter, due to higher loan volumes, fee income growth,
and two additional days in the quarter. The contribution from TD Ameritrade increased US$19 million, or 24%, primarily due to higher asset-based revenue, a
favourable tax liability adjustment and lower operating expenses, partially offset by decreased transaction-based revenue.
Revenue for the quarter increased US$85 million, or 5%, compared with the prior quarter. Net interest income increased US$46 million, or 4%, reflecting higher
loan volumes and two additional days in the quarter. Margin on average earning assets was 3.14%, a 3 bps increase, due to positive hedging impact and higher
deposit margins. Non-interest income increased US$39 million, or 9%, primarily reflecting organic and seasonal growth in personal banking fee revenue.
Average loan volumes increased US$4 billion, or 3%, compared with the prior quarter, due to growth in the commercial and auto lending portfolios. Average
deposit volumes were flat compared with the prior quarter.
AUA and AUM were US$13 billion and US$71 billion, respectively, as at July 31, 2016, both relatively flat compared with the prior quarter.
PCL for the quarter increased US$7 million, or 6%, compared with the prior quarter. Personal banking PCL was US$80 million, down US$6 million, reflecting the
favourable housing environment. Business banking PCL was US$49 million, an increase of US$13 million, primarily due to portfolio growth. PCL associated with
debt securities classified as loans was US$1 million, flat compared with the prior quarter. Net impaired loans, excluding ACI loans and debt securities classified as
loans, were US$1.5 billion, a decrease of US$155 million, or 10%. The decrease was mainly related to certain legacy home equity loans returning to performing
status after demonstrating a sustained ability to pay under modified terms. Net impaired loans, excluding ACI loans and debt securities classified as loans, as a
percentage of total loans decreased 14 bps compared to the prior quarter. Net impaired debt securities classified as loans decreased US$59 million, or 8%.
Non-interest expenses for the quarter were relatively flat compared with the prior quarter.
The efficiency ratio for the quarter was 58.5%, compared with 61.8% in the prior quart er.
Year-to-date comparison – Q3 2016 vs. Q3 2015
U.S. Retail net income for the nine months ended July 31, 2016, was $2,258 million (US$1,698 million), which included net income of $1,916 million
(US$1,441 million) from the U.S. Retail Bank and $342 million (US$257 million) from the Bank’s investment in TD Ameritrade. U.S. Retail reported earnings
increased US$143 million, or 9%, compared with the same period last year, while adjusted earnings were up US$136 million, or 9%. In addition to U.S. dollar
earnings growth, Canadian dollar earnings benefited from the strength of the U.S. dollar, with reported earnings up $365 million, or 19%, and adjusted earnings up
$357 million, or 19%. The reported and adjusted annualized ROE for the nine months ended July 31, 2016, was 9.0%, compared with 8.3% and 8.4%,
respectively.
U.S. Retail Bank net income on a reported basis increased US$108 million, or 8%, compared with the same period last year, due to higher loan and deposit
volumes, positive operating leverage, and contribution from an acquisition in the strategic cards portfolio, partially offset by higher PCL. U.S. Retail Bank adjusted
net income increased US$101 million, or 8%. The contribution from TD Ameritrade of US$257 million increased US$35 million, or 16%, primarily due to increased
asset-based revenue and a favourable tax liability adjustment, partially offset by higher operating expenses.

TD BANK GROUP • THIRD QUARTER 2016 • EARNINGS NEWS RELEASE Page 11
Revenue was US$5,282 million, an increase of US$301 million, or 6%, compared with the same period last year. Net interest income increased US$285 million,
or 8%, reflecting loan and deposit volume growth, and the benefit of an acquisition in the strategic cards portfolio, partially offset by lower margins. Margin on
average earning assets was 3.12%, a 1 basis point decrease, due to lower loan margins as a result of the competitive environment, partially offset by the Rate
Increase and positive hedging impact. Non-interest income increased US$16 million, or 1%, primarily reflecting customer account growth, higher transaction
volumes, and the benefit of an acquisition in the strategic cards portfolio, offset by unfavourable hedging impact.
Excluding an acquisition in the strategic cards portfolio, average loan volumes increased US$13 billion, or 11%, compared with the same period last year due to
growth in business loans and personal loans of 18% and 4%, respectively. Average deposit volumes increased US$18 billion, or 9%, reflecting 8% growth in
business deposits, 8% growth in personal deposits, and 11% growth in sweep deposit volume from TD Ameritrade.
PCL was US$413 million, an increase of US$116 million, or 39%, compared with the same period last year. Personal banking PCL was US$285 million, an
increase of US$39 million, or 16%, primarily due to higher provision for auto loans and credit cards, partially offset by improvements on residential mortgages.
Business banking PCL was US$125 million, an increase of US$67 million, primarily due to commercial loan volume growth and an allowance increase reflecting
the current business economic environment. PCL associated with debt securities classified as loans was US$3 million, an increase of US$10 million. Annualized
PCL as a percentage of credit volume for loans excluding debt securities classified as loans was 0.39%, an increase of 6 bps.
Non-interest expenses for the nine months ended July 31, 2016, were US$3,147 million. Reported non-interest expenses for the period increased
US$78 million, or 3%, compared with the same period last year, primarily due to business initiatives, employee costs, and volume growth, partially offset by
productivity savings. Adjusted non-interest expenses increased US$90 million, or 3%.
The reported and adjusted efficiency ratio for the period was 59.6%, compared with 61.6% and 61.4%, respectively, for the same period last year.
TABLE 9: WHOLESALE BANKING
(millions of Canadian dollars, except as noted) For the three months ended For the nine months ended
July 31 April 30 July 31 July 31 July 31 2016 2016 2015 2016 2015
Net interest income (TEB) $ 390 $ 440 $ 564 $ 1,289 $ 1,745 Non-interest income 469 326 201 1,000 515
Total revenue 859 766 765 2,289 2,260 Provision for credit losses 11 50 2 73 4 Non-interest expenses 437 441 431 1,307 1,311
Net income $ 302 $ 219 $ 239 $ 682 $ 677
Selected volumes and ratios Trading-related revenue $ 447 $ 429 $ 425 $ 1,256 $ 1,229
Gross drawn (billions of dollars)1 21 19 16 21 16 Return on common equity 20.4 % 14.8 % 17.2 % 15.2 % 15.9 % Efficiency ratio 50.9 57.6 56.3 57.1 58.0
Average number of full-time equivalent staff 3,808 3,649 3,736 3,724 3,751 1 Includes gross loans and bankers' acceptances, excluding letters of credit and before any cash collateral, credit default swaps, and reserves for the corporate lending business.
Quarterly comparison – Q3 2016 vs. Q3 2015
Wholesale Banking net income for the quarter was $302 million, an increase of $63 million, or 26%, compared with the third quarter last year reflecting higher
revenue, partially offset by higher PCL and higher non-interest expenses. The annualized ROE for the quarter was 20.4%, compared with 17.2% in the third
quarter last year.
Wholesale Banking revenue is derived primarily from capital markets services and corporate lending. The capital markets businesses generate revenue from
advisory, underwriting, trading, facilitation, and trade execution services. Revenue for the quarter was $859 million, an increase of $94 million, or 12%, compared
with the third quarter last year reflecting higher origination activity from debt and equity capital markets, higher corporate lending fees and higher trading-related
revenue.
PCL increased $9 million compared with the third quarter last year reflecting specific provisions in the oil and gas sector.
Non-interest expenses were $437 million, an increase of $6 million, or 1%, compared with the third quarter last year, reflecting higher variable compensation
and the unfavourable impact of foreign exchange translation, partially offset by lower operating expenses.
Quarterly comparison – Q3 2016 vs. Q2 2016
Wholesale Banking net income for the quarter increased $83 million, or 38%, compared with the prior quarter reflecting higher revenue, lower PCL and lower non-
interest expenses, partially offset by a higher effective tax rate. The annualized ROE for the quarter was 20.4%, compared with 14.8% in the prior quarter.
Revenue for the quarter increased $93 million, or 12%, compared with the prior quarter reflecting higher origination activity from debt and equity capital markets,
higher corporate lending fees and higher trading-related revenue.
PCL for the quarter was $11 million, a decrease of $39 million, reflecting lower specific provisions in the oil and gas sector.
Non-interest expenses for the quarter decreased $4 million, or 1%, compared with the prior quarter.
Year-to-date comparison – Q3 2016 vs. Q3 2015
Wholesale Banking net income for the nine months ended July 31, 2016, was $682 million, an increase of $5 million, compared with the same period last year
reflecting higher revenue, lower non-interest expenses and a lower effective tax rate, partially offset by higher PCL. The annualized ROE was 15.2%, compared
with 15.9% in the same period last year.
Revenue was $2,289 million, an increase of $29 million, or 1%, compared with the same period last year.
PCL was $73 million, an increase of $69 million compared with the same period last year, reflecting specific provisions in the oil and gas sector.
Non-interest expenses were $1,307 million, a decrease of $4 million, compared with the same period last year.

TD BANK GROUP • THIRD QUARTER 2016 • EARNINGS NEWS RELEASE Page 12
TABLE 10: CORPORATE
(millions of Canadian dollars) For the three months ended For the nine months ended
July 31 April 30 July 31 July 31 July 31 2016 2016 2015 2016 2015
Net income (loss) – reported $ (241) $ (350) $ (204) $ (793) $ (827)
Adjustments for items of note, net of income taxes1 Amortization of intangibles 58 63 62 186 190 Fair value of derivatives hedging the reclassified available-for-sale securities portfolio – 51 (19) 10 (34) Impairment of goodwill, non-financial assets, and other charges – 116 – 116 – Restructuring charges – – – – 228
Net income (loss) – adjusted $ (183) $ (120) $ (161) $ (481) $ (443)
Decomposition of items included in net income (loss) – adjusted Net corporate expenses $ (222) $ (196) $ (193) $ (621) $ (542) Other 10 48 4 54 16 Non-controlling interests 29 28 28 86 83
Net income (loss) – adjusted $ (183) $ (120) $ (161) $ (481) $ (443) 1
For explanations of items of note, refer to the "Non-GAAP Financial Measures – Reconciliation of Adjusted to Reported Net Income" table in the "How We Performed" section of this
document.
Quarterly comparison – Q3 2016 vs. Q3 2015
Corporate segment's reported net loss for the quarter was $241 million, compared with a reported net loss of $204 million in the third quarter last year. Reported
net loss included gains related to the fair value of derivatives hedging the reclassified available-for-sale securities portfolio in the third quarter last year. Adjusted
net loss was $183 million, compared with an adjusted net loss of $161 million in the third quarter last year. Adjusted net loss increased primarily due to higher net
corporate expenses, partially offset by higher contribution from Other Items. Net corporate expenses increased due to ongoing investments in enterprise and
regulatory projects. Other items included higher revenue from treasury and balance sheet management activities and higher provisions for incurred but not
identified credit losses due to credit deterioration in exposures within the oil and gas industry, and volume growth within the Canadian Retail and Wholesale
Banking loan portfolios.
Quarterly comparison – Q3 2016 vs. Q2 2016
Corporate segment's reported net loss for the quarter was $241 million, compared with a reported net loss of $350 million in the prior quarter. Reported net loss in
the second quarter included impairment of goodwill, non-financial assets, and other charges, and losses related to the fair value of derivatives hedging the
reclassified available-for-sale securities portfolio. Adjusted net loss was $183 million, compared with an adjusted net loss of $120 million in the prior quarter.
Adjusted net loss increased primarily due to higher net corporate expenses and lower contribution from Other Items. Lower contribution from Other Items included
higher tax provisions this quarter and lower revenue from treasury and balance sheet management activities, partially offset by lower provisions for incurred but not
identified credit losses.
Year-to-date comparison – Q3 2016 vs. Q3 2015
Corporate segment’s reported net loss for the nine months ended July 31, 2016, was $793 million, compared with a reported net loss of $827 million in the same
period last year. Reported net loss included impairment of goodwill, non-financial assets, and other charges, and losses related to the fair value of derivatives
hedging the reclassified available-for-sale securities portfolio in the current period, and restructuring charges, partially offset by gains related to the fair value of
derivatives hedging the reclassified available-for-sale securities portfolio in the same period last year. Adjusted net loss for the nine months ended July 31, 2016,
was $481 million, compared with an adjusted net loss of $443 million in the same period last year. The increase in adjusted net loss was due to higher net
corporate expenses, partially offset by higher contribution from Other Items. Net corporate expenses increased due to ongoing investments in enterprise and
regulatory projects. Higher contribution from Other Items was primarily due to higher revenue from treasury and balance sheet management activities and lower
tax provisions in the current period, partially offset by higher provisions for incurred but not identified credit losses due to an increase in portfolio risk, credit
deterioration in exposures impacted by low oil and gas prices, and volume growth within the Canadian Retail and Wholesale Banking loan portfolios.

TD BANK GROUP • THIRD QUARTER 2016 • EARNINGS NEWS RELEASE Page 13
SHAREHOLDER AND INVESTOR INFORMATION
Shareholder Services
If you: And your inquiry relates to: Please contact:
Are a registered shareholder (your name
appears on your TD share certificate)
Missing dividends, lost share certificates, estate
questions, address changes to the share register,
dividend bank account changes, the dividend
reinvestment plan, eliminating duplicate mailings of
shareholder materials or stopping (and resuming)
receiving annual and quarterly reports
Transfer Agent:
CST Trust Company
P.O. Box 700, Station B
Montréal, Québec H3B 3K3
1-800-387-0825 (Canada and U.S. only)
or 416-682-3860
Facsimile: 1-888-249-6189
[email protected] or www.canstockta.com
Hold your TD shares through the
Direct Registration System
in the United States
Missing dividends, lost share certificates, estate
questions, address changes to the share register,
eliminating duplicate mailings of shareholder materials
or stopping (and resuming) receiving annual and
quarterly reports
Co-Transfer Agent and Registrar
Computershare
P.O. Box 30170
College Station, TX 77842-3170, or
Computershare
211 Quality Circle, Suite 210
College Station, TX 77845
1-866-233-4836
TDD for hearing impaired: 1-800-231-5469
Shareholders outside of U.S.: 201-680-6578
TDD shareholders outside of U.S.: 201-680-6610
www.computershare.com
Beneficially own TD shares that are held in
the name of an intermediary, such as a bank,
a trust company, a securities broker or other
nominee
Your TD shares, including questions regarding the
dividend reinvestment plan and mailings of shareholder
materials
Your intermediary
For all other shareholder inquiries, please contact TD Shareholder Relations at 416-944-6367 or 1-866-756-8936 or email [email protected].
Please note that by leaving us an e-mail or voicemail message, you are providing your consent for us to forward your inquiry to the appropriate party for
response.
Access to Quarterly Results Materials
Interested investors, the media and others may view this third quarter earnings news release, results slides, supplementary financial information, and the Report to
Shareholders on the TD Investor Relations website at www.td.com/investor/.
General Information
Contact Corporate & Public Affairs: 416-982-8578
Products and services: Contact TD Canada Trust, 24 hours a day, seven days a week: 1 -866-567-8888
French: 1-866-233-2323
Cantonese/Mandarin: 1-800-328-3698
Telephone device for the hearing impaired (TTY): 1-800-361-1180
Website: www.td.com
Email: [email protected]

TD BANK GROUP • THIRD QUARTER 2016 • EARNINGS NEWS RELEASE Page 14
Quarterly Earnings Conference Call
TD Bank Group will host an earnings conference call in Toronto, Ontario on August 25, 2016. The call will be audio webcast live through TD's website at
3 p.m. ET. The call and audio webcast will feature presentations by TD executives on the Bank's financial results for the third quarter, discussions of
related disclosures, and will be followed by a question-and-answer period with analysts. The presentation material referenced during the call will be
available on the TD website at www.td.com/investor/qr_2016.jsp on August 25, 2016, by approximately 12 p.m. ET. A listen-only telephone line is available
at 416-204-9271 or 1-800-505-9568 (toll free).
The audio webcast and presentations will be archived at www.td.com/investor/qr_2016.jsp. Replay of the teleconference will be available from 6 p.m. ET on
August 25, 2016, until 6 p.m. ET on September 30, 2016, by calling 647-436-0148 or 1-888-203-1112 (toll free). The passcode is 9997574.
Annual Meeting
Thursday, March 30, 2017
Design Exchange
Toronto, Ontario
About TD Bank Group
The Toronto-Dominion Bank and its subsidiaries are collectively known as TD Bank Group ("TD" or the "Bank"). TD is the sixth largest bank in North America by
branches and serves approximately 25 million customers in three key businesses operating in a number of locations in financial centres around the globe:
Canadian Retail, including TD Canada Trust, TD Auto Finance Canada, TD Wealth (Canada), TD Direct Investing, and TD Insurance; U.S. Retail, including
TD Bank, America's Most Convenient Bank, TD Auto Finance U.S., TD Wealth (U.S.), and an investment in TD Ameritrade; and Wholesale Banking, including
TD Securities. TD also ranks among the world's leading online financial services firms, with approximately 10.8 million active online and mobile customers. TD had
CDN$1.2 trillion in assets on July 31, 2016. The Toronto-Dominion Bank trades under the symbol "TD" on the Toronto and New York Stock Exchanges.
For further information contact:
Gillian Manning, Head of Investor Relations, 416-308-6014
Ali Duncan Martin, Manager, Media Relations, 416-983-4412


