

Teaching an Understanding of Tactile Graphics to Students Who Are BlindJanuary 30, 20159am-Noon
What’s Next
• Friday Jan. 30th, 9-noon• Before this session, you should have taught a
lesson, monitored progress, collaborated with a peer about the lesson, and written a reflection on your implementation and results.• Sharing lessons, etc.• 3-D tactile printing• Creating tactile graphics on the Perkins brailler• Wrap up and closure
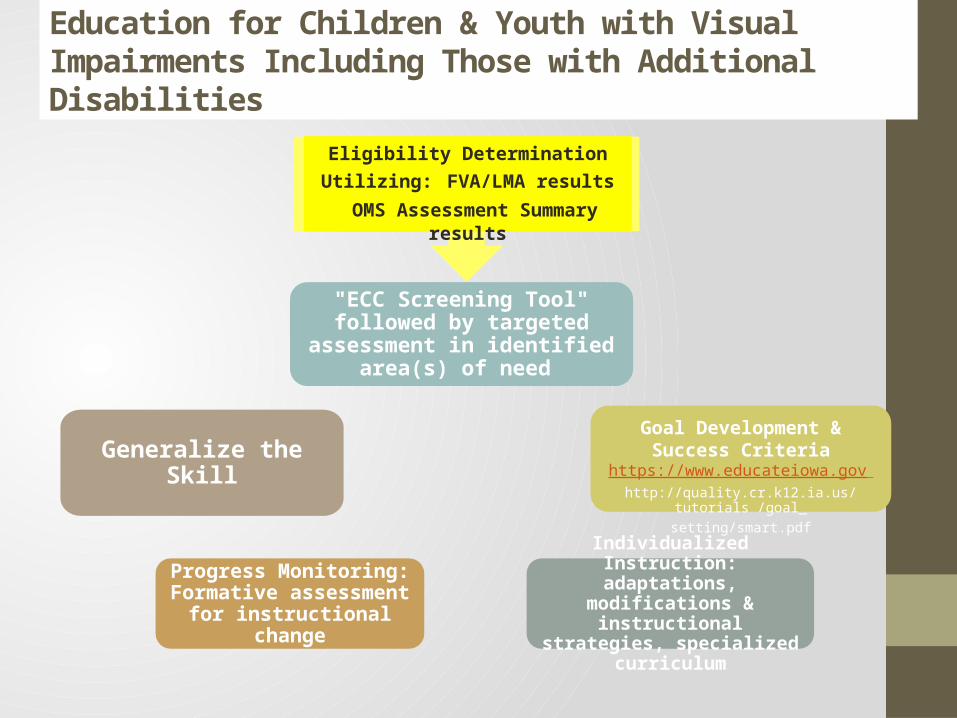
"ECC Screening Tool" followed by targeted assessment in identified
area(s) of need
Goal Development & Success Criteriahttps://www.educateiowa.gov
http://quality.cr.k12.ia.us/tutorials /goal_setting/smart.pdf
Individualized Instruction: adaptations, modifications &
instructional strategies, specialized curriculum
Progress Monitoring: Formative assessment for
instructional change
Generalize the Skill
Eligibility Determination Utilizing: FVA/LMA results
OMS Assessment Summary results
Education for Children & Youth with Visual Impairments Including Those with Additional Disabilities
Sharing Out on Implementation and Results• Describe the lesson(s) you have done with your
student(s) this school year.• Describe what your student(s) learned.• What type of formative assessment did you use?• Observation, Questioning, Discussion, Self-assessment, As
I See It, Short quiz, 3-minute pause with probe, Debriefing, One sentence summary, Muddiest (or Clearest) Point, 3-2-1, other
• Describe what you learned.• Share a strength of your partner’s instruction.
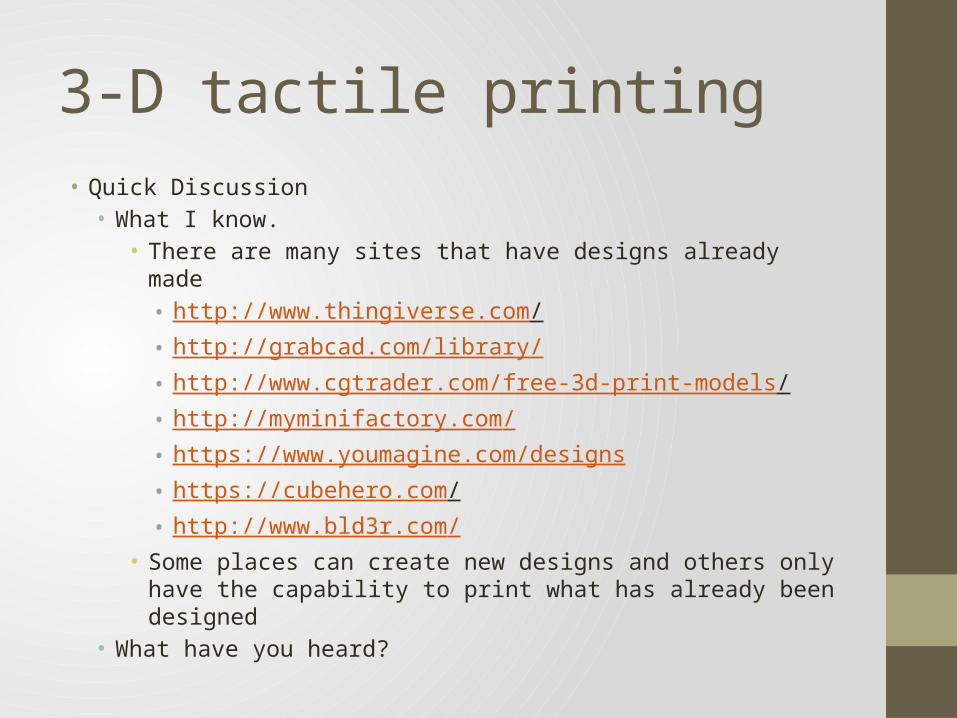
3-D tactile printing• Quick Discussion• What I know.• There are many sites that have designs already made• http://www.thingiverse.com/ • http://grabcad.com/library/• http://www.cgtrader.com/free-3d-print-models/ • http://myminifactory.com/• https://www.youmagine.com/designs• https://cubehero.com/ • http://www.bld3r.com/
• Some places can create new designs and others only have the capability to print what has already been designed
• What have you heard?

Creating tactile graphics on the Perkins brailler• When to use a numeric indicator• Digital and Analog Clocks• Money• Number Lines• Dot Plots, also called Line Plots• Pictographs• Stem and Leaf Plots• Box and Whisker Plots• Bar Graphs• Frequency Tables, Frequency Distribution, or use of Tally
Marks

Numeric IndicatorOmit Measuring tools
Barometer Ruler Protractor Thermometer Beaker
Number lines Line plots Cartesian graphs Analog Clocks
Include Pie charts/Spinners Histograms Bar graphs Line graphs Scatter plots Pictographs Time lines Latitude/Longitude Digital Clocks
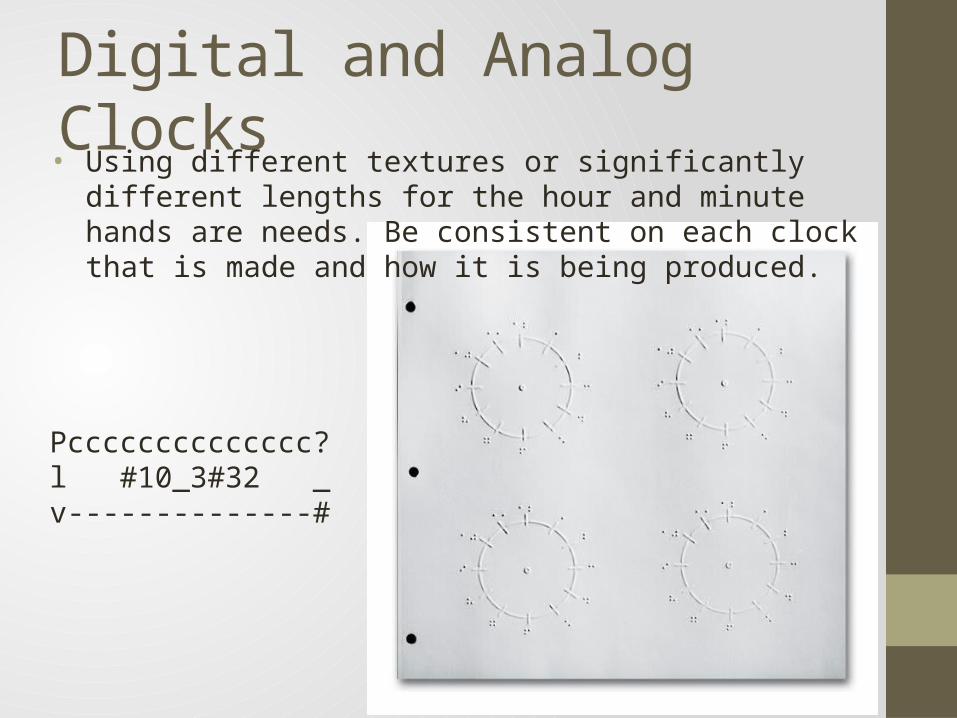
Digital and Analog Clocks• Using different textures or significantly different lengths for the
hour and minute hands are needs. Be consistent on each clock that is made and how it is being produced.
Pcccccccccccccc?l #10_3#32 _v--------------#

Money – no tactile
• When identification of coins or bills and their values is being taught • do not illustrate images on coins or bills • real coins and bills should be used in class
• Use a transcriber’s note to tell how many twenty-dollar bills, ten-dollar bills, quarters, dimes, nickels, and pennies.

Key for Money
Bills $1 for one dollar $5 for five dollar
Coins pn penny nk nickel dm dime qr quarter hl half-dollar
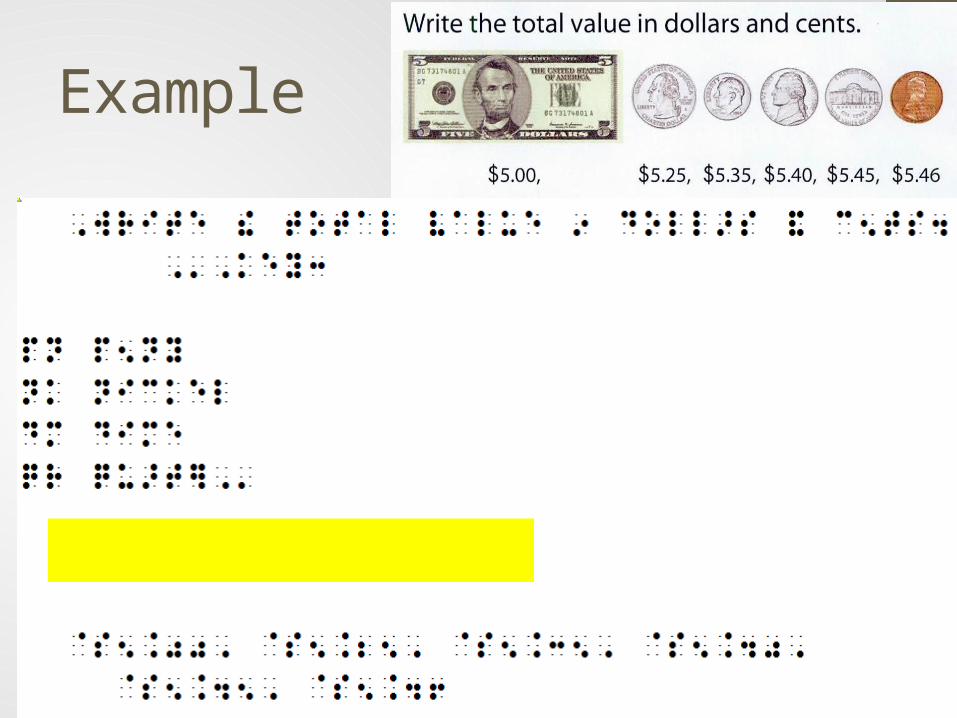
Example

Number Lines• “ow” (dots 2,4,6) left-pointing arrowhead• “3” (dots 2,5) line (axis line)• “r” (dots 1,2,3,5) coordinate scale mark• “o” (dots 1,3,5) right-pointing arrowhead• Use “ow”,3,3,r,3,3,r,3,3,r,3,3,”o”• Appropriate Nemeth code numbers (without numeric indicators)• The next symbols are used to create the graph on the number
line.• Full cell (dots 1,2,3,4,5,6) solid (filled-in) circle (point included) placed
above the number line• “x” (dots 1,3,4,6) open circle (point not included) placed above the
number line (only necessary when graphing an inequality involving "<" or ">" or "not equal to")
• “7” (dots 2,3,5,6) shading of the rest of the points included in the solution on the number line itself
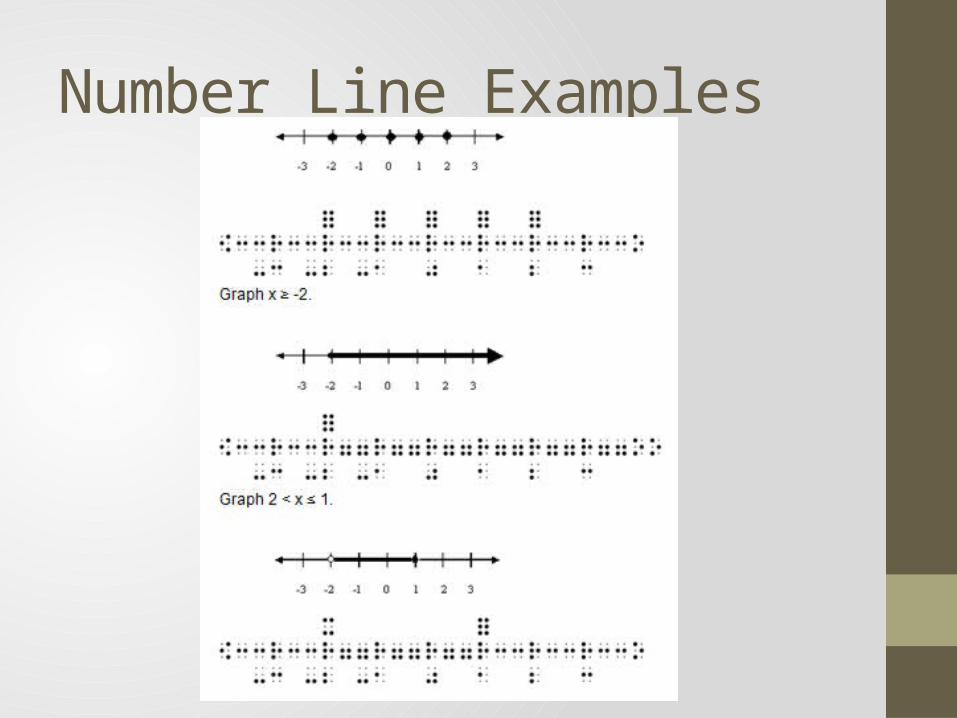
Number Line Examples

Dot Plots, also called Line Plots
• Line plots are a series of dots or x’s above a number line. • Follow the number line rules • Use full cells for the dots or x’s • Include a Transcriber’s Note about the
change

Example

Pictographs – Embossed
• shapes must be a whole or half unit•= represents a whole unit •l represents a half unit •pictograph in boxes may retain the
top and bottom lines

Example

Stem and Leaf Plots

Stem and Leaf Plots in Braille

Box and Whisker Plots• Some different ways they can be done
• Type a number on the Perkins brailler and then use dot 2-5’s for the whiskers (horizontal lines left and right of the boxes), x’s for the boxed areas, and a full cell where the two boxes meet which is at the median. The full cell could also be use at each of the dots which is at the min, max, 1st and 3rd quartiles, and median.
• Use a number line already made (number line device from APH, disposable number lines from APH, or one made on the Perkins brailler using a series of 3’s and r’s). Then he can use tactile dots for points and graphic art tape or wikkistix for boxes.
• Use of graph paper, feel and peel square stickers, and tactile dots to lay it out horizontally.
• Some combination of these. Feel free to be creative here. The key is to have the horizontal values on a number line, dots to represent the 5 key points, and something thicker to represent the boxed areas. It wouldn’t technically have to be boxes.
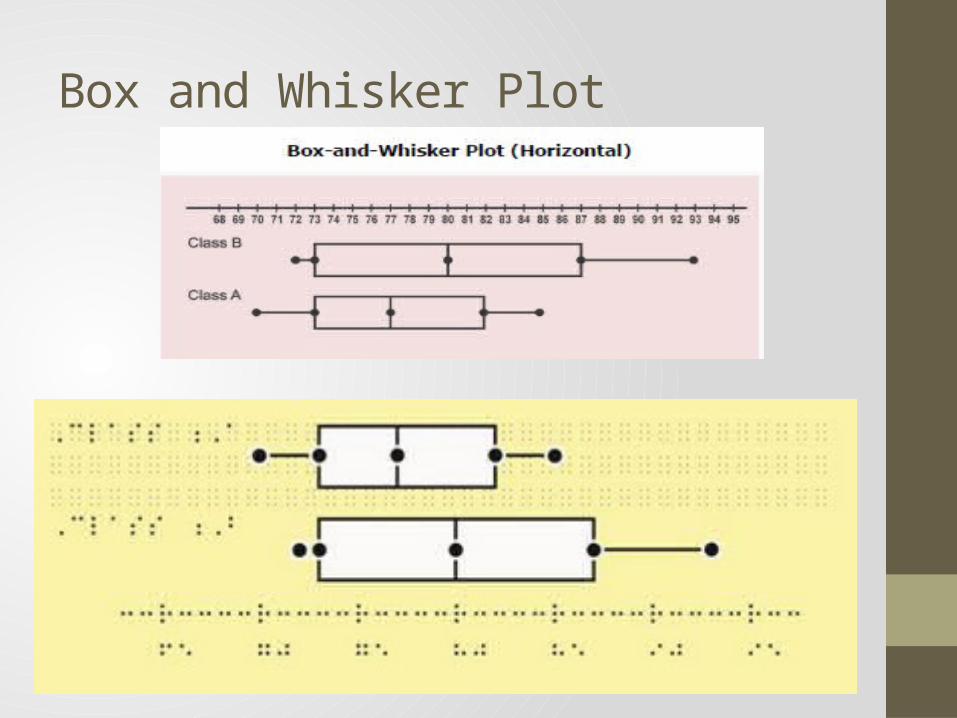
Box and Whisker Plot
Bar Graphs
• They can be made vertically or horizontally on the Perkins brailler. • You can also use tactile graph paper and
stickers to make these as long as the concept is there.

Bar Graphs

Frequency Tables, Frequency Distribution, or use of Tally Marks• Notice dot 4-5-6 is used for each tally mark and they are done
in groups of 5 with a space between groups. Some books also have you actually write how many tally marks are on that line.

Wrap-Up and Closure
•What has been your biggest Aha! moment and why?•What resources/materials did you find
most valuable/useful?• Discuss what questions you still have or
resources you still need.•What did you use for videotaping, pre- &
post-observation, and collaborating with your partner (what went well/what didn’t)?
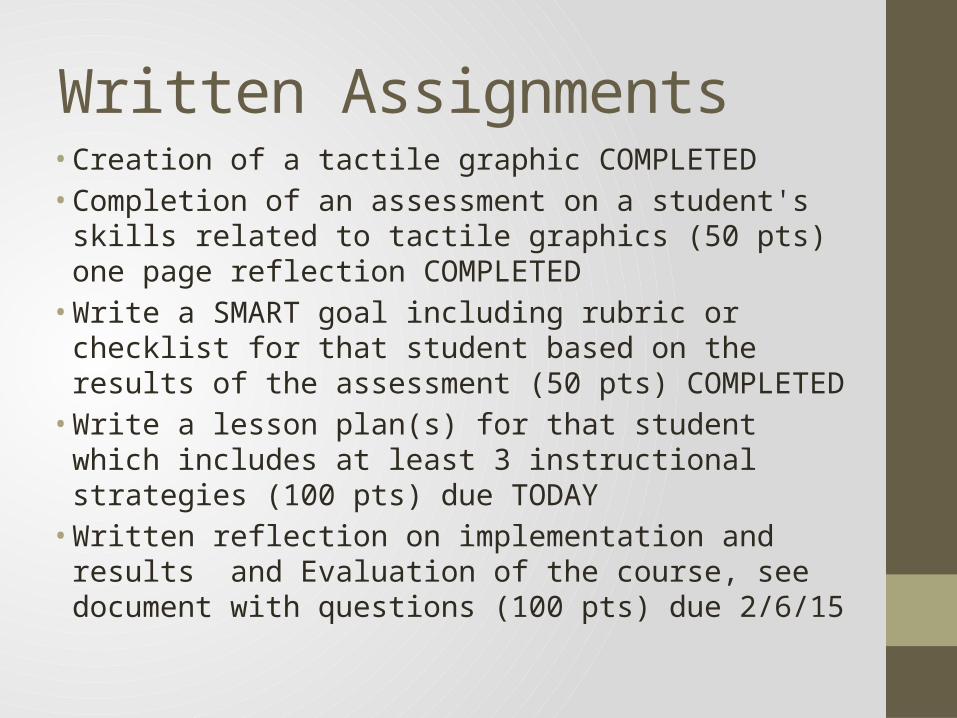
Written Assignments• Creation of a tactile graphic COMPLETED• Completion of an assessment on a student's skills
related to tactile graphics (50 pts) one page reflection COMPLETED • Write a SMART goal including rubric or checklist for
that student based on the results of the assessment (50 pts) COMPLETED • Write a lesson plan(s) for that student which includes
at least 3 instructional strategies (100 pts) due TODAY• Written reflection on implementation and results and
Evaluation of the course, see document with questions (100 pts) due 2/6/15


