

AUTHOR’S PROOF
1 © The Meteoritical Society, 2008. Printed in USA.
Meteoritics & Planetary Science 43, Nr 12, 1–crossref to last page (2008)
Abstract available online at http://meteoritics.org
The effect of target properties on crater morphology: Comparison of central peak
craters on the Moon and Ganymede
Veronica J. BRAY1, 3*, Gareth S. COLLINS1, Joanna V. MORGAN1, and Paul M. SCHENK2
1Earth Science and Engineering Department, Imperial College London, Exhibition Road, London, SW7 2BP, UK2Lunar and Planetary Institute, 3600 Bay Area Blvd., Houston, Texas, 77058, USA
3Lunar and Planetary Laboratory, University of Arizona, Tucson, Arizona, 85721, USA*Corresponding author. E-mail: [email protected]
(Received 23 March 2008; revision accepted 01 December 2008)
Abstract–We examine the morphology of central peak craters on the Moon and Ganymede in order
to investigate differences in the near-surface properties of these bodies. We have extracted
topographic profiles across craters on Ganymede using Galileo images, and use these data to compile
scaling trends. Comparisons between lunar and Ganymede craters show that crater depth, wall slope
and amount of central uplift are all affected by material properties. We observe no major differences
between similar-sized craters in the dark and bright terrain of Ganymede, suggesting that dark terrain
does not contain enough silicate material to significantly increase the strength of the surface ice.
Below crater diameters of ∼12 km, central peak craters on Ganymede and simple craters on the Moon
have similar rim heights, indicating comparable amounts of rim collapse. This suggests that the
formation of central peaks at smaller crater diameters on Ganymede than the Moon is dominated by
enhanced central floor uplift rather than rim collapse. Crater wall slope trends are similar on the Moon
and Ganymede, indicating that there is a similar trend in material weakening with increasing crater
size, and possibly that the mechanism of weakening during impact is analogous in icy and rocky
targets. We have run a suite of numerical models to simulate the formation of central peak craters on
Ganymede and the Moon. Our modeling shows that the same styles of strength model can be applied
to ice and rock, and that the strength model parameters do not differ significantly between materials.
I�TRODUCTIO�
Impact cratering is a complex process that depends upon
the size, velocity and composition of the impacting body, as
well as the gravity and near-surface properties of the target.
As a result of the latter, the study of impact craters offers a
tool for investigating the subsurface structure and
composition of solar system bodies. For example, the crater
diameter at which small bowl-shaped “simple” craters
develop into “complex” craters (those with terraced or
slumped crater rims, flat floors and additional central features
such as central peaks or peak-rings; see Melosh 1989) is
approximately inversely proportional to the target body’s
gravity (Pike 1977, 1988), but is also affected by differences
in target properties (Head 1976; Grieve 1987).
The surfaces of the Galilean satellites of Ganymede and
Europa are composed primarily of water ice (Showman et al.
2004), making craters on these bodies useful for studying
impact into ice. Craters on these bodies exhibit the same
simple and central peak morphologies seen for craters below
∼150 km in diameter on the Moon. However, the largest
craters on the icy Galilean satellites display exotic
morphologies that have no obvious lunar analogues (e.g.,
large central pits; see Fig. 5d) (Croft et al. 1985; McKinnon
et al. 1991). As the gravities of Ganymede and Europa are
similar to the Earth’s moon (1.43 m s−2 and 1.33 m s−2,
respectively, relative to 1.63 m s−2 for the Moon), the unusual
crater morphologies are considered to be due to the
mechanical properties of ice or the presence of subsurface
liquid layers (e.g., Moore et al. 2001; Schenk 2002).
An important goal of future research is to determine
whether impact crater morphology can be used to estimate ice
thickness as it has implications for the accessibility and
habitability of these putative subsurface oceans (e.g., Chyba
2000). This requires further understanding of the crater
formation process in ice before the crater morphologies
created as a result of subsurface layering can be differentiated
from those occurring as a direct result of the cratering process
in ice. As the ice crust of Ganymede is thicker than that of
Europa, the morphologies of its smaller craters are expected

2 V. J. Bray et al.
to be relatively unaffected by the presence of its subsurface
ocean (Schenk 2002), and thus provide a suitable source for
observations of craters that have formed in unlayered ice.
The use of computer modelling has advanced
investigation of the impact process, allowing complex crater
collapse to be studied on planetary scales. Before a numerical
modeling approach can be used to estimate ice layer
thickness, we must first better determine the mechanical
properties of ice, as hydrocodes rely on accurate strength
models to recreate the material behavior during crater
formation.
This paper is split into two parts. First, we present
existing observational data for the Moon and Ganymede, and
new topographic profiles of central peak craters on
Ganymede, created from Galileo photoclinometry and stereo
photogrammy. These profiles are used to create scaling trends
which are then compared to existing lunar and Ganymede
trends. The differences in lunar and Ganymede crater scaling
are discussed and used to infer differences in the near-surface
properties of these two bodies. In the second part of the paper,
we present results of simulated crater formation in rock and
ice using dynamic modeling codes, testing results by
comparison with observational data, similar to previous
works (e.g., Turtle and Pierazzo 2001; Collins et al. 2002).
We compare our icy impact model results with the observed
topographic profiles and scaling trends of Ganymede craters,
and use these comparisons to determine the range of target
strength parameters that can produce a reasonable match
between the modelled and observed data. These values are
then compared to model parameters for lunar craters, and
used to draw additional information on the differences
between the surfaces of the Moon and Ganymede.
OBSERVATIO�S
Method
Topographic mapping of planetary surfaces is commonly
based on a combination of direct shadow measurement,
photoclinometry, stereo image analysis and where possible
laser altimetry, and has been completed for the Moon and
Galilean satellites (e.g., Smith et al. 1997; Schenk et al. 2001).
The lack of laser altimetry of the Galilean satellites restricts
height measurements of surface features to image-based
methods. For information on stereo and photoclinometric
techniques see Efford (1991) and Jankowski and Squyres
(1991).
The majority of current topographic data available for
Ganymede is based on Voyager images that have a maximum
horizontal resolution of ∼0.5 km per pixel. This resolution
translates to uncertainties on depth measurements between 10
and 30% (Schenk 1991). Higher resolution Galileo data has
been used to refine depth-diameter plots and measurements
(e.g., Schenk 2002), with systematic errors on depth
measurements of ∼5% (Schenk et al. 2004); crater wall slopes
and other measurements requiring height data have not yet
been presented. Height measurements based on these higher-
resolution data are expected to be of higher accuracy,
especially with regard to small diameter craters. However, the
lower number of craters imaged by Galileo will lead to a
higher apparent variability of the crater dimensions.
We used a combination of Galileo stereo and
photoclinometry to produce topographic profiles of 38 craters
on Ganymede, including 19 fresh central peak craters which
range in size from 4.7 km to 50.4 km in diameter, and host
peak widths of 1.7 to 25 km. The freshest craters on
Ganymede display highly variable bright and dark deposits on
their floors and rims (Schenk and McKinnon 1991). As the
accuracy of digital elevation models (DEMs) derived via
photoclinometry is highly affected by surface albedo
variations, we restricted our measurements to slightly more
mature central peak craters that have lost most of their
extreme albedo deposits while remaining morphologically
crisp.
The Ganymede surface is separated into distinct bright
and dark terrains which are believed to consist of pure ice, and
an ice-rock mix, respectively (Breneman and Belton 1998).
The dark terrain is considered to be older than the bright
terrain, and to have undergone larger degrees of mass-wasting
processes on account of its higher (albedo-induced)
temperature (Moore et al. 1996). Terrain type was noted at the
time of profile collection so that any differences in crater
trends on bright and dark terrains could be documented.
Our photoclinometry incorporated the combined lunar-
Lambert photometric function as defined by McEwen (1991),
and was chosen over other options such as the Minnaert
function on account of its greater applicability, especially
near the limb and at moderate to high phase angles. Our stereo
data was created from Galileo Solid State Imager (SSI) data,
with the use of the scene-recognition algorithm developed by
Schenk et al. (2004). Once each DEM of a crater was
obtained, spurious patterns or shape distortions created by
radiation noise or data compression artefacts were removed
through the use of standard image noise filters, and manually
by visual inspection of the DEM and original image(s). Data
gaps, deep shadows and features superimposed after impact
were also removed.
We acquired 6 to 8 radial profiles across each crater,
pairing when possible to create 3 to 4 full cross sectional
profiles; crater diameters (D) were determined from an
average of the 3 to 4 rim-to-rim distances. Measurements of
other crater dimensions and internal features were made from
all radial profiles of each crater (Fig. 1); this gave a range of
values for each crater characteristic, which have been used to
determine error bars. Errors stated in this work are inclusive
of both morphologic variation and errors inherent to the
photoclinometry/stereo process. Obvious outliers in these
values were discarded and the maximum reasonable value
The effect of target properties on crater morphology 3
adopted for each feature measurement prior to the
construction of scaling trends; height and width values in this
work should therefore be viewed as an upper bound.
In cases where the topographic data was created via
stereo and the local terrain was not significantly disrupted by
later impact or fracturing, the profile was extended up to 5
crater radii so that the pre-impact terrain surface could also be
recorded (Fig. 1); this enabled the pre-impact terrain slope to
be removed from the profiles, allowing easy comparison with
computer simulation results, for which the pre-impact surface
is represented by a smooth horizontal plain. In cases of
extreme topographic tilt, craters with morphologic features
deemed to be anomalous were not included in the data set.
Existing and �ew Data
Depth-Diameter Ratios
Observational data for lunar craters has revealed a linear
relationship between depth (d) and diameter (D) of impact
craters of the type d = αD where α is a constant of
proportionality approximately equal to 0.2 for simple craters
(Pike 1977). Simple craters are deeper relative to the crater
diameter, than larger complex craters, resulting in a shallower
d/D trend line (Pike 1977; Schenk 2002). On the Moon this
change in d/D ratio occurs at ∼11 km (Pike 1977).
The depth-diameter relationship of fresh Ganymede
craters has shown simple craters on Ganymede to have a
similar d/D slope to that of lunar craters (Schenk 1991). The
depth of complex craters on Ganymede increases with
increasing crater diameter, similar to lunar craters (Fig. 2).
However, complex craters on Ganymede are inherently
60–70% shallower than lunar craters of the same diameter
(Croft 1981). The s-c transition diameter for craters on
Ganymede was first estimated at 3 to 5 km by Passey and
Shoemaker (1982) and later refined by Schenk (1991) on the
basis of Voyager data to 5 ± 1 km. This value was updated
after more accurate Galileo measurement to reveal a smaller
s-c transition diameter of 1.9 ± 0.5 km (Schenk 2002).
In addition to the change in d/D ratio associated with the
s-c transition at crater diameters of ∼2 km, Schenk (2002)
recorded a further two transitions in d/D ratio at larger crater
sizes. The first occurs at ∼26 km is associated with a subtle
decrease in crater depths and the transition from central peak
morphology to central pit craters (Fig. 5d). Another, sharper
reduction in crater depth occurs after ∼60 km and marks the
development of anomalous crater morphologies. Both
changes in d/D ratio are thought due to temperature-induced
transitions in rheology at depth (Schenk 2002).
The depth and diameter of the fresh craters profiled in the
course of this work are presented in Fig. 2. As simple craters
were not included in this work, the s-c transition is not
discussed. There is a possible break in the d/D trend line at D
∼20 km that corresponds with the appearance of flat-floored
craters (see Melosh 1989). Tentative power-law trend line
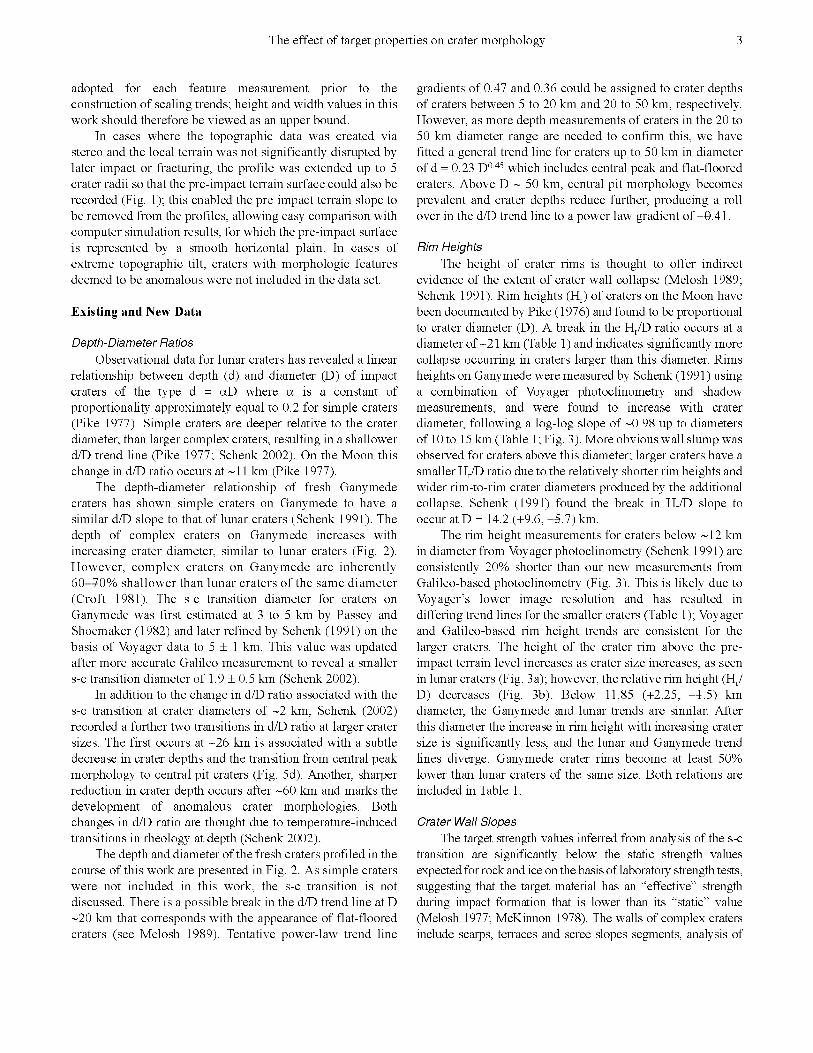
gradients of 0.47 and 0.36 could be assigned to crater depths
of craters between 5 to 20 km and 20 to 50 km, respectively.
However, as more depth measurements of craters in the 20 to
50 km diameter range are needed to confirm this, we have
fitted a general trend line for craters up to 50 km in diameter
of d = 0.23 D0.45 which includes central peak and flat-floored
craters. Above D ∼ 50 km, central pit morphology becomes
prevalent and crater depths reduce further, producing a roll
over in the d/D trend line to a power law gradient of −0.41.
Rim Heights
The height of crater rims is thought to offer indirect
evidence of the extent of crater wall collapse (Melosh 1989;
Schenk 1991). Rim heights (Hr) of craters on the Moon have
been documented by Pike (1976) and found to be proportional
to crater diameter (D). A break in the Hr/D ratio occurs at a
diameter of ∼21 km (Table 1) and indicates significantly more
collapse occurring in craters larger than this diameter. Rims
heights on Ganymede were measured by Schenk (1991) using
a combination of Voyager photoclinometry and shadow
measurements, and were found to increase with crater
diameter, following a log-log slope of ∼0.98 up to diameters
of 10 to 15 km (Table 1; Fig. 3). More obvious wall slump was
observed for craters above this diameter; larger craters have a
smaller Hr/D ratio due to the relatively shorter rim heights and
wider rim-to-rim crater diameters produced by the additional
collapse. Schenk (1991) found the break in Hr/D slope to
occur at D = 14.2 (+9.6, −5.7) km.
The rim height measurements for craters below ∼12 km
in diameter from Voyager photoclinometry (Schenk 1991) are
consistently 20% shorter than our new measurements from
Galileo-based photoclinometry (Fig. 3). This is likely due to
Voyager’s lower image resolution and has resulted in
differing trend lines for the smaller craters (Table 1); Voyager
and Galileo-based rim height trends are consistent for the
larger craters. The height of the crater rim above the pre-
impact terrain level increases as crater size increases, as seen
in lunar craters (Fig. 3a); however, the relative rim height (Hr/
D) decreases (Fig. 3b). Below 11.85 (+2.25, −1.5) km
diameter, the Ganymede and lunar trends are similar. After
this diameter the increase in rim height with increasing crater
size is significantly less, and the lunar and Ganymede trend
lines diverge. Ganymede crater rims become at least 50%
lower than lunar craters of the same size. Both relations are
included in Table 1.
Crater Wall Slopes
The target strength values inferred from analysis of the s-c
transition are significantly below the static strength values
expected for rock and ice on the basis of laboratory strength tests,
suggesting that the target material has an “effective” strength
during impact formation that is lower than its “static” value
(Melosh 1977; McKinnon 1978). The walls of complex craters
include scarps, terraces and scree slopes segments, analysis of

4 V. J. Bray et al.
which can provide information on the material strength and
target structure (e.g., Nycz and Hildebrand 2007). The average
wall slope angle is also a useful diagnostic tool when considering
the large-scale movement of the target material during impact
crater formation. As slope angle is a proxy for the “effective”
coefficient of friction (µeff), measurement of average crater wall
slope angles (S) allows µeff of the target material during the
process of impact crater formation to be estimated; this approach
is not applicable when determining the “static” coefficient of
friction of the target material prior to or after impact.
The average wall slopes of lunar craters above 15 km in
diameter decrease as crater diameter increases from 29° to
14° for 10–60 km craters (Pike 1976). This decrease in slope
angle demonstrates an effective weakening of the target
material during impact as crater size increases from µeff =
0.55 to 0.25. A kink in the slope of S/D plots is also observed
(Pike 1977), corresponding with the s-c transition. This is
attributed to the additional amount of collapse from the rim of
complex craters increasing diameter while decreasing the rim
height (Pike 1980).
A decrease in wall slope with crater size has also been
observed for Ganymede (Wood 1973), where a variation of
wall slope between 15° and 35° has been noted (Schenk
1991). A break in the S/D curve is recorded at a similar
diameter to the change in the Hr/D ratio and correlates with
the identification of slump features in Ganymede craters
above 15 ± 5 km (Schenk 1991); terraces on Ganymede crater
walls are less pronounced than in lunar craters (Schenk 1991
2002).
We recorded average wall slopes ranging from 5° to 25°
for craters in both bright and dark terrain. These average
crater wall slopes are consistently shallower than for similar
sized craters on the Moon by up to 50% (Fig. 4). The wall
slopes of Ganymede craters above 10 km in diameter
decrease as crater diameter increases from 24° for a 10 km
crater, to 17° for 50–60 km craters, a similar decrease to that
observed in lunar craters.
Central Peak Morphology
Central peaks are thought to form via uplift of the
transient crater floor during the modification phase of
impact crater formation (see Melosh 1989). It is intuitive
Fig. 1. Annotated topographic cross section of a 7 km diameter crater on dark terrain at 22.6 N, 194.1 W. Vertical exaggeration is 9.5×. D isthe rim-to-rim diameter; d is the crater depth, measured from the maximum rim elevation to the lowest point on the crater floor. The height ofthe crater rim above the average surrounding terrain level (the rim height) and maximum elevation of the central peak summit above the craterfloor (the central peak height) are noted with Hr and Hcp, respectively. Dcp is the diameter of the central peak. In cases of a two-tiered centralpeak (see Fig. 5b), the peak diameter was measured as the base of the top “tier” and did not include the lower “tier” breadth. The average wallslope calculation is noted.
Fig. 2. Depth-diameter plot of craters on Ganymede. Different cratermorphologies are noted and a lunar trend included for comparison(Pike 1977). The thin black line shows the least-squares fit to datafrom this work; error bars are representative. Best-fit results from ournumerical modeling using an empirical strength model and oneapplying acoustic fluidization (A. F.) are marked with square datapoints (see section Numerical Modeling of Crater Formation in Ice).

The effect of target properties on crater morphology 5
therefore that the larger the impact, the greater the amount of
central uplift. This is reflected by the positive correlation of
central peak diameter (Dcp) and height (Hcp) with crater
diameter noted on both the Moon and Ganymede (Passey
and Shoemaker 1982; Pike 1985; Schenk 1991). Central
peaks on Ganymede are recorded as being ∼25% wider than
central peaks in the same diameter lunar craters (Moore
et al. 1985; Schenk 1989).
Our measurements support previous observations that
central peak diameters on Ganymede are typically 1/3 of the
crater diameter (Table 1). We report a positive trend in peak
height for craters above 12 km in diameter, although crater
peak heights below this crater size do not follow published
data. Instead, we report a highly variable central peak
height, ranging from 50 to 550 m, with an average of ∼200 m
(Table 1).
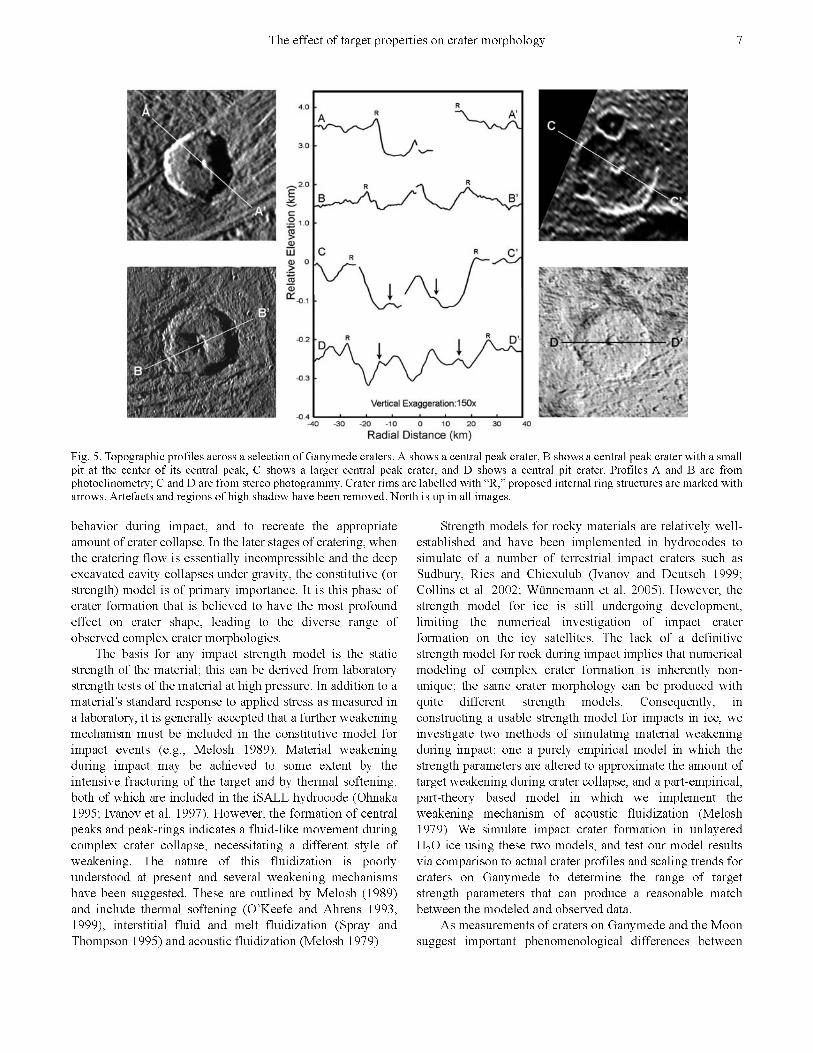
A series of central peak crater profiles is presented in Fig. 5,
showing the general morphological trend as crater size
increases. In craters below 30 km in diameter central peaks
are mainly conical in shape (e.g., Fig. 5a), although some off-
center and asymmetrical examples were recorded. Central
peaks generally remain below the level of the pre-impact
surface and certainly below the crater rim level. The larger
central peak craters that were profiled in this work show
peak heights in excess of the pre-impact surface and the
crater rim (e.g., Fig. 5b). These large central peaks are also
observed to have a two-tiered morphology with a notably
wider base. This morphology is also seen of the Europan
summit-pit crater Cilix, and several central pit craters on
Ganymede. In the largest central peak crater profiled in this
work this wide peak base is replaced by a concentric
topographically expressed uplift between the central peak
and the crater rim (Fig. 5c). Such concentric internal
features are also observed to surround the summits of central
pit craters (Fig. 5d) and increase in diameter with increasing
crater size (Bray 2008).
Observational Summary and Implications
Our selection of crater profiles provides a representative
sample of fresh central peak crater morphology on
Ganymede. The higher resolution of Galileo SSI data has
allowed the trends for smaller craters to be updated relative to
Voyager measurements. This section summarizes our findings
and discusses the implications of differences in the lunar and
Ganymede scaling trends.
Table 1. Summary of scaling trends for the Moon and Ganymede.Moon Ganymede–Voyager Ganymede–Galileo
Properties
Dependence on
crater diameter, D
D range
(km)
Dependence on
crater diameter, D
D range
(km)
Dependence on
crater diameter, D
D range
(km)
Crater depth, d 0.196 D1.01† <11 0.088 D0.989* 0.4–1.4 D0..2*** <1.9 (± 0.5)
1.044 D0.301† 11– 400 0.22 D0.44* >5 0.227 D0.446 5–50
Rim height, Hr 0.036 D1.014† <21 Hr = D1.061* <14.2 0.045 D0.772<12
0.236 D0.399† 21–400 0.085 D0.365 12–35
Peak diameter, Dcp 0.22 D†† 20–140 Dcp = 0.3 D** <14 0.300 D 5–50
Peak height, Hcp 0.006 D1.28‡‡ >35 0.0004 D2.557* <15 0.0018 D1.54 12–50
0.0006 D1.969‡ 17–51 0.09 D 0.429* >15
∼3‡ 80–200
Sources: †Pike 1977; ††Pike 1985; ‡‡Wood 1973; ‡Hale and Grieve 1982; *Schenk 1991; **Passey and Shoemaker 1982; ***Schenk 2002.
Fig. 3. a) Rim height and crater diameter measurements of craters on Ganymede. b) Relative rim height trend. Measurements from Galileo(this work) and Voyager data (Schenk 1991) are shown with closed and open circles, respectively. The narrow line shows the least squares fitto the data. For craters below ∼12 km, this trend line is based on Galileo data alone; above this crater diameter, the trend line is based on thecombined Voyager and Galileo data sets. Representative number of error bars included. The heavy line is the corresponding trend for lunarcraters (Pike 1977). Best-fit results from our numerical modeling are marked with square data points.

6 V. J. Bray et al.
Degree of Crater Collapse
For crater diameters below 11.85 (+2.25, −1.5) km, the
rim height trends of simple craters on the Moon and
complex craters on Ganymede are similar, suggesting a
common controlling factor in the rim collapse, despite the
contrasting crater types (Fig. 3). As Ganymede has a slightly
lower gravity than that of the Moon, rim heights might be
expected to be subtly larger on Ganymede. However, rims
on Ganymede decrease in height relative to their lunar
counterparts as crater size increases, demonstrating
progressively more rim collapse in ice. This disparity is
more extreme for craters above ∼12 km where the lower
relative rim heights of craters on Ganymede indicate
significantly more rim collapse, which is presumably due to
the ice-rich target.
The separate rim height trend for craters above and below
∼12 km suggests that a strength threshold is exceeded at this
diameter which prompts more rigorous collapse in larger
craters. This is separate from the s-c transition at 1.9 ± 0.5 km
(Schenk 2002), showing that central floor uplift and rim
collapse in complex craters are not necessarily connected
processes. This suggests that the earlier s-c transition on
Ganymede relative to the Moon may be the result of more
rapid floor uplift due to weaker material at depth, rather than
weaker surface ice allowing the onset of rim collapse at
smaller crater diameters. As central peak formation does not
appear to require significant rim collapse, numerical models
must be able to produce central peak morphology by another
means.
Effective Strength of the Target During Crater Formation
Crater wall slopes on Ganymede are shallower than those
in lunar craters of the same size (Fig. 4). This shows the
surface ice to have a lower effective coefficient of friction
than lunar rock during impact crater formation. There is no
obvious difference between the wall slopes of craters in dark
and bright terrain showing that the additional rock content of
the dark terrain does not provide significant strengthening to
the surface ice.
Average wall slopes of Ganymede craters decrease as
crater size increase, demonstrating an effective weakening of
the target as impact event size increases. This decrease in wall
slope is similar on the Moon and Ganymede (Fig. 4)
indicating the same trend in material weakening with crater
size on these two satellites. This suggests that the mechanism
of material weakening during impact is similar in icy and
rocky targets, and that existing lunar-style material strength
models may also be appropriate for impact simulations on icy
bodies.
Central Peak Development
The progression in central peak morphology, from a
conical shape (Fig. 5a) to a two-tiered slope with a wide
base (Fig. 5b), suggests that the central peak has become
gravitationally unstable and started to collapse downwards
and outwards. As peak collapse progresses further the
basal sections may develop into the concentric ring
morphology seen in Fig. 5c. These rings are likely to be
connected with internal crater development rather than rim
collapse as they occur inside the maximum distance from
the crater rim expected for mega-terraces (Pearce and
Melosh 1986). The features could thus be produced as the
result of outward moving peak material colliding with
collapsing rim debris, similar to a suggested mechanism
for peak-ring formation (Morgan et al. 2000; Collins et al.
2002; Osinski and Spray 2005). Alternatively, such
concentric topographic uplifts could be explained by
multiple vertical oscillations of the crater’s central region;
this would provide support for the Bingham plastic model
for peak-ring formation (Melosh 1982; Alexopoulos and
McKinnon 1994).
�UMERICAL MODELI�G OF CRATER
FORMATIO� I� ICE
Approach to Modeling
We simulate impact crater formation on the Moon and
Ganymede using the iSALE hydrocode, a multi-rheology,
multi-material extension of the SALE hydrocode (Amsden et al.
1980), specifically developed to model impact crater formation
in its entirety (Melosh 1992; Ivanov et al. 1997; Collins et al.
2004). Hydrocodes rely on accurate constitutive models and
equations of state (EoS) to correctly describe the material
Fig. 4. Wall slope and diameter measurements of craters onGanymede (this work). Lunar data is from Pike (1976). Lunar andGanymede wall slopes are shown with closed and open circles,respectively. Errors in slope measurement are ∼5% and incorporatedin the data point size. Best-fit simulation results are marked withsquare data points.
The effect of target properties on crater morphology 7
behavior during impact, and to recreate the appropriate
amount of crater collapse. In the later stages of cratering, when
the cratering flow is essentially incompressible and the deep
excavated cavity collapses under gravity, the constitutive (or
strength) model is of primary importance. It is this phase of
crater formation that is believed to have the most profound
effect on crater shape, leading to the diverse range of
observed complex crater morphologies.
The basis for any impact strength model is the static
strength of the material; this can be derived from laboratory
strength tests of the material at high pressure. In addition to a
material's standard response to applied stress as measured in
a laboratory, it is generally accepted that a further weakening
mechanism must be included in the constitutive model for
impact events (e.g., Melosh 1989). Material weakening
during impact may be achieved to some extent by the
intensive fracturing of the target and by thermal softening,
both of which are included in the iSALE hydrocode (Ohnaka
1995; Ivanov et al. 1997). However, the formation of central
peaks and peak-rings indicates a fluid-like movement during
complex crater collapse, necessitating a different style of
weakening. The nature of this fluidization is poorly
understood at present and several weakening mechanisms
have been suggested. These are outlined by Melosh (1989)
and include thermal softening (O’Keefe and Ahrens 1993,
1999), interstitial fluid and melt fluidization (Spray and
Thompson 1995) and acoustic fluidization (Melosh 1979).
Strength models for rocky materials are relatively well-
established and have been implemented in hydrocodes to
simulate of a number of terrestrial impact craters such as
Sudbury, Ries and Chicxulub (Ivanov and Deutsch 1999;
Collins et al. 2002; Wünnemann et al. 2005). However, the
strength model for ice is still undergoing development,
limiting the numerical investigation of impact crater
formation on the icy satellites. The lack of a definitive
strength model for rock during impact implies that numerical
modeling of complex crater formation is inherently non-
unique; the same crater morphology can be produced with
quite different strength models. Consequently, in
constructing a usable strength model for impacts in ice, we
investigate two methods of simulating material weakening
during impact: one a purely empirical model in which the
strength parameters are altered to approximate the amount of
target weakening during crater collapse, and a part-empirical,
part-theory based model in which we implement the
weakening mechanism of acoustic fluidization (Melosh
1979). We simulate impact crater formation in unlayered
H2O ice using these two models, and test our model results
via comparison to actual crater profiles and scaling trends for
craters on Ganymede to determine the range of target
strength parameters that can produce a reasonable match
between the modeled and observed data.
As measurements of craters on Ganymede and the Moon
suggest important phenomenological differences between
Fig. 5. Topographic profiles across a selection of Ganymede craters. A shows a central peak crater, B shows a central peak crater with a smallpit at the center of its central peak, C shows a larger central peak crater, and D shows a central pit crater. Profiles A and B are fromphotoclinometry; C and D are from stereo photogrammy. Crater rims are labelled with “R,” proposed internal ring structures are marked witharrows. Artefacts and regions of high shadow have been removed. North is up in all images.
8 V. J. Bray et al.
cratering in rock and ice, we also model impact into rock
using the two strength models, and compare the parameters
required to recreate the correct morphology of a lunar and
Ganymede crater in each case. To directly compare the
difference in model strength parameters necessary to recreate
impact cratering in ice and rock, the same style of crater must
be compared; for bodies of similar gravity, like the Moon and
Ganymede, this means the same size crater. However, the
contrasting morphological trends on the Moon and
Ganymede at large diameters mean that only simple and
central peak morphologies on the two bodies can be directly
compared. The upper bound for a suitable simulation size is
offered by a change in d/D ratio on Ganymede at D ∼ 26 km,
after which craters are believed to be affected by the presence
of subsurface rheological changes (Schenk 2002). The s-c
transition on the Moon sets a lower bound to our modeled
crater size as lunar craters below ∼15 km will be simple
craters. We therefore concentrate on the simulation of a crater
between 15 and 26 km in diameter.
Initial Conditions
Lunar impacts involve the collision of asteroids and
comets with an averaged impact velocity of ∼15 km s−1
(Wetherill 1971; Rickmann et al. 2001), while impact in the
Galilean system commonly involves Jupiter Family Comets
with velocities between 21 and 25 km s−1 (Zahnle et al. 1998).
The impactor for lunar simulations was approximated to a
gabbro projectile with an impact velocity of 15 km s−1. We
modeled our Ganymede impactor as pure water ice with an
impact velocity of 15 km s−1 and scaled the projectile size
accordingly to produce the same sized crater in both rock and
ice (Schmidt and Housen 1987); thus allowing direct
comparison to lunar simulations. The structure and
composition of both projectiles were simplified to spherical
and homogeneous. Due to the 2D axis-symmetric nature of the
hydrocode, impact angle was set to 90° instead of the more
statistically likely 45°. It is acknowledged that variation from
this value will have an effect on the subcrater stress regime.
The target structure was simplified to a homogeneous,
unlayered half-space to prevent complexities arising from
additional layering and multi-material effects. We
approximated the thermodynamic response of the lunar crust
using the Tillotson EoS for gabbroic anorthosite (Tillotson
1962; Ahrens and O’Keefe 1982). For Ganymede simulations
we used the Tillotson EoS for ice Ih (Tillotson 1962; Ivanov
et al. 2002), as the thermodynamic properties of other
compositional candidates for the Ganymede surface remain
undefined. The Tillotson EoS for ice is severely limited in its
applicability for hypervelocity impact; it includes no solid-
state or liquid phase changes and is overly simplistic in its
treatment of vapor. However, as the focus of our study was
late stage collapse, rather than early time phenomena where
an accurate EoS is paramount, this simple thermodynamic
prescription was deemed sufficient.
Standard strength parameters for gabbro were used to
form our static strength model for lunar simulations (Collins
et al. 2004, 2008). The static strength model for ice employed
in iSALE was derived from low temperature (77 K), high-
pressure laboratory data (Durham et al. 1983; Beeman et al.
1988; Rist and Murrell 1994; Weiss and Schulson 1995) and
takes account of the material strength dependence on
pressure, damage and thermal softening. In a slight
modification of Collins et al. (2004), the static strength of
damaged ice was represented not using a simple Coulomb
model, but rather the Lundborg (1968) approximation:
(1)
Where Yd0 is the effective cohesion of the damaged ice,
µd is the coefficient of friction at low pressure, and Ym is the
limiting strength at high pressure. Table 2 lists the static rock
and ice strength model parameters used in this work (see
Collins et al. 2004, 2008, for further parameter descriptions).
Weakening During Impact
We tested two models for weakening the target material.
One approach employed the static strength parameters
defined in Table 2, and incorporated the mechanism of
acoustic fluidization to weaken the target during impact.
Acoustic fluidization during impacts was first suggested by
Melosh (1979) as an extension of existing models of
earthquake induced landslides (Seed and Goodman 1964).
The basic concept involves rock debris flowing in a fluid-
like manner when subject to strong vibrations. As the
vibrations dissipate, slip events become more localized and
less frequent leading to a decrease in the size of the fluidized
region, and a larger dynamic viscosity until material strength
is regained, allowing crater morphology to be ultimately
retained.
iSALE adopts a simple mathematical approximation of
acoustic fluidization, known as the block model (Ivanov and
Kostuchenko 1997), in which the amount and longevity of
fluidization can be controlled by two parameters: the
kinematic viscosity of the fluidized region, η, and the decay
time of the block vibrations, τ (Wünnemann and Ivanov
2003). In the formal derivation of the block model Melosh
and Ivanov (1999) relate η to the average block size of the
fragmented subcrater rock mass. To determine values for the
acoustic fluidization parameters in ice and rock different
combinations of η and τ were used, controlling the relative
amount of target weakening.
As the nature of target weakening during impact is still a
matter of debate, we also used a purely empirical approach to
define the effective strength of the damaged target during
crater formation. Our empirical model used a simple Mohr-
Coulomb criterion in which the cohesion Yd0 and friction
coefficient μd in Equation 2 were varied to produce the
correct morphology for a 15 to 20 km crater.
Yd
Yd0
μdP
1 μdP+ Y
mYd0
–( )⁄--------------------------------------------------+=
The effect of target properties on crater morphology 9
(2)
Comparison to Observations
Hydrocode results must be tested by comparison to
observational (ground-truth) data such as scaling trends and
depth-diameter (d/D) plots. The best-fit model parameters for
simulation impact into ice were determined by comparing the
modeled crater morphology to an actual topographic profile
of a Ganymede crater (Fig. 6b). To ensure that the simulated
‘best-fit’ crater was representative of the general cratering
trend, the simulations were also compared to a representative
profile created from the scaling trends in Table 1 (Fig. 6a).
Modeled craters were primarily assessed on their fit to d/D
trend, rim height and wall slope. Central peak morphology
also had to be reproduced, although a strict fit to the central
peak dimensions was not critical as the central morphology of
impact craters was observed to be particularly variable.
Modeling Results
Both the empirical and the acoustic fluidization models
can simulate the correct crater depth, wall slope and
approximate central peak dimensions of craters on
Ganymede. Measurements of the simulated Ganymede crater
are included in Figs. 2 to 5 to show the best-fit model crater
dimensions relative to observational data. Figure 6 shows the
best-fit simulation results produced for both models using the
target weakening parameters presented in Table 3. Figures 6a
and 6b show the simulations results relative to a
representative crater profile constructed from the scaling
trends in Table 2, and an actual crater profile, respectively.
The crater simulated using the acoustic fluidization
model has an overly broad rim compared to the representative
profile which does not incorporate the breadth of crater rims.
This prevents a closer fit of the acoustic fluidization model
results (Fig. 6a). The empirical model also displays features
that prevent exact match to all observed crater dimensions,
including a subtle pit at the peak center. This pitted
morphology was present in all empirical model simulations in
which the crater wall slope was correctly reproduced. Craters
produced using the empirical model display constant wall
slopes and do not reproduce the break in wall slope close to
the crater rim, leading to an offset in the modeled and
observed crater rim position in Fig. 6b.
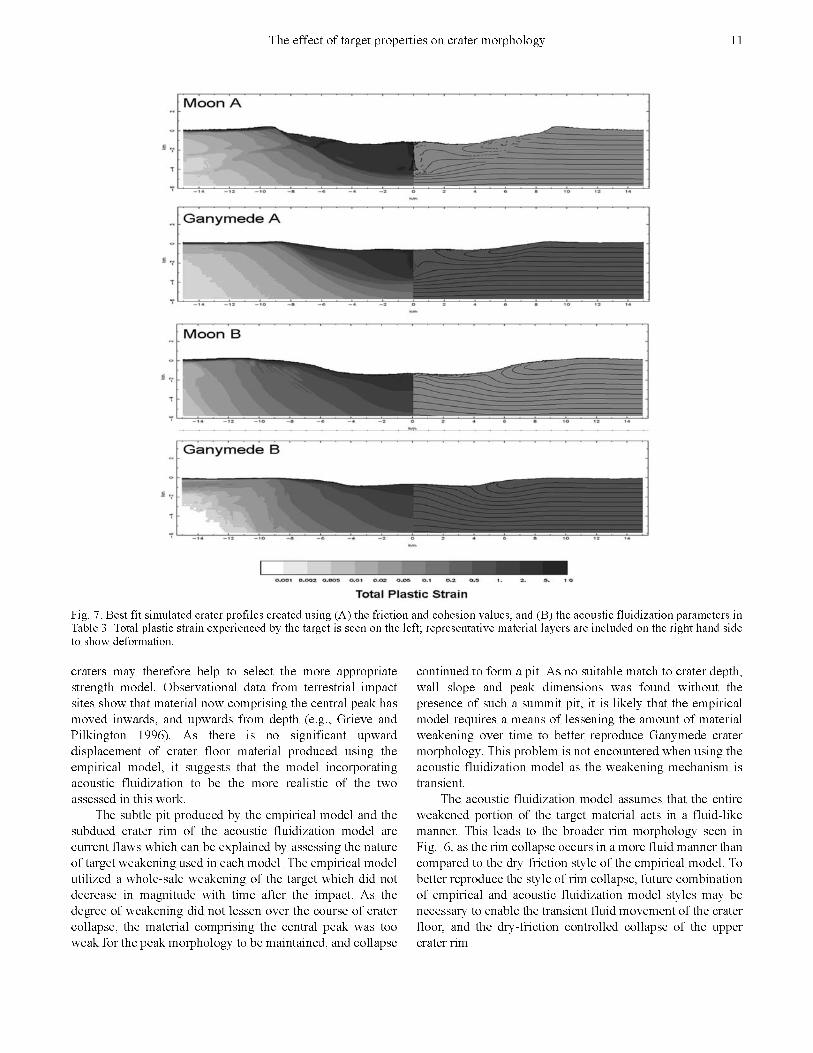
A comparison of the best-fit simulation results for central
peak craters on Ganymede and the Moon is shown in Fig. 7.
Final crater structure (right side) and total plastic strain (TPS;
left side) are shown for both the empirical (A) and theory-
based (B) best-fit models. The target weakening parameters
used to obtain the closest fit to observations of both lunar and
Ganymede craters are presented in Table 3.
Empirical Model (A)
The closest fit to lunar scaling trends was achieved using
a cohesion of 1 MPa and an effective frictional coefficient of
0.3. An effective friction coefficient of 0.23 in conjunction
with a cohesion of 0.05 MPa most accurately recreates the
morphology of a ∼20 km Ganymede central peak crater (Fig. 7,
models A).
The final crater morphology in the Moon-A and
Ganymede-A simulations was the result of rapid, large-scale
inward collapse of crater wall material that collided to form a
central peak. This style of crater formation results in a deep
bowl-shaped zone of highly deformed material beneath the
crater that extends down to the maximum depth of the crater.
This zone of heavily disrupted, inwardly collapsed material is
delineated approximately in Fig. 7 by the TPS contour of 1.
Note that a large volume of this material experienced a TPS in
excess of 2, and that structural uplift beneath the centre of the
crater extends to a depth of 3 km; beneath this, any net
displacement of material is down.
Acoustic Fluidization Model (B)
A best-fit lunar crater was produced using a decay time of
50 s and a kinematic viscosity of 125,000 m2 s−1. The closest
fit to Ganymede observational data was achieved using
similar parameter values: a decay time of 60 s, and a
kinematic viscosity of 100,000 m2 s−1.
The final crater morphology in the Moon-B and
Ganymede-B simulations was the result of a combination of
uplift of the crater floor to form the central peak, and inward
collapse of the crater wall to broaden the crater. In this case,
the deformation of the subcrater target material is distributed
over a larger volume, which results in a substantially smaller
zone of high TPS (>2) than in the empirical models (Fig. 7).
Also evident is that structural uplift beneath the centre of the
crater extends to much greater depths in the B-models than in
the A-models. Net displacement of subcrater material is
upward to a depth of ∼6 km in both “B” models.
Table 2. Impactor properties and static strength parameters.Parameter Moon Ganymede
Cohesion (yield strength at zero pressure), Y0
50 MPa 10 MPa
Damaged cohesion, Yd0 10 MPa 0.5 MPa
Von Mises plastic limit (yield strength at infinite pressure), Ym
2.5 GPa 0.11 GPa
Coefficient of internal friction, µi 1.5 2
Damaged coefficient of friction, µdi
0.6 0.6
Melt temperature, Tm 1500 °K 273 °K
Thermal softening parameter, ξ 1.2 1.2
Density of impactor and target ma-terial, ρ
2940 kg m−3 910 kg m−3
Impactor radius 0.5 km 0.3 km
Impact velocity 15 km s−1 15 km s−1
Kinetic energy of projectile 56.3 MJ 33.8 MJ
Yd
Yd0
μdP+=

10 V. J. Bray et al.
Modeling Summary and Implications
We found a best-fit to our scaling trend based profile of a
lunar crater using a cohesion of 1 MPa and an effective
coefficient of friction of 0.3. For Ganymede we achieved
best-fit results using a cohesion of 0.05 MPa and an effective
coefficient of friction of 0.23. Both the friction and cohesion
values used for ice are less than those used for rock
simulations, consistent with the Ganymede surface ice being
fundamentally weaker than lunar rock. However, the best fit
Yd0 values for rock and ice (Table 3) were both 10% of the
values expected for damaged rock/ice on the basis of
laboratory tests (Table 2). The departure of µd from the
values in Table 2 was also similar for rock and ice (50 and
40% of the pre-impact damaged coefficient of friction values,
respectively). This implies a similar amount of target
weakening during impact crater formation in rock and ice.
After investigation of kinematic viscosities spanning the
two orders of magnitude between 5 × 10³ m2 s−1 and 5 × 10⁵
m2 s−1 we determined a best-fit viscosity of 10 × 104 m2 s−1,
with a corresponding decay time of 60 s. These values are
similar to the acoustic fluidization parameters used to recreate
the lunar crater of 12.5 × 10⁴ m2 s−1 and 50 s. The similar
strength parameters used for rock and ice in both strength
models suggest that the amount of target weakening occurring
during impact does not vary significantly between rock and
ice. This could imply that the mechanism of target weakening
operates independent of target material. As there are subtle
differences in the best-fit parameter values for rock and ice,
continued modelling is required to determine whether such a
result is robust.
In simulations using the acoustic fluidization model,
central peaks are formed primarily by uplift of the target
material from depth; in simulations using the empirical
model, central peaks are formed by the collision of material
collapsing in from the transient crater rim. These two styles
of peak formation are differentiated by the size of the highly-
deformed zone beneath the crater, the maximum strain
beneath the crater, and the depth to the base of the structural
uplift (Fig. 7). Central uplifts formed using the acoustic
fluidization model extend deeper, and experience lower TPS
than central uplifts formed using the empirical model
(Fig. 7). Observations of terrestrial and extra-terrestrial
Fig. 6. Final crater profiles produced using the empirical (left) and acoustic fluidization models (right). a) Relative to a representative craterprofile constructed from the scaling trends in Table 1 (black line). b) Relative to observational data for a 17 km diameter central peak craterat 38.4 °N, 194.9 °W. The solid black line represents the topographic profile of the crater, averaged from 8 radial profiles. The dotted linesdelineate the extent of natural variation in crater topography with azimuth.
Table 3. Best-fit strength model parameters.Parameter Moon Ganymede
Empirical model:
Cohesion, Yd0 1 MPa 0.05 MPa
Coefficient of friction μd 0.3 0.23
Acoustic fluidization model:
Decay time 50 s 60 s
Kinematic viscosity 125,000 m2 s−1 100,000 m2 s−1
The effect of target properties on crater morphology 11
craters may therefore help to select the more appropriate
strength model. Observational data from terrestrial impact
sites show that material now comprising the central peak has
moved inwards, and upwards from depth (e.g., Grieve and
Pilkington 1996). As there is no significant upward
displacement of crater floor material produced using the
empirical model, it suggests that the model incorporating
acoustic fluidization to be the more realistic of the two
assessed in this work.
The subtle pit produced by the empirical model and the
subdued crater rim of the acoustic fluidization model are
current flaws which can be explained by assessing the nature
of target weakening used in each model. The empirical model
utilized a whole-sale weakening of the target which did not
decrease in magnitude with time after the impact. As the
degree of weakening did not lessen over the course of crater
collapse, the material comprising the central peak was too
weak for the peak morphology to be maintained, and collapse
continued to form a pit. As no suitable match to crater depth,
wall slope and peak dimensions was found without the
presence of such a summit pit, it is likely that the empirical
model requires a means of lessening the amount of material
weakening over time to better reproduce Ganymede crater
morphology. This problem is not encountered when using the
acoustic fluidization model as the weakening mechanism is
transient.
The acoustic fluidization model assumes that the entire
weakened portion of the target material acts in a fluid-like
manner. This leads to the broader rim morphology seen in
Fig. 6, as the rim collapse occurs in a more fluid manner than
compared to the dry-friction style of the empirical model. To
better reproduce the style of rim collapse, future combination
of empirical and acoustic fluidization model styles may be
necessary to enable the transient fluid movement of the crater
floor, and the dry-friction controlled collapse of the upper
crater rim.
Fig. 7. Best fit simulated crater profiles created using (A) the friction and cohesion values, and (B) the acoustic fluidization parameters inTable 3. Total plastic strain experienced by the target is seen on the left; representative material layers are included on the right hand sideto show deformation.
12 V. J. Bray et al.
CO�CLUSIO�S
New measurements of Ganymede craters based on
Galileo topography have supplemented and updated existing
scaling trends for central peak craters on Ganymede. Direct
comparison of these with lunar cratering trends has allowed
the dependence of crater morphology on target properties to
be assessed for rock and ice showing that the crater depth,
wall slope and amount of central uplift are all affected by
material properties. Minimal difference was noted between
craters of the same size in dark and bright terrain. This
indicates that the dark terrain of Ganymede does not contain
enough rocky material to significantly increase the strength of
the surface ice. Scaling trends for fresh craters determined
from combined data from the two terrains are thus deemed
suitable for comparisons with computer model simulations in
pure ice.
The similar rim heights of craters below ∼12 km diameter
on the Moon and Ganymede imply that a similar amount of
rim collapse occurs on both bodies during impacts of this size.
This is despite the fact that central peaks are present in craters
at these diameters on Ganymede. Together, this suggests that
the formation of central peaks at smaller crater diameters on
Ganymede than the Moon is not directly linked to rim
collapse as suggested by Pike (1980), but dominated instead
by enhanced central floor uplift due to weaker material at
depth. Conversely, the smaller rim heights of Ganymede
craters above ∼12 km diameter, relative to the rim heights of
craters on the Moon, indicate more significant rim collapse in
ice than in rock for larger craters.
Topographic profiles of the largest central peaks reveal a
two-tiered morphology, which we suggest is indicative of
basal collapse of an over-heightened central peak. If our
interpretation is correct, this observation adds support to the
hypothesis that peak-ring formation involves the collapse of a
large central peak (Melosh 1982; Alexopoulos and McKinnon
1994; Morgan et al. 2000; Collins et al. 2002; Osinski and
Spray 2005).
We used our detailed measurements of Ganymede
craters to constrain two alternative strength models for use
in hydrocode simulations of impacts in ice. In addition, we
used existing crater scaling trends for lunar craters to
constrain the same two weakening models for use in
simulations of impacts in rock. For a crater 15 to 20 km in
diameter, a simple strength model (Equation 2) gives
reasonable agreement with observation if the effective
coefficient of friction is set equal to the tangent of the
desired crater wall slope, and a cohesion of 1 and 0.05 MPa
is used for the surfaces of the Moon and Ganymede,
respectively. Observational results were also recreated for
the same size crater using a strength model which
incorporated acoustic fluidization. Both strength models
suggest that the amount of target weakening occurring
during impact varies only subtly between different
materials.
The style of crater collapse was substantially different for
the two strength models used in our numerical simulations. In
the empirical, Mohr-Coulomb model, the central peak formed
by inward collapse of the rim; in the acoustic fluidization
model, central peaks were formed primarily by uplift of the
target material from depth. Hence, if complex crater
formation is driven by floor uplift, rather than by rim collapse,
as suggested by our observations, the acoustic fluidization
model is the more appropriate mechanism for reducing target
strength in impact simulations.
Acknowledgments—This work would not have been possible
without years of iSALE model development. For this we are
especially grateful to Jay Melosh, Boris Ivanov and Kai
Wünnemann. Thanks also to Richard Grieve for many helpful
discussions, and to Mark Cintala and Thomas Kenkmann for
their thorough and constructive reviews of this manuscript.
Editorial Handling—Dr. Gordon Osinski
REFERE�CES
Alexopoulos J. S. and McKinnon W. B. 1994. Large impact cratersand basins on Venus, with implications for ring mechanics on theterrestrial planets. In Large meteorite impacts and planetaryevolution, edited by Dressler B. O., Grieve R. A. F., and SharptonV. L. GSA Special Paper 293. Boulder: Geological Society ofAmerica. pp. 29–50.
Amsden A. A., Ruppel H. M., and Hirt C. W. 1980. SALE: Asimplified ALE computer program for fluid flow at all speeds.Los Alamos National Laboratory LA-8095, Los Alamos, NM,101 p.
Beeman M., Durham W. B., and Kirby S. H. 1998. Friction of ice,Journal of Geophysical Research 93:7625–7633.
Breneman H. H. and Belton M. J. S. 1998. Dark terrain onGanymede: Geological mapping and interpretation of GalileoRegio at high resolution. Icarus135:317–344.
Bray V. J. 2008. Impact crater formation on the icy satellites. Ph.D.thesis, Imperial College, London, United Kingdom.
Chyba C. F. 2000. Energy for microbial life on Europa. �ature 403:381–382.
Collins G. S., Melosh H. J., Morgan J. V., and Warner M. R. 2002.Hydrocode simulations of Chicxulub crater collapse and peakring formation. Icarus 157:24–33.
Collins G. S., Melosh H. J., and Ivanov B. A. 2004. Damage anddeformation in numerical impact simulations. Meteoritics &Planetary Science 39:217–231.
Collins G. S., Kenkmann T., Osinski G. R., and Wünnemann K. 2008.Mid-sized complex crater formation in mixed crystallinesedimentary targets: Insight from modelling and observation.Meteoritics & Planetary Science 43. This issue.
Croft S. K. 1981. Cratering on Ganymede and Callisto: Comparisonswith the terrestrial planets. Proceedings, 12th Lunar PlanetaryScience Conference. pp. 187–189.
Croft S. K. 1985. The scaling of complex craters. Proceedings, 13thLunar Planetary Science Conference. Journal of GeophysicalResearch 90:C828–C842.
Durham W. B., Heard H. C., and Kirby S. H. 1983. Experimentaldeformation of polycrystalline H2O ice at high pressure and lowtemperature: Preliminary results. Proceedings, 14th LunarPlanetary Science Conference. Journal of Geophysical Research88:B377–B392.

The effect of target properties on crater morphology 13
Efford N. 1991. Sources of error in the photoclinometricdetermination of planetary topography—A reappraisal. Earth,Moon, and Planets 54:19–58.
Grieve R. A. F. 1987. Terrestrial impact structures. Annual Review ofEarth Planetary Sciences 15:245–270.
Grieve R. A. F. and Pilkington, M. 1996. The signature of terrestrialimpacts. AGSO Journal of Australian Geology and Geophysics.16:399–420.
Hale W. and Grieve R. A. F. 1982. Volumetric analysis of complexlunar craters: Implications for basin ring formation. Proceedings,13th Lunar Planetary Science Conference. Journal ofGeophysical Research 87:A65–A76.
Hale W. and Head J. W. 1980. Central peaks in Mercurian craters:Comparisons to the Moon. Proceedings, 11th Lunar PlanetaryScience Conference. pp. 2191–2205.
Head J. W. 1976. The significance of substrate characteristics indetermining the morphology and morphometry of lunar craters.Proceedings, 7th Lunar Science Conference. pp. 2913–2929.
Ivanov B. A. and Deutsch A. 1999. Sudbury impact event: Crateringmechanics and thermal history. In Large meteorite impacts andplanetary evolution II, edited by Dressler B. O. and Sharpton V. I.GSA Special Paper 339. Boulder: Geological Society ofAmerica. pp. 389–397.
Ivanov B.A., and Kostuchenko V. N. 1997. Impact crater formation:Dry friction and fluidization influence on the scaling andmodification. Proceedings, 27th Lunar Planetary ScienceConference. p. 1654.
Ivanov B. A., Deniem D., and Neukum G. 1997. Implementation ofdynamic strength models into 2D hydrocodes: Applications foratmospheric breakup and impact cratering. International Journalof Impact Engineering 20:411–430.
Ivanov B. A., Langenhorst F., Deutsch A., and Hornemann U. 2002.How strong was impact-induced CO2 degassing in the K/T event?Numerical modeling of shock recovery experiments. InCatastrophic events and mass extinctions: Impact and beyond, GSASpecial Paper 356. Boulder: Geological Society of America. pp.587–594.
Jankowski D. G. and Squyres S. W. 1991. Sources of error inplanetary photoclinometry. Journal of Geophysical Research 96:20,907–20,922.
Lundborg N. 1968. Strength of rock-like materials. InternationalJournal of Rock Mechanics and Mining Sciences 5:427–454.
McEwen A. S. 1991. Photometric functions fro photoclinometry andother applications. Icarus 92:298–311.
McKinnon W. B. 1978. An investigation into the role of plasticfailure in crater modification. Proceedings, 9th Lunar andPlanetary Science Conference. pp. 3965–3973.
McKinnon W. B., Chapman C. R., and Housen K. R. 1991. Crateringof the Uranian satellites, In Uranus, edited by Miner J. T. andMatthews L. D. Tucson: The University of Arizona Press. pp.629–692.
Melosh H. J. 1977. Crater modification by gravity: A mechanicalanalysis of slumping. In Impact and explosion cratering. editedby Roddy D. J., Pepin R. O., and Merrill R. B. New York:Pergamon Press. pp. 1245–1260.
Melosh H. J. 1979. Acoustic fluidization: A new geologic process?Journal of Geophysical Research 84:7513–7520.
Melosh H. J. 1982. A schematic model of crater modification bygravity. Journal of Geophysical Research 87:371–380.
Melosh H. J. 1989. Impact cratering: A geological process. NewYork: Oxford University. Press. 265 p.
Melosh H. J. and Ivanov B. A. 1999. Impact crater collapse. AnnualReview of Earth Planetary Sciences 27:385–415.
Melosh H. J., Ryan E. V., and Asphaug E. 1992. Dynamicfragmentation in impacts: Hydrocode simulation of laboratoryimpacts. Journal of Geophysical Research 97:14,735–14,759.
Moore J. M., Horner V. M., and Greeley R. 1985. Thegeomorphology of Rhea. Proceedings, 15th Lunar PlanetaryScience Conference. Journal of Geophysical Research 90:C785–C795.
Moore J. M., Mellon M. T., and Zent A. P. 1996. Mass wasting andground collapse in terrains of volatile-rich deposits as a solarsystem process: The pre-Galileo view. Icarus 122:63–78
Moore J. M., Asphaug E., Belton M. J. S., Bierhaus B., BrenemanH. H., Brooks S. M., Chapman C. R., Chuang F. C., Collins G. C.,Giese B., Greeley R., Head J. W., III, Kadel S., Klaasen K. P.,Klemaszewski J. E., Magee K. P., Moreau J., Morrison D.,Neukum G., Pappalardo R. T., Phillips C. B., Schenk P. M.,Senske D. A., Sullivan R. J., Turtle E. P., and Williams K. K.2001. Impact features on Europa: Results of the Galileo EuropaMission (GEM). Icarus 151:93–111.
Morgan J. V., Warner M. R., Collins G. S., Melosh H. J., andChristenson G. L. 2000. Peak-ring formation in large impactcraters: Geophysical constraints from Chicxulub. Earth andPlanetary Science Letters 193:347–354.
Nycz J. C. and Hildebrand A. R. 2007. Constraining strengthproperties in Martian surface layers by modeling the peripheralpeak ring impact crater morphology (abstract #1360). Bridgingthe Gap II Conference.
O’Keefe J. D. and Ahrens T. J. 1982. The interaction of theCretaceous/Tertiary extinction bolide with the atmosphere, oceanand solid earth. GSA Special Paper 190. Boulder: GeologicalSociety of America. pp. 103–120.
O’Keefe J. D. and Ahrens T. J. 1993. Planetary cratering mechanics.Journal of Geophysical Research 98:17,001–17,028.
O’Keefe J. D. and Ahrens T. J. 1999. Complex craters: Relationshipof stratigraphy and rings to impact conditions. Journal ofGeophysical Research 104:27,091–27,104.
Ohnaka M. 1995 A shear failure strength law of rock in the brittle-plastic transition regime. Geophysical Research Letters 22:25–28.
Osinski G. R. and Spray J. G. 2005. Tectonics of complex craterformation as revealed by the Haughton impact structure, DevonIsland, Canadian High Arctic. Meteoritics & Planetary Science40:1813–1834.
Passey Q. R. and Shoemaker E. M. 1982. Craters and basins onGanymede and Callisto: Morphological indicators of crustalevolution. In Satellites of Jupiter, edited by Morrison D. Tucson:The University of Arizona Press. pp. 340–378.
Pearce S. J. and Melosh H. J. 1986. Terrace width variations incomplex lunar craters. Geophysical Research Letters 13:1419–1422.
Pierazzo E., Vickery A. M., and Melosh H. J. 1997. A reevaluationof impact melt production. Icarus 127:408–423.
Pike R. J. 1976. Crater dimensions from Apollo data andsupplemental sources. The Moon 15:463–477.
Pike R. J. 1977. Size-dependence in the shape of fresh impact craterson the moon. In Impact and explosion cratering, edited by RoddyD. J., Pepin R. O., and Merill R. B. New York: Pergamon Press.pp. 489–509.
Pike R. J. 1980. Formation of complex impact craters: Mars. Icarus43:1–19.
Pike R. J. 1985. Some morphologic systematics of complex impactstructures. Meteoritics 20:49–68.
Pike R. J. 1988. Geomorphology of impact craters on Mercury. InMercury, edited by Vilas F., Chapman C., and Matthews M,Tucson: The University of Arizona Press. pp. 165–273.
Rickman H., Fernandez J. A., Tancredi G., and Licandro J. 2001. Thecometary contribution to planetary impact rates. In Collisionalproceedings in the solar system, edited by Marov M. Y. andRickman H. Dordrecht: Kluwer Academic Publishers. pp. 131–142.
14 V. J. Bray et al.
Rist M. A. and Murrell S. A. F. 1994. Ice triaxial deformation andfracture. Journal of Glaciology. 40:305–318.
Schenk P. M. 1991. Ganymede and Callisto: Complex craterformation and planetary crusts. Journal of Geophysical Research96:15,635–15,664.
Schenk P. M. 2002. Thickness constraints on the icy shells of theGalilean satellites from a comparison of crater shapes. �ature417:419–421.
Schenk P. M. and McKinnon W. B. 1991. Dark ray and dark floorcraters on Ganymede and the provenances of large impactors inthe Jovian system. Icarus 89:318–346.
Schenk P., Wilson R., Hargitai H., McEwen A., and Thomas P. 2001.The mountains of Io: Global and geologic perspectives fromVoyager and Galileo. Journal of Geophysical Research 106:33,201–33,222.
Schenk P. M. 2002. Thickness constraints on the icy shells of theGalilean satellites from a comparison of crater shapes. �ature417:419–421.
Schenk P. M., Wilson R. R., and Davies A. G. 2004. Shield volcanotopography and rheology of lava flows on Io. Icarus 169:98–110.
Schmidt R. M. and Housen K. R. 1987. Some recent advances in thescaling of impact and explosion cratering. International Journalof Impact Engineering 5:543–560.
Seed H. B. and Goodman R. E. 1964. Earthquake stability ofcohesionless soils. Journal of the Soil Mechanics andFoundation Division 90 (SM6), ASCE, 4128.
Showman A. P., Mosqueria I., and Head J. W. 2004. On theresurfacing of Ganymede by liquid-water volcanism. Icarus 172:625–640.
Smith D. E., Zuber M. T., Neumann G. A., and Lemione F. G. 1997.Topography of the Moon from the Clementine lidar. Journal ofGeophysical Research 102:1591–1611.
Spray J. and Thompson L. 1995. Friction melt distribution in a multi-ring impact basin. �ature 373:130–132.
Tillotson J. M. 1962. Metallic equation of state for hypervelocityimpact. General Atomic Report GA-3216. Advanced ResearchProject Agency, San Diego. 141 p.
Turtle E. P. and Pierazzo E. 2001. Thickness of a Europan ice shellfrom impact crater simulations. Science 294:1326–1328.
Weiss J. and Schulson E. M. 1995. The failure of fresh-water granularice under multi-axial compressive loading. Acta Metallurgica etMaterialia 43:2303–2315.
Wetherill G. W. 1971. Cometary versus asteroidal origin of chondriticmeteorites. In Physical studies of minor planets, edited byGehrels T. NASA SP-267. pp. 447–460.
Wood C. A. 1973. Central peak heights and crater origins. Icarus 20:503.
Wünnemann K. and Ivanov B. A. 2003. Numerical modelling ofimpact crater depth-diameter dependence in an acousticallyfluidized target. Planetary and Space Science 51:831–845.
Wünnemann K., Morgan J., and Jodicke H. 2005. Is Ries cratertypical for its size? An analysis based upon old and newgeophysical data and numerical modeling, In Large meteoriteimpacts III, edited by Kenkmann T., Hörz F., and Deutsch A.Boulder: Geological Society of America. pp. 67–84.
Zahnle K., Dones L., and Levison H. F. 1998. Cratering rates on theGalilean satellites. Icarus 136:202–222.


