
EMBARGOED
The 2016 State Energy Efficiency Scorecard
Weston Berg, Seth Nowak, Meegan Kelly, Shruti Vaidyanathan,
Mary Shoemaker, Anna Chittum, Marianne DiMascio, and
Chetana Kallakuri
September 2016
Report U1606
© American Council for an Energy-Efficient Economy
529 14th Street NW, Suite 600, Washington, DC 20045
Phone: (202) 507-4000 • Twitter: @ACEEEDC
Facebook.com/myACEEE • aceee.org
EMBARGOED
2016 STATE SCORECARD © ACEEE
i
Contents
Contents ................................................................................................................................................. i
About the Authors .............................................................................................................................. iv
Acknowledgments ............................................................................................................................... v
Executive Summary ........................................................................................................................... vi
Key Findings .......................................................................................................................... vi
Strategies for Improving Energy Efficiency ...................................................................... xii
Introduction .......................................................................................................................................... 1
Chapter 1. Methodology and Results ............................................................................................... 2
Scoring ...................................................................................................................................... 2
State Data Collection and Review ........................................................................................ 4
Areas Beyond Our Scope: Local and Federal Efforts ........................................................ 5
Changes in Scoring Methodology from Last Year ............................................................. 6
2016 State Energy Efficiency Scorecard Results ................................................................. 6
Strategies for Improving Energy Efficiency ...................................................................... 15
Chapter 2. Utility and Public Benefits Programs and Policies .................................................... 18
Introduction ........................................................................................................................... 18
Methodology ......................................................................................................................... 18
Scoring and Results .............................................................................................................. 19
Discussion .............................................................................................................................. 24
Additional Policies ............................................................................................................... 47
Chapter 3. Transportation Policies .................................................................................................. 53
Introduction ........................................................................................................................... 53
Scoring and Results .............................................................................................................. 53
Discussion .............................................................................................................................. 58
EMBARGOED
2016 STATE SCORECARD © ACEEE
ii
Chapter 4. Building Energy Codes .................................................................................................. 63
Introduction ........................................................................................................................... 63
Methodology ......................................................................................................................... 65
Scoring and Results .............................................................................................................. 65
Discussion .............................................................................................................................. 68
Chapter 5. Combined Heat and Power .......................................................................................... 80
Introduction ........................................................................................................................... 80
Scoring and Results .............................................................................................................. 80
Discussion .............................................................................................................................. 83
Additional Metrics ............................................................................................................... 87
Chapter 6. State Government-Led Initiatives ................................................................................ 91
Introduction ........................................................................................................................... 91
Scoring and Results .............................................................................................................. 91
Discussion .............................................................................................................................. 93
Possible New Metrics ......................................................................................................... 110
Chapter 7. Appliance and Equipment Efficiency Standards ..................................................... 113
Introduction ......................................................................................................................... 113
Scoring and Results ............................................................................................................ 114
Chapter 8. Conclusions ................................................................................................................... 117
Data Limitations ................................................................................................................. 118
Potential New Scorecard Metrics ..................................................................................... 119
References ......................................................................................................................................... 121
Appendix A. Respondents to Utility and State Energy Office Data Requests ........................ 128
Appendix B. Electric Efficiency Program Spending per Capita ............................................... 132
Appendix C. Summary of Large Customer Self-Direct Programs by State ............................ 133
EMBARGOED
2016 STATE SCORECARD © ACEEE
iii
Appendix D. Details of States’ Energy Efficiency Resource Standards ................................... 137
Appendix E. Tax Incentives for High-Efficiency Vehicles ......................................................... 144
Appendix F. State Transit Funding ............................................................................................... 146
Appendix G. State Transit Legislation.......................................................................................... 147
Appendix H. State Progress toward Public Building Energy Benchmarking Requirements ............................................................................................................................................................ 150
Appendix I. State Energy Savings Performance Contracting: Energy Savings, Cost Savings, and Spending ................................................................................................................................... 151
Appendix J. Total Energy and Cost Savings from State Financial Incentives ........................ 154
EMBARGOED
2016 STATE SCORECARD © ACEEE
iv
About the Authors
Weston Berg is the lead author of The State Energy Efficiency Scorecard. He conducts research, analysis, and outreach on energy efficiency policy areas including utility regulation, state government policies, and building energy codes.
Seth Nowak conducts analysis and writes reports on energy efficiency programs and policies in the electric and natural gas utility sector. Focus areas of his research include exemplary programs; best practices; and program evaluation, measurement, and verification.
Meegan Kelly conducts research and outreach on the impacts of state, federal, and international energy efficiency programs and policies on energy use in the industrial sector. She also engages in research on combined heat and power and intelligent efficiency.
Shruti Vaidyanathan is a senior researcher for ACEEE’s Transportation Program. She is the principal analyst for Greenercars.org, ACEEE’s comprehensive environmental ranking of consumer vehicles. Her recent work has also focused on transportation system efficiency at the state and local levels, particularly the role of information and communications technology in smart transportation systems.
Mary Shoemaker analyzes state and federal legislation and agency regulations that affect energy efficiency. In particular, she explores the role of energy efficiency in complying with air pollution regulations, with an emphasis on the Clean Air Act and Section 111(d) obligations for states. Mary also contributes to ACEEE’s state technical assistance work.
Anna Chittum is a visiting fellow at ACEEE, where she researches and develops federal, state, and local industrial energy policies, focusing on combined heat and power (CHP) systems and industrial energy efficiency programs. She recently returned in 2014 from a yearlong Fulbright fellowship in Denmark, where she researched local heat planning and the integration of CHP and intermittent renewable energy sources on the Danish grid.
Marianne DiMascio is the outreach director for the Appliance Standards Awareness Project (ASAP), where she creates awareness of and builds support for appliance efficiency standards on both the federal and state level, building a coalition of supporters through outreach, education, and advocacy. She is co-author of The Efficiency Boom: Cashing In on the Savings from Appliance Standards.
Chetana Kallakuri works in the ACEEE Policy Program on federal energy efficiency policies in the United States. Chetana holds a bachelor of technology in electrical engineering from JNTU Kakinada in India, and a master of environmental management with a concentration in energy from the Yale School of Forestry and Environmental Studies. While in India, she worked with the Cerana Foundation, a Hyderabad-based environmental nonprofit.
EMBARGOED
2016 STATE SCORECARD © ACEEE
v
Acknowledgments
This report was made possible through the generous support of the US Department of Energy. The authors gratefully acknowledge external reviewers, internal reviewers, colleagues, and sponsors who supported this effort. First and foremost, we thank our many contacts at state energy offices and public utility commissions, too numerous to list here, who provided valuable utility data and information on energy efficiency policies and programs and offered feedback on an earlier draft of this report. The State Scorecard is also greatly enhanced by peer reviewers at national and regional organizations. These external expert reviewers included, in no particular order, Jim Meyers, Christine Brinker, Ellen Zuckerman, and Howard Geller (Southwest Energy Efficiency Project); Robert Bevill and Chris Herbert (South-Central Partnership for Energy Efficiency as a Resource); Taylor Allred (Southern Alliance for Clean Energy); Brian Buckley (Northeast Energy Efficiency Partnerships); Kate Daniel (NC Clean Energy Technology Center); Karen Glitman and Frances Heussy (Vermont Energy Investment Corporation); Jamie Howland (Acadia Center); Eleni Pelican, Johanna Zetterberg, David Nemtzow, Danielle Byrnett, Shannon Shea, John Cymbalsky, Monica Neukomm, Mike Li, Alice Dasek, Jenah Zweig, and Jay Wrobel (US Department of Energy); Lara Ettenson, Deron Lovaas, Simon Mui, Dylan Sullivan, Samantha Williams, and Miles Farmer (Natural Resources Defense Council); Michael Murray (Mission:data); Alissa Burger (Institute for Market Transformation); and Julia Friedman, Stacey Paradis, and Nick Dreher (Midwest Energy Efficiency Alliance). Internal reviewers included Steve Nadel, R. Neal Elliott, Maggie Molina, Annie Gilleo, Therese Langer, Naomi Baum, Dan York, and David Ribeiro. The authors also gratefully acknowledge the help of experts who participated in working groups, including Eric Lacey (Stone Mattheis Xenopoulos & Brew, PC); Harry Misuriello (ACEEE); Todd Sims and Rodney Sobin (National Association of State Energy Officials); Kamaria Greenfield (Building Codes Assistance Project); David Cohan, Ted Bronson, Patricia Garland, and Claudia Tighe (US Department of Energy); Neeharika Naik-Dhungel (US Environmental Protection Agency); Anne Hampson (ICF International); Bruce Hedman (Institute for Industrial Productivity); and Joanna Mauer and Andrew Delaski (Appliance Standards Awareness Project). Last, we would like to thank Fred Grossberg for managing the editorial process; Keri Schreiner, Elise Marton, Sean O’Brien, and Roxanna Usher for copy editing; Eric Schwass for assistance with publication and graphic design; and Glee Murray, Patrick Kiker, Maxine Chikumbo, and the Hastings Group for their help in launching the report.
EMBARGOED
2016 STATE SCORECARD © ACEEE
vi
Executive Summary
The past year has been an exciting time for energy efficiency, with several states strengthening efficiency policies and programs, and policymakers publicly recognizing the diverse benefits these initiatives provide. Utilities across the United States invested approximately $7.7 billion in energy efficiency over the past year. Meanwhile, states are also spurring efficiency investment through advancements in building energy codes, transportation planning, and leading by example in their own facilities and fleets. These investments reap large benefits, giving businesses, governments, and consumers more control over how and when they use energy. While some uncertainty hangs over the EPA’s Clean Power Plan as it awaits judicial review, many states continue to plan innovative strategies to reduce greenhouse gas (GHG) emissions through energy efficiency. As a cost-effective compliance option, efficiency is a valuable addition to any state’s policy toolkit, saving money, driving investment across all sectors of the economy, creating jobs, and reducing the environmental impact of energy use.
Governors, legislators, regulators, businesses, and citizens are increasingly recognizing that energy efficiency is a critical state resource that keeps money in the local economy. As a result, many innovative policies and programs that promote energy efficiency originate at the state level. The 2016 State Energy Efficiency Scorecard reflects these successes through a comprehensive analysis of state efforts to support energy efficiency.
This is the 10th edition of the Scorecard. As in the past, this year’s report ranks states on their policy and program efforts, not only assessing performance but also documenting best practices and recognizing leadership. By providing an annual benchmark of the progress of state energy efficiency policies, the Scorecard encourages states to continue strengthening their commitment to efficiency, thereby promoting economic growth and environmental benefits.
The 2016 Scorecard assesses state policies and programs that improve energy efficiency in our homes, businesses, industries, and transportation systems. It examines the six policy areas in which states typically pursue energy efficiency:
Utility and public benefits programs and policies
Transportation policies
Building energy codes and compliance
Combined heat and power (CHP) policies
State government–led initiatives around energy efficiency
Appliance and equipment standards
KEY FINDINGS
Figure ES1 shows the states’ rankings, dividing them into five tiers for easy comparison. Later in this section, table ES1 provides details of each state’s scores. An identical ranking for two or more states indicates a tie.
EMBARGOED
2016 STATE SCORECARD © ACEEE
vii
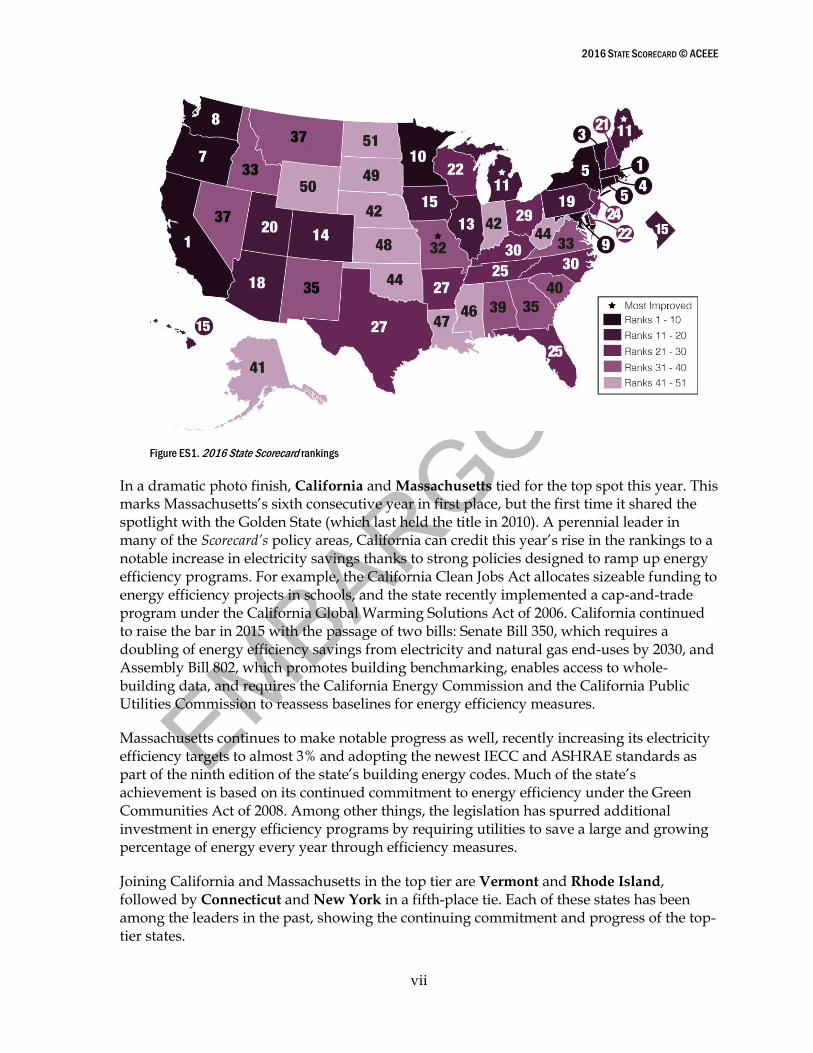
Figure ES1. 2016 State Scorecard rankings
In a dramatic photo finish, California and Massachusetts tied for the top spot this year. This marks Massachusetts’s sixth consecutive year in first place, but the first time it shared the spotlight with the Golden State (which last held the title in 2010). A perennial leader in many of the Scorecard’s policy areas, California can credit this year’s rise in the rankings to a notable increase in electricity savings thanks to strong policies designed to ramp up energy efficiency programs. For example, the California Clean Jobs Act allocates sizeable funding to energy efficiency projects in schools, and the state recently implemented a cap-and-trade program under the California Global Warming Solutions Act of 2006. California continued to raise the bar in 2015 with the passage of two bills: Senate Bill 350, which requires a doubling of energy efficiency savings from electricity and natural gas end-uses by 2030, and Assembly Bill 802, which promotes building benchmarking, enables access to whole-building data, and requires the California Energy Commission and the California Public Utilities Commission to reassess baselines for energy efficiency measures.
Massachusetts continues to make notable progress as well, recently increasing its electricity efficiency targets to almost 3% and adopting the newest IECC and ASHRAE standards as part of the ninth edition of the state’s building energy codes. Much of the state’s achievement is based on its continued commitment to energy efficiency under the Green Communities Act of 2008. Among other things, the legislation has spurred additional investment in energy efficiency programs by requiring utilities to save a large and growing percentage of energy every year through efficiency measures.
Joining California and Massachusetts in the top tier are Vermont and Rhode Island, followed by Connecticut and New York in a fifth-place tie. Each of these states has been among the leaders in the past, showing the continuing commitment and progress of the top-tier states.
EMBARGOED
2016 STATE SCORECARD © ACEEE
viii
Oregon, Washington, Maryland, and Minnesota rounded out the top 10 this year. Each of these states has well-established efficiency programs and continues to push the boundaries by redefining the ways in which policies and regulations can enable energy savings.
States Rising and Falling
The most-improved states this year were Missouri, Maine, and Michigan. They posted the largest point increases over their previous year’s score.
With the most dramatic improvement of any state this year, Missouri added 5 points to leap an impressive 12 positions in the rankings. The Show-Me State showed improvements across the board, adding points in utility savings, transportation, building energy codes, CHP, and state government-led programs. For example, Missouri partnered with the Midwest Energy Efficiency Alliance to develop a compliance study of residential building energy codes. The state has also enabled several Property Assessed Clean Energy (PACE) programs, which allow local governments to provide financing for energy efficiency and renewable energy projects that property owners pay back through property tax assessments. In addition, efforts to strengthen energy efficiency are a cornerstone of Missouri's recently released 2015 Comprehensive State Energy Plan, which lays out a roadmap to continue to build upon the state’s success.
Maine also added points thanks to its increased energy efficiency investments and the resulting electricity savings. Moving into its third Triennial Plan in 2017, Maine continues to raise the bar with its recent adoption of incremental electric efficiency targets of roughly 2.4%. While these targets are the fourth highest in the country, it is important to note that state lawmakers sent mixed messages this year by passing legislation to return a sizeable portion of Regional Greenhouse Gas Initiative (RGGI) revenues to certain large electric customers, funds that otherwise would have gone toward measures to strengthen efficiency and reduce greenhouse gas emissions.
Michigan also earned additional points in the building energy codes category, with its 2015 Residential Code taking effect earlier this year and new commercial codes expected to take effect next year. Also garnering points were a state-run LED conversion program for small businesses and not-for-profit organizations, as well as the state’s commercial and industrial PACE efforts. We gave credit for PACE for the first time in this year’s Scorecard to recognize innovative state efforts to leverage private capital toward efficiency goals.
Other states have also made progress in energy efficiency.
Rhode Island, which has ranked among the top five since 2014, moved out of its 2015 tie for fourth place to claim that spot solely for itself this year by scoring an additional 3 points. The Ocean State was the only one to earn a perfect score for utility and public benefits programs and policies, and it led all states in net incremental electricity savings as a percentage of retail sales. Rhode Island is poised to continue its success thanks to a strong and diverse portfolio of state government policies—including rebates, loan programs, and PACE financing—to encourage energy efficiency.
New York, which continues to lay the regulatory foundations for its utility system of the future through its Reforming the Energy Vision (REV) proceeding, posted an increase in
EMBARGOED
2016 STATE SCORECARD © ACEEE
ix
electricity savings. Earlier in the year, the Empire State also completed major updates to its state building energy codes, incorporating the 2015 IECC and ASHRAE 90.1-2013 standards. Utah and Tennessee made similar gains thanks to updates to state building energy codes this year. Arkansas committed to extend its energy efficiency goals and gained points for state government-led policies, including a home energy loan program and PACE financing.
By contrast, 23 states fell in the rankings this year, and 21 lost points, both because of changes in their performance and adjustments to our methodology, including more emphasis on energy savings achieved by utilities. Illinois fell the farthest, losing 4.5 points and falling three positions in the rankings. This drop shows the need for states to consistently update and improve their policies. Although Illinois has energy savings targets in place, spending cannot exceed an established cost cap, so regulators have approved lower targets in recent years.
Results by Policy Area
Rhode Island, Massachusetts, and Vermont were the leading states in utility-sector energy efficiency programs and policies (see Chapter 2). These three states also topped this category in 2014 and 2015. With long records of success, all three continued to raise the bar on cost-effective programs and policies. Rhode Island earned maximum points in this category for the third year in a row by achieving incremental electricity savings of close to 3% of retail sales.
Savings from electricity efficiency programs in 2015 totaled approximately 26.5 million megawatt-hours (MWh), a 3.1% increase over the 2014 savings reported in last year’s State Scorecard. These savings are equivalent to about 0.7% of total retail electricity sales across the nation. Gas savings for 2015 were reported at 345 million therms, an almost 8% decrease from 2014, likely due at least in part to historically low prices.
Total spending for electricity efficiency programs reached $6.3 billion in 2015. Adding this to natural gas program spending of $1.4 billion, we estimate total efficiency program expenditures of approximately $7.7 billion, an increase over the $7.3 billion reported for 2014.
Twenty-six states continue to enforce and adequately fund energy savings targets to drive investments in utility-sector energy efficiency programs. The states with the most aggressive targets included Massachusetts, Rhode Island, and Arizona. This year, Massachusetts, Maine, and Connecticut all adopted new and more stringent three-year savings targets, while Arkansas extended savings targets for both electricity and natural gas through 2019. Also making headlines was New Hampshire, which approved its long-awaited energy efficiency resource standard (EERS) in the summer. New York’s REV continues to take shape, although concrete long-range energy efficiency targets are still pending. Other states have faced challenges to their EERS policies. In Ohio, a freeze passed by state legislators continues through 2016, even though most utilities in the state are still meeting targets.
California, Massachusetts, and New York continue to lead the way in energy-efficient transportation policies (see Chapter 3). California’s requirements for reducing GHG emissions have prompted several strategies for smart growth. Massachusetts promoted smart growth development in cities and municipalities through state-delivered financial
EMBARGOED
2016 STATE SCORECARD © ACEEE
x
incentives. New York is one of the few states in the nation to have a vehicle miles traveled (VMT) reduction target.
A variety of states joined California and Illinois in achieving top scores for building energy codes and compliance this year, including Massachusetts, New York, Texas, Vermont, and Washington (see Chapter 4). Only a few states have adopted or made progress toward adoption of the most recent DOE-certified codes for both residential and commercial new construction. These include Illinois, Massachusetts, New Jersey, Utah, Vermont, and Washington.
Massachusetts, Maryland, and California scored highest for their CHP policies (Chapter 5), while California, Colorado, Connecticut, Massachusetts, Minnesota, New York, Tennessee, and Washington led the way in state government initiatives (Chapter 6). All of these states offer financial incentives to consumers and state and local governments, and they also invest in R&D programs focused on energy efficiency. California continues to lead the nation in setting appliance standards (Chapter 7), having adopted standards for more than 100 products. Within the past year, it became the first state to adopt standards for LEDs and small-diameter directional lamps; it also updated its standards for HVAC air filters, fluorescent dimming ballasts, and heat pump water chilling packages. Table ES1 gives an overview of how states fared in each scoring category.
EMBARGOED
2016 STATE SCORECARD © ACEEE
xi
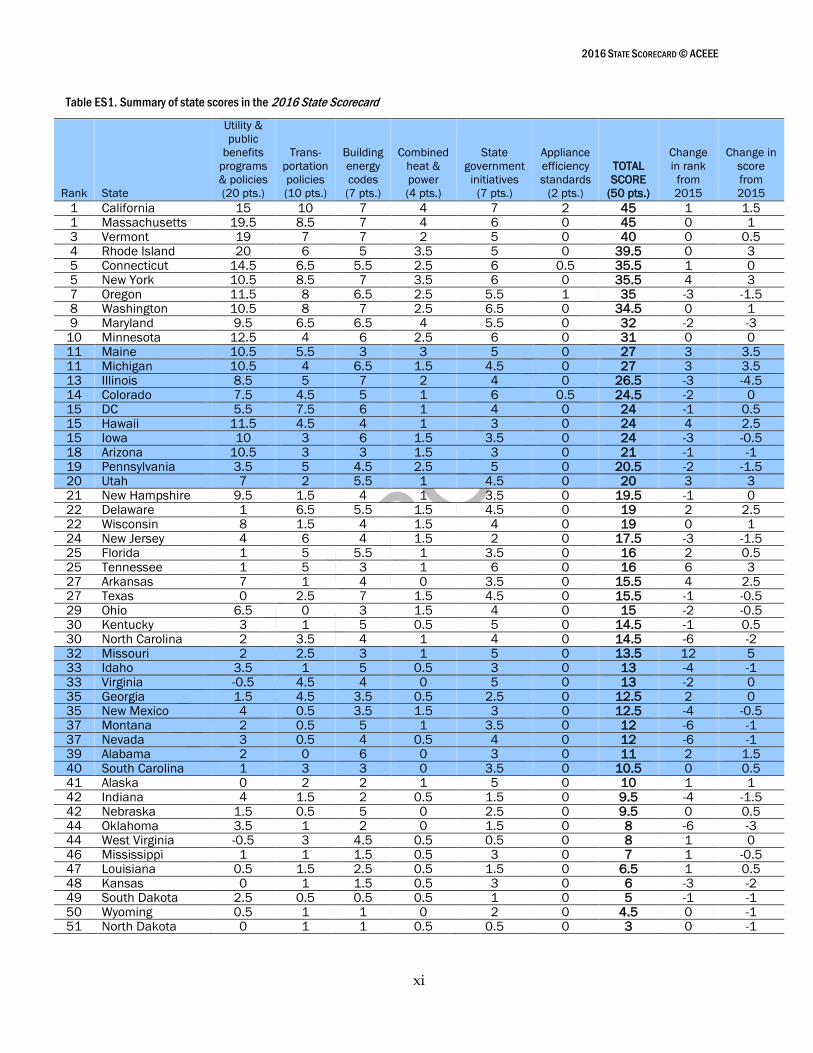
Table ES1. Summary of state scores in the 2016 State Scorecard
Rank State
Utility &
public
benefits
programs
& policies
(20 pts.)
Trans-
portation
policies
(10 pts.)
Building
energy
codes
(7 pts.)
Combined
heat &
power
(4 pts.)
State
government
initiatives
(7 pts.)
Appliance
efficiency
standards
(2 pts.)
TOTAL
SCORE
(50 pts.)
Change
in rank
from
2015
Change in
score
from
2015
1 California 15 10 7 4 7 2 45 1 1.5
1 Massachusetts 19.5 8.5 7 4 6 0 45 0 1
3 Vermont 19 7 7 2 5 0 40 0 0.5
4 Rhode Island 20 6 5 3.5 5 0 39.5 0 3
5 Connecticut 14.5 6.5 5.5 2.5 6 0.5 35.5 1 0
5 New York 10.5 8.5 7 3.5 6 0 35.5 4 3
7 Oregon 11.5 8 6.5 2.5 5.5 1 35 -3 -1.5
8 Washington 10.5 8 7 2.5 6.5 0 34.5 0 1
9 Maryland 9.5 6.5 6.5 4 5.5 0 32 -2 -3
10 Minnesota 12.5 4 6 2.5 6 0 31 0 0
11 Maine 10.5 5.5 3 3 5 0 27 3 3.5
11 Michigan 10.5 4 6.5 1.5 4.5 0 27 3 3.5
13 Illinois 8.5 5 7 2 4 0 26.5 -3 -4.5
14 Colorado 7.5 4.5 5 1 6 0.5 24.5 -2 0
15 DC 5.5 7.5 6 1 4 0 24 -1 0.5
15 Hawaii 11.5 4.5 4 1 3 0 24 4 2.5
15 Iowa 10 3 6 1.5 3.5 0 24 -3 -0.5
18 Arizona 10.5 3 3 1.5 3 0 21 -1 -1
19 Pennsylvania 3.5 5 4.5 2.5 5 0 20.5 -2 -1.5
20 Utah 7 2 5.5 1 4.5 0 20 3 3
21 New Hampshire 9.5 1.5 4 1 3.5 0 19.5 -1 0
22 Delaware 1 6.5 5.5 1.5 4.5 0 19 2 2.5
22 Wisconsin 8 1.5 4 1.5 4 0 19 0 1
24 New Jersey 4 6 4 1.5 2 0 17.5 -3 -1.5
25 Florida 1 5 5.5 1 3.5 0 16 2 0.5
25 Tennessee 1 5 3 1 6 0 16 6 3
27 Arkansas 7 1 4 0 3.5 0 15.5 4 2.5
27 Texas 0 2.5 7 1.5 4.5 0 15.5 -1 -0.5
29 Ohio 6.5 0 3 1.5 4 0 15 -2 -0.5
30 Kentucky 3 1 5 0.5 5 0 14.5 -1 0.5
30 North Carolina 2 3.5 4 1 4 0 14.5 -6 -2
32 Missouri 2 2.5 3 1 5 0 13.5 12 5
33 Idaho 3.5 1 5 0.5 3 0 13 -4 -1
33 Virginia -0.5 4.5 4 0 5 0 13 -2 0
35 Georgia 1.5 4.5 3.5 0.5 2.5 0 12.5 2 0
35 New Mexico 4 0.5 3.5 1.5 3 0 12.5 -4 -0.5
37 Montana 2 0.5 5 1 3.5 0 12 -6 -1
37 Nevada 3 0.5 4 0.5 4 0 12 -6 -1
39 Alabama 2 0 6 0 3 0 11 2 1.5
40 South Carolina 1 3 3 0 3.5 0 10.5 0 0.5
41 Alaska 0 2 2 1 5 0 10 1 1
42 Indiana 4 1.5 2 0.5 1.5 0 9.5 -4 -1.5
42 Nebraska 1.5 0.5 5 0 2.5 0 9.5 0 0.5
44 Oklahoma 3.5 1 2 0 1.5 0 8 -6 -3
44 West Virginia -0.5 3 4.5 0.5 0.5 0 8 1 0
46 Mississippi 1 1 1.5 0.5 3 0 7 1 -0.5
47 Louisiana 0.5 1.5 2.5 0.5 1.5 0 6.5 1 0.5
48 Kansas 0 1 1.5 0.5 3 0 6 -3 -2
49 South Dakota 2.5 0.5 0.5 0.5 1 0 5 -1 -1
50 Wyoming 0.5 1 1 0 2 0 4.5 0 -1
51 North Dakota 0 1 1 0.5 0.5 0 3 0 -1
EMBARGOED
2016 STATE SCORECARD © ACEEE
xii
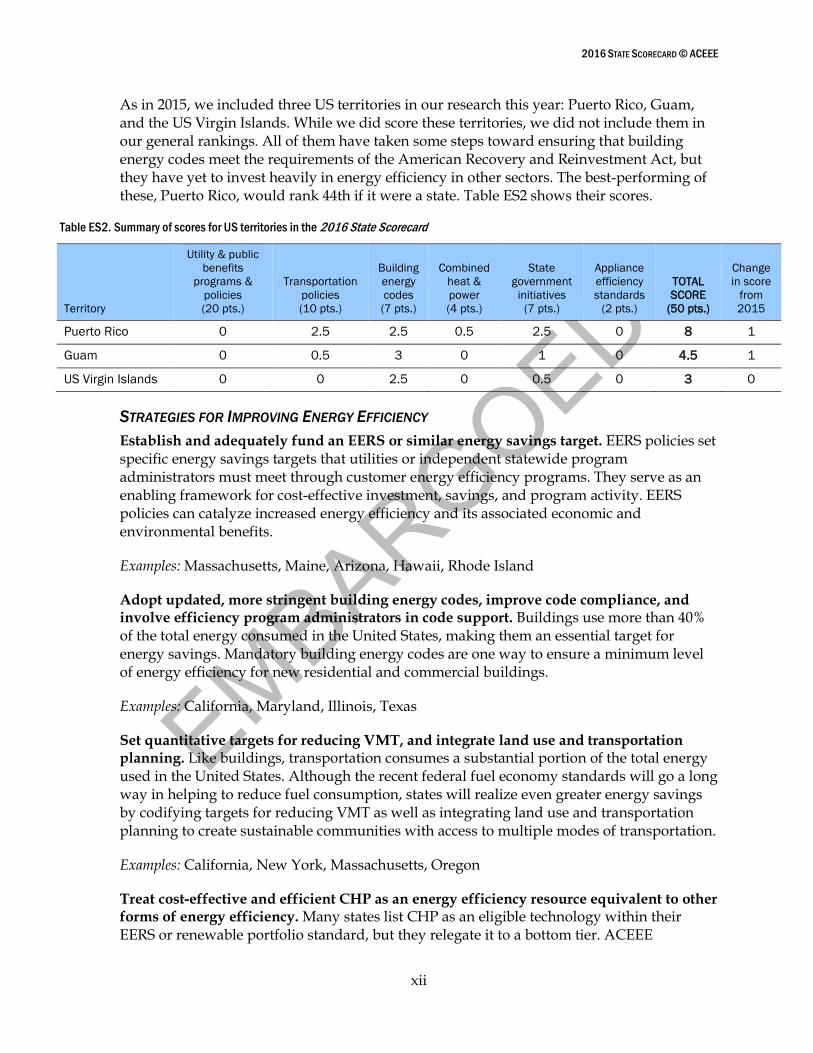
As in 2015, we included three US territories in our research this year: Puerto Rico, Guam, and the US Virgin Islands. While we did score these territories, we did not include them in our general rankings. All of them have taken some steps toward ensuring that building energy codes meet the requirements of the American Recovery and Reinvestment Act, but they have yet to invest heavily in energy efficiency in other sectors. The best-performing of these, Puerto Rico, would rank 44th if it were a state. Table ES2 shows their scores.
Table ES2. Summary of scores for US territories in the 2016 State Scorecard
Territory
Utility & public
benefits
programs &
policies
(20 pts.)
Transportation
policies
(10 pts.)
Building
energy
codes
(7 pts.)
Combined
heat &
power
(4 pts.)
State
government
initiatives
(7 pts.)
Appliance
efficiency
standards
(2 pts.)
TOTAL
SCORE
(50 pts.)
Change
in score
from
2015
Puerto Rico 0 2.5 2.5 0.5 2.5 0 8 1
Guam 0 0.5 3 0 1 0 4.5 1
US Virgin Islands 0 0 2.5 0 0.5 0 3 0
STRATEGIES FOR IMPROVING ENERGY EFFICIENCY
Establish and adequately fund an EERS or similar energy savings target. EERS policies set specific energy savings targets that utilities or independent statewide program administrators must meet through customer energy efficiency programs. They serve as an enabling framework for cost-effective investment, savings, and program activity. EERS policies can catalyze increased energy efficiency and its associated economic and environmental benefits.
Examples: Massachusetts, Maine, Arizona, Hawaii, Rhode Island
Adopt updated, more stringent building energy codes, improve code compliance, and involve efficiency program administrators in code support. Buildings use more than 40% of the total energy consumed in the United States, making them an essential target for energy savings. Mandatory building energy codes are one way to ensure a minimum level of energy efficiency for new residential and commercial buildings.
Examples: California, Maryland, Illinois, Texas
Set quantitative targets for reducing VMT, and integrate land use and transportation planning. Like buildings, transportation consumes a substantial portion of the total energy used in the United States. Although the recent federal fuel economy standards will go a long way in helping to reduce fuel consumption, states will realize even greater energy savings by codifying targets for reducing VMT as well as integrating land use and transportation planning to create sustainable communities with access to multiple modes of transportation.
Examples: California, New York, Massachusetts, Oregon
Treat cost-effective and efficient CHP as an energy efficiency resource equivalent to other forms of energy efficiency. Many states list CHP as an eligible technology within their EERS or renewable portfolio standard, but they relegate it to a bottom tier. ACEEE
EMBARGOED
2016 STATE SCORECARD © ACEEE
xiii
recommends that states give CHP savings equal footing, which requires that they develop a specific methodology for counting energy savings attributed to its utilization. If CHP is allowed as an eligible resource, EERS target levels should be increased to account for CHP potential and to ensure that CHP does not displace traditional energy efficiency measures.
Example: Massachusetts
Expand state-led efforts—and make them visible. Initiatives here might include establishing sustainable funding sources for energy efficiency incentive programs; investing in energy efficiency–related research, development, and demonstration centers; and leading by example by incorporating energy efficiency into government operations. States have many opportunities to lead by example, including reducing energy use in public buildings and fleets, demonstrating the market for energy service companies (ESCOs) that finance and deliver energy-saving projects, and funding research centers that focus on breakthroughs in energy-efficient technologies.
Examples: New York, Connecticut, Alaska
Explore and promote innovative financing mechanisms to leverage private capital and
lower upfront costs of energy efficiency measures. Although utilities in many states offer
some form of on-bill financing program to promote energy efficiency in homes and
buildings, expanding lender and customer participation has been an ongoing challenge.
States can help address this challenge by passing legislation, increasing stakeholder
awareness, and addressing legal barriers to the implementation of financing programs. A
growing number of states are seeking new ways to maximize the impact of public funds and
invigorate energy efficiency by attracting private capital through emerging financing
models such as PACE and green banks.
Examples: Missouri, New York, Rhode Island
EMBARGOED
2016 STATE SCORECARD © ACEEE
1
Introduction
The past year has been an exciting time for energy efficiency, with several states strengthening energy efficiency policies and programs, and policymakers publicly recognizing the diverse benefits of these initiatives. Utilities across the United States invested approximately $7.7 billion in energy efficiency over the past year. States are also spurring energy efficiency investment through advancements in building energy codes, transportation planning, and leading by example in their own facilities and fleets. These investments in energy efficiency reap huge benefits, giving businesses, governments, and consumers more control over how and when they use energy. While some uncertainty hangs over the EPA’s Clean Power Plan as it awaits judicial review, many states continue to plan smart strategies to reduce greenhouse gas (GHG) emissions. As a cost-effective compliance option, energy efficiency is a valuable addition to any state’s policy toolkit, saving money, driving investment across all economic sectors, creating jobs, and reducing the environmental impact of energy use.
Governors, legislators, regulators, businesses, and citizens increasingly recognize that energy efficiency is a crucially important state resource that keeps their money in the local economies. As a result, many innovative policies and programs that promote energy efficiency originate at the state level. The 2016 State Energy Efficiency Scorecard reflects these successes through a comprehensive analysis of state efforts to support energy efficiency.
This is the 10th edition of the State Energy Efficiency Scorecard. As in the past, this year’s State Scorecard ranks states on their policy and program efforts, not only assessing performance but also documenting best practices and recognizing leadership. The State Scorecard provides an annual benchmark of the progress of state energy efficiency policies and encourages states to continue strengthening their commitment to efficiency, thereby promoting economic growth and environmental benefits.
The Scorecard is divided into eight chapters. In Chapter 1, we discuss our methodology for scoring states (including changes made this year), present the overall results of our analysis, and provide several strategies states can use to improve their energy efficiency. Chapter 1 also highlights the leading states, most-improved states, and the policy trends revealed by the rankings.
Subsequent chapters present detailed results for six major policy areas. Chapter 2 covers utility and public benefits programs and policies. Chapter 3 discusses transportation policies. Chapter 4 deals with building energy code adoption and state code compliance efforts. Chapter 5 covers state scores on policies that encourage and enable combined heat and power (CHP) development. Chapter 6 deals with state government initiatives, including financial incentives, lead-by-example policies, energy efficiency–focused research and development (R&D), and building energy use transparency policies. Finally, Chapter 7 discusses appliance and equipment efficiency standards.
In Chapter 8, we offer our closing thoughts on the report’s findings, expectations for what we will see from states in the coming year, and potential changes for next year’s State Scorecard.
EMBARGOED
METHODOLOGY & RESULTS 2016 STATE SCORECARD © ACEEE
2
Chapter 1. Methodology and Results
Author: Weston Berg
SCORING
States are the test beds for policies and regulations, and no two states are the same. To reflect this diversity, we chose metrics that are flexible enough to capture the range of policy and program options that states use to encourage energy efficiency. The policies and programs evaluated in the State Scorecard aim to reduce end-use energy consumption, set long-term commitments for energy efficiency, and establish mandatory performance codes and standards. They also help to accelerate the adoption of the most energy-efficient technologies, reduce market, regulatory, and information barriers to energy efficiency, and provide funding for efficiency programs.
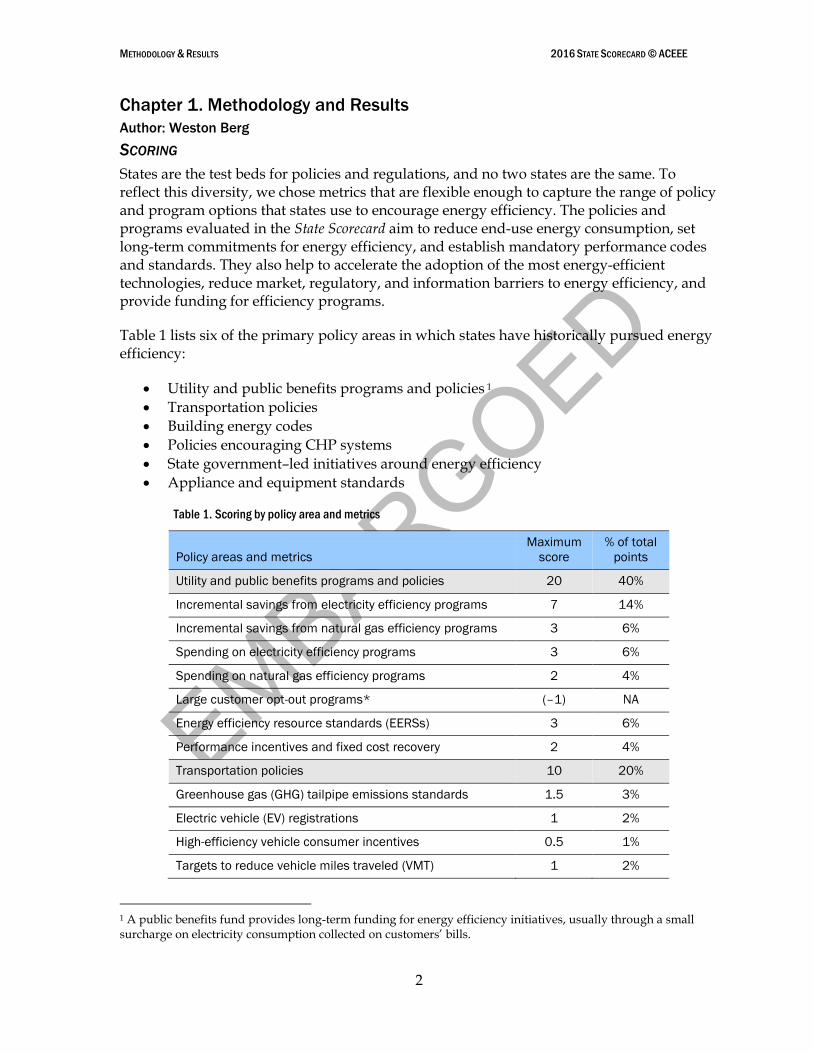
Table 1 lists six of the primary policy areas in which states have historically pursued energy efficiency:
Utility and public benefits programs and policies 1
Transportation policies
Building energy codes
Policies encouraging CHP systems
State government–led initiatives around energy efficiency
Appliance and equipment standards
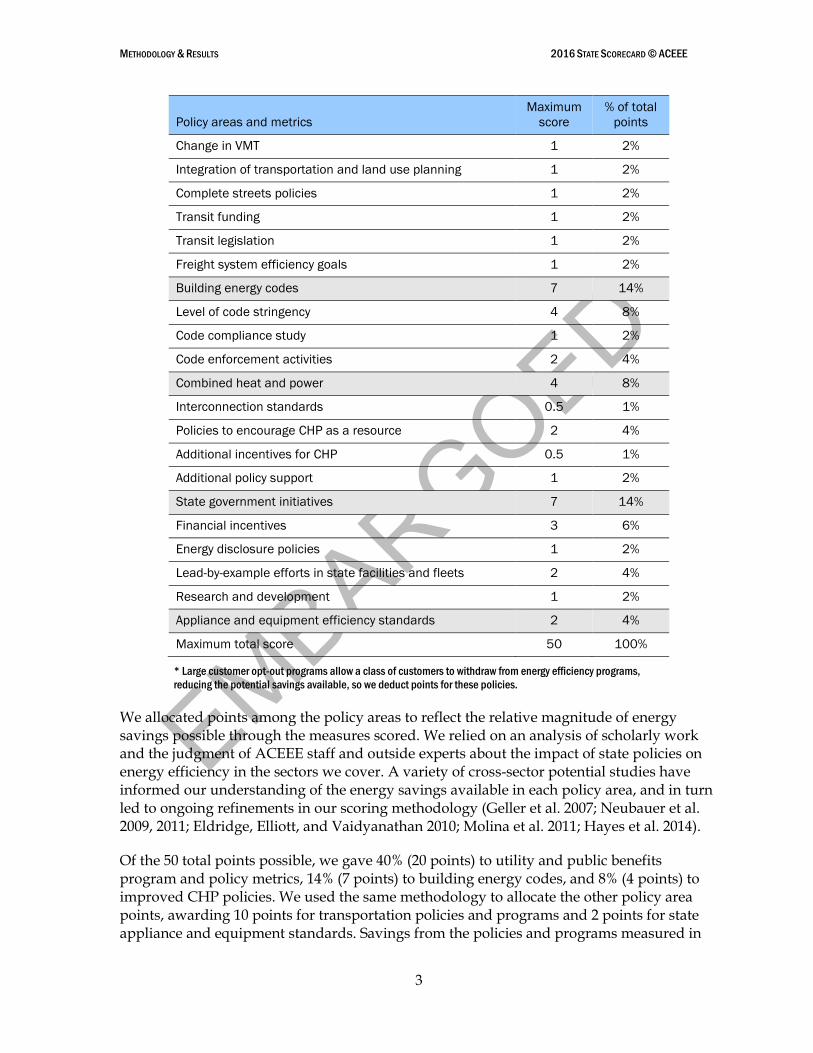
Table 1. Scoring by policy area and metrics
Policy areas and metrics
Maximum
score
% of total
points
Utility and public benefits programs and policies 20 40%
Incremental savings from electricity efficiency programs 7 14%
Incremental savings from natural gas efficiency programs 3 6%
Spending on electricity efficiency programs 3 6%
Spending on natural gas efficiency programs 2 4%
Large customer opt-out programs* (–1) NA
Energy efficiency resource standards (EERSs) 3 6%
Performance incentives and fixed cost recovery 2 4%
Transportation policies 10 20%
Greenhouse gas (GHG) tailpipe emissions standards 1.5 3%
Electric vehicle (EV) registrations 1 2%
High-efficiency vehicle consumer incentives 0.5 1%
Targets to reduce vehicle miles traveled (VMT) 1 2%
1 A public benefits fund provides long-term funding for energy efficiency initiatives, usually through a small surcharge on electricity consumption collected on customers’ bills.
EMBARGOED
METHODOLOGY & RESULTS 2016 STATE SCORECARD © ACEEE
3
Policy areas and metrics
Maximum
score
% of total
points
Change in VMT 1 2%
Integration of transportation and land use planning 1 2%
Complete streets policies 1 2%
Transit funding 1 2%
Transit legislation 1 2%
Freight system efficiency goals 1 2%
Building energy codes 7 14%
Level of code stringency 4 8%
Code compliance study 1 2%
Code enforcement activities 2 4%
Combined heat and power 4 8%
Interconnection standards 0.5 1%
Policies to encourage CHP as a resource 2 4%
Additional incentives for CHP 0.5 1%
Additional policy support 1 2%
State government initiatives 7 14%
Financial incentives 3 6%
Energy disclosure policies 1 2%
Lead-by-example efforts in state facilities and fleets 2 4%
Research and development 1 2%
Appliance and equipment efficiency standards 2 4%
Maximum total score 50 100%
* Large customer opt-out programs allow a class of customers to withdraw from energy efficiency programs,
reducing the potential savings available, so we deduct points for these policies.
We allocated points among the policy areas to reflect the relative magnitude of energy savings possible through the measures scored. We relied on an analysis of scholarly work and the judgment of ACEEE staff and outside experts about the impact of state policies on energy efficiency in the sectors we cover. A variety of cross-sector potential studies have informed our understanding of the energy savings available in each policy area, and in turn led to ongoing refinements in our scoring methodology (Geller et al. 2007; Neubauer et al. 2009, 2011; Eldridge, Elliott, and Vaidyanathan 2010; Molina et al. 2011; Hayes et al. 2014).
Of the 50 total points possible, we gave 40% (20 points) to utility and public benefits program and policy metrics, 14% (7 points) to building energy codes, and 8% (4 points) to improved CHP policies. We used the same methodology to allocate the other policy area points, awarding 10 points for transportation policies and programs and 2 points for state appliance and equipment standards. Savings from the policies and programs measured in
EMBARGOED
METHODOLOGY & RESULTS 2016 STATE SCORECARD © ACEEE
4
our chapter on state initiatives are hard to quantify, but we assigned a significant number of points to this policy area to highlight states that lead by example in making clear and visible commitments to energy efficiency.
Within each policy area, we developed a scoring methodology based on a diverse set of criteria that we detail in each policy chapter. We used these criteria to assign a score to each state. The scores were informed by data requests sent to state energy officials, public utility commission staff, and experts in each policy area. To the best of our knowledge, policy information for The 2016 State Energy Efficiency Scorecard is accurate as of July 31, 2016.
The State Scorecard is meant to reflect the current policy landscape, incorporating changes from year to year. We do not envision that the allocation of points both across and within sectors will forever remain the same; rather, we will continue to adjust our methodology to reflect the current energy efficiency policy and program landscape. This year, we made changes to our scoring methodology in several policy areas. We outline these changes later in this chapter and discuss them in more depth in the relevant policy chapters. Changes in future editions of the Scorecard could include revisions to point allocations and the addition or subtraction of entire categories of scoring. In making these changes, our goal is to faithfully represent states’ evolving efforts to realize the potential for energy efficiency in the systems and sectors of their economies.
STATE DATA COLLECTION AND REVIEW
We continue to improve our outreach to state-level stakeholders to verify the accuracy and comprehensiveness of the policy information that we use to score the states. As in past years, we asked each state utility commission to review statewide data for the customer-funded energy efficiency programs presented in Chapter 2 and the CHP policies detailed in Chapter 5. Forty-five state commissions responded, comparable to the number of responses we received last year. We also asked each state energy office to review information on transportation policies (Chapter 3), building energy codes (Chapter 4), CHP (Chapter 5), and state government–led initiatives (Chapter 6).
We received responses from energy offices in 43 states and 2 territories, slightly less than the response rate we achieved in 2015. In addition, we gave state energy office and utility commission officials the opportunity to review and submit updates to the material on ACEEE’s State and Local Policy Database (ACEEE 2016).2 We also asked them to review and provide comments on a draft version of The 2016 State Energy Efficiency Scorecard prior to publication. We used publicly available data and responses from prior years to evaluate states that did not respond to this year’s data request or request for review. In addition, we convened expert working groups to provide further information on building energy codes and CHP policies in all states.
Best-Practice Policy and Performance Metrics
The scoring framework described above is our best attempt to represent the myriad efficiency metrics as a quantitative score. Converting spending data, energy savings data, and policy adoption metrics spanning six policy areas into one score clearly involves some
2 Available at database.aceee.org.
EMBARGOED
METHODOLOGY & RESULTS 2016 STATE SCORECARD © ACEEE
5
oversimplification. Quantitative energy-savings performance metrics are confined mostly to programs run by utilities and third-party administrators using ratepayer funds. These programs are subject to strict evaluation, measurement, and verification standards. States engage in many other efforts to encourage efficiency, but such efforts are typically not evaluated with the same rigor, so it is difficult to capture comprehensive quantitative data for these programs.
Although our preference is to include metrics based on energy savings achieved in every sector, these data are not widely available. Therefore, with the exception of utility policies, we have not scored the other policy areas on reported savings or spending data attributable to a particular policy action. Instead, given the lack of consistent ex post data, we have developed best-practice metrics for scoring the states. Although these metrics do not score outcomes directly, they credit states that are implementing policies likely to lead to more energy-efficient outcomes. For example, we give credit for potential energy savings from improved building energy codes and appliance efficiency standards since actual savings from these policies are rarely evaluated. We have also attempted to reflect outcome metrics to the extent possible; for example, electric vehicle (EV) registrations and reductions in vehicle miles traveled (VMT) both represent positive outcomes of transportation policies. We include full discussions of the policy and performance metrics in each chapter.
AREAS BEYOND OUR SCOPE: LOCAL AND FEDERAL EFFORTS
Energy efficiency initiatives implemented by actors at the federal or local level or in the private sector (with the exception of investor-owned utilities [IOUs] and CHP facilities) generally fall outside the scope of this report. It is important to note that regions, counties, and municipalities have become actively involved in developing energy efficiency programs, a positive development that reinforces state-level efficiency efforts. ACEEE’s biennial City Energy Efficiency Scorecard (Ribeiro et al. 2015) captures data on these local actions; we do not specifically track them in the State Scorecard. However a few State Scorecard metrics do capture local-level efforts, including the adoption of building codes and land-use policies, as well as state financial incentives for local energy efficiency efforts. We also include municipal utilities in our data set to the extent that they report energy efficiency data to the US Energy Information Administration (EIA), state public utility commissions, or other state and regional groups. As much as possible, however, we aim to focus specifically on state-level energy efficiency activities.
The State Scorecard has not traditionally covered private-sector investments in efficient technologies outside of customer-funded or government-sponsored energy efficiency initiatives, codes, or standards. However we do recognize the need for metrics that capture the rapidly growing role of private financing mechanisms in new utility business models. As Chapter 6 explains, we began to move this year’s Scorecard in that direction by considering the existence of Property Assessed Clean Energy (PACE) programs and green banks in the scores for state financial incentives. While utility and public programs are critical to leveraging private capital, we found it challenging to develop an independent metric that measures the success of private-sector investment, given the absence of protocols for measuring and verifying energy savings. We hope that as the transparency and reliability of savings data from these private initiatives improve, they will play a larger, more quantifiable role in future State Scorecards.
EMBARGOED
METHODOLOGY & RESULTS 2016 STATE SCORECARD © ACEEE
6
CHANGES IN SCORING METHODOLOGY FROM LAST YEAR
We updated the scoring methodology in five policy areas this year to better reflect potential energy savings and changing policy landscapes.
In Chapter 2, “Utility and Public Benefits Programs and Policies,” we increased our emphasis on achieved savings by awarding an additional point to electric savings (shifting 1 point away from spending). We refined the data request in an effort to access more and better data and to emphasize measured savings. These changes led to a redistribution of points in the electric savings category that effectively rewarded high-achieving states with more points than lower-performing states. Meanwhile, other states—particularly those showing lower net savings and lower investment in efficiency—might see a loss in points, even where there has been no significant change in savings from last year.
In Chapter 3, “Transportation,” we made no major changes in point allocation, but we did update our scoring category for energy efficiency in state freight plans to correspond with the 2015 adoption of the Fixing America’s Surface Transportation (FAST) Act, which supersedes the Moving Ahead for Progress in the 21st Century Act (MAP-21) requirements.
In Chapter 4, “Building Energy Codes,” the scoring methodology remained largely unchanged, but we did update our section on building energy code stringency. Specifically, we tightened our assessment of code stringency, awarding points only to states that could demonstrate statewide or significant local adoption of at least 2009 IECC and ASHRAE 90.1-2007 codes for residential and commercial construction, respectively. Given the looming 2017 deadline under the America Recovery and Reinvestment Act (ARRA) for states to achieve 90% compliance with these model energy codes—and the fact there has been ample time to adopt them—we no longer give credit for lesser standards.
In Chapter 6, “State Government-Led Initiatives,” we allocated additional points for state-run financial incentives. We also expanded our eligibility criteria in this category to recognize a growing state movement to leverage private dollars for energy efficiency through programs such as green banks and PACE financing.
In Chapter 7, “Appliance and Equipment Efficiency Standards,” we updated the scoring methodology for appliance and equipment standards to emphasize savings from recent state standards. A state could still earn up to 2 points for appliance efficiency standards not presently preempted by federal standards, but we did not award points for standards with compliance dates predating 2013.
We discuss additional details on scoring, including changes to methodology, in each chapter.
2016 STATE ENERGY EFFICIENCY SCORECARD RESULTS
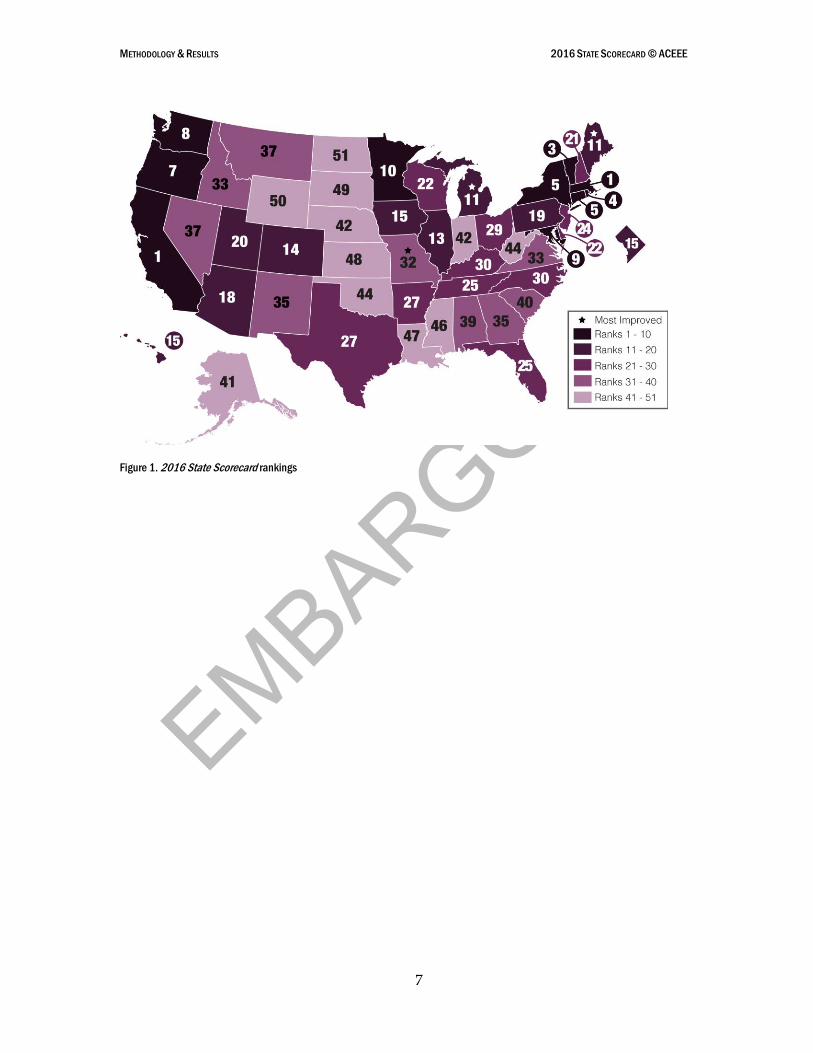
We present the results of the State Scorecard in Figure 1 and describe them more fully in Table 2. In this section, we also highlight some key changes in state rankings, discuss which states are making notable new commitments to energy efficiency, and provide a series of recommendations for states wanting to increase their energy efficiency.
EMBARGOED
METHODOLOGY & RESULTS 2016 STATE SCORECARD © ACEEE
7
Figure 1. 2016 State Scorecard rankings
EMBARGOED
METHODOLOGY & RESULTS 2016 STATE SCORECARD © ACEEE
8
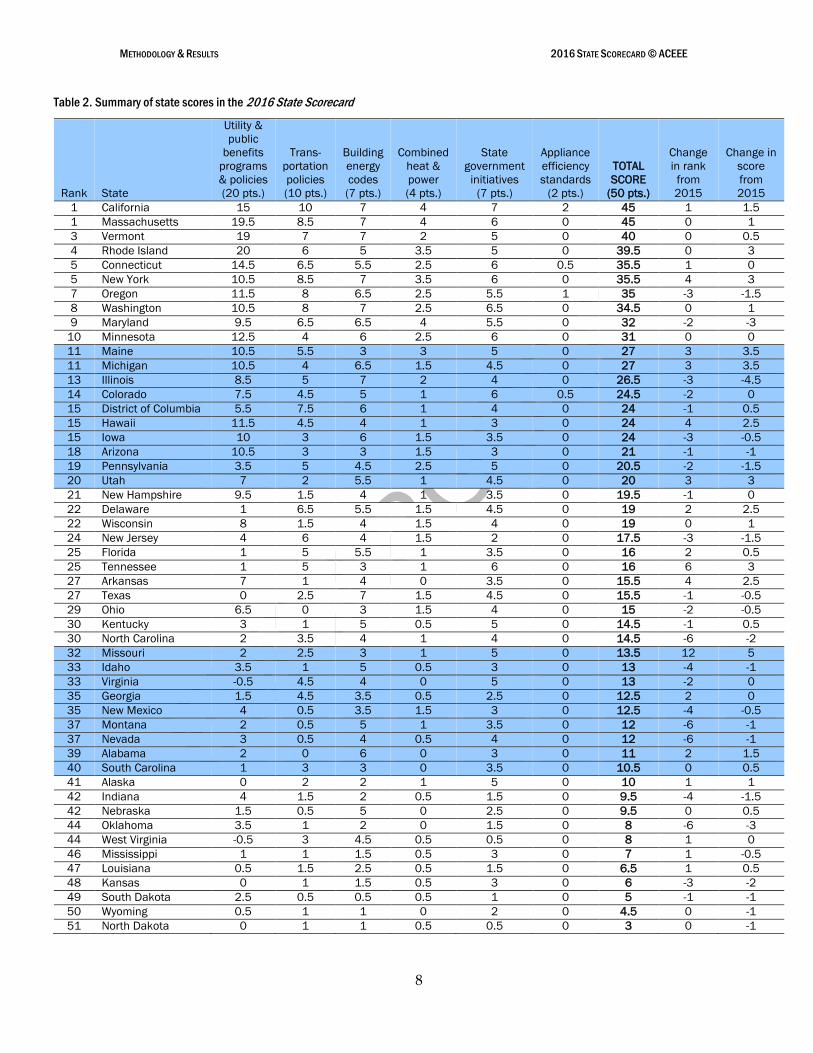
Table 2. Summary of state scores in the 2016 State Scorecard
Rank State
Utility &
public
benefits
programs
& policies
(20 pts.)
Trans-
portation
policies
(10 pts.)
Building
energy
codes
(7 pts.)
Combined
heat &
power
(4 pts.)
State
government
initiatives
(7 pts.)
Appliance
efficiency
standards
(2 pts.)
TOTAL
SCORE
(50 pts.)
Change
in rank
from
2015
Change in
score
from
2015
1 California 15 10 7 4 7 2 45 1 1.5
1 Massachusetts 19.5 8.5 7 4 6 0 45 0 1
3 Vermont 19 7 7 2 5 0 40 0 0.5
4 Rhode Island 20 6 5 3.5 5 0 39.5 0 3
5 Connecticut 14.5 6.5 5.5 2.5 6 0.5 35.5 1 0
5 New York 10.5 8.5 7 3.5 6 0 35.5 4 3
7 Oregon 11.5 8 6.5 2.5 5.5 1 35 -3 -1.5
8 Washington 10.5 8 7 2.5 6.5 0 34.5 0 1
9 Maryland 9.5 6.5 6.5 4 5.5 0 32 -2 -3
10 Minnesota 12.5 4 6 2.5 6 0 31 0 0
11 Maine 10.5 5.5 3 3 5 0 27 3 3.5
11 Michigan 10.5 4 6.5 1.5 4.5 0 27 3 3.5
13 Illinois 8.5 5 7 2 4 0 26.5 -3 -4.5
14 Colorado 7.5 4.5 5 1 6 0.5 24.5 -2 0
15 District of Columbia 5.5 7.5 6 1 4 0 24 -1 0.5
15 Hawaii 11.5 4.5 4 1 3 0 24 4 2.5
15 Iowa 10 3 6 1.5 3.5 0 24 -3 -0.5
18 Arizona 10.5 3 3 1.5 3 0 21 -1 -1
19 Pennsylvania 3.5 5 4.5 2.5 5 0 20.5 -2 -1.5
20 Utah 7 2 5.5 1 4.5 0 20 3 3
21 New Hampshire 9.5 1.5 4 1 3.5 0 19.5 -1 0
22 Delaware 1 6.5 5.5 1.5 4.5 0 19 2 2.5
22 Wisconsin 8 1.5 4 1.5 4 0 19 0 1
24 New Jersey 4 6 4 1.5 2 0 17.5 -3 -1.5
25 Florida 1 5 5.5 1 3.5 0 16 2 0.5
25 Tennessee 1 5 3 1 6 0 16 6 3
27 Arkansas 7 1 4 0 3.5 0 15.5 4 2.5
27 Texas 0 2.5 7 1.5 4.5 0 15.5 -1 -0.5
29 Ohio 6.5 0 3 1.5 4 0 15 -2 -0.5
30 Kentucky 3 1 5 0.5 5 0 14.5 -1 0.5
30 North Carolina 2 3.5 4 1 4 0 14.5 -6 -2
32 Missouri 2 2.5 3 1 5 0 13.5 12 5
33 Idaho 3.5 1 5 0.5 3 0 13 -4 -1
33 Virginia -0.5 4.5 4 0 5 0 13 -2 0
35 Georgia 1.5 4.5 3.5 0.5 2.5 0 12.5 2 0
35 New Mexico 4 0.5 3.5 1.5 3 0 12.5 -4 -0.5
37 Montana 2 0.5 5 1 3.5 0 12 -6 -1
37 Nevada 3 0.5 4 0.5 4 0 12 -6 -1
39 Alabama 2 0 6 0 3 0 11 2 1.5
40 South Carolina 1 3 3 0 3.5 0 10.5 0 0.5
41 Alaska 0 2 2 1 5 0 10 1 1
42 Indiana 4 1.5 2 0.5 1.5 0 9.5 -4 -1.5
42 Nebraska 1.5 0.5 5 0 2.5 0 9.5 0 0.5
44 Oklahoma 3.5 1 2 0 1.5 0 8 -6 -3
44 West Virginia -0.5 3 4.5 0.5 0.5 0 8 1 0
46 Mississippi 1 1 1.5 0.5 3 0 7 1 -0.5
47 Louisiana 0.5 1.5 2.5 0.5 1.5 0 6.5 1 0.5
48 Kansas 0 1 1.5 0.5 3 0 6 -3 -2
49 South Dakota 2.5 0.5 0.5 0.5 1 0 5 -1 -1
50 Wyoming 0.5 1 1 0 2 0 4.5 0 -1
51 North Dakota 0 1 1 0.5 0.5 0 3 0 -1
EMBARGOED
METHODOLOGY & RESULTS 2016 STATE SCORECARD © ACEEE
9
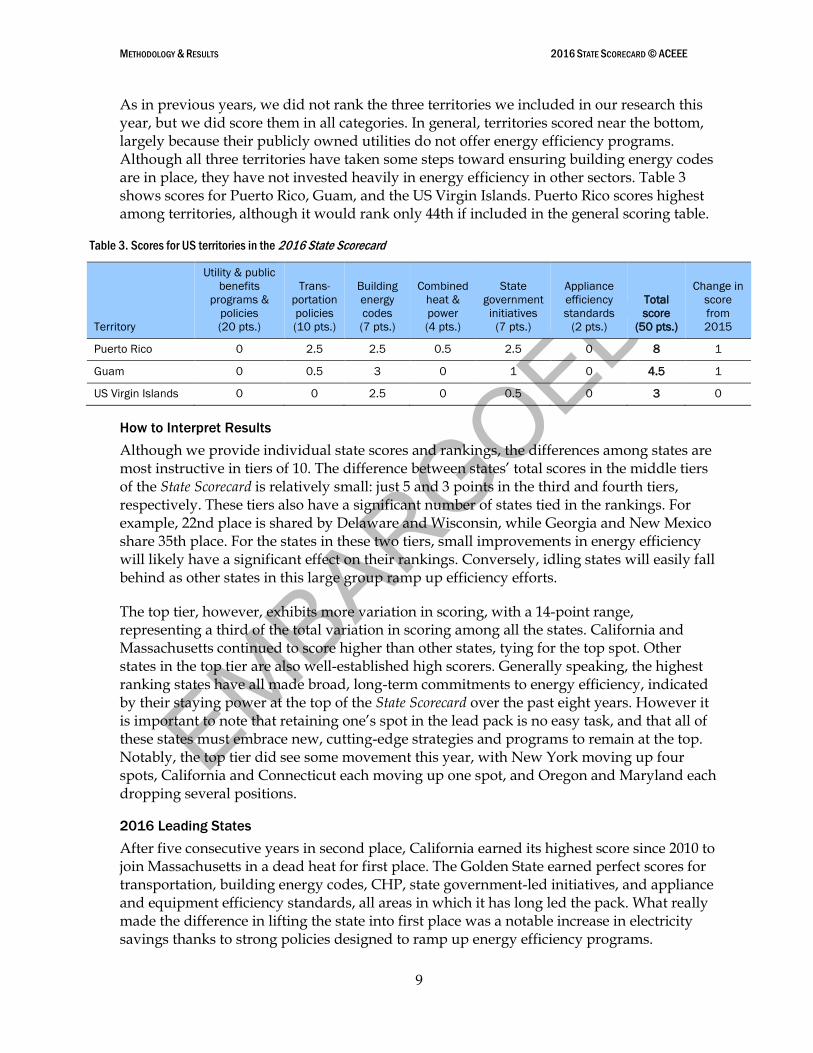
As in previous years, we did not rank the three territories we included in our research this year, but we did score them in all categories. In general, territories scored near the bottom, largely because their publicly owned utilities do not offer energy efficiency programs. Although all three territories have taken some steps toward ensuring building energy codes are in place, they have not invested heavily in energy efficiency in other sectors. Table 3 shows scores for Puerto Rico, Guam, and the US Virgin Islands. Puerto Rico scores highest among territories, although it would rank only 44th if included in the general scoring table.
Table 3. Scores for US territories in the 2016 State Scorecard
Territory
Utility & public
benefits
programs &
policies
(20 pts.)
Trans-
portation
policies
(10 pts.)
Building
energy
codes
(7 pts.)
Combined
heat &
power
(4 pts.)
State
government
initiatives
(7 pts.)
Appliance
efficiency
standards
(2 pts.)
Total
score
(50 pts.)
Change in
score
from
2015
Puerto Rico 0 2.5 2.5 0.5 2.5 0 8 1
Guam 0 0.5 3 0 1 0 4.5 1
US Virgin Islands 0 0 2.5 0 0.5 0 3 0
How to Interpret Results
Although we provide individual state scores and rankings, the differences among states are most instructive in tiers of 10. The difference between states’ total scores in the middle tiers of the State Scorecard is relatively small: just 5 and 3 points in the third and fourth tiers, respectively. These tiers also have a significant number of states tied in the rankings. For example, 22nd place is shared by Delaware and Wisconsin, while Georgia and New Mexico share 35th place. For the states in these two tiers, small improvements in energy efficiency will likely have a significant effect on their rankings. Conversely, idling states will easily fall behind as other states in this large group ramp up efficiency efforts.
The top tier, however, exhibits more variation in scoring, with a 14-point range, representing a third of the total variation in scoring among all the states. California and Massachusetts continued to score higher than other states, tying for the top spot. Other states in the top tier are also well-established high scorers. Generally speaking, the highest ranking states have all made broad, long-term commitments to energy efficiency, indicated by their staying power at the top of the State Scorecard over the past eight years. However it is important to note that retaining one’s spot in the lead pack is no easy task, and that all of these states must embrace new, cutting-edge strategies and programs to remain at the top. Notably, the top tier did see some movement this year, with New York moving up four spots, California and Connecticut each moving up one spot, and Oregon and Maryland each dropping several positions.
2016 Leading States
After five consecutive years in second place, California earned its highest score since 2010 to join Massachusetts in a dead heat for first place. The Golden State earned perfect scores for transportation, building energy codes, CHP, state government-led initiatives, and appliance and equipment efficiency standards, all areas in which it has long led the pack. What really made the difference in lifting the state into first place was a notable increase in electricity savings thanks to strong policies designed to ramp up energy efficiency programs.
EMBARGOED
METHODOLOGY & RESULTS 2016 STATE SCORECARD © ACEEE
10
Through the California Clean Jobs Act (Proposition 39), the state has allocated sizeable funding to energy efficiency projects in schools. The state also began implementing a cap-and-trade program (required by the California Global Warming Solutions Act of 2006) in 2013. Energy efficiency makes up a significant portion of the state’s strategy for meeting this program’s GHG emissions-reduction goals. California continues to look to the future, having recently enacted two pieces of efficiency-spurring legislation: Senate Bill 350, requiring a doubling of energy efficiency savings from electricity and natural gas end-uses by 2030, and Assembly Bill 802, which promotes building benchmarking and enables access to whole-building data for buildings above a certain size.
Massachusetts also made progress this year, raising its score by 1 point, but not quite enough to hold off California. The increase coincided with the Bay State’s efforts this year to adopt the IECC 2015 and ASHRAE standard 90.1-2013 as part of the ninth edition of the state’s building energy codes. Massachusetts has a strong track record on energy efficiency. The state’s Green Communities Act of 2008 laid the foundation for greater investments in energy efficiency programs by requiring gas and electric utilities to save a large and growing percentage of energy every year through energy efficiency. Its 2013 to 2015 electricity and gas savings goals were the most aggressive in the country, and this year Massachusetts continued to raise the bar by finalizing electricity efficiency targets approaching 3% for its next three-year cycle and increasing its annual natural gas target to 1.24% (MA EEAC 2015). Vermont ranks third this year, the same place it held in 2015, due to its strong performance across nearly every policy area. Rhode Island, in fourth, achieved the highest electricity savings of any state, reporting statewide savings approaching 3%. New York earned an additional 3 points to move into a tie with Connecticut for fifth place. Both states saw notable increases in electricity savings as a percentage of sales and made moves to update state building energy codes to more stringent model codes. Table 4 shows the number of years that states have been in the top 5 and top 10 spots in the State Scorecard rankings since 2007.
EMBARGOED
METHODOLOGY & RESULTS 2016 STATE SCORECARD © ACEEE
11
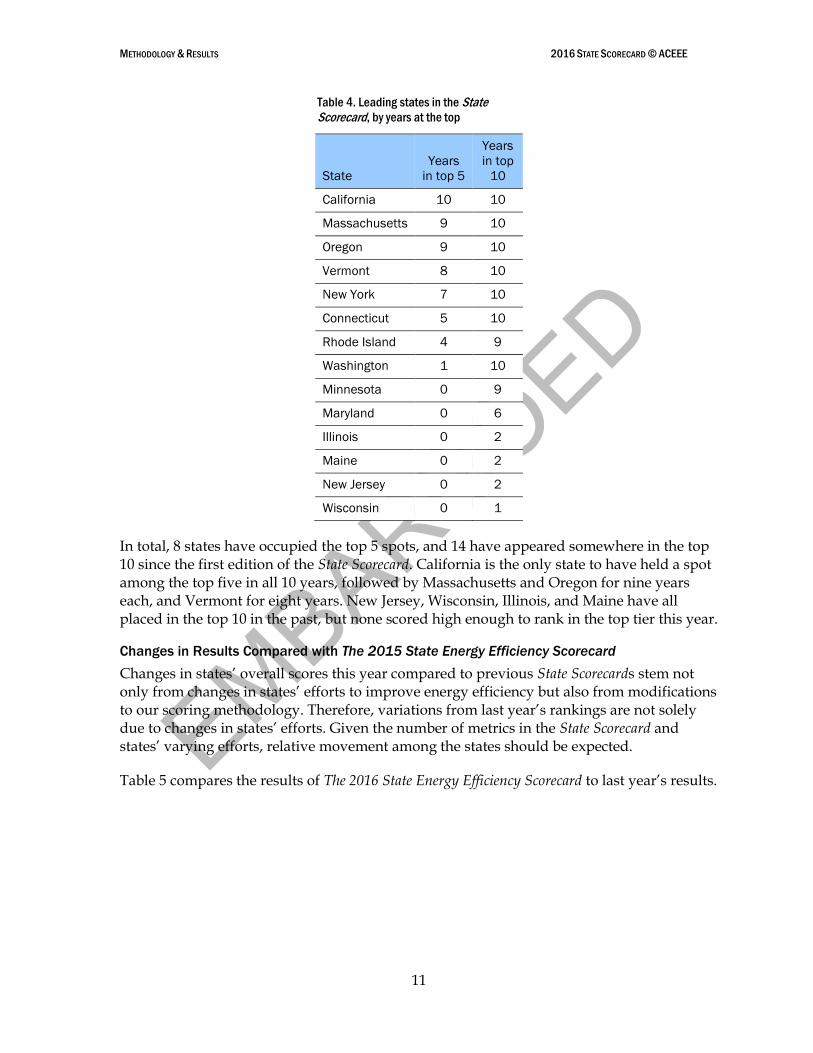
Table 4. Leading states in the State Scorecard, by years at the top
State
Years
in top 5
Years
in top
10
California 10 10
Massachusetts 9 10
Oregon 9 10
Vermont 8 10
New York 7 10
Connecticut 5 10
Rhode Island 4 9
Washington 1 10
Minnesota 0 9
Maryland 0 6
Illinois 0 2
Maine 0 2
New Jersey 0 2
Wisconsin 0 1
In total, 8 states have occupied the top 5 spots, and 14 have appeared somewhere in the top 10 since the first edition of the State Scorecard. California is the only state to have held a spot among the top five in all 10 years, followed by Massachusetts and Oregon for nine years each, and Vermont for eight years. New Jersey, Wisconsin, Illinois, and Maine have all placed in the top 10 in the past, but none scored high enough to rank in the top tier this year.
Changes in Results Compared with The 2015 State Energy Efficiency Scorecard
Changes in states’ overall scores this year compared to previous State Scorecards stem not only from changes in states’ efforts to improve energy efficiency but also from modifications to our scoring methodology. Therefore, variations from last year’s rankings are not solely due to changes in states’ efforts. Given the number of metrics in the State Scorecard and states’ varying efforts, relative movement among the states should be expected.
Table 5 compares the results of The 2016 State Energy Efficiency Scorecard to last year’s results.

EMBARGOED
METHODOLOGY & RESULTS 2016 STATE SCORECARD © ACEEE
12
Table 5. Number of states and territories gaining or losing points compared with 2015, by policy area
Policy category States gaining points No change States losing points
Utility & public benefits 13 24% 17 31% 24 44%
Transportation 11 20% 25 46% 18 33%
Building energy codes 22 41% 26 48% 6 11%
Combined heat and power 10 19% 38 70% 6 11%
State government initiatives 24 44% 19 35% 11 20%
Appliance standards 0 0% 45 83% 9 17%
Total score 25 46% 8 15% 21 39%
Percentages may not total 100 due to rounding.
Overall, 25 states and territories gained points and 21 states lost points compared with last year. Seven states and one territory had no change in score.3 Some of the changes in points were due to our methodological changes, and so the number of states losing points should not necessarily be interpreted as a sign that states are losing ground. Rather, we raised the bar and awarded points for more ambitious programs and policies, particularly in electricity savings and appliance and equipment standards.
The landscape for energy efficiency is clearly in constant flux, and many opportunities remain for states to lead the way. The changes in state scores reflect an ever-rising bar for energy efficiency policies and outcomes. For example, as Chapter 2 describes, 24 states lost points in utility and public benefits programs and policies. This overall decrease reflects our added emphasis on performance metrics rather than spending metrics. That said, the general pattern is not indicative of a lack of progress among states. While several states have backslid in terms of policy—examples include Indiana’s 2014 rollback of its energy efficiency resource standards (EERS) and Ohio’s embattled EERS, which remains frozen as of summer 2016—most continued to make advances. Savings from electric efficiency programs in 2015 totaled approximately 26.5 million megawatt-hours (MWh), a 3.1% increase over the 2014 savings reported in last year’s State Scorecard. These savings are equivalent to more than 0.7% of total retail electricity sales in the United States in 2015. More information on state scores for utility programs is included in Chapter 2.
Most-Improved States
Eighteen states rose in the rankings this year, and while all should be applauded, several made particularly noteworthy gains in overall points compared with last year.4 This year’s most improved states were Missouri, Maine, and Michigan. All of these states earned
3 The State Scorecard looks at all 50 states and the District of Columbia, which, while not a state, is grouped under that heading for convenience. We also score, but do not rank, three US territories, including the US Virgin Islands.
4 Note that change in rank reflects performance relative to other states. Change in score refers to absolute number of points earned.
EMBARGOED
METHODOLOGY & RESULTS 2016 STATE SCORECARD © ACEEE
13
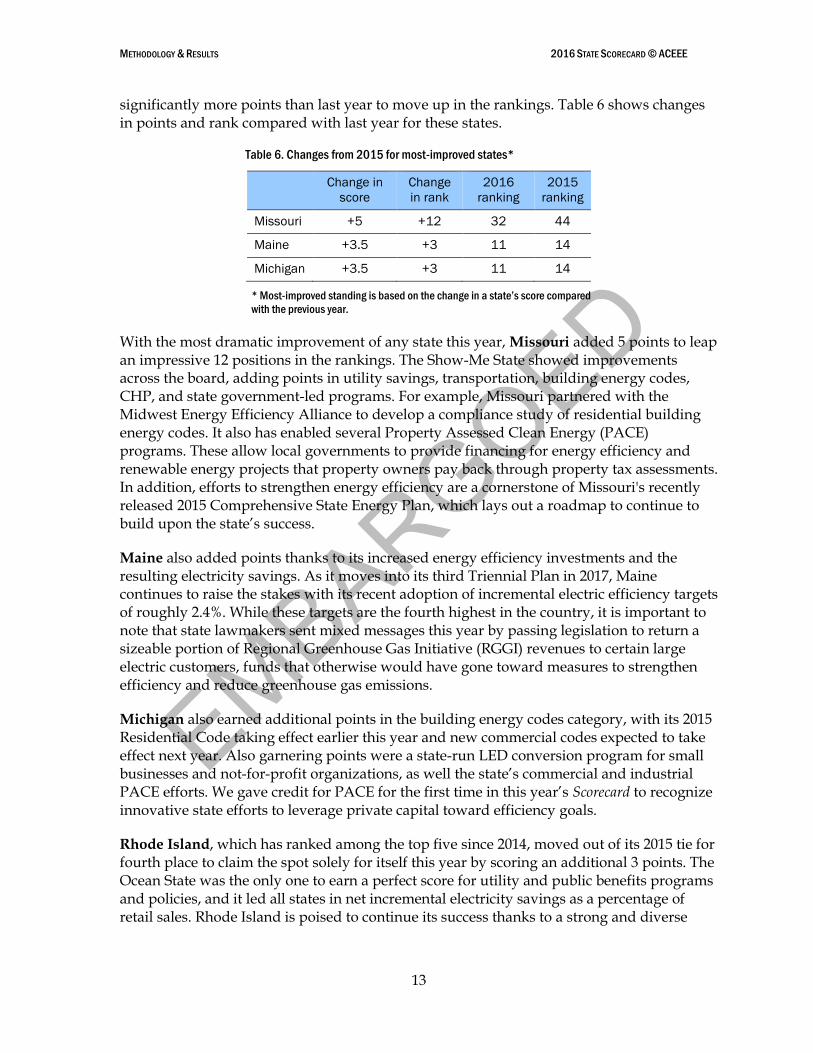
significantly more points than last year to move up in the rankings. Table 6 shows changes in points and rank compared with last year for these states.
Table 6. Changes from 2015 for most-improved states*
Change in
score
Change
in rank
2016
ranking
2015
ranking
Missouri +5 +12 32 44
Maine +3.5 +3 11 14
Michigan +3.5 +3 11 14
* Most-improved standing is based on the change in a state’s score compared
with the previous year.
With the most dramatic improvement of any state this year, Missouri added 5 points to leap an impressive 12 positions in the rankings. The Show-Me State showed improvements across the board, adding points in utility savings, transportation, building energy codes, CHP, and state government-led programs. For example, Missouri partnered with the Midwest Energy Efficiency Alliance to develop a compliance study of residential building energy codes. It also has enabled several Property Assessed Clean Energy (PACE) programs. These allow local governments to provide financing for energy efficiency and renewable energy projects that property owners pay back through property tax assessments. In addition, efforts to strengthen energy efficiency are a cornerstone of Missouri's recently released 2015 Comprehensive State Energy Plan, which lays out a roadmap to continue to build upon the state’s success.
Maine also added points thanks to its increased energy efficiency investments and the resulting electricity savings. As it moves into its third Triennial Plan in 2017, Maine continues to raise the stakes with its recent adoption of incremental electric efficiency targets of roughly 2.4%. While these targets are the fourth highest in the country, it is important to note that state lawmakers sent mixed messages this year by passing legislation to return a sizeable portion of Regional Greenhouse Gas Initiative (RGGI) revenues to certain large electric customers, funds that otherwise would have gone toward measures to strengthen efficiency and reduce greenhouse gas emissions.
Michigan also earned additional points in the building energy codes category, with its 2015 Residential Code taking effect earlier this year and new commercial codes expected to take effect next year. Also garnering points were a state-run LED conversion program for small businesses and not-for-profit organizations, as well the state’s commercial and industrial PACE efforts. We gave credit for PACE for the first time in this year’s Scorecard to recognize innovative state efforts to leverage private capital toward efficiency goals.
Rhode Island, which has ranked among the top five since 2014, moved out of its 2015 tie for fourth place to claim the spot solely for itself this year by scoring an additional 3 points. The Ocean State was the only one to earn a perfect score for utility and public benefits programs and policies, and it led all states in net incremental electricity savings as a percentage of retail sales. Rhode Island is poised to continue its success thanks to a strong and diverse
EMBARGOED
METHODOLOGY & RESULTS 2016 STATE SCORECARD © ACEEE
14
portfolio of state government policies—including rebates, loan programs, and PACE financing—that encourage energy efficiency.
Other states have also made recent progress in energy efficiency.
New York, which continues to lay the regulatory foundations for its utility system of the future through its Reforming the Energy Vision (REV) proceeding, also posted an increase in electricity savings. Earlier in the year, the Empire State also completed major updates to its state building energy codes, incorporating the 2015 IECC and ASHRAE 90.1-2013 standards. Utah and Tennessee made similar gains thanks to updates to state building energy codes this year. Arkansas committed to extend its energy efficiency goals and gained points for state government-led policies, including a home energy loan program and PACE financing.
States Losing Ground
Twenty-three states fell in the rankings this year due to several factors, including policy or program rollbacks, faster progress by other states, and changes to the scoring methodology in four of our policy areas (utilities, transportation, CHP, and building codes). This loss of ground also indicates the complex relationship between changes in total score and changes in rank. Of the 21 states that lost points, 18 fell in the rankings.5 The rankings of two others did not change, while one state, Mississippi, actually rose in the rankings despite losing points compared to last year. Meanwhile, Kentucky added to its score, but nonetheless fell in the rankings. Given the number of metrics covered in the State Scorecard and states’ differing efforts, relative movement among states should be expected. As mentioned earlier, the difference among states’ total scores, particularly in the third and fourth tiers of the State Scorecard, is small; as a result, idling states can easily fall behind in the rankings as others ramp up efforts to become more energy efficient.
Three states had the most noticeable overall drops in score compared with last year: Illinois lost 4.5 points, and Maryland and Oklahoma lost 3 points each. Illinois’s fall illustrates the need to consistently update and improve policy. Although the state has energy savings targets in place, spending cannot exceed an established cost cap; as a result, regulators have approved lower targets in recent years. And although legislation provides for additional procurement of certain energy efficiency measures not subject to the cost cap, Illinois still has not kept pace with neighboring states such as Minnesota. Finally, for Illinois and other states, some of the loss in points can be attributed to updates in our scoring methodology, emphasizing total savings over amounts of utility ratepayer funds committed to energy efficiency.
Maryland lost points due to both a dip in electricity program savings and updates to our methodology. Meanwhile, Oklahoma’s score was impacted by the state legislature’s elimination of an Energy Efficient Residential Construction Tax Credit and the State Energy Facilities Program. Also figuring into its reduced score was the fact that its commercial
5 The three US territories also lost points this year, but they are not included in our rankings.
EMBARGOED
METHODOLOGY & RESULTS 2016 STATE SCORECARD © ACEEE
15
building energy codes still reference the older 2006 IECC model code. The great majority of state building codes are at least as stringent as the 2009 IECC and ASHRAE 90.1-2007.
In general, we see two trends among these states and others losing ground in the State Scorecard. First, many of the states falling behind are not increasing energy savings year after year and are therefore being outpaced as other states ramp up programs to meet higher savings targets. These states typically have not fully implemented changes to the utility business model that encourage utilities to take full advantage of energy efficiency as a resource, including decoupling, performance incentives, and energy savings targets.
Secondly, opt-out provisions have been approved in many of the states falling behind in the State Scorecard rankings. These provisions allow large customers to avoid paying into energy efficiency programs, forcing other customers to subsidize them and limiting the amount of energy savings utilities can achieve.
STRATEGIES FOR IMPROVING ENERGY EFFICIENCY
No state received the full 50 points in The 2016 State Energy Efficiency Scorecard, reflecting the fact that opportunities remain in all states—including leading states—to improve energy efficiency. For states wanting to raise their standing in the State Scorecard and, more important, to capture greater energy savings and the associated public benefits, we offer the following recommendations based on the metrics we track.
Establish and adequately fund an EERS or similar energy savings target. These policies set specific energy savings targets that utilities or independent statewide program administrators must meet through customer energy efficiency programs and market transformation. They also serve as an enabling framework for cost-effective investment, savings, and program activity that, as seen in many of the leading states, can have a catalytic effect on increasing energy efficiency and its associated economic and environmental benefits. Although some states opt to include energy efficiency within the integrated resource planning (IRP) process, experience suggests that EERS policies truly drive higher cost-effective efficiency savings than any other method. The long-term goals associated with an EERS send a clear signal to market actors about the importance of energy efficiency resources in utility program planning, creating a level of certainty that encourages large-scale, productive investment in energy efficiency technologies and services. EERS targets should be established alongside rigorous, robust integrated and distributed resources planning. Long-term energy savings targets require leadership, sustainable funding sources, and institutional support to deliver on their goals. Chapter 2 has details.
Examples: Massachusetts, Arizona, Hawaii, Rhode Island
Adopt updated, more-stringent building energy codes, improve code compliance, and enable efficiency program administrators to be involved in code support. Buildings consume more than 40% of the total energy used in the United States, making them an essential target for energy savings. Mandatory building energy codes are one way to ensure a minimum level of energy efficiency for new residential and commercial buildings. Model codes are only as effective as their level of implementation, however, and improved compliance activities—including training and code-compliance surveys—are increasingly
EMBARGOED
METHODOLOGY & RESULTS 2016 STATE SCORECARD © ACEEE
16
important. Another emerging policy driver for capturing energy savings from codes is the enabling of utility and program administrators to support compliance activities. See Chapter 4 for details.
Examples: California, Maryland, Illinois, Texas
Set quantitative targets for reducing VMT and integrate land use and transportation planning. Like buildings, transportation consumes a substantial portion of the total energy used in the United States. Although the recent federal fuel economy standards will go a long way in helping to reduce fuel consumption, states will realize even greater energy savings by addressing transportation system efficiency as a whole. Codifying targets for reducing VMT is an important step toward achieving substantial reductions in energy use, as is ensuring that states integrate land use and transportation planning to create sustainable communities with access to multiple modes of transportation.
Examples: California, New York, Massachusetts, Oregon
Treat cost-effective and efficient CHP as an energy efficiency resource equivalent to other forms of energy efficiency. Several states list CHP as an eligible technology in their EERS or renewable portfolio standard (RPS) but relegate it to a bottom tier, letting other renewable technologies and efficiency resources take priority within the standard. ACEEE recommends that CHP savings be given equal footing, which requires states to develop a specific methodology for counting CHP savings. If CHP is considered an eligible resource, total energy savings target levels should be increased to take CHP’s potential into account. Massachusetts has accomplished this in its Green Communities Act.
Example: Massachusetts
Expand and highlight state-led efforts, such as funding for energy efficiency incentive programs, benchmarking requirements for state building energy use, and investments in energy efficiency–related R&D centers. State-led initiatives complement the existing landscape of utility programs, leveraging resources from the state’s public and private sectors to generate energy and cost savings that benefit taxpayers and consumers. States have many opportunities to lead by example here, including by reducing energy use in public buildings and fleets, and by enabling the market for energy service companies (ESCOs) that finance and deliver energy-saving projects. States can also fund research centers that focus on energy-efficient technology breakthroughs. See Chapter 6 for details.
Examples: New York, Connecticut, Alaska
Explore and promote innovative financing mechanisms to leverage private capital and lower upfront costs of energy efficiency measures. While utilities in many states offer some form of on-bill financing program to promote energy efficiency in homes and buildings, expanding lender and customer participation has been an ongoing challenge. States can help address this challenge by passing legislation, increasing stakeholder awareness, and addressing legal barriers to the implementation of financing programs. A growing number of states are seeking new ways to maximize the impact of public funds and

EMBARGOED
METHODOLOGY & RESULTS 2016 STATE SCORECARD © ACEEE
17
invigorate energy efficiency by attracting private capital through emerging financing models such as PACE and green banks.
Examples: Missouri, New York, Rhode Island
EMBARGOED
UTILITY POLICIES 2016 STATE SCORECARD © ACEEE
18
Chapter 2. Utility and Public Benefits Programs and Policies
Authors: Seth Nowak and Weston Berg
INTRODUCTION
The utility sector is critical to implementing energy efficiency. Electric and natural gas utilities and independent statewide program administrators deliver a substantial share of US electricity and natural gas efficiency programs.6 Utility customers fund these programs through utility rates and statewide public benefits funds. Through these programs, utilities encourage customers to use efficient technologies and thereby reduce their energy waste. Energy efficiency is therefore a resource—one similar to power plants, wind turbines, or solar panels. Driven by regulation from state utility commissions, utilities and program administrators in some states have been delivering energy efficiency programs and market transformation initiatives for decades, offering various efficiency services for residential, commercial, industrial, and low-income customers.7
Utilities and administrators implement energy efficiency programs in all 50 states and the District of Columbia. Program approaches include financial incentives, such as rebates and loans; technical services, such as audits, retrofits, and training for architects, engineers, and building owners; behavioral strategies; and educational campaigns about the benefits of energy efficiency improvements. Utilities and administrators also continue to develop new and creative ways of delivering energy efficiency to their customers, including some customer segments that have been more difficult to serve, such as small business and multifamily.
METHODOLOGY
For this chapter, we gathered statewide data on the following:
Utility energy sales (electricity and natural gas) to customers in 2014 and 2015
Utility revenues from retail energy sales in 2014 and 2015
Number of residential natural gas customers in 2014
Budgets for electricity and natural gas energy efficiency programs in 2015 and 2016
Actual spending for electricity and natural gas energy efficiency programs in 2014 and 2015
Incremental net and gross energy electricity and natural gas energy efficiency program savings in 2014 and 20158
6 Other major programs, run by state governments, are discussed in Chapter 6.
7 For more information on the historical growth of utility energy efficiency programs, see ACEEE’s Three Decades and Counting: A Historical Review and Current Assessment of Electric Utility Energy Efficiency Activity in the States (York et al. 2012).
8 Gross savings are those expected from an energy efficiency program, crediting all installed efficiency measures, including those that would have been installed in the absence of the program. Net savings are those attributable to the program, typically calculated by removing free riders (program participants who would have implemented or installed the measures without incentive, or with a lesser incentive). States differ in how they define, measure, and account for free-ridership and other components of the net savings calculation (Haeri and Khawaja 2012).
EMBARGOED
UTILITY POLICIES 2016 STATE SCORECARD © ACEEE
19
Policies and regulations to encourage utility investment in energy efficiency
Utility policies and programs related to large customers, including self-direct and opt-out provisions
Data access policies and provisions9
Our data sources included information requests completed by state utility commissions, the Consortium for Energy Efficiency (CEE 2012–2016),10 EIA (EIA 2015, 2016a, 2016b, 2016c), and regional efficiency groups.11 We sent the data we gathered, including last year’s State Scorecard data, to state utility commissions and independent administrators for review. Table 7 shows overall scores for utility programs and policies. Tables 9, 11, 13, and 15 provide data on electricity and natural gas efficiency program savings and spending in the most recent years for which data are available.
SCORING AND RESULTS
This chapter reviews and ranks the states based on their performance in implementing utility-sector efficiency programs and enabling policies that are evidence of states’ commitment to energy efficiency. The seven utility scoring metrics are
Incremental electricity program savings as a percentage of retail sales (7 points)12
Incremental natural gas program savings as a percentage of residential and commercial sales (3 points)
Electricity program spending as a percentage of statewide electric utility revenues (3 points)
Natural gas program spending per residential gas customer (2 points)
Opt-out provisions for large customers (reduction of 1 point)
EERS for utilities and statewide program administrators (3 points)
Utility business models that encourage energy efficiency, including performance incentives and mechanisms for addressing lost revenue (2 points)
In this category, a state could earn up to 20 points, or 40% of the 50 total points possible in the State Scorecard. We set this point allocation because the savings potential of utility and
9 We used these data from state responses to present best practices, not to develop scores.
10 The Consortium for Energy Efficiency (CEE) surveys administrators of public benefits programs annually to capture trends in aggregated budgets and expenditures. CEE has granted ACEEE permission to reference survey results as of a point in time for the purpose of capturing updates to the budget, expenditure, and impacts data. The full report is at www.cee1.org/annual-industry-reports.
11 The six regional energy efficiency organizations (REEOs) include the Midwest Energy Efficiency Alliance
(MEEA), Northeast Energy Efficiency Partnerships (NEEP), Northwest Energy Efficiency Alliance (NEEA), Southeast Energy Efficiency Alliance (SEEA), South-Central Partnership for Energy Efficiency as a Resource (SPEER), and Southwest Energy Efficiency Project (SWEEP). The REEOs work through funded partnerships with the US Department of Energy and with various stakeholders, such as utilities and advocacy groups, to provide technical assistance to states and municipalities in support of efficiency policy development and program design and implementation.
12 ACEEE defines incremental savings as new savings from programs implemented in a given year. Incremental savings are distinct from cumulative savings, i.e., the savings in a given program year from all the measures that have been implemented under the programs in that year and in prior years that are still saving energy.
EMBARGOED
UTILITY POLICIES 2016 STATE SCORECARD © ACEEE
20
public benefits programs is approximately 40% of the total energy savings potential of all policy areas scored. Studies suggest that electricity programs typically achieve at least three times more primary energy savings than natural gas programs (Eldridge et al. 2009; Geller et al. 2007; Elliott et al. 2007a; Elliott et al. 2007b). Utility-sector potential studies generally indicate significant untapped potential for natural gas efficiency programs (Neubauer 2011; Itron 2006; Mosenthal et al. 2014; GDS 2013; Cadmus 2010). Therefore, we allocated 10 points to performance metrics for electricity programs (annual savings and spending data) and 5 points to performance metrics for natural gas programs (annual savings and spending data). In an effort to award more points to actual energy savings and fewer points to program spending, we shifted a point from spending to savings within the electricity efficiency programs category. To support this change, we refined our data request to improve the accuracy of responses, including accounting for transmission line loss factors for states reporting at the generator level. We also scored states on a variety of enabling policies.
Our scoring methodology for utility sector efficiency savings has had some unintended impacts that we have tried to correct. It disadvantages several states because of the types of energy used or the types of fuels offered to consumers. Hawaii, for example, consumes almost no natural gas (EIA 2016d), so it aims energy efficiency efforts at reducing electricity consumption only. To correct for this issue, we awarded Hawaii the points for natural gas efficiency spending, savings, and regulatory structures equivalent to the proportion of points it earned for corresponding electricity programs and policies. We gave the same treatment to the three US territories included in this report. Elsewhere, particularly in the Northeast, energy efficiency efforts often aim to reduce the consumption of fuel oil. While we capture these efforts in program spending when they are combined with efficiency programs targeting electricity or natural gas, we have not otherwise accounted for fuel oil savings, but will consider ways to do so in future iterations of the State Scorecard.13
We continue our practice of reporting programs’ incremental energy savings (new savings from programs in each program cycle) rather than their cumulative energy savings (savings in a given year from all current and previously implemented energy efficiency measures still saving energy under applicable programs). We report incremental savings in the State Scorecard for two reasons. First, basing our scoring on cumulative energy savings would involve levels of complexity that are beyond the scope of the State Scorecard, including identifying the start year for the cumulative series and accurately accounting for the life of energy efficiency measures and the persistence of savings. Second, the State Scorecard aims to provide a snapshot of states’ current energy efficiency programs, and incremental savings give a clearer picture of recent efforts.
This year, we also requested that our contacts at state utility commissions provide both lifetime savings and cumulative savings from electric and gas energy efficiency programs.
13 In the 2016 State Scorecard data request distributed to utility commissions, we did ask respondents to provide
levels of savings and program expenditures associated with fuel oil savings. Eight states reported data in this category. Given variations in reporting formats among states, we did not include fuel oil savings in this year’s Scorecard but intend to do so next year.
EMBARGOED
UTILITY POLICIES 2016 STATE SCORECARD © ACEEE
21
Cumulative savings are the savings in a given program year from all measures that have been implemented under the program that year and in prior years that are still saving energy. Meanwhile, lifetime savings look ahead to the expected energy savings over the lifetime of an installed measure(s), calculated by multiplying the incremental MWh or therm reduction associated with a measure(s) by the expected lifetime of that measure(s).14 Although lifecycle savings have the potential to serve as a forward-looking alternative to our current scoring methodology, we did not use these measures for scoring this year, as we did not have data for roughly half of the states.
There are some other possible metrics we do not use for scoring. We do not attempt to include program cost effectiveness or level of spending per unit of energy savings. All states have cost-effectiveness requirements for energy efficiency programs. However the wide diversity of measurement approaches across states makes comparison less than straightforward. Also, several states require program administrators to pursue all cost-effective efficiency. Although some states have prioritized low acquisition costs and encouraged maximizing the degree of cost effectiveness, promoting larger amounts of marginally cost-effective energy savings is another valid approach. We also do not adjust savings for variations in avoided costs of energy across states, as there are examples of achieving deep energy savings in both high- and low-cost states.
Note that scores are for states as a whole, and therefore may not be representative of the specific efforts of each utility within the state. We do not assess the energy savings performance of individual utilities.15 A single utility, or small set of utilities, may do very well in terms of energy efficiency programs and associated metrics (spending and savings), but when viewed in combination with all utilities in that state, such efforts can be masked by other utilities not performing as well.
Table 7 lists states’ overall utility scoring. Explanations of each metric follow.
14 EIA refers to this type of data as incremental life cycle savings.
15 ACEEE is currently in the research phase of its inaugural Utility Scorecard, anticipated for a 2017 release.
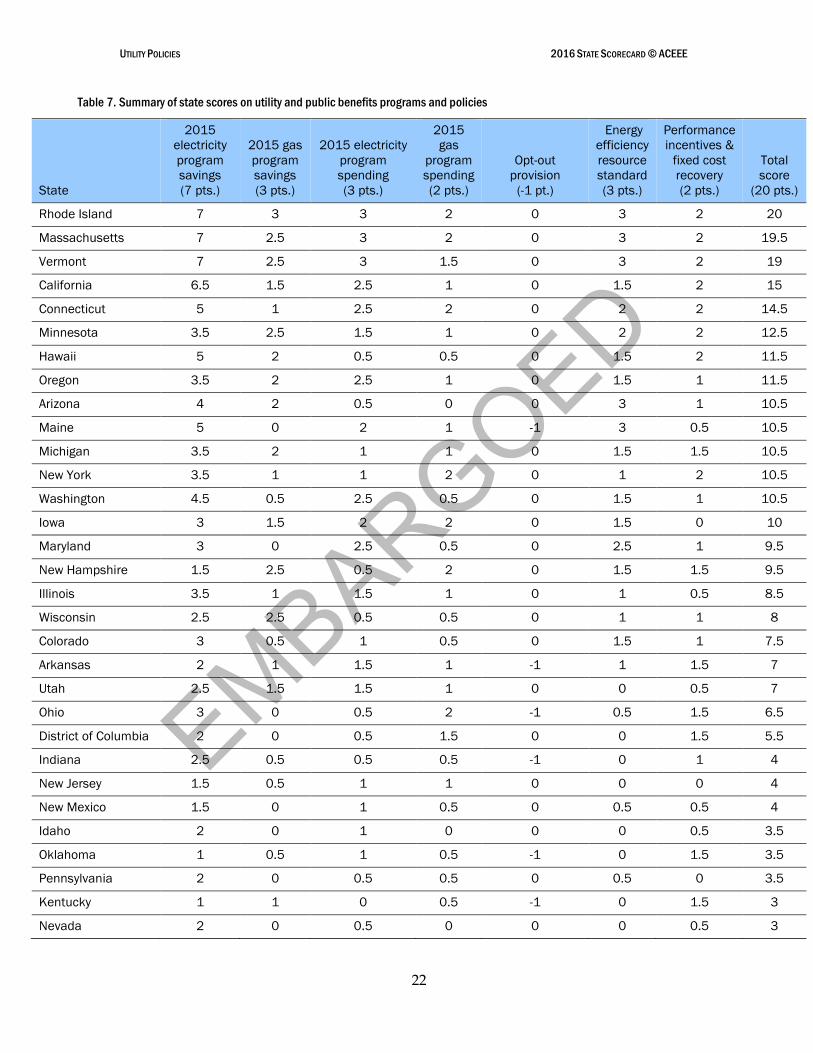
EMBARGOED
UTILITY POLICIES 2016 STATE SCORECARD © ACEEE
22
Table 7. Summary of state scores on utility and public benefits programs and policies
State
2015
electricity
program
savings
(7 pts.)
2015 gas
program
savings
(3 pts.)
2015 electricity
program
spending
(3 pts.)
2015
gas
program
spending
(2 pts.)
Opt-out
provision
(-1 pt.)
Energy
efficiency
resource
standard
(3 pts.)
Performance
incentives &
fixed cost
recovery
(2 pts.)
Total
score
(20 pts.)
Rhode Island 7 3 3 2 0 3 2 20
Massachusetts 7 2.5 3 2 0 3 2 19.5
Vermont 7 2.5 3 1.5 0 3 2 19
California 6.5 1.5 2.5 1 0 1.5 2 15
Connecticut 5 1 2.5 2 0 2 2 14.5
Minnesota 3.5 2.5 1.5 1 0 2 2 12.5
Hawaii 5 2 0.5 0.5 0 1.5 2 11.5
Oregon 3.5 2 2.5 1 0 1.5 1 11.5
Arizona 4 2 0.5 0 0 3 1 10.5
Maine 5 0 2 1 -1 3 0.5 10.5
Michigan 3.5 2 1 1 0 1.5 1.5 10.5
New York 3.5 1 1 2 0 1 2 10.5
Washington 4.5 0.5 2.5 0.5 0 1.5 1 10.5
Iowa 3 1.5 2 2 0 1.5 0 10
Maryland 3 0 2.5 0.5 0 2.5 1 9.5
New Hampshire 1.5 2.5 0.5 2 0 1.5 1.5 9.5
Illinois 3.5 1 1.5 1 0 1 0.5 8.5
Wisconsin 2.5 2.5 0.5 0.5 0 1 1 8
Colorado 3 0.5 1 0.5 0 1.5 1 7.5
Arkansas 2 1 1.5 1 -1 1 1.5 7
Utah 2.5 1.5 1.5 1 0 0 0.5 7
Ohio 3 0 0.5 2 -1 0.5 1.5 6.5
District of Columbia 2 0 0.5 1.5 0 0 1.5 5.5
Indiana 2.5 0.5 0.5 0.5 -1 0 1 4
New Jersey 1.5 0.5 1 1 0 0 0 4
New Mexico 1.5 0 1 0.5 0 0.5 0.5 4
Idaho 2 0 1 0 0 0 0.5 3.5
Oklahoma 1 0.5 1 0.5 -1 0 1.5 3.5
Pennsylvania 2 0 0.5 0.5 0 0.5 0 3.5
Kentucky 1 1 0 0.5 -1 0 1.5 3
Nevada 2 0 0.5 0 0 0 0.5 3
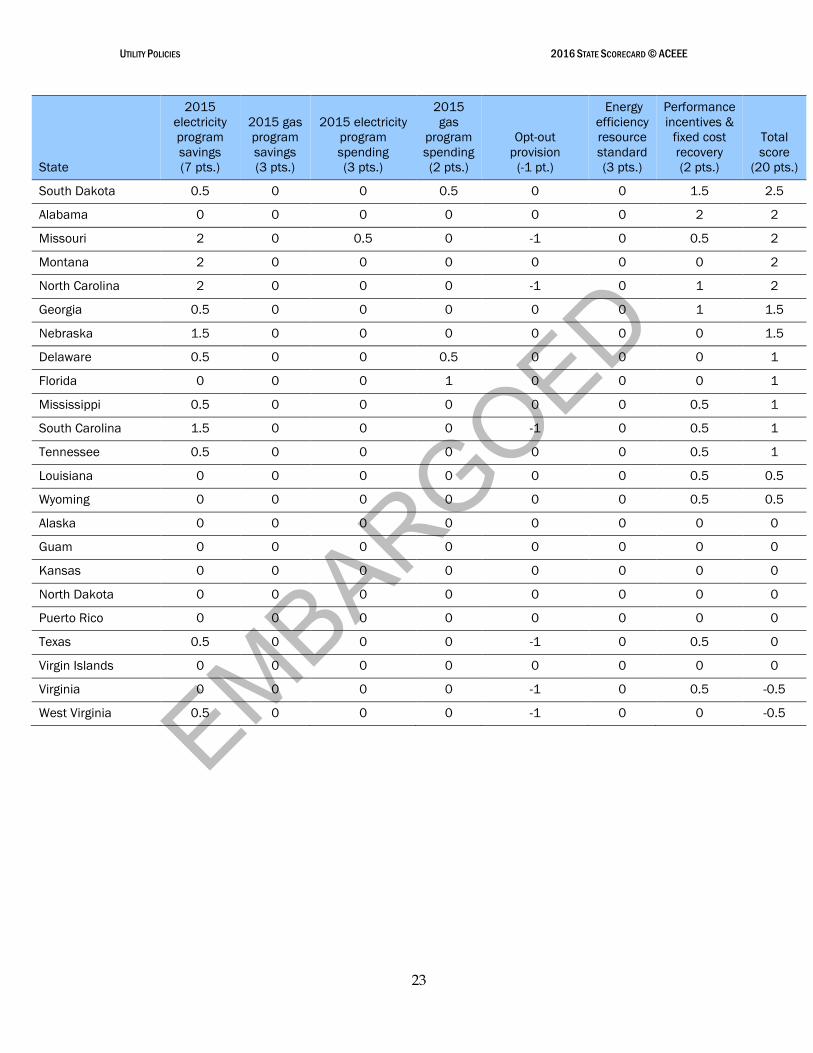
EMBARGOED
UTILITY POLICIES 2016 STATE SCORECARD © ACEEE
23
State
2015
electricity
program
savings
(7 pts.)
2015 gas
program
savings
(3 pts.)
2015 electricity
program
spending
(3 pts.)
2015
gas
program
spending
(2 pts.)
Opt-out
provision
(-1 pt.)
Energy
efficiency
resource
standard
(3 pts.)
Performance
incentives &
fixed cost
recovery
(2 pts.)
Total
score
(20 pts.)
South Dakota 0.5 0 0 0.5 0 0 1.5 2.5
Alabama 0 0 0 0 0 0 2 2
Missouri 2 0 0.5 0 -1 0 0.5 2
Montana 2 0 0 0 0 0 0 2
North Carolina 2 0 0 0 -1 0 1 2
Georgia 0.5 0 0 0 0 0 1 1.5
Nebraska 1.5 0 0 0 0 0 0 1.5
Delaware 0.5 0 0 0.5 0 0 0 1
Florida 0 0 0 1 0 0 0 1
Mississippi 0.5 0 0 0 0 0 0.5 1
South Carolina 1.5 0 0 0 -1 0 0.5 1
Tennessee 0.5 0 0 0 0 0 0.5 1
Louisiana 0 0 0 0 0 0 0.5 0.5
Wyoming 0 0 0 0 0 0 0.5 0.5
Alaska 0 0 0 0 0 0 0 0
Guam 0 0 0 0 0 0 0 0
Kansas 0 0 0 0 0 0 0 0
North Dakota 0 0 0 0 0 0 0 0
Puerto Rico 0 0 0 0 0 0 0 0
Texas 0.5 0 0 0 -1 0 0.5 0
Virgin Islands 0 0 0 0 0 0 0 0
Virginia 0 0 0 0 -1 0 0.5 -0.5
West Virginia 0.5 0 0 0 -1 0 0 -0.5
EMBARGOED
UTILITY POLICIES 2016 STATE SCORECARD © ACEEE
24
DISCUSSION
History of Utility and Public Benefits Programs and Policies
The structure and delivery of customer-funded electric energy efficiency programs have changed dramatically over the past three decades, mostly in conjunction with electric industry restructuring efforts.16 In the 1980s and 1990s, such programs were almost exclusively the domain of utilities, but efforts in the mid-1990s to restructure and deregulate the electric utilities led numerous states to implement public benefits charges as a new source of funding for efficiency. These public benefits approaches established new structures and tasked utilities—or, in some states, separate efficiency utilities or other third parties—with administering and delivering energy efficiency, renewable energy, and low-income programs. 17
Despite such public benefits programs, restructuring still resulted in a precipitous decline in funding for customer-funded electricity energy efficiency programs in the late 1990s, primarily due to regulatory uncertainty and the expected loss of cost-recovery mechanisms for those programs. 18 Generally, utilities did not see customer-funded energy efficiency programs as being compatible with competitive retail markets.
After restructuring efforts slowed in some states, utility commissions placed renewed focus and importance on energy efficiency programs. From its low point in 1998, spending for electricity programs increased more than fourfold by 2010, from approximately $900 million to $3.9 billion. In 2015, total spending for electricity efficiency programs reached roughly $6.3 billion. Adding natural gas program spending of $1.4 billion, we estimate total efficiency program spending of approximately $7.7 billion in 2015 (see figure 2).
16 By customer-funded energy efficiency programs—also known as ratepayer-funded energy efficiency programs—we mean energy efficiency programs funded through charges wrapped into customer rates or appearing as some type of charge on customer utility bills. This includes both utility-administered programs and public benefits programs administered by other entities. We do not include data on separately funded low-income programs, load management programs, or energy efficiency R&D.
17 States that have established nonutility administration of efficiency programs include Delaware, District of Columbia, Hawaii, Maine, New Jersey, New York, Oregon, Vermont, and Wisconsin.
18 Under traditional regulatory structures, utilities do not have an economic incentive to help their customers become more energy efficient because their revenues and profits fall in line with falling energy sales due to energy efficiency programs. To address this disincentive, state regulators allow utilities to recover, at a minimum, the costs of running energy efficiency programs through charges on customer bills. For more on this issue, see York and Kushler (2011).

EMBARGOED
UTILITY POLICIES 2016 STATE SCORECARD © ACEEE
25
Figure 2. Annual electric and natural gas energy efficiency program spending. Natural gas spending is not available for the years
1993–2004. Sources: Nadel, Kubo, and Geller 2000; York and Kushler 2002, 2005; Eldridge et al. 2007, 2008, 2009; CEE 2012,
2013, 2014, 2015; Gilleo et al. 2015.
Given states’ increasing commitments to energy efficiency, growth will likely continue over the next decade, but taper off in the long-term due to several factors. These include an anticipated tightening of federal efficiency standards and the fact that many states lack long-range efficiency targets past 2020. One analysis of customer-funded energy efficiency program budgets estimated that funding for electric and natural gas programs will rise to $15.6 billion by 2025 due to the impact of all-cost-effective efficiency policies in leading states, achievement of EERS targets, and peer learning (Barbose et al. 2013). The authors also suggest a regional expansion of the US energy efficiency market, with a large portion of the projected increases in spending coming from states in the Southeast that historically have had relatively low levels of investment.
Furthermore, we expect many states to use energy efficiency as one way to comply with EPA Clean Power Plan (CPP) rules for carbon emissions in existing power plants (EPA 2014a). Even amid the uncertainty prompted by the Supreme Court’s stay of the CPP in February 2016, many states have continued to plan for the GHG regulations, albeit with a focus on energy efficiency planning while they await oral arguments scheduled for September before the US Court of Appeals for the District of Columbia Circuit.
Regardless of the court’s decision regarding the CPP, energy efficiency will remain a powerful tool to reduce GHG emissions, which the EPA remains required to regulate under the Clean Air Act. ACEEE research finds that energy efficiency policies can yield a 26%
$1.8$1.2 $1.0 $0.9 $1.0 $1.1
$1.4 $1.4 $1.6$2.2
$2.6$3.1
$3.9
$4.7 $4.8 $5.0
$5.9$6.3
$0.3
$0.3
$0.6
$0.8
$0.9
$1.0$1.1
$1.1
$1.4
$1.4
$0.0
$1.0
$2.0
$3.0
$4.0
$5.0
$6.0
$7.0
$8.0
1993 1996 1997 1998 1999 2000 2003 2004 2006 2007 2008 2009 2010 2011 2012 2013 2014 2015
Electricity programs
Natural gas programs
EMBARGOED
UTILITY POLICIES 2016 STATE SCORECARD © ACEEE
26
reduction in GHG emissions overall (Hayes et al. 2014).19 As states plan for carbon emission and other multipollutant reduction requirements over the next several years, it is likely that spending on energy efficiency will continue to rise.
Savings from Electricity and Natural Gas Efficiency Programs
We assess the overall performance of electricity and natural gas energy efficiency programs by the amount of energy saved. Utilities and nonutility program administrators pursue numerous strategies to achieve energy efficiency savings. Program portfolios may initially concentrate on the most cost-effective and easily accessible measure types, such as energy-efficient lighting and appliances. As utilities gain experience, as technologies mature, and as customers become aware of the benefits of energy efficiency, the number of approaches increases. Utilities estimate program energy savings, which are then subject to internal or third-party evaluation, measurement, and verification (EM&V) and are typically reported to the public utility commission on a semiannual or annual basis.
In states ramping up funding in response to aggressive EERS policies, programs typically shift focus from widget-based approaches (e.g., installing new, more efficient water heaters) to more comprehensive deep-savings approaches that seek to generate more energy efficiency savings per program participant by conducting whole-building or system retrofits. Some deep-savings approaches also draw on complementary efficiency efforts, such as utility support for full implementation of building energy codes.20 Deep-savings approaches may also add to the emphasis on whole-building retrofits and comprehensive changes in systems and operations by including behavioral elements that empower customers.
SCORES FOR INCREMENTAL SAVINGS IN 2015 FROM ELECTRIC EFFICIENCY PROGRAMS
We report 2015 statewide net energy efficiency savings as a percentage of 2015 retail electricity sales and scored the states on a scale of 0 to 7. We awarded up to 6 points last year. Our intention in boosting the number of points for energy savings is to increase our emphasis on actual performance. We relied primarily on states to provide these data. Forty-four states and the District of Columbia completed some or all of our data request form. Where no data for 2015 were available, we used the most recent savings data available, whether from state-reported 2014 savings from the 2015 State Scorecard or from EIA (2016a, 2016b).
As in 2015, states that achieved savings of at least 2% of electricity sales earned full points. We continue to see examples of states raising the bar beyond 2% electricity savings. In the future, we will consider awarding maximum points only for higher levels of savings (i.e., 2.5%). This year, states that achieved electricity savings of 2% or more in 2015 earned 7 points, with scores decreasing by 0.5 points for every 0.14% decrease in savings.
Table 8 lists the scoring bins for each level of savings.
19 This analysis is based on the targets proposed in the draft version of the EPA rule. ACEEE had not yet analyzed final targets during the writing of this report.
20 See Nowak et al. (2011) for a full discussion of this topic.

EMBARGOED
UTILITY POLICIES 2016 STATE SCORECARD © ACEEE
27
Table 8. Scoring of utility and public benefits
electricity savings
2015 savings as
% of sales Score
2% or greater 7
1.86–1.99% 6.5
1.72–1.85% 6
1.58–1.71% 5.5
1.44–1.57% 5
1.30–1.43% 4.5
1.16–1.29% 4
1.02–1.15% 3.5
0.88–1.01% 3
0.74–0.87% 2.5
0.60–0.73% 2
0.46–0.59% 1.5
0.32–0.45% 1
0.18–0.31% 0.5
Less than 0.18% 0
Table 9 shows state results and scores. Nationwide reported savings from utility and public benefits electricity programs in 2015 totaled 26.5 million MWh, equivalent to 0.7% of sales.21 This figure is nearly identical to the savings levels reported last year in this category.
21 As noted above, 2015 savings were not available in some states at the time of publication. In these cases, we substituted 2014 electricity savings. We have noted these instances in table 9.
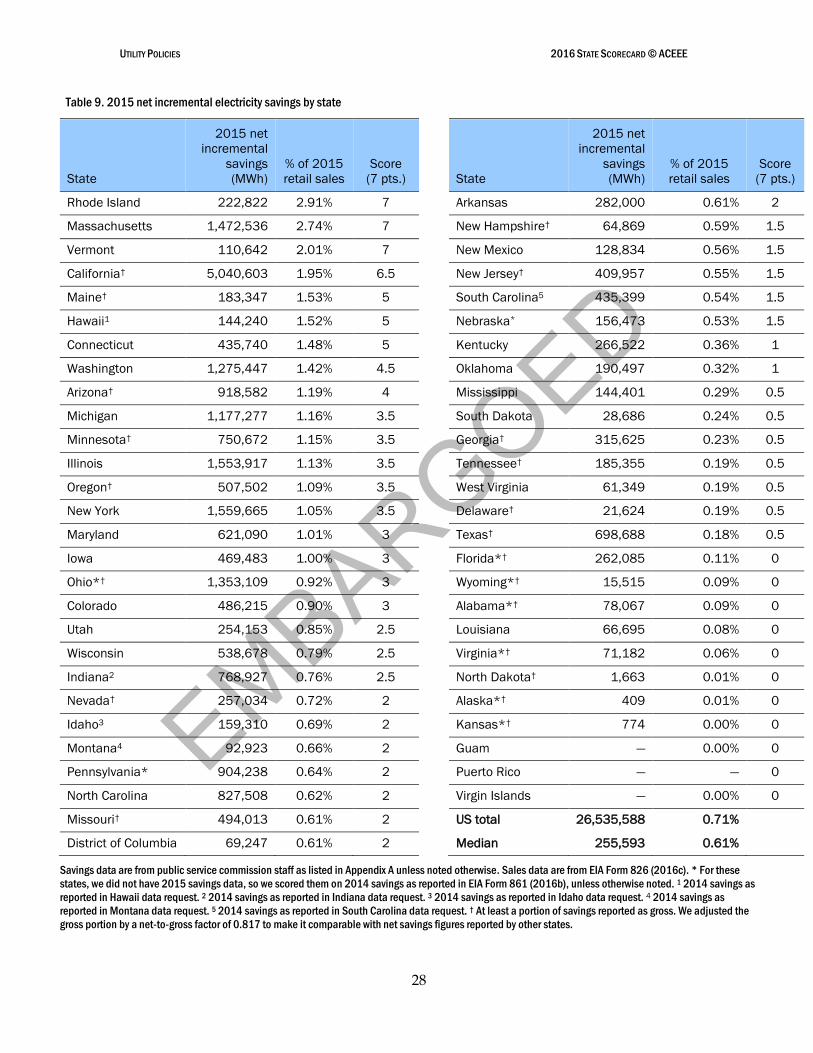
EMBARGOED
UTILITY POLICIES 2016 STATE SCORECARD © ACEEE
28
Table 9. 2015 net incremental electricity savings by state
State
2015 net
incremental
savings
(MWh)
% of 2015
retail sales
Score
(7 pts.)
State
2015 net
incremental
savings
(MWh)
% of 2015
retail sales
Score
(7 pts.)
Rhode Island 222,822 2.91% 7 Arkansas 282,000 0.61% 2
Massachusetts 1,472,536 2.74% 7 New Hampshire† 64,869 0.59% 1.5
Vermont 110,642 2.01% 7 New Mexico 128,834 0.56% 1.5
California† 5,040,603 1.95% 6.5 New Jersey† 409,957 0.55% 1.5
Maine† 183,347 1.53% 5 South Carolina5 435,399 0.54% 1.5
Hawaii1 144,240 1.52% 5 Nebraska* 156,473 0.53% 1.5
Connecticut 435,740 1.48% 5 Kentucky 266,522 0.36% 1
Washington 1,275,447 1.42% 4.5 Oklahoma 190,497 0.32% 1
Arizona† 918,582 1.19% 4 Mississippi 144,401 0.29% 0.5
Michigan 1,177,277 1.16% 3.5 South Dakota 28,686 0.24% 0.5
Minnesota† 750,672 1.15% 3.5 Georgia† 315,625 0.23% 0.5
Illinois 1,553,917 1.13% 3.5 Tennessee† 185,355 0.19% 0.5
Oregon† 507,502 1.09% 3.5 West Virginia 61,349 0.19% 0.5
New York 1,559,665 1.05% 3.5 Delaware† 21,624 0.19% 0.5
Maryland 621,090 1.01% 3 Texas† 698,688 0.18% 0.5
Iowa 469,483 1.00% 3 Florida*† 262,085 0.11% 0
Ohio*† 1,353,109 0.92% 3 Wyoming*† 15,515 0.09% 0
Colorado 486,215 0.90% 3 Alabama*† 78,067 0.09% 0
Utah 254,153 0.85% 2.5 Louisiana 66,695 0.08% 0
Wisconsin 538,678 0.79% 2.5 Virginia*† 71,182 0.06% 0
Indiana2 768,927 0.76% 2.5 North Dakota† 1,663 0.01% 0
Nevada† 257,034 0.72% 2 Alaska*† 409 0.01% 0
Idaho3 159,310 0.69% 2 Kansas*† 774 0.00% 0
Montana4 92,923 0.66% 2 Guam — 0.00% 0
Pennsylvania* 904,238 0.64% 2 Puerto Rico — — 0
North Carolina 827,508 0.62% 2 Virgin Islands — 0.00% 0
Missouri† 494,013 0.61% 2 US total 26,535,588 0.71%
District of Columbia 69,247 0.61% 2 Median 255,593 0.61%
Savings data are from public service commission staff as listed in Appendix A unless noted otherwise. Sales data are from EIA Form 826 (2016c). * For these
states, we did not have 2015 savings data, so we scored them on 2014 savings as reported in EIA Form 861 (2016b), unless otherwise noted. 1 2014 savings as
reported in Hawaii data request. 2 2014 savings as reported in Indiana data request. 3 2014 savings as reported in Idaho data request. 4 2014 savings as
reported in Montana data request. 5 2014 savings as reported in South Carolina data request. † At least a portion of savings reported as gross. We adjusted the
gross portion by a net-to-gross factor of 0.817 to make it comparable with net savings figures reported by other states.
EMBARGOED
UTILITY POLICIES 2016 STATE SCORECARD © ACEEE
29
We scored states on net incremental electricity savings that resulted from energy efficiency programs offered in 2015.22 We normalized these data by dividing by total electricity sales. Data for electricity sales were based on EIA’s Monthly Electric Utility Sales and Revenue Report with State Distributions (2016b) and Annual Electric Power Industry Report (2016a). Energy savings were based on survey responses from state utility commissions and statewide utility program administrators.
States use different methodologies for estimating energy savings, which can produce inequities when making comparisons.23 A state’s EM&V process plays a key role in determining how savings are quantified. This is particularly true of a state’s treatment of free riders (savings attributed to a program that would have occurred anyway in the absence of the program) and spillover (savings not attributed to a program that would not have occurred without it). States report energy savings as either net or gross, with net savings accounting for free riders and free drivers, and gross savings not accounting for these.24 The State Scorecard specifically focuses on net savings.
In a national survey of evaluation practices, ACEEE researchers found that, of the 45 jurisdictions at the time with formally approved customer-funded energy efficiency programs, 21 jurisdictions reported net savings, 12 reported gross savings, and 9 reported both (Kushler, Nowak, and Witte 2012).25 These findings point to several important caveats to the electric program savings data. First, a number of states do not estimate or report net savings. In these cases, we have applied a standard factor of approximately 0.817 to convert gross savings to net savings (a net-to-gross ratio). 26 Doing so allows a more straightforward comparison with other states that report net electricity savings. Savings (or some portion of savings) reported as gross are marked by a dagger (†) in table 9.27 Although Arizona, Minnesota, New Hampshire, and Iowa report gross savings as net to state regulators, we applied the conversion factor to these states because the studies they reference in setting net savings equal to gross savings were outdated or unavailable.
22 Incremental electricity savings are new savings achieved from measures implemented in the reporting year. We substituted 2014 data for states that could not report 2015 savings data. Readers should also note that programs that have been running for several years at a high level of funding are achieving the highest levels of cumulative electricity savings (total energy savings achieved to date from efficiency measures). Incremental savings data, which measure new savings achieved in the current program year, are the best way to directly compare state efforts due to the difficulty in tracking the duration of programs and their savings.
23 See Sciortino et al. (2011).
24 Free drivers are utility customers who install energy efficiency measures as a result of a program but are not themselves participants in the energy efficiency program.
25 This includes 44 states and the District of Columbia. Three states did not respond to this question.
26 We based the 0.817 net-to-gross factor used this year on the median net-to-gross ratio calculated from those
states that reported figures for both net and gross savings in this year’s data request. These included California, Connecticut, Maryland, New Mexico, New York, North Carolina, Oklahoma, Oregon, Rhode Island, Utah, West Virginia, and Wisconsin. We applied this conversion factor to all states reporting only gross savings and those whose net-to-gross ratios were outliers, falling more than 20% above or below the median. California was the only state that reported a net-to-gross ratio more than 20% below the median.
27 Savings were determined to be gross based on Kushler, Nowak, and Witte (2012) and on responses to our survey of public utility commissions.
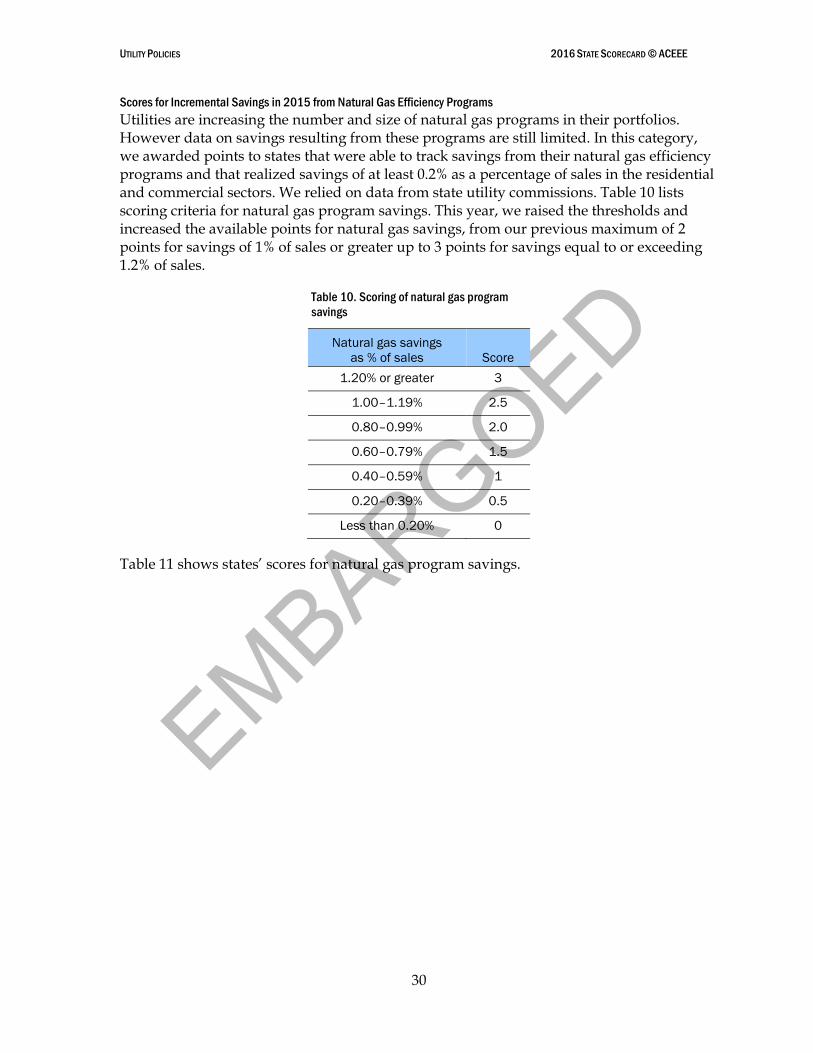
EMBARGOED
UTILITY POLICIES 2016 STATE SCORECARD © ACEEE
30
Scores for Incremental Savings in 2015 from Natural Gas Efficiency Programs
Utilities are increasing the number and size of natural gas programs in their portfolios. However data on savings resulting from these programs are still limited. In this category, we awarded points to states that were able to track savings from their natural gas efficiency programs and that realized savings of at least 0.2% as a percentage of sales in the residential and commercial sectors. We relied on data from state utility commissions. Table 10 lists scoring criteria for natural gas program savings. This year, we raised the thresholds and increased the available points for natural gas savings, from our previous maximum of 2 points for savings of 1% of sales or greater up to 3 points for savings equal to or exceeding 1.2% of sales.
Table 10. Scoring of natural gas program
savings
Natural gas savings
as % of sales Score
1.20% or greater 3
1.00–1.19% 2.5
0.80–0.99% 2.0
0.60–0.79% 1.5
0.40–0.59% 1
0.20–0.39% 0.5
Less than 0.20% 0
Table 11 shows states’ scores for natural gas program savings.
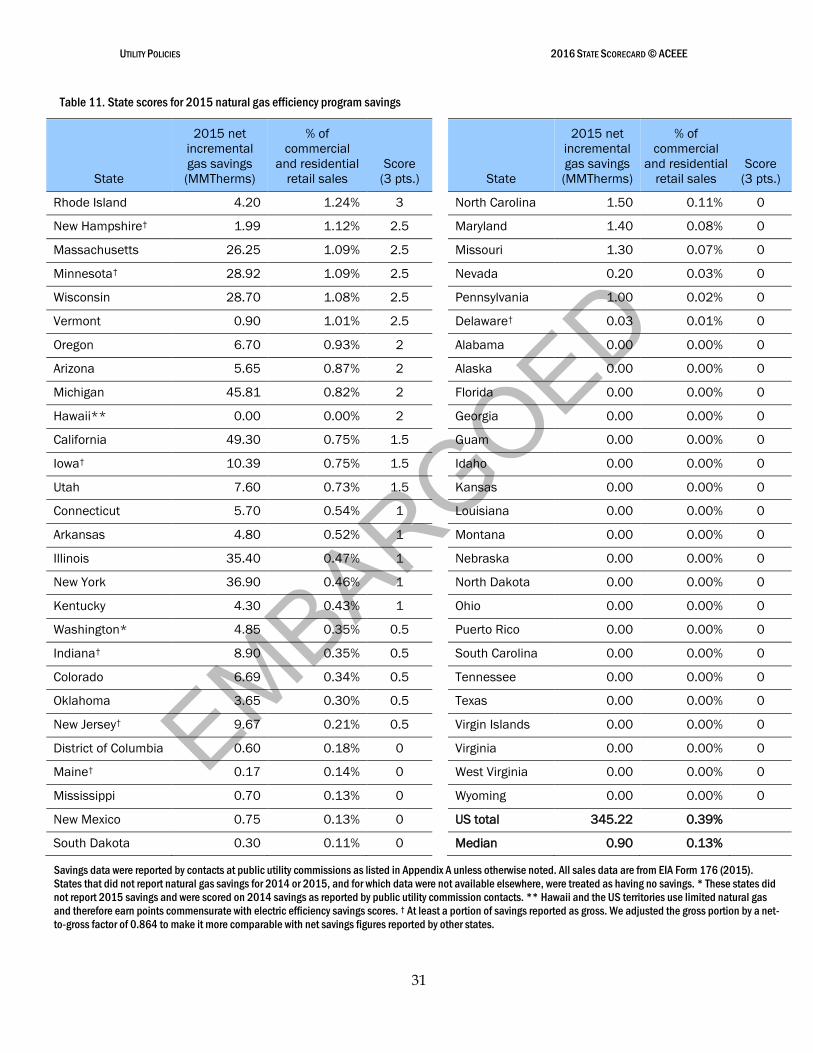
EMBARGOED
UTILITY POLICIES 2016 STATE SCORECARD © ACEEE
31
Table 11. State scores for 2015 natural gas efficiency program savings
State
2015 net
incremental
gas savings
(MMTherms)
% of
commercial
and residential
retail sales
Score
(3 pts.) State
2015 net
incremental
gas savings
(MMTherms)
% of
commercial
and residential
retail sales
Score
(3 pts.)
Rhode Island 4.20 1.24% 3 North Carolina 1.50 0.11% 0
New Hampshire† 1.99 1.12% 2.5 Maryland 1.40 0.08% 0
Massachusetts 26.25 1.09% 2.5 Missouri 1.30 0.07% 0
Minnesota† 28.92 1.09% 2.5 Nevada 0.20 0.03% 0
Wisconsin 28.70 1.08% 2.5 Pennsylvania 1.00 0.02% 0
Vermont 0.90 1.01% 2.5 Delaware† 0.03 0.01% 0
Oregon 6.70 0.93% 2 Alabama 0.00 0.00% 0
Arizona 5.65 0.87% 2 Alaska 0.00 0.00% 0
Michigan 45.81 0.82% 2 Florida 0.00 0.00% 0
Hawaii** 0.00 0.00% 2 Georgia 0.00 0.00% 0
California 49.30 0.75% 1.5 Guam 0.00 0.00% 0
Iowa† 10.39 0.75% 1.5 Idaho 0.00 0.00% 0
Utah 7.60 0.73% 1.5 Kansas 0.00 0.00% 0
Connecticut 5.70 0.54% 1 Louisiana 0.00 0.00% 0
Arkansas 4.80 0.52% 1 Montana 0.00 0.00% 0
Illinois 35.40 0.47% 1 Nebraska 0.00 0.00% 0
New York 36.90 0.46% 1 North Dakota 0.00 0.00% 0
Kentucky 4.30 0.43% 1 Ohio 0.00 0.00% 0
Washington* 4.85 0.35% 0.5 Puerto Rico 0.00 0.00% 0
Indiana† 8.90 0.35% 0.5 South Carolina 0.00 0.00% 0
Colorado 6.69 0.34% 0.5 Tennessee 0.00 0.00% 0
Oklahoma 3.65 0.30% 0.5 Texas 0.00 0.00% 0
New Jersey† 9.67 0.21% 0.5 Virgin Islands 0.00 0.00% 0
District of Columbia 0.60 0.18% 0 Virginia 0.00 0.00% 0
Maine† 0.17 0.14% 0 West Virginia 0.00 0.00% 0
Mississippi 0.70 0.13% 0 Wyoming 0.00 0.00% 0
New Mexico 0.75 0.13% 0 US total 345.22 0.39%
South Dakota 0.30 0.11% 0 Median 0.90 0.13%
Savings data were reported by contacts at public utility commissions as listed in Appendix A unless otherwise noted. All sales data are from EIA Form 176 (2015).
States that did not report natural gas savings for 2014 or 2015, and for which data were not available elsewhere, were treated as having no savings. * These states did
not report 2015 savings and were scored on 2014 savings as reported by public utility commission contacts. ** Hawaii and the US territories use limited natural gas
and therefore earn points commensurate with electric efficiency savings scores. † At least a portion of savings reported as gross. We adjusted the gross portion by a net-
to-gross factor of 0.864 to make it more comparable with net savings figures reported by other states.
EMBARGOED
UTILITY POLICIES 2016 STATE SCORECARD © ACEEE
32
Electricity and Natural Gas Efficiency Program Funding
In this category, we scored states on 2015 electricity efficiency program spending for customer-funded energy efficiency programs. These programs are funded through charges included in utility customers’ bills. Our data include spending by investor-owned, municipal, and cooperative utilities, public power companies or authorities, and public benefits program administrators. We did not collect data on the federal Weatherization Assistance Program, which gives money to states on a formula basis. We did include revenues from the Regional Greenhouse Gas Initiative (RGGI), which contribute to customer-funded energy efficiency program portfolios of member states and to energy efficiency programs funded through AB32 and Proposition 39 in California.28 Where RGGI funds were channeled to energy efficiency initiatives implemented by state governments, we included them in Chapter 6, “State Government–Led Initiatives.”
This year, we continue to report energy efficiency spending data rather than energy efficiency budgets—an important change we made in 2015 to more accurately capture state energy efficiency funding.29 For the nine states that did not provide data for 2015 spending on energy efficiency programs for electric or natural gas utilities, we used 2014 spending data from CEE (2016) or data supplied by our state contacts in their 2015 utility data request responses.
Please note that spending data are subject to variation across states, which poses an ongoing challenge to equitably score states based on a common and reliable metric. Several states report performance incentives paid to utilities or other program administrators as part of utility efficiency program spending, resulting in higher spending numbers. While most performance incentives are based on shared net benefits—viewed as an expense—the relative amounts of the incentives are in the range of 5–15% of program spending (Nowak et al. 2015). For this reason, this year we asked states to disaggregate program spending from these incentives. We did not credit this spending in our scoring this year in an effort to more accurately reflect funds directly dedicated to energy efficiency measures. As in past years, we sent spending data gathered from the above sources to state utility commissions for review. Tables 13 and 15 below report electricity and natural gas efficiency program spending, respectively.
SCORES FOR ELECTRIC PROGRAM SPENDING
States could receive up to 3 points based on energy efficiency spending as a percentage of 2015 electric utility revenues.30 Spending representing at least 4.0% of revenues earned the maximum of 3 points, while spending between 3.0% and 4.0% qualified for 2.5 points. For
28 AB32 is California’s GHG reduction bill that resulted in a cap-and-trade program. Proposition 39 grants significant funding to energy efficiency programs targeting schools. Both programs are subject to evaluation, measurement, and verification at least as stringent as utility programs.
29 Prior to 2010, we depended on EIA for actual spending data, which entailed a two-year time lag.
30 Statewide revenues are from EIA Form 826 (EIA 2016c). We measure spending as a percentage of revenues to normalize the level of energy efficiency spending. Blending utility revenues from all customer classes gives a more accurate measure of utilities’ overall spending on energy efficiency than does expressing budgets per capita, which might skew the data for utilities that have a few very large customers. An alternative metric, statewide electric energy efficiency spending per capita is presented in Appendix B.
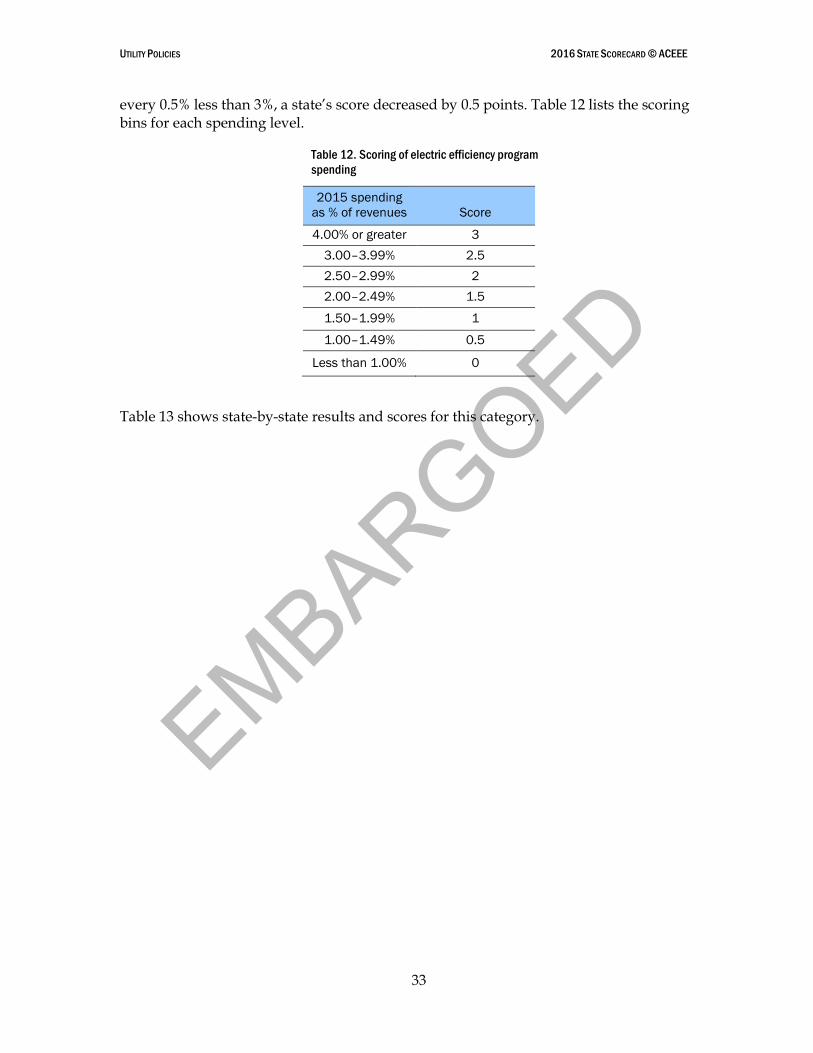
EMBARGOED
UTILITY POLICIES 2016 STATE SCORECARD © ACEEE
33
every 0.5% less than 3%, a state’s score decreased by 0.5 points. Table 12 lists the scoring bins for each spending level.
Table 12. Scoring of electric efficiency program
spending
2015 spending
as % of revenues Score
4.00% or greater 3
3.00–3.99% 2.5
2.50–2.99% 2
2.00–2.49% 1.5
1.50–1.99% 1
1.00–1.49% 0.5
Less than 1.00% 0
Table 13 shows state-by-state results and scores for this category.
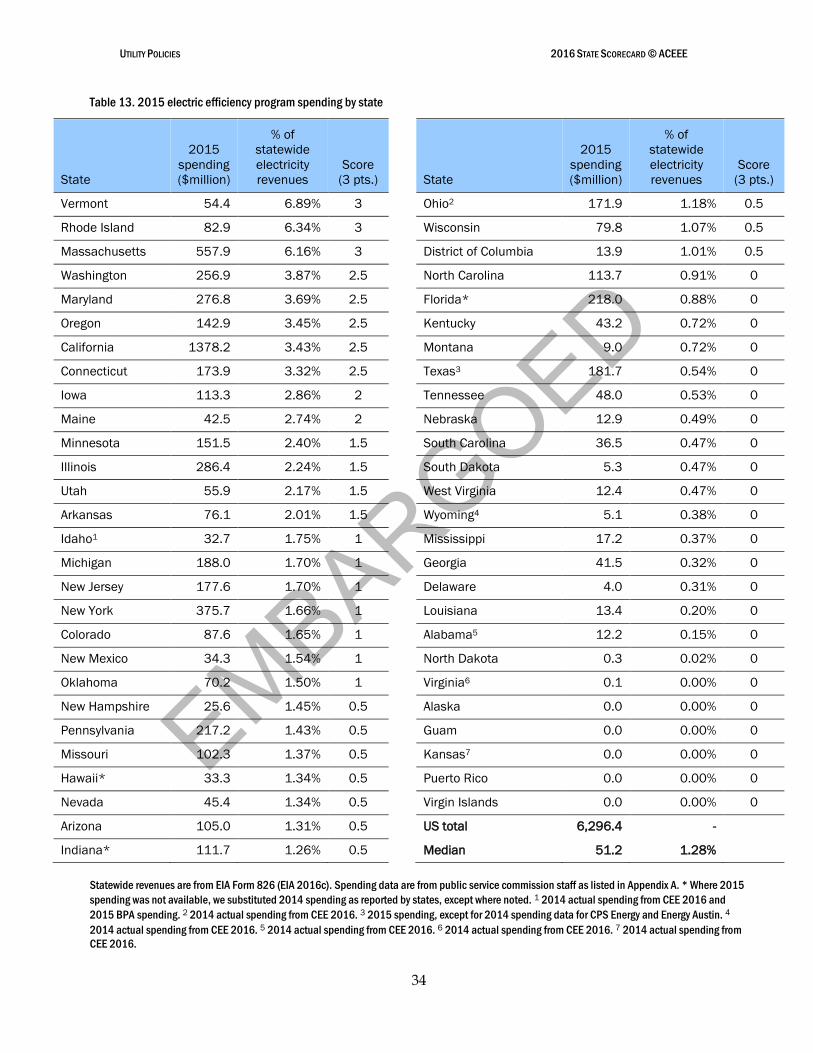
EMBARGOED
UTILITY POLICIES 2016 STATE SCORECARD © ACEEE
34
Table 13. 2015 electric efficiency program spending by state
State
2015
spending
($million)
% of
statewide
electricity
revenues
Score
(3 pts.) State
2015
spending
($million)
% of
statewide
electricity
revenues
Score
(3 pts.)
Vermont 54.4 6.89% 3 Ohio2 171.9 1.18% 0.5
Rhode Island 82.9 6.34% 3 Wisconsin 79.8 1.07% 0.5
Massachusetts 557.9 6.16% 3 District of Columbia 13.9 1.01% 0.5
Washington 256.9 3.87% 2.5 North Carolina 113.7 0.91% 0
Maryland 276.8 3.69% 2.5 Florida* 218.0 0.88% 0
Oregon 142.9 3.45% 2.5 Kentucky 43.2 0.72% 0
California 1378.2 3.43% 2.5 Montana 9.0 0.72% 0
Connecticut 173.9 3.32% 2.5 Texas3 181.7 0.54% 0
Iowa 113.3 2.86% 2 Tennessee 48.0 0.53% 0
Maine 42.5 2.74% 2 Nebraska 12.9 0.49% 0
Minnesota 151.5 2.40% 1.5 South Carolina 36.5 0.47% 0
Illinois 286.4 2.24% 1.5 South Dakota 5.3 0.47% 0
Utah 55.9 2.17% 1.5 West Virginia 12.4 0.47% 0
Arkansas 76.1 2.01% 1.5 Wyoming4 5.1 0.38% 0
Idaho1 32.7 1.75% 1 Mississippi 17.2 0.37% 0
Michigan 188.0 1.70% 1 Georgia 41.5 0.32% 0
New Jersey 177.6 1.70% 1 Delaware 4.0 0.31% 0
New York 375.7 1.66% 1 Louisiana 13.4 0.20% 0
Colorado 87.6 1.65% 1 Alabama5 12.2 0.15% 0
New Mexico 34.3 1.54% 1 North Dakota 0.3 0.02% 0
Oklahoma 70.2 1.50% 1 Virginia6 0.1 0.00% 0
New Hampshire 25.6 1.45% 0.5 Alaska 0.0 0.00% 0
Pennsylvania 217.2 1.43% 0.5 Guam 0.0 0.00% 0
Missouri 102.3 1.37% 0.5 Kansas7 0.0 0.00% 0
Hawaii* 33.3 1.34% 0.5 Puerto Rico 0.0 0.00% 0
Nevada 45.4 1.34% 0.5 Virgin Islands 0.0 0.00% 0
Arizona 105.0 1.31% 0.5 US total 6,296.4 -
Indiana* 111.7 1.26% 0.5 Median 51.2 1.28%
Statewide revenues are from EIA Form 826 (EIA 2016c). Spending data are from public service commission staff as listed in Appendix A. * Where 2015
spending was not available, we substituted 2014 spending as reported by states, except where noted. 1 2014 actual spending from CEE 2016 and
2015 BPA spending. 2 2014 actual spending from CEE 2016. 3 2015 spending, except for 2014 spending data for CPS Energy and Energy Austin. 4
2014 actual spending from CEE 2016. 5 2014 actual spending from CEE 2016. 6 2014 actual spending from CEE 2016. 7 2014 actual spending from
CEE 2016.
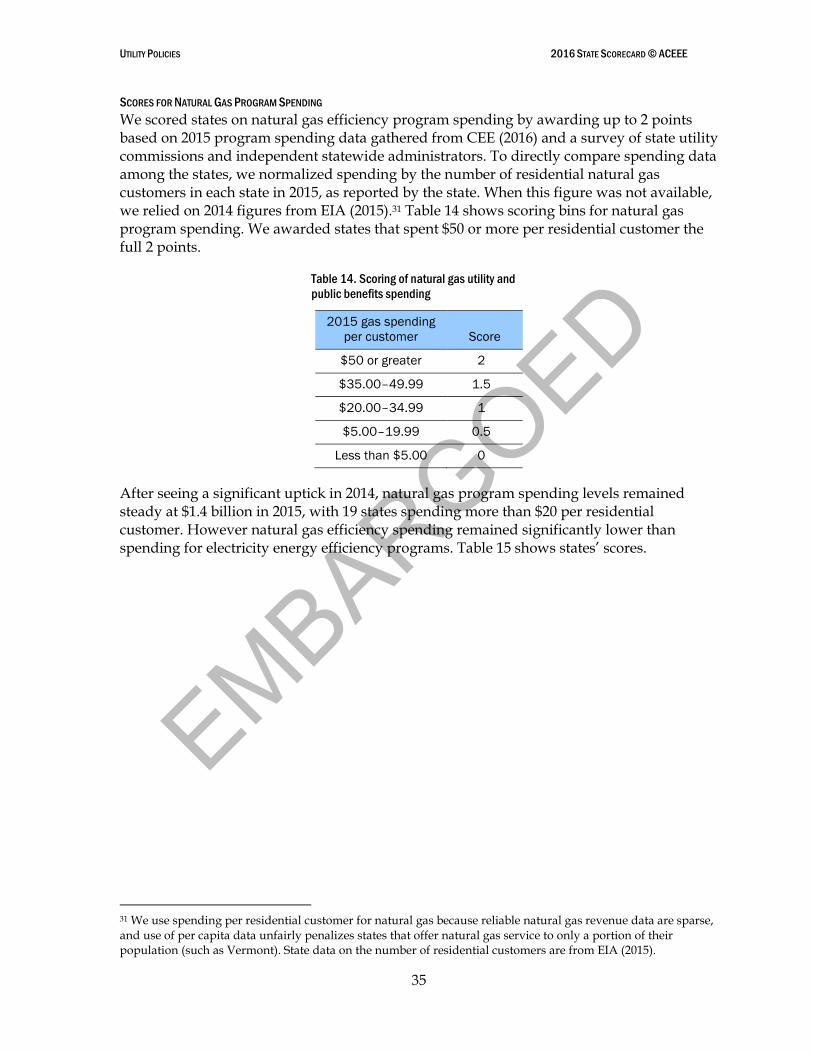
EMBARGOED
UTILITY POLICIES 2016 STATE SCORECARD © ACEEE
35
SCORES FOR NATURAL GAS PROGRAM SPENDING
We scored states on natural gas efficiency program spending by awarding up to 2 points based on 2015 program spending data gathered from CEE (2016) and a survey of state utility commissions and independent statewide administrators. To directly compare spending data among the states, we normalized spending by the number of residential natural gas customers in each state in 2015, as reported by the state. When this figure was not available, we relied on 2014 figures from EIA (2015).31 Table 14 shows scoring bins for natural gas program spending. We awarded states that spent $50 or more per residential customer the full 2 points.
Table 14. Scoring of natural gas utility and
public benefits spending
2015 gas spending
per customer Score
$50 or greater 2
$35.00–49.99 1.5
$20.00–34.99 1
$5.00–19.99 0.5
Less than $5.00 0
After seeing a significant uptick in 2014, natural gas program spending levels remained steady at $1.4 billion in 2015, with 19 states spending more than $20 per residential customer. However natural gas efficiency spending remained significantly lower than spending for electricity energy efficiency programs. Table 15 shows states’ scores.
31 We use spending per residential customer for natural gas because reliable natural gas revenue data are sparse, and use of per capita data unfairly penalizes states that offer natural gas service to only a portion of their population (such as Vermont). State data on the number of residential customers are from EIA (2015).
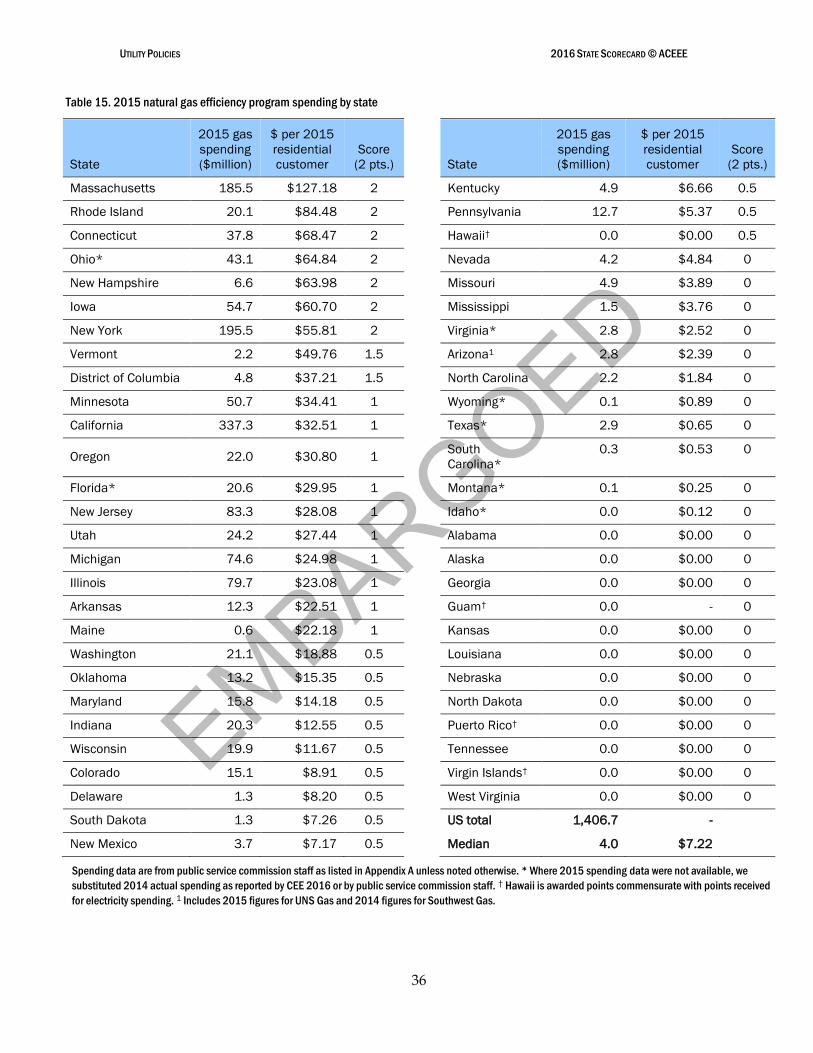
EMBARGOED
UTILITY POLICIES 2016 STATE SCORECARD © ACEEE
36
Table 15. 2015 natural gas efficiency program spending by state
State
2015 gas
spending
($million)
$ per 2015
residential
customer
Score
(2 pts.) State
2015 gas
spending
($million)
$ per 2015
residential
customer
Score
(2 pts.)
Massachusetts 185.5 $127.18 2 Kentucky 4.9 $6.66 0.5
Rhode Island 20.1 $84.48 2 Pennsylvania 12.7 $5.37 0.5
Connecticut 37.8 $68.47 2 Hawaii† 0.0 $0.00 0.5
Ohio* 43.1 $64.84 2 Nevada 4.2 $4.84 0
New Hampshire 6.6 $63.98 2 Missouri 4.9 $3.89 0
Iowa 54.7 $60.70 2 Mississippi 1.5 $3.76 0
New York 195.5 $55.81 2 Virginia* 2.8 $2.52 0
Vermont 2.2 $49.76 1.5 Arizona1 2.8 $2.39 0
District of Columbia 4.8 $37.21 1.5 North Carolina 2.2 $1.84 0
Minnesota 50.7 $34.41 1 Wyoming* 0.1 $0.89 0
California 337.3 $32.51 1 Texas* 2.9 $0.65 0
Oregon 22.0 $30.80 1
South
Carolina*
0.3 $0.53 0
Florida* 20.6 $29.95 1 Montana* 0.1 $0.25 0
New Jersey 83.3 $28.08 1 Idaho* 0.0 $0.12 0
Utah 24.2 $27.44 1 Alabama 0.0 $0.00 0
Michigan 74.6 $24.98 1 Alaska 0.0 $0.00 0
Illinois 79.7 $23.08 1 Georgia 0.0 $0.00 0
Arkansas 12.3 $22.51 1 Guam† 0.0 - 0
Maine 0.6 $22.18 1 Kansas 0.0 $0.00 0
Washington 21.1 $18.88 0.5 Louisiana 0.0 $0.00 0
Oklahoma 13.2 $15.35 0.5 Nebraska 0.0 $0.00 0
Maryland 15.8 $14.18 0.5 North Dakota 0.0 $0.00 0
Indiana 20.3 $12.55 0.5 Puerto Rico† 0.0 $0.00 0
Wisconsin 19.9 $11.67 0.5 Tennessee 0.0 $0.00 0
Colorado 15.1 $8.91 0.5 Virgin Islands† 0.0 $0.00 0
Delaware 1.3 $8.20 0.5 West Virginia 0.0 $0.00 0
South Dakota 1.3 $7.26 0.5 US total 1,406.7 -
New Mexico 3.7 $7.17 0.5 Median 4.0 $7.22
Spending data are from public service commission staff as listed in Appendix A unless noted otherwise. * Where 2015 spending data were not available, we
substituted 2014 actual spending as reported by CEE 2016 or by public service commission staff. † Hawaii is awarded points commensurate with points received
for electricity spending. 1 Includes 2015 figures for UNS Gas and 2014 figures for Southwest Gas.
EMBARGOED
UTILITY POLICIES 2016 STATE SCORECARD © ACEEE
37
Opt-Out Provisions for Large Customers
For the third year running, we assessed opt-out and self-direct provisions for large customers in the State Scorecard. Increasingly, large customers are seeking to opt out of utility energy efficiency programs, asserting that they have already done all the energy efficiency that is cost effective. However this is seldom the case (Chittum 2011).
Opt-out policies have several negative consequences. Failure to include large customer programs in an energy efficiency portfolio increases the cost of energy savings for all customers and reduces the benefits. In effect, allowing the large customers to opt out forces other consumers to subsidize them. It also prevents utilities from capturing all highly cost-effective energy savings; this can contribute to higher overall system costs through the use of more expensive supply resources. While the ideal solution is for utilities to offer programs that respond to the needs of these large consumers, ACEEE’s research suggests that this does not always happen (Chittum 2011). When it does not, we suggest giving these customers the option of self-directing their energy efficiency program dollars.32 This option provides a path for including large customer energy efficiency in the state’s portfolio of savings, while encouraging utilities to improve program offerings to better respond to all customers’ needs. We provide examples of self-direct programs in Appendix C.
SCORES FOR LARGE CUSTOMER OPT-OUT PROVISIONS
This year, we again included opt-out as a category in which states may lose rather than gain points. We subtracted 1 point for states that allow electric or natural gas customers, or both, to opt out of energy efficiency programs.33
We did not subtract points for self-direct programs. When implemented properly, these programs can effectively meet the needs of large customers. Self-direct programs vary from state to state, with some requiring more stringent measurement and verification of energy savings than others (Chittum 2011). In the future, we may examine these programs with a more critical eye and subtract points from states that lack strong evaluation and measurement. Table 16 shows states with opt-out programs.
32 Self-direct programs allow some customers, usually large industrial or commercial ones, to self-direct energy efficiency fees usually paid on utility bills directly into energy efficiency investments in their own facilities instead of into a broader, aggregated pool of funds. These programs should be designed to include comparable methods to verify and measure investments and energy savings.
33 By default, most large gas customers already are opted out because they take wholesale delivery (frequently directly from transmission) and are thus outside the purview of state government. We did not subtract points in these cases.
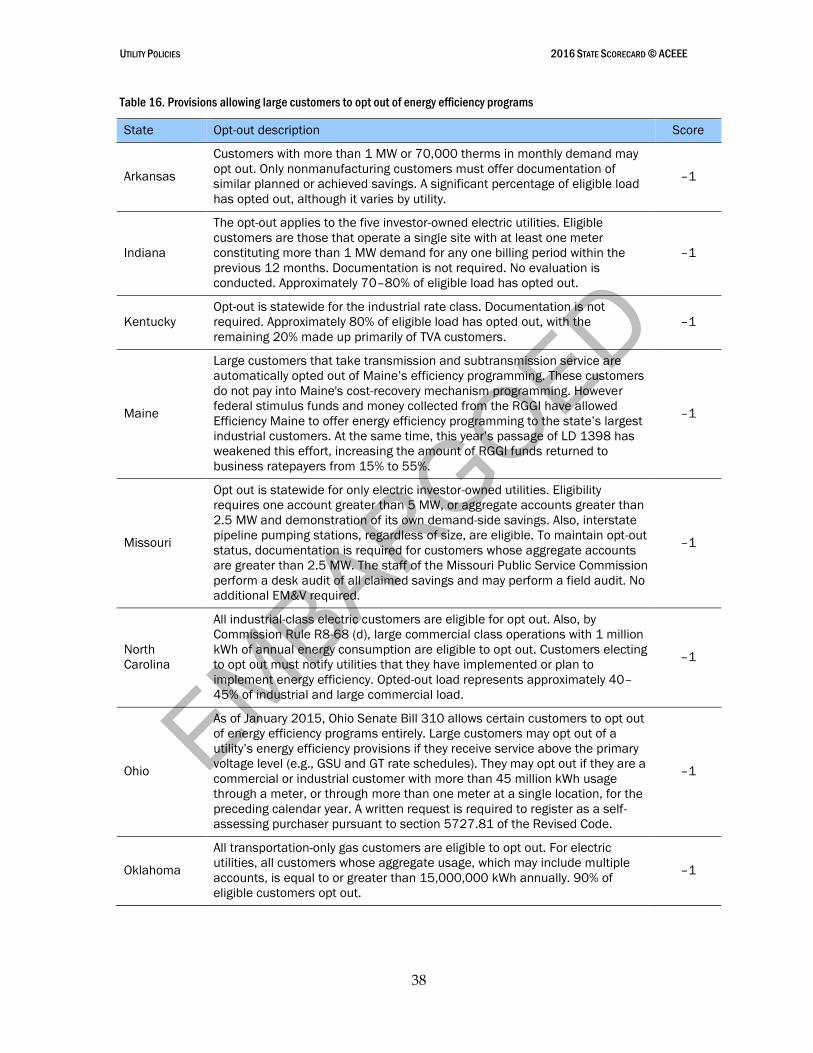
EMBARGOED
UTILITY POLICIES 2016 STATE SCORECARD © ACEEE
38
Table 16. Provisions allowing large customers to opt out of energy efficiency programs
State Opt-out description Score
Arkansas
Customers with more than 1 MW or 70,000 therms in monthly demand may
opt out. Only nonmanufacturing customers must offer documentation of
similar planned or achieved savings. A significant percentage of eligible load
has opted out, although it varies by utility.
–1
Indiana
The opt-out applies to the five investor-owned electric utilities. Eligible
customers are those that operate a single site with at least one meter
constituting more than 1 MW demand for any one billing period within the
previous 12 months. Documentation is not required. No evaluation is
conducted. Approximately 70–80% of eligible load has opted out.
–1
Kentucky
Opt-out is statewide for the industrial rate class. Documentation is not
required. Approximately 80% of eligible load has opted out, with the
remaining 20% made up primarily of TVA customers.
–1
Maine
Large customers that take transmission and subtransmission service are
automatically opted out of Maine’s efficiency programming. These customers
do not pay into Maine's cost-recovery mechanism programming. However
federal stimulus funds and money collected from the RGGI have allowed
Efficiency Maine to offer energy efficiency programming to the state’s largest
industrial customers. At the same time, this year’s passage of LD 1398 has
weakened this effort, increasing the amount of RGGI funds returned to
business ratepayers from 15% to 55%.
–1
Missouri
Opt out is statewide for only electric investor-owned utilities. Eligibility
requires one account greater than 5 MW, or aggregate accounts greater than
2.5 MW and demonstration of its own demand-side savings. Also, interstate
pipeline pumping stations, regardless of size, are eligible. To maintain opt-out
status, documentation is required for customers whose aggregate accounts
are greater than 2.5 MW. The staff of the Missouri Public Service Commission
perform a desk audit of all claimed savings and may perform a field audit. No
additional EM&V required.
–1
North
Carolina
All industrial-class electric customers are eligible for opt out. Also, by
Commission Rule R8-68 (d), large commercial class operations with 1 million
kWh of annual energy consumption are eligible to opt out. Customers electing
to opt out must notify utilities that they have implemented or plan to
implement energy efficiency. Opted-out load represents approximately 40–
45% of industrial and large commercial load.
–1
Ohio
As of January 2015, Ohio Senate Bill 310 allows certain customers to opt out
of energy efficiency programs entirely. Large customers may opt out of a
utility’s energy efficiency provisions if they receive service above the primary
voltage level (e.g., GSU and GT rate schedules). They may opt out if they are a
commercial or industrial customer with more than 45 million kWh usage
through a meter, or through more than one meter at a single location, for the
preceding calendar year. A written request is required to register as a self-
assessing purchaser pursuant to section 5727.81 of the Revised Code.
–1
Oklahoma
All transportation-only gas customers are eligible to opt out. For electric
utilities, all customers whose aggregate usage, which may include multiple
accounts, is equal to or greater than 15,000,000 kWh annually. 90% of
eligible customers opt out.
–1
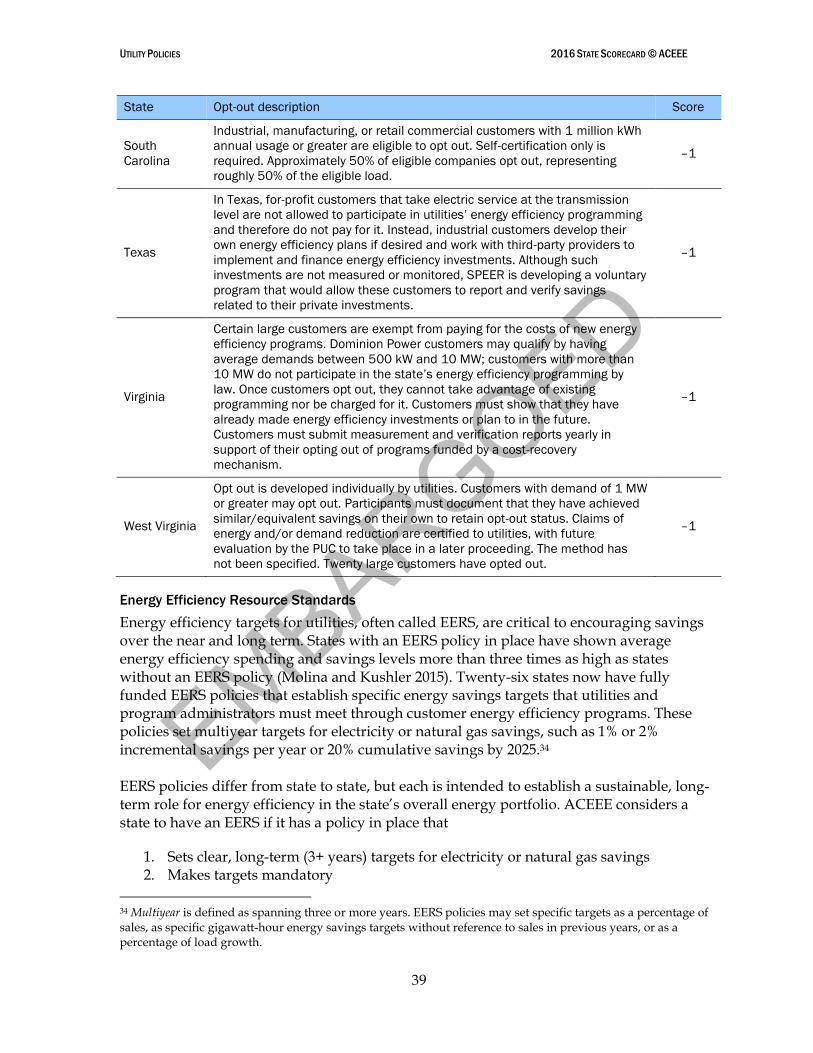
EMBARGOED
UTILITY POLICIES 2016 STATE SCORECARD © ACEEE
39
State Opt-out description Score
South
Carolina
Industrial, manufacturing, or retail commercial customers with 1 million kWh
annual usage or greater are eligible to opt out. Self-certification only is
required. Approximately 50% of eligible companies opt out, representing
roughly 50% of the eligible load.
–1
Texas
In Texas, for-profit customers that take electric service at the transmission
level are not allowed to participate in utilities’ energy efficiency programming
and therefore do not pay for it. Instead, industrial customers develop their
own energy efficiency plans if desired and work with third-party providers to
implement and finance energy efficiency investments. Although such
investments are not measured or monitored, SPEER is developing a voluntary
program that would allow these customers to report and verify savings
related to their private investments.
–1
Virginia
Certain large customers are exempt from paying for the costs of new energy
efficiency programs. Dominion Power customers may qualify by having
average demands between 500 kW and 10 MW; customers with more than
10 MW do not participate in the state’s energy efficiency programming by
law. Once customers opt out, they cannot take advantage of existing
programming nor be charged for it. Customers must show that they have
already made energy efficiency investments or plan to in the future.
Customers must submit measurement and verification reports yearly in
support of their opting out of programs funded by a cost-recovery
mechanism.
–1
West Virginia
Opt out is developed individually by utilities. Customers with demand of 1 MW
or greater may opt out. Participants must document that they have achieved
similar/equivalent savings on their own to retain opt-out status. Claims of
energy and/or demand reduction are certified to utilities, with future
evaluation by the PUC to take place in a later proceeding. The method has
not been specified. Twenty large customers have opted out.
–1
Energy Efficiency Resource Standards
Energy efficiency targets for utilities, often called EERS, are critical to encouraging savings over the near and long term. States with an EERS policy in place have shown average energy efficiency spending and savings levels more than three times as high as states without an EERS policy (Molina and Kushler 2015). Twenty-six states now have fully funded EERS policies that establish specific energy savings targets that utilities and program administrators must meet through customer energy efficiency programs. These policies set multiyear targets for electricity or natural gas savings, such as 1% or 2% incremental savings per year or 20% cumulative savings by 2025.34
EERS policies differ from state to state, but each is intended to establish a sustainable, long-term role for energy efficiency in the state’s overall energy portfolio. ACEEE considers a state to have an EERS if it has a policy in place that
1. Sets clear, long-term (3+ years) targets for electricity or natural gas savings 2. Makes targets mandatory
34 Multiyear is defined as spanning three or more years. EERS policies may set specific targets as a percentage of sales, as specific gigawatt-hour energy savings targets without reference to sales in previous years, or as a percentage of load growth.
EMBARGOED
UTILITY POLICIES 2016 STATE SCORECARD © ACEEE
40
3. Includes sufficient funding for full implementation of programs necessary to meet targets
Several states have chosen to enforce all cost-effective efficiency requirements, which call for utilities and program administrators to determine and invest in the maximum amount of cost-effective efficiency feasible. ACEEE considers states with all cost-effective requirements to have EERS policies in place once these policies have led to multiyear savings targets and have also met the rest of the criteria listed above.
EERS policies aim explicitly for quantifiable energy savings, reinforcing the idea that energy efficiency is a utility system resource on par with supply-side resources. These standards also help utility system planners more clearly anticipate and project the impact of energy efficiency programs on utility system loads and resource needs. Energy savings targets are generally set at levels that push efficiency program administrators to achieve higher savings than they otherwise would have, with goals typically based on analysis of the energy efficiency savings potential in the state to ensure that the targets are realistic and achievable. EERS policies maintain strict requirements for cost effectiveness so that efficiency programs are guaranteed to provide overall benefits to customers. These standards help to ensure a long-term commitment to energy efficiency as a resource, building essential customer engagement as well as the workforce and market infrastructure necessary to sustain the high savings levels.35
SCORES FOR ENERGY EFFICIENCY RESOURCE STANDARDS
In this category, we credited states that had mandatory savings targets codified in EERS policies. Our research relied on legislation and utility commission dockets.
A state could earn up to 3 points for an EERS policy based on a number of factors. As table 17 shows, we scored states on a sliding 2.5 scale based on the level of savings called for by their electricity savings targets. States could earn an additional 0.5 points if natural gas was included in the savings goals. We also updated our scoring scale to include half-point increments to better reflect and differentiate levels of savings targets.
Some EERS policies contain cost caps that limit spending, thereby reducing the policy’s effectiveness. This year, we did not subtract points for the existence of a cost cap, although we do note whether a cost cap is in place in the results table below. Most of the states with these policies in place have found themselves constrained. As a result, regulators have approved lower energy savings targets. In these cases, we score states on the lower savings targets approved by regulators that take the cost cap into account, rather than on the higher legislative targets.
As we did last year, we awarded top points to states with energy savings targets of 2% of sales or greater. Multiple states have proved that long-term savings of more than 2% are feasible and cost effective.
35 The ACEEE report Energy Efficiency Resource Standards: A New Progress Report on State Experience analyzed current trends in EERS implementation and found that most states were meeting or were on track to meet energy savings targets (Downs and Cui 2014).
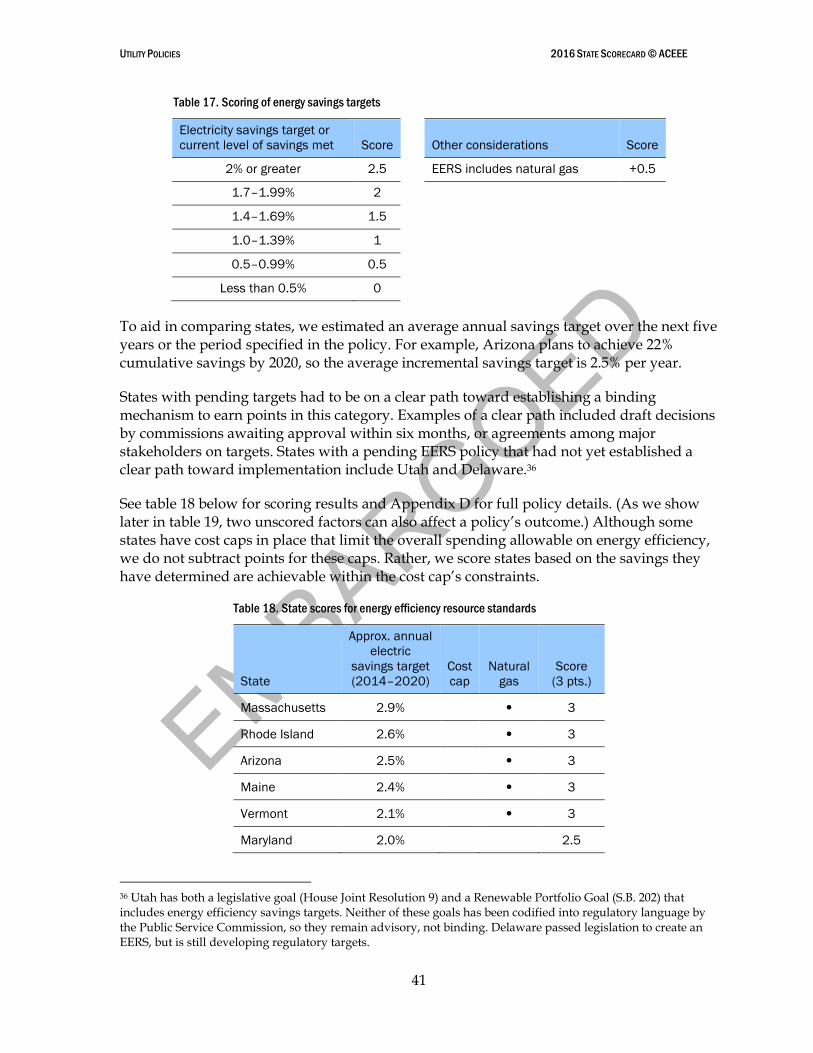
EMBARGOED
UTILITY POLICIES 2016 STATE SCORECARD © ACEEE
41
Table 17. Scoring of energy savings targets
Electricity savings target or
current level of savings met Score Other considerations Score
2% or greater 2.5 EERS includes natural gas +0.5
1.7–1.99% 2
1.4–1.69% 1.5
1.0–1.39% 1
0.5–0.99% 0.5
Less than 0.5% 0
To aid in comparing states, we estimated an average annual savings target over the next five years or the period specified in the policy. For example, Arizona plans to achieve 22% cumulative savings by 2020, so the average incremental savings target is 2.5% per year.
States with pending targets had to be on a clear path toward establishing a binding mechanism to earn points in this category. Examples of a clear path included draft decisions by commissions awaiting approval within six months, or agreements among major stakeholders on targets. States with a pending EERS policy that had not yet established a clear path toward implementation include Utah and Delaware.36
See table 18 below for scoring results and Appendix D for full policy details. (As we show later in table 19, two unscored factors can also affect a policy’s outcome.) Although some states have cost caps in place that limit the overall spending allowable on energy efficiency, we do not subtract points for these caps. Rather, we score states based on the savings they have determined are achievable within the cost cap’s constraints.
Table 18. State scores for energy efficiency resource standards
State
Approx. annual
electric
savings target
(2014–2020)
Cost
cap
Natural
gas
Score
(3 pts.)
Massachusetts 2.9% • 3
Rhode Island 2.6% • 3
Arizona 2.5% • 3
Maine 2.4% • 3
Vermont 2.1% • 3
Maryland 2.0% 2.5
36 Utah has both a legislative goal (House Joint Resolution 9) and a Renewable Portfolio Goal (S.B. 202) that includes energy efficiency savings targets. Neither of these goals has been codified into regulatory language by the Public Service Commission, so they remain advisory, not binding. Delaware passed legislation to create an EERS, but is still developing regulatory targets.
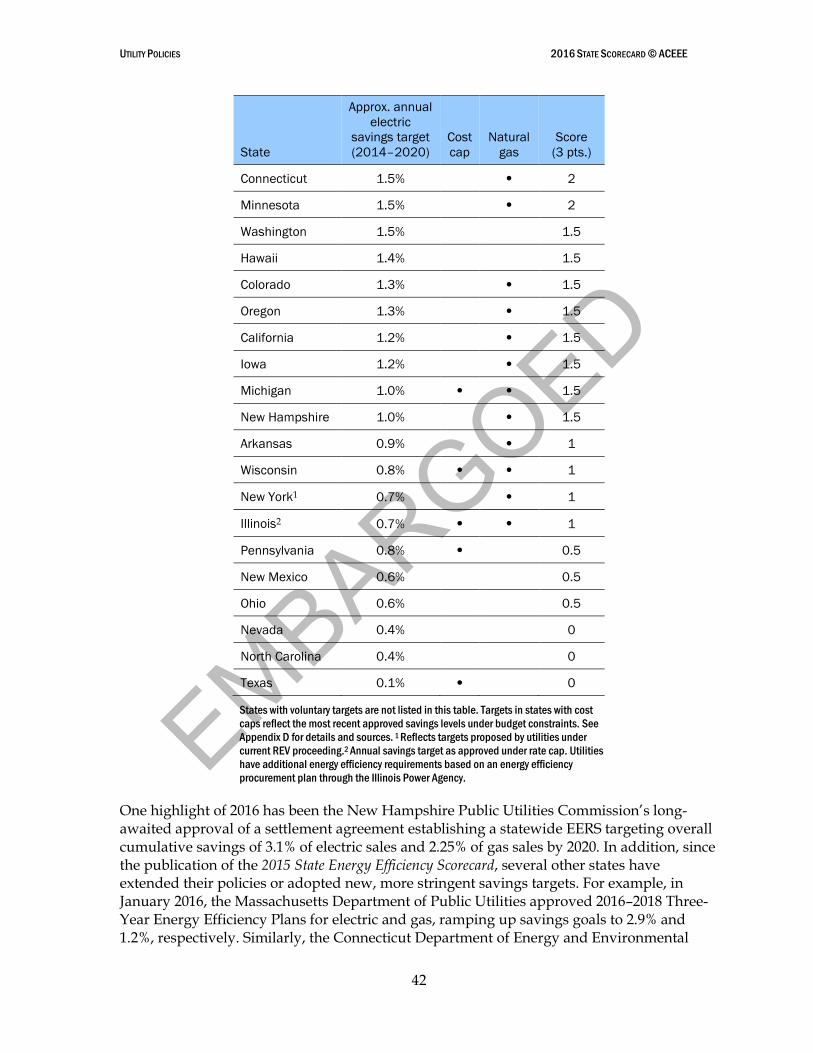
EMBARGOED
UTILITY POLICIES 2016 STATE SCORECARD © ACEEE
42
State
Approx. annual
electric
savings target
(2014–2020)
Cost
cap
Natural
gas
Score
(3 pts.)
Connecticut 1.5% • 2
Minnesota 1.5% • 2
Washington 1.5% 1.5
Hawaii 1.4% 1.5
Colorado 1.3% • 1.5
Oregon 1.3% • 1.5
California 1.2% • 1.5
Iowa 1.2% • 1.5
Michigan 1.0% • • 1.5
New Hampshire 1.0% • 1.5
Arkansas 0.9% • 1
Wisconsin 0.8% • • 1
New York1 0.7% • 1
Illinois2 0.7% • • 1
Pennsylvania 0.8% • 0.5
New Mexico 0.6% 0.5
Ohio 0.6% 0.5
Nevada 0.4% 0
North Carolina 0.4% 0
Texas 0.1% • 0
States with voluntary targets are not listed in this table. Targets in states with cost
caps reflect the most recent approved savings levels under budget constraints. See
Appendix D for details and sources. 1 Reflects targets proposed by utilities under
current REV proceeding.2 Annual savings target as approved under rate cap. Utilities
have additional energy efficiency requirements based on an energy efficiency
procurement plan through the Illinois Power Agency.
One highlight of 2016 has been the New Hampshire Public Utilities Commission’s long-awaited approval of a settlement agreement establishing a statewide EERS targeting overall cumulative savings of 3.1% of electric sales and 2.25% of gas sales by 2020. In addition, since the publication of the 2015 State Energy Efficiency Scorecard, several other states have extended their policies or adopted new, more stringent savings targets. For example, in January 2016, the Massachusetts Department of Public Utilities approved 2016–2018 Three-Year Energy Efficiency Plans for electric and gas, ramping up savings goals to 2.9% and 1.2%, respectively. Similarly, the Connecticut Department of Energy and Environmental

EMBARGOED
UTILITY POLICIES 2016 STATE SCORECARD © ACEEE
43
Protection (DEEP) approved the state’s 2016–2018 Electric and Natural Gas Conservation and Load Management Plan in December 2015, increasing electric and gas efficiency targets to 1.51% and 0.61%, respectively. That same month, the Arkansas Public Service Commission issued an order extending the state’s 0.9% electricity savings target through 2018, ramping up to 1.00% in 2019, with a natural gas savings target of 0.5% for 2017–2019.
Other states have faced challenges to their EERS policies. In Ohio, an ongoing legislative freeze continued through 2016. With no additional legislative action, savings targets will resume under the original policy in 2017.
New York continues to push ahead on efforts to lay the regulatory foundations for the utility system of the future through its REV proceeding, but concrete energy efficiency targets are still pending. As part of the REV proceeding, the commission carried 2015 electric savings goals for utilities into 2016 and called on utilities to propose targets over the following two years that were at least as high as current savings levels.37 Because the commission has made it clear that—at least over the next three years—savings targets will continue to be an important and mandatory measure of performance, we continue to give credit for an EERS policy. The New York State Public Service Commission has asked the state’s Clean Energy Advisory Council to develop target recommendations by the end of the year.
Long-term energy savings targets require leadership, sustainable funding sources, and institutional support for states to achieve their goals. Several states currently have or in the past have had EERS-like structures in place but have lacked one or more of these enabling elements, and thus have undercut the achievement of their savings goals. States in this situation include Florida and New Jersey, neither of which earned points in this category this year.38 Most states with EERS policies or other energy savings targets have met their goals and are on track to meet future goals (Downs and Cui 2014).
Utility Business Model and Energy Efficiency: Earning a Return and Fixed Cost Recovery
Under traditional regulatory structures, utilities do not have an economic incentive to promote energy efficiency. They typically have a disincentive, because falling energy sales from energy efficiency programs reduce utilities’ revenues and profits—an effect referred to as lost revenues or lost sales. Because utilities’ earnings are usually based on the total amount of capital invested in certain asset categories—such as transmission and distribution infrastructure and power plants—and the amount of electricity sold, the financial incentives are very much tilted in favor of increased electricity sales and expanding supply-side systems.
37 The New York Public Service Commission’s February 2015 order in the REV case directed that “longer-term goals should exceed existing targets.” Utilities have filed plans for the 2016–2018 period with incremental electricity savings ranging from 0.4% to 0.9% of retail sales per year. In January, the PSC also authorized NYSERDA's Clean Energy Fund (CEF) Framework, which outlines a minimum 10-year energy efficiency goal of 10.6 million MWh measured in cumulative first year savings. Some degree of overlap of program savings is anticipated between utility targets and NYSERDA CEF goals.
38 In 2014, Florida utilities proposed reducing efficiency efforts from 2010 levels by at least 80%. The Florida Public Service Commission approved this proposal. In New Jersey available funds for energy efficiency are far below the amount necessary to meet savings targets laid out by state legislators.

EMBARGOED
UTILITY POLICIES 2016 STATE SCORECARD © ACEEE
44
This dynamic has led industry experts to devise ways of addressing the possible loss of earnings and profit from customer energy efficiency programs and thereby remove utilities’ financial disincentive to promote energy efficiency. Three key policy approaches properly align utility incentives and remove barriers to energy efficiency. The first is to ensure that utilities can recover the direct costs associated with implementing energy efficiency programs. This is a minimum threshold requirement for utilities and related organizations to fund and offer efficiency programs; every state meets it in some form. Given the wide acceptance of program cost recovery, we do not address it in the State Scorecard. The other two mechanisms are fixed cost recovery (decoupling and lost revenue adjustment mechanisms) and performance incentives. Decoupling—the disassociation of a utility's revenues from its sales—aims to make the utility indifferent to decreases or increases in sales, removing what is known as the throughput incentive. Although decoupling does not necessarily make the utility more likely to promote efficiency programs, it removes or reduces the disincentive for it to do so. Additional mechanisms for addressing lost revenues include modifications to customers’ rates that permit utilities to collect these revenues, either through a lost-revenue adjustment mechanism (LRAM) or other ratemaking approach. ACEEE prefers the decoupling approach for addressing the throughput incentive and considers LRAM appropriate only as a short-term solution. Performance incentives are financial incentives that reward utilities (and in some cases nonutility program administrators) for reaching or exceeding specified program goals. These may include a shareholder incentive that is awarded based on achievement of energy savings targets, and an incentive based on spending goals. Of the two, ACEEE recommends shareholder incentives. As table 20 shows, a number of states have enacted mechanisms that align utility incentives with energy efficiency.39
SCORES FOR UTILITY BUSINESS MODEL AND ENERGY EFFICIENCY
A state could earn up to 2 points in this category: up to 1 point for having implemented performance incentive mechanisms and up to 1 point for having implemented full revenue decoupling for its electric and natural gas utilities. Table 19 describes the scoring methodology. Information about individual state decoupling policies and financial incentive mechanisms is available on ACEEE’s State and Local Policy Database (ACEEE 2016).
39 For a detailed analysis of performance incentives, see Nowak et al. (2015). For a detailed analysis of LRAM, see Gilleo et al. (2015).
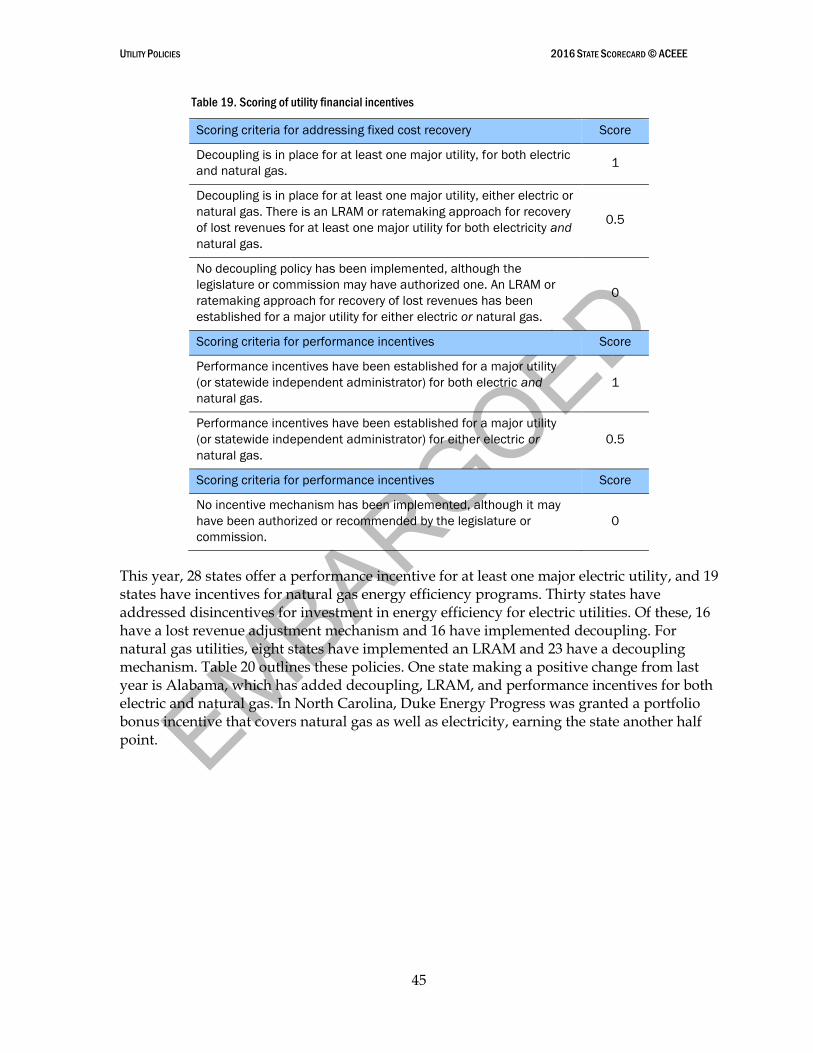
EMBARGOED
UTILITY POLICIES 2016 STATE SCORECARD © ACEEE
45
Table 19. Scoring of utility financial incentives
Scoring criteria for addressing fixed cost recovery Score
Decoupling is in place for at least one major utility, for both electric
and natural gas. 1
Decoupling is in place for at least one major utility, either electric or
natural gas. There is an LRAM or ratemaking approach for recovery
of lost revenues for at least one major utility for both electricity and
natural gas.
0.5
No decoupling policy has been implemented, although the
legislature or commission may have authorized one. An LRAM or
ratemaking approach for recovery of lost revenues has been
established for a major utility for either electric or natural gas.
0
Scoring criteria for performance incentives Score
Performance incentives have been established for a major utility
(or statewide independent administrator) for both electric and
natural gas.
1
Performance incentives have been established for a major utility
(or statewide independent administrator) for either electric or
natural gas.
0.5
Scoring criteria for performance incentives Score
No incentive mechanism has been implemented, although it may
have been authorized or recommended by the legislature or
commission.
0
This year, 28 states offer a performance incentive for at least one major electric utility, and 19 states have incentives for natural gas energy efficiency programs. Thirty states have addressed disincentives for investment in energy efficiency for electric utilities. Of these, 16 have a lost revenue adjustment mechanism and 16 have implemented decoupling. For natural gas utilities, eight states have implemented an LRAM and 23 have a decoupling mechanism. Table 20 outlines these policies. One state making a positive change from last year is Alabama, which has added decoupling, LRAM, and performance incentives for both electric and natural gas. In North Carolina, Duke Energy Progress was granted a portfolio bonus incentive that covers natural gas as well as electricity, earning the state another half point.
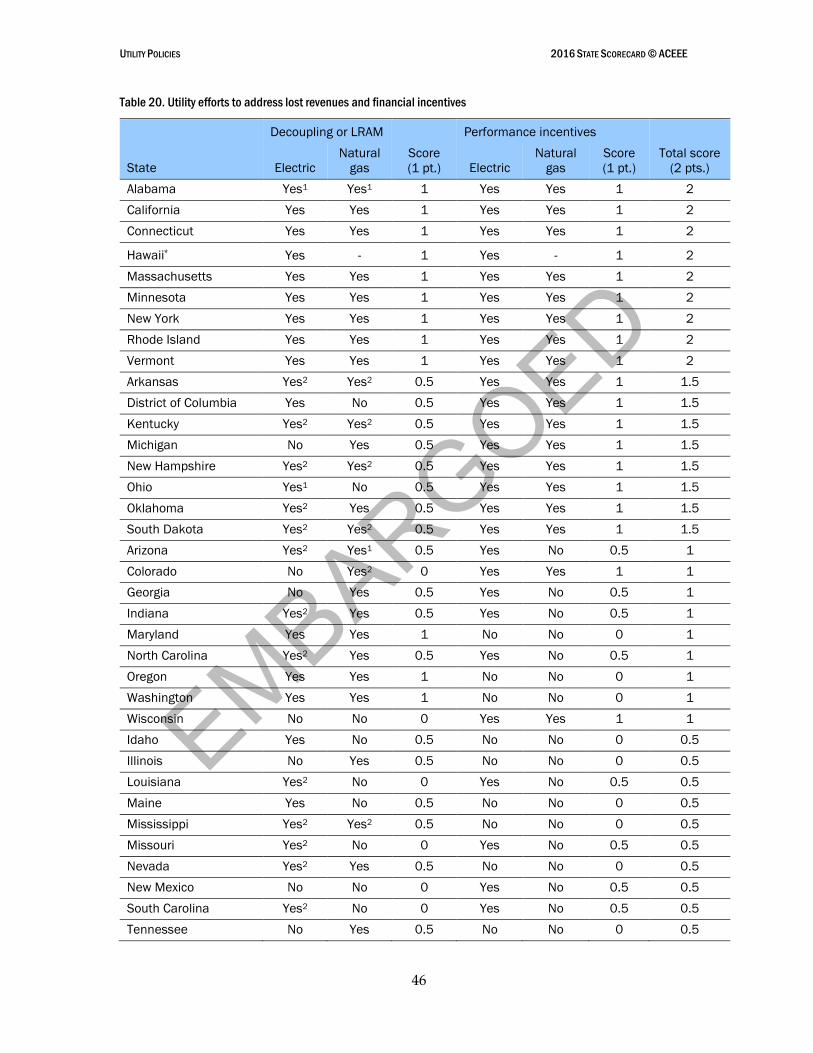
EMBARGOED
UTILITY POLICIES 2016 STATE SCORECARD © ACEEE
46
Table 20. Utility efforts to address lost revenues and financial incentives
Decoupling or LRAM Performance incentives
State Electric
Natural
gas
Score
(1 pt.) Electric
Natural
gas
Score
(1 pt.)
Total score
(2 pts.)
Alabama Yes1 Yes1 1 Yes Yes 1 2
California Yes Yes 1 Yes Yes 1 2
Connecticut Yes Yes 1 Yes Yes 1 2
Hawaii* Yes - 1 Yes - 1 2
Massachusetts Yes Yes 1 Yes Yes 1 2
Minnesota Yes Yes 1 Yes Yes 1 2
New York Yes Yes 1 Yes Yes 1 2
Rhode Island Yes Yes 1 Yes Yes 1 2
Vermont Yes Yes 1 Yes Yes 1 2
Arkansas Yes2 Yes2 0.5 Yes Yes 1 1.5
District of Columbia Yes No 0.5 Yes Yes 1 1.5
Kentucky Yes2 Yes2 0.5 Yes Yes 1 1.5
Michigan No Yes 0.5 Yes Yes 1 1.5
New Hampshire Yes2 Yes2 0.5 Yes Yes 1 1.5
Ohio Yes1 No 0.5 Yes Yes 1 1.5
Oklahoma Yes2 Yes 0.5 Yes Yes 1 1.5
South Dakota Yes2 Yes2 0.5 Yes Yes 1 1.5
Arizona Yes2 Yes1 0.5 Yes No 0.5 1
Colorado No Yes2 0 Yes Yes 1 1
Georgia No Yes 0.5 Yes No 0.5 1
Indiana Yes2 Yes 0.5 Yes No 0.5 1
Maryland Yes Yes 1 No No 0 1
North Carolina Yes2 Yes 0.5 Yes No 0.5 1
Oregon Yes Yes 1 No No 0 1
Washington Yes Yes 1 No No 0 1
Wisconsin No No 0 Yes Yes 1 1
Idaho Yes No 0.5 No No 0 0.5
Illinois No Yes 0.5 No No 0 0.5
Louisiana Yes2 No 0 Yes No 0.5 0.5
Maine Yes No 0.5 No No 0 0.5
Mississippi Yes2 Yes2 0.5 No No 0 0.5
Missouri Yes2 No 0 Yes No 0.5 0.5
Nevada Yes2 Yes 0.5 No No 0 0.5
New Mexico No No 0 Yes No 0.5 0.5
South Carolina Yes2 No 0 Yes No 0.5 0.5
Tennessee No Yes 0.5 No No 0 0.5
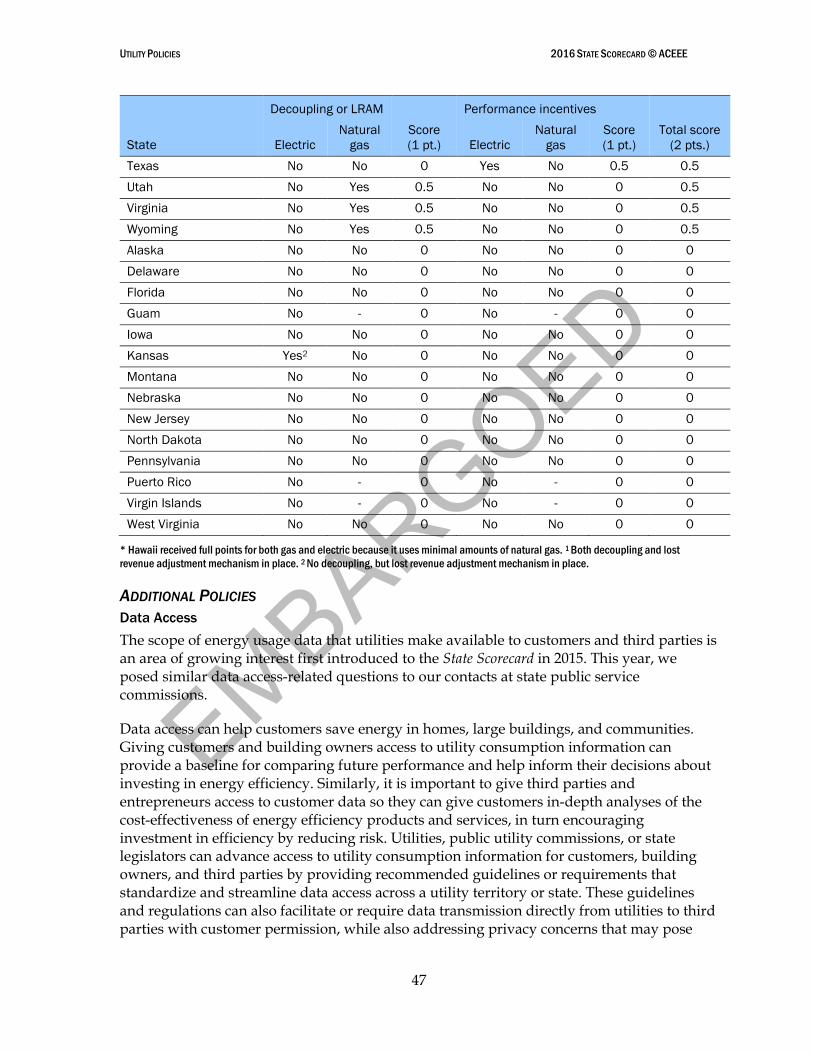
EMBARGOED
UTILITY POLICIES 2016 STATE SCORECARD © ACEEE
47
Decoupling or LRAM Performance incentives
State Electric
Natural
gas
Score
(1 pt.) Electric
Natural
gas
Score
(1 pt.)
Total score
(2 pts.)
Texas No No 0 Yes No 0.5 0.5
Utah No Yes 0.5 No No 0 0.5
Virginia No Yes 0.5 No No 0 0.5
Wyoming No Yes 0.5 No No 0 0.5
Alaska No No 0 No No 0 0
Delaware No No 0 No No 0 0
Florida No No 0 No No 0 0
Guam No - 0 No - 0 0
Iowa No No 0 No No 0 0
Kansas Yes2 No 0 No No 0 0
Montana No No 0 No No 0 0
Nebraska No No 0 No No 0 0
New Jersey No No 0 No No 0 0
North Dakota No No 0 No No 0 0
Pennsylvania No No 0 No No 0 0
Puerto Rico No - 0 No - 0 0
Virgin Islands No - 0 No - 0 0
West Virginia No No 0 No No 0 0
* Hawaii received full points for both gas and electric because it uses minimal amounts of natural gas. 1 Both decoupling and lost
revenue adjustment mechanism in place. 2 No decoupling, but lost revenue adjustment mechanism in place.
ADDITIONAL POLICIES
Data Access
The scope of energy usage data that utilities make available to customers and third parties is an area of growing interest first introduced to the State Scorecard in 2015. This year, we posed similar data access-related questions to our contacts at state public service commissions.
Data access can help customers save energy in homes, large buildings, and communities. Giving customers and building owners access to utility consumption information can provide a baseline for comparing future performance and help inform their decisions about investing in energy efficiency. Similarly, it is important to give third parties and entrepreneurs access to customer data so they can give customers in-depth analyses of the cost-effectiveness of energy efficiency products and services, in turn encouraging investment in efficiency by reducing risk. Utilities, public utility commissions, or state legislators can advance access to utility consumption information for customers, building owners, and third parties by providing recommended guidelines or requirements that standardize and streamline data access across a utility territory or state. These guidelines and regulations can also facilitate or require data transmission directly from utilities to third parties with customer permission, while also addressing privacy concerns that may pose
EMBARGOED
UTILITY POLICIES 2016 STATE SCORECARD © ACEEE
48
barriers to data sharing. One avenue of increased customer acceptance is to educate consumers about the benefits of increased data access.
In addition to providing data to customers, building owners, and third-party service providers, multiple other use cases exist for which state and local governments should facilitate data sharing by working with utilities to clarify conditions and guidelines. For example, California Public Utilities Commission rulemaking recognizes specific use cases for local governments seeking access to aggregate data for use in creating Climate Action Plans; for research institutions seeking anonymous energy consumption data to evaluate energy policies; and for environmental groups seeking customer data regarding energy efficiency measures pre- and post-retrofit.40
Although state policies can encourage data sharing, the absence of explicit state policies does not mean utilities cannot act. After all, some utilities consider it simply a customer service obligation to empower consumers with the ability to access and share their energy data in a digital world. Regardless of policy, utilities can still facilitate these relationships. For example, utilities in several states give customers access to their own energy use data through an online portal, offering them the option of releasing it to third parties for greater analysis even without an explicit policy promoting such exchanges in place.
The data requests we distributed to utility commission contacts posed the following questions.
Do utilities provide energy usage data for customers to download in an electronic format such as Green Button? Are they required to do so? Here, we identify those states in which utilities let customers download and access their energy use data in an electronic format, giving them usage information that is often a prerequisite to their investing in energy efficiency. We also identify those states in which utility commissions are going a step further to explicitly require utilities to provide energy use data to customers in a standardized electronic format. Doing so helps to facilitate sharing with third-party energy management services. For example, utilities are increasingly supporting Green Button,41 a technical standard for exchanging energy usage data, which, as the name suggests, enables customers to download energy usage data by simply clicking on a “green button.”
Are guidelines or requirements are in place regarding the process for third-party access to customer energy use data? Such policies remove perceived technical and policy barriers to third-party access, specifically by addressing privacy concerns among consumers and liability concerns among utilities.
40 California Public Utilities Commission. Decision Adopting Rules to Provide Access to Energy Usage-Related
Data While Protecting Privacy of Personal Data. Rulemaking 08-12-2009, May 1, 2014. http://docs.cpuc.ca.gov/PublishedDocs/Published/G000/M090/K845/90845985.PDF
41 Green Button comes in two varieties: Green Button Download My Data, which allows customers to download their energy use data (and upload it to a third-party application), and Green Button Connect My Data, which allows customers to automate the secure transfer of their usage data to third parties.
EMBARGOED
UTILITY POLICIES 2016 STATE SCORECARD © ACEEE
49
Are utilities required to provide aggregated energy use data to owners of separately metered commercial or multifamily properties, or to public agencies? If so, what are the terms and details of the requirements? Separately metered buildings make up a significant portion of the built environment in many cities, and thus represent a significant opportunity in which to promote energy efficiency. By having access to whole-building energy data, building owners can benchmark energy consumption and identify opportunities to improve energy efficiency. Unfortunately, when attempting to track energy use data within buildings, owners and operators often encounter privacy-related obstacles related to tenant-occupied spaces, where the tenant is the utility customer of record. Clarifying privacy protection and information-sharing practices through data aggregation requirements can help address these concerns.
Table 21 summarizes the responses to these questions. We did not score states on their responses this year, although we will likely score this metric in the future .42
42 Complete information on data access as reported by states can be found at database.aceee.org.
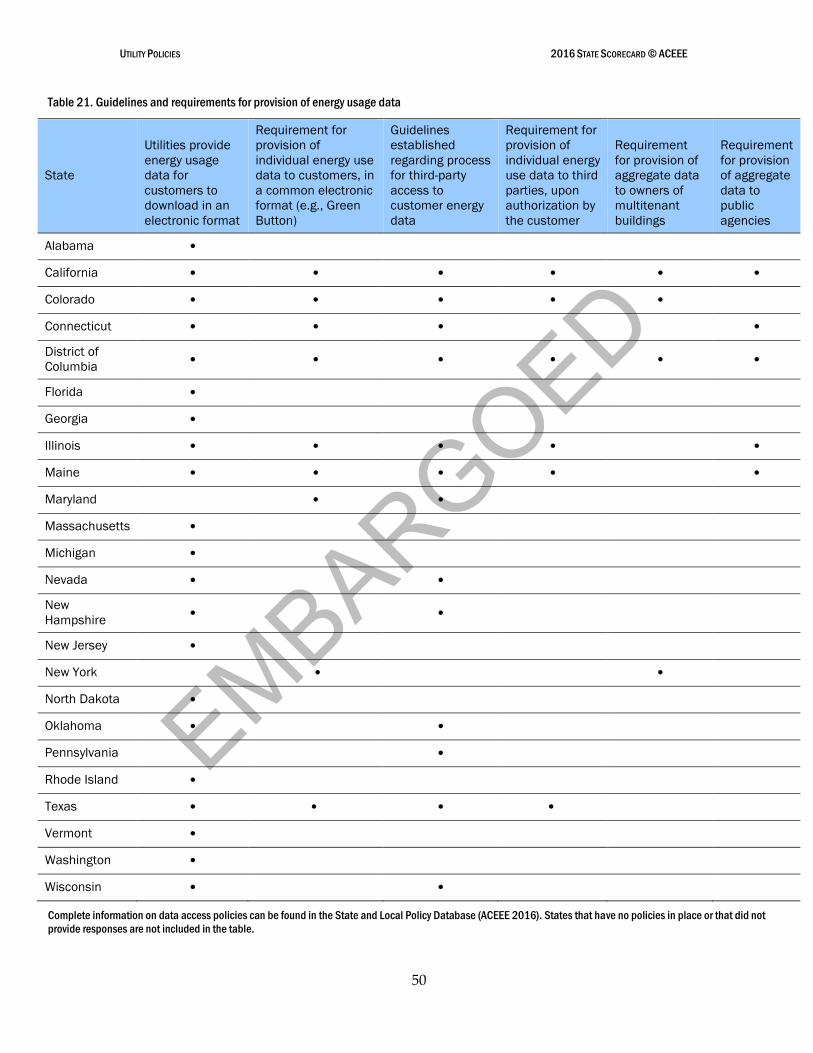
EMBARGOED
UTILITY POLICIES 2016 STATE SCORECARD © ACEEE
50
Table 21. Guidelines and requirements for provision of energy usage data
State
Utilities provide
energy usage
data for
customers to
download in an
electronic format
Requirement for
provision of
individual energy use
data to customers, in
a common electronic
format (e.g., Green
Button)
Guidelines
established
regarding process
for third-party
access to
customer energy
data
Requirement for
provision of
individual energy
use data to third
parties, upon
authorization by
the customer
Requirement
for provision of
aggregate data
to owners of
multitenant
buildings
Requirement
for provision
of aggregate
data to
public
agencies
Alabama •
California • • • • • •
Colorado • • • • •
Connecticut • • • •
District of
Columbia • • • • • •
Florida •
Georgia •
Illinois • • • • •
Maine • • • • •
Maryland • •
Massachusetts •
Michigan •
Nevada • •
New
Hampshire • •
New Jersey •
New York • •
North Dakota •
Oklahoma • •
Pennsylvania •
Rhode Island •
Texas • • • •
Vermont •
Washington •
Wisconsin • •
Complete information on data access policies can be found in the State and Local Policy Database (ACEEE 2016). States that have no policies in place or that did not
provide responses are not included in the table.
EMBARGOED
UTILITY POLICIES 2016 STATE SCORECARD © ACEEE
51
States that have taken notable steps toward clarifying guidelines for the provision of customer energy usage data are described below.
States across the country continue to ramp up utility-scale energy efficiency efforts. Although many of the traditional leaders remain in this space, states and regions relatively new to energy efficiency are also making notable progress. Several examples are described below.
Leading and Trending States: Data Access
District of Columbia. The Sustainable DC Act of 2014 included a provision that mandates
both electric and gas utilities to provide aggregated whole-building data upon request to a
building owner, making it the first jurisdiction in the country to do so. These data are then
made available for download and through automated upload to ENERGY STAR® Portfolio
Manager. Data are aggregated to the whole-building level for five or more accounts, to
address any privacy concerns and simplify the process of benchmarking multitenant
buildings.
California. In September 2015, California passed Assembly Bill 802 invigorating the state’s
benchmarking program by increasing transparency and public access to energy data. The
bill required utilities to make available whole-building aggregated energy consumption data
when requested to by building owners. Meanwhile Green Button Connect My Data continues
to gain traction across the state, graduating from earlier limited pilots programs to more
widespread adoption by large investor-owned utilities.
Illinois. In March 2016, the Illinois Commerce Commission issued an order directing
Commonwealth Edison Company and Ameren to take the first steps to give customers with
smart meters the ability to authorize and share their energy usage data with registered third-
party companies using Green Button Connect My Data. Commission order 15-0073
establishes the process by which Illinois consumers can obtain and control access to their
electricity usage data. Customers of Commonwealth Edison with smart meters can use
Green Button Connect My Data as of May 2016. (All customers will have a smart meter by
2018.)
New York. The New York Public Service Commission issued a March 2016 order approving
an advanced metering infrastructure (AMI) business plan by ConEd under the condition that
the utility both provide Home Area Network (HAN) functionality and implement Green Button
Connect My Data. In a subsequent order, utilities with AMI deployment plans were directed
to submit a proposed implementation plan, budget, and timeline for implementing Green
Button Connect My Data or an alternate standard that offers similar functionality. Utilities
without AMI deployment plans were directed to identify other tools that could be used to
improve customer and authorized third-party access to customer data in their initial
diversified stock income plans.
Texas. Regardless of the utilities that serve them, customers can access their data by
registering with the portal smartmetertexas.com. Third parties can also readily gain access
to customer data after consent is received to help customers make informed decisions
about reducing their energy use. Furthermore, SPEER has published the Smart Energy
Roadmap for Texas, which details numerous strategies for improving data collection and
customers’ data access, as well as ways to better inform customers of available savings
opportunities.
EMBARGOED
UTILITY POLICIES 2016 STATE SCORECARD © ACEEE
52
Leading and Trending States: Utility and Public Benefits Programs and Policies
Arkansas. Arkansas is leading in the Southeast, having significantly ramped up its utility-
sector energy efficiency initiatives since 2007. In that year, the Arkansas Public Service
Commission (PSC) approved rules for conservation and energy efficiency programs requiring
electric and natural gas utilities to administer energy efficiency programs. In 2010, the state
adopted an EERS for both electricity and natural gas and established rules for cost recovery,
performance incentives, and utility resource planning. In a 2015 PSC Order, these targets
were increased to incremental annual savings of 0.9% and 0.5% for electricity and gas,
respectively, for 2017–2018, although an opt-out provision may limit future savings.
Arkansas is also developing a new financing mechanism for residential utility customers to
add more energy efficiency program offerings to the utilities’ core programs.
Maine. In Maine, net incremental savings made a sizeable leap, from 1.21% of retail sales in
2014 to 1.69% in 2015. In 2013, the state’s Omnibus Energy Act stabilized the process for
funding the Efficiency Maine Trust’s electricity savings programs and expanded important
funding for programs that reduce heating demand and promote alternative heating systems.
In FY 2015, the Trust leveraged significant foundational work completed in FY 2014 to
implement significant thermal efficiency programs. This past year marked the first full year
of the state’s new Home Energy Savings Program (HESP) and a significant portion of funds
dedicated to new programs in FY 2014 were not fully invested until FY 2015. As Maine
enters the final year of its second Triennial Plan, its third Triennial Plan (2017–2019) will
target energy savings between 2.2 and 2.6% annually.
Vermont. Vermont pioneered the third-party administration model of implementing energy
efficiency programs, which has been replicated in many states, including Maine, New Jersey,
Delaware, and Oregon, and the District of Columbia. Efficiency Vermont, the state’s “energy
efficiency utility,” runs programs for a wide range of customers and leads the nation in
producing consistent energy savings. Vermont’s excellent performance is due largely to a
strategic commitment by the Vermont Public Service Board to fund programs at aggressive
levels in order to reach new customers and achieve deep savings. The Public Service Board
has an optimal mix of policies, including an EERS and performance incentives, to encourage
successful programs.
Rhode Island. Rhode Island invests a greater proportion of utility revenues in energy
efficiency than any other state due to its requirement that utilities invest in all cost-effective
energy efficiency. A recent revision of the state’s energy efficiency potential study confirmed
that it should continue to strive for electricity savings of more than 2% per year for the next
three years. Natural gas targets of at least 1% per year are similarly aggressive. The state’s
energy efficiency plans are overseen by a stakeholder board with representatives from
government agencies, environmental groups, businesses, and consumer advocates.
EMBARGOED
TRANSPORTATION 2016 STATE SCORECARD © ACEEE
53
Chapter 3. Transportation Policies
Author: Shruti Vaidyanathan
INTRODUCTION
Transportation energy use accounts for approximately 28% of overall energy consumption in the United States and is the second biggest consumer of energy after the electric power sector (EIA 2016a). At the federal, state, or local level, a comprehensive approach to transportation energy efficiency must address both individual vehicles and the transportation system as a whole, including its interrelationship with land use policies. In recent years, the federal government has addressed vehicle energy use through joint GHG and fuel economy standards for light- and heavy-duty vehicles. However states have historically led the way in creating policies for other aspects of transportation efficiency.
The energy efficiency score for the transportation category reflects state actions that go beyond federal policies to achieve a more energy-efficient transportation sector. These may be measures to improve the efficiency of vehicles purchased or operated in the state, policies to promote more efficient modes of transportation, or the integration of land use and transportation planning to reduce the need to drive.
SCORING AND RESULTS
While ambitious fuel economy and GHG standards for light-duty vehicles are now in place at the national level through 2025, states continue to play a crucial role in ensuring continuing progress toward high-efficiency vehicles.43 Consequently, we awarded states that have adopted California’s GHG vehicle emissions standards 1 point and those that also adopted its Zero Emission Vehicle (ZEV) program an additional 0.5 points. In addition, we awarded 0.5 points to states with consumer incentives for the purchase of high-efficiency vehicles. States with more than 30 registered EVs per 100,000 people qualified for an additional 0.5 points, while those with more than 70 EVs per 100,000 earned a full point. States can lead the way in improving not only vehicle fuel efficiency but also the efficiency of transportation systems more broadly. States that have a dedicated transit revenue stream earned 1 point in this year’s State Scorecard. Twenty-two states have transit statutes in place that provide sustainable funding sources for operating expenses, as well as for transit facility expansion and maintenance. For details, see Appendix G. States also received points based on the magnitude of their transit spending: relatively large investments ($50 per capita or more) received 1 point, while investments ranging from $20 to $50 per capita received 0.5 points. Maryland, for instance, saw a 40% increase in per capita transit spending between fiscal years 2012 and 2013. Policies that promote compact development and ensure the accessibility of major destinations are essential to reducing transportation energy use in the long term. States with smart growth statutes earned 1 point. These statutes include the creation of zoning overlay
43 The light-duty standards finalized by the EPA and DOT in 2012 are up for review in 2017, and states that have adopted California’s GHG emissions program can help ensure that the federal standards are not weakened in the midterm evaluation process. California’s Zero Emissions Vehicle (ZEV) program, which most of these states have also adopted, is proving to be a major driver of advanced technology vehicles in the light-duty market.
EMBARGOED
TRANSPORTATION 2016 STATE SCORECARD © ACEEE
54
districts such as the Massachusetts Chapter 40R program, as well as various other incentives to encourage sustainable growth. See the ACEEE State and Local Policy Database for further details (ACEEE 2016).
States that adopted reduction targets for VMT or transportation-specific GHG reduction goals statewide were also eligible for 1 point. Only six states earned points in this category. Among them is Vermont, which earned a point for the VMT goals outlined in the Comprehensive Energy Plan adopted in 2011 and updated in 2016. This update sets objectives for 2030, one of which is to hold VMT to 2011 levels, with no increase in growth.
We awarded an additional point to states whose rolling 10-year VMT average fell by 5% or more between 2012 and 2014. A reduction of between 1% and 5% earned 0.5 points. We did not adjust VMT data to account for fluctuations in economic conditions. We also awarded 1 point to states with complete streets statutes, which ensure proper attention to the needs of pedestrians and cyclists in all road projects.
Regarding freight system efficiency, we changed our methodology so that states could earn 1 point only if their state freight plans included energy efficiency performance metrics or freight-specific GHG reduction goals. We awarded 0.5 points to states with plans that describe concrete strategies to improve the overall efficiency of the state freight transport system and improve access to multiple modes of carriage.
Table 23 shows state scores. ACEEE recognizes that variations in the geography and urban/rural composition mean that some states cannot feasibly implement some of the policies mentioned in this chapter. Nevertheless, every state can make additional efforts to reduce their transportation energy use, and this chapter illustrates a number of different approaches. Additional details on state transit funding, transportation policies, and incentives for the purchase of high-efficiency vehicles are included in Appendices E, F, and G.

EMBARGOED
TRANSPORTATION 2016 STATE SCORECARD © ACEEE
55
Table 22. State scores for transportation policies
State
GHG
tailpipe
emissions
standards
and ZEV
program
(1.5 pts.)1
EV
registrations
per
100,000
people
(1 pt.)2
High-
efficiency
vehicle
consumer
incentives
(0.5 pts.)3
VMT
targets/GHG
reduction
goals
(1 pt.)4
Average %
change in
VMT per
capita
(1 pt.) 5
Integration of
transportation
and land use
planning
(1 pt.)6
Complete
streets
legislation
(1 pt.)7
Transit
funding
(1 pt.)8
Dedicated
transit
revenue
stream
statutes
(1 pt.)9
Freight
system
efficiency
goals
(1 pt.)10
Total
score
(10
pts.)
California 1.5 1 0.5 1 1 1 1 1 1 1 10
Massachusetts 1.5 1 0.5 1 0 1 1 1 1 0.5 8.5
New York 1.5 0.5 0.5 1 1 1 1 1 1 0 8.5
Oregon 1.5 1 0 1 1 1 1 0 1 0.5 8
Washington 1 1 0.5 1 1 1 1 0 1 0.5 8
District of Columbia 1.5 1 0.5 0 1 1 1 1 0 0.5 7.5
Vermont 1.5 1 0 1 1 1 1 0 0 0.5 7
Connecticut 1.5 1 0.5 0 0.5 1 1 1 0 0 6.5
Delaware 1 0.5 0.5 0 1 1 1 1 0 0.5 6.5
Maryland 1.5 1 0.5 0 0.5 1 1 1 0 0 6.5
New Jersey 1.5 0.5 0.5 0 0 1 1 1 0 0.5 6
Rhode Island 1.5 0.5 0.5 0 1 1 1 0.5 0 0 6
Maine 1.5 0 0 0 1 1 1 0 1 0 5.5
Florida 0 0.5 0 0 1 1 1 0 1 0.5 5
Illinois 0 0.5 0 0 0.5 1 1 1 1 0 5
Pennsylvania 1 0 0 0 1 0 1 1 1 0 5
Tennessee 0 0.5 0.5 0 1 1 1 0 1 0 5
Colorado 0 1 0.5 0 1 0 1 0 1 0 4.5
Georgia 0 1 0.5 0 1 0 1 0 1 0 4.5
Hawaii 0 1 0 0 0.5 1 1 0 1 0 4.5
Virginia 0 0.5 0 0 1 1 1 0.5 0.5 0 4.5
Michigan 0 0 0 0 0.5 1 1 0.5 1 0 4
Minnesota 0 0 0 0 0.5 0 1 1 1 0.5 4
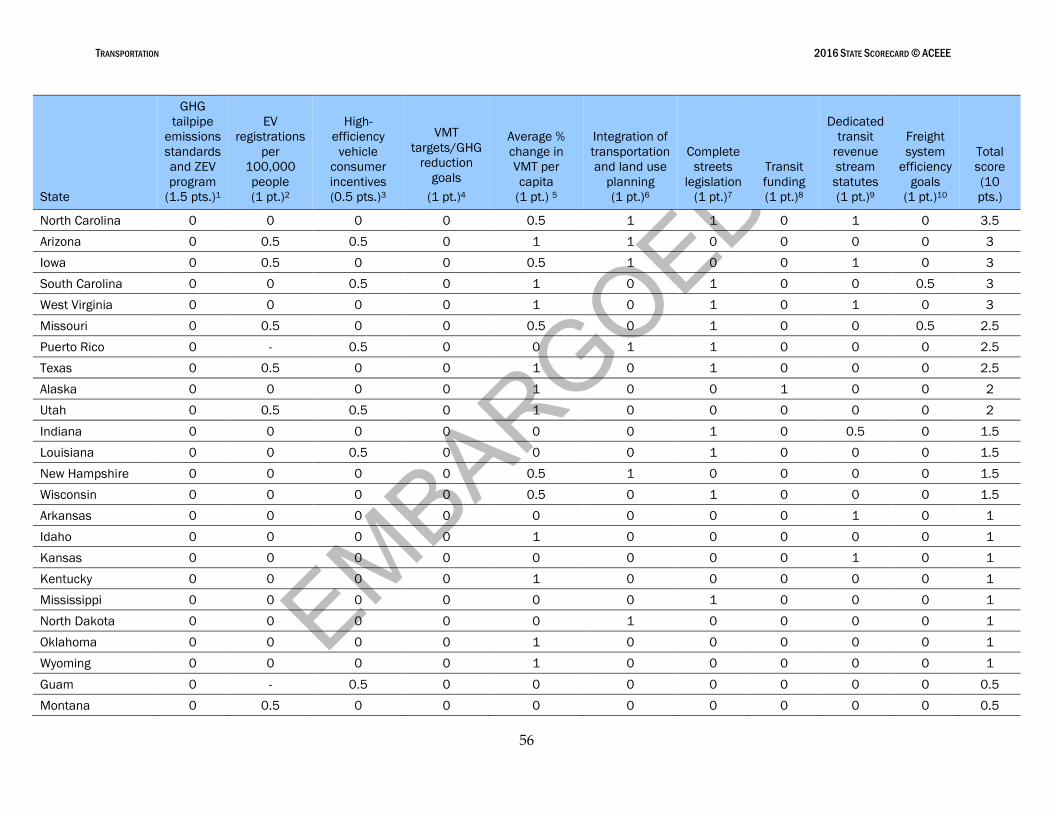
EMBARGOED
TRANSPORTATION 2016 STATE SCORECARD © ACEEE
56
State
GHG
tailpipe
emissions
standards
and ZEV
program
(1.5 pts.)1
EV
registrations
per
100,000
people
(1 pt.)2
High-
efficiency
vehicle
consumer
incentives
(0.5 pts.)3
VMT
targets/GHG
reduction
goals
(1 pt.)4
Average %
change in
VMT per
capita
(1 pt.) 5
Integration of
transportation
and land use
planning
(1 pt.)6
Complete
streets
legislation
(1 pt.)7
Transit
funding
(1 pt.)8
Dedicated
transit
revenue
stream
statutes
(1 pt.)9
Freight
system
efficiency
goals
(1 pt.)10
Total
score
(10
pts.)
North Carolina 0 0 0 0 0.5 1 1 0 1 0 3.5
Arizona 0 0.5 0.5 0 1 1 0 0 0 0 3
Iowa 0 0.5 0 0 0.5 1 0 0 1 0 3
South Carolina 0 0 0.5 0 1 0 1 0 0 0.5 3
West Virginia 0 0 0 0 1 0 1 0 1 0 3
Missouri 0 0.5 0 0 0.5 0 1 0 0 0.5 2.5
Puerto Rico 0 - 0.5 0 0 1 1 0 0 0 2.5
Texas 0 0.5 0 0 1 0 1 0 0 0 2.5
Alaska 0 0 0 0 1 0 0 1 0 0 2
Utah 0 0.5 0.5 0 1 0 0 0 0 0 2
Indiana 0 0 0 0 0 0 1 0 0.5 0 1.5
Louisiana 0 0 0.5 0 0 0 1 0 0 0 1.5
New Hampshire 0 0 0 0 0.5 1 0 0 0 0 1.5
Wisconsin 0 0 0 0 0.5 0 1 0 0 0 1.5
Arkansas 0 0 0 0 0 0 0 0 1 0 1
Idaho 0 0 0 0 1 0 0 0 0 0 1
Kansas 0 0 0 0 0 0 0 0 1 0 1
Kentucky 0 0 0 0 1 0 0 0 0 0 1
Mississippi 0 0 0 0 0 0 1 0 0 0 1
North Dakota 0 0 0 0 0 1 0 0 0 0 1
Oklahoma 0 0 0 0 1 0 0 0 0 0 1
Wyoming 0 0 0 0 1 0 0 0 0 0 1
Guam 0 - 0.5 0 0 0 0 0 0 0 0.5
Montana 0 0.5 0 0 0 0 0 0 0 0 0.5
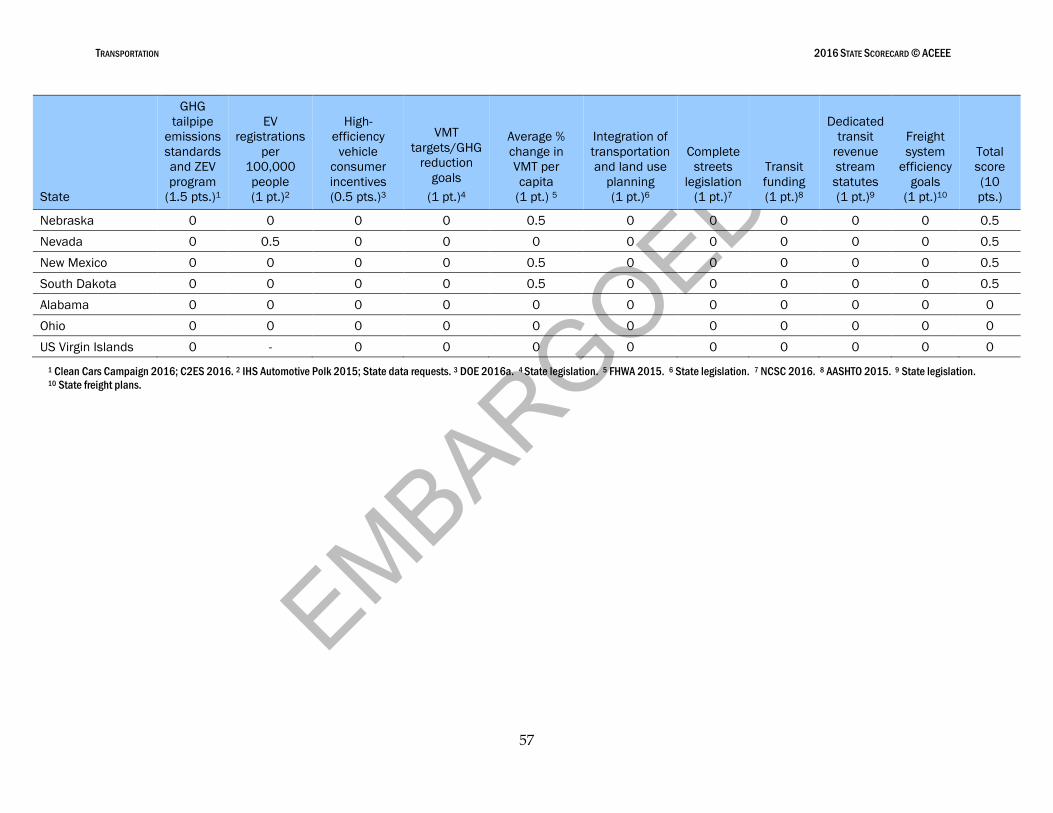
EMBARGOED
TRANSPORTATION 2016 STATE SCORECARD © ACEEE
57
State
GHG
tailpipe
emissions
standards
and ZEV
program
(1.5 pts.)1
EV
registrations
per
100,000
people
(1 pt.)2
High-
efficiency
vehicle
consumer
incentives
(0.5 pts.)3
VMT
targets/GHG
reduction
goals
(1 pt.)4
Average %
change in
VMT per
capita
(1 pt.) 5
Integration of
transportation
and land use
planning
(1 pt.)6
Complete
streets
legislation
(1 pt.)7
Transit
funding
(1 pt.)8
Dedicated
transit
revenue
stream
statutes
(1 pt.)9
Freight
system
efficiency
goals
(1 pt.)10
Total
score
(10
pts.)
Nebraska 0 0 0 0 0.5 0 0 0 0 0 0.5
Nevada 0 0.5 0 0 0 0 0 0 0 0 0.5
New Mexico 0 0 0 0 0.5 0 0 0 0 0 0.5
South Dakota 0 0 0 0 0.5 0 0 0 0 0 0.5
Alabama 0 0 0 0 0 0 0 0 0 0 0
Ohio 0 0 0 0 0 0 0 0 0 0 0
US Virgin Islands 0 - 0 0 0 0 0 0 0 0 0
1 Clean Cars Campaign 2016; C2ES 2016. 2 IHS Automotive Polk 2015; State data requests. 3 DOE 2016a. 4 State legislation. 5 FHWA 2015. 6 State legislation. 7 NCSC 2016. 8 AASHTO 2015. 9 State legislation. 10 State freight plans.
EMBARGOED
TRANSPORTATION 2016 STATE SCORECARD © ACEEE
58
DISCUSSION
Tailpipe Emission Standards and the Zero Emission Vehicle Program
As a longtime leader in vehicle emissions standards, California has been instrumental in prodding the federal government to establish GHG standards that draw new efficiency technologies into the market. The state’s success in this role is due in part to auto manufacturers’ preference for minimizing the number of distinct regulatory regimes for vehicles. In 2002, California passed the Pavley Bill (Assembly Bill 1493), the first law in the United States to address GHG emissions from vehicles. The law requires the California Air Resources Board to regulate GHGs as part of the California Low Emission Vehicle Program. The GHG reductions from this law will be achieved largely through improved fuel efficiency, making these standards, to a large degree, energy efficiency policies. In 2010, the EPA and the Department of Transportation (DOT) issued harmonized national standards for fuel economy and GHG emissions for model years 2012–2016. The standards match California’s GHG tailpipe standards in stringency and call for fleet-wide average fuel economy of 34.1 miles per gallon (mpg) by 2016. In 2012, the California Air Resources Board adopted new GHG standards for model years 2017–2025. The DOT and EPA subsequently finalized new GHG and fuel economy standards as well, calling for a fleet-wide GHG emissions average of 54.5 mpg by 2025. The three programs are now harmonized. As the federal programs undergo a midterm evaluation between 2016 and 2018, the commitment of California and other states that have adopted California’s program to reducing vehicle GHG emissions will be important in maintaining the strength of the standards, because automakers strongly prefer a single, national program. California has also updated its ZEV program, requiring an increase in production of plug-in hybrid, battery electric, and fuel-cell vehicles from 2018–2025. The program requires automakers to produce ZEVs to reduce GHG and criteria pollutant emissions. Manufacturers of passenger cars and light trucks (up to 8,500 pounds) must earn a certain number of ZEV credits by meeting state requirements that outline the number of ZEVs that they must produce and deliver for sale (C2ES 2016).
States may choose to adopt either the federal vehicle emissions standards or California’s. Fifteen states and the District of Columbia have adopted California’s GHG regulations in recent years, but Arizona and Florida repealed their programs in 2012. The states that continue to honor the California standards include Connecticut, Delaware, the District of Columbia, Maine, Maryland, Massachusetts, New Jersey, New York, Oregon, Pennsylvania, Rhode Island, Vermont, and Washington (Clean Cars Campaign 2016). Nine other states and the District of Columbia have adopted California’s ZEV requirements (C2ES 2016).
Electric Vehicle Registrations
As more EVs become available to drivers, states can help remove the barriers to their widespread adoption. In addition to reducing the high up-front costs of these vehicles, states can provide incentives for the construction of the required fueling infrastructure. Additionally, nonfinancial benefits—such as emissions testing exemptions—make it more convenient to own an EV. The total number of EV registrations helps track the successful uptake of electric vehicles in a given state.
EMBARGOED
TRANSPORTATION 2016 STATE SCORECARD © ACEEE
59
Incentives for High-Efficiency Vehicles
High purchase cost is a barrier to the entry of fuel-efficient vehicles into the marketplace because these vehicles contain new, advanced technologies. To encourage consumers to purchase fuel-efficient vehicles, states may offer a number of financial incentives, including tax credits, rebates, and sales tax exemptions. Several states offer tax incentives to purchasers of alternative-fuel vehicles—including those that run on compressed natural gas, ethanol, propane, or electricity—and in some cases to purchasers of hybrid vehicles (electric or hydraulic). Although alternative-fuel vehicles can provide environmental benefits by reducing pollution, they do not necessarily increase fuel efficiency, and we did not include policies to promote their purchase in the State Scorecard. However we do include incentives for EVs and hybrids, which do have high fuel efficiency. With the arrival of a wide range of plug-in vehicles in recent years, tax credits for electric and hybrid vehicles are playing an important role in spurring their adoption.
We also did not give credit for incentives for the use of high-occupancy vehicle lanes and preferred parking programs for high-efficiency vehicles, as they promote increased vehicle use and consequently have questionable net energy benefits.
Vehicle Miles Traveled (VMT) Reduction Targets and VMT Growth
Improved vehicle fuel economy will not adequately address energy use in the transportation sector in the long term if growth in total VMT goes unchecked. EIA predicts a 13% increase in light-duty VMT between now and 2030, which is lower than previous EIA estimates but which still outpaces anticipated US population growth (EIA 2016a). Demographic changes, increased availability of services based on information and communications technology, and rising mode shares for public transit, biking, and walking after years of decline could sustain a reduced growth rate in VMT into the future relative to business as usual (Dutzik and Baxandall 2013).
Reducing VMT growth is key to managing transportation energy use. Several states have taken on this challenge by setting VMT reduction targets. Success in achieving these targets requires the coordination of transportation and land use planning.
Integration of Policies for Land Use and Transportation Planning
Sound land use planning is vital to supporting alternatives to driving in the United States. Successful strategies vary among states due to differences in their infrastructure, geography, and political environment; however all states benefit from incorporating core principles of smart growth into their comprehensive plans. Energy-efficient transport integrates transportation and land use policies. For a state to reduce fuel use through transportation system efficiency, it must address land use and transportation considerations simultaneously. Such approaches include measures that encourage the provision of
Transit-oriented development, including mixed land uses (mix of jobs, stores, and housing) and good street connectivity to make neighborhoods friendly to all modes of transportation
Areas of compact development
Convenient modes of transportation that provide alternatives to automobiles
Centers of activity where popular destinations are close together

EMBARGOED
TRANSPORTATION 2016 STATE SCORECARD © ACEEE
60
Complete Streets Policies
Complete streets policies focus on street connectivity and aim to create safe, easy access to roads for all pedestrians, bicyclists, motorists, and public transportation users. Complete streets foster increased use of alternatives to driving and have a significant impact on a state’s fuel consumption. According to the National Complete Streets Coalition, modest increases in biking and walking could save 2.4 billion gallons of fuel annually across the country (NCSC 2012). A complete streets policy directs states’ transportation agencies to evaluate and incorporate complete streets principles and tasks transportation planners with ensuring that all roadway infrastructure projects allow for equitable access to and use of those roadways.
State Transit Funding
While states receive some federal funds for public transit, a significant proportion of transit funding comes from state budgets. A state’s investment in public transit is a key indicator of its interest in promoting energy-efficient modes of transportation, although realizing the potential for energy savings through transit typically requires land use changes that create denser, more mixed-use communities as well.
Dedicated Transit Revenue Streams
As states find themselves faced with increasingly uncertain federal funding streams and federal transportation policies that remain highway-focused, many have taken the lead in finding dedicated funding sources for long-term public transit expenditures. To generate a sustainable stream of capital and operating funds, a number of states have adopted legislation that identifies specific sources of funding for public transit. For instance, in 2010, New York passed Assembly Bill 8180, which directs certain vehicle registration and renewal fees toward public transportation. This metric lets us track state-level progress that is not represented in the time-lagged state transit funding data described above.
Freight
Many states have freight transportation plans in place. The 2012 federal transportation funding authorization bill, MAP-21, contained a number of new freight provisions. States were eligible for an increased share of federal funding for freight projects that (1) were shown to contribute to the efficient movement of freight and (2) were identified in the state freight plan. Thus, MAP-21 effectively encouraged states to develop and adopt freight plans. However it did not promote saving energy through these plans (MAP-21 2012).
Adopted in 2015, the FAST Act superseded MAP-21, requiring states to develop freight plans that include both immediate and long-range planning activities in order to receive federal funds. Plans must be complete by October 2017. Additionally, FAST creates a separate pot of money for intermodal and rail freight projects. Each state is allowed to set aside up to 10% of federally awarded funds for eligible nonhighway projects (FAST 2015).
These freight plans can be further strengthened by adopting concrete targets or performance measures that establish energy efficiency as a priority for good movement. Such measures will involve tracking and reporting the energy efficiency of freight movement in the state as a whole, and they will encourage the use of energy efficiency as a criterion for selecting or evaluating freight projects. States could formulate these performance targets in terms of
EMBARGOED
TRANSPORTATION 2016 STATE SCORECARD © ACEEE
61
gallons per ton-mile of freight moved, for example, and targets should reflect performance across all freight modes. Closely related performance measures—such as grams of GHG emitted per ton-mile of freight—are also eligible for points under this metric.
Leading and Trending States: Transportation Policies
California. California is the clear leader in the transportation sector. As part of its plans to
implement AB 32, which requires a 25% reduction of 1990 GHG emission levels by 2020,
California has identified several strategies for smart growth and VMT reduction. In 2008, the state
passed SB 375, which required the California Air Resources Board to develop regional
transportation-specific GHG reduction goals in collaboration with metropolitan planning
organizations. The board finalized targets in 2011, recommending a 5–8% reduction in vehicle-
associated GHG emissions by 2020 for the state’s four largest metropolitan planning
organizations. These goals must be reflected in regional transportation plans that create compact,
sustainable development across the state and thus reduce VMT growth.
Between 2005 and 2007, California adopted the Goods Management Action Plan (GMAP)
emphasizing energy efficiency in goods movement. In 2014, the state created the California
Freight Mobility Plan (CFMP), which it structured to address all of the MAP-21 national goals
including GHG emissions reductions. On the vehicle efficiency side, California passed AB 118 in
2009, providing a voucher program for the incremental cost of purchasing hybrid medium- and
heavy-duty trucks. Vouchers range from $6,000 to $45,000. The state also offers tax rebates of
up to $2,500 for light-duty zero-emission EVs and plug-in hybrid EVs on a first-come, first-served
basis, effective until 2023.
Massachusetts. Like California, Massachusetts has long been a leader on the transportation front.
The state is dedicated to encouraging compact, transit-oriented development through a number of
measures. The Massachusetts 40R program provides financial incentives for the use of zoning
overlays that promote smart growth development in cities and municipalities. The state also has a
GHG reduction target that aims to reduce transportation emissions by 2 million tons by 2020, as
well as a comprehensive complete streets statute that incorporates pedestrian and bicycle travel
in all road construction projects.
To continue curbing emissions and energy consumption in the transportation sector,
Massachusetts adopted the California ZEV program to encourage the adoption of electric vehicles.
With approximately 95 electric vehicles registered per 100,000 residents, the state is making
steady progress in promoting electric vehicles as a viable option for drivers.
New York. New York has steadily moved up the ranks in recent years through its strong efforts in
transportation efficiency. On the vehicle efficiency side, New York signed a 2013 memorandum of
understanding with seven other states to put a combined 3.3 million ZEVs on the road by 2025.
This action supplements the California low-emission vehicle emissions standards that New York
adopted in 2005.
The state has also made a number of changes to improve system efficiency. New York is one of
the few states in the nation to have a concrete VMT reduction target. A goal set in 2008 calls for a
10% reduction in 10 years. With one of the highest transit ridership rates in the country, the state
passed Assembly Bill 8180 in 2010, directing a portion of vehicle registration and license renewal
fees to public transportation. The bill also created the Metropolitan Transit Authority Financial
Assistance Fund to support subway, bus, and rail services and capital improvements. In 2011,
New York adopted a new complete streets policy aimed at providing accessibility for multiple
modes of transport.
EMBARGOED
TRANSPORTATION 2016 STATE SCORECARD © ACEEE
62
Leading and Trending States: Transportation Policies (continued)
Oregon. Oregon has made steady progress toward reducing its fuel consumption and VMT in
recent years. In 2011, the state adopted transportation-specific GHG reduction goals for six of its
largest metropolitan areas; the goals call for a 17–21% reduction of 2005 levels by 2035. In
combination with a stringent growth management act, these new goals have helped move Oregon
toward the top of the rankings in this policy area.
The state also passed HB 2186 in 2009, calling for all metropolitan planning organizations to
create a GHG emissions task force. These task forces look for alternative land use and
transportation planning scenarios to meet community growth needs while reducing GHG emissions
across the state. Oregon is also one of the first states to pass legislation for a VMT fee program. In
an effort to reduce the overall number of miles driven, this voluntary program charges drivers a 1.5
cent-per-mile fee in lieu of the state’s 30 cent-per-gallon gas tax.
Washington. Washington has long been a leader in integrating land use and transportation
planning to reduce fuel consumption and VMT. The state introduced the Growth Management Act
in 1990 in an early attempt to curb suburban sprawl amid rapid population growth. Washington
also has an aggressive VMT reduction target, which calls for a 50% reduction in VMT per capita by
2050 relative to 1990 levels. In 2011, the state passed a complete streets law to encourage
walkable, multimodal communities. In 2012, the state legislature adopted House Bill 2660,
providing grants to public transit agencies to preserve transit service in the state.
EMBARGOED
BUILDING CODES 2016 STATE SCORECARD © ACEEE
63
Chapter 4. Building Energy Codes
Authors: Weston Berg and Mary Shoemaker
INTRODUCTION
Buildings consume 74% of the electricity and 41% of the total energy used in the United States, and they account for 40% of US carbon dioxide emissions (DOE 2012). This makes buildings an essential target for energy savings. However, because buildings have long lifetimes and are not easily retrofitted, encouraging building efficiency measures during construction is a practical way to reduce building energy consumption. Mandatory building energy codes are one way to target energy efficiency by legally requiring a minimum level of energy efficiency for new residential and commercial buildings.
Code Adoption
In 1978, California enacted the first statewide building energy code in its Title 24 Building Standard. Several states (including Florida, New York, Minnesota, Oregon, and Washington) followed with state-developed codes in the 1980s. During the 1980s and 1990s, the International Code Council® (ICC) and its predecessor code development organizations developed the Model Energy Code (MEC), later renamed the International Energy Conservation Code® (IECC). Today, most states use a version of the IECC for their residential buildings.
Many commercial building codes are based on ASHRAE 90.1 standards, jointly developed by ASHRAE and the Illuminating Engineering Society (IES). The IECC commercial building provisions include prescriptive and performance requirements that largely coincide with ASHRAE 90.1 requirements. DOE’s most recent analysis of commercial codes found IECC 2015 and ASHRAE 90.1-2013 to be similar in terms of stringency (Zhang et al. 2015).
With the publication of each new edition of the IECC and ASHRAE standards, DOE issues determinations on the codes that ascertain their relative impact when compared with older standards and, if justified, establish the latest iteration as the base code with which all states must comply. Within two years of the final determination, states are required to send letters certifying their compliance, requesting an extension, or explaining their decision not to comply.
The most recent IECC and ASHRAE code versions for which DOE has issued energy-saving determinations are ASHRAE 90.1-2013 and the 2015 IECC standards. DOE determinations for these standards are relatively new, finalized in September 2014 for ASHRAE 90.1-2013 and in June 2015 for the 2015 IECC standard. In 2014 DOE reported that ASHRAE 90.1-2013 generates 7.6% greater site energy savings than ASHRAE 90.1-2010. For the most recent residential code update (from 2012 to 2015), the difference is much smaller. The 2015 IECC achieves about 1% greater site energy savings than the 2012 IECC (DOE 2016b). States are required to file commercial code certification statements with DOE by September 2016 and residential certification statements by June 2017. Stakeholder discussions for the development of the 2018 IECC are ongoing in 2016.
Stimulus funding provided through the DOE State Energy Program under ARRA spurred the majority of states to adopt at least the 2009 IECC and ASHRAE 90.1-2007 standards. ARRA required that each of the 50 states accepting stimulus funding for code
EMBARGOED
BUILDING CODES 2016 STATE SCORECARD © ACEEE
64
implementation and compliance implement a plan to achieve compliance with these codes in 90% of new and renovated residential and commercial building space by 2017.
Code Compliance
Robust implementation and enforcement are necessary to ensure that states will reap the benefits of adopted codes. A support network that includes DOE, the Pacific Northwest National Laboratory (PNNL), the Building Codes Assistance Project (BCAP), and a variety of other local, regional, and national stakeholder groups provides advocacy, technical training, and educational resources in an effort to help states and communities reach their compliance goals.
DOE provides many resources to help guide states in code compliance efforts. In addition to funding compliance activities in many states through grants, DOE provides technical assistance—such as model adoption policies, compliance software, and training modules—through its Building Energy Codes Program. Among its most recent efforts is an ongoing three-year Residential Energy Code Field Study in eight states that seeks to establish baseline energy use and determine the degree to which investment in building energy code education, training, and outreach programs can produce a significant, measurable change in residential building energy savings (DOE 2016d).
BCAP is a nonprofit advocacy organization that works closely with states to facilitate compliance with building codes. With support from the DOE’s National Energy Technology Laboratory, BCAP’s Compliance Planning Assistance (CPA) program helps states conduct gap analysis reports to assess and address gaps in state energy code infrastructure; it also helps them develop strategic compliance plans that establish targeted near- and long-term actions to achieve full energy code compliance. A variety of methods exist to increase compliance with building codes, many of which are promoted and facilitated by BCAP. Along with the CPA program, BCAP has been working with the National Association of State Energy Officials (NASEO) and the Northwest Energy Efficiency Alliance (NEEA) to promote energy code compliance collaboratives. The collaboratives consist of stakeholders groups that explore how best to promote adoption of and compliance with energy codes, including through education, training, key messaging, and advocacy.
Six regional energy efficiency organizations also work closely and collaboratively within their states, and with each other, to coordinate code-related activities to support adoption and compliance efforts.44
In addition to these regional and national efforts, states can take other measures to support code compliance. These include
44 The six regional energy efficiency organizations are Northeast Energy Efficiency Partnerships (NEEP), the
Southeast Energy Efficiency Alliance (SEEA), the Midwest Energy Efficiency Alliance (MEEA), South-Central Partnership for Energy Efficiency as a Resource (SPEER), the Southwest Energy Efficiency Project (SWEEP), and the Northwest Energy Efficiency Alliance (NEEA). These organizations cover all states except California, Hawaii, and Alaska.

EMBARGOED
BUILDING CODES 2016 STATE SCORECARD © ACEEE
65
Providing and supporting training programs and outreach for code compliance in order to increase the number and effectiveness of contractors and code officials that monitor and evaluate compliance
Conducting a study—preferably every five years—to determine actual rates of energy code compliance, identify compliance patterns, and create protocols for measuring compliance and developing best-practice training programs
Establishing a system through which utilities are encouraged to support code compliance
Utilities can promote compliance with state and local building codes in a number of ways (Misuriello et al. 2012). Many utilities across the country offer energy efficiency programs that target new construction. In several states that have passed EERS policies, programs have been established that allow utilities to claim savings for code enhancement activities, both for adoption and for compliance. Utilities can fund and administer training and certification programs, assist local jurisdictions with implementing tools that streamline enforcement, provide funding for purchasing diagnostic equipment, and assist with compliance evaluation. They also can combine code compliance efforts with efforts to improve energy efficiency beyond code requirements. To encourage utilities to participate, prudent regulatory mechanisms, such as program cost recovery or shared savings policies, must be in place to compensate them for their efforts.
METHODOLOGY
Our review of state building energy code stringency is based predominantly on publicly available information, such as that provided by the Online Code Environment and Advocacy Network (OCEAN), which maintains maps and state overviews of building energy codes, as well as by the DOE Building Energy Codes Program and the expert knowledge of several individuals who are active in state building energy code policy and evaluation. Because OCEAN and the DOE might not capture very recent code adoptions, we also rely on primary data collection. We distributed a data request to energy offices and knowledgeable officials in each state, requesting information on their efforts to measure and enforce code compliance.
SCORING AND RESULTS
States earned credit on two measures of building energy codes: the stringency of residential and commercial codes, and the level of efforts to support code compliance. We awarded points as follows:
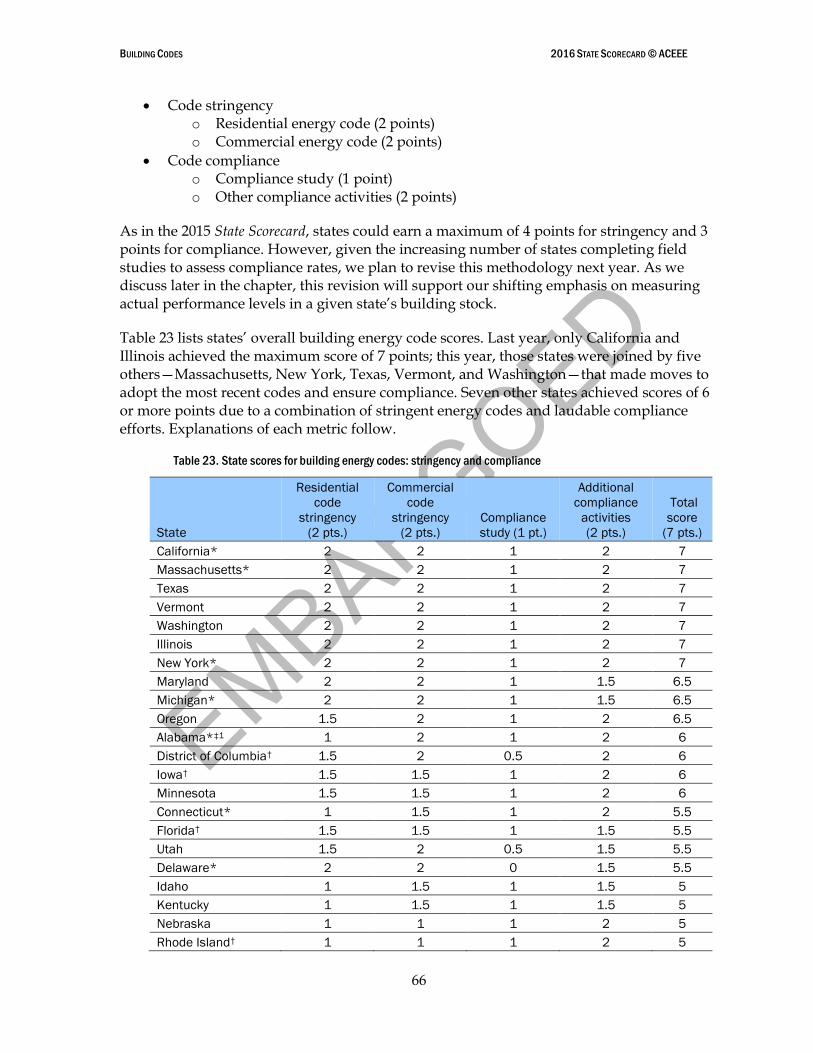
EMBARGOED
BUILDING CODES 2016 STATE SCORECARD © ACEEE
66
Code stringency o Residential energy code (2 points) o Commercial energy code (2 points)
Code compliance o Compliance study (1 point) o Other compliance activities (2 points)
As in the 2015 State Scorecard, states could earn a maximum of 4 points for stringency and 3 points for compliance. However, given the increasing number of states completing field studies to assess compliance rates, we plan to revise this methodology next year. As we discuss later in the chapter, this revision will support our shifting emphasis on measuring actual performance levels in a given state’s building stock.
Table 23 lists states’ overall building energy code scores. Last year, only California and Illinois achieved the maximum score of 7 points; this year, those states were joined by five others—Massachusetts, New York, Texas, Vermont, and Washington—that made moves to adopt the most recent codes and ensure compliance. Seven other states achieved scores of 6 or more points due to a combination of stringent energy codes and laudable compliance efforts. Explanations of each metric follow.
Table 23. State scores for building energy codes: stringency and compliance
State
Residential
code
stringency
(2 pts.)
Commercial
code
stringency
(2 pts.)
Compliance
study (1 pt.)
Additional
compliance
activities
(2 pts.)
Total
score
(7 pts.)
California* 2 2 1 2 7
Massachusetts* 2 2 1 2 7
Texas 2 2 1 2 7
Vermont 2 2 1 2 7
Washington 2 2 1 2 7
Illinois 2 2 1 2 7
New York* 2 2 1 2 7
Maryland 2 2 1 1.5 6.5
Michigan* 2 2 1 1.5 6.5
Oregon 1.5 2 1 2 6.5
Alabama*‡1 1 2 1 2 6
District of Columbia† 1.5 2 0.5 2 6
Iowa† 1.5 1.5 1 2 6
Minnesota 1.5 1.5 1 2 6
Connecticut* 1 1.5 1 2 5.5
Florida† 1.5 1.5 1 1.5 5.5
Utah 1.5 2 0.5 1.5 5.5
Delaware* 2 2 0 1.5 5.5
Idaho 1 1.5 1 1.5 5
Kentucky 1 1.5 1 1.5 5
Nebraska 1 1 1 2 5
Rhode Island† 1 1 1 2 5
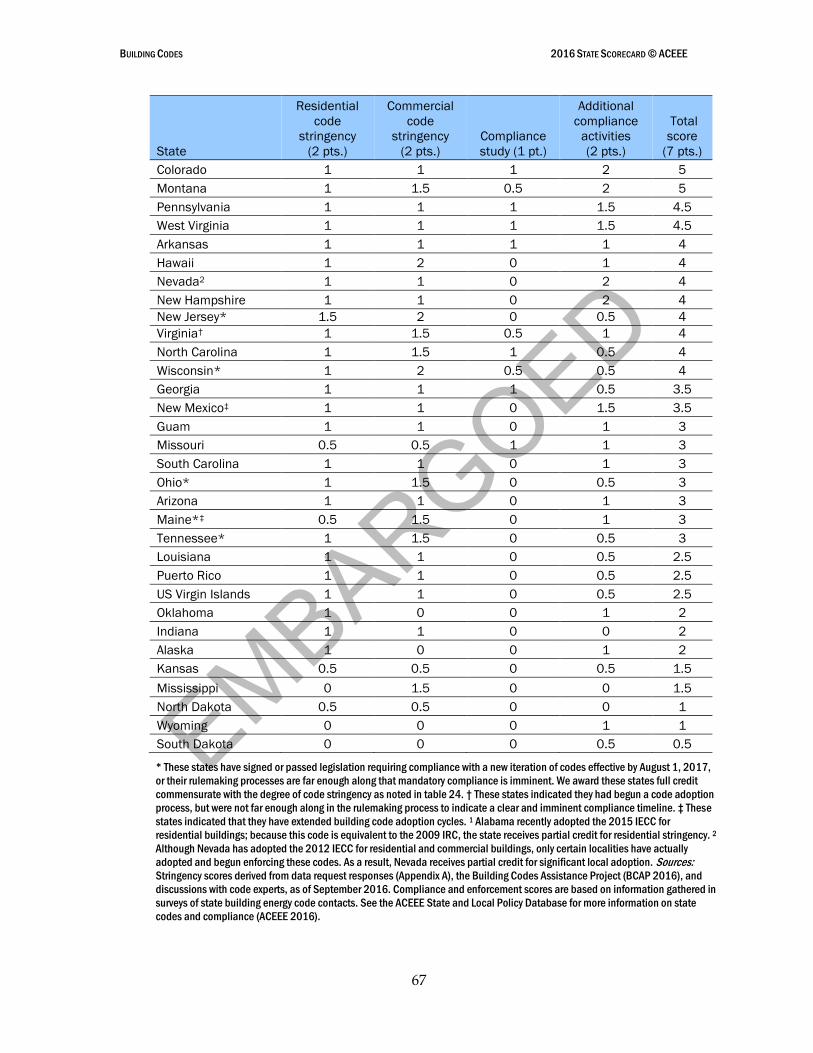
EMBARGOED
BUILDING CODES 2016 STATE SCORECARD © ACEEE
67
State
Residential
code
stringency
(2 pts.)
Commercial
code
stringency
(2 pts.)
Compliance
study (1 pt.)
Additional
compliance
activities
(2 pts.)
Total
score
(7 pts.)
Colorado 1 1 1 2 5
Montana 1 1.5 0.5 2 5
Pennsylvania 1 1 1 1.5 4.5
West Virginia 1 1 1 1.5 4.5
Arkansas 1 1 1 1 4
Hawaii 1 2 0 1 4
Nevada2 1 1 0 2 4
New Hampshire 1 1 0 2 4
New Jersey* 1.5 2 0 0.5 4
Virginia† 1 1.5 0.5 1 4
North Carolina 1 1.5 1 0.5 4
Wisconsin* 1 2 0.5 0.5 4
Georgia 1 1 1 0.5 3.5
New Mexico‡ 1 1 0 1.5 3.5
Guam 1 1 0 1 3
Missouri 0.5 0.5 1 1 3
South Carolina 1 1 0 1 3
Ohio* 1 1.5 0 0.5 3
Arizona 1 1 0 1 3
Maine*‡ 0.5 1.5 0 1 3
Tennessee* 1 1.5 0 0.5 3
Louisiana 1 1 0 0.5 2.5
Puerto Rico 1 1 0 0.5 2.5
US Virgin Islands 1 1 0 0.5 2.5
Oklahoma 1 0 0 1 2
Indiana 1 1 0 0 2
Alaska 1 0 0 1 2
Kansas 0.5 0.5 0 0.5 1.5
Mississippi 0 1.5 0 0 1.5
North Dakota 0.5 0.5 0 0 1
Wyoming 0 0 0 1 1
South Dakota 0 0 0 0.5 0.5
* These states have signed or passed legislation requiring compliance with a new iteration of codes effective by August 1, 2017,
or their rulemaking processes are far enough along that mandatory compliance is imminent. We award these states full credit
commensurate with the degree of code stringency as noted in table 24. † These states indicated they had begun a code adoption
process, but were not far enough along in the rulemaking process to indicate a clear and imminent compliance timeline. ‡ These
states indicated that they have extended building code adoption cycles. 1 Alabama recently adopted the 2015 IECC for
residential buildings; because this code is equivalent to the 2009 IRC, the state receives partial credit for residential stringency. 2
Although Nevada has adopted the 2012 IECC for residential and commercial buildings, only certain localities have actually
adopted and begun enforcing these codes. As a result, Nevada receives partial credit for significant local adoption. Sources: Stringency scores derived from data request responses (Appendix A), the Building Codes Assistance Project (BCAP 2016), and
discussions with code experts, as of September 2016. Compliance and enforcement scores are based on information gathered in
surveys of state building energy code contacts. See the ACEEE State and Local Policy Database for more information on state
codes and compliance (ACEEE 2016).
EMBARGOED
BUILDING CODES 2016 STATE SCORECARD © ACEEE
68
DISCUSSION
Stringency
We assigned each state a score of 0 to 2 points each for residential and for commercial building energy codes, with 2 being assigned to the most stringent codes, for a total of 4 possible points for building code stringency. Although the most recent iteration of the residential IECC delivers only slightly more energy savings than the 2012 IECC, we nonetheless awarded full points only to states that have adopted this code because there is value in maintaining a continual code updating and adoption process. For detailed information on building code stringency in each state, visit ACEEE’s State and Local Policy Database.
Stimulus funding provided through the DOE State Energy Program under ARRA spurred the majority of states to adopt at least the 2009 IECC and ASHRAE 90.1-2007 standards. ARRA required that each of the 50 states accepting stimulus funding for code implementation and compliance implement a plan to achieve compliance with these codes in 90% of new and renovated residential and commercial building space by 2017.
This year, we updated our stringency scoring methodology for states that have yet to adopt, or demonstrate significant local adoption of, the 2009 IECC and ASHRAE 90.1-2007 codes for residential and commercial construction, respectively. Given ARRA’s imminent 2017 deadline for 90% compliance, we did not award points to states with codes less stringent than these standards.
We have not limited State Scorecard credit to codes that have already become effective. A handful of states are still in the process of updating their building energy codes, and we awarded full credit (commensurate with the degree of code stringency) to those states that have exhibited progress and show a clear path leading to code adoption and implementation within the next year (by August 1, 2017). In table 23, we asterisked the states with a clear path toward adoption and implementation and awarded them full credit. Other states have begun the process of updating their codes, but have yet to demonstrate a clear path toward adoption with a definitive implementation date. Although we did not award these states full credit, it is important to note that they have begun the process and are moving along. Table 23 denotes these states with a dagger symbol; table 24 offers more details.
We also awarded credit to states that demonstrated significant local adoption of building energy codes, as an alternative to a statewide requirement. Many home-rule states—such as Arizona, Colorado, Kansas, and Missouri—adopt and enforce building energy codes at the local level.45 We have not developed a quantitative method for comparing the interstate impact of jurisdictional code adoptions, in part because of a lack of consistent data across states. We recognize that our methodology is limited, and we do not intend to dismiss this local progress by assigning a lower score to these states. Within Arizona, for example, 54 of the 100 code-adopting jurisdictions have enacted the IECC 2009 or better, according to the
45 Home rule decentralizes power, allowing a locality to exercise certain powers of governance within its own
administrative area. See database.aceee.org for more information on building codes in home-rule states.
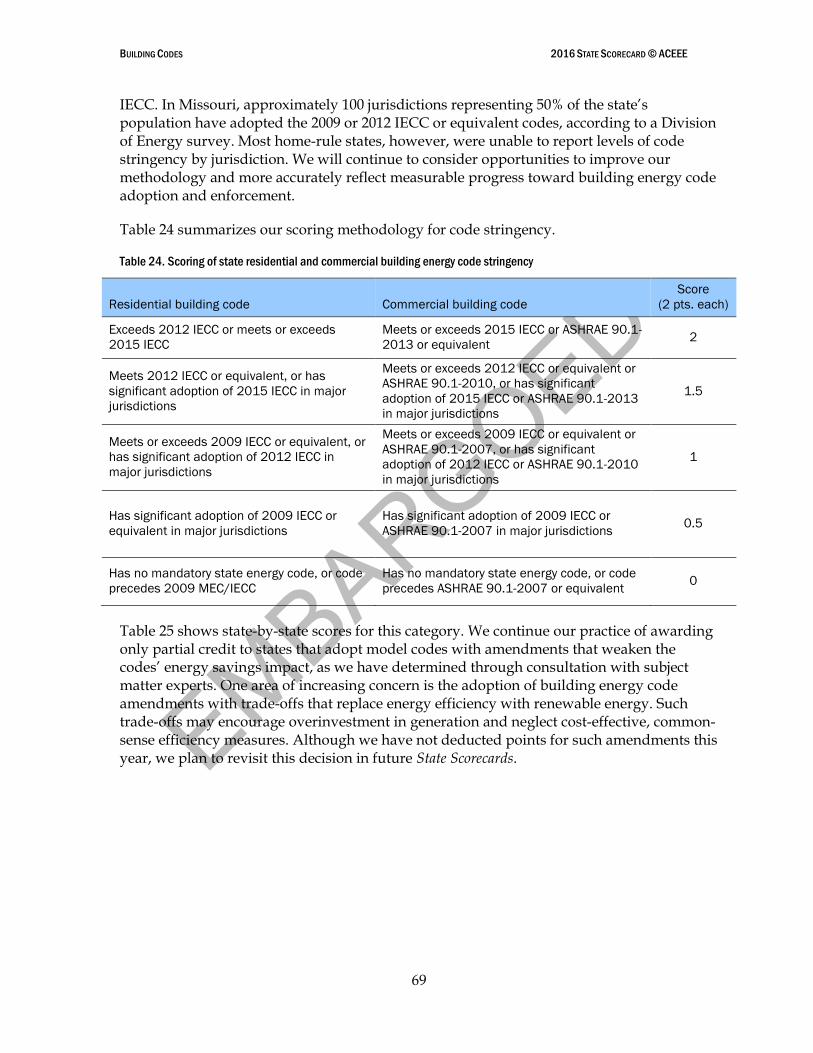
EMBARGOED
BUILDING CODES 2016 STATE SCORECARD © ACEEE
69
IECC. In Missouri, approximately 100 jurisdictions representing 50% of the state’s population have adopted the 2009 or 2012 IECC or equivalent codes, according to a Division of Energy survey. Most home-rule states, however, were unable to report levels of code stringency by jurisdiction. We will continue to consider opportunities to improve our methodology and more accurately reflect measurable progress toward building energy code adoption and enforcement.
Table 24 summarizes our scoring methodology for code stringency.
Table 24. Scoring of state residential and commercial building energy code stringency
Residential building code Commercial building code
Score
(2 pts. each)
Exceeds 2012 IECC or meets or exceeds
2015 IECC
Meets or exceeds 2015 IECC or ASHRAE 90.1-
2013 or equivalent 2
Meets 2012 IECC or equivalent, or has
significant adoption of 2015 IECC in major
jurisdictions
Meets or exceeds 2012 IECC or equivalent or
ASHRAE 90.1-2010, or has significant
adoption of 2015 IECC or ASHRAE 90.1-2013
in major jurisdictions
1.5
Meets or exceeds 2009 IECC or equivalent, or
has significant adoption of 2012 IECC in
major jurisdictions
Meets or exceeds 2009 IECC or equivalent or
ASHRAE 90.1-2007, or has significant
adoption of 2012 IECC or ASHRAE 90.1-2010
in major jurisdictions
1
Has significant adoption of 2009 IECC or
equivalent in major jurisdictions
Has significant adoption of 2009 IECC or
ASHRAE 90.1-2007 in major jurisdictions 0.5
Has no mandatory state energy code, or code
precedes 2009 MEC/IECC
Has no mandatory state energy code, or code
precedes ASHRAE 90.1-2007 or equivalent 0
Table 25 shows state-by-state scores for this category. We continue our practice of awarding only partial credit to states that adopt model codes with amendments that weaken the codes’ energy savings impact, as we have determined through consultation with subject matter experts. One area of increasing concern is the adoption of building energy code amendments with trade-offs that replace energy efficiency with renewable energy. Such trade-offs may encourage overinvestment in generation and neglect cost-effective, common-sense efficiency measures. Although we have not deducted points for such amendments this year, we plan to revisit this decision in future State Scorecards.

EMBARGOED
BUILDING CODES 2016 STATE SCORECARD © ACEEE
70
Table 25. State scores for code stringency
State
Res.
score
(2 pts.)
Residential code description
Com.
score
(2 pts.)
Commercial code description
Total
score
(4 pts.)
California 2
The 2013 Building Energy
Efficiency Standards, effective
July 1, 2014, are mandatory
statewide and exceed the 2012
IECC standards for residential
buildings. The 2016 Standards
adopted in June 2015 and
effective January 1, 2017, are
expected to exceed the 2015
IECC standards for residential
buildings.
2
The 2013 Building Energy Efficiency
Standards, effective July 1, 2014, are
mandatory statewide and exceed
ASHRAE/IESNA 90.1-2010 for
commercial buildings. The 2016
Building Energy Efficiency Standards,
adopted in June 2015 and effective
January 1, 2017, are expected to
exceed ASHRAE/IESNA 90.1-2013 for
commercial buildings.
4
Illinois 2 2015 IECC 2
The commercial provisions of the 2015
IECC or ASHRAE 90.1-2013 Standard
are equivalent and acceptable paths to
compliance.
4
Maryland 2 2015 IECC 2 2015 IECC 4
Massachusetts 2 2015 IECC with strengthening
amendments 2
In the process of adopting the IECC
2015 and ASHRAE standard 90.1-2013
as part of the ninth edition MA building
code
4
New York 2 2015 IECC, effective October 3,
2016 2
2015 IECC/ASHRAE 90.1-2013,
effective October 3, 2016 4
Texas 2
2015 IRC for single family
(effective September 1, 2016)
and 2015 IECC for all other
residential buildings (effective
November 1, 2016)
2
2015 IECC (effective November 1,
2016); ASHRAE 90.1-2013 for state-
funded buildings (effective June 1,
2016)
4
Vermont 2 2015 IECC 2 2015 IECC with ASHRAE 90.1-2013 as
alternative compliance path 4
Washington 2 2015 IECC 2 2015 IECC/ASHRAE 90.1-2013 4
Delaware 2
2012 IECC; currently reviewing
2015 IECC, with adoption
expected by May 2017
2
ASHRAE 90.1-2010; currently reviewing
ASHRAE 90.1-2013, with adoption
expected by May 2017
4
Michigan 2 2015 IECC (effective February
2016) 2
The state recently approved draft rules
with reference to ASHRAE 90.1-2013.
New codes are estimated to be
effective June 2017.
4
New Jersey 1.5 2015 IECC with a significantly
weakening amendment 2 ASHRAE 90.1-2013 3.5
District of
Columbia 1.5
The 2013 DC Construction Code
references 2012 IECC; DC has
begun reviewing 2015 codes.
2
The 2013 DC Construction Code
includes not only the 2012 IECC and
ASHRAE 90.1-2010, but also the 2012
International Green Construction Code.
DC has begun reviewing 2015 codes.
3.5
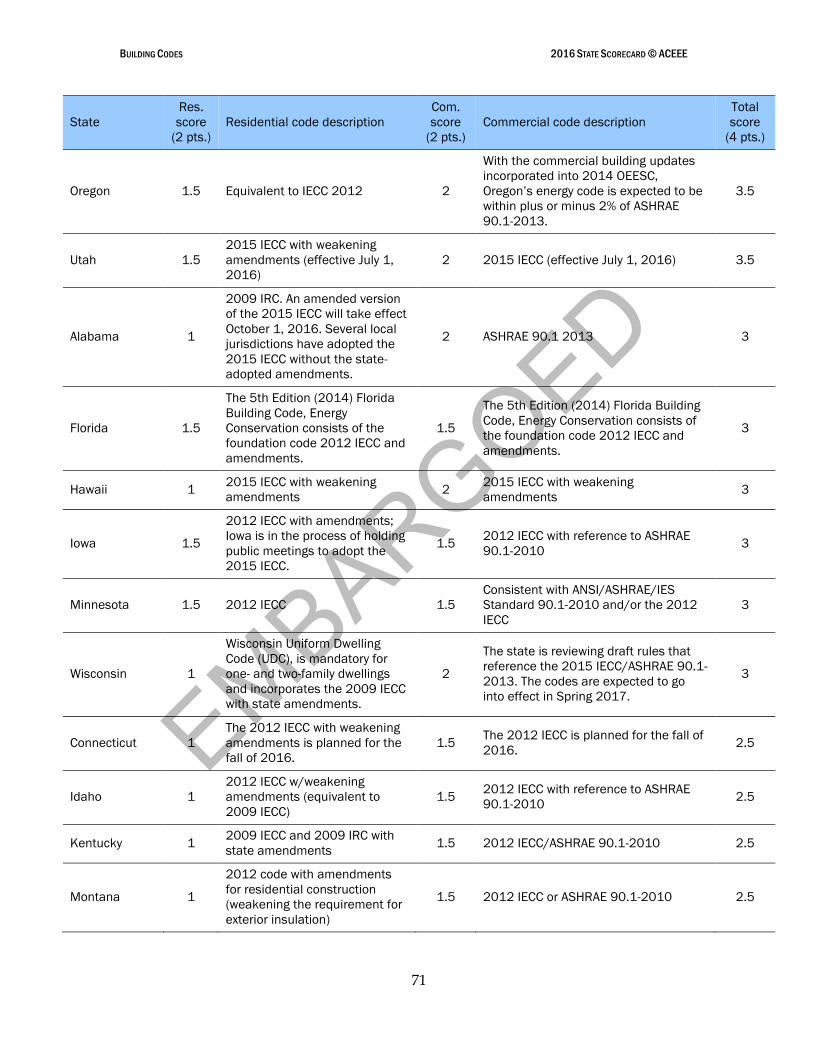
EMBARGOED
BUILDING CODES 2016 STATE SCORECARD © ACEEE
71
State
Res.
score
(2 pts.)
Residential code description
Com.
score
(2 pts.)
Commercial code description
Total
score
(4 pts.)
Oregon 1.5 Equivalent to IECC 2012 2
With the commercial building updates
incorporated into 2014 OEESC,
Oregon’s energy code is expected to be
within plus or minus 2% of ASHRAE
90.1-2013.
3.5
Utah 1.5
2015 IECC with weakening
amendments (effective July 1,
2016)
2 2015 IECC (effective July 1, 2016) 3.5
Alabama 1
2009 IRC. An amended version
of the 2015 IECC will take effect
October 1, 2016. Several local
jurisdictions have adopted the
2015 IECC without the state-
adopted amendments.
2 ASHRAE 90.1 2013 3
Florida 1.5
The 5th Edition (2014) Florida
Building Code, Energy
Conservation consists of the
foundation code 2012 IECC and
amendments.
1.5
The 5th Edition (2014) Florida Building
Code, Energy Conservation consists of
the foundation code 2012 IECC and
amendments.
3
Hawaii 1 2015 IECC with weakening
amendments 2
2015 IECC with weakening
amendments 3
Iowa 1.5
2012 IECC with amendments;
Iowa is in the process of holding
public meetings to adopt the
2015 IECC.
1.5 2012 IECC with reference to ASHRAE
90.1-2010 3
Minnesota 1.5 2012 IECC 1.5
Consistent with ANSI/ASHRAE/IES
Standard 90.1-2010 and/or the 2012
IECC
3
Wisconsin 1
Wisconsin Uniform Dwelling
Code (UDC), is mandatory for
one- and two-family dwellings
and incorporates the 2009 IECC
with state amendments.
2
The state is reviewing draft rules that
reference the 2015 IECC/ASHRAE 90.1-
2013. The codes are expected to go
into effect in Spring 2017.
3
Connecticut 1
The 2012 IECC with weakening
amendments is planned for the
fall of 2016.
1.5 The 2012 IECC is planned for the fall of
2016. 2.5
Idaho 1
2012 IECC w/weakening
amendments (equivalent to
2009 IECC)
1.5 2012 IECC with reference to ASHRAE
90.1-2010 2.5
Kentucky 1 2009 IECC and 2009 IRC with
state amendments 1.5 2012 IECC/ASHRAE 90.1-2010 2.5
Montana 1
2012 code with amendments
for residential construction
(weakening the requirement for
exterior insulation)
1.5 2012 IECC or ASHRAE 90.1-2010 2.5
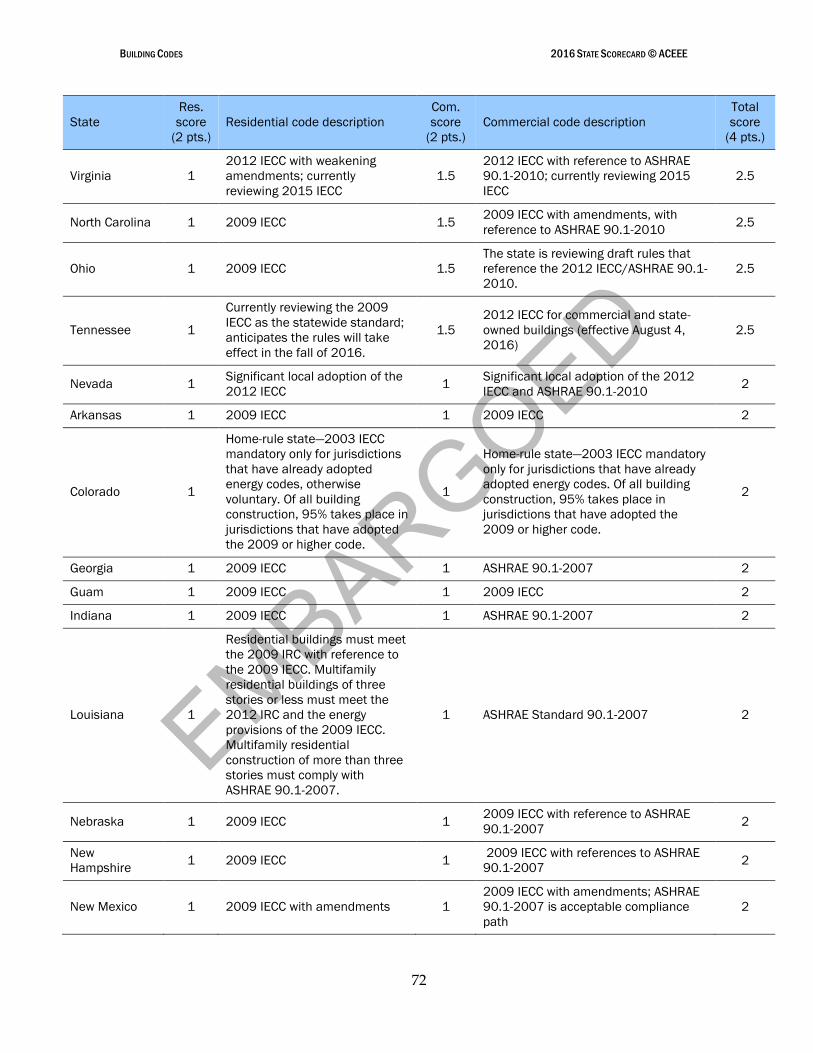
EMBARGOED
BUILDING CODES 2016 STATE SCORECARD © ACEEE
72
State
Res.
score
(2 pts.)
Residential code description
Com.
score
(2 pts.)
Commercial code description
Total
score
(4 pts.)
Virginia 1
2012 IECC with weakening
amendments; currently
reviewing 2015 IECC
1.5
2012 IECC with reference to ASHRAE
90.1-2010; currently reviewing 2015
IECC
2.5
North Carolina 1 2009 IECC 1.5 2009 IECC with amendments, with
reference to ASHRAE 90.1-2010 2.5
Ohio 1 2009 IECC 1.5
The state is reviewing draft rules that
reference the 2012 IECC/ASHRAE 90.1-
2010.
2.5
Tennessee 1
Currently reviewing the 2009
IECC as the statewide standard;
anticipates the rules will take
effect in the fall of 2016.
1.5
2012 IECC for commercial and state-
owned buildings (effective August 4,
2016)
2.5
Nevada 1 Significant local adoption of the
2012 IECC 1
Significant local adoption of the 2012
IECC and ASHRAE 90.1-2010 2
Arkansas 1 2009 IECC 1 2009 IECC 2
Colorado 1
Home-rule state—2003 IECC
mandatory only for jurisdictions
that have already adopted
energy codes, otherwise
voluntary. Of all building
construction, 95% takes place in
jurisdictions that have adopted
the 2009 or higher code.
1
Home-rule state—2003 IECC mandatory
only for jurisdictions that have already
adopted energy codes. Of all building
construction, 95% takes place in
jurisdictions that have adopted the
2009 or higher code.
2
Georgia 1 2009 IECC 1 ASHRAE 90.1-2007 2
Guam 1 2009 IECC 1 2009 IECC 2
Indiana 1 2009 IECC 1 ASHRAE 90.1-2007 2
Louisiana 1
Residential buildings must meet
the 2009 IRC with reference to
the 2009 IECC. Multifamily
residential buildings of three
stories or less must meet the
2012 IRC and the energy
provisions of the 2009 IECC.
Multifamily residential
construction of more than three
stories must comply with
ASHRAE 90.1-2007.
1 ASHRAE Standard 90.1-2007 2
Nebraska 1 2009 IECC 1 2009 IECC with reference to ASHRAE
90.1-2007 2
New
Hampshire 1 2009 IECC 1
2009 IECC with references to ASHRAE
90.1-2007 2
New Mexico 1 2009 IECC with amendments 1
2009 IECC with amendments; ASHRAE
90.1-2007 is acceptable compliance
path
2
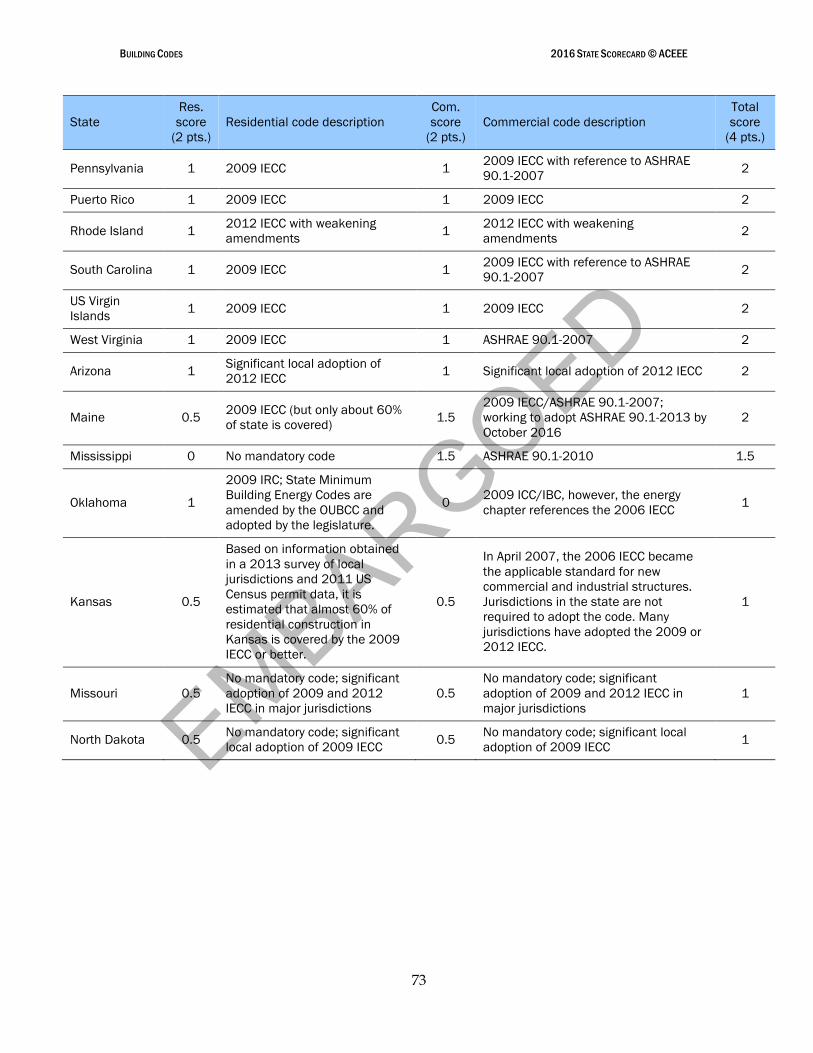
EMBARGOED
BUILDING CODES 2016 STATE SCORECARD © ACEEE
73
State
Res.
score
(2 pts.)
Residential code description
Com.
score
(2 pts.)
Commercial code description
Total
score
(4 pts.)
Pennsylvania 1 2009 IECC 1 2009 IECC with reference to ASHRAE
90.1-2007 2
Puerto Rico 1 2009 IECC 1 2009 IECC 2
Rhode Island 1 2012 IECC with weakening
amendments 1
2012 IECC with weakening
amendments 2
South Carolina 1 2009 IECC 1 2009 IECC with reference to ASHRAE
90.1-2007 2
US Virgin
Islands 1 2009 IECC 1 2009 IECC 2
West Virginia 1 2009 IECC 1 ASHRAE 90.1-2007 2
Arizona 1 Significant local adoption of
2012 IECC 1 Significant local adoption of 2012 IECC 2
Maine 0.5 2009 IECC (but only about 60%
of state is covered) 1.5
2009 IECC/ASHRAE 90.1-2007;
working to adopt ASHRAE 90.1-2013 by
October 2016
2
Mississippi 0 No mandatory code 1.5 ASHRAE 90.1-2010 1.5
Oklahoma 1
2009 IRC; State Minimum
Building Energy Codes are
amended by the OUBCC and
adopted by the legislature.
0 2009 ICC/IBC, however, the energy
chapter references the 2006 IECC 1
Kansas 0.5
Based on information obtained
in a 2013 survey of local
jurisdictions and 2011 US
Census permit data, it is
estimated that almost 60% of
residential construction in
Kansas is covered by the 2009
IECC or better.
0.5
In April 2007, the 2006 IECC became
the applicable standard for new
commercial and industrial structures.
Jurisdictions in the state are not
required to adopt the code. Many
jurisdictions have adopted the 2009 or
2012 IECC.
1
Missouri 0.5
No mandatory code; significant
adoption of 2009 and 2012
IECC in major jurisdictions
0.5
No mandatory code; significant
adoption of 2009 and 2012 IECC in
major jurisdictions
1
North Dakota 0.5 No mandatory code; significant
local adoption of 2009 IECC 0.5
No mandatory code; significant local
adoption of 2009 IECC 1
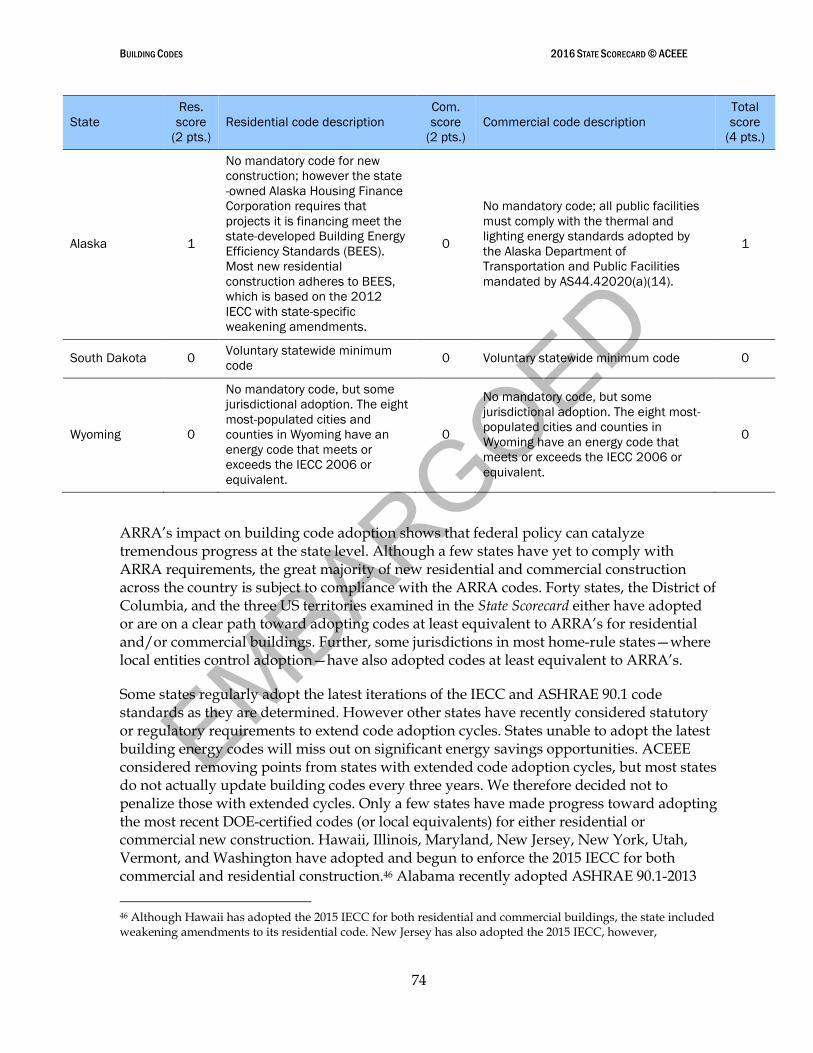
EMBARGOED
BUILDING CODES 2016 STATE SCORECARD © ACEEE
74
State
Res.
score
(2 pts.)
Residential code description
Com.
score
(2 pts.)
Commercial code description
Total
score
(4 pts.)
Alaska 1
No mandatory code for new
construction; however the state
-owned Alaska Housing Finance
Corporation requires that
projects it is financing meet the
state-developed Building Energy
Efficiency Standards (BEES).
Most new residential
construction adheres to BEES,
which is based on the 2012
IECC with state-specific
weakening amendments.
0
No mandatory code; all public facilities
must comply with the thermal and
lighting energy standards adopted by
the Alaska Department of
Transportation and Public Facilities
mandated by AS44.42020(a)(14).
1
South Dakota 0 Voluntary statewide minimum
code 0 Voluntary statewide minimum code 0
Wyoming 0
No mandatory code, but some
jurisdictional adoption. The eight
most-populated cities and
counties in Wyoming have an
energy code that meets or
exceeds the IECC 2006 or
equivalent.
0
No mandatory code, but some
jurisdictional adoption. The eight most-
populated cities and counties in
Wyoming have an energy code that
meets or exceeds the IECC 2006 or
equivalent.
0
ARRA’s impact on building code adoption shows that federal policy can catalyze tremendous progress at the state level. Although a few states have yet to comply with ARRA requirements, the great majority of new residential and commercial construction across the country is subject to compliance with the ARRA codes. Forty states, the District of Columbia, and the three US territories examined in the State Scorecard either have adopted or are on a clear path toward adopting codes at least equivalent to ARRA’s for residential and/or commercial buildings. Further, some jurisdictions in most home-rule states—where local entities control adoption—have also adopted codes at least equivalent to ARRA’s.
Some states regularly adopt the latest iterations of the IECC and ASHRAE 90.1 code standards as they are determined. However other states have recently considered statutory or regulatory requirements to extend code adoption cycles. States unable to adopt the latest building energy codes will miss out on significant energy savings opportunities. ACEEE considered removing points from states with extended code adoption cycles, but most states do not actually update building codes every three years. We therefore decided not to penalize those with extended cycles. Only a few states have made progress toward adopting the most recent DOE-certified codes (or local equivalents) for either residential or commercial new construction. Hawaii, Illinois, Maryland, New Jersey, New York, Utah, Vermont, and Washington have adopted and begun to enforce the 2015 IECC for both commercial and residential construction.46 Alabama recently adopted ASHRAE 90.1-2013
46 Although Hawaii has adopted the 2015 IECC for both residential and commercial buildings, the state included weakening amendments to its residential code. New Jersey has also adopted the 2015 IECC, however,
EMBARGOED
BUILDING CODES 2016 STATE SCORECARD © ACEEE
75
standards for all commercial buildings and an amended version of the 2015 IECC for residential buildings, and Texas recently adopted ASHRAE 90.1-2013 for all state-funded construction projects. Delaware and Massachusetts are in the process of adopting the 2015 IECC and ASHRAE 90.1-2013 for residential and commercial buildings, and Wisconsin is reviewing the 2015 IECC and ASHRAE 90.1-2013 for commercial buildings. In addition, Michigan adopted the residential 2015 IECC and ASHRAE 90.1-2013. While California has yet to begin enforcing the 2015 codes, they earn full credit for exceeding 2012 residential and commercial codes, which go into effect January 1, 2017.
At the other end of the spectrum, nine states lack mandatory statewide energy codes for new residential and/or commercial construction: Alaska, Colorado, Kansas, Maine, Mississippi, Missouri, North Dakota, South Dakota, and Wyoming. Some of these home-rule states are nonetheless showing high rates of adoption at the jurisdictional level, including Arizona, Colorado, Kansas, and Missouri. We award these states points accordingly.
Compliance
Scoring states on compliance is difficult due to the lack of consistent data on actual compliance rates—and the fact that other efforts taken to measure compliance are largely qualitative. Still, as always, we continue to seek ways to have scores reflect tangible improvements in energy savings.
Last year, we updated our scoring methodology to award more credit to states that have completed compliance studies in the past five years. The reasoning behind this decision was that, as the 2017 deadline for 90% compliance approaches, compliance rates should serve as a reflection of a state’s code enforcement efforts. We have employed the same methodology this year, but, with the deadline only months away, readers can expect the 2017 State Scorecard to utilize a new approach. To motivate states to reach and exceed the 90% compliance goal, ACEEE intends eventually to award credit to states based on not only the publication of compliance studies and their rigor, but also the actual level of compliance they report. For more information on state compliance efforts, visit ACEEE’s State and Local Policy Database (ACEEE 2016).
Table 26 shows our scoring methodology for assessing state compliance studies.
amendments to the residential portion of the code weaken air leakage test requirements. These states’ scores reflect these weakening amendments.
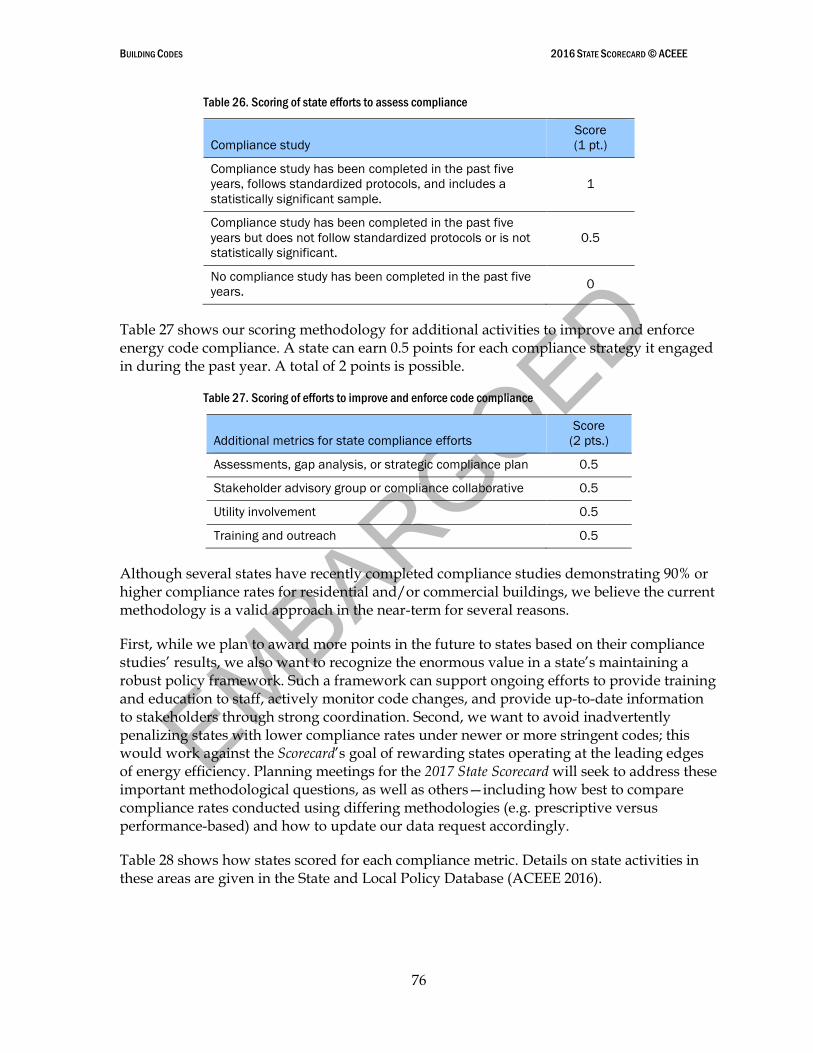
EMBARGOED
BUILDING CODES 2016 STATE SCORECARD © ACEEE
76
Table 26. Scoring of state efforts to assess compliance
Compliance study
Score
(1 pt.)
Compliance study has been completed in the past five
years, follows standardized protocols, and includes a
statistically significant sample.
1
Compliance study has been completed in the past five
years but does not follow standardized protocols or is not
statistically significant.
0.5
No compliance study has been completed in the past five
years. 0
Table 27 shows our scoring methodology for additional activities to improve and enforce energy code compliance. A state can earn 0.5 points for each compliance strategy it engaged in during the past year. A total of 2 points is possible.
Table 27. Scoring of efforts to improve and enforce code compliance
Additional metrics for state compliance efforts
Score
(2 pts.)
Assessments, gap analysis, or strategic compliance plan 0.5
Stakeholder advisory group or compliance collaborative 0.5
Utility involvement 0.5
Training and outreach 0.5
Although several states have recently completed compliance studies demonstrating 90% or higher compliance rates for residential and/or commercial buildings, we believe the current methodology is a valid approach in the near-term for several reasons.
First, while we plan to award more points in the future to states based on their compliance studies’ results, we also want to recognize the enormous value in a state’s maintaining a robust policy framework. Such a framework can support ongoing efforts to provide training and education to staff, actively monitor code changes, and provide up-to-date information to stakeholders through strong coordination. Second, we want to avoid inadvertently penalizing states with lower compliance rates under newer or more stringent codes; this would work against the Scorecard’s goal of rewarding states operating at the leading edges of energy efficiency. Planning meetings for the 2017 State Scorecard will seek to address these important methodological questions, as well as others—including how best to compare compliance rates conducted using differing methodologies (e.g. prescriptive versus performance-based) and how to update our data request accordingly.
Table 28 shows how states scored for each compliance metric. Details on state activities in these areas are given in the State and Local Policy Database (ACEEE 2016).
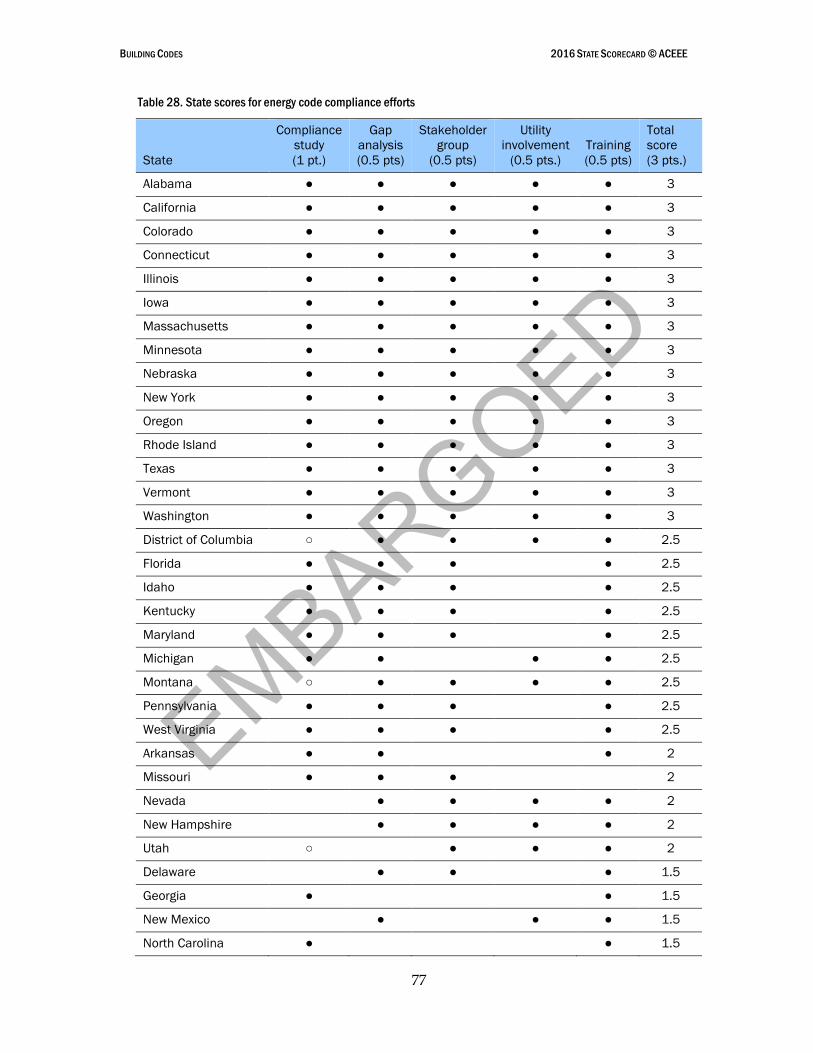
EMBARGOED
BUILDING CODES 2016 STATE SCORECARD © ACEEE
77
Table 28. State scores for energy code compliance efforts
State
Compliance
study
(1 pt.)
Gap
analysis
(0.5 pts)
Stakeholder
group
(0.5 pts)
Utility
involvement
(0.5 pts.)
Training
(0.5 pts)
Total
score
(3 pts.)
Alabama ● ● ● ● ● 3
California ● ● ● ● ● 3
Colorado ● ● ● ● ● 3
Connecticut ● ● ● ● ● 3
Illinois ● ● ● ● ● 3
Iowa ● ● ● ● ● 3
Massachusetts ● ● ● ● ● 3
Minnesota ● ● ● ● ● 3
Nebraska ● ● ● ● ● 3
New York ● ● ● ● ● 3
Oregon ● ● ● ● ● 3
Rhode Island ● ● ● ● ● 3
Texas ● ● ● ● ● 3
Vermont ● ● ● ● ● 3
Washington ● ● ● ● ● 3
District of Columbia ○ ● ● ● ● 2.5
Florida ● ● ● ● 2.5
Idaho ● ● ● ● 2.5
Kentucky ● ● ● ● 2.5
Maryland ● ● ● ● 2.5
Michigan ● ● ● ● 2.5
Montana ○ ● ● ● ● 2.5
Pennsylvania ● ● ● ● 2.5
West Virginia ● ● ● ● 2.5
Arkansas ● ● ● 2
Missouri ● ● ● 2
Nevada ● ● ● ● 2
New Hampshire ● ● ● ● 2
Utah ○ ● ● ● 2
Delaware ● ● ● 1.5
Georgia ● ● 1.5
New Mexico ● ● ● 1.5
North Carolina ● ● 1.5
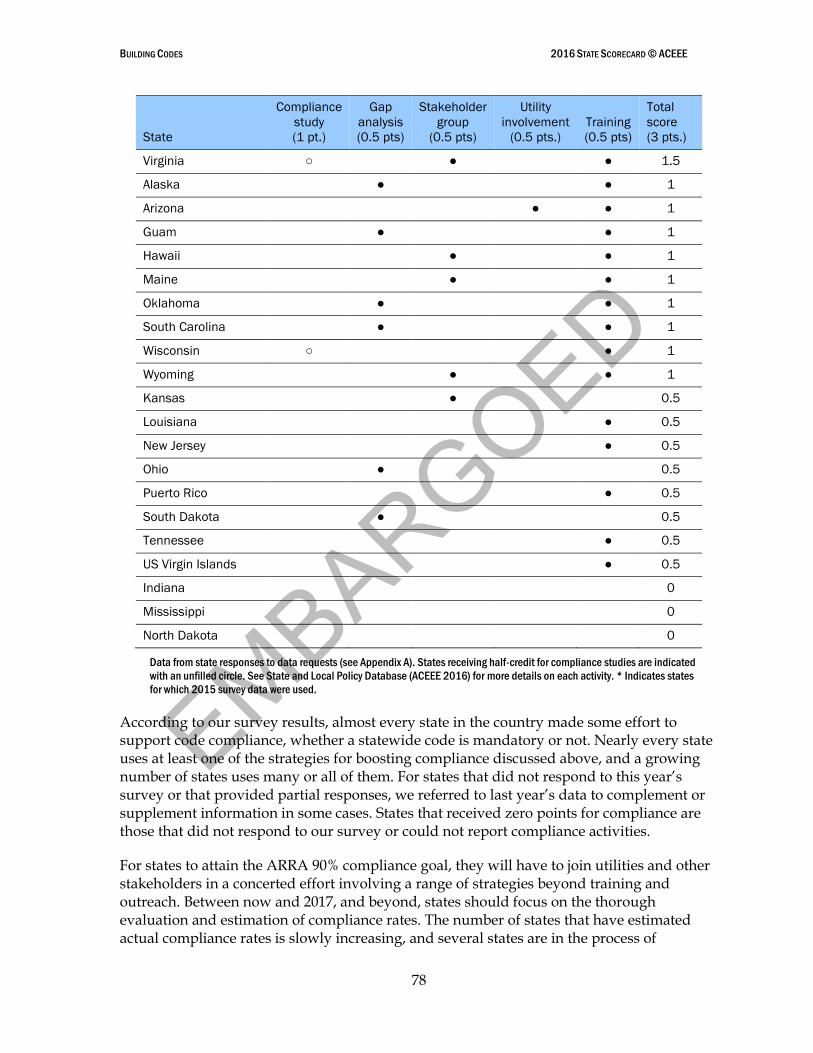
EMBARGOED
BUILDING CODES 2016 STATE SCORECARD © ACEEE
78
State
Compliance
study
(1 pt.)
Gap
analysis
(0.5 pts)
Stakeholder
group
(0.5 pts)
Utility
involvement
(0.5 pts.)
Training
(0.5 pts)
Total
score
(3 pts.)
Virginia ○ ● ● 1.5
Alaska ● ● 1
Arizona ● ● 1
Guam ● ● 1
Hawaii ● ● 1
Maine ● ● 1
Oklahoma ● ● 1
South Carolina ● ● 1
Wisconsin ○ ● 1
Wyoming ● ● 1
Kansas ● 0.5
Louisiana ● 0.5
New Jersey ● 0.5
Ohio ● 0.5
Puerto Rico ● 0.5
South Dakota ● 0.5
Tennessee ● 0.5
US Virgin Islands ● 0.5
Indiana 0
Mississippi 0
North Dakota 0
Data from state responses to data requests (see Appendix A). States receiving half-credit for compliance studies are indicated
with an unfilled circle. See State and Local Policy Database (ACEEE 2016) for more details on each activity. * Indicates states
for which 2015 survey data were used.
According to our survey results, almost every state in the country made some effort to support code compliance, whether a statewide code is mandatory or not. Nearly every state uses at least one of the strategies for boosting compliance discussed above, and a growing number of states uses many or all of them. For states that did not respond to this year’s survey or that provided partial responses, we referred to last year’s data to complement or supplement information in some cases. States that received zero points for compliance are those that did not respond to our survey or could not report compliance activities.
For states to attain the ARRA 90% compliance goal, they will have to join utilities and other stakeholders in a concerted effort involving a range of strategies beyond training and outreach. Between now and 2017, and beyond, states should focus on the thorough evaluation and estimation of compliance rates. The number of states that have estimated actual compliance rates is slowly increasing, and several states are in the process of
EMBARGOED
BUILDING CODES 2016 STATE SCORECARD © ACEEE
79
conducting compliance studies with DOE assistance. However only a little more than half the states have completed a compliance study of any type, and few of them follow a standard methodology to measure compliance for both the commercial and the residential sector.
EMBARGOED
CHP 2016 STATE SCORECARD © ACEEE
80
Chapter 5. Combined Heat and Power
Authors: Meegan Kelly and Anna Chittum
INTRODUCTION
CHP systems generate electricity and thermal energy in a single integrated system. CHP is more energy efficient than generating electricity and thermal energy separately because heat that is normally wasted in conventional generation is captured as useful energy. That recovered energy can then be used to meet a thermal demand for onsite processes, such as heating or cooling a building or generating steam to run a manufacturing process. CHP systems can save customers money and reduce net emissions. The majority are powered by natural gas, but many are fueled by biomass, biogas, or other types of fossil fuels.
SCORING AND RESULTS
States can encourage or discourage CHP in many ways. Financial, technical, policy, and regulatory factors affect the extent to which CHP systems are deployed. Our scoring methodology emphasizes CHP as an energy resource, which we believe is the most important policy driver for increasing the use of highly efficient CHP in the United States.
Our methodology is based on four policy categories:
Interconnection standards for electrically connecting CHP systems to the grid
Encouraging CHP as a resource
Deployment incentives
Additional supportive policies
The second point, encouraging CHP as a resource, is an umbrella category with the greatest weight. It scores states on activities and policies that actively identify CHP as an energy resource and integrate CHP into system planning and energy resource acquisition efforts. The full scoring methodology is outlined below and described in detail later in this chapter.
A state could earn up to 4 points based on the above categories. We awarded points for:
The presence and design of interconnection standards (0.5 points)
The extent to which CHP is identified and encouraged as an energy resource, based on four subcategories:
o Eligibility of CHP within an energy efficiency resource standard or other similar regulatory requirement (0.5 points)
o The presence of utility- or program administrator–run CHP programs designed to acquire CHP energy resources (0.5 points)
o The presence of state-approved production goals or program budgets for acquiring a defined amount of kWh savings from CHP (0.5 points)
o Access to production incentives, feed-in tariffs, standard offer programs, or other revenue streams linked to CHP system kWh production (0.5 points)
Deployment incentives—including rebates, grants, and financing—or a net metering standard that applies to CHP (0.5 points)
Additional supportive policies, including certain streamlined air permitting processes, technical assistance, goals for CHP in critical facilities, resiliency efforts,
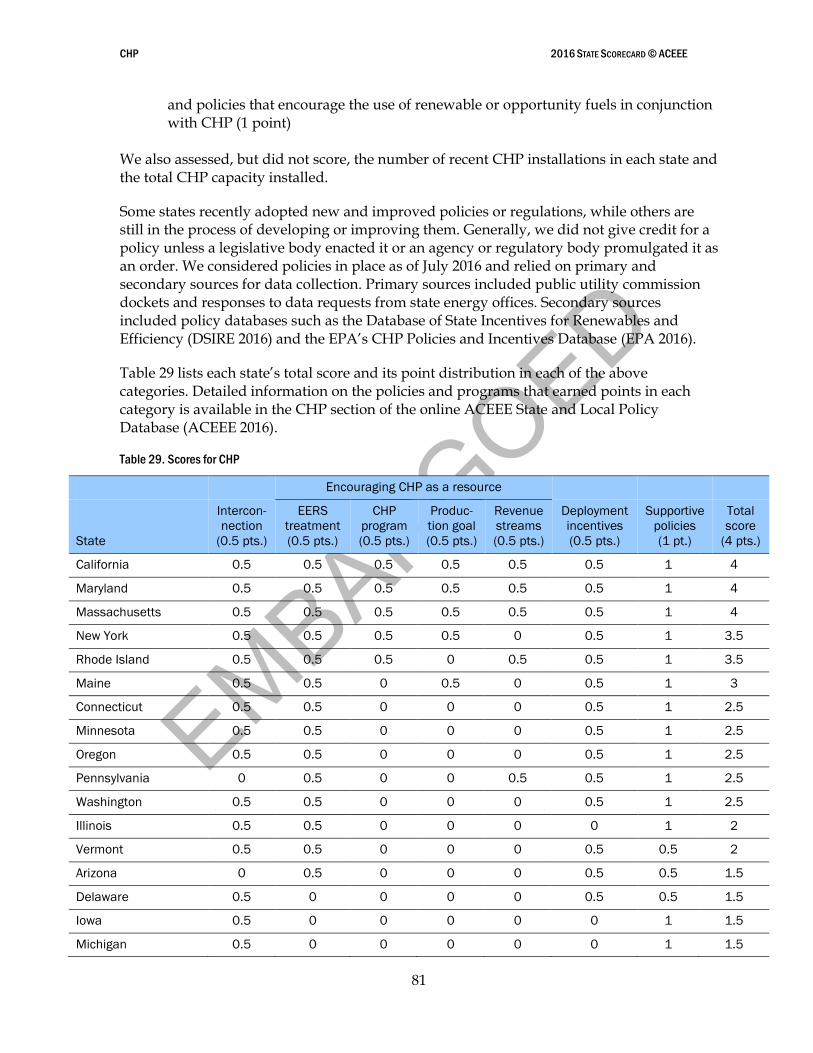
EMBARGOED
CHP 2016 STATE SCORECARD © ACEEE
81
and policies that encourage the use of renewable or opportunity fuels in conjunction with CHP (1 point)
We also assessed, but did not score, the number of recent CHP installations in each state and the total CHP capacity installed.
Some states recently adopted new and improved policies or regulations, while others are still in the process of developing or improving them. Generally, we did not give credit for a policy unless a legislative body enacted it or an agency or regulatory body promulgated it as an order. We considered policies in place as of July 2016 and relied on primary and secondary sources for data collection. Primary sources included public utility commission dockets and responses to data requests from state energy offices. Secondary sources included policy databases such as the Database of State Incentives for Renewables and Efficiency (DSIRE 2016) and the EPA’s CHP Policies and Incentives Database (EPA 2016).
Table 29 lists each state’s total score and its point distribution in each of the above categories. Detailed information on the policies and programs that earned points in each category is available in the CHP section of the online ACEEE State and Local Policy Database (ACEEE 2016).
Table 29. Scores for CHP
Encouraging CHP as a resource
State
Intercon-
nection
(0.5 pts.)
EERS
treatment
(0.5 pts.)
CHP
program
(0.5 pts.)
Produc-
tion goal
(0.5 pts.)
Revenue
streams
(0.5 pts.)
Deployment
incentives
(0.5 pts.)
Supportive
policies
(1 pt.)
Total
score
(4 pts.)
California 0.5 0.5 0.5 0.5 0.5 0.5 1 4
Maryland 0.5 0.5 0.5 0.5 0.5 0.5 1 4
Massachusetts 0.5 0.5 0.5 0.5 0.5 0.5 1 4
New York 0.5 0.5 0.5 0.5 0 0.5 1 3.5
Rhode Island 0.5 0.5 0.5 0 0.5 0.5 1 3.5
Maine 0.5 0.5 0 0.5 0 0.5 1 3
Connecticut 0.5 0.5 0 0 0 0.5 1 2.5
Minnesota 0.5 0.5 0 0 0 0.5 1 2.5
Oregon 0.5 0.5 0 0 0 0.5 1 2.5
Pennsylvania 0 0.5 0 0 0.5 0.5 1 2.5
Washington 0.5 0.5 0 0 0 0.5 1 2.5
Illinois 0.5 0.5 0 0 0 0 1 2
Vermont 0.5 0.5 0 0 0 0.5 0.5 2
Arizona 0 0.5 0 0 0 0.5 0.5 1.5
Delaware 0.5 0 0 0 0 0.5 0.5 1.5
Iowa 0.5 0 0 0 0 0 1 1.5
Michigan 0.5 0 0 0 0 0 1 1.5
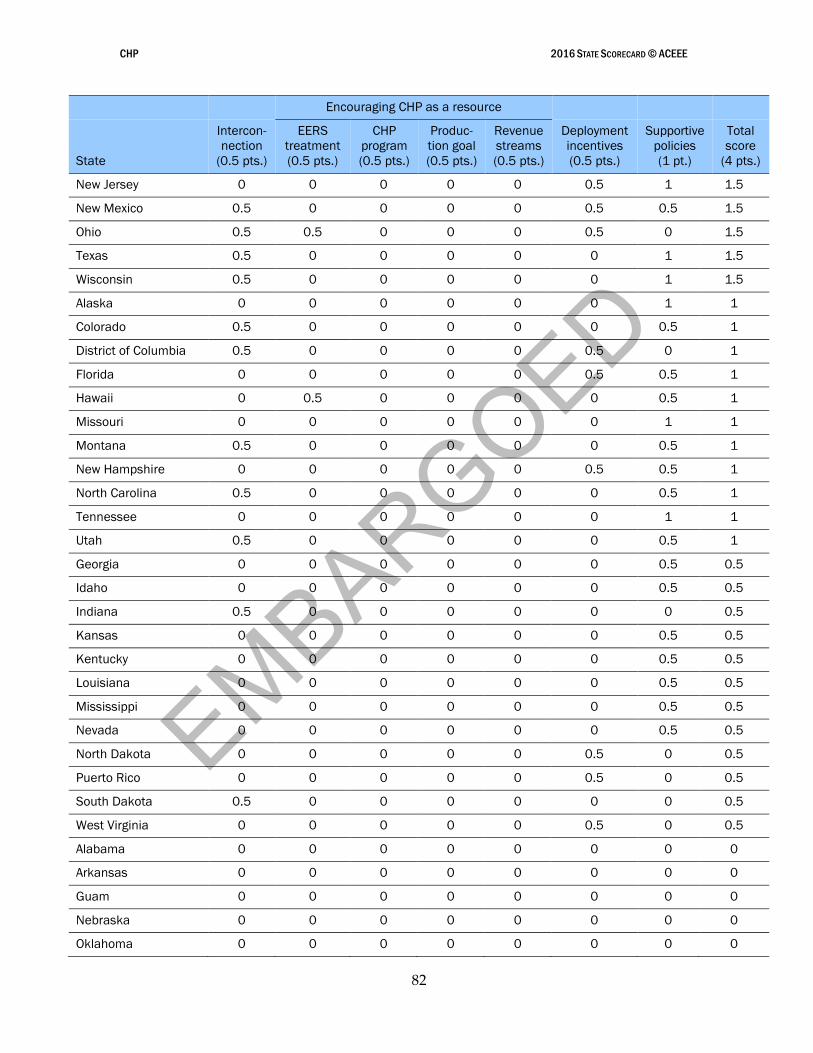
EMBARGOED
CHP 2016 STATE SCORECARD © ACEEE
82
Encouraging CHP as a resource
State
Intercon-
nection
(0.5 pts.)
EERS
treatment
(0.5 pts.)
CHP
program
(0.5 pts.)
Produc-
tion goal
(0.5 pts.)
Revenue
streams
(0.5 pts.)
Deployment
incentives
(0.5 pts.)
Supportive
policies
(1 pt.)
Total
score
(4 pts.)
New Jersey 0 0 0 0 0 0.5 1 1.5
New Mexico 0.5 0 0 0 0 0.5 0.5 1.5
Ohio 0.5 0.5 0 0 0 0.5 0 1.5
Texas 0.5 0 0 0 0 0 1 1.5
Wisconsin 0.5 0 0 0 0 0 1 1.5
Alaska 0 0 0 0 0 0 1 1
Colorado 0.5 0 0 0 0 0 0.5 1
District of Columbia 0.5 0 0 0 0 0.5 0 1
Florida 0 0 0 0 0 0.5 0.5 1
Hawaii 0 0.5 0 0 0 0 0.5 1
Missouri 0 0 0 0 0 0 1 1
Montana 0.5 0 0 0 0 0 0.5 1
New Hampshire 0 0 0 0 0 0.5 0.5 1
North Carolina 0.5 0 0 0 0 0 0.5 1
Tennessee 0 0 0 0 0 0 1 1
Utah 0.5 0 0 0 0 0 0.5 1
Georgia 0 0 0 0 0 0 0.5 0.5
Idaho 0 0 0 0 0 0 0.5 0.5
Indiana 0.5 0 0 0 0 0 0 0.5
Kansas 0 0 0 0 0 0 0.5 0.5
Kentucky 0 0 0 0 0 0 0.5 0.5
Louisiana 0 0 0 0 0 0 0.5 0.5
Mississippi 0 0 0 0 0 0 0.5 0.5
Nevada 0 0 0 0 0 0 0.5 0.5
North Dakota 0 0 0 0 0 0.5 0 0.5
Puerto Rico 0 0 0 0 0 0.5 0 0.5
South Dakota 0.5 0 0 0 0 0 0 0.5
West Virginia 0 0 0 0 0 0.5 0 0.5
Alabama 0 0 0 0 0 0 0 0
Arkansas 0 0 0 0 0 0 0 0
Guam 0 0 0 0 0 0 0 0
Nebraska 0 0 0 0 0 0 0 0
Oklahoma 0 0 0 0 0 0 0 0
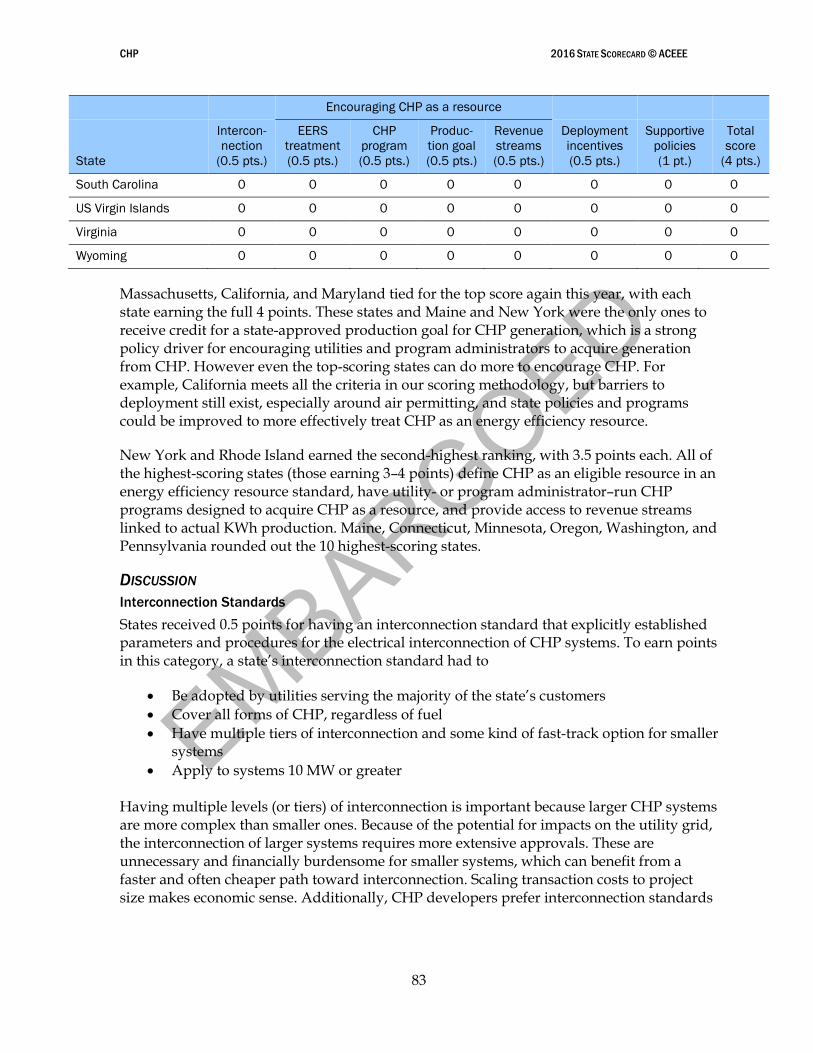
EMBARGOED
CHP 2016 STATE SCORECARD © ACEEE
83
Encouraging CHP as a resource
State
Intercon-
nection
(0.5 pts.)
EERS
treatment
(0.5 pts.)
CHP
program
(0.5 pts.)
Produc-
tion goal
(0.5 pts.)
Revenue
streams
(0.5 pts.)
Deployment
incentives
(0.5 pts.)
Supportive
policies
(1 pt.)
Total
score
(4 pts.)
South Carolina 0 0 0 0 0 0 0 0
US Virgin Islands 0 0 0 0 0 0 0 0
Virginia 0 0 0 0 0 0 0 0
Wyoming 0 0 0 0 0 0 0 0
Massachusetts, California, and Maryland tied for the top score again this year, with each state earning the full 4 points. These states and Maine and New York were the only ones to receive credit for a state-approved production goal for CHP generation, which is a strong policy driver for encouraging utilities and program administrators to acquire generation from CHP. However even the top-scoring states can do more to encourage CHP. For example, California meets all the criteria in our scoring methodology, but barriers to deployment still exist, especially around air permitting, and state policies and programs could be improved to more effectively treat CHP as an energy efficiency resource.
New York and Rhode Island earned the second-highest ranking, with 3.5 points each. All of the highest-scoring states (those earning 3–4 points) define CHP as an eligible resource in an energy efficiency resource standard, have utility- or program administrator–run CHP programs designed to acquire CHP as a resource, and provide access to revenue streams linked to actual KWh production. Maine, Connecticut, Minnesota, Oregon, Washington, and Pennsylvania rounded out the 10 highest-scoring states.
DISCUSSION
Interconnection Standards
States received 0.5 points for having an interconnection standard that explicitly established parameters and procedures for the electrical interconnection of CHP systems. To earn points in this category, a state’s interconnection standard had to
Be adopted by utilities serving the majority of the state’s customers
Cover all forms of CHP, regardless of fuel
Have multiple tiers of interconnection and some kind of fast-track option for smaller systems
Apply to systems 10 MW or greater
Having multiple levels (or tiers) of interconnection is important because larger CHP systems are more complex than smaller ones. Because of the potential for impacts on the utility grid, the interconnection of larger systems requires more extensive approvals. These are unnecessary and financially burdensome for smaller systems, which can benefit from a faster and often cheaper path toward interconnection. Scaling transaction costs to project size makes economic sense. Additionally, CHP developers prefer interconnection standards
EMBARGOED
CHP 2016 STATE SCORECARD © ACEEE
84
that cover higher size limits and are based on widely accepted technical industry standards, such as IEEE 1547.47
Encouraging CHP as a Resource
While CHP is known for its energy efficiency benefits, few states actively identify it as an energy resource akin to more traditional sources such as centralized power plants. CHP can offer energy, capacity, and even ancillary services to grids to which they are connected, but to maximize those benefits, states must first identify CHP as a resource and integrate it into system planning and energy resource acquisition efforts.48 One of the best ways to do this is to include CHP within state energy efficiency goals and utility programs.
States could receive up to 2 points for activities and policies that encourage CHP as an energy resource. We considered the following subcategories in awarding points:
EERS treatment. We awarded 0.5 points if CHP was clearly defined as eligible in a binding EERS or similar requirement. Most states with EERS policies set goals for future years. These goals are generally a percentage of total electricity sold that must be derived from efficiency resources, with the percentage of these resources increasing over time. To receive credit, a state’s EERS must explicitly apply to CHP powered by natural gas, be technology neutral, and be a binding obligation.
CHP resource acquisition programs. We awarded 0.5 points for programs designed to acquire cost-effective CHP in a way similar to the acquisition of other energy efficiency resources. For a state to earn this half point, a majority of its energy customers must have access to clearly defined CHP programming offered by major utilities or other program administrators. We did not give credit if only a small selection of customers have access to a CHP program or if a state has a custom commercial or industrial incentive program that could theoretically be used for CHP but is not marketed as a CHP program. To earn credit, states have to be actively reaching out to potential CHP users and developers to market the program, and they must be acquiring new CHP resources as a result.
Production goal. We awarded 0.5 points for the existence of either a state-approved production goal (kWh) from CHP resources or a program budget for the acquisition of a defined amount of kWh savings from CHP by utilities or program administrators. The presence of either (or both) of these indicates that a state has identified CHP as a resource and, importantly, has given utilities a clear signal to develop and deploy programming designed to acquire CHP. In many states, utilities report receiving mixed signals about whether their regulators are actually supportive of program spending tied to CHP. This
47 This standard establishes criteria and requirements for interconnection of distributed energy resources with electric power systems. It provides requirements relevant to the performance, operation, testing, safety, and maintenance of the interconnection. For more information, visit www.ieee.org.
48 The Federal Energy Regulatory Commission (FERC) defines ancillary services as “those services necessary to support the transmission of electric power from seller to purchaser, given the obligations of control areas and transmitting utilities within those control areas, to maintain reliable operations of the interconnected transmission system. Ancillary services supplied with generation include load following, reactive power-voltage regulation, system protective services, loss compensation service, system control, load dispatch services, and energy imbalance services.” For more information, visit www.ferc.gov/market-oversight/guide/glossary.asp.
EMBARGOED
CHP 2016 STATE SCORECARD © ACEEE
85
subcategory addresses this particular issue of utility incentives and disincentives to pursue CHP programming.
Revenue streams. We awarded 0.5 points to states that provide access to favorable revenue streams for CHP, including production incentives ($/kWh), feed-in tariffs, standard offer programs, or other revenue streams linked to kWh production. These incentives are specifically designed to encourage measurable energy savings from CHP. Production incentives are linked directly to a CHP system’s production or to some calculated amount of energy savings relative to an established baseline. Feed-in tariffs usually specify $/kWh payment to CHP operators for exporting electricity to the grid, providing price certainty and long-term contracts that can help finance CHP systems (EPA 2015b). Standard offer programs offer a set price for qualifying CHP production and often have a program cap or point at which the standard offer will no longer be available. Revenue streams through net metering are treated in a separate category described later in this chapter.
In general, we did not give credit for custom program offerings marketed to commercial and industrial sectors that could only potentially be used for CHP, as the spending and savings for these programs are reflected in other parts of the State Scorecard. However we did give credit for programs that included a specific CHP-focused component, such as the identification of and outreach to potential sites for CHP installations.
To earn points in any of the four subcategories outlined above, a state policy or program must be usable by all customer classes and apply to CHP systems powered by natural gas. Detailed information on the policies and programs that earned points in this category is available in the CHP section of the ACEEE State and Local Policy Database (ACEEE 2016).
Deployment Incentives
States could receive 0.5 points for the presence of deployment incentives that improve the economics of a CHP investment but are not necessarily tied to resource acquisition efforts by utilities. Deployment incentives can encourage CHP at the state level in a variety of ways, and the leading states have multiple types of incentive programs. To earn points in this category, at least one available incentive must
Apply to all CHP, regardless of fuel
Be an investment tax credit, a credit for installed capacity, a loan or loan guarantee, a project grant, or a net metering standard
Apply to both the commercial and the industrial sectors
Tax incentives for CHP can take many forms, but are often credits taken against business or real estate taxes. The US Internal Revenue Service (IRS) administers a federal business energy investment tax credit (ITC) that incentivizes CHP systems by offering a credit for 10% of CHP project costs (DSIRE 2016). Tax credits administered by a state can similarly provide support for CHP deployment. Although the federal ITC is set to expire on December 31, 2016, tax incentives are usually considered more permanent incentive structures than grant programs.
EMBARGOED
CHP 2016 STATE SCORECARD © ACEEE
86
State grants can also support CHP deployment by providing financing for capital and other costs. Some grant awards and other simple incentive programs offer rebates or payments linked to the installation of CHP capacity with amounts set in $/kW. Many of these programs are administered in conjunction with production incentives. Low-interest loan programs, loan guarantees, and bonding authorities are other strategies states can use to make CHP systems financially attractive and reduce the cost of financing. To earn points for these programs, a state must clearly identify CHP as an eligible project type and market it to CHP project developers who then take advantage of the financing opportunity.
Net metering regulations can also incentivize CHP deployment by allowing owners of small distributed generation systems to get credit for net excess electricity that they produce onsite. With wholesale net metering, sometimes known as dual-meter metering, utilities pay customers at the wholesale or avoided-cost rate for any excess electricity exported to the grid. We gave credit to states that explicitly list CHP as an eligible technology and offered at least wholesale net metering to all CHP systems, regardless of fuel, in all customer classes.
Detailed information on incentives for CHP is available from the EPA’s CHP Policies and Incentives Database (EPA 2016) and from the Database of State Incentives for Renewables and Efficiency (DSIRE 2016).49
Additional Supportive Policies
A state could receive up to 1 point for activities or additional policies that support the deployment of CHP. Because barriers to deployment and opportunities to encourage CHP vary from state to state, this category recognizes a wide variety of efforts that states can undertake. States earned 0.5 points for the presence of any one of the following supportive policies, or 1 point for the presence of two or more
Policies that encourage the use of opportunity fuels in conjunction with CHP technologies, such as biomass, biogas, anaerobic digester gas, landfill gas, wood, and other waste (including waste heat)
Streamlined air permitting procedures, including permit-by-rule, for CHP systems for multiple major pollutants
Dedicated CHP-focused technical assistance efforts
Requirements that public buildings and/or other critical facilities consider CHP during times of upgrade and new construction
Policies and programs that specifically encourage CHP for its resiliency and reliability benefits
In previous years, we assigned points separately for the eligibility of CHP in a state’s EERS and its RPS to note the different roles the two standards can play. As with EERSs, most states with RPS policies set goals for future years that require a percentage of the total electricity sold to be derived from renewable resources. This year, states could earn points for RPSs and other policies that encourage the use of renewable-fueled CHP as an additional supportive policy. The availability of biomass and biogas resources is often local, and some
49 EPA’s database is available at www.epa.gov/chp/policies/database.html. The DSIRE database is available at www.dsireusa.org.
EMBARGOED
CHP 2016 STATE SCORECARD © ACEEE
87
states are better suited to use these resources than others. Natural gas is available nearly everywhere in the United States and is the predominant fuel used by CHP systems. While natural gas CHP systems do not generally benefit from RPS treatment, biomass or biogas systems often do, and we recognize the use of these and other opportunity fuels in this category.
States could also earn points for streamlined air permitting, including permit-by-rule processes. These are alternatives to conventional air permits that help reduce the time and cost involved in permitting eligible CHP units. Additional information about approaches to streamline air permitting for CHP is available in an EPA fact sheet (EPA 2014).
States could earn points for several other supportive policies in this category. Such policies can include targeted technical assistance programs, education campaigns, or other state-led special efforts that support CHP. To earn credit for technical assistance, a state’s efforts must go beyond the critical services provided by DOE’s CHP Technical Assistance Partnerships. States could also earn points for requirements to consider CHP for public buildings and critical facilities during times of upgrade or new construction, or for programs that encourage the consideration of CHP’s resiliency benefits during grid outages. The ACEEE State and Local Policy Database’s CHP section contains state-by-state descriptions of these policies (ACEEE 2016).
ADDITIONAL METRICS
Two additional metrics are noted but do not impact a state’s score. Below, we include data on both the number of individual CHP systems installed and the total capacity (MW) installed in each state.50 We believe information on actual installations is useful for comparing CHP activity states, but does not in itself fully indicate a state’s CHP friendliness. Table 30 shows the number of new CHP systems and installed CHP capacity over the past two years.
The 2015 data show a lower level of installed CHP capacity than we have seen in recent years. This is due to the absence of any very large installations (e.g., greater than 50 MW), which tend to contribute a high percentage of the annual capacity. Thus, while the number of installations is in the typical range, the amount of capacity in 2015 was lower than in prior years.
Various economic considerations determine how many CHP projects are installed, but the retail price of energy is a major factor in their economic attractiveness. Higher electricity prices may improve the case for CHP in some states, where self-generation can be more cost effective than purchasing electricity from the grid. In other states, lower and stable natural gas prices can help hasten investment in CHP systems, since many are fueled by natural gas.
While not assessed in the Scorecard since states cannot control the price of electricity or gas that customers pay, these prices drive a state’s CHP market to varying degrees. Policymakers can implement policies that help overcome economic barriers raised in part by
50 We use data from the DOE CHP Installation Database maintained by ICF International. The data reflected in
the State Scorecard were released June 1, 2016 and reflect installations as of December 31, 2015 (DOE 2016c).
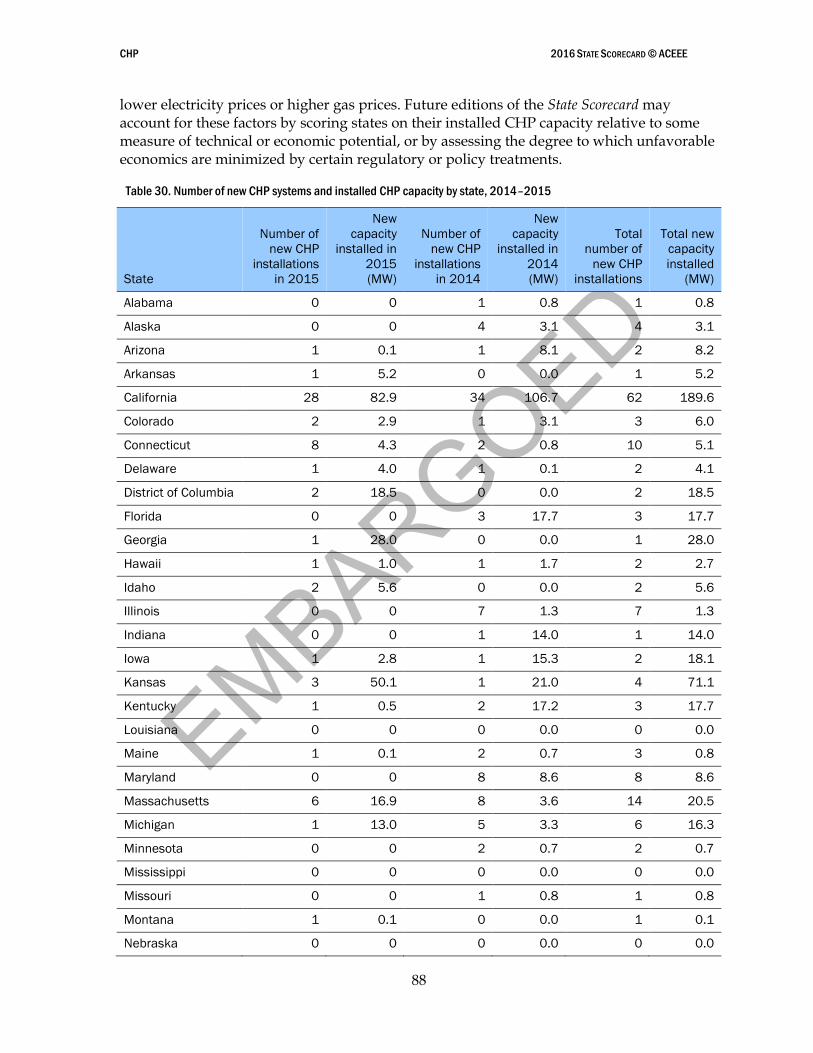
EMBARGOED
CHP 2016 STATE SCORECARD © ACEEE
88
lower electricity prices or higher gas prices. Future editions of the State Scorecard may account for these factors by scoring states on their installed CHP capacity relative to some measure of technical or economic potential, or by assessing the degree to which unfavorable economics are minimized by certain regulatory or policy treatments.
Table 30. Number of new CHP systems and installed CHP capacity by state, 2014–2015
State
Number of
new CHP
installations
in 2015
New
capacity
installed in
2015
(MW)
Number of
new CHP
installations
in 2014
New
capacity
installed in
2014
(MW)
Total
number of
new CHP
installations
Total new
capacity
installed
(MW)
Alabama 0 0 1 0.8 1 0.8
Alaska 0 0 4 3.1 4 3.1
Arizona 1 0.1 1 8.1 2 8.2
Arkansas 1 5.2 0 0.0 1 5.2
California 28 82.9 34 106.7 62 189.6
Colorado 2 2.9 1 3.1 3 6.0
Connecticut 8 4.3 2 0.8 10 5.1
Delaware 1 4.0 1 0.1 2 4.1
District of Columbia 2 18.5 0 0.0 2 18.5
Florida 0 0 3 17.7 3 17.7
Georgia 1 28.0 0 0.0 1 28.0
Hawaii 1 1.0 1 1.7 2 2.7
Idaho 2 5.6 0 0.0 2 5.6
Illinois 0 0 7 1.3 7 1.3
Indiana 0 0 1 14.0 1 14.0
Iowa 1 2.8 1 15.3 2 18.1
Kansas 3 50.1 1 21.0 4 71.1
Kentucky 1 0.5 2 17.2 3 17.7
Louisiana 0 0 0 0.0 0 0.0
Maine 1 0.1 2 0.7 3 0.8
Maryland 0 0 8 8.6 8 8.6
Massachusetts 6 16.9 8 3.6 14 20.5
Michigan 1 13.0 5 3.3 6 16.3
Minnesota 0 0 2 0.7 2 0.7
Mississippi 0 0 0 0.0 0 0.0
Missouri 0 0 1 0.8 1 0.8
Montana 1 0.1 0 0.0 1 0.1
Nebraska 0 0 0 0.0 0 0.0
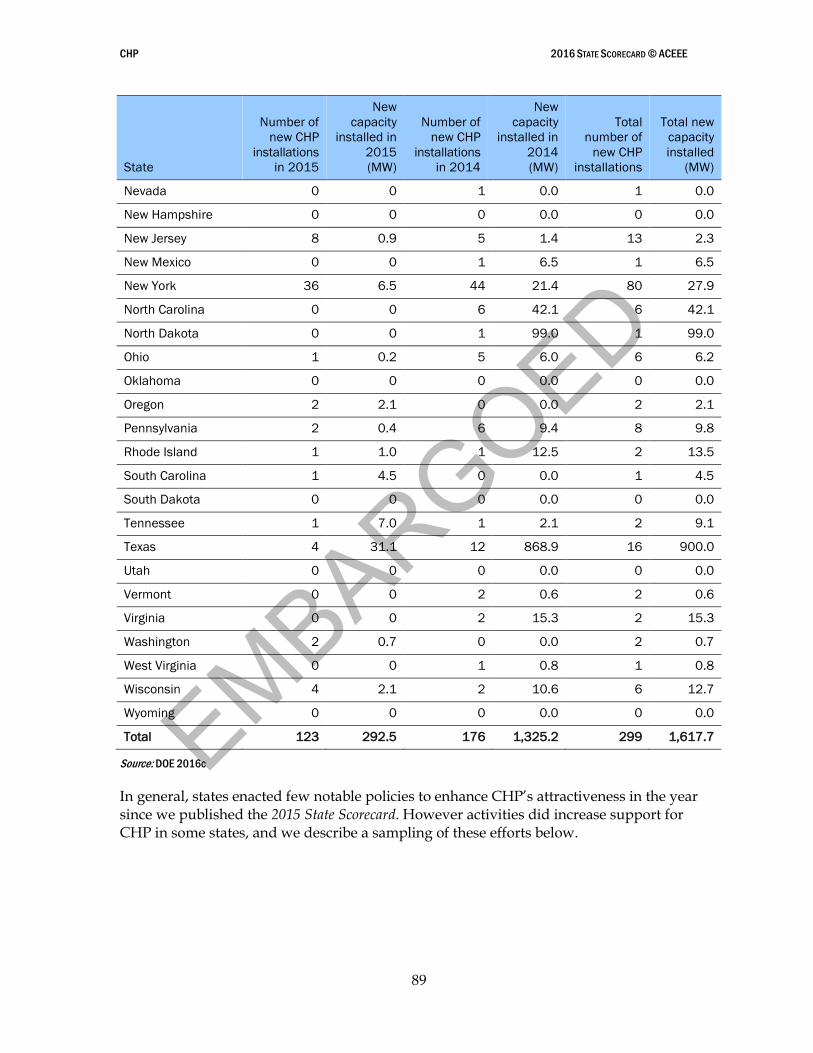
EMBARGOED
CHP 2016 STATE SCORECARD © ACEEE
89
State
Number of
new CHP
installations
in 2015
New
capacity
installed in
2015
(MW)
Number of
new CHP
installations
in 2014
New
capacity
installed in
2014
(MW)
Total
number of
new CHP
installations
Total new
capacity
installed
(MW)
Nevada 0 0 1 0.0 1 0.0
New Hampshire 0 0 0 0.0 0 0.0
New Jersey 8 0.9 5 1.4 13 2.3
New Mexico 0 0 1 6.5 1 6.5
New York 36 6.5 44 21.4 80 27.9
North Carolina 0 0 6 42.1 6 42.1
North Dakota 0 0 1 99.0 1 99.0
Ohio 1 0.2 5 6.0 6 6.2
Oklahoma 0 0 0 0.0 0 0.0
Oregon 2 2.1 0 0.0 2 2.1
Pennsylvania 2 0.4 6 9.4 8 9.8
Rhode Island 1 1.0 1 12.5 2 13.5
South Carolina 1 4.5 0 0.0 1 4.5
South Dakota 0 0 0 0.0 0 0.0
Tennessee 1 7.0 1 2.1 2 9.1
Texas 4 31.1 12 868.9 16 900.0
Utah 0 0 0 0.0 0 0.0
Vermont 0 0 2 0.6 2 0.6
Virginia 0 0 2 15.3 2 15.3
Washington 2 0.7 0 0.0 2 0.7
West Virginia 0 0 1 0.8 1 0.8
Wisconsin 4 2.1 2 10.6 6 12.7
Wyoming 0 0 0 0.0 0 0.0
Total 123 292.5 176 1,325.2 299 1,617.7
Source: DOE 2016c
In general, states enacted few notable policies to enhance CHP’s attractiveness in the year since we published the 2015 State Scorecard. However activities did increase support for CHP in some states, and we describe a sampling of these efforts below.
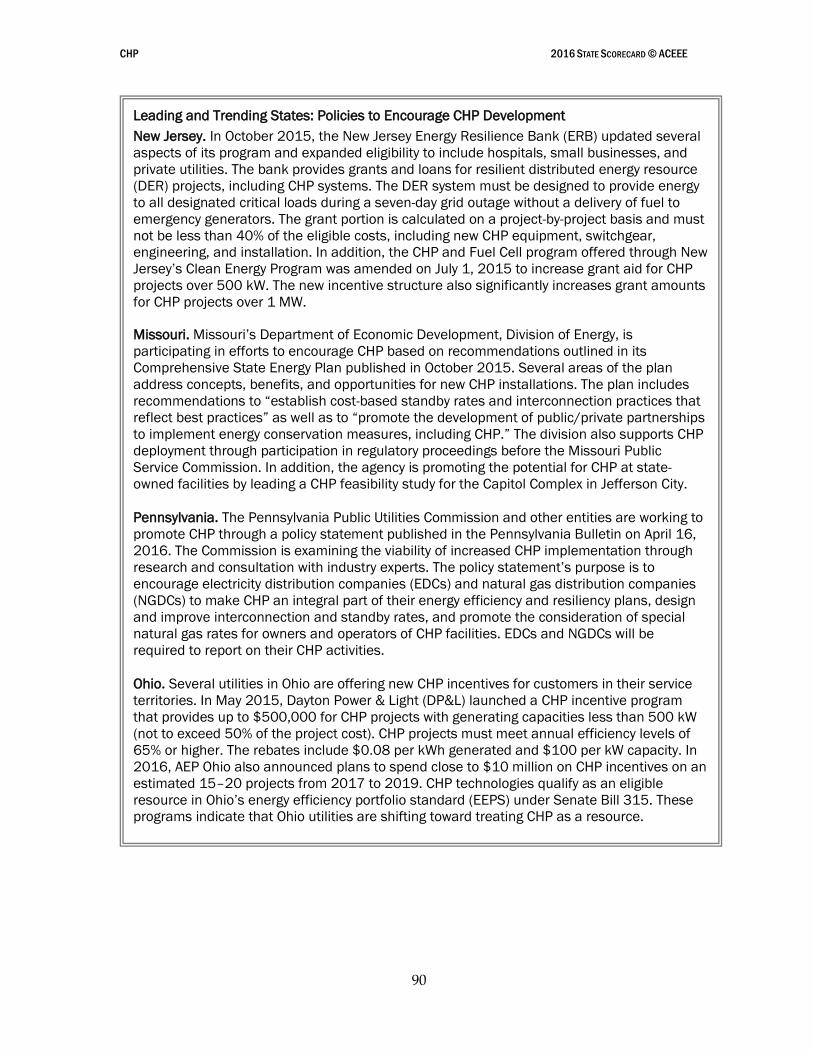
EMBARGOED
CHP 2016 STATE SCORECARD © ACEEE
90
Leading and Trending States: Policies to Encourage CHP Development
New Jersey. In October 2015, the New Jersey Energy Resilience Bank (ERB) updated several
aspects of its program and expanded eligibility to include hospitals, small businesses, and
private utilities. The bank provides grants and loans for resilient distributed energy resource
(DER) projects, including CHP systems. The DER system must be designed to provide energy
to all designated critical loads during a seven-day grid outage without a delivery of fuel to
emergency generators. The grant portion is calculated on a project-by-project basis and must
not be less than 40% of the eligible costs, including new CHP equipment, switchgear,
engineering, and installation. In addition, the CHP and Fuel Cell program offered through New
Jersey’s Clean Energy Program was amended on July 1, 2015 to increase grant aid for CHP
projects over 500 kW. The new incentive structure also significantly increases grant amounts
for CHP projects over 1 MW.
Missouri. Missouri’s Department of Economic Development, Division of Energy, is
participating in efforts to encourage CHP based on recommendations outlined in its
Comprehensive State Energy Plan published in October 2015. Several areas of the plan
address concepts, benefits, and opportunities for new CHP installations. The plan includes
recommendations to “establish cost-based standby rates and interconnection practices that
reflect best practices” as well as to “promote the development of public/private partnerships
to implement energy conservation measures, including CHP.” The division also supports CHP
deployment through participation in regulatory proceedings before the Missouri Public
Service Commission. In addition, the agency is promoting the potential for CHP at state-
owned facilities by leading a CHP feasibility study for the Capitol Complex in Jefferson City.
Pennsylvania. The Pennsylvania Public Utilities Commission and other entities are working to
promote CHP through a policy statement published in the Pennsylvania Bulletin on April 16,
2016. The Commission is examining the viability of increased CHP implementation through
research and consultation with industry experts. The policy statement’s purpose is to
encourage electricity distribution companies (EDCs) and natural gas distribution companies
(NGDCs) to make CHP an integral part of their energy efficiency and resiliency plans, design
and improve interconnection and standby rates, and promote the consideration of special
natural gas rates for owners and operators of CHP facilities. EDCs and NGDCs will be
required to report on their CHP activities.
Ohio. Several utilities in Ohio are offering new CHP incentives for customers in their service
territories. In May 2015, Dayton Power & Light (DP&L) launched a CHP incentive program
that provides up to $500,000 for CHP projects with generating capacities less than 500 kW
(not to exceed 50% of the project cost). CHP projects must meet annual efficiency levels of
65% or higher. The rebates include $0.08 per kWh generated and $100 per kW capacity. In
2016, AEP Ohio also announced plans to spend close to $10 million on CHP incentives on an
estimated 15–20 projects from 2017 to 2019. CHP technologies qualify as an eligible
resource in Ohio’s energy efficiency portfolio standard (EEPS) under Senate Bill 315. These
programs indicate that Ohio utilities are shifting toward treating CHP as a resource.
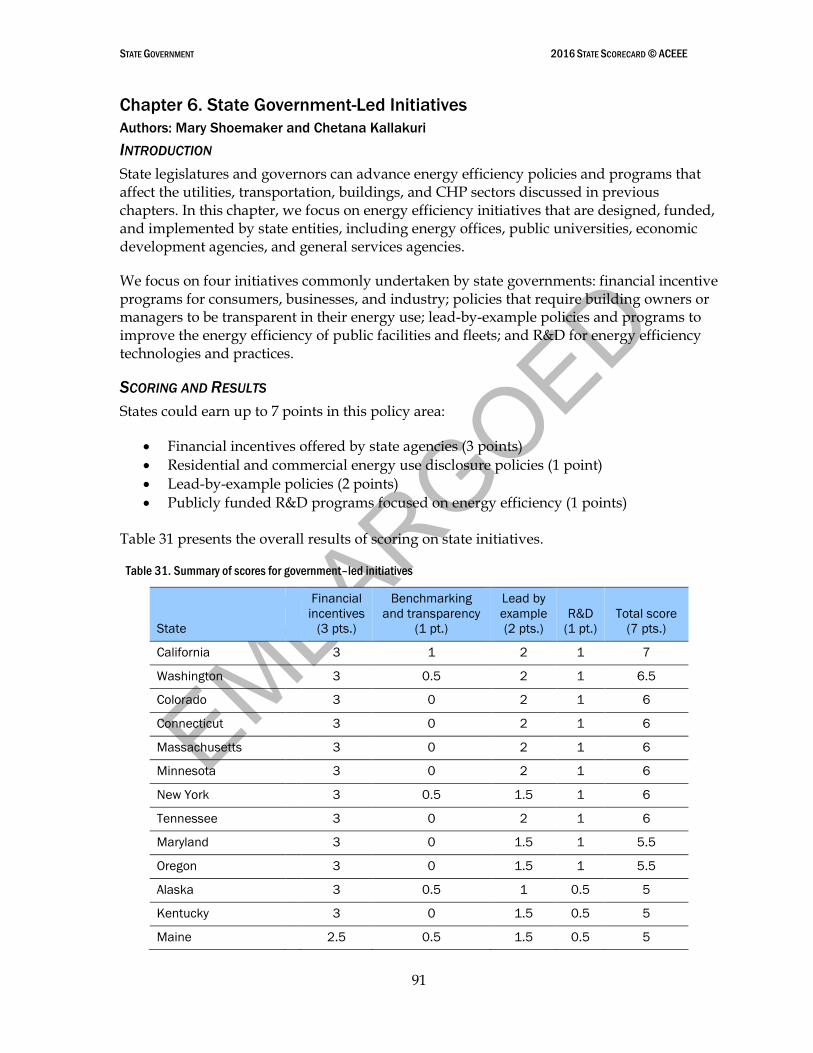
EMBARGOED
STATE GOVERNMENT 2016 STATE SCORECARD © ACEEE
91
Chapter 6. State Government-Led Initiatives
Authors: Mary Shoemaker and Chetana Kallakuri
INTRODUCTION
State legislatures and governors can advance energy efficiency policies and programs that affect the utilities, transportation, buildings, and CHP sectors discussed in previous chapters. In this chapter, we focus on energy efficiency initiatives that are designed, funded, and implemented by state entities, including energy offices, public universities, economic development agencies, and general services agencies.
We focus on four initiatives commonly undertaken by state governments: financial incentive programs for consumers, businesses, and industry; policies that require building owners or managers to be transparent in their energy use; lead-by-example policies and programs to improve the energy efficiency of public facilities and fleets; and R&D for energy efficiency technologies and practices.
SCORING AND RESULTS
States could earn up to 7 points in this policy area:
Financial incentives offered by state agencies (3 points)
Residential and commercial energy use disclosure policies (1 point)
Lead-by-example policies (2 points)
Publicly funded R&D programs focused on energy efficiency (1 points) Table 31 presents the overall results of scoring on state initiatives.
Table 31. Summary of scores for government–led initiatives
State
Financial
incentives
(3 pts.)
Benchmarking
and transparency
(1 pt.)
Lead by
example
(2 pts.)
R&D
(1 pt.)
Total score
(7 pts.)
California 3 1 2 1 7
Washington 3 0.5 2 1 6.5
Colorado 3 0 2 1 6
Connecticut 3 0 2 1 6
Massachusetts 3 0 2 1 6
Minnesota 3 0 2 1 6
New York 3 0.5 1.5 1 6
Tennessee 3 0 2 1 6
Maryland 3 0 1.5 1 5.5
Oregon 3 0 1.5 1 5.5
Alaska 3 0.5 1 0.5 5
Kentucky 3 0 1.5 0.5 5
Maine 2.5 0.5 1.5 0.5 5
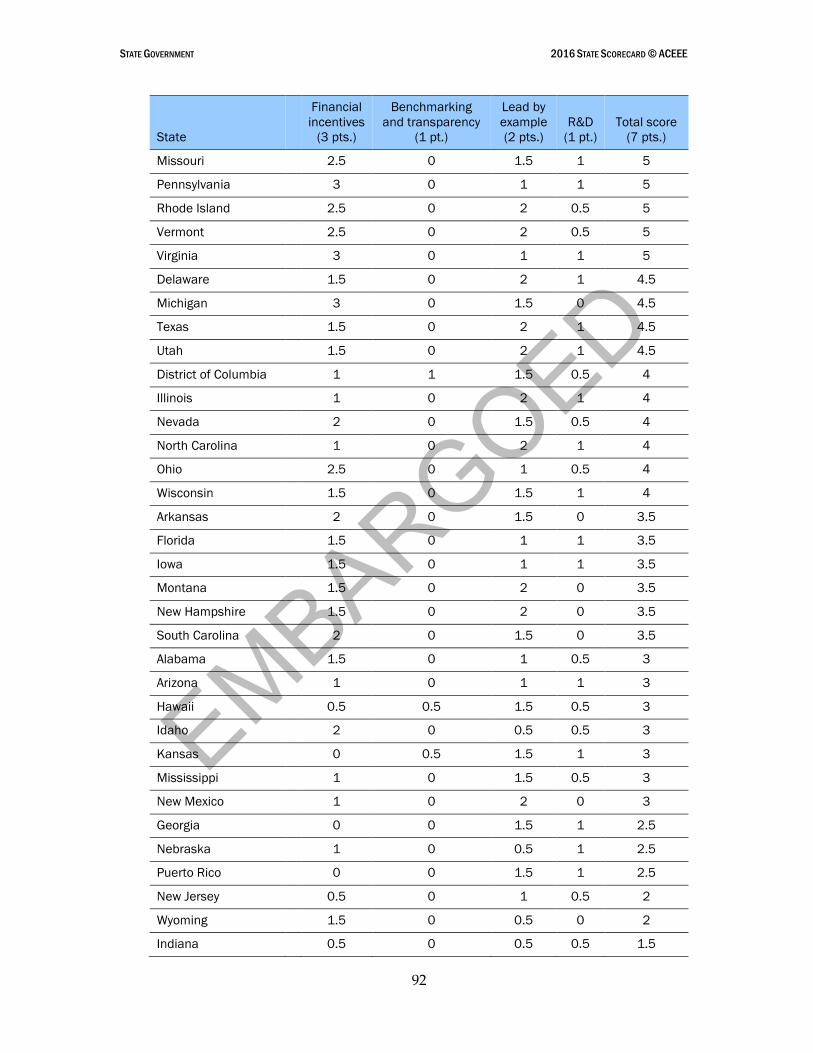
EMBARGOED
STATE GOVERNMENT 2016 STATE SCORECARD © ACEEE
92
State
Financial
incentives
(3 pts.)
Benchmarking
and transparency
(1 pt.)
Lead by
example
(2 pts.)
R&D
(1 pt.)
Total score
(7 pts.)
Missouri 2.5 0 1.5 1 5
Pennsylvania 3 0 1 1 5
Rhode Island 2.5 0 2 0.5 5
Vermont 2.5 0 2 0.5 5
Virginia 3 0 1 1 5
Delaware 1.5 0 2 1 4.5
Michigan 3 0 1.5 0 4.5
Texas 1.5 0 2 1 4.5
Utah 1.5 0 2 1 4.5
District of Columbia 1 1 1.5 0.5 4
Illinois 1 0 2 1 4
Nevada 2 0 1.5 0.5 4
North Carolina 1 0 2 1 4
Ohio 2.5 0 1 0.5 4
Wisconsin 1.5 0 1.5 1 4
Arkansas 2 0 1.5 0 3.5
Florida 1.5 0 1 1 3.5
Iowa 1.5 0 1 1 3.5
Montana 1.5 0 2 0 3.5
New Hampshire 1.5 0 2 0 3.5
South Carolina 2 0 1.5 0 3.5
Alabama 1.5 0 1 0.5 3
Arizona 1 0 1 1 3
Hawaii 0.5 0.5 1.5 0.5 3
Idaho 2 0 0.5 0.5 3
Kansas 0 0.5 1.5 1 3
Mississippi 1 0 1.5 0.5 3
New Mexico 1 0 2 0 3
Georgia 0 0 1.5 1 2.5
Nebraska 1 0 0.5 1 2.5
Puerto Rico 0 0 1.5 1 2.5
New Jersey 0.5 0 1 0.5 2
Wyoming 1.5 0 0.5 0 2
Indiana 0.5 0 0.5 0.5 1.5
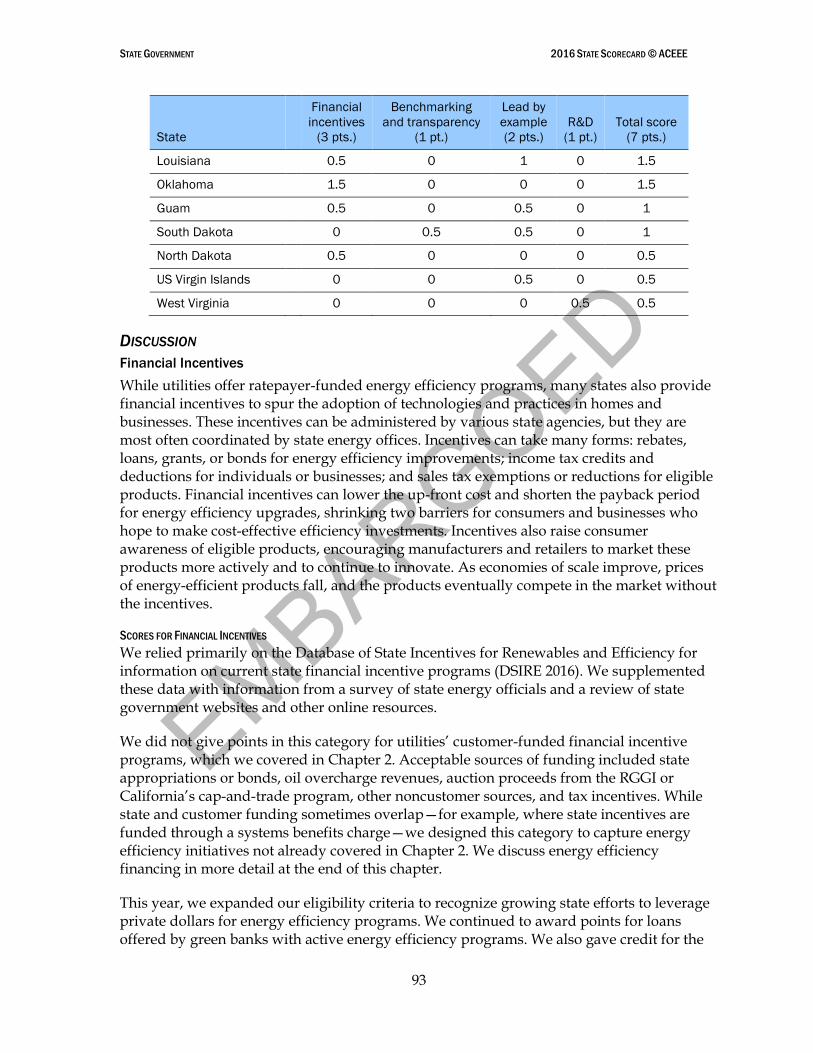
EMBARGOED
STATE GOVERNMENT 2016 STATE SCORECARD © ACEEE
93
State
Financial
incentives
(3 pts.)
Benchmarking
and transparency
(1 pt.)
Lead by
example
(2 pts.)
R&D
(1 pt.)
Total score
(7 pts.)
Louisiana 0.5 0 1 0 1.5
Oklahoma 1.5 0 0 0 1.5
Guam 0.5 0 0.5 0 1
South Dakota 0 0.5 0.5 0 1
North Dakota 0.5 0 0 0 0.5
US Virgin Islands 0 0 0.5 0 0.5
West Virginia 0 0 0 0.5 0.5
DISCUSSION
Financial Incentives
While utilities offer ratepayer-funded energy efficiency programs, many states also provide financial incentives to spur the adoption of technologies and practices in homes and businesses. These incentives can be administered by various state agencies, but they are most often coordinated by state energy offices. Incentives can take many forms: rebates, loans, grants, or bonds for energy efficiency improvements; income tax credits and deductions for individuals or businesses; and sales tax exemptions or reductions for eligible products. Financial incentives can lower the up-front cost and shorten the payback period for energy efficiency upgrades, shrinking two barriers for consumers and businesses who hope to make cost-effective efficiency investments. Incentives also raise consumer awareness of eligible products, encouraging manufacturers and retailers to market these products more actively and to continue to innovate. As economies of scale improve, prices of energy-efficient products fall, and the products eventually compete in the market without the incentives.
SCORES FOR FINANCIAL INCENTIVES
We relied primarily on the Database of State Incentives for Renewables and Efficiency for information on current state financial incentive programs (DSIRE 2016). We supplemented these data with information from a survey of state energy officials and a review of state government websites and other online resources.
We did not give points in this category for utilities’ customer-funded financial incentive programs, which we covered in Chapter 2. Acceptable sources of funding included state appropriations or bonds, oil overcharge revenues, auction proceeds from the RGGI or California’s cap-and-trade program, other noncustomer sources, and tax incentives. While state and customer funding sometimes overlap—for example, where state incentives are funded through a systems benefits charge—we designed this category to capture energy efficiency initiatives not already covered in Chapter 2. We discuss energy efficiency financing in more detail at the end of this chapter.
This year, we expanded our eligibility criteria to recognize growing state efforts to leverage private dollars for energy efficiency programs. We continued to award points for loans offered by green banks with active energy efficiency programs. We also gave credit for the
EMBARGOED
STATE GOVERNMENT 2016 STATE SCORECARD © ACEEE
94
PACE financing programs that many states are enabling. From 2009 to 2015, energy efficiency projects accounted for 48% of PACE financing (PACENation 2015). State legislatures pass and amend legislation enabling residential and/or commercial PACE, and localities and private program administrators typically run the programs, depending on the jurisdiction.51 Sometimes states play a more prominent role in PACE coordination by administering a statewide program or offering guidance to PACE providers (Fazeli 2016). Because programs are locally administered, we did not give extra credit for multiple active PACE programs; however we indicate in the table below whether state PACE activity is in the residential and/or commercial market. States earned up to 3 points for major financial incentive programs that encourage the purchase of energy-efficient products. We judged these programs on their relative strength, customer reach, and impact.52 Incentive programs generally received 0.5 points each, but several states have major incentive programs that we deemed worth 1 point each; these include Arizona, Idaho, Nebraska, Nevada, Texas, Washington, and Wisconsin. We credited states that have enabled PACE and have at least one active PACE program. States could receive a maximum of 0.5 points for PACE. Table 32 describes our scoring of state financial incentives.
The number of financial incentive programs a state implements may not fully reflect the robustness of its efforts, so this year we attempted to collect additional information from state energy offices regarding state budgets for financial incentives, program participation rates, verified savings from incentives, and leveraging of private capital. These data are presented in Appendices H, I, and J. For additional information, see the end of this chapter, where we discuss potential new metrics for state-led initiatives.
51 Currently, 32 states plus Washington, DC authorize PACE (PACENation 2016). While most states’ PACE activity is in the commercial market, there have been several residential PACE programs over the last several years. In July 2016, the Federal Housing Administration, the DOE, and the Department of Veteran Affairs issued new guidance and best practices on residential PACE, which are expected to lay the groundwork for future residential PACE programs. For more information on these announcements, part of the White House’s Clean Energy Savings for All Americans initiative, visit: www.whitehouse.gov/the-press-office/2016/07/19/fact-sheet-obama-administration-announces-clean-energy-savings-all.
52 Energy-efficient products include any product or process that reduces energy consumption. While renewable energy technologies such as solar hot-water heating may reduce energy consumption, they are often rolled into larger programs that focus on renewable energy rather than energy efficiency. ACEEE would like to credit states for renewable energy technologies that reduce energy consumption, but they are often difficult to distinguish from broader renewable energy incentives that fall outside of the scope of the State Scorecard. As a result, they are not included at this time.

EMBARGOED
STATE GOVERNMENT 2016 STATE SCORECARD © ACEEE
95
Table 32. State scoring on major financial incentive programs
State Major state financial incentives for energy efficiency
Score
(3 pts.)
Alaska New home rebate program; five loan programs; two grant programs 3
California
Five grants; two loans (public sector and education); a loan loss
reserve; a rebate program; an R&D program; commercial and
residential PACE financing
3
Colorado
Mortgage discount for ENERGY STAR homes; loan loss reserve
program; school loan program; Dairy and Irrigation Efficiency audit
program; commercial and residential PACE financing
3
Connecticut Several loans; financing for multifamily and low- to moderate- income
residential projects; commercial financing 3
Kentucky
Personal and corporate energy efficiency tax credits; green bank loan
for state agencies; sales tax exemption for energy-efficient products;
three grants; commercial PACE financing
3
Maryland
Different loans and grant programs for agricultural residential,
multifamily, commercial, and industrial sectors; Smart Energy
Communities Program; loans for state agencies; commercial PACE
financing
3
Massachusetts Alternative Energy and Energy Conservation Patent Exemption
(personal and corporate); one bond; three grants 3
Michigan Michigan Saves financing; five loans; four grants; a loan loss reserve;
commercial PACE financing 3
Minnesota Six loans; two revolving loans; one loan loss reserve; commercial
PACE financing 3
New York
Green Jobs Green NY Program; rebate, loan, grant, financing, and
incentive programs; Energy Conservation Improvements Property Tax
Exemption; green bank; commercial and residential PACE financing
3
Oregon Several residential and business energy tax credits; one loan program;
one grant program; commercial PACE financing 3
Pennsylvania Alternative Energy Investment Fund; Pennsylvania Sustainable Energy
Finance Program; several grant and loan programs 3
Washington Major grant program for energy efficiency in public facilities and local
communities; three loans; two grants 3
Virginia
Energy Leasing Program for state-owned facilities; Clean Energy
Manufacturing Grant Program; one loan program; personal and
property tax incentives; commercial PACE financing; Clean Energy
Development and Services (CEDS) program
3
Tennessee Energy Efficient Schools Initiative (loans and grants); two grants; one
loan; EmPower TN incentives 3
Vermont Three loan programs; Weatherization Trust Fund; Thermal Efficiency
Finance Program 2.5
Missouri Two loan programs; one personal tax deduction; commercial and
residential PACE financing 2.5
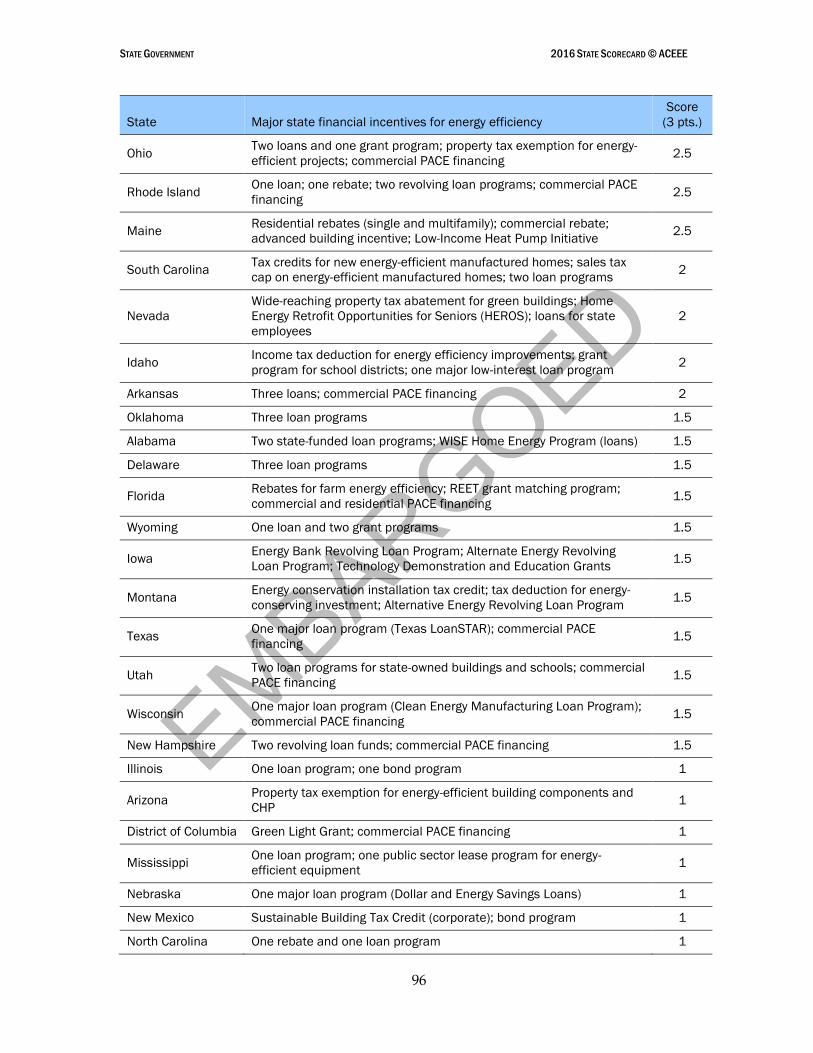
EMBARGOED
STATE GOVERNMENT 2016 STATE SCORECARD © ACEEE
96
State Major state financial incentives for energy efficiency
Score
(3 pts.)
Ohio Two loans and one grant program; property tax exemption for energy-
efficient projects; commercial PACE financing 2.5
Rhode Island One loan; one rebate; two revolving loan programs; commercial PACE
financing 2.5
Maine Residential rebates (single and multifamily); commercial rebate;
advanced building incentive; Low-Income Heat Pump Initiative 2.5
South Carolina Tax credits for new energy-efficient manufactured homes; sales tax
cap on energy-efficient manufactured homes; two loan programs 2
Nevada
Wide-reaching property tax abatement for green buildings; Home
Energy Retrofit Opportunities for Seniors (HEROS); loans for state
employees
2
Idaho Income tax deduction for energy efficiency improvements; grant
program for school districts; one major low-interest loan program 2
Arkansas Three loans; commercial PACE financing 2
Oklahoma Three loan programs 1.5
Alabama Two state-funded loan programs; WISE Home Energy Program (loans) 1.5
Delaware Three loan programs 1.5
Florida Rebates for farm energy efficiency; REET grant matching program;
commercial and residential PACE financing 1.5
Wyoming One loan and two grant programs 1.5
Iowa Energy Bank Revolving Loan Program; Alternate Energy Revolving
Loan Program; Technology Demonstration and Education Grants 1.5
Montana Energy conservation installation tax credit; tax deduction for energy-
conserving investment; Alternative Energy Revolving Loan Program 1.5
Texas One major loan program (Texas LoanSTAR); commercial PACE
financing 1.5
Utah Two loan programs for state-owned buildings and schools; commercial
PACE financing 1.5
Wisconsin One major loan program (Clean Energy Manufacturing Loan Program);
commercial PACE financing 1.5
New Hampshire Two revolving loan funds; commercial PACE financing 1.5
Illinois One loan program; one bond program 1
Arizona Property tax exemption for energy-efficient building components and
CHP 1
District of Columbia Green Light Grant; commercial PACE financing 1
Mississippi One loan program; one public sector lease program for energy-
efficient equipment 1
Nebraska One major loan program (Dollar and Energy Savings Loans) 1
New Mexico Sustainable Building Tax Credit (corporate); bond program 1
North Carolina One rebate and one loan program 1
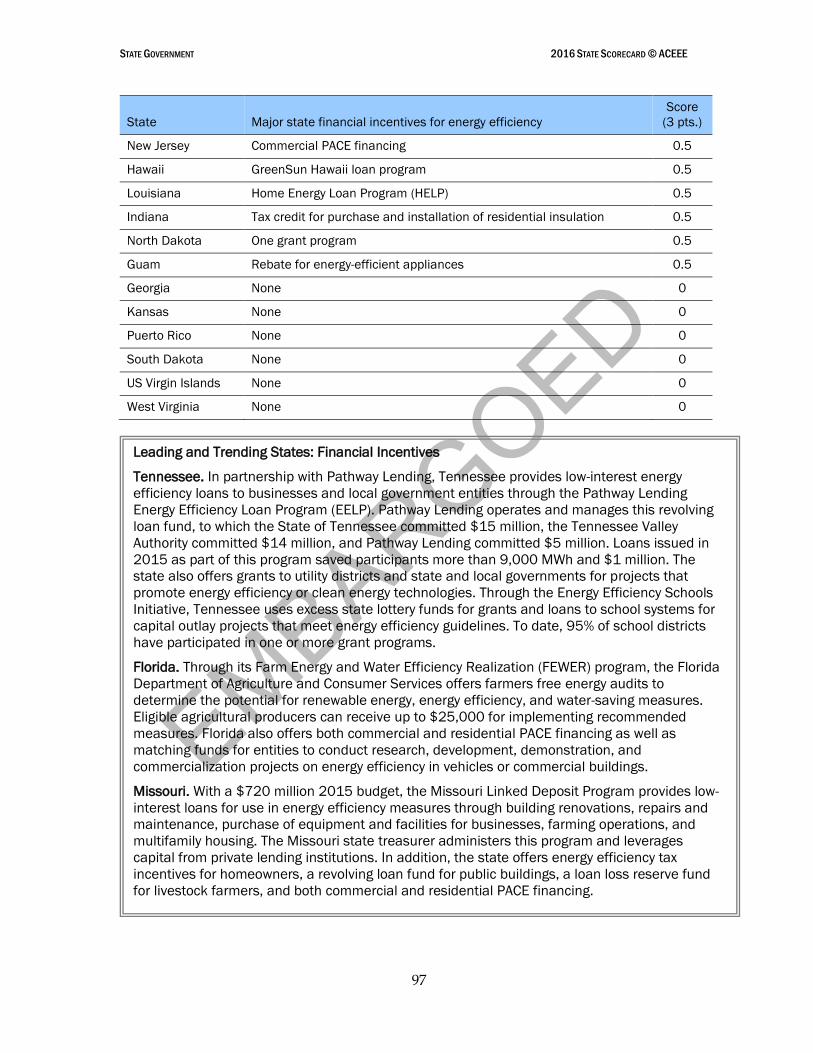
EMBARGOED
STATE GOVERNMENT 2016 STATE SCORECARD © ACEEE
97
State Major state financial incentives for energy efficiency
Score
(3 pts.)
New Jersey Commercial PACE financing 0.5
Hawaii GreenSun Hawaii loan program 0.5
Louisiana Home Energy Loan Program (HELP) 0.5
Indiana Tax credit for purchase and installation of residential insulation 0.5
North Dakota One grant program 0.5
Guam Rebate for energy-efficient appliances 0.5
Georgia None 0
Kansas None 0
Puerto Rico None 0
South Dakota None 0
US Virgin Islands None 0
West Virginia None 0
Leading and Trending States: Financial Incentives
Tennessee. In partnership with Pathway Lending, Tennessee provides low-interest energy
efficiency loans to businesses and local government entities through the Pathway Lending
Energy Efficiency Loan Program (EELP). Pathway Lending operates and manages this revolving
loan fund, to which the State of Tennessee committed $15 million, the Tennessee Valley
Authority committed $14 million, and Pathway Lending committed $5 million. Loans issued in
2015 as part of this program saved participants more than 9,000 MWh and $1 million. The
state also offers grants to utility districts and state and local governments for projects that
promote energy efficiency or clean energy technologies. Through the Energy Efficiency Schools
Initiative, Tennessee uses excess state lottery funds for grants and loans to school systems for
capital outlay projects that meet energy efficiency guidelines. To date, 95% of school districts
have participated in one or more grant programs.
Florida. Through its Farm Energy and Water Efficiency Realization (FEWER) program, the Florida
Department of Agriculture and Consumer Services offers farmers free energy audits to
determine the potential for renewable energy, energy efficiency, and water-saving measures.
Eligible agricultural producers can receive up to $25,000 for implementing recommended
measures. Florida also offers both commercial and residential PACE financing as well as
matching funds for entities to conduct research, development, demonstration, and
commercialization projects on energy efficiency in vehicles or commercial buildings.
Missouri. With a $720 million 2015 budget, the Missouri Linked Deposit Program provides low-
interest loans for use in energy efficiency measures through building renovations, repairs and
maintenance, purchase of equipment and facilities for businesses, farming operations, and
multifamily housing. The Missouri state treasurer administers this program and leverages
capital from private lending institutions. In addition, the state offers energy efficiency tax
incentives for homeowners, a revolving loan fund for public buildings, a loan loss reserve fund
for livestock farmers, and both commercial and residential PACE financing.
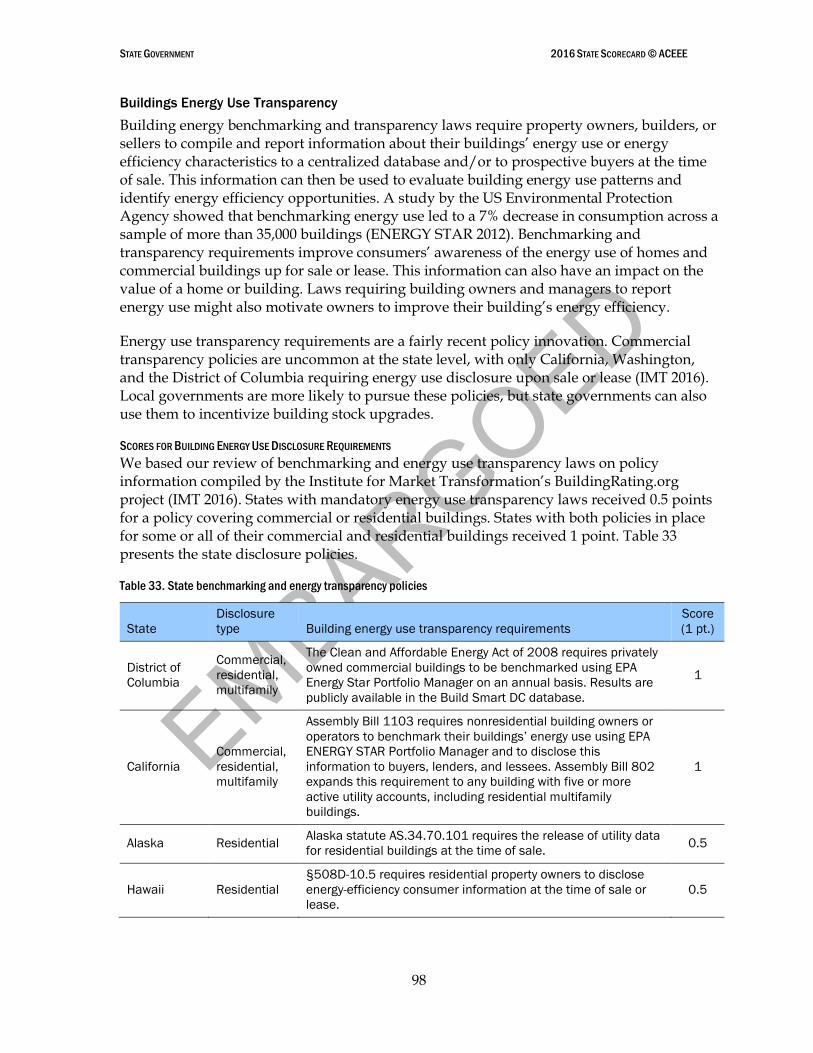
EMBARGOED
STATE GOVERNMENT 2016 STATE SCORECARD © ACEEE
98
Buildings Energy Use Transparency
Building energy benchmarking and transparency laws require property owners, builders, or sellers to compile and report information about their buildings’ energy use or energy efficiency characteristics to a centralized database and/or to prospective buyers at the time of sale. This information can then be used to evaluate building energy use patterns and identify energy efficiency opportunities. A study by the US Environmental Protection Agency showed that benchmarking energy use led to a 7% decrease in consumption across a sample of more than 35,000 buildings (ENERGY STAR 2012). Benchmarking and transparency requirements improve consumers’ awareness of the energy use of homes and commercial buildings up for sale or lease. This information can also have an impact on the value of a home or building. Laws requiring building owners and managers to report energy use might also motivate owners to improve their building’s energy efficiency.
Energy use transparency requirements are a fairly recent policy innovation. Commercial transparency policies are uncommon at the state level, with only California, Washington, and the District of Columbia requiring energy use disclosure upon sale or lease (IMT 2016). Local governments are more likely to pursue these policies, but state governments can also use them to incentivize building stock upgrades.
SCORES FOR BUILDING ENERGY USE DISCLOSURE REQUIREMENTS
We based our review of benchmarking and energy use transparency laws on policy information compiled by the Institute for Market Transformation’s BuildingRating.org project (IMT 2016). States with mandatory energy use transparency laws received 0.5 points for a policy covering commercial or residential buildings. States with both policies in place for some or all of their commercial and residential buildings received 1 point. Table 33 presents the state disclosure policies.
Table 33. State benchmarking and energy transparency policies
State
Disclosure
type Building energy use transparency requirements
Score
(1 pt.)
District of
Columbia
Commercial,
residential,
multifamily
The Clean and Affordable Energy Act of 2008 requires privately
owned commercial buildings to be benchmarked using EPA
Energy Star Portfolio Manager on an annual basis. Results are
publicly available in the Build Smart DC database.
1
California
Commercial,
residential,
multifamily
Assembly Bill 1103 requires nonresidential building owners or
operators to benchmark their buildings’ energy use using EPA
ENERGY STAR Portfolio Manager and to disclose this
information to buyers, lenders, and lessees. Assembly Bill 802
expands this requirement to any building with five or more
active utility accounts, including residential multifamily
buildings.
1
Alaska Residential Alaska statute AS.34.70.101 requires the release of utility data
for residential buildings at the time of sale. 0.5
Hawaii Residential
§508D-10.5 requires residential property owners to disclose
energy-efficiency consumer information at the time of sale or
lease.
0.5
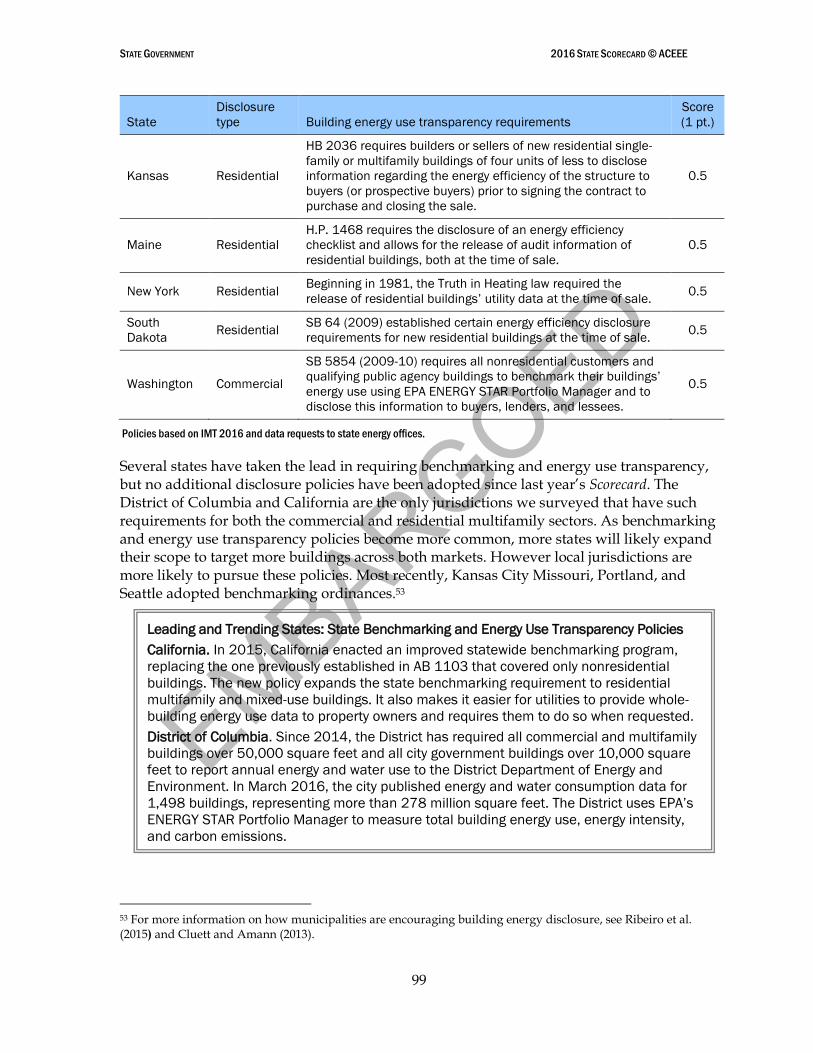
EMBARGOED
STATE GOVERNMENT 2016 STATE SCORECARD © ACEEE
99
State
Disclosure
type Building energy use transparency requirements
Score
(1 pt.)
Kansas Residential
HB 2036 requires builders or sellers of new residential single-
family or multifamily buildings of four units of less to disclose
information regarding the energy efficiency of the structure to
buyers (or prospective buyers) prior to signing the contract to
purchase and closing the sale.
0.5
Maine Residential
H.P. 1468 requires the disclosure of an energy efficiency
checklist and allows for the release of audit information of
residential buildings, both at the time of sale.
0.5
New York Residential Beginning in 1981, the Truth in Heating law required the
release of residential buildings’ utility data at the time of sale. 0.5
South
Dakota Residential
SB 64 (2009) established certain energy efficiency disclosure
requirements for new residential buildings at the time of sale. 0.5
Washington Commercial
SB 5854 (2009-10) requires all nonresidential customers and
qualifying public agency buildings to benchmark their buildings’
energy use using EPA ENERGY STAR Portfolio Manager and to
disclose this information to buyers, lenders, and lessees.
0.5
Policies based on IMT 2016 and data requests to state energy offices.
Several states have taken the lead in requiring benchmarking and energy use transparency, but no additional disclosure policies have been adopted since last year’s Scorecard. The District of Columbia and California are the only jurisdictions we surveyed that have such requirements for both the commercial and residential multifamily sectors. As benchmarking and energy use transparency policies become more common, more states will likely expand their scope to target more buildings across both markets. However local jurisdictions are more likely to pursue these policies. Most recently, Kansas City Missouri, Portland, and Seattle adopted benchmarking ordinances.53
53 For more information on how municipalities are encouraging building energy disclosure, see Ribeiro et al. (2015) and Cluett and Amann (2013).
Leading and Trending States: State Benchmarking and Energy Use Transparency Policies
California. In 2015, California enacted an improved statewide benchmarking program,
replacing the one previously established in AB 1103 that covered only nonresidential
buildings. The new policy expands the state benchmarking requirement to residential
multifamily and mixed-use buildings. It also makes it easier for utilities to provide whole-
building energy use data to property owners and requires them to do so when requested.
District of Columbia. Since 2014, the District has required all commercial and multifamily
buildings over 50,000 square feet and all city government buildings over 10,000 square
feet to report annual energy and water use to the District Department of Energy and
Environment. In March 2016, the city published energy and water consumption data for
1,498 buildings, representing more than 278 million square feet. The District uses EPA’s
ENERGY STAR Portfolio Manager to measure total building energy use, energy intensity,
and carbon emissions.
EMBARGOED
STATE GOVERNMENT 2016 STATE SCORECARD © ACEEE
100
Lead by Example
State governments can advance energy-efficient technologies and practices in the marketplace by adopting policies and programs to save energy in public-sector buildings and fleets, a practice commonly referred to as lead by example. In the current environment of fiscal austerity, lead-by-example policies and programs are a proven strategy for improving the operational efficiency and economic performance of states’ assets. Lead-by-example initiatives also reduce the negative environmental and health impacts of high energy use and promote energy efficiency to the broader public.54
STATE BUILDING REQUIREMENTS
States often adopt policies and comprehensive programs to reduce energy use in state buildings. State governments operate numerous facilities, including office buildings, public schools, colleges, and universities, the energy costs of which can account for as much as 10% of a typical government’s annual operating budget. In addition, the energy consumed by a state's facilities can account for as much as 90% of its GHG emissions (DOE 2008). Only a handful of states have not yet implemented an energy efficiency policy for public facilities. Mandatory energy savings targets for new and existing state government facilities are the most widely adopted state measures. These energy savings requirements encourage states to invest in the construction of new, efficient buildings and retrofit projects, lowering energy bills and promoting economic development in the energy services and construction sectors.
To earn points, energy savings targets must commit state government facilities to a specific energy reduction goal over a distinct time period. We also gave 0.5 points to states that adopted efficiency requirements for public facilities that exceeded the statewide building energy code.
BENCHMARKING REQUIREMENTS FOR PUBLIC BUILDINGS
Proper building energy management is a critical element of successful energy efficiency initiatives in the public sector. Benchmarking energy use in public-sector buildings through tailored or widely available tools such as ENERGY STAR Portfolio Manager ensures a comprehensive set of energy use data that can drive cost-effective energy efficiency investments.55 Comparing building energy performance across agencies can also help prioritize energy efficiency projects.
Through benchmarking policies, states and cities require all buildings to undergo a regular energy audit or have their energy performance tracked using Portfolio Manager or another recognized tool. These policies were awarded 0.5 points. Large-scale public-sector energy benchmarking programs could also qualify for the 0.5 points.
54 Energy efficiency reduces society’s need to burn fossil fuels to generate electricity, thereby reducing harmful pollutants from fossil fuel combustion. ACEEE and Physicians for Social Responsibility explore this connection in a joint fact sheet: aceee.org/fact-sheet/ee-and-health.
55 Some states have their own databases of public building energy use that integrate with the ENERGY STAR Portfolio Manager. For example, Maryland’s EnergyCap database compiles the energy use (based on utility bills) of all public buildings in the state and provides a means of comparing buildings owned by different state agencies.
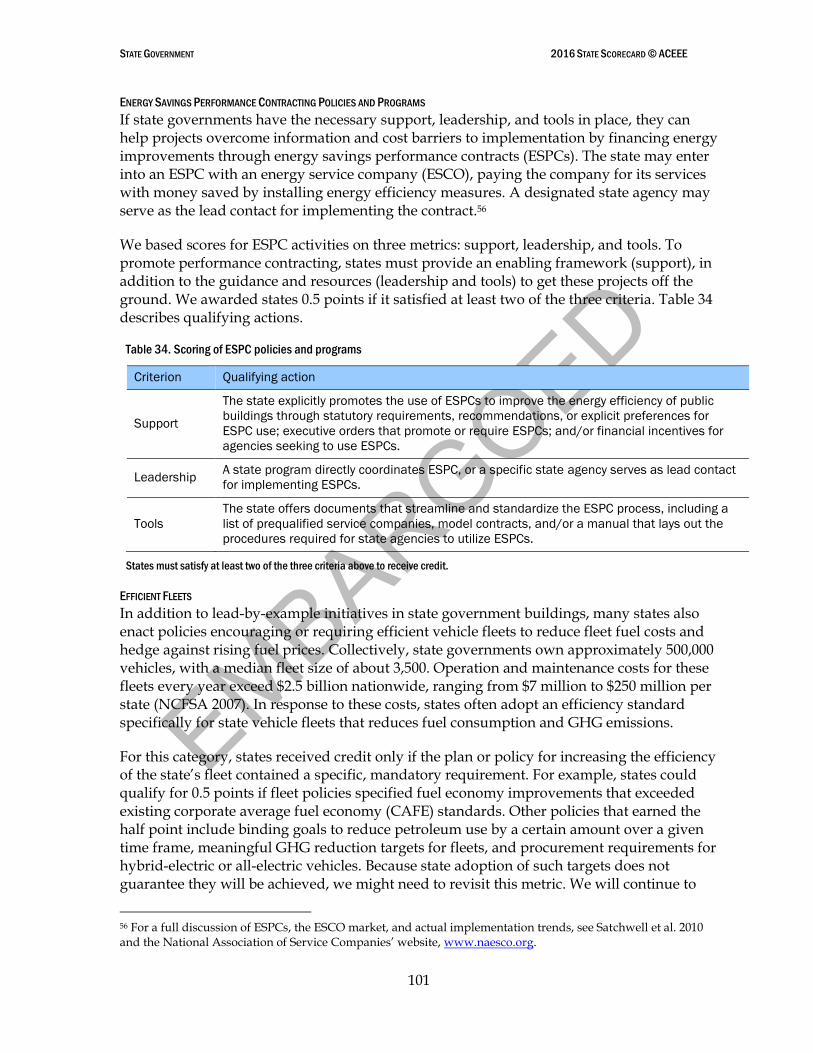
EMBARGOED
STATE GOVERNMENT 2016 STATE SCORECARD © ACEEE
101
ENERGY SAVINGS PERFORMANCE CONTRACTING POLICIES AND PROGRAMS
If state governments have the necessary support, leadership, and tools in place, they can help projects overcome information and cost barriers to implementation by financing energy improvements through energy savings performance contracts (ESPCs). The state may enter into an ESPC with an energy service company (ESCO), paying the company for its services with money saved by installing energy efficiency measures. A designated state agency may serve as the lead contact for implementing the contract.56
We based scores for ESPC activities on three metrics: support, leadership, and tools. To promote performance contracting, states must provide an enabling framework (support), in addition to the guidance and resources (leadership and tools) to get these projects off the ground. We awarded states 0.5 points if it satisfied at least two of the three criteria. Table 34 describes qualifying actions.
Table 34. Scoring of ESPC policies and programs
Criterion Qualifying action
Support
The state explicitly promotes the use of ESPCs to improve the energy efficiency of public
buildings through statutory requirements, recommendations, or explicit preferences for
ESPC use; executive orders that promote or require ESPCs; and/or financial incentives for
agencies seeking to use ESPCs.
Leadership A state program directly coordinates ESPC, or a specific state agency serves as lead contact
for implementing ESPCs.
Tools
The state offers documents that streamline and standardize the ESPC process, including a
list of prequalified service companies, model contracts, and/or a manual that lays out the
procedures required for state agencies to utilize ESPCs.
States must satisfy at least two of the three criteria above to receive credit.
EFFICIENT FLEETS
In addition to lead-by-example initiatives in state government buildings, many states also enact policies encouraging or requiring efficient vehicle fleets to reduce fleet fuel costs and hedge against rising fuel prices. Collectively, state governments own approximately 500,000 vehicles, with a median fleet size of about 3,500. Operation and maintenance costs for these fleets every year exceed $2.5 billion nationwide, ranging from $7 million to $250 million per state (NCFSA 2007). In response to these costs, states often adopt an efficiency standard specifically for state vehicle fleets that reduces fuel consumption and GHG emissions.
For this category, states received credit only if the plan or policy for increasing the efficiency of the state’s fleet contained a specific, mandatory requirement. For example, states could qualify for 0.5 points if fleet policies specified fuel economy improvements that exceeded existing corporate average fuel economy (CAFE) standards. Other policies that earned the half point include binding goals to reduce petroleum use by a certain amount over a given time frame, meaningful GHG reduction targets for fleets, and procurement requirements for hybrid-electric or all-electric vehicles. Because state adoption of such targets does not guarantee they will be achieved, we might need to revisit this metric. We will continue to
56 For a full discussion of ESPCs, the ESCO market, and actual implementation trends, see Satchwell et al. 2010 and the National Association of Service Companies’ website, www.naesco.org.
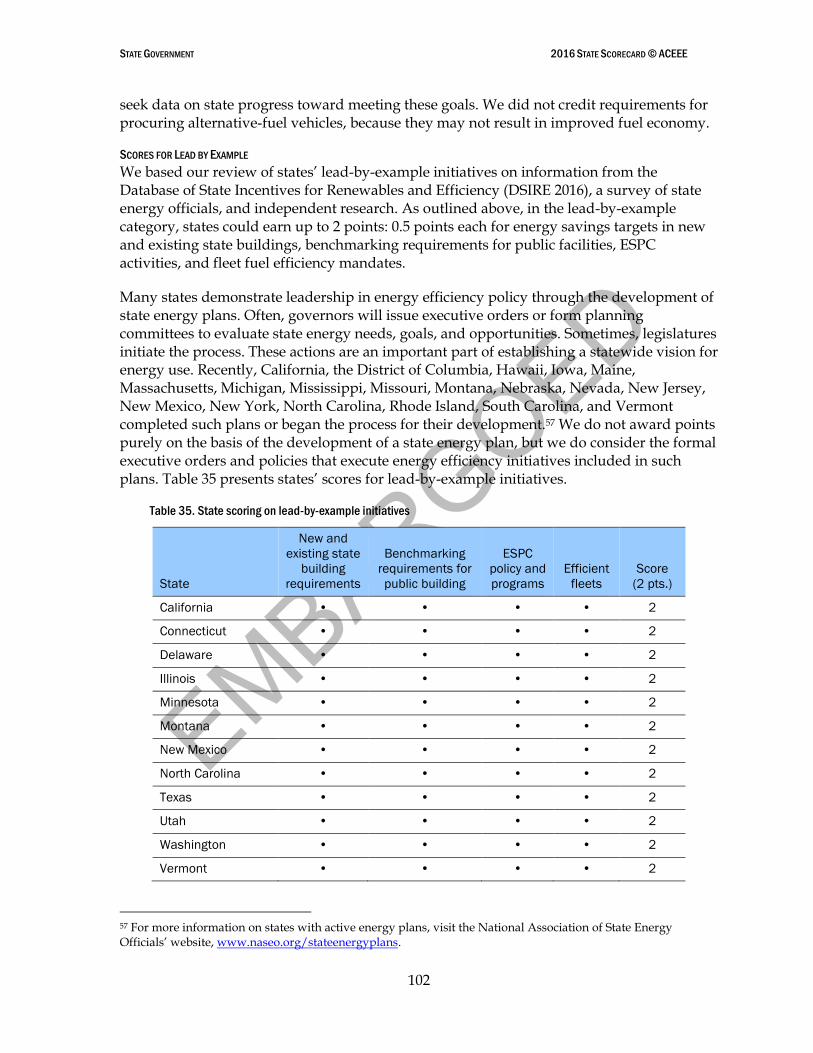
EMBARGOED
STATE GOVERNMENT 2016 STATE SCORECARD © ACEEE
102
seek data on state progress toward meeting these goals. We did not credit requirements for procuring alternative-fuel vehicles, because they may not result in improved fuel economy.
SCORES FOR LEAD BY EXAMPLE
We based our review of states’ lead-by-example initiatives on information from the Database of State Incentives for Renewables and Efficiency (DSIRE 2016), a survey of state energy officials, and independent research. As outlined above, in the lead-by-example category, states could earn up to 2 points: 0.5 points each for energy savings targets in new and existing state buildings, benchmarking requirements for public facilities, ESPC activities, and fleet fuel efficiency mandates.
Many states demonstrate leadership in energy efficiency policy through the development of state energy plans. Often, governors will issue executive orders or form planning committees to evaluate state energy needs, goals, and opportunities. Sometimes, legislatures initiate the process. These actions are an important part of establishing a statewide vision for energy use. Recently, California, the District of Columbia, Hawaii, Iowa, Maine, Massachusetts, Michigan, Mississippi, Missouri, Montana, Nebraska, Nevada, New Jersey, New Mexico, New York, North Carolina, Rhode Island, South Carolina, and Vermont completed such plans or began the process for their development.57 We do not award points purely on the basis of the development of a state energy plan, but we do consider the formal executive orders and policies that execute energy efficiency initiatives included in such plans. Table 35 presents states’ scores for lead-by-example initiatives.
Table 35. State scoring on lead-by-example initiatives
State
New and
existing state
building
requirements
Benchmarking
requirements for
public building
ESPC
policy and
programs
Efficient
fleets
Score
(2 pts.)
California • • • • 2
Connecticut • • • • 2
Delaware • • • • 2
Illinois • • • • 2
Minnesota • • • • 2
Montana • • • • 2
New Mexico • • • • 2
North Carolina • • • • 2
Texas • • • • 2
Utah • • • • 2
Washington • • • • 2
Vermont • • • • 2
57 For more information on states with active energy plans, visit the National Association of State Energy Officials’ website, www.naseo.org/stateenergyplans.
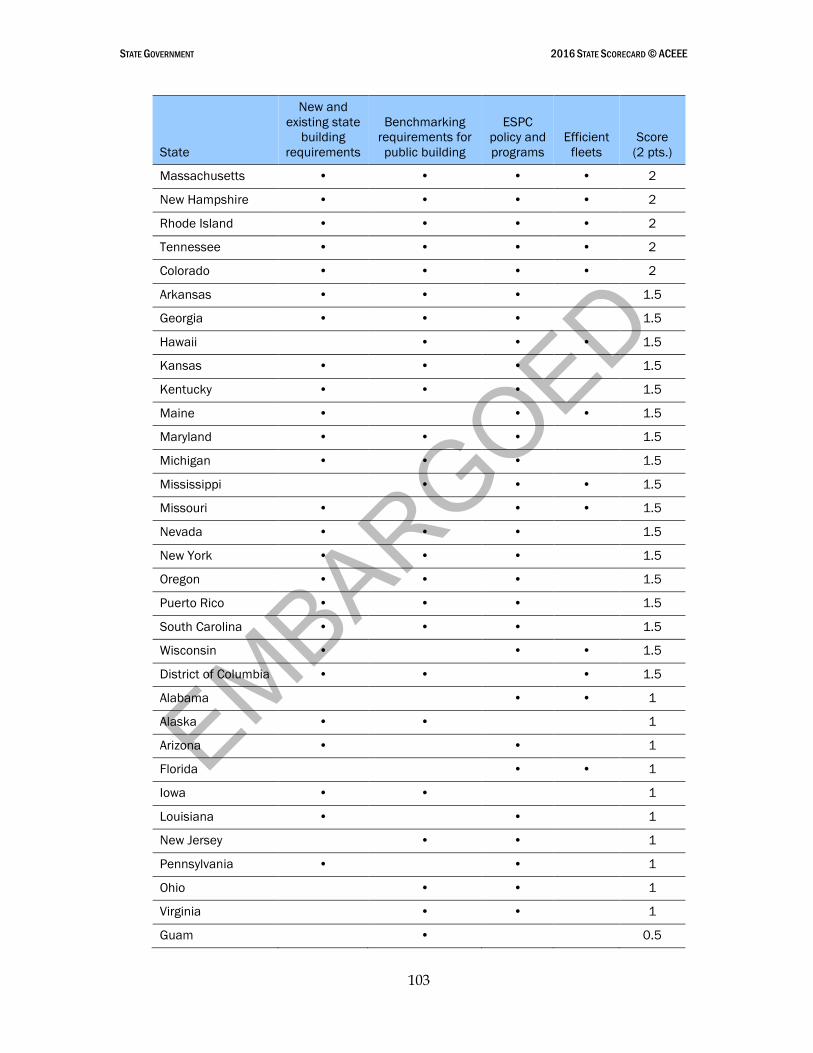
EMBARGOED
STATE GOVERNMENT 2016 STATE SCORECARD © ACEEE
103
State
New and
existing state
building
requirements
Benchmarking
requirements for
public building
ESPC
policy and
programs
Efficient
fleets
Score
(2 pts.)
Massachusetts • • • • 2
New Hampshire • • • • 2
Rhode Island • • • • 2
Tennessee • • • • 2
Colorado • • • • 2
Arkansas • • • 1.5
Georgia • • • 1.5
Hawaii • • • 1.5
Kansas • • • 1.5
Kentucky • • • 1.5
Maine • • • 1.5
Maryland • • • 1.5
Michigan • • • 1.5
Mississippi • • • 1.5
Missouri • • • 1.5
Nevada • • • 1.5
New York • • • 1.5
Oregon • • • 1.5
Puerto Rico • • • 1.5
South Carolina • • • 1.5
Wisconsin • • • 1.5
District of Columbia • • • 1.5
Alabama • • 1
Alaska • • 1
Arizona • • 1
Florida • • 1
Iowa • • 1
Louisiana • • 1
New Jersey • • 1
Pennsylvania • • 1
Ohio • • 1
Virginia • • 1
Guam • 0.5

EMBARGOED
STATE GOVERNMENT 2016 STATE SCORECARD © ACEEE
104
State
New and
existing state
building
requirements
Benchmarking
requirements for
public building
ESPC
policy and
programs
Efficient
fleets
Score
(2 pts.)
Idaho • 0.5
Indiana • 0.5
Nebraska • 0.5
South Dakota • 0.5
US Virgin Islands • 0.5
Wyoming • 0.5
Oklahoma 0
West Virginia 0
North Dakota 0
EMBARGOED
STATE GOVERNMENT 2016 STATE SCORECARD © ACEEE
105
Leading and Trending States: Lead-by-Example Initiatives
Connecticut. As part of a goal to reduce state facilities’ energy consumption by 20% by 2018
(CGS §16a-37u), Connecticut state agencies must establish an energy baseline, identify
energy savings opportunities, and implement energy efficiency measures. The state requires
the Department of Energy and Environmental Protection (DEEP) to benchmark and publicly
disclose the energy and water consumption of state-owned or -operated buildings of 10,000
square feet or more. To date, staff members have benchmarked more than 40% of state
buildings. To help with these efforts, the Institute for Sustainable Energy (ISE) runs a
benchmarking help desk, providing towns, state agencies, and schools training and technical
assistance on benchmarking and the use of ENERGY STAR Portfolio Manager. Connecticut
also recently tightened its High Performance Building Performance Standard, which now
requires state construction and renovation projects to achieve a score of 75 or more on EPA’s
ENERGY STAR Target Finder tool.
Vermont. In 2015, Governor Raimondo signed Executive Order 15-17, establishing the Lead
by Example program within the state’s Office of Energy Resources (OER) to oversee efforts to
reduce energy consumption and GHG emissions in state facilities. This executive order also
requires state agencies to reduce energy consumption by 10% by FY 2019, from a 2014
baseline. OER must establish interim goals, publicly disclose state energy data, and provide
agencies with technical assistance. The state also set the goal that at least 25% of new light-
duty fleet purchases and leases be zero-emissions vehicles by 2025.
Utah. In 2015, the Utah State Legislature enacted a requirement that all state buildings
annually report their utility expenditures, energy and water consumption, and cost information
at the building level. Each state agency must develop strategies for improving energy
efficiency and designate a staff member responsible for coordinating these efforts. The State
Building Board sends annual progress reports to the governor and the legislature. In addition,
the state provides performance contracting technical support to public entities through a list
of prequalified ESCOs, a list of prequalified third-party ESCO service reviewers, and the
reinstatement of the Utah Chapter of the Energy Services Coalition.
Minnesota. Over the past decade, the state of Minnesota has shown its commitment to
sustainable buildings by providing leadership, setting high performance standards, and
implementing an integrated framework of programs that provide a comprehensive system for
designing, managing, and improving building energy performance. Beginning with aggressive
standards for state buildings based on the long-term goal of having a zero-carbon building
stock by 2030, the state offers a complementary benchmarking program for tracking energy
use and provides technical, contractual, and financial performance contracting assistance to
public entities through its Office of Guaranteed Energy Savings Program. Additionally, new on-
road vehicles must have a fuel efficiency rating that exceeds 30 mpg for city usage and 35
mpg for highway usage.
Kentucky. With almost $800 million in ESPC investments since enabling legislation in 1996,
Kentucky has one of the largest performance contracting industries in the nation. Through the
Local Government Energy Retrofit Program, the Kentucky Department for Energy Development
and Independence is working with the Kentucky Department for Local Government to facilitate
energy efficiency in smaller municipalities through ESPC. All state-supported universities and
colleges in the state community and technical college system have ESPCs. The state also
tracks real-time energy savings in state buildings and makes these data publicly available
through the Kentucky Energy Dashboard. To date, the Commonwealth Energy Management
and Control System (CEMCS) accounts for 164 buildings and more than 10 million square feet
of state buildings. CEMCS was one of the few state government programs granted an increase
in the current biennium so that more buildings could be included.
EMBARGOED
STATE GOVERNMENT 2016 STATE SCORECARD © ACEEE
106
Research and Development
Research and development (R&D) programs drive advances in energy-efficient technologies, and states play a unique role in laying the foundation for such progress. By leveraging resources in the public and private sectors, state government programs can foster collaborative efforts and rapidly create, develop, and commercialize new energy-efficient technologies. These programs can also encourage cooperation among organizations from different sectors and backgrounds to further spur innovation.
Not only do state R&D efforts provide a variety of services to create, develop, and deploy new technologies for energy efficiency, but they address a number of failures in the energy services marketplace that impede the diffusion of new technologies (Pye and Nadel 1997). In response to the increasing need for state initiatives in energy-related R&D, several state bodies established the Association of State Energy Research and Technology Transfer Institutions (ASERTTI) in 1990. ASERTTI members collaborate on applied R&D and share technical and operational information, emphasizing end-use efficiency and conservation.
Aside from those institutions affiliated with ASERTTI, numerous other state-level entities (including universities, state governments, research centers, and utilities) fund and implement R&D programs to advance energy efficiency throughout the economy. Such programs include research on energy consumption patterns in local industries and the development of energy-saving technologies at state or university research centers and through public–private partnerships.
Individual state research institutions provide expertise and knowledge that policymakers can draw from to advance successful efficiency programs. These institutions enable valuable knowledge spillover to other states through information sharing—facilitated through ASERTTI membership—that allows states to benefit from one another’s research. States without R&D institutions can use this shared information as a road map to begin or advance their own efficiency programs. Even leading states can improve or add to their R&D efforts by drawing from other states’ programs and best practices.
SCORES FOR RESEARCH AND DEVELOPMENT
We reviewed state energy efficiency R&D institutions based on information collected from a survey of state energy officials and other, secondary research. This research complemented information we previously collected from the National Guide to State Energy Research Centers (ASERTTI 2012). In scoring this metric, we awarded 0.5 points for each major state government-funded R&D program dedicated to energy efficiency—including programs administered by state government agencies, public–private partnerships, and university programs—up to a maximum of 1 point. To ensure that scores more effectively credit state-administered, privately financed energy efficiency incentives, we shifted 0.5 points from the R&D metric to the state financial incentives metric. Because R&D funding often fluctuates, and it is difficult to determine the dollar amount that specifically supports energy efficiency, we do not currently score R&D based on program funding or staffing levels.58 We recognize
58 Institutions that focus primarily on renewable energy technology or alternative-fuel R&D do not receive credit
in the Scorecard. In addition, programs that serve primarily an educational or policy development purpose also do not receive points.
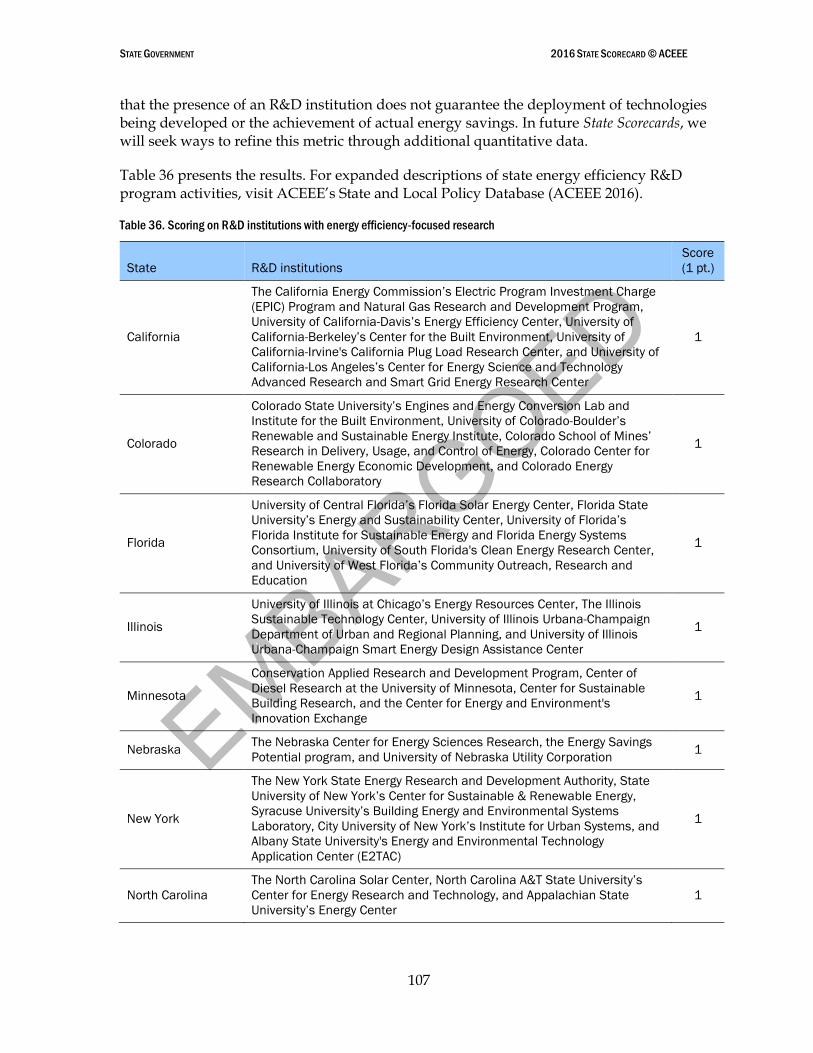
EMBARGOED
STATE GOVERNMENT 2016 STATE SCORECARD © ACEEE
107
that the presence of an R&D institution does not guarantee the deployment of technologies being developed or the achievement of actual energy savings. In future State Scorecards, we will seek ways to refine this metric through additional quantitative data.
Table 36 presents the results. For expanded descriptions of state energy efficiency R&D program activities, visit ACEEE’s State and Local Policy Database (ACEEE 2016).
Table 36. Scoring on R&D institutions with energy efficiency-focused research
State R&D institutions
Score
(1 pt.)
California
The California Energy Commission’s Electric Program Investment Charge
(EPIC) Program and Natural Gas Research and Development Program,
University of California-Davis’s Energy Efficiency Center, University of
California-Berkeley’s Center for the Built Environment, University of
California-Irvine's California Plug Load Research Center, and University of
California-Los Angeles’s Center for Energy Science and Technology
Advanced Research and Smart Grid Energy Research Center
1
Colorado
Colorado State University’s Engines and Energy Conversion Lab and
Institute for the Built Environment, University of Colorado-Boulder’s
Renewable and Sustainable Energy Institute, Colorado School of Mines’
Research in Delivery, Usage, and Control of Energy, Colorado Center for
Renewable Energy Economic Development, and Colorado Energy
Research Collaboratory
1
Florida
University of Central Florida’s Florida Solar Energy Center, Florida State
University’s Energy and Sustainability Center, University of Florida’s
Florida Institute for Sustainable Energy and Florida Energy Systems
Consortium, University of South Florida's Clean Energy Research Center,
and University of West Florida’s Community Outreach, Research and
Education
1
Illinois
University of Illinois at Chicago’s Energy Resources Center, The Illinois
Sustainable Technology Center, University of Illinois Urbana-Champaign
Department of Urban and Regional Planning, and University of Illinois
Urbana-Champaign Smart Energy Design Assistance Center
1
Minnesota
Conservation Applied Research and Development Program, Center of
Diesel Research at the University of Minnesota, Center for Sustainable
Building Research, and the Center for Energy and Environment's
Innovation Exchange
1
Nebraska The Nebraska Center for Energy Sciences Research, the Energy Savings
Potential program, and University of Nebraska Utility Corporation 1
New York
The New York State Energy Research and Development Authority, State
University of New York’s Center for Sustainable & Renewable Energy,
Syracuse University’s Building Energy and Environmental Systems
Laboratory, City University of New York’s Institute for Urban Systems, and
Albany State University's Energy and Environmental Technology
Application Center (E2TAC)
1
North Carolina
The North Carolina Solar Center, North Carolina A&T State University’s
Center for Energy Research and Technology, and Appalachian State
University’s Energy Center
1
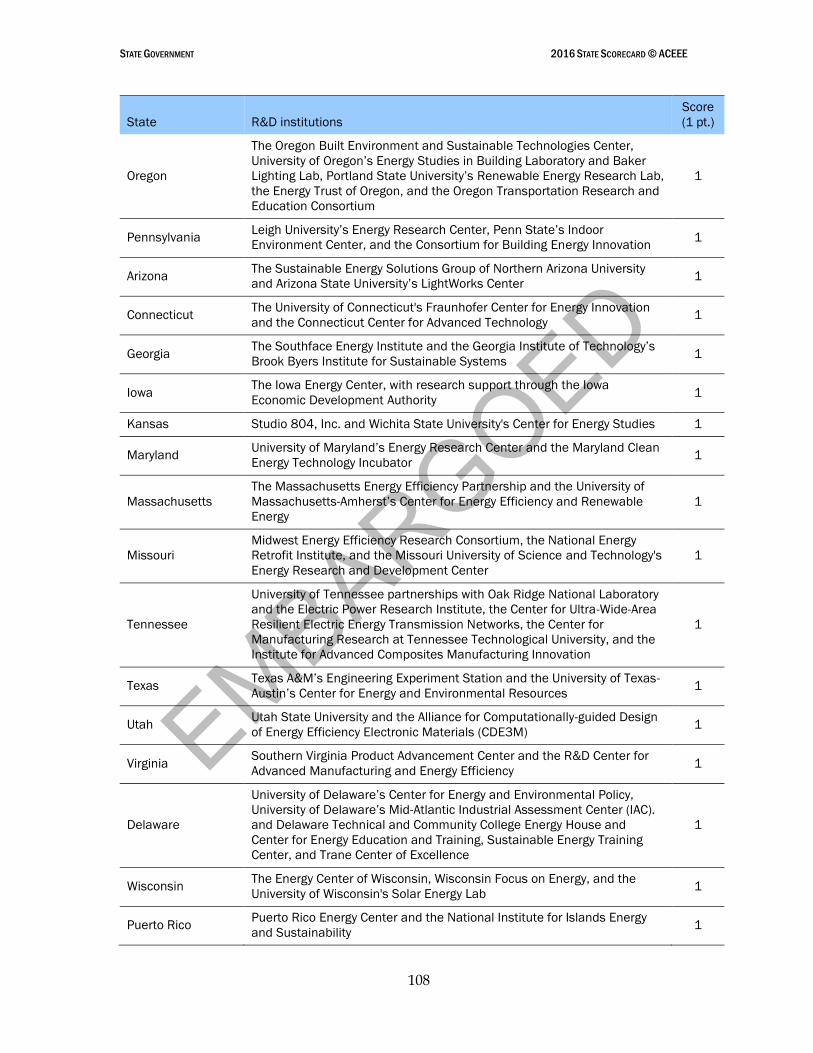
EMBARGOED
STATE GOVERNMENT 2016 STATE SCORECARD © ACEEE
108
State R&D institutions
Score
(1 pt.)
Oregon
The Oregon Built Environment and Sustainable Technologies Center,
University of Oregon’s Energy Studies in Building Laboratory and Baker
Lighting Lab, Portland State University’s Renewable Energy Research Lab,
the Energy Trust of Oregon, and the Oregon Transportation Research and
Education Consortium
1
Pennsylvania Leigh University’s Energy Research Center, Penn State’s Indoor
Environment Center, and the Consortium for Building Energy Innovation 1
Arizona The Sustainable Energy Solutions Group of Northern Arizona University
and Arizona State University’s LightWorks Center 1
Connecticut The University of Connecticut's Fraunhofer Center for Energy Innovation
and the Connecticut Center for Advanced Technology 1
Georgia The Southface Energy Institute and the Georgia Institute of Technology’s
Brook Byers Institute for Sustainable Systems 1
Iowa The Iowa Energy Center, with research support through the Iowa
Economic Development Authority 1
Kansas Studio 804, Inc. and Wichita State University's Center for Energy Studies 1
Maryland University of Maryland’s Energy Research Center and the Maryland Clean
Energy Technology Incubator 1
Massachusetts
The Massachusetts Energy Efficiency Partnership and the University of
Massachusetts-Amherst’s Center for Energy Efficiency and Renewable
Energy
1
Missouri
Midwest Energy Efficiency Research Consortium, the National Energy
Retrofit Institute, and the Missouri University of Science and Technology's
Energy Research and Development Center
1
Tennessee
University of Tennessee partnerships with Oak Ridge National Laboratory
and the Electric Power Research Institute, the Center for Ultra-Wide-Area
Resilient Electric Energy Transmission Networks, the Center for
Manufacturing Research at Tennessee Technological University, and the
Institute for Advanced Composites Manufacturing Innovation
1
Texas Texas A&M’s Engineering Experiment Station and the University of Texas-
Austin’s Center for Energy and Environmental Resources 1
Utah Utah State University and the Alliance for Computationally-guided Design
of Energy Efficiency Electronic Materials (CDE3M) 1
Virginia Southern Virginia Product Advancement Center and the R&D Center for
Advanced Manufacturing and Energy Efficiency 1
Delaware
University of Delaware’s Center for Energy and Environmental Policy,
University of Delaware’s Mid-Atlantic Industrial Assessment Center (IAC).
and Delaware Technical and Community College Energy House and
Center for Energy Education and Training, Sustainable Energy Training
Center, and Trane Center of Excellence
1
Wisconsin The Energy Center of Wisconsin, Wisconsin Focus on Energy, and the
University of Wisconsin's Solar Energy Lab 1
Puerto Rico Puerto Rico Energy Center and the National Institute for Islands Energy
and Sustainability 1
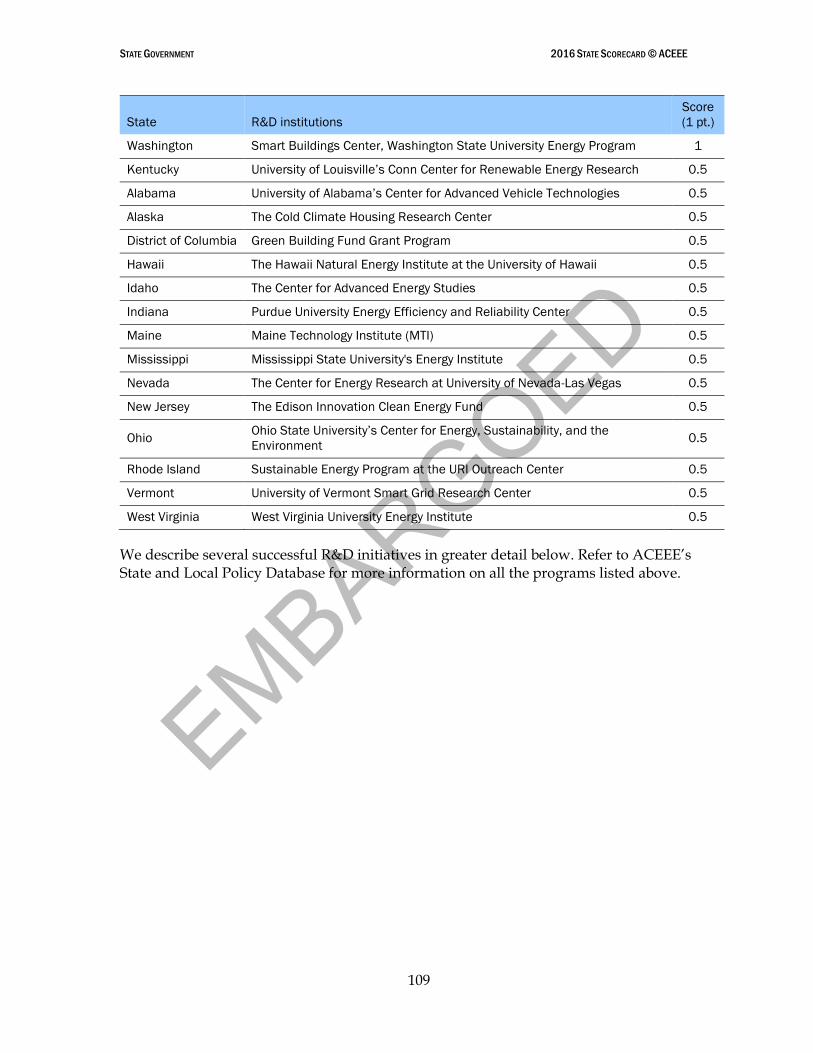
EMBARGOED
STATE GOVERNMENT 2016 STATE SCORECARD © ACEEE
109
State R&D institutions
Score
(1 pt.)
Washington Smart Buildings Center, Washington State University Energy Program 1
Kentucky University of Louisville’s Conn Center for Renewable Energy Research 0.5
Alabama University of Alabama’s Center for Advanced Vehicle Technologies 0.5
Alaska The Cold Climate Housing Research Center 0.5
District of Columbia Green Building Fund Grant Program 0.5
Hawaii The Hawaii Natural Energy Institute at the University of Hawaii 0.5
Idaho The Center for Advanced Energy Studies 0.5
Indiana Purdue University Energy Efficiency and Reliability Center 0.5
Maine Maine Technology Institute (MTI) 0.5
Mississippi Mississippi State University's Energy Institute 0.5
Nevada The Center for Energy Research at University of Nevada-Las Vegas 0.5
New Jersey The Edison Innovation Clean Energy Fund 0.5
Ohio Ohio State University’s Center for Energy, Sustainability, and the
Environment 0.5
Rhode Island Sustainable Energy Program at the URI Outreach Center 0.5
Vermont University of Vermont Smart Grid Research Center 0.5
West Virginia West Virginia University Energy Institute 0.5
We describe several successful R&D initiatives in greater detail below. Refer to ACEEE’s State and Local Policy Database for more information on all the programs listed above.
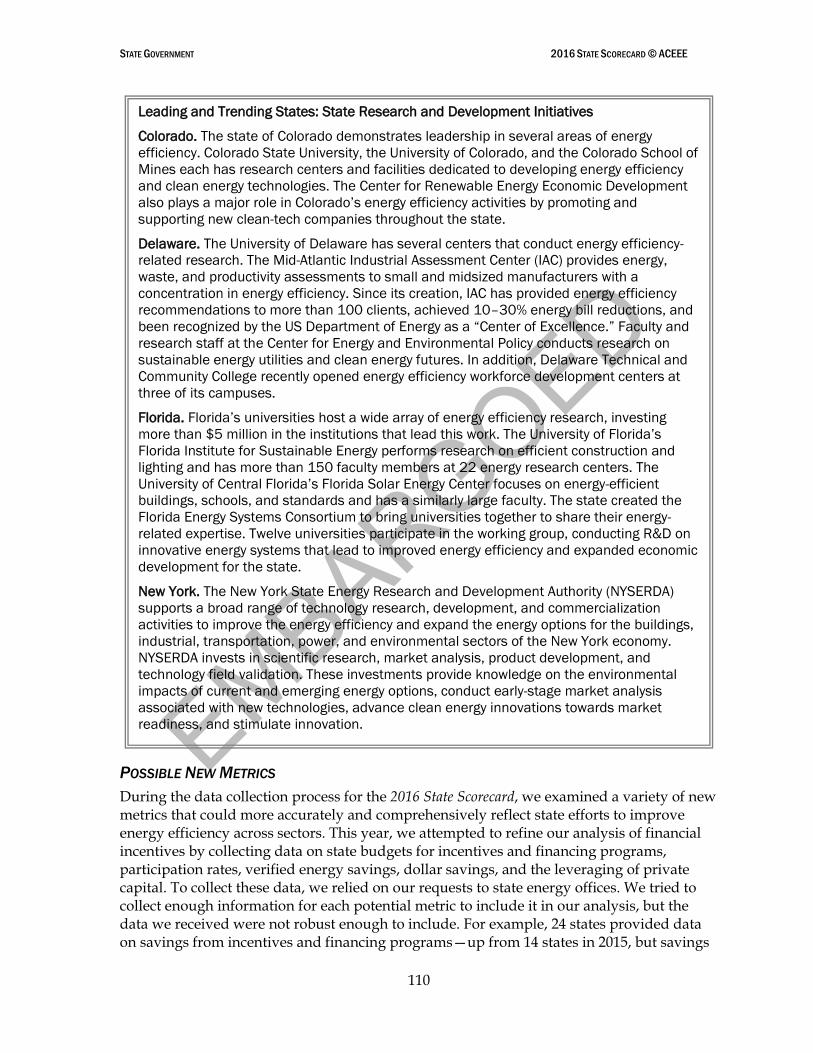
EMBARGOED
STATE GOVERNMENT 2016 STATE SCORECARD © ACEEE
110
POSSIBLE NEW METRICS
During the data collection process for the 2016 State Scorecard, we examined a variety of new metrics that could more accurately and comprehensively reflect state efforts to improve energy efficiency across sectors. This year, we attempted to refine our analysis of financial incentives by collecting data on state budgets for incentives and financing programs, participation rates, verified energy savings, dollar savings, and the leveraging of private capital. To collect these data, we relied on our requests to state energy offices. We tried to collect enough information for each potential metric to include it in our analysis, but the data we received were not robust enough to include. For example, 24 states provided data on savings from incentives and financing programs—up from 14 states in 2015, but savings
Leading and Trending States: State Research and Development Initiatives
Colorado. The state of Colorado demonstrates leadership in several areas of energy
efficiency. Colorado State University, the University of Colorado, and the Colorado School of
Mines each has research centers and facilities dedicated to developing energy efficiency
and clean energy technologies. The Center for Renewable Energy Economic Development
also plays a major role in Colorado’s energy efficiency activities by promoting and
supporting new clean-tech companies throughout the state.
Delaware. The University of Delaware has several centers that conduct energy efficiency-
related research. The Mid-Atlantic Industrial Assessment Center (IAC) provides energy,
waste, and productivity assessments to small and midsized manufacturers with a
concentration in energy efficiency. Since its creation, IAC has provided energy efficiency
recommendations to more than 100 clients, achieved 10–30% energy bill reductions, and
been recognized by the US Department of Energy as a “Center of Excellence.” Faculty and
research staff at the Center for Energy and Environmental Policy conducts research on
sustainable energy utilities and clean energy futures. In addition, Delaware Technical and
Community College recently opened energy efficiency workforce development centers at
three of its campuses.
Florida. Florida’s universities host a wide array of energy efficiency research, investing
more than $5 million in the institutions that lead this work. The University of Florida’s
Florida Institute for Sustainable Energy performs research on efficient construction and
lighting and has more than 150 faculty members at 22 energy research centers. The
University of Central Florida’s Florida Solar Energy Center focuses on energy-efficient
buildings, schools, and standards and has a similarly large faculty. The state created the
Florida Energy Systems Consortium to bring universities together to share their energy-
related expertise. Twelve universities participate in the working group, conducting R&D on
innovative energy systems that lead to improved energy efficiency and expanded economic
development for the state.
New York. The New York State Energy Research and Development Authority (NYSERDA)
supports a broad range of technology research, development, and commercialization
activities to improve the energy efficiency and expand the energy options for the buildings,
industrial, transportation, power, and environmental sectors of the New York economy.
NYSERDA invests in scientific research, market analysis, product development, and
technology field validation. These investments provide knowledge on the environmental
impacts of current and emerging energy options, conduct early-stage market analysis
associated with new technologies, advance clean energy innovations towards market
readiness, and stimulate innovation.
EMBARGOED
STATE GOVERNMENT 2016 STATE SCORECARD © ACEEE
111
data were generally program specific rather than portfolio wide, and in several cases savings were projected rather than verified. States often provided budget data at the agency level and reported participation rates without including the number of eligible customers. For a summary of quantitative data received in 2016 for state financial incentives, performance contracting, and public building energy benchmarking, see Appendices H–J. We will continue to solicit data from states on these potential metrics and refine our financial incentives scoring methodology in the future based on data availability.
Energy Efficiency Financing
To an increasing degree, states are leveraging private capital alongside public dollars to incentivize energy efficiency. Green banks, for example, combine public and ratepayer funds to stimulate private investments in clean energy projects. State or local governments typically create these financing institutions and often provide technical assistance alongside financing products (Gilleo, Stickles, and Kramer 2016).59 PACE financing is another increasingly popular public–private partnership model for which we now give credit.
One of the obstacles to measuring private energy efficiency financing’s success is the absence of protocols for measuring and verifying energy savings. Nonratepayer programs—public and private alike—often have less rigorous EM&V protocols than utility-run programs. In addition, private institutions offering these financing tools often do not prioritize the collection of energy savings data. While we have begun to credit such incentives in a qualitative way when they are appropriately funded, we will continue to solicit quantitative data from states to better understand these programs’ effectiveness.
Energy Efficiency Programs for Low-Income Households
Low-income households often face a disproportionate energy burden that can be alleviated by energy efficiency (Drehobl and Ross 2016). Reducing energy bills for low-income households not only keeps money in these families’ pockets, but it also improves their quality of life by creating healthier homes and neighborhoods. These efforts can help states address other priorities such as reduced emissions, economic development, and improved public health.
Energy efficiency programs for low-income households can be funded through federal, state, or ratepayer dollars and delivered by utilities, state housing finance agencies, community action agencies, or other agencies and organizations. State Energy Offices (SEOs) have many options for investing in energy efficiency in low-income communities, including but not limited to the following:
Design energy efficiency programs or incentives specifically for low-income communities and consider investing state resources alongside federal and ratepayer dollars.
Leverage existing Weatherization Assistance Program delivery channels to expand energy efficiency offerings to program participants
59 While we do credit evaluated savings from financing programs (including on-bill financing programs) in the utilities chapter, in this chapter we recognize financing programs, such as green banks, that leverage additional nonratepayer state resources.
EMBARGOED
STATE GOVERNMENT 2016 STATE SCORECARD © ACEEE
112
Provide technical assistance and financial resources to public housing authorities as they work with ESCOs to improve their properties
Encourage agencies and organizations allocating federal grants, such as the Low Income Housing Tax Credit, to prioritize energy efficiency in their allocation process
Through ongoing research and outreach, ACEEE is working to help states and utilities identify the challenges and opportunities in serving this underserved market. We hope to recognize state efforts and identify best practices in future State Scorecards. Moving forward, we will work to collect additional data on state energy efficiency efforts in low-income communities, identify best practices, and refine metrics for crediting state initiatives in this sector. Below, we highlight several examples of states that have enacted policies or programs for low-income communities.
Leading and Trending States: Low-Income Energy Efficiency Policies and Programs
Wyoming. The state’s housing finance agency—Wyoming Community Development
Authority (WCDA)—offers its Energy Savers Loan to income-qualified existing residential
single family homes. WCDA offers loan recipients up to $15,000 for home rehabilitation
services, including health and safety repairs, building envelope upgrades, and other energy
efficiency improvements (WCDA 2015).
Virginia. To support energy efficiency projects in its Low-Income Housing Tax Credit (LIHTC)
allocation process, the Virginia Housing Development Authority (VHDA) provides a scoring
incentive for applicants pursuing green certification standards such as Leadership in
Energy and Environmental Design (LEED) or EarthCraft. The EarthCraft Multifamily program
certifies both newly constructed and renovated projects that classify as either affordable or
market rate. In Virginia, all successful applicants for LIHTC have committed to meeting
EarthCraft Multifamily standards. A recent evaluation of actual utility usage data in 15
LIHTC properties in Virginia found that units certified to EarthCraft Multifamily high energy
efficiency standards achieved an average annual savings of 5,568 kWh and $648, with
over 40% less energy consumption than in standard housing (EarthCraft Virginia).
Connecticut. The Connecticut Green Bank recently launched a partnership with the
Housing Development Fund to provide loans and technical assistance to affordable
multifamily building owners interested in energy efficiency improvements and clean energy
projects. Funded with a $5 million grant from the MacArthur Foundation, the program will
finance energy efficiency upgrades and health and safety remediation measures in eligible
properties (The Commercial Record 2016). Connecticut Green Bank is a quasi-public
organization created by the state legislature in 2011 as the nation’s first green bank.
Funding for energy efficiency comes primarily from a system benefit charge, RGGI auction
proceeds, and ARRA funds.

EMBARGOED
APPLIANCE STANDARDS 2016 STATE SCORECARD © ACEEE
113
Chapter 7. Appliance and Equipment Efficiency Standards
Author: Marianne DiMascio
INTRODUCTION
Every day, we use appliances, equipment, and lighting in our homes, offices, and public buildings. While the energy consumption and cost for a single device may seem small, the extra energy consumed by less efficient products collectively adds up to a substantial amount of wasted energy. For example, a single computer might waste a small amount of electricity, but the energy wasted by millions of computers in the United States is considerable. Real and persistent market barriers inhibit sales of more efficient models to consumers. Appliance efficiency standards overcome these barriers by initiating change in the manufacturer’s—not the consumer’s—actions, requiring manufacturers to meet minimum efficiency levels for all products and thereby removing the most inefficient products from the market.
States have historically led the way when it comes to establishing standards for appliances and other equipment. In 1976, California became the first state to introduce appliance standards. Many others, including New York and Massachusetts, soon followed. The federal government did not establish any national standards until Congress passed the National Appliance Energy Conservation Act of 1987, which included standards based on those adopted by California and several other states. Congress enacted additional national standards in 1988, 1992, 2005, and 2007. In general, these laws set initial standards for products and require the DOE to review and strengthen standards for specific products. Approximately 55 products are now subject to national efficiency standards.
President Ronald Reagan signed the original national appliance standards into law in 1987; by 2015, savings from such standards had grown to 13% of electricity consumption and 4% of natural gas usage. Appliance standards saved enough energy in 2015 to meet the electricity needs of 43 million homes (more than one-third of US households) and the gas needs of about 10 million US homes. By 2030, the savings will grow to 20% of projected electricity consumption and 6% of gas usage, as new national standards take effect and the impact of existing standards grows.60
In 2030, the carbon dioxide emissions reductions from standards completed since 2007 will reach about 220 million metric tons. This amounts to about one-quarter of the emissions reductions expected from the Clean Power Plan, the Obama Administration’s highest profile action to reduce climate emissions.
Historically, there has been an inverse relationship between standards activity at the federal and state levels. When federal activity picks up, the impetus for states to set standards decreases, and vice versa. In recent years, the DOE has been very active and only a handful of states have proposed or adopted standards. California remains the most engaged, with a full slate of standards and labeling regulations in process, pending, or on deck. After adopting standards for deep-dimming fluorescent ballasts and updating toilet, faucet, and
60 Appliance Standards Awareness Project (ASAP) unpublished update to Lowenberger et al. 2012.
EMBARGOED
APPLIANCE STANDARDS 2016 STATE SCORECARD © ACEEE
114
urinal standards in 2015, the California Energy Commission (CEC) adopted new standards in 2016 for LEDs, small-diameter directional lamps, and showerheads.
Other states have also taken steps. Colorado updated its plumbing products standards, having adopted new standards for toilets in 2014. Legislators in Rhode Island and Washington filed bills this year to add standards for products such as faucets, toilets, urinals, deep-dimming fluorescent ballasts, and air purifiers. We expect more states to consider adopting standards once the standards for the products in the California pipeline are finalized.
Federal preemption generally prevents states from setting standards stronger than existing federal requirements for a given product. States that wish to implement their own standards after federal preemption must apply for a waiver; however states remain free to set standards for any products that are not subject to national standards. These additional standards can have significant energy efficiency benefits and set precedents for adopting new national standards.
SCORING AND RESULTS
We updated the scoring methodology for appliance and equipment standards this year to emphasize savings from recent state actions. States could earn up to 2 points for appliance efficiency standards not presently preempted by federal standards and for which the effective date (not the adoption date) for any state is either within the past three calendar years or in the future.61 This methodology credits recent state action, provides an incentive for states to adopt new standards, and deemphasizes older state standards, some of which were garnering little to no savings. Giving credit to all states that have adopted a standard for which the most recent effective date is within the past three years acknowledges the important role early adopters play in paving the way for other states to adopt similar standards.
For example, California adopted the first state battery charger standards in 2012 (effective in 2013), followed by Oregon in 2013 (effective in 2014). Both states get credit for battery charger standards in 2016 because the most recent effective date (2014) is within the past three years. Similarly, both states will still get credit for these standards in 2017. Assuming no additional states pass battery charger standards, we will not count battery charger savings in 2018 since no compliance dates will be within three calendar years.
We calculated the scores based on cumulative per capita savings (measured in Btus) through 2030. We used a floating start date that aligns with each state’s product compliance date. For example, standards for deep-dimming fluorescent ballasts took effect in California in 2016. Our savings analysis for that product in California covers the period from 2016 to 2030. If another state adopts the same standards with a later effective date, the analysis will begin in the year the standards take effect in that state.
61 The effective date is also known as the compliance date.
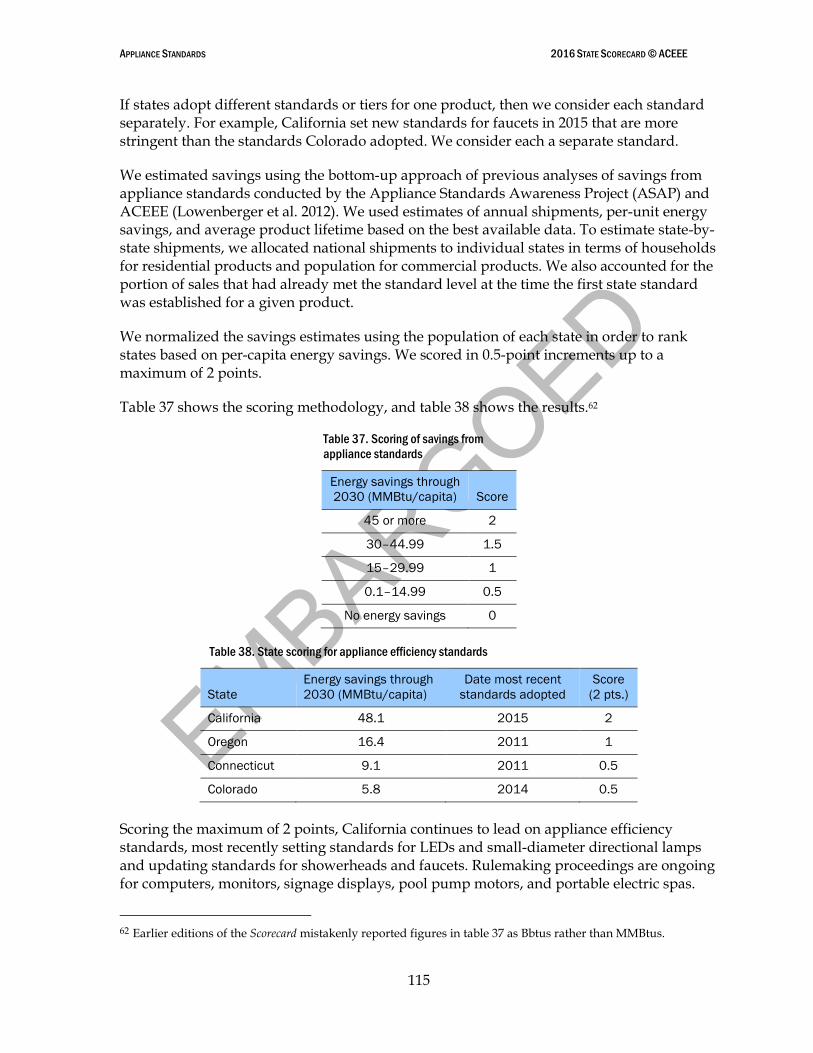
EMBARGOED
APPLIANCE STANDARDS 2016 STATE SCORECARD © ACEEE
115
If states adopt different standards or tiers for one product, then we consider each standard separately. For example, California set new standards for faucets in 2015 that are more stringent than the standards Colorado adopted. We consider each a separate standard.
We estimated savings using the bottom-up approach of previous analyses of savings from appliance standards conducted by the Appliance Standards Awareness Project (ASAP) and ACEEE (Lowenberger et al. 2012). We used estimates of annual shipments, per-unit energy savings, and average product lifetime based on the best available data. To estimate state-by-state shipments, we allocated national shipments to individual states in terms of households for residential products and population for commercial products. We also accounted for the portion of sales that had already met the standard level at the time the first state standard was established for a given product.
We normalized the savings estimates using the population of each state in order to rank states based on per-capita energy savings. We scored in 0.5-point increments up to a maximum of 2 points.
Table 37 shows the scoring methodology, and table 38 shows the results.62
Table 37. Scoring of savings from
appliance standards
Energy savings through
2030 (MMBtu/capita) Score
45 or more 2
30–44.99 1.5
15–29.99 1
0.1–14.99 0.5
No energy savings 0
Table 38. State scoring for appliance efficiency standards
State
Energy savings through
2030 (MMBtu/capita)
Date most recent
standards adopted
Score
(2 pts.)
California 48.1 2015 2
Oregon 16.4 2011 1
Connecticut 9.1 2011 0.5
Colorado 5.8 2014 0.5
Scoring the maximum of 2 points, California continues to lead on appliance efficiency standards, most recently setting standards for LEDs and small-diameter directional lamps and updating standards for showerheads and faucets. Rulemaking proceedings are ongoing for computers, monitors, signage displays, pool pump motors, and portable electric spas.
62 Earlier editions of the Scorecard mistakenly reported figures in table 37 as Bbtus rather than MMBtus.
EMBARGOED
APPLIANCE STANDARDS 2016 STATE SCORECARD © ACEEE
116
Not only has California adopted the greatest number of standards, but many other states’ standards are based on California’s. Oregon earned credit for battery chargers and TV standards, Connecticut for TV standards, and Colorado for faucets and showerhead standards.
Because we updated our methodology this year to place more emphasis on recent activity, we did not give credit to a number of states that earned credit for standards in last year's Scorecard.63 Many of these states adopted standards during a flurry of state activity between 2004 and 2009 for products such as water dispensers, spas, and pool pumps. A DOE rulemaking for pool pump standards is now underway, thanks in large part to the groundwork laid by many of these states.
Over the past five to six years, the drought-prone states of California, Colorado, Georgia, and Texas adopted standards for faucets, showerheads, toilets, and urinals and are on track to save a significant amount of water. The faucet and showerhead standards will also save energy by reducing hot-water consumption.
63 The states include Arizona, Georgia, Maryland, New Hampshire, Rhode Island, Texas, and Washington. The District of Columbia also falls into this category.
Leading and Trending States: Appliance and Equipment Efficiency Standards
California. The 1974 Warren–Alquist Act granted the California Energy Commission (CEC)
the first-in-the-nation authority to adopt appliance and equipment efficiency standards.
Since that time, California has adopted standards for more than 100 products, many of
which have subsequently become federal standards. For more details on CEC standards,
see 2015 CEC Appliance Efficiency Regulations, published on July 1, 2015.
CEC adopted additional standards not included in the 2015 regulations. In late 2015, they
approved a new package of standards and labeling and reporting requirements for HVAC
air filters, fluorescent dimming ballasts, heat pump water chilling packages, faucets,
toilets, and urinals. In April 2016, CEC updated showerhead standards and adopted the
first-ever state standards for LEDs and small-diameter directional lamps. CEC is conducting
ongoing rulemakings for computers, monitors and displays, pool pump motors, and
portable electric spas.
Oregon. Beginning in 2002, Oregon introduced several appliance standards bills, passing
one in 2007 and another in 2013. With the signing of Senate Bill 692 in June 2013,
Oregon added three new standards to its books—consumer battery chargers, televisions,
and double-ended quartz halogen lamps. Oregon now has eight nonpreempted standards,
second only to California.

EMBARGOED
CONCLUSIONS 2016 STATE SCORECARD © ACEEE
117
Chapter 8. Conclusions
In the past year, many states continued to push the needle on energy efficiency by increasing support for existing programs. They also looked for new ways to expand their menu of efficiency measures and leverage the power of private markets. The benefits of these efforts are diverse and abundant; they include boosting economic development in the energy efficiency services and technology industries, saving money for consumers, and strengthening environmental sustainability through pollution reductions.
States today are tackling energy efficiency amid a rapidly changing environment rife with countervailing conditions, including aging infrastructure, advances in data access, and competition from customer-sited distributed energy resources. In an effort to manage these challenges and opportunities, states are undertaking large-scale changes in rate structures, utility business models, and regulatory frameworks. The potential of private market forces to deliver energy efficiency—by using financing as a complement to or even a substitute for traditional programs—continues to interest those looking to shape the utility of the future. Integrating these efforts with ratepayer funded programs also has become an increasingly hot topic, as has the role and structure of the monopoly investor-owned utility. States such as New York and Minnesota are undergoing dramatic utility restructuring, while Connecticut and Hawaii increasingly look to financing from green banks to deliver energy efficiency; the latter states do so amid surging efforts from the Green Bank Network and other groups to standardize processes and build investor confidence. To facilitate this transition and attract investors, improving the availability of information, education, and loan performance data will be key.
Amid this experimentation, we continue to see energy efficiency deliver big savings and a variety of benefits. Energy savings continue to rise, with states in the Northeast proving that electricity savings of 2%—and even upwards of 3%—are possible. In California, meanwhile, new strategies to fund energy efficiency programs yielded impressive results over the past year to raise the state’s ranking as an energy saver. And, all across the country, states are increasingly emphasizing energy efficiency’s role in resilience efforts, be it through CHP, lower peak load, or more durable and sustainable buildings.
This year’s State Scorecard also emphasizes the need to consistently update energy efficiency policies and programs to both embrace advancements and bolster existing policy goals. A growing number of states (about 25%) have taken major steps toward adopting the most recent iteration of building codes, for example. However, with deadlines for code certification statements looming in 2016 and 2017, other states will likely follow suit; adopting these codes sooner rather than later will ultimately increase the resulting energy savings.
In this year’s State Scorecard, a wide gap remains between states near the top and those at the bottom of the rankings. A regulatory environment that levels the playing field for energy efficiency—the fastest, cheapest, cleanest energy resource—is critical to capturing the full range of its benefits for states and for consumers.
Energy efficiency programs advanced in several states in 2016. New Hampshire approved its first-ever EERS this past summer. Other states extended energy savings targets for
EMBARGOED
CONCLUSIONS 2016 STATE SCORECARD © ACEEE
118
utilities, finalizing long-term visions that will ensure large-scale savings in future years. For example, both Massachusetts and Connecticut approved three-year energy efficiency plans pledging more aggressive savings targets for 2016–2018. In the fall of 2015, California passed two game-changing pieces of legislation: Senate Bill 350, requiring a doubling of energy efficiency savings from electricity and natural gas end-uses by 2030, and Assembly Bill 802, which promotes building benchmarking and enables access to whole-building data for buildings above a certain size. Other states committing to extend their efficiency goals included Arkansas and Maryland. Meanwhile, Delaware continued to lay the groundwork for a potential future EERS.
While the utility sector continues to serve as the primary avenue through which states seek to advance energy efficiency, there are clear signs that state governments will increasingly look to leverage private capital to fund and deliver energy efficiency programs to consumers. Green banks are now well established in Connecticut and New York, and many other states are following suit. Other financing options, such as residential and commercial PACE, are also continuing to gain traction. Over the next few years, states will be seeking a balance between these financing programs and more traditional ratepayer-funded programs. Ultimately, both private financing solutions and ratepayer-funded energy efficiency programs deliver important energy savings options to the market.
States are also responding to an uncertain federal regulatory landscape. The EPA’s Clean Power Plan, pending judicial review, could drive substantial additional investment in energy efficiency as a compliance path for meeting GHG emissions mandates. Low-income communities are a particularly important area of focus given the CPP’s Clean Energy Incentive Program, which rewards states for spurring energy efficiency in disadvantaged neighborhoods. While uncertainty remains about the CPP’s future following the February Supreme Court stay, there been no change to the EPA’s legal requirement to regulate carbon dioxide, and energy efficiency programs will likely continue to offer the most cost-effective way for states to demonstrate compliance.
Energy efficiency can save consumers money, drive investment across many economic sectors, and create jobs. Several states are consistently leading the way on energy efficiency and many more are notably increasing their efforts. Still, many opportunities to sustain and expand current efforts remain. Energy efficiency is a resource that is abundant in every state. Reaping its full economic, energy security, and environmental benefits will require continued leadership from all stakeholders, including legislators, regulators, and the utility industry.
DATA LIMITATIONS
The scoring framework we used in this report is our best current attempt to represent the myriad efficiency metrics as a quantitative score. Any effort to convert state spending data, energy savings data, and adoption of best-practice policies across six policy areas into one state energy efficiency score has obvious limitations. Here, we suggest a few areas for future research that will help refine the State Scorecard scoring methodology and more accurately represent the changing landscape of energy efficiency in the states.
EMBARGOED
CONCLUSIONS 2016 STATE SCORECARD © ACEEE
119
One of the most pronounced limitations is access to recent, reliable data on the results of energy efficiency work. Because many states do not gather data on the performance of energy efficiency policy efforts, we use a best-practices approach to score some policy areas. As an example, it is difficult to score states on building energy code compliance rates because the majority of them do not collect the relevant data. This year, we attempted to gather this information during the data collection process, but only about half of the states were able to provide quantitative data, and many of the results were only rough estimates. The current Scorecard expands our best-practices approach in this category, but performance metrics would allow for more objective and accurate assessment. While states should be applauded for adopting stringent building energy codes, the success of these codes in reducing energy consumption is unclear without a way to verify actual implementation.
As in the past, we face a similar difficulty in scoring state-backed financing and incentive programs for energy efficiency investments. Though many states have seemingly robust programs aimed at residential and commercial consumers, few are able to relay information on program budgets or energy savings resulting from such initiatives. As a result, we can offer only a qualitative analysis of these programs. This lack of quantitative data is becoming increasingly pronounced as many states begin pouring financial resources into green banks. Without comparable results on dollars spent and rigorously evaluated energy savings, it is impossible to judge these programs with the same scrutiny as we judge utility programs.
We would also like to see spending and savings data for energy efficiency programs targeting home-heating fuel and propane. This year, we added questions to our data request asking for savings and spending attributable to efficiency efforts in these areas. Because only a few states responded to these particular queries, we could not include the data in this year’s scoring methodology. However we will continue to examine workable metrics for fuel oil and propane efficiency in the future.
POTENTIAL NEW SCORECARD METRICS
We have described relevant potential future metrics or revisions to existing metrics in several chapters of this year’s State Scorecard. While we believe our data collection and scoring methodology are comprehensive, there is always room for modifications. As the energy efficiency market continues to evolve and data become more available, we will continue to adjust each chapter’s scoring metrics. Here, we present some additional metrics that currently fall outside the scope of our report but that nonetheless indicate important efficiency pathways.
State efficiency programs that fall outside utility-sector and public benefits programs are an area in which we continue to revise our data request; our goal is to find ways to transition to a more comprehensive and quantitative assessment. We hope to recognize state government and regulatory efforts to enable home and business owners to finance energy efficiency improvements through on-bill financing and other innovative incentive programs. One possible metric by which to compare state financial incentives is the level and sustainability of budgets for these programs. This information is available in some cases, but gathering it for all programs will continue to present challenges. We may also be able to compare state
EMBARGOED
CONCLUSIONS 2016 STATE SCORECARD © ACEEE
120
energy efficiency R&D efforts on the basis of budgets and staffing levels, but data availability is again an issue.
As discussed in Chapter 6, states are increasingly leveraging private capital through mechanisms such as green banks and PACE financing in an effort to harness the free market to fund energy efficiency and clean energy. Here, too, we would also like to expand the Scorecard to measure to the progress of these programs. For example, we would like to better capture efforts to combine public and ratepayer funds to stimulate private investments in clean energy projects. However, as mentioned, these efforts are currently impeded by the absence of protocols for measuring and verifying energy savings when it comes to private financing. Nonratepayer programs—public and private alike—often have less rigorous EM&V protocols than utility-run programs. So, while we currently credit these incentives, our ability to do so in a quantitative manner will depend on the quality of available energy savings data.
The effort to improve energy efficiency in low-income households is another area we would like to emphasize in the State Scorecard. Low-income households account for about one-third of the US population, yet data have shown that these communities are underrepresented in efficiency programs offered to all residential customers. Furthermore, recent ACEEE analysis has found that the percentage of household income that goes toward energy costs—also known as the energy burden—for low-income, African American, Latino, and renters is up to three times more than that of the average household. States that pursue investment in low-income energy efficiency programs in an effort to extend the health and quality of life benefits of energy efficiency to disadvantaged communities will receive added consideration in future State Scorecards.
Internet-connected devices, smart meters, and other intelligent efficiency technologies are proliferating in many states. These devices help overcome informational and motivational barriers to consumer uptake of energy efficiency. Similarly, a new industry is emerging that uses social marketing and social media to encourage consumers to save energy—such as by giving customers frequent feedback on their energy use and tailored energy savings tips. Data-focused policies—such as state data privacy policies, disclosure of building energy use, and data-access policies such as the industry-led Green Button standard—can help this promising energy efficiency area grow. The State Scorecard began collecting information on data-access policies in 2015 and continued to do so this year. Although we have yet to quantify progress on data access in a scoring methodology, given the rapid advances many states are making in this area, we intend to include it in our scoring next year.
EMBARGOED
REFERENCES 2016 STATE SCORECARD © ACEEE
121
References
AASHTO (American Association of State Highway Transportation Officials). 2015. Survey of State Funding for Public Transportation—FY2013 Data. Washington, DC: AASHTO. scopt.transportation.org/Documents/SSFP-2015.pdf.
ACEEE. 2016. State and Local Policy Database. database.aceee.org/.
ASERTTI (Association of State Energy Research and Technology Transfer Institutions). 2012. National Guide to State Energy Research Centers. Arlington, VA: ASERTTI. asertti.org/researchcenters/ASERTTI_State_Research_Guide.pdf.
Baatz, B., A. Gilleo, and T. Barigye. 2016. Big Savers: Experiences and Recent History of Program Administrators Achieving High Levels of Electric Savings. Washington, DC: ACEEE. aceee.org/research-report/u1601.
Barbose, G., C. Goldman, I. Hoffman, and M. Billingsley. 2013. The Future of Utility Customer-Funded Energy Efficiency Programs in the United States: Projected Spending and Savings to 2025. Berkeley: Lawrence Berkeley National Laboratory. emp.lbl.gov/sites/all/files/lbnl-5803e.pdf.
C2ES (Center for Climate and Energy Solutions). 2016. “ZEV Program.” Accessed June. www.c2es.org/us-states-regions/policy-maps/zev-program.
Cadmus Group, Inc. 2010. Assessment of Electric and Natural Gas Energy-Efficiency Potential (2010–2016): Final Report, Volume I. Prepared for Ameren Illinois Utilities. Portland: Cadmus. www.illinois.gov/sites/ipa/Documents/AIC-Potential-Study-2010-2016-VolumeI.pdf.
CEE (Consortium for Energy Efficiency). 2012. Efficiency Program Industry by State and Region Appendices, 2011. Boston: CEE. library.cee1.org/content/efficiency-program-industry-state-and-region-appendices-2011.
——— . 2013. Efficiency Program Industry by State and Region Appendices, 2012. Boston: CEE. library.cee1.org/content/efficiency-program-industry-state-and-region-appendices-2012.
——— . 2014. Efficiency Program Industry by State and Region Appendices, 2013. Boston: CEE. library.cee1.org/content/efficiency-program-industry-state-and-region-appendices-2013.
——— . 2015. Efficiency Program Industry by State and Region Appendices, 2014. Boston: CEE. library.cee1.org/content/efficiency-program-industry-state-and-region-appendices-2014.
——— . 2016. Efficiency Program Industry by State and Region Appendices, 2015. Boston: CEE. library.cee1.org/content/efficiency-program-industry-state-and-region-appendices-2015.
EMBARGOED
REFERENCES 2016 STATE SCORECARD © ACEEE
122
Chittum, A. 2011. Follow the Leaders: Improving Large Customer Self-Direct Programs. Washington, DC: ACEEE. aceee.org/research-report/ie112.
Clean Cars Campaign. 2016. “State Action.” Accessed May. cleancarscampaign.org/web-content/stateaction/stateaction.html.
Drehobl, A., and L. Ross. 2016. Lifting the High Energy Burden in America’s Largest Cities: How Energy Efficiency Can Improve Low-Income and Underserved Communities. Washington, DC: ACEEE. aceee.org/research-report/u1602.
Cluett, R., and J. Amann. 2013. Residential Energy Use Disclosure: A Review of Existing Policies. Washington, DC: ACEEE. aceee.org/research-report/a131.
The Commercial Record. 2016. “Connecticut Green Bank Joins Partnership to Ease Middle-Class Energy Costs.” The Commercial Record April 28. www.commercialrecord.com/2016/04/connecticut-green-bank-joins-partnership-ease-middle-class-energy-costs.
DOE (Department of Energy). 2008. “State Energy Program: Projects by Topic—What Are State and Local Government Facility Projects in the States?” Accessed April. www.eere.energy.gov/state_energy_program/topic_definition_detail.cfm/topic=115.
——— . 2012. “2011 Buildings Energy Data Book.” Washington, DC: DOE. http://buildingsdatabook.eere.energy.gov.
——— . 2016a. “Alternative Fuels Data Center: State Incentives and Laws.” Accessed May. www.afdc.energy.gov/afdc/laws/state.
——— . 2016b. “Building Energy Codes Program: Determinations.” Accessed June. www.energycodes.gov/determinations.
——— . 2016c. “US DOE Combined Heat and Power Installation Database.” Accessed June. doe.icfwebservices.com/chpdb.
——— . 2016d. “Residential Energy Code Field Study.” Accessed July. www.energycodes.gov/compliance/residential-energy-code-field-study.
Downs, A., and C. Cui. 2014. Energy Efficiency Resource Standards: A New Progress Report on State Experience. Washington, DC: ACEEE. aceee.org/research-report/u1403.
DSIRE (Database of State Incentives for Renewables and Efficiency). 2016. “Database of State Incentives for Renewables & Efficiency®.” Accessed June. dsireusa.org/.
Dutzik, T., and P. Baxandall. 2013. A New Direction: Our Changing Relationship with Driving and the Implications for America’s Future. Prepared by Frontier Group. Washington, DC: US PIRG (Public Interest Research Group) Education Fund. www.uspirg.org/sites/pirg/files/reports/A%20New%20Direction%20vUS.pdf.
EMBARGOED
REFERENCES 2016 STATE SCORECARD © ACEEE
123
EarthCraft Virginia. 2015. “Housing Study—VT, Housing Virginia & EarthCraft Virginia.” Accessed December. www.earthcraftvirginia.org/housing-study-vt-housing-virginia-earthcraft-virginia.
EIA (Energy Information Administration). 2015. “Natural Gas Annual Respondent Query System (EIA-176 Data through 2014).” www.eia.gov/cfapps/ngqs/ngqs.cfm?f_report=RP7.
——— . 2016a. Annual Energy Outlook 2016—Early Release: Annotated Summary of Two Cases. Washington, DC: EIA. http://www.eia.gov/forecasts/aeo/er/index.cfm.
——— . 2016b. “Electric Power Sales, Revenue, and Energy Efficiency Form EIA-861 Detailed Data Files.” Accessed April. www.eia.gov/electricity/data/eia861/.
——— . 2016c. “Form EIA-826 Detailed Data.” www.eia.gov/electricity/data/eia826.
——— . 2016d. “Hawaii State Energy Profile and Energy Estimates.” www.eia.gov/state/?sid=HI.
Eldridge, M., R. N. Elliott, and S. Vaidyanathan. 2010. North Carolina’s Energy Future: Electricity, Water, and Transportation Efficiency. Washington, DC: ACEEE. aceee.org/north-carolina%E2%80%99s-energy-future-electricity-water-and-transportation-efficiency.
Eldridge, M., M. Neubauer, D. York, S. Vaidyanathan, A. Chittum, and S. Nadel. 2008. The 2008 State Energy Efficiency Scorecard. Washington, DC: ACEEE. aceee.org/2008-state-energy-efficiency-scorecard.
Eldridge, M., W. Prindle, D. York, and S. Nadel. 2007. The State Energy Efficiency Scorecard for 2006. Washington, DC: ACEEE. aceee.org/research-report/e075.
Eldridge, M., M. Sciortino, L. Furrey, S. Nowak, S. Vaidyanathan, M. Neubauer, N. Kaufman, A. Chittum, S. Black, C. Sheppard, C. Chamberlin, A. Jacobson, Y. Mugica, and D. Bryk. 2009. The 2009 State Energy Efficiency Scorecard. Washington, DC: ACEEE. aceee.org/research-report/e097.
Elliott, R. N., M. Eldridge, A. Shipley, J. Laitner, S. Nadel, P. Fairey, R. Vieira, J. Sonne, A. Silverstein, B. Hedman, and K. Darrow. 2007a. Potential for Energy Efficiency and Renewable Energy to Meet Florida’s Growing Energy Demands. Washington, DC: ACEEE. aceee.org/research-report/e072.
Elliott, R. N., M. Eldridge, A. Shipley, J. Laitner, S. Nadel, A. Silverstein, B. Hedman, and M. Sloan. 2007b. Potential for Energy Efficiency, Demand Response, and Onsite Renewable Energy to Meet Texas’s Growing Electricity Needs. Washington, DC: ACEEE. aceee.org/research-report/e073.
ENERGY STAR. 2012. ENERGY STAR® Portfolio Manager™: Data Trends: Benchmarking and Energy Savings. Washington, DC: EPA.
EMBARGOED
REFERENCES 2016 STATE SCORECARD © ACEEE
124
www.energystar.gov/ia/business/downloads/datatrends/DataTrends_Savings_20121002.pdf.
EPA (Environmental Protection Agency). 2015. “Clean Power Plan Final Rule.” www.epa.gov/cleanpowerplan/clean-power-plan-existing-power-plants.
——— . 2016. dCHPP (CHP Policies and Incentives Database). Washington, DC: EPA. www.epa.gov/chp/dchpp-chp-policies-and-incentives-database.
Fazeli, S. 2016. Accelerating the Commercial PACE Market: Statewide Programs and State Energy Office Participation in Property Assessed Clean Energy (PACE) Financing. Arlington: NASEO. naseo.org/data/sites/1/documents/publications/CLEAN_Master%20NASEO%20PACE%20Memo%202016-5-18%20FINAL.pdf.
FAST (Fixing America’s Surface Transportation Act). 2015. Pub. L. No 114–94, 128 Stat. 1312. www.gpo.gov/fdsys/pkg/PLAW-114publ94/pdf/PLAW-114publ94.pdf.
FHWA (Federal Highway Administration). 2015. “Traffic Volume Trends: Monthly Report.” www.fhwa.dot.gov/policyinformation/travel_monitoring/tvt.cfm.
GDS Associates, Inc. 2013. Michigan Electric and Natural Gas Energy Efficiency Potential Study: Final Report. Prepared for Michigan Public Service Commission. Marietta, GA: GDS. www.michigan.gov/documents/mpsc/mi_ee_potential_study_rep_v29_439270_7.pdf.
Geller, H., S. Baldwin, P. Case, K. Emerson, T. Langer, and S. Wright. 2007. Utah Energy Efficiency Strategy: Policy Options. Boulder: Southwest Energy Efficiency Project. aceee.org/files/pdf/UT%20EE%20Strategy_Executive%20Summary_Low%20Resolution_1.pdf.
Gilleo, A., B. Stickles, and C. Kramer. 2016. Green Banks. Washington, DC: ACEEE. aceee.org/research-report/f1602.
Gilleo, A., S. Nowak, M. Kelly, S. Vaidyanathan, M. Shoemaker, A. Chittum, and T. Bailey. 2015. The 2015 State Energy Efficiency Scorecard. Washington, DC: ACEEE. aceee.org/research-report/u1509.
Haeri, H., and M. S. Khawaja. 2012. “The Trouble with Freeriders: The Debate about Freeridership in Energy Efficiency Isn’t Wrong, but It Is Wrongheaded.” Public Utilities Fortnightly. March. fortnightly.com/fortnightly/2012/03/trouble-freeriders.
Hayes, S., G. Herndon, J. Barrett, J. Mauer, M. Molina, M. Neubauer, D. Trombley, and L. Ungar. 2014. Change Is in the Air: How States Can Harness Energy Efficiency to Strengthen the Economy and Reduce Pollution. Washington, DC: ACEEE. aceee.org/research-report/e1401.
IHS Automotive Polk. 2015. Electric Vehicle Registration Dataset. Accessed April.

EMBARGOED
REFERENCES 2016 STATE SCORECARD © ACEEE
125
IMT (Institute for Market Transformation). 2016. “Jurisdictions.” Accessed May 24. www.buildingrating.org/jurisdictions.
Itron. 2006. California Energy Efficiency: Potential Studies. Prepared for PG&E. San Diego: Itron, Inc. www.calmac.org/publications/PGE_PotentialStudy_4Pager_05242006.pdf.
Kushler, M., S. Nowak, and P. Witte. 2012. A National Survey of State Policies and Practices for the Evaluation of Ratepayer-Funded Energy Efficiency Programs. Washington, DC: ACEEE. aceee.org/research-report/u122.
Lowenberger, A., J. Mauer, A. deLaski, M. DiMascio, J. Amann, and S. Nadel. 2012. The Efficiency Boom: Cashing in on the Savings from Appliance Standards. Washington, DC: ACEEE. aceee.org/research-report/a123.
MA EEAC (Massachusetts Energy Efficiency Advisory Council). 2015. 2016–2018 Massachusetts Joint Statewide Three-Year Electric and Gas Energy Efficiency Plan. Boston: MA EEAC. ma-eeac.org/wordpress/wp-content/uploads/Exhibit-1-Gas-and-Electric-PAs-Plan-2016-2018-with-App-except-App-U.pdf.
AP-21 (Moving Ahead for Progress in the 21st Century Act). 2012. Pub. L. No. 112–141, 126 Stat. 405. www.gpo.gov/fdsys/pkg/PLAW-112publ141/pdf/PLAW-112publ141.pdf.
Misuriello, H., S. Kwatra, M. Kushler, and S. Nowak. 2012. Building Energy Code Advancement through Utility Support and Engagement. Washington, DC: ACEEE. aceee.org/research-report/a126.
Molina, M., and M. Kushler. 2015. Policies Matter: Creating a Foundation for an Energy-Efficient Utility of the Future. Washington, DC: ACEEE. aceee.org/policies-matter-creating-foundation-energy.
Molina, M., S. Watson, N. Kaufman, S. Laitner, E. Mackres, D. Trombley, D. York, M. Hagenstad, S. Schare, D. Violette, A. Gulkis, C. Metz, and G. Gawor. 2011. Missouri’s Energy Efficiency Potential: Opportunities for Economic Growth and Energy Sustainability. Washington, DC: ACEEE. aceee.org/research-report/e114.
Mosenthal P., S. Bower, D. Trombley, D. Hill, and N. Lange. 2014. Energy Efficiency and Renewable Energy Potential Study of New York State—Volume 1: Study Overview. Albany: NYSERDA. www.nyserda.ny.gov/-/media/Files/EDPPP/Energy-Prices/Energy-Statistics/14-19-EE-RE-Potential-Study-Vol1.pdf.
Nadel, S., T. Kubo, and H. Geller. 2000. State Scorecard on Utility Energy Efficiency Program Trends. Washington, DC: ACEEE. aceee.org/research-report/u004.
NCSC (National Complete Streets Coalition). 2012. Complete Streets and High Gas Prices. Washington, DC: NCSC. www.completestreets.org/webdocs/factsheets/cs-gasprices.pdf.
EMBARGOED
REFERENCES 2016 STATE SCORECARD © ACEEE
126
——— . 2016. Best Complete Streets Policies of 2015. Washington, DC: NCSC. www.smartgrowthamerica.org/documents/best-cs-policies-of-2015.pdf.
NCSFA (National Conference of State Fleet Administrators). 2007. NCSFA Target Membership Estimated Fleet Totals and Dollars (Reported by State Fleets). Gaithersburg, MD: NCSFA.
Neubauer, M., S. Nadel, J. Talbot, A. Lowenberger, D. Trombley, S. Black, N. Kaufman, S. Vaidyanathan, B. Foster, S. Laitner, M. Hagenstad, D. Violette, S. Schare, D. White, and R. Hornby. 2011. Advancing Energy Efficiency in Arkansas: Opportunities for a Clean Energy Economy. Washington, DC: ACEEE. aceee.org/research-report/e104.
Neubauer, M., S. Watson, J. S. Laitner, J. Talbot, D. Trombley, A. Chittum, and S. Black. 2009. South Carolina’s Energy Future: Minding Its Efficiency Resources. Washington, DC: ACEEE. aceee.org/research-report/e099.
Nowak, S., B. Baatz, A. Gilleo, M. Kushler, M. Molina, and D. York. 2015. Beyond Carrots for Utilities: A National Review of Performance Incentives for Energy Efficiency. Washington, DC: ACEEE. aceee.org/beyond-carrots-utilities-national-review.
Nowak, S., M. Kushler, M. Sciortino, D. York, and P. Witte. 2011. Energy Efficiency Resource Standards: State and Utility Strategies for Higher Energy Savings. Washington, DC: ACEEE. aceee.org/research-report/u113.
PACENation (Property Assessed Clean Energy Nation). 2015. Commercial PACE Market Update: Q3 2015. Pleasantville, NY: PACENation. www.pacenation.us/wp-content/uploads/2015/11/C-PACE-Market-Update-Q3-2015.pdf.
——— . 2016. “PACE Legislation.” Accessed June. www.pacenation.us/resources/pace-enabling-legislation/.
Pye, M., and S. Nadel. 1997. Energy Technology Innovation at the State Level: Review of State Energy Research, Development, and Demonstration (RD&D) Programs. Washington, DC: ACEEE. aceee.org/research-report/e973.
Ribeiro, D., V. Hewitt, E. Mackres, R. Cluett, L. Ross, S. Vaidyanathan, and S. Zerbonne. 2015. The 2015 City Energy Efficiency Scorecard. Washington, DC: ACEEE. aceee.org/research-report/u1502.
Satchwell, A., C. Goldman, P. Larsen, D. Gilligan, and T. Singer. 2010. A Survey of the U.S. ESCO Industry: Market Growth and Development from 2008 to 2011. Berkeley: Lawrence Berkeley National Laboratory. emp.lbl.gov/sites/all/files/REPORT%20lbnl-3479e.pdf.
Sciortino, M. 2011. How State Governments Enable Local Governments to Advance Energy Efficiency. Washington, DC: ACEEE. aceee.org/white-paper/state-enabling-local-ee.
Sciortino, M., M. Neubauer, S. Vaidyanathan, A. Chittum, S. Hayes, S. Nowak, and M. Molina. 2011. The 2011 State Energy Efficiency Scorecard. Washington, DC: ACEEE. aceee.org/research-report/e115.
EMBARGOED
REFERENCES 2016 STATE SCORECARD © ACEEE
127
WCDA (Wyoming Community Development Authority). 2015. Wyoming Energy Savers. Casper: WCDA. www.wyomingcda.com/documents/Wyoming_Energy_Savers_Handout_2015.pdf.
York, D., and M. Kushler. 2002. State Scorecard on Utility and Public Benefits Energy Efficiency Programs: An Update. Washington, DC: ACEEE. aceee.org/research-report/u023.
——— . 2005. ACEEE's 3rd National Scorecard on Utility and Public Benefits Energy Efficiency Programs: A National Review and Update of State-Level Activity. Washington, DC: ACEEE. aceee.org/research-report/u054.
——— . 2011. The Old Model Isn’t Working: Creating the Energy Utility for the 21st Century. Washington, DC: ACEEE. aceee.org/white-paper/the-old-model-isnt-working.
York, D., P. Witte, S. Nowak, and M. Kushler. 2012. Three Decades and Counting: A Historical Review and Current Assessment of Electric Utility Energy Efficiency Activity in the States. Washington, DC: ACEEE. aceee.org/research-report/u123.
Zhang, J., Y. Xie, R. Athalye, J. Zhuge, M. Rosenberg, R. Hart, and B. Liu. 2015. Energy and Energy Cost Savings Analysis of the 2015 IECC for Commercial Buildings. Richland, WA: PNNL (Pacific Northwest National Laboratory). www.energycodes.gov/sites/default/files/documents/2015_IECC_Commercial_Analysis.pdf.
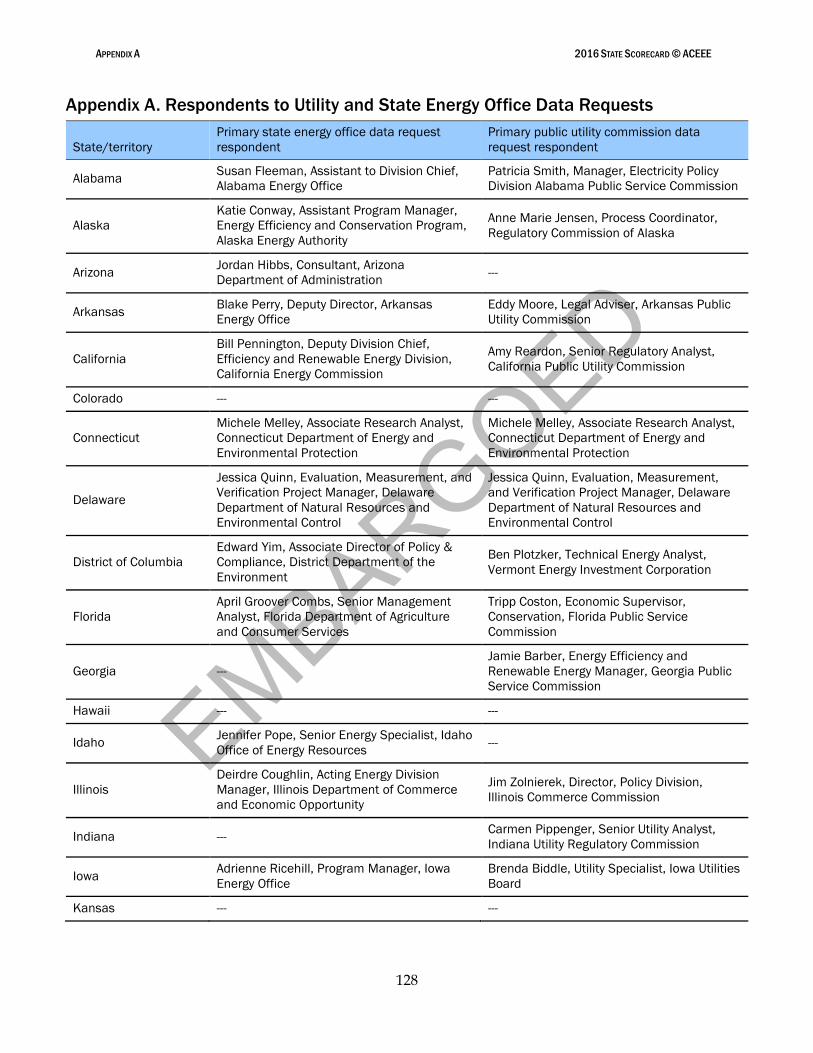
EMBARGOED
APPENDIX A 2016 STATE SCORECARD © ACEEE
128
Appendix A. Respondents to Utility and State Energy Office Data Requests
State/territory
Primary state energy office data request
respondent
Primary public utility commission data
request respondent
Alabama Susan Fleeman, Assistant to Division Chief,
Alabama Energy Office
Patricia Smith, Manager, Electricity Policy
Division Alabama Public Service Commission
Alaska
Katie Conway, Assistant Program Manager,
Energy Efficiency and Conservation Program,
Alaska Energy Authority
Anne Marie Jensen, Process Coordinator,
Regulatory Commission of Alaska
Arizona Jordan Hibbs, Consultant, Arizona
Department of Administration ---
Arkansas Blake Perry, Deputy Director, Arkansas
Energy Office
Eddy Moore, Legal Adviser, Arkansas Public
Utility Commission
California
Bill Pennington, Deputy Division Chief,
Efficiency and Renewable Energy Division,
California Energy Commission
Amy Reardon, Senior Regulatory Analyst,
California Public Utility Commission
Colorado --- ---
Connecticut
Michele Melley, Associate Research Analyst,
Connecticut Department of Energy and
Environmental Protection
Michele Melley, Associate Research Analyst,
Connecticut Department of Energy and
Environmental Protection
Delaware
Jessica Quinn, Evaluation, Measurement, and
Verification Project Manager, Delaware
Department of Natural Resources and
Environmental Control
Jessica Quinn, Evaluation, Measurement,
and Verification Project Manager, Delaware
Department of Natural Resources and
Environmental Control
District of Columbia
Edward Yim, Associate Director of Policy &
Compliance, District Department of the
Environment
Ben Plotzker, Technical Energy Analyst,
Vermont Energy Investment Corporation
Florida
April Groover Combs, Senior Management
Analyst, Florida Department of Agriculture
and Consumer Services
Tripp Coston, Economic Supervisor,
Conservation, Florida Public Service
Commission
Georgia ---
Jamie Barber, Energy Efficiency and
Renewable Energy Manager, Georgia Public
Service Commission
Hawaii --- ---
Idaho Jennifer Pope, Senior Energy Specialist, Idaho
Office of Energy Resources ---
Illinois
Deirdre Coughlin, Acting Energy Division
Manager, Illinois Department of Commerce
and Economic Opportunity
Jim Zolnierek, Director, Policy Division,
Illinois Commerce Commission
Indiana --- Carmen Pippenger, Senior Utility Analyst,
Indiana Utility Regulatory Commission
Iowa Adrienne Ricehill, Program Manager, Iowa
Energy Office
Brenda Biddle, Utility Specialist, Iowa Utilities
Board
Kansas --- ---
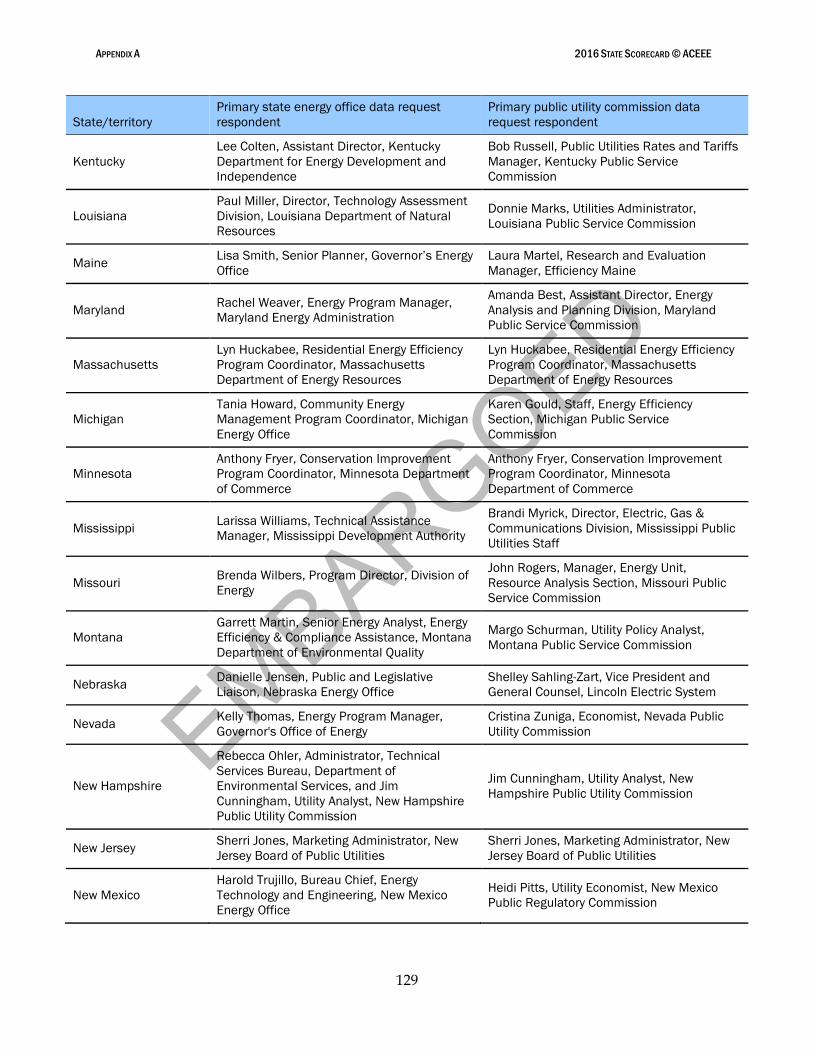
EMBARGOED
APPENDIX A 2016 STATE SCORECARD © ACEEE
129
State/territory
Primary state energy office data request
respondent
Primary public utility commission data
request respondent
Kentucky
Lee Colten, Assistant Director, Kentucky
Department for Energy Development and
Independence
Bob Russell, Public Utilities Rates and Tariffs
Manager, Kentucky Public Service
Commission
Louisiana
Paul Miller, Director, Technology Assessment
Division, Louisiana Department of Natural
Resources
Donnie Marks, Utilities Administrator,
Louisiana Public Service Commission
Maine Lisa Smith, Senior Planner, Governor’s Energy
Office
Laura Martel, Research and Evaluation
Manager, Efficiency Maine
Maryland Rachel Weaver, Energy Program Manager,
Maryland Energy Administration
Amanda Best, Assistant Director, Energy
Analysis and Planning Division, Maryland
Public Service Commission
Massachusetts
Lyn Huckabee, Residential Energy Efficiency
Program Coordinator, Massachusetts
Department of Energy Resources
Lyn Huckabee, Residential Energy Efficiency
Program Coordinator, Massachusetts
Department of Energy Resources
Michigan
Tania Howard, Community Energy
Management Program Coordinator, Michigan
Energy Office
Karen Gould, Staff, Energy Efficiency
Section, Michigan Public Service
Commission
Minnesota
Anthony Fryer, Conservation Improvement
Program Coordinator, Minnesota Department
of Commerce
Anthony Fryer, Conservation Improvement
Program Coordinator, Minnesota
Department of Commerce
Mississippi Larissa Williams, Technical Assistance
Manager, Mississippi Development Authority
Brandi Myrick, Director, Electric, Gas &
Communications Division, Mississippi Public
Utilities Staff
Missouri Brenda Wilbers, Program Director, Division of
Energy
John Rogers, Manager, Energy Unit,
Resource Analysis Section, Missouri Public
Service Commission
Montana
Garrett Martin, Senior Energy Analyst, Energy
Efficiency & Compliance Assistance, Montana
Department of Environmental Quality
Margo Schurman, Utility Policy Analyst,
Montana Public Service Commission
Nebraska Danielle Jensen, Public and Legislative
Liaison, Nebraska Energy Office
Shelley Sahling-Zart, Vice President and
General Counsel, Lincoln Electric System
Nevada Kelly Thomas, Energy Program Manager,
Governor's Office of Energy
Cristina Zuniga, Economist, Nevada Public
Utility Commission
New Hampshire
Rebecca Ohler, Administrator, Technical
Services Bureau, Department of
Environmental Services, and Jim
Cunningham, Utility Analyst, New Hampshire
Public Utility Commission
Jim Cunningham, Utility Analyst, New
Hampshire Public Utility Commission
New Jersey Sherri Jones, Marketing Administrator, New
Jersey Board of Public Utilities
Sherri Jones, Marketing Administrator, New
Jersey Board of Public Utilities
New Mexico
Harold Trujillo, Bureau Chief, Energy
Technology and Engineering, New Mexico
Energy Office
Heidi Pitts, Utility Economist, New Mexico
Public Regulatory Commission
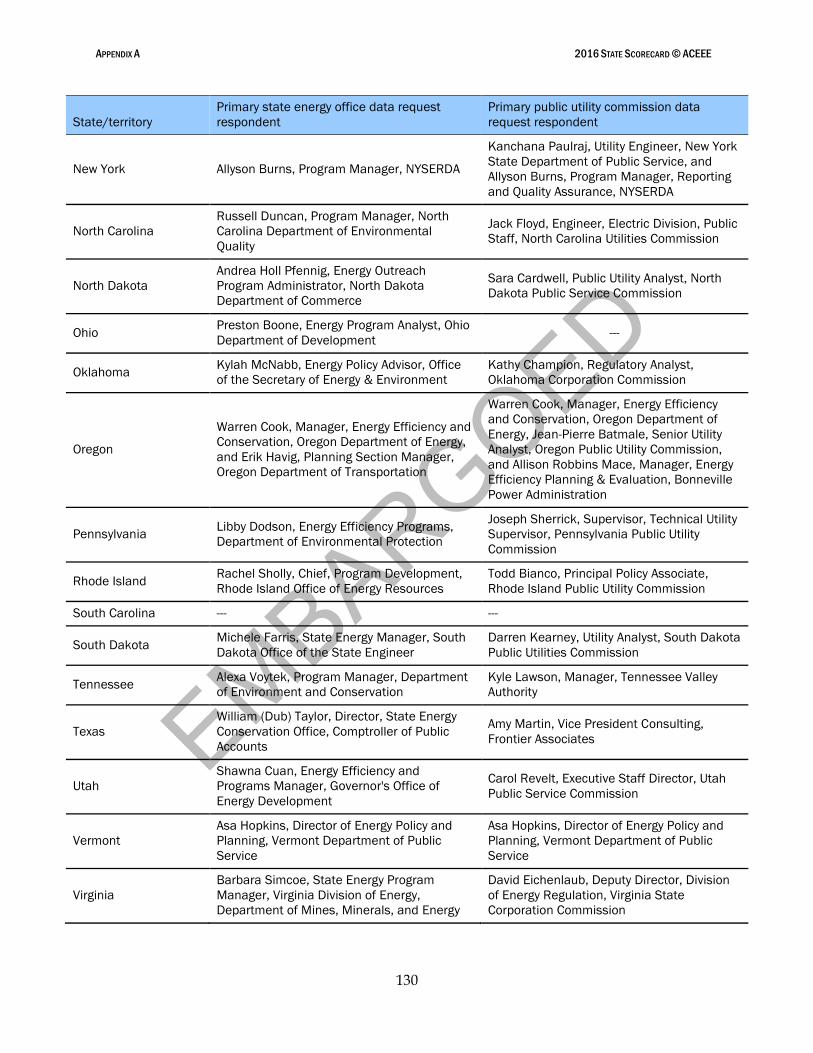
EMBARGOED
APPENDIX A 2016 STATE SCORECARD © ACEEE
130
State/territory
Primary state energy office data request
respondent
Primary public utility commission data
request respondent
New York Allyson Burns, Program Manager, NYSERDA
Kanchana Paulraj, Utility Engineer, New York
State Department of Public Service, and
Allyson Burns, Program Manager, Reporting
and Quality Assurance, NYSERDA
North Carolina
Russell Duncan, Program Manager, North
Carolina Department of Environmental
Quality
Jack Floyd, Engineer, Electric Division, Public
Staff, North Carolina Utilities Commission
North Dakota
Andrea Holl Pfennig, Energy Outreach
Program Administrator, North Dakota
Department of Commerce
Sara Cardwell, Public Utility Analyst, North
Dakota Public Service Commission
Ohio Preston Boone, Energy Program Analyst, Ohio
Department of Development ---
Oklahoma Kylah McNabb, Energy Policy Advisor, Office
of the Secretary of Energy & Environment
Kathy Champion, Regulatory Analyst,
Oklahoma Corporation Commission
Oregon
Warren Cook, Manager, Energy Efficiency and
Conservation, Oregon Department of Energy,
and Erik Havig, Planning Section Manager,
Oregon Department of Transportation
Warren Cook, Manager, Energy Efficiency
and Conservation, Oregon Department of
Energy, Jean-Pierre Batmale, Senior Utility
Analyst, Oregon Public Utility Commission,
and Allison Robbins Mace, Manager, Energy
Efficiency Planning & Evaluation, Bonneville
Power Administration
Pennsylvania Libby Dodson, Energy Efficiency Programs,
Department of Environmental Protection
Joseph Sherrick, Supervisor, Technical Utility
Supervisor, Pennsylvania Public Utility
Commission
Rhode Island Rachel Sholly, Chief, Program Development,
Rhode Island Office of Energy Resources
Todd Bianco, Principal Policy Associate,
Rhode Island Public Utility Commission
South Carolina --- ---
South Dakota Michele Farris, State Energy Manager, South
Dakota Office of the State Engineer
Darren Kearney, Utility Analyst, South Dakota
Public Utilities Commission
Tennessee Alexa Voytek, Program Manager, Department
of Environment and Conservation
Kyle Lawson, Manager, Tennessee Valley
Authority
Texas
William (Dub) Taylor, Director, State Energy
Conservation Office, Comptroller of Public
Accounts
Amy Martin, Vice President Consulting,
Frontier Associates
Utah
Shawna Cuan, Energy Efficiency and
Programs Manager, Governor's Office of
Energy Development
Carol Revelt, Executive Staff Director, Utah
Public Service Commission
Vermont
Asa Hopkins, Director of Energy Policy and
Planning, Vermont Department of Public
Service
Asa Hopkins, Director of Energy Policy and
Planning, Vermont Department of Public
Service
Virginia
Barbara Simcoe, State Energy Program
Manager, Virginia Division of Energy,
Department of Mines, Minerals, and Energy
David Eichenlaub, Deputy Director, Division
of Energy Regulation, Virginia State
Corporation Commission
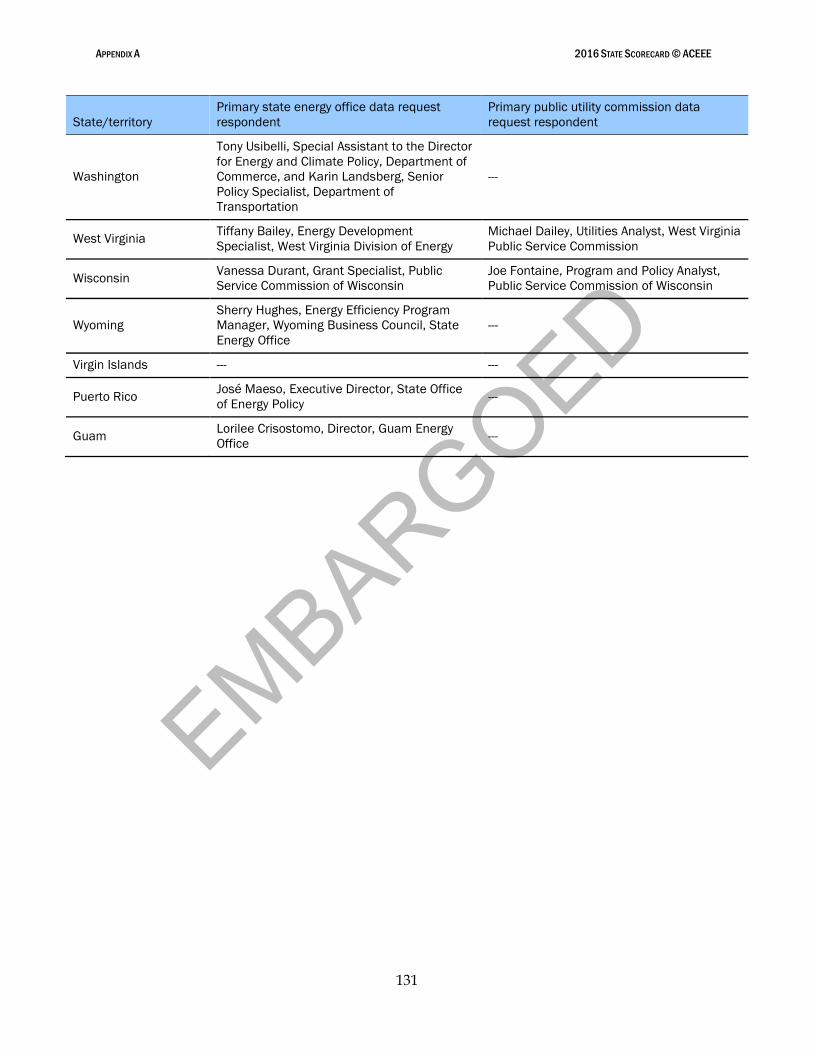
EMBARGOED
APPENDIX A 2016 STATE SCORECARD © ACEEE
131
State/territory
Primary state energy office data request
respondent
Primary public utility commission data
request respondent
Washington
Tony Usibelli, Special Assistant to the Director
for Energy and Climate Policy, Department of
Commerce, and Karin Landsberg, Senior
Policy Specialist, Department of
Transportation
---
West Virginia Tiffany Bailey, Energy Development
Specialist, West Virginia Division of Energy
Michael Dailey, Utilities Analyst, West Virginia
Public Service Commission
Wisconsin Vanessa Durant, Grant Specialist, Public
Service Commission of Wisconsin
Joe Fontaine, Program and Policy Analyst,
Public Service Commission of Wisconsin
Wyoming
Sherry Hughes, Energy Efficiency Program
Manager, Wyoming Business Council, State
Energy Office
---
Virgin Islands --- ---
Puerto Rico José Maeso, Executive Director, State Office
of Energy Policy ---
Guam Lorilee Crisostomo, Director, Guam Energy
Office ---
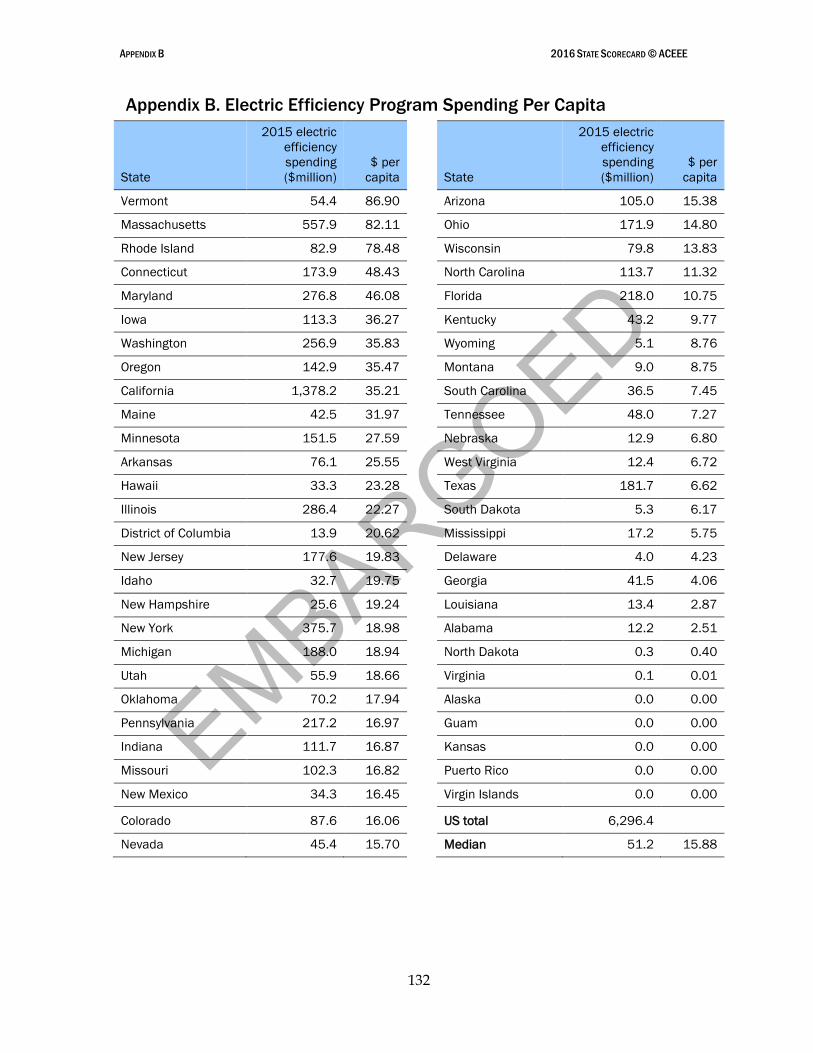
EMBARGOED
APPENDIX B 2016 STATE SCORECARD © ACEEE
132
Appendix B. Electric Efficiency Program Spending Per Capita
State
2015 electric
efficiency
spending
($million)
$ per
capita State
2015 electric
efficiency
spending
($million)
$ per
capita
Vermont 54.4 86.90 Arizona 105.0 15.38
Massachusetts 557.9 82.11 Ohio 171.9 14.80
Rhode Island 82.9 78.48 Wisconsin 79.8 13.83
Connecticut 173.9 48.43 North Carolina 113.7 11.32
Maryland 276.8 46.08 Florida 218.0 10.75
Iowa 113.3 36.27 Kentucky 43.2 9.77
Washington 256.9 35.83 Wyoming 5.1 8.76
Oregon 142.9 35.47 Montana 9.0 8.75
California 1,378.2 35.21 South Carolina 36.5 7.45
Maine 42.5 31.97 Tennessee 48.0 7.27
Minnesota 151.5 27.59 Nebraska 12.9 6.80
Arkansas 76.1 25.55 West Virginia 12.4 6.72
Hawaii 33.3 23.28 Texas 181.7 6.62
Illinois 286.4 22.27 South Dakota 5.3 6.17
District of Columbia 13.9 20.62 Mississippi 17.2 5.75
New Jersey 177.6 19.83 Delaware 4.0 4.23
Idaho 32.7 19.75 Georgia 41.5 4.06
New Hampshire 25.6 19.24 Louisiana 13.4 2.87
New York 375.7 18.98 Alabama 12.2 2.51
Michigan 188.0 18.94 North Dakota 0.3 0.40
Utah 55.9 18.66 Virginia 0.1 0.01
Oklahoma 70.2 17.94 Alaska 0.0 0.00
Pennsylvania 217.2 16.97 Guam 0.0 0.00
Indiana 111.7 16.87 Kansas 0.0 0.00
Missouri 102.3 16.82 Puerto Rico 0.0 0.00
New Mexico 34.3 16.45 Virgin Islands 0.0 0.00
Colorado 87.6 16.06 US total 6,296.4
Nevada 45.4 15.70 Median 51.2 15.88
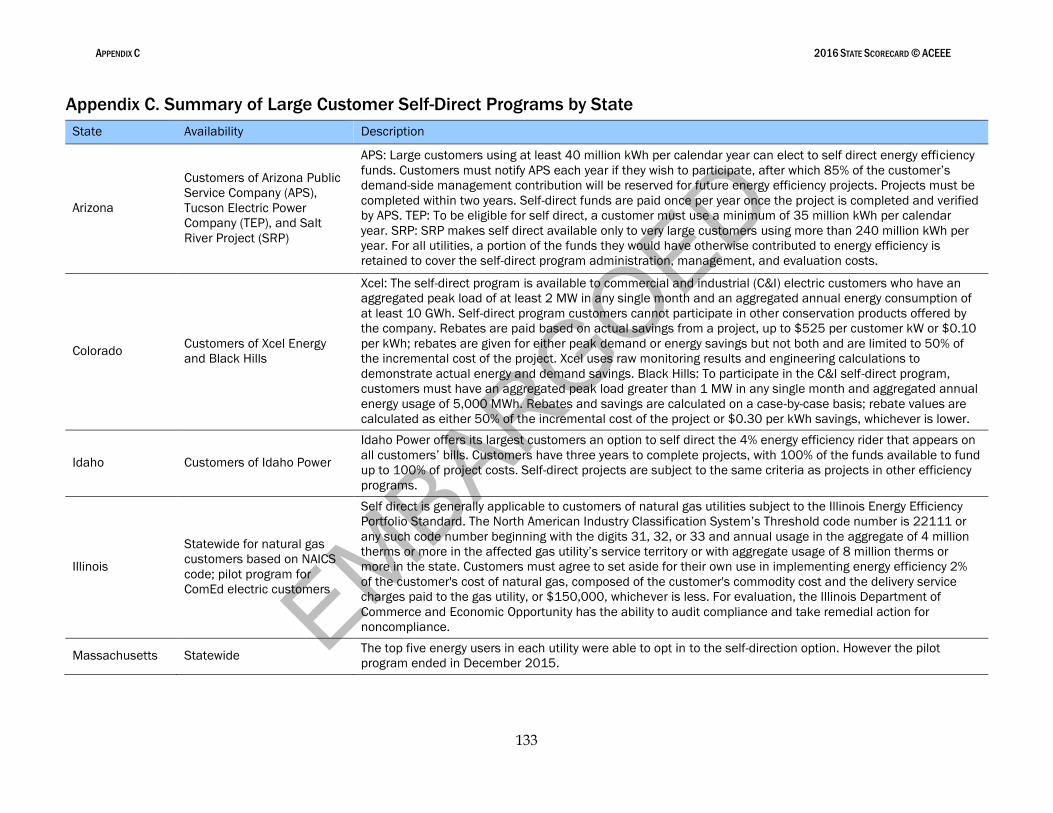
EMBARGOED
APPENDIX C 2016 STATE SCORECARD © ACEEE
133
Appendix C. Summary of Large Customer Self-Direct Programs by State
State Availability Description
Arizona
Customers of Arizona Public
Service Company (APS),
Tucson Electric Power
Company (TEP), and Salt
River Project (SRP)
APS: Large customers using at least 40 million kWh per calendar year can elect to self direct energy efficiency
funds. Customers must notify APS each year if they wish to participate, after which 85% of the customer’s
demand-side management contribution will be reserved for future energy efficiency projects. Projects must be
completed within two years. Self-direct funds are paid once per year once the project is completed and verified
by APS. TEP: To be eligible for self direct, a customer must use a minimum of 35 million kWh per calendar
year. SRP: SRP makes self direct available only to very large customers using more than 240 million kWh per
year. For all utilities, a portion of the funds they would have otherwise contributed to energy efficiency is
retained to cover the self-direct program administration, management, and evaluation costs.
Colorado Customers of Xcel Energy
and Black Hills
Xcel: The self-direct program is available to commercial and industrial (C&I) electric customers who have an
aggregated peak load of at least 2 MW in any single month and an aggregated annual energy consumption of
at least 10 GWh. Self-direct program customers cannot participate in other conservation products offered by
the company. Rebates are paid based on actual savings from a project, up to $525 per customer kW or $0.10
per kWh; rebates are given for either peak demand or energy savings but not both and are limited to 50% of
the incremental cost of the project. Xcel uses raw monitoring results and engineering calculations to
demonstrate actual energy and demand savings. Black Hills: To participate in the C&I self-direct program,
customers must have an aggregated peak load greater than 1 MW in any single month and aggregated annual
energy usage of 5,000 MWh. Rebates and savings are calculated on a case-by-case basis; rebate values are
calculated as either 50% of the incremental cost of the project or $0.30 per kWh savings, whichever is lower.
Idaho Customers of Idaho Power
Idaho Power offers its largest customers an option to self direct the 4% energy efficiency rider that appears on
all customers’ bills. Customers have three years to complete projects, with 100% of the funds available to fund
up to 100% of project costs. Self-direct projects are subject to the same criteria as projects in other efficiency
programs.
Illinois
Statewide for natural gas
customers based on NAICS
code; pilot program for
ComEd electric customers
Self direct is generally applicable to customers of natural gas utilities subject to the Illinois Energy Efficiency
Portfolio Standard. The North American Industry Classification System’s Threshold code number is 22111 or
any such code number beginning with the digits 31, 32, or 33 and annual usage in the aggregate of 4 million
therms or more in the affected gas utility’s service territory or with aggregate usage of 8 million therms or
more in the state. Customers must agree to set aside for their own use in implementing energy efficiency 2%
of the customer's cost of natural gas, composed of the customer's commodity cost and the delivery service
charges paid to the gas utility, or $150,000, whichever is less. For evaluation, the Illinois Department of
Commerce and Economic Opportunity has the ability to audit compliance and take remedial action for
noncompliance.
Massachusetts Statewide The top five energy users in each utility were able to opt in to the self-direction option. However the pilot
program ended in December 2015.
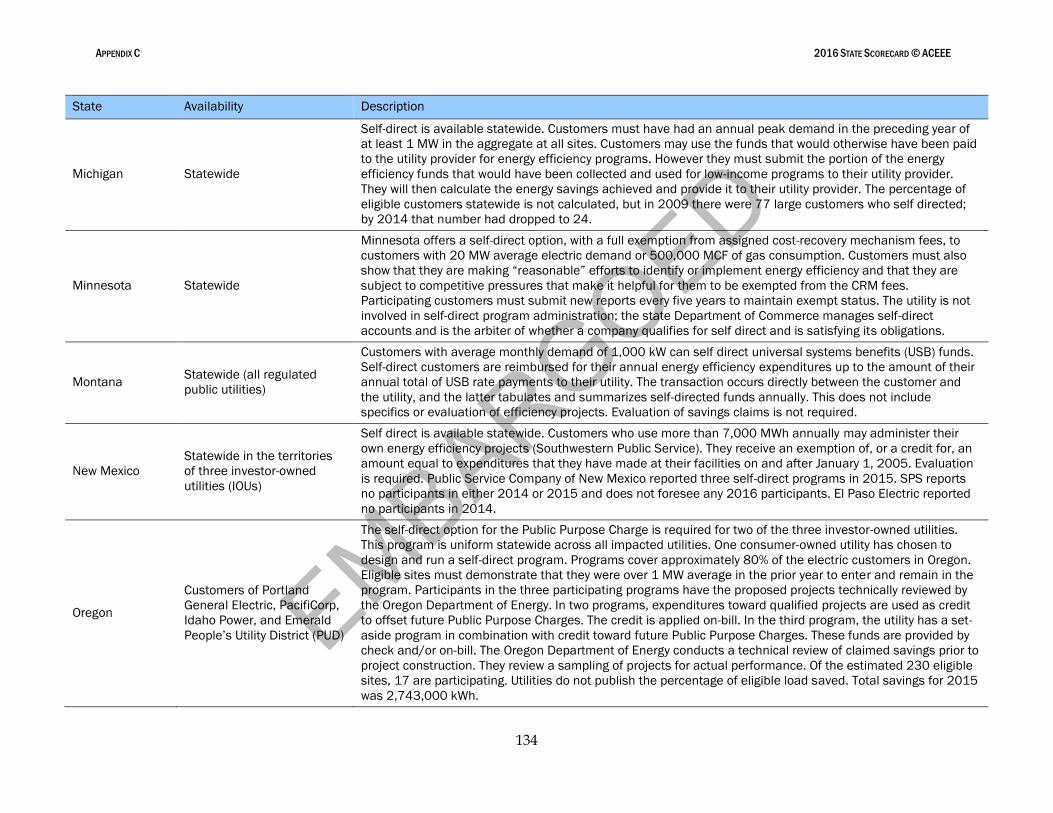
EMBARGOED
APPENDIX C 2016 STATE SCORECARD © ACEEE
134
State Availability Description
Michigan Statewide
Self-direct is available statewide. Customers must have had an annual peak demand in the preceding year of
at least 1 MW in the aggregate at all sites. Customers may use the funds that would otherwise have been paid
to the utility provider for energy efficiency programs. However they must submit the portion of the energy
efficiency funds that would have been collected and used for low-income programs to their utility provider.
They will then calculate the energy savings achieved and provide it to their utility provider. The percentage of
eligible customers statewide is not calculated, but in 2009 there were 77 large customers who self directed;
by 2014 that number had dropped to 24.
Minnesota Statewide
Minnesota offers a self-direct option, with a full exemption from assigned cost-recovery mechanism fees, to
customers with 20 MW average electric demand or 500,000 MCF of gas consumption. Customers must also
show that they are making “reasonable” efforts to identify or implement energy efficiency and that they are
subject to competitive pressures that make it helpful for them to be exempted from the CRM fees.
Participating customers must submit new reports every five years to maintain exempt status. The utility is not
involved in self-direct program administration; the state Department of Commerce manages self-direct
accounts and is the arbiter of whether a company qualifies for self direct and is satisfying its obligations.
Montana Statewide (all regulated
public utilities)
Customers with average monthly demand of 1,000 kW can self direct universal systems benefits (USB) funds.
Self-direct customers are reimbursed for their annual energy efficiency expenditures up to the amount of their
annual total of USB rate payments to their utility. The transaction occurs directly between the customer and
the utility, and the latter tabulates and summarizes self-directed funds annually. This does not include
specifics or evaluation of efficiency projects. Evaluation of savings claims is not required.
New Mexico
Statewide in the territories
of three investor-owned
utilities (IOUs)
Self direct is available statewide. Customers who use more than 7,000 MWh annually may administer their
own energy efficiency projects (Southwestern Public Service). They receive an exemption of, or a credit for, an
amount equal to expenditures that they have made at their facilities on and after January 1, 2005. Evaluation
is required. Public Service Company of New Mexico reported three self-direct programs in 2015. SPS reports
no participants in either 2014 or 2015 and does not foresee any 2016 participants. El Paso Electric reported
no participants in 2014.
Oregon
Customers of Portland
General Electric, PacifiCorp,
Idaho Power, and Emerald
People’s Utility District (PUD)
The self-direct option for the Public Purpose Charge is required for two of the three investor-owned utilities.
This program is uniform statewide across all impacted utilities. One consumer-owned utility has chosen to
design and run a self-direct program. Programs cover approximately 80% of the electric customers in Oregon.
Eligible sites must demonstrate that they were over 1 MW average in the prior year to enter and remain in the
program. Participants in the three participating programs have the proposed projects technically reviewed by
the Oregon Department of Energy. In two programs, expenditures toward qualified projects are used as credit
to offset future Public Purpose Charges. The credit is applied on-bill. In the third program, the utility has a set-
aside program in combination with credit toward future Public Purpose Charges. These funds are provided by
check and/or on-bill. The Oregon Department of Energy conducts a technical review of claimed savings prior to
project construction. They review a sampling of projects for actual performance. Of the estimated 230 eligible
sites, 17 are participating. Utilities do not publish the percentage of eligible load saved. Total savings for 2015
was 2,743,000 kWh.
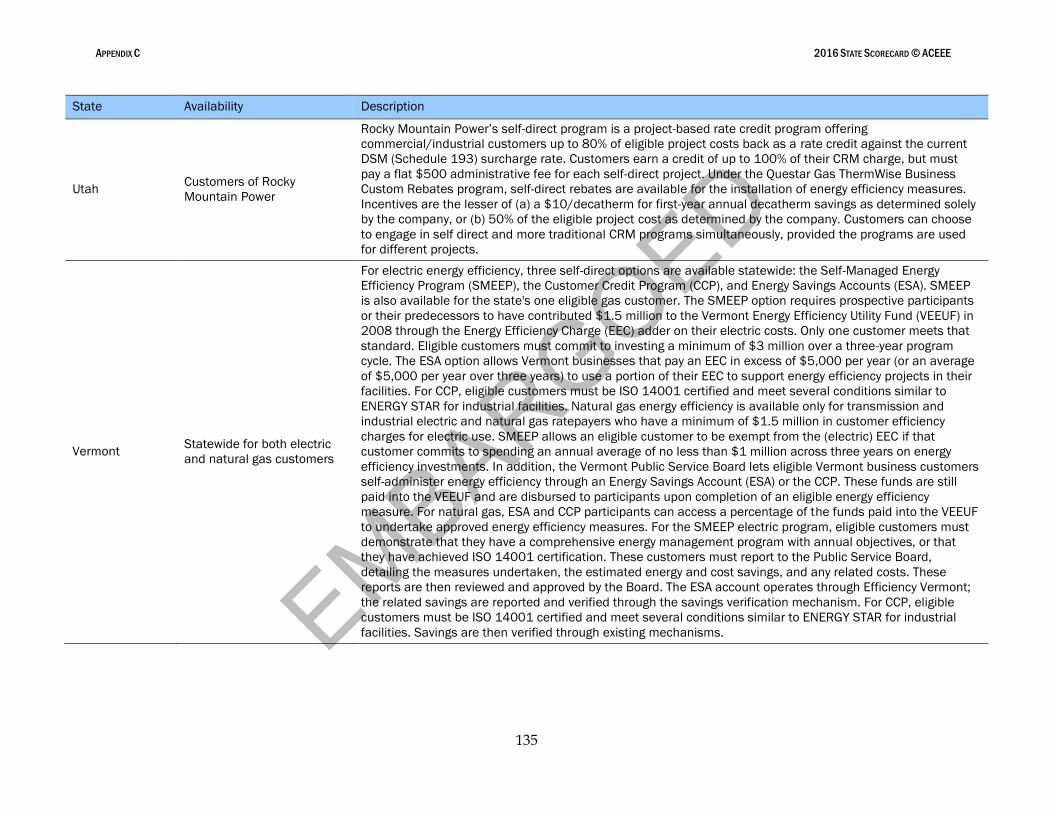
EMBARGOED
APPENDIX C 2016 STATE SCORECARD © ACEEE
135
State Availability Description
Utah Customers of Rocky
Mountain Power
Rocky Mountain Power’s self-direct program is a project-based rate credit program offering
commercial/industrial customers up to 80% of eligible project costs back as a rate credit against the current
DSM (Schedule 193) surcharge rate. Customers earn a credit of up to 100% of their CRM charge, but must
pay a flat $500 administrative fee for each self-direct project. Under the Questar Gas ThermWise Business
Custom Rebates program, self-direct rebates are available for the installation of energy efficiency measures.
Incentives are the lesser of (a) a $10/decatherm for first-year annual decatherm savings as determined solely
by the company, or (b) 50% of the eligible project cost as determined by the company. Customers can choose
to engage in self direct and more traditional CRM programs simultaneously, provided the programs are used
for different projects.
Vermont Statewide for both electric
and natural gas customers
For electric energy efficiency, three self-direct options are available statewide: the Self-Managed Energy
Efficiency Program (SMEEP), the Customer Credit Program (CCP), and Energy Savings Accounts (ESA). SMEEP
is also available for the state's one eligible gas customer. The SMEEP option requires prospective participants
or their predecessors to have contributed $1.5 million to the Vermont Energy Efficiency Utility Fund (VEEUF) in
2008 through the Energy Efficiency Charge (EEC) adder on their electric costs. Only one customer meets that
standard. Eligible customers must commit to investing a minimum of $3 million over a three-year program
cycle. The ESA option allows Vermont businesses that pay an EEC in excess of $5,000 per year (or an average
of $5,000 per year over three years) to use a portion of their EEC to support energy efficiency projects in their
facilities. For CCP, eligible customers must be ISO 14001 certified and meet several conditions similar to
ENERGY STAR for industrial facilities. Natural gas energy efficiency is available only for transmission and
industrial electric and natural gas ratepayers who have a minimum of $1.5 million in customer efficiency
charges for electric use. SMEEP allows an eligible customer to be exempt from the (electric) EEC if that
customer commits to spending an annual average of no less than $1 million across three years on energy
efficiency investments. In addition, the Vermont Public Service Board lets eligible Vermont business customers
self-administer energy efficiency through an Energy Savings Account (ESA) or the CCP. These funds are still
paid into the VEEUF and are disbursed to participants upon completion of an eligible energy efficiency
measure. For natural gas, ESA and CCP participants can access a percentage of the funds paid into the VEEUF
to undertake approved energy efficiency measures. For the SMEEP electric program, eligible customers must
demonstrate that they have a comprehensive energy management program with annual objectives, or that
they have achieved ISO 14001 certification. These customers must report to the Public Service Board,
detailing the measures undertaken, the estimated energy and cost savings, and any related costs. These
reports are then reviewed and approved by the Board. The ESA account operates through Efficiency Vermont;
the related savings are reported and verified through the savings verification mechanism. For CCP, eligible
customers must be ISO 14001 certified and meet several conditions similar to ENERGY STAR for industrial
facilities. Savings are then verified through existing mechanisms.
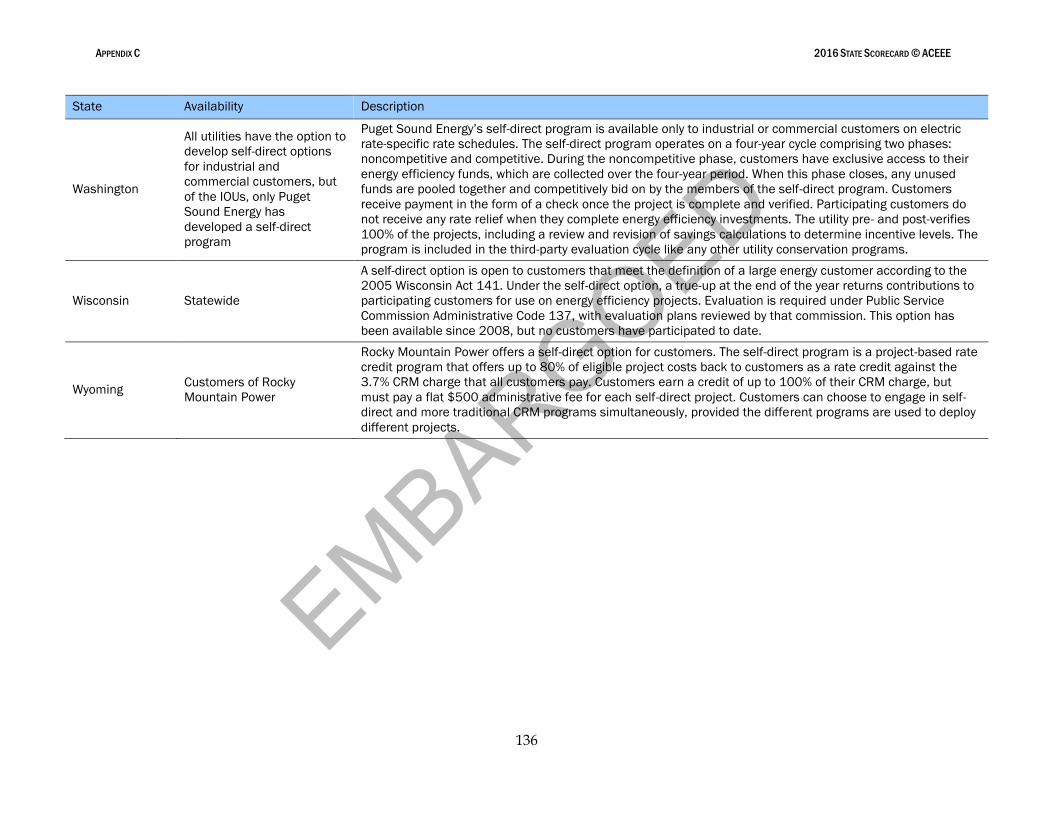
EMBARGOED
APPENDIX C 2016 STATE SCORECARD © ACEEE
136
State Availability Description
Washington
All utilities have the option to
develop self-direct options
for industrial and
commercial customers, but
of the IOUs, only Puget
Sound Energy has
developed a self-direct
program
Puget Sound Energy’s self-direct program is available only to industrial or commercial customers on electric
rate-specific rate schedules. The self-direct program operates on a four-year cycle comprising two phases:
noncompetitive and competitive. During the noncompetitive phase, customers have exclusive access to their
energy efficiency funds, which are collected over the four-year period. When this phase closes, any unused
funds are pooled together and competitively bid on by the members of the self-direct program. Customers
receive payment in the form of a check once the project is complete and verified. Participating customers do
not receive any rate relief when they complete energy efficiency investments. The utility pre- and post-verifies
100% of the projects, including a review and revision of savings calculations to determine incentive levels. The
program is included in the third-party evaluation cycle like any other utility conservation programs.
Wisconsin Statewide
A self-direct option is open to customers that meet the definition of a large energy customer according to the
2005 Wisconsin Act 141. Under the self-direct option, a true-up at the end of the year returns contributions to
participating customers for use on energy efficiency projects. Evaluation is required under Public Service
Commission Administrative Code 137, with evaluation plans reviewed by that commission. This option has
been available since 2008, but no customers have participated to date.
Wyoming Customers of Rocky
Mountain Power
Rocky Mountain Power offers a self-direct option for customers. The self-direct program is a project-based rate
credit program that offers up to 80% of eligible project costs back to customers as a rate credit against the
3.7% CRM charge that all customers pay. Customers earn a credit of up to 100% of their CRM charge, but
must pay a flat $500 administrative fee for each self-direct project. Customers can choose to engage in self-
direct and more traditional CRM programs simultaneously, provided the different programs are used to deploy
different projects.
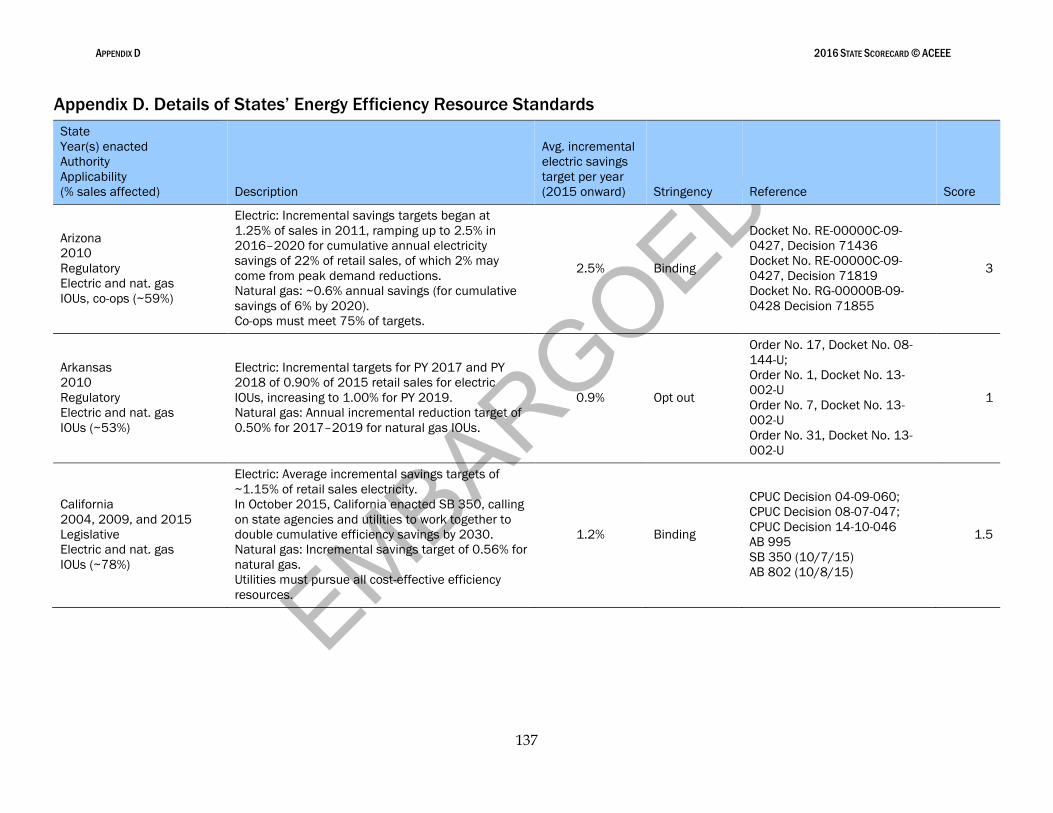
EMBARGOED
APPENDIX D 2016 STATE SCORECARD © ACEEE
137
Appendix D. Details of States’ Energy Efficiency Resource Standards
State
Year(s) enacted
Authority
Applicability
(% sales affected) Description
Avg. incremental
electric savings
target per year
(2015 onward) Stringency Reference Score
Arizona
2010
Regulatory
Electric and nat. gas
IOUs, co-ops (~59%)
Electric: Incremental savings targets began at
1.25% of sales in 2011, ramping up to 2.5% in
2016–2020 for cumulative annual electricity
savings of 22% of retail sales, of which 2% may
come from peak demand reductions.
Natural gas: ~0.6% annual savings (for cumulative
savings of 6% by 2020).
Co-ops must meet 75% of targets.
2.5% Binding
Docket No. RE-00000C-09-
0427, Decision 71436
Docket No. RE-00000C-09-
0427, Decision 71819
Docket No. RG-00000B-09-
0428 Decision 71855
3
Arkansas
2010
Regulatory
Electric and nat. gas
IOUs (~53%)
Electric: Incremental targets for PY 2017 and PY
2018 of 0.90% of 2015 retail sales for electric
IOUs, increasing to 1.00% for PY 2019.
Natural gas: Annual incremental reduction target of
0.50% for 2017–2019 for natural gas IOUs.
0.9% Opt out
Order No. 17, Docket No. 08-
144-U;
Order No. 1, Docket No. 13-
002-U
Order No. 7, Docket No. 13-
002-U
Order No. 31, Docket No. 13-
002-U
1
California
2004, 2009, and 2015
Legislative
Electric and nat. gas
IOUs (~78%)
Electric: Average incremental savings targets of
~1.15% of retail sales electricity.
In October 2015, California enacted SB 350, calling
on state agencies and utilities to work together to
double cumulative efficiency savings by 2030.
Natural gas: Incremental savings target of 0.56% for
natural gas.
Utilities must pursue all cost-effective efficiency
resources.
1.2% Binding
CPUC Decision 04-09-060;
CPUC Decision 08-07-047;
CPUC Decision 14-10-046
AB 995
SB 350 (10/7/15)
AB 802 (10/8/15)
1.5
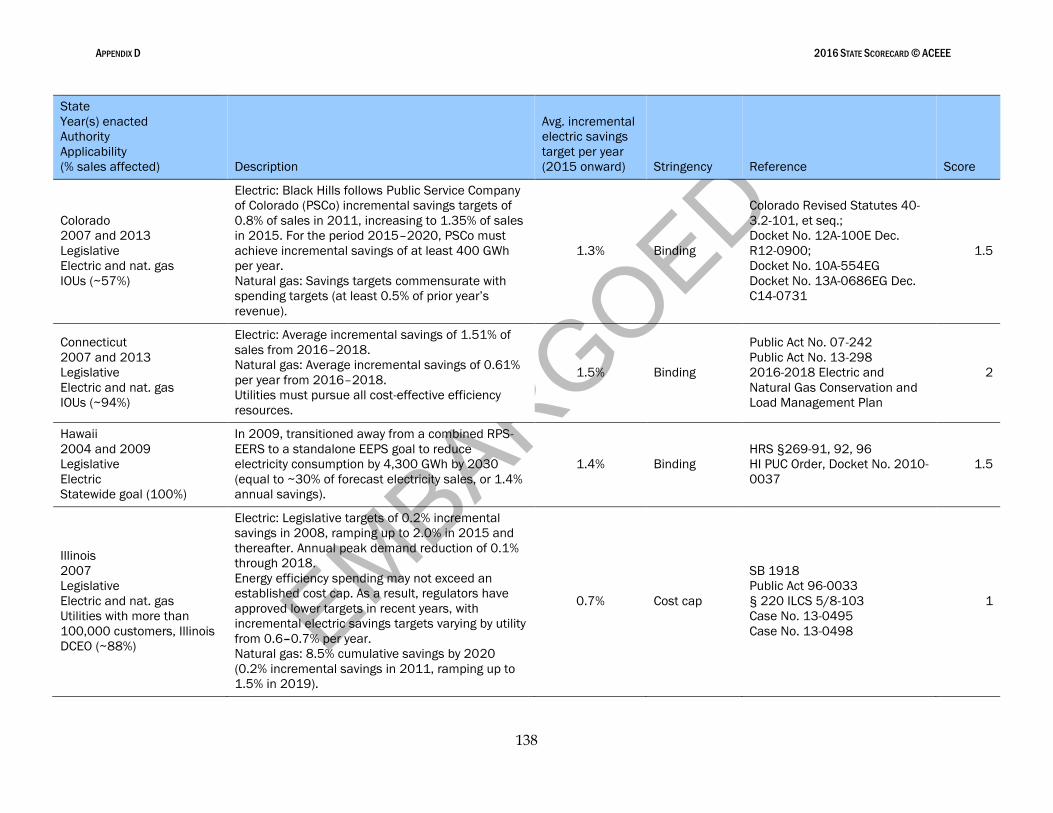
EMBARGOED
APPENDIX D 2016 STATE SCORECARD © ACEEE
138
State
Year(s) enacted
Authority
Applicability
(% sales affected) Description
Avg. incremental
electric savings
target per year
(2015 onward) Stringency Reference Score
Colorado
2007 and 2013
Legislative
Electric and nat. gas
IOUs (~57%)
Electric: Black Hills follows Public Service Company
of Colorado (PSCo) incremental savings targets of
0.8% of sales in 2011, increasing to 1.35% of sales
in 2015. For the period 2015–2020, PSCo must
achieve incremental savings of at least 400 GWh
per year.
Natural gas: Savings targets commensurate with
spending targets (at least 0.5% of prior year’s
revenue).
1.3% Binding
Colorado Revised Statutes 40-
3.2-101, et seq.;
Docket No. 12A-100E Dec.
R12-0900;
Docket No. 10A-554EG
Docket No. 13A-0686EG Dec.
C14-0731
1.5
Connecticut
2007 and 2013
Legislative
Electric and nat. gas
IOUs (~94%)
Electric: Average incremental savings of 1.51% of
sales from 2016–2018.
Natural gas: Average incremental savings of 0.61%
per year from 2016–2018.
Utilities must pursue all cost-effective efficiency
resources.
1.5% Binding
Public Act No. 07-242
Public Act No. 13-298
2016-2018 Electric and
Natural Gas Conservation and
Load Management Plan
2
Hawaii
2004 and 2009
Legislative
Electric
Statewide goal (100%)
In 2009, transitioned away from a combined RPS-
EERS to a standalone EEPS goal to reduce
electricity consumption by 4,300 GWh by 2030
(equal to ~30% of forecast electricity sales, or 1.4%
annual savings).
1.4% Binding
HRS §269-91, 92, 96
HI PUC Order, Docket No. 2010-
0037
1.5
Illinois
2007
Legislative
Electric and nat. gas
Utilities with more than
100,000 customers, Illinois
DCEO (~88%)
Electric: Legislative targets of 0.2% incremental
savings in 2008, ramping up to 2.0% in 2015 and
thereafter. Annual peak demand reduction of 0.1%
through 2018.
Energy efficiency spending may not exceed an
established cost cap. As a result, regulators have
approved lower targets in recent years, with
incremental electric savings targets varying by utility
from 0.6–0.7% per year.
Natural gas: 8.5% cumulative savings by 2020
(0.2% incremental savings in 2011, ramping up to
1.5% in 2019).
0.7% Cost cap
SB 1918
Public Act 96-0033
§ 220 ILCS 5/8-103
Case No. 13-0495
Case No. 13-0498
1
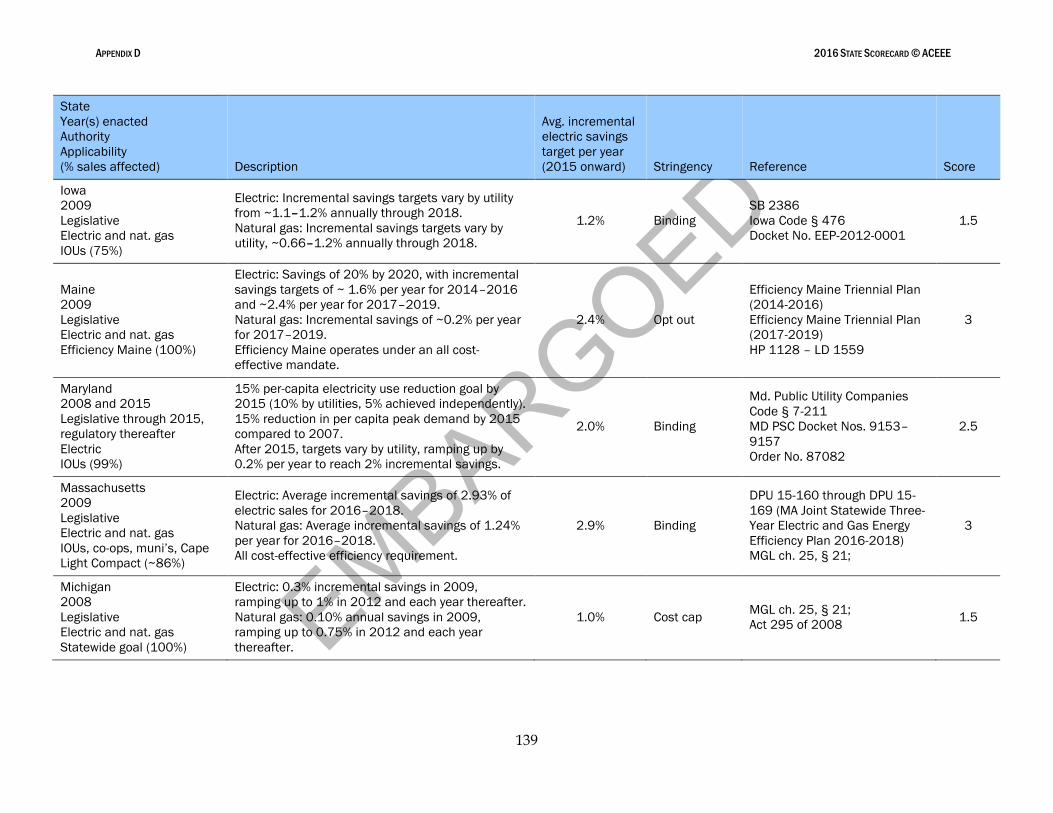
EMBARGOED
APPENDIX D 2016 STATE SCORECARD © ACEEE
139
State
Year(s) enacted
Authority
Applicability
(% sales affected) Description
Avg. incremental
electric savings
target per year
(2015 onward) Stringency Reference Score
Iowa
2009
Legislative
Electric and nat. gas
IOUs (75%)
Electric: Incremental savings targets vary by utility
from ~1.1–1.2% annually through 2018.
Natural gas: Incremental savings targets vary by
utility, ~0.66–1.2% annually through 2018.
1.2% Binding
SB 2386
Iowa Code § 476
Docket No. EEP-2012-0001
1.5
Maine
2009
Legislative
Electric and nat. gas
Efficiency Maine (100%)
Electric: Savings of 20% by 2020, with incremental
savings targets of ~ 1.6% per year for 2014–2016
and ~2.4% per year for 2017–2019.
Natural gas: Incremental savings of ~0.2% per year
for 2017–2019.
Efficiency Maine operates under an all cost-
effective mandate.
2.4% Opt out
Efficiency Maine Triennial Plan
(2014-2016)
Efficiency Maine Triennial Plan
(2017-2019)
HP 1128 – LD 1559
3
Maryland
2008 and 2015
Legislative through 2015,
regulatory thereafter
Electric
IOUs (99%)
15% per-capita electricity use reduction goal by
2015 (10% by utilities, 5% achieved independently).
15% reduction in per capita peak demand by 2015
compared to 2007.
After 2015, targets vary by utility, ramping up by
0.2% per year to reach 2% incremental savings.
2.0% Binding
Md. Public Utility Companies
Code § 7-211
MD PSC Docket Nos. 9153–
9157
Order No. 87082
2.5
Massachusetts
2009
Legislative
Electric and nat. gas
IOUs, co-ops, muni’s, Cape
Light Compact (~86%)
Electric: Average incremental savings of 2.93% of
electric sales for 2016–2018.
Natural gas: Average incremental savings of 1.24%
per year for 2016–2018.
All cost-effective efficiency requirement.
2.9% Binding
DPU 15-160 through DPU 15-
169 (MA Joint Statewide Three-
Year Electric and Gas Energy
Efficiency Plan 2016-2018)
MGL ch. 25, § 21;
3
Michigan
2008
Legislative
Electric and nat. gas
Statewide goal (100%)
Electric: 0.3% incremental savings in 2009,
ramping up to 1% in 2012 and each year thereafter.
Natural gas: 0.10% annual savings in 2009,
ramping up to 0.75% in 2012 and each year
thereafter.
1.0% Cost cap MGL ch. 25, § 21;
Act 295 of 2008 1.5
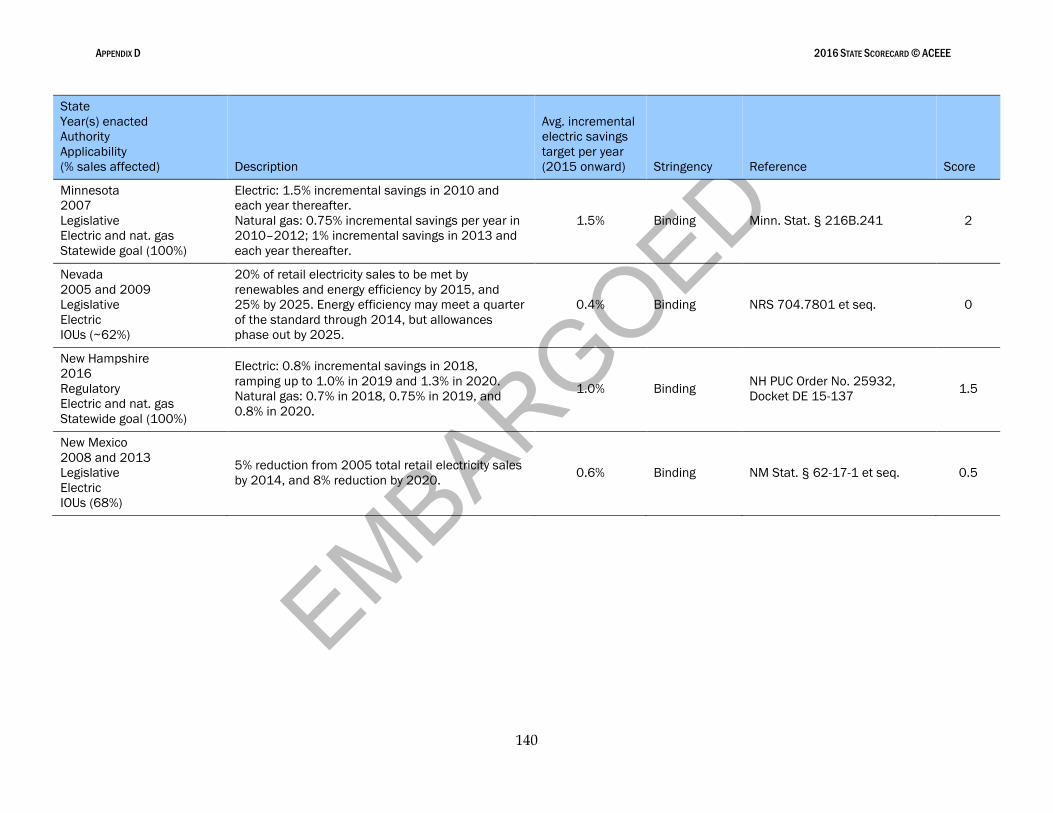
EMBARGOED
APPENDIX D 2016 STATE SCORECARD © ACEEE
140
State
Year(s) enacted
Authority
Applicability
(% sales affected) Description
Avg. incremental
electric savings
target per year
(2015 onward) Stringency Reference Score
Minnesota
2007
Legislative
Electric and nat. gas
Statewide goal (100%)
Electric: 1.5% incremental savings in 2010 and
each year thereafter.
Natural gas: 0.75% incremental savings per year in
2010–2012; 1% incremental savings in 2013 and
each year thereafter.
1.5% Binding Minn. Stat. § 216B.241 2
Nevada
2005 and 2009
Legislative
Electric
IOUs (~62%)
20% of retail electricity sales to be met by
renewables and energy efficiency by 2015, and
25% by 2025. Energy efficiency may meet a quarter
of the standard through 2014, but allowances
phase out by 2025.
0.4% Binding NRS 704.7801 et seq. 0
New Hampshire
2016
Regulatory
Electric and nat. gas
Statewide goal (100%)
Electric: 0.8% incremental savings in 2018,
ramping up to 1.0% in 2019 and 1.3% in 2020.
Natural gas: 0.7% in 2018, 0.75% in 2019, and
0.8% in 2020.
1.0% Binding NH PUC Order No. 25932,
Docket DE 15-137 1.5
New Mexico
2008 and 2013
Legislative
Electric
IOUs (68%)
5% reduction from 2005 total retail electricity sales
by 2014, and 8% reduction by 2020. 0.6% Binding NM Stat. § 62-17-1 et seq. 0.5
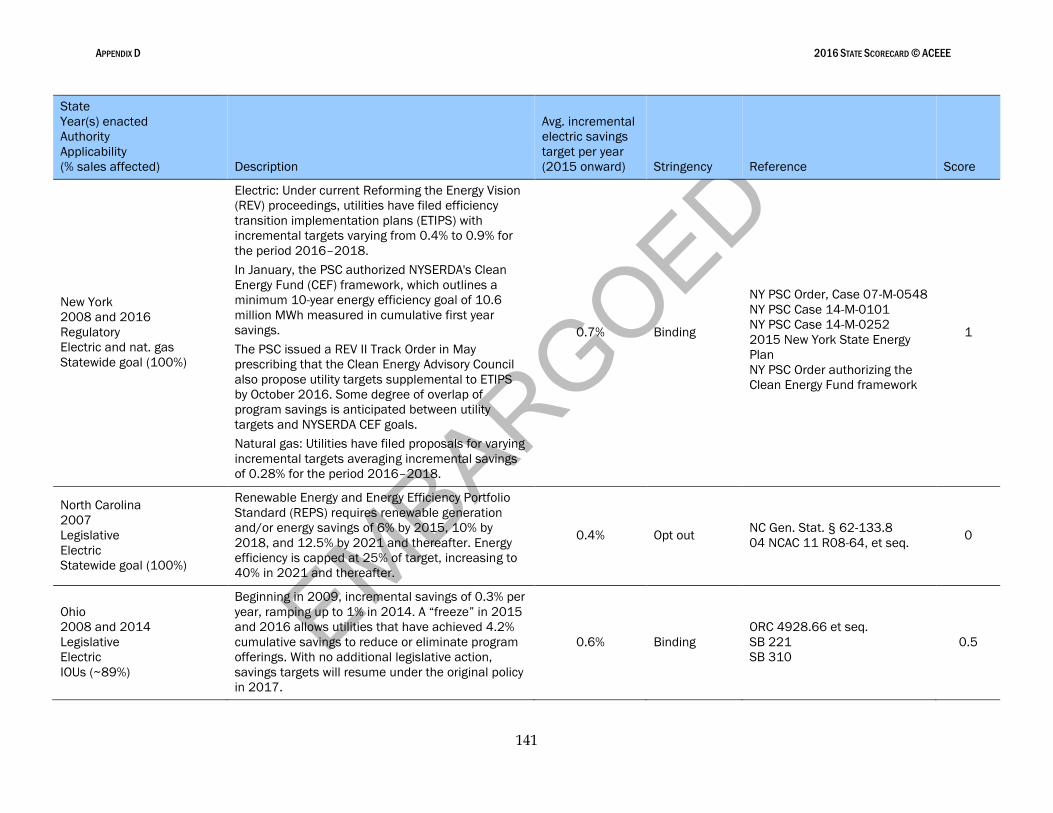
EMBARGOED
APPENDIX D 2016 STATE SCORECARD © ACEEE
141
State
Year(s) enacted
Authority
Applicability
(% sales affected) Description
Avg. incremental
electric savings
target per year
(2015 onward) Stringency Reference Score
New York
2008 and 2016
Regulatory
Electric and nat. gas
Statewide goal (100%)
Electric: Under current Reforming the Energy Vision
(REV) proceedings, utilities have filed efficiency
transition implementation plans (ETIPS) with
incremental targets varying from 0.4% to 0.9% for
the period 2016–2018.
In January, the PSC authorized NYSERDA's Clean
Energy Fund (CEF) framework, which outlines a
minimum 10-year energy efficiency goal of 10.6
million MWh measured in cumulative first year
savings.
The PSC issued a REV II Track Order in May
prescribing that the Clean Energy Advisory Council
also propose utility targets supplemental to ETIPS
by October 2016. Some degree of overlap of
program savings is anticipated between utility
targets and NYSERDA CEF goals.
Natural gas: Utilities have filed proposals for varying
incremental targets averaging incremental savings
of 0.28% for the period 2016–2018.
0.7% Binding
NY PSC Order, Case 07-M-0548
NY PSC Case 14-M-0101
NY PSC Case 14-M-0252
2015 New York State Energy
Plan
NY PSC Order authorizing the
Clean Energy Fund framework
1
North Carolina
2007
Legislative
Electric
Statewide goal (100%)
Renewable Energy and Energy Efficiency Portfolio
Standard (REPS) requires renewable generation
and/or energy savings of 6% by 2015, 10% by
2018, and 12.5% by 2021 and thereafter. Energy
efficiency is capped at 25% of target, increasing to
40% in 2021 and thereafter.
0.4% Opt out NC Gen. Stat. § 62-133.8
04 NCAC 11 R08-64, et seq. 0
Ohio
2008 and 2014
Legislative
Electric
IOUs (~89%)
Beginning in 2009, incremental savings of 0.3% per
year, ramping up to 1% in 2014. A “freeze” in 2015
and 2016 allows utilities that have achieved 4.2%
cumulative savings to reduce or eliminate program
offerings. With no additional legislative action,
savings targets will resume under the original policy
in 2017.
0.6% Binding
ORC 4928.66 et seq.
SB 221
SB 310
0.5
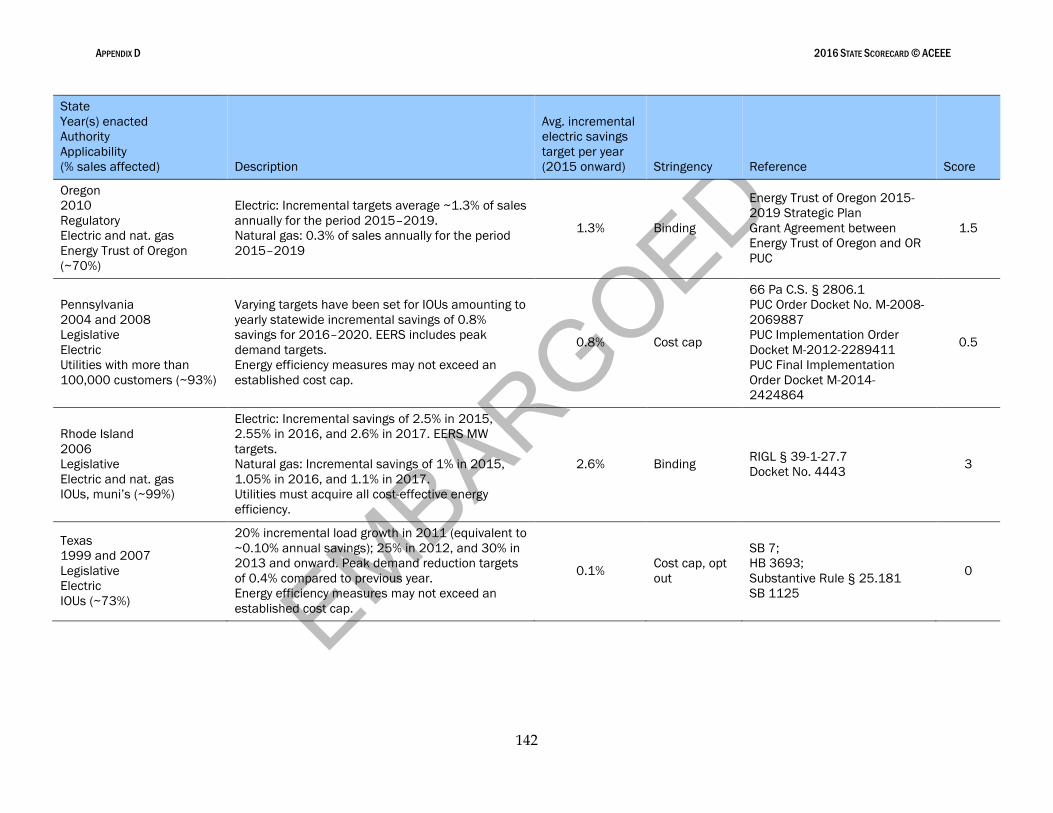
EMBARGOED
APPENDIX D 2016 STATE SCORECARD © ACEEE
142
State
Year(s) enacted
Authority
Applicability
(% sales affected) Description
Avg. incremental
electric savings
target per year
(2015 onward) Stringency Reference Score
Oregon
2010
Regulatory
Electric and nat. gas
Energy Trust of Oregon
(~70%)
Electric: Incremental targets average ~1.3% of sales
annually for the period 2015–2019.
Natural gas: 0.3% of sales annually for the period
2015–2019
1.3% Binding
Energy Trust of Oregon 2015-
2019 Strategic Plan
Grant Agreement between
Energy Trust of Oregon and OR
PUC
1.5
Pennsylvania
2004 and 2008
Legislative
Electric
Utilities with more than
100,000 customers (~93%)
Varying targets have been set for IOUs amounting to
yearly statewide incremental savings of 0.8%
savings for 2016–2020. EERS includes peak
demand targets.
Energy efficiency measures may not exceed an
established cost cap.
0.8% Cost cap
66 Pa C.S. § 2806.1
PUC Order Docket No. M-2008-
2069887
PUC Implementation Order
Docket M-2012-2289411
PUC Final Implementation
Order Docket M-2014-
2424864
0.5
Rhode Island
2006
Legislative
Electric and nat. gas
IOUs, muni’s (~99%)
Electric: Incremental savings of 2.5% in 2015,
2.55% in 2016, and 2.6% in 2017. EERS MW
targets.
Natural gas: Incremental savings of 1% in 2015,
1.05% in 2016, and 1.1% in 2017.
Utilities must acquire all cost-effective energy
efficiency.
2.6% Binding RIGL § 39-1-27.7
Docket No. 4443 3
Texas
1999 and 2007
Legislative
Electric
IOUs (~73%)
20% incremental load growth in 2011 (equivalent to
~0.10% annual savings); 25% in 2012, and 30% in
2013 and onward. Peak demand reduction targets
of 0.4% compared to previous year.
Energy efficiency measures may not exceed an
established cost cap.
0.1% Cost cap, opt
out
SB 7;
HB 3693;
Substantive Rule § 25.181
SB 1125
0
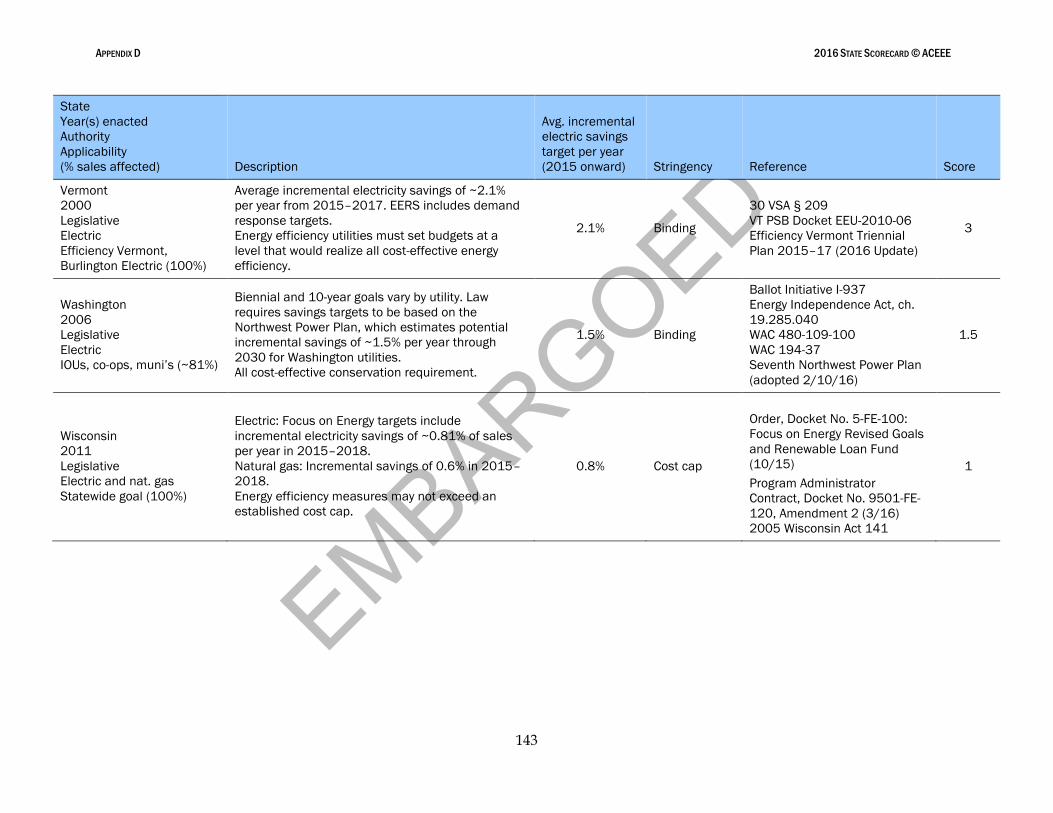
EMBARGOED
APPENDIX D 2016 STATE SCORECARD © ACEEE
143
State
Year(s) enacted
Authority
Applicability
(% sales affected) Description
Avg. incremental
electric savings
target per year
(2015 onward) Stringency Reference Score
Vermont
2000
Legislative
Electric
Efficiency Vermont,
Burlington Electric (100%)
Average incremental electricity savings of ~2.1%
per year from 2015–2017. EERS includes demand
response targets.
Energy efficiency utilities must set budgets at a
level that would realize all cost-effective energy
efficiency.
2.1% Binding
30 VSA § 209
VT PSB Docket EEU-2010-06
Efficiency Vermont Triennial
Plan 2015–17 (2016 Update)
3
Washington
2006
Legislative
Electric
IOUs, co-ops, muni’s (~81%)
Biennial and 10-year goals vary by utility. Law
requires savings targets to be based on the
Northwest Power Plan, which estimates potential
incremental savings of ~1.5% per year through
2030 for Washington utilities.
All cost-effective conservation requirement.
1.5% Binding
Ballot Initiative I-937
Energy Independence Act, ch.
19.285.040
WAC 480-109-100
WAC 194-37
Seventh Northwest Power Plan
(adopted 2/10/16)
1.5
Wisconsin
2011
Legislative
Electric and nat. gas
Statewide goal (100%)
Electric: Focus on Energy targets include
incremental electricity savings of ~0.81% of sales
per year in 2015–2018.
Natural gas: Incremental savings of 0.6% in 2015–
2018.
Energy efficiency measures may not exceed an
established cost cap.
0.8% Cost cap
Order, Docket No. 5-FE-100:
Focus on Energy Revised Goals
and Renewable Loan Fund
(10/15)
Program Administrator
Contract, Docket No. 9501-FE-
120, Amendment 2 (3/16)
2005 Wisconsin Act 141
1

EMBARGOED
APPENDIX E 2016 STATE SCORECARD © ACEEE
144
Appendix E. Tax Incentives for High-Efficiency Vehicles
State Tax incentive
Arizona
EV owners in Arizona pay a significantly reduced vehicle license tax—$4 for every $100 in
assessed value—as part of the state’s Reduced Alternative Fuel Vehicle License Tax
program.
California
AB 118 targets medium- and heavy-duty trucks in a voucher program whose goal is to
reduce the up-front incremental cost of purchasing a hybrid vehicle. Vouchers range from
$12,000 to $110,000, depending on vehicle specifications, and are paid directly to fleets
that purchase hybrid trucks for use within the state. California also offers tax rebates of up
to $5,000 for light-duty zero-emission EVs and plug-in hybrid EVs on a first-come, first-
served basis, effective until 2023.
Colorado
On May 4, the Colorado legislature approved HB 1332, a bill that dramatically improves the
state's alternative fuel vehicle tax credits. It sets a flat $5,000 credit for the purchase of a
light-duty electric vehicle and makes the credits assignable to a car dealer or finance
company effectively turning the credit into a point of sale incentive.
Connecticut
Connecticut’s Hydrogen and Electric Automobile Purchase Rebate Program provides as
much as $3,000 for the incremental cost of the purchase of a hydrogen fuel cell electric
vehicle (FCEV), all-electric vehicle, or plug-in hybrid electric vehicle. Rebates are calculated
on the basis of battery capacity. Vehicles with a battery capacity of 18 kWh or more earn
$3,000, while those with capacities between 7 kWh and 18kWh earn $1,500. Vehicles
with batteries smaller than 7 kWh are eligible for a rebate of $750.
Delaware As part of the Delaware Clean Transportation Incentive Program, plug-in electric vehicles
earn a rebate of $2,200.
District of
Columbia
The District of Columbia offers a reduced registration fee and a vehicle excise tax
exemption for owners of all vehicles with an EPA estimated city fuel economy of at least 40
miles per gallon.
Georgia
An income tax credit is available to individuals who purchase new commercial medium- or
heavy-duty vehicles that run on alternative fuels including electricity. Medium-duty vehicles
qualify for a credit up to $12,000, while heavy-duty vehicles can earn a credit of up to
$20,000.
Guam A rebate of up to 10% the base price of a plug-in vehicle is available to residents and
businesses.
Louisiana
Louisiana offers an income tax credit equivalent to 50% of the incremental cost of
purchasing an EV under the state’s alternative-fuel vehicle tax credit program. Alternatively,
taxpayers may claim the lesser of 10% of the total cost of the vehicle or $3,000.
Maryland
Purchasers of qualifying all-electric and plug-in hybrid-electric light-duty vehicles may claim
up to $3,000 against the vehicle excise tax in Maryland, depending on the vehicle’s battery
weight.
Massachusetts The Massachusetts Offers Rebates for EVs (MOR-EV) program offers rebates of up to
$2,500 to customers purchasing plug-in EVs.
New Jersey All ZEVs in New Jersey are exempt from state sales and use taxes.
New York New York started the New York Truck Voucher Incentive Program in 2014. Vouchers of up
to $60,000 are available for the purchase of hybrid and all-electric class 3–8 trucks.
Puerto Rico
In 2012, Puerto Rico amended the Internal Revenue Code to allow an excise tax
reimbursement of up to 65% for buyers of hybrid and plug-in hybrid vehicles. The
reimbursement ranges from $2,000 to $8,000 and is available through 2016. Buyers of
all-electric vehicles are waived from paying excise tax altogether.
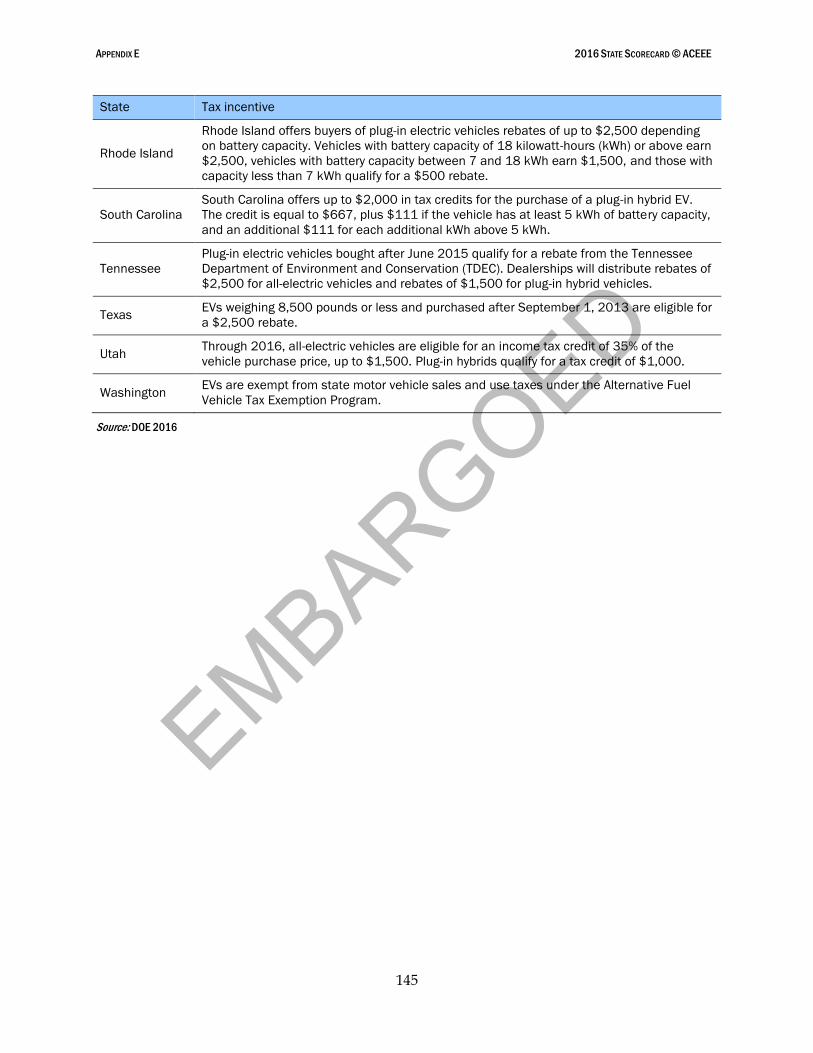
EMBARGOED
APPENDIX E 2016 STATE SCORECARD © ACEEE
145
State Tax incentive
Rhode Island
Rhode Island offers buyers of plug-in electric vehicles rebates of up to $2,500 depending
on battery capacity. Vehicles with battery capacity of 18 kilowatt-hours (kWh) or above earn
$2,500, vehicles with battery capacity between 7 and 18 kWh earn $1,500, and those with
capacity less than 7 kWh qualify for a $500 rebate.
South Carolina
South Carolina offers up to $2,000 in tax credits for the purchase of a plug-in hybrid EV.
The credit is equal to $667, plus $111 if the vehicle has at least 5 kWh of battery capacity,
and an additional $111 for each additional kWh above 5 kWh.
Tennessee
Plug-in electric vehicles bought after June 2015 qualify for a rebate from the Tennessee
Department of Environment and Conservation (TDEC). Dealerships will distribute rebates of
$2,500 for all-electric vehicles and rebates of $1,500 for plug-in hybrid vehicles.
Texas EVs weighing 8,500 pounds or less and purchased after September 1, 2013 are eligible for
a $2,500 rebate.
Utah Through 2016, all-electric vehicles are eligible for an income tax credit of 35% of the
vehicle purchase price, up to $1,500. Plug-in hybrids qualify for a tax credit of $1,000.
Washington EVs are exempt from state motor vehicle sales and use taxes under the Alternative Fuel
Vehicle Tax Exemption Program.
Source: DOE 2016
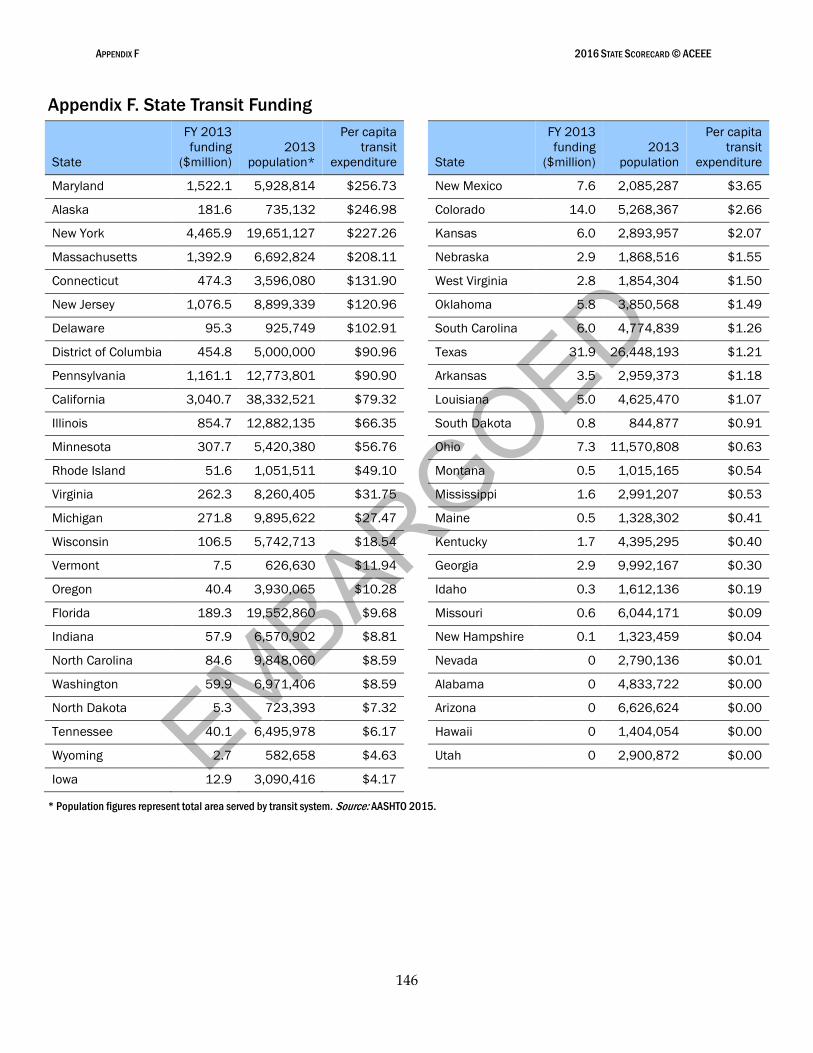
EMBARGOED
APPENDIX F 2016 STATE SCORECARD © ACEEE
146
Appendix F. State Transit Funding
State
FY 2013
funding
($million)
2013
population*
Per capita
transit
expenditure State
FY 2013
funding
($million)
2013
population
Per capita
transit
expenditure
Maryland 1,522.1 5,928,814 $256.73 New Mexico 7.6 2,085,287 $3.65
Alaska 181.6 735,132 $246.98 Colorado 14.0 5,268,367 $2.66
New York 4,465.9 19,651,127 $227.26 Kansas 6.0 2,893,957 $2.07
Massachusetts 1,392.9 6,692,824 $208.11 Nebraska 2.9 1,868,516 $1.55
Connecticut 474.3 3,596,080 $131.90 West Virginia 2.8 1,854,304 $1.50
New Jersey 1,076.5 8,899,339 $120.96 Oklahoma 5.8 3,850,568 $1.49
Delaware 95.3 925,749 $102.91 South Carolina 6.0 4,774,839 $1.26
District of Columbia 454.8 5,000,000 $90.96 Texas 31.9 26,448,193 $1.21
Pennsylvania 1,161.1 12,773,801 $90.90 Arkansas 3.5 2,959,373 $1.18
California 3,040.7 38,332,521 $79.32 Louisiana 5.0 4,625,470 $1.07
Illinois 854.7 12,882,135 $66.35 South Dakota 0.8 844,877 $0.91
Minnesota 307.7 5,420,380 $56.76 Ohio 7.3 11,570,808 $0.63
Rhode Island 51.6 1,051,511 $49.10 Montana 0.5 1,015,165 $0.54
Virginia 262.3 8,260,405 $31.75 Mississippi 1.6 2,991,207 $0.53
Michigan 271.8 9,895,622 $27.47 Maine 0.5 1,328,302 $0.41
Wisconsin 106.5 5,742,713 $18.54 Kentucky 1.7 4,395,295 $0.40
Vermont 7.5 626,630 $11.94 Georgia 2.9 9,992,167 $0.30
Oregon 40.4 3,930,065 $10.28 Idaho 0.3 1,612,136 $0.19
Florida 189.3 19,552,860 $9.68 Missouri 0.6 6,044,171 $0.09
Indiana 57.9 6,570,902 $8.81 New Hampshire 0.1 1,323,459 $0.04
North Carolina 84.6 9,848,060 $8.59 Nevada 0 2,790,136 $0.01
Washington 59.9 6,971,406 $8.59 Alabama 0 4,833,722 $0.00
North Dakota 5.3 723,393 $7.32 Arizona 0 6,626,624 $0.00
Tennessee 40.1 6,495,978 $6.17 Hawaii 0 1,404,054 $0.00
Wyoming 2.7 582,658 $4.63 Utah 0 2,900,872 $0.00
Iowa 12.9 3,090,416 $4.17
* Population figures represent total area served by transit system. Source: AASHTO 2015.
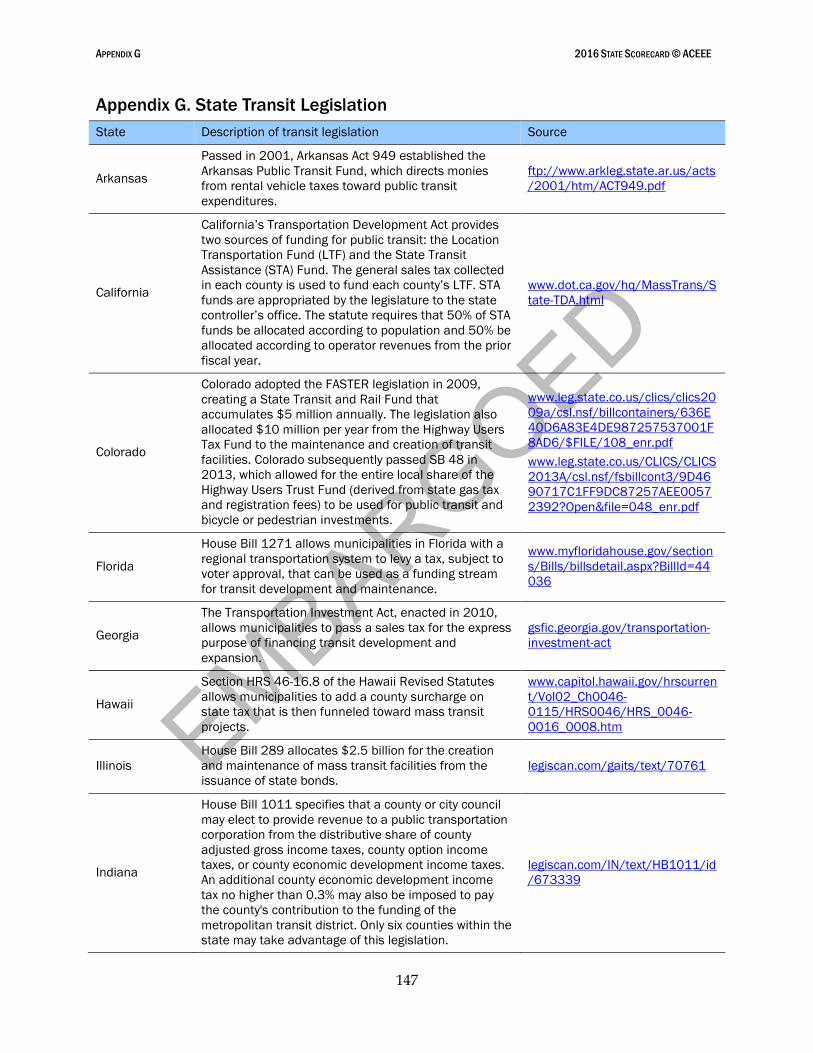
EMBARGOED
APPENDIX G 2016 STATE SCORECARD © ACEEE
147
Appendix G. State Transit Legislation
State Description of transit legislation Source
Arkansas
Passed in 2001, Arkansas Act 949 established the
Arkansas Public Transit Fund, which directs monies
from rental vehicle taxes toward public transit
expenditures.
ftp://www.arkleg.state.ar.us/acts
/2001/htm/ACT949.pdf
California
California’s Transportation Development Act provides
two sources of funding for public transit: the Location
Transportation Fund (LTF) and the State Transit
Assistance (STA) Fund. The general sales tax collected
in each county is used to fund each county’s LTF. STA
funds are appropriated by the legislature to the state
controller’s office. The statute requires that 50% of STA
funds be allocated according to population and 50% be
allocated according to operator revenues from the prior
fiscal year.
www.dot.ca.gov/hq/MassTrans/S
tate-TDA.html
Colorado
Colorado adopted the FASTER legislation in 2009,
creating a State Transit and Rail Fund that
accumulates $5 million annually. The legislation also
allocated $10 million per year from the Highway Users
Tax Fund to the maintenance and creation of transit
facilities. Colorado subsequently passed SB 48 in
2013, which allowed for the entire local share of the
Highway Users Trust Fund (derived from state gas tax
and registration fees) to be used for public transit and
bicycle or pedestrian investments.
www.leg.state.co.us/clics/clics20
09a/csl.nsf/billcontainers/636E
40D6A83E4DE987257537001F
8AD6/$FILE/108_enr.pdf
www.leg.state.co.us/CLICS/CLICS
2013A/csl.nsf/fsbillcont3/9D46
90717C1FF9DC87257AEE0057
2392?Open&file=048_enr.pdf
Florida
House Bill 1271 allows municipalities in Florida with a
regional transportation system to levy a tax, subject to
voter approval, that can be used as a funding stream
for transit development and maintenance.
www.myfloridahouse.gov/section
s/Bills/billsdetail.aspx?BillId=44
036
Georgia
The Transportation Investment Act, enacted in 2010,
allows municipalities to pass a sales tax for the express
purpose of financing transit development and
expansion.
gsfic.georgia.gov/transportation-
investment-act
Hawaii
Section HRS 46-16.8 of the Hawaii Revised Statutes
allows municipalities to add a county surcharge on
state tax that is then funneled toward mass transit
projects.
www.capitol.hawaii.gov/hrscurren
t/Vol02_Ch0046-
0115/HRS0046/HRS_0046-
0016_0008.htm
Illinois
House Bill 289 allocates $2.5 billion for the creation
and maintenance of mass transit facilities from the
issuance of state bonds.
legiscan.com/gaits/text/70761
Indiana
House Bill 1011 specifies that a county or city council
may elect to provide revenue to a public transportation
corporation from the distributive share of county
adjusted gross income taxes, county option income
taxes, or county economic development income taxes.
An additional county economic development income
tax no higher than 0.3% may also be imposed to pay
the county's contribution to the funding of the
metropolitan transit district. Only six counties within the
state may take advantage of this legislation.
legiscan.com/IN/text/HB1011/id
/673339
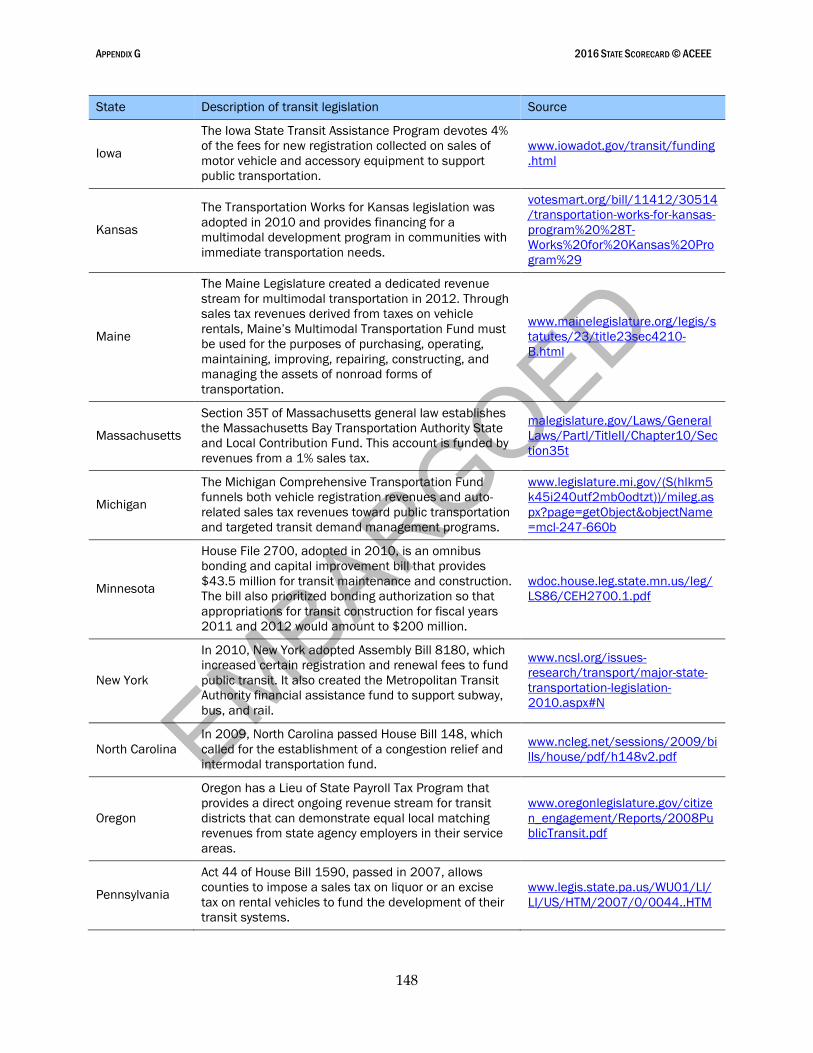
EMBARGOED
APPENDIX G 2016 STATE SCORECARD © ACEEE
148
State Description of transit legislation Source
Iowa
The Iowa State Transit Assistance Program devotes 4%
of the fees for new registration collected on sales of
motor vehicle and accessory equipment to support
public transportation.
www.iowadot.gov/transit/funding
.html
Kansas
The Transportation Works for Kansas legislation was
adopted in 2010 and provides financing for a
multimodal development program in communities with
immediate transportation needs.
votesmart.org/bill/11412/30514
/transportation-works-for-kansas-
program%20%28T-
Works%20for%20Kansas%20Pro
gram%29
Maine
The Maine Legislature created a dedicated revenue
stream for multimodal transportation in 2012. Through
sales tax revenues derived from taxes on vehicle
rentals, Maine’s Multimodal Transportation Fund must
be used for the purposes of purchasing, operating,
maintaining, improving, repairing, constructing, and
managing the assets of nonroad forms of
transportation.
www.mainelegislature.org/legis/s
tatutes/23/title23sec4210-
B.html
Massachusetts
Section 35T of Massachusetts general law establishes
the Massachusetts Bay Transportation Authority State
and Local Contribution Fund. This account is funded by
revenues from a 1% sales tax.
malegislature.gov/Laws/General
Laws/PartI/TitleII/Chapter10/Sec
tion35t
Michigan
The Michigan Comprehensive Transportation Fund
funnels both vehicle registration revenues and auto-
related sales tax revenues toward public transportation
and targeted transit demand management programs.
www.legislature.mi.gov/(S(hlkm5
k45i240utf2mb0odtzt))/mileg.as
px?page=getObject&objectName
=mcl-247-660b
Minnesota
House File 2700, adopted in 2010, is an omnibus
bonding and capital improvement bill that provides
$43.5 million for transit maintenance and construction.
The bill also prioritized bonding authorization so that
appropriations for transit construction for fiscal years
2011 and 2012 would amount to $200 million.
wdoc.house.leg.state.mn.us/leg/
LS86/CEH2700.1.pdf
New York
In 2010, New York adopted Assembly Bill 8180, which
increased certain registration and renewal fees to fund
public transit. It also created the Metropolitan Transit
Authority financial assistance fund to support subway,
bus, and rail.
www.ncsl.org/issues-
research/transport/major-state-
transportation-legislation-
2010.aspx#N
North Carolina
In 2009, North Carolina passed House Bill 148, which
called for the establishment of a congestion relief and
intermodal transportation fund.
www.ncleg.net/sessions/2009/bi
lls/house/pdf/h148v2.pdf
Oregon
Oregon has a Lieu of State Payroll Tax Program that
provides a direct ongoing revenue stream for transit
districts that can demonstrate equal local matching
revenues from state agency employers in their service
areas.
www.oregonlegislature.gov/citize
n_engagement/Reports/2008Pu
blicTransit.pdf
Pennsylvania
Act 44 of House Bill 1590, passed in 2007, allows
counties to impose a sales tax on liquor or an excise
tax on rental vehicles to fund the development of their
transit systems.
www.legis.state.pa.us/WU01/LI/
LI/US/HTM/2007/0/0044..HTM
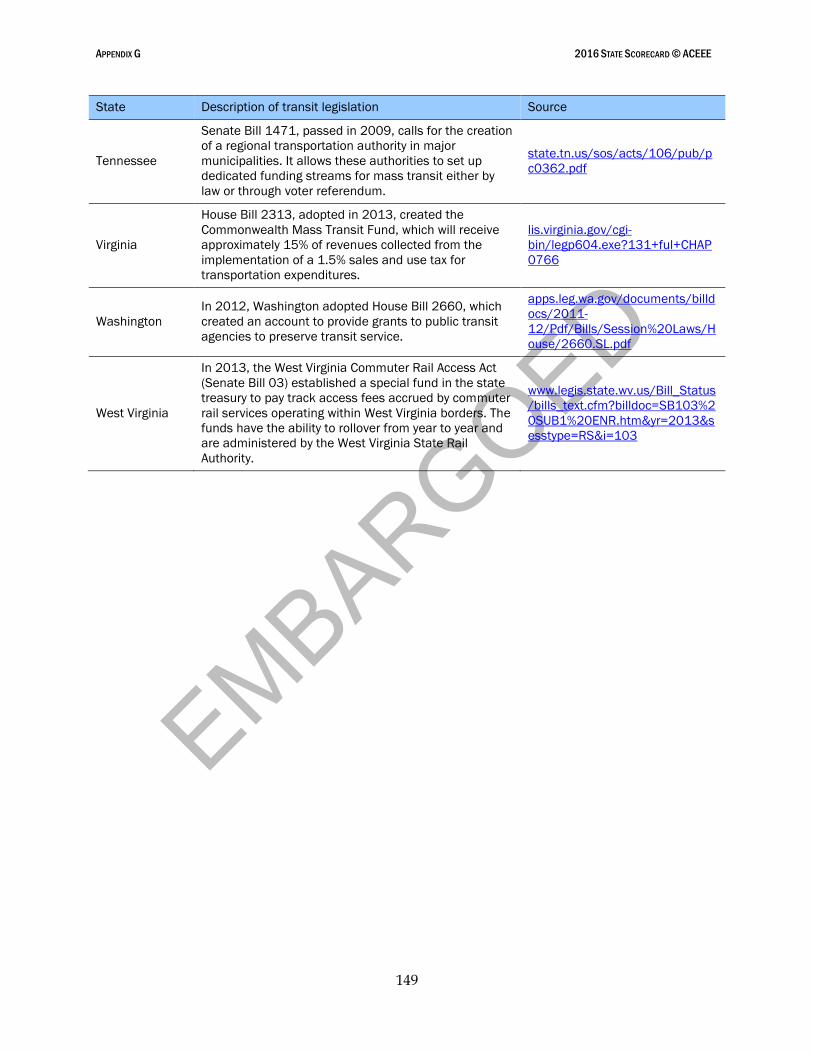
EMBARGOED
APPENDIX G 2016 STATE SCORECARD © ACEEE
149
State Description of transit legislation Source
Tennessee
Senate Bill 1471, passed in 2009, calls for the creation
of a regional transportation authority in major
municipalities. It allows these authorities to set up
dedicated funding streams for mass transit either by
law or through voter referendum.
state.tn.us/sos/acts/106/pub/p
c0362.pdf
Virginia
House Bill 2313, adopted in 2013, created the
Commonwealth Mass Transit Fund, which will receive
approximately 15% of revenues collected from the
implementation of a 1.5% sales and use tax for
transportation expenditures.
lis.virginia.gov/cgi-
bin/legp604.exe?131+ful+CHAP
0766
Washington
In 2012, Washington adopted House Bill 2660, which
created an account to provide grants to public transit
agencies to preserve transit service.
apps.leg.wa.gov/documents/billd
ocs/2011-
12/Pdf/Bills/Session%20Laws/H
ouse/2660.SL.pdf
West Virginia
In 2013, the West Virginia Commuter Rail Access Act
(Senate Bill 03) established a special fund in the state
treasury to pay track access fees accrued by commuter
rail services operating within West Virginia borders. The
funds have the ability to rollover from year to year and
are administered by the West Virginia State Rail
Authority.
www.legis.state.wv.us/Bill_Status
/bills_text.cfm?billdoc=SB103%2
0SUB1%20ENR.htm&yr=2013&s
esstype=RS&i=103
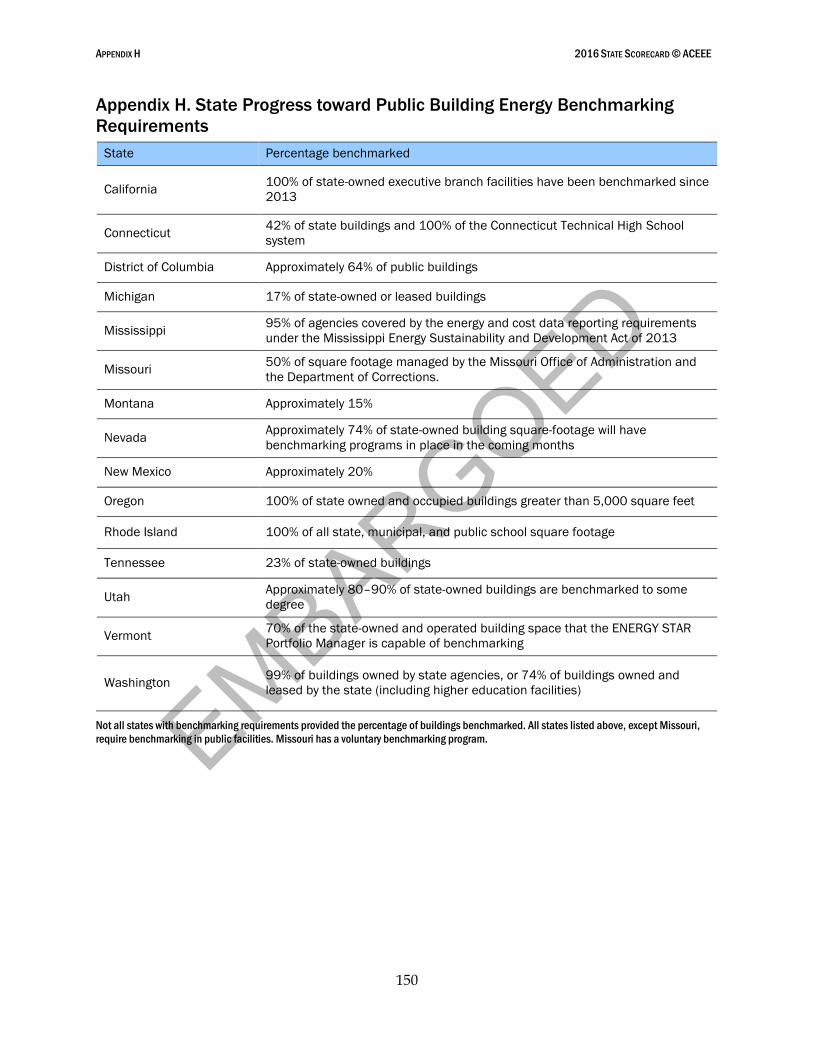
EMBARGOED
APPENDIX H 2016 STATE SCORECARD © ACEEE
150
Appendix H. State Progress toward Public Building Energy Benchmarking
Requirements
State Percentage benchmarked
California 100% of state-owned executive branch facilities have been benchmarked since
2013
Connecticut 42% of state buildings and 100% of the Connecticut Technical High School
system
District of Columbia Approximately 64% of public buildings
Michigan 17% of state-owned or leased buildings
Mississippi 95% of agencies covered by the energy and cost data reporting requirements
under the Mississippi Energy Sustainability and Development Act of 2013
Missouri 50% of square footage managed by the Missouri Office of Administration and
the Department of Corrections.
Montana Approximately 15%
Nevada Approximately 74% of state-owned building square-footage will have
benchmarking programs in place in the coming months
New Mexico Approximately 20%
Oregon 100% of state owned and occupied buildings greater than 5,000 square feet
Rhode Island 100% of all state, municipal, and public school square footage
Tennessee 23% of state-owned buildings
Utah Approximately 80–90% of state-owned buildings are benchmarked to some
degree
Vermont 70% of the state-owned and operated building space that the ENERGY STAR
Portfolio Manager is capable of benchmarking
Washington 99% of buildings owned by state agencies, or 74% of buildings owned and
leased by the state (including higher education facilities)
Not all states with benchmarking requirements provided the percentage of buildings benchmarked. All states listed above, except Missouri,
require benchmarking in public facilities. Missouri has a voluntary benchmarking program.
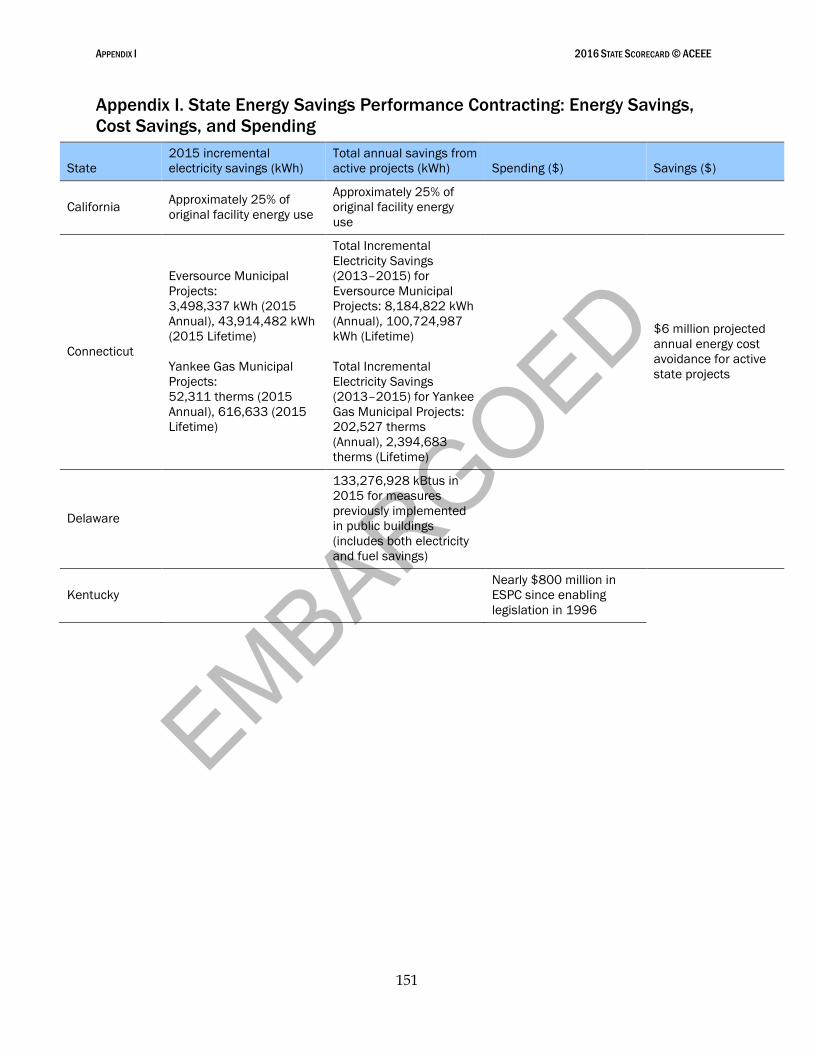
EMBARGOED
APPENDIX I 2016 STATE SCORECARD © ACEEE
151
Appendix I. State Energy Savings Performance Contracting: Energy Savings,
Cost Savings, and Spending
State
2015 incremental
electricity savings (kWh)
Total annual savings from
active projects (kWh) Spending ($) Savings ($)
California Approximately 25% of
original facility energy use
Approximately 25% of
original facility energy
use
Connecticut
Eversource Municipal
Projects:
3,498,337 kWh (2015
Annual), 43,914,482 kWh
(2015 Lifetime)
Yankee Gas Municipal
Projects:
52,311 therms (2015
Annual), 616,633 (2015
Lifetime)
Total Incremental
Electricity Savings
(2013–2015) for
Eversource Municipal
Projects: 8,184,822 kWh
(Annual), 100,724,987
kWh (Lifetime)
Total Incremental
Electricity Savings
(2013–2015) for Yankee
Gas Municipal Projects:
202,527 therms
(Annual), 2,394,683
therms (Lifetime)
$6 million projected
annual energy cost
avoidance for active
state projects
Delaware
133,276,928 kBtus in
2015 for measures
previously implemented
in public buildings
(includes both electricity
and fuel savings)
Kentucky
Nearly $800 million in
ESPC since enabling
legislation in 1996
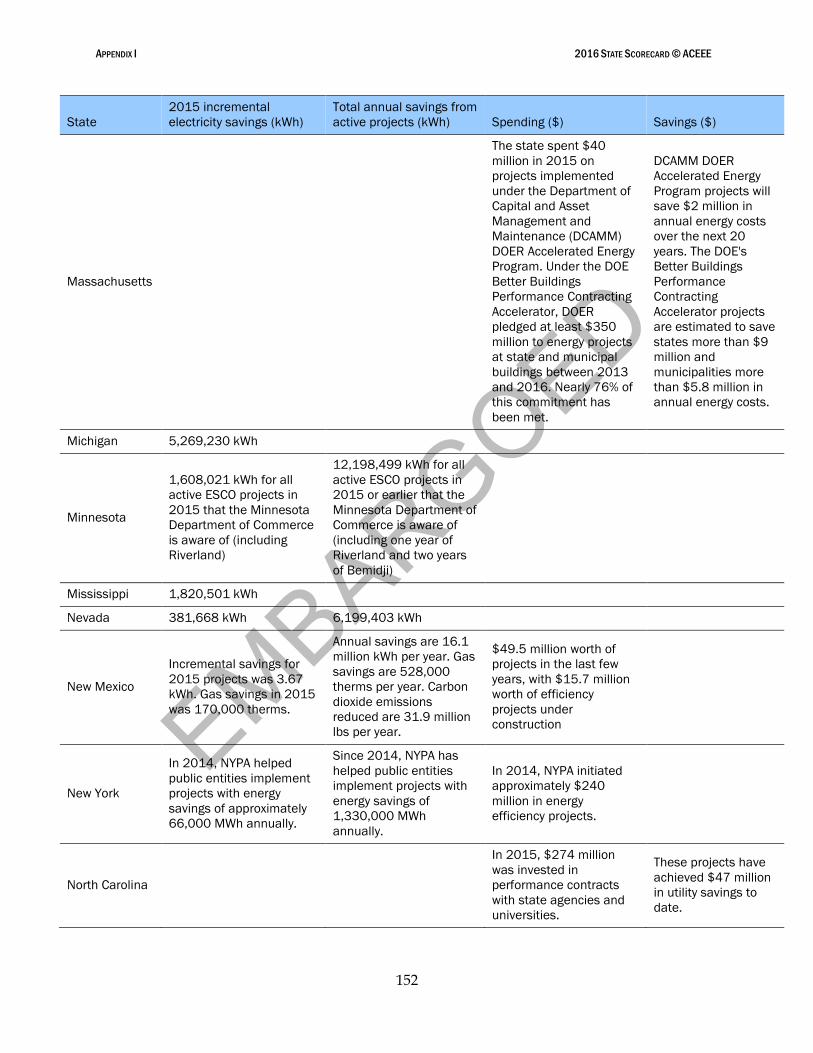
EMBARGOED
APPENDIX I 2016 STATE SCORECARD © ACEEE
152
State
2015 incremental
electricity savings (kWh)
Total annual savings from
active projects (kWh) Spending ($) Savings ($)
Massachusetts
The state spent $40
million in 2015 on
projects implemented
under the Department of
Capital and Asset
Management and
Maintenance (DCAMM)
DOER Accelerated Energy
Program. Under the DOE
Better Buildings
Performance Contracting
Accelerator, DOER
pledged at least $350
million to energy projects
at state and municipal
buildings between 2013
and 2016. Nearly 76% of
this commitment has
been met.
DCAMM DOER
Accelerated Energy
Program projects will
save $2 million in
annual energy costs
over the next 20
years. The DOE's
Better Buildings
Performance
Contracting
Accelerator projects
are estimated to save
states more than $9
million and
municipalities more
than $5.8 million in
annual energy costs.
Michigan 5,269,230 kWh
Minnesota
1,608,021 kWh for all
active ESCO projects in
2015 that the Minnesota
Department of Commerce
is aware of (including
Riverland)
12,198,499 kWh for all
active ESCO projects in
2015 or earlier that the
Minnesota Department of
Commerce is aware of
(including one year of
Riverland and two years
of Bemidji)
Mississippi 1,820,501 kWh
Nevada 381,668 kWh 6,199,403 kWh
New Mexico
Incremental savings for
2015 projects was 3.67
kWh. Gas savings in 2015
was 170,000 therms.
Annual savings are 16.1
million kWh per year. Gas
savings are 528,000
therms per year. Carbon
dioxide emissions
reduced are 31.9 million
lbs per year.
$49.5 million worth of
projects in the last few
years, with $15.7 million
worth of efficiency
projects under
construction
New York
In 2014, NYPA helped
public entities implement
projects with energy
savings of approximately
66,000 MWh annually.
Since 2014, NYPA has
helped public entities
implement projects with
energy savings of
1,330,000 MWh
annually.
In 2014, NYPA initiated
approximately $240
million in energy
efficiency projects.
North Carolina
In 2015, $274 million
was invested in
performance contracts
with state agencies and
universities.
These projects have
achieved $47 million
in utility savings to
date.
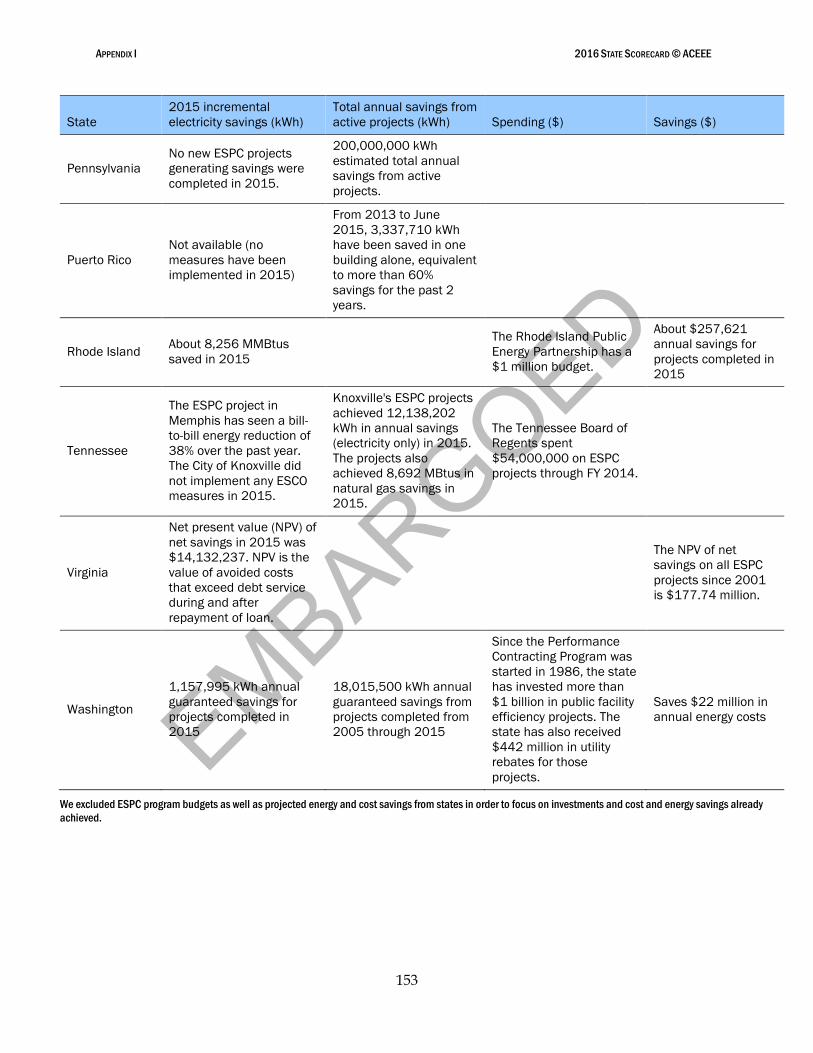
EMBARGOED
APPENDIX I 2016 STATE SCORECARD © ACEEE
153
State
2015 incremental
electricity savings (kWh)
Total annual savings from
active projects (kWh) Spending ($) Savings ($)
Pennsylvania
No new ESPC projects
generating savings were
completed in 2015.
200,000,000 kWh
estimated total annual
savings from active
projects.
Puerto Rico
Not available (no
measures have been
implemented in 2015)
From 2013 to June
2015, 3,337,710 kWh
have been saved in one
building alone, equivalent
to more than 60%
savings for the past 2
years.
Rhode Island About 8,256 MMBtus
saved in 2015
The Rhode Island Public
Energy Partnership has a
$1 million budget.
About $257,621
annual savings for
projects completed in
2015
Tennessee
The ESPC project in
Memphis has seen a bill-
to-bill energy reduction of
38% over the past year.
The City of Knoxville did
not implement any ESCO
measures in 2015.
Knoxville's ESPC projects
achieved 12,138,202
kWh in annual savings
(electricity only) in 2015.
The projects also
achieved 8,692 MBtus in
natural gas savings in
2015.
The Tennessee Board of
Regents spent
$54,000,000 on ESPC
projects through FY 2014.
Virginia
Net present value (NPV) of
net savings in 2015 was
$14,132,237. NPV is the
value of avoided costs
that exceed debt service
during and after
repayment of loan.
The NPV of net
savings on all ESPC
projects since 2001
is $177.74 million.
Washington
1,157,995 kWh annual
guaranteed savings for
projects completed in
2015
18,015,500 kWh annual
guaranteed savings from
projects completed from
2005 through 2015
Since the Performance
Contracting Program was
started in 1986, the state
has invested more than
$1 billion in public facility
efficiency projects. The
state has also received
$442 million in utility
rebates for those
projects.
Saves $22 million in
annual energy costs
We excluded ESPC program budgets as well as projected energy and cost savings from states in order to focus on investments and cost and energy savings already
achieved.
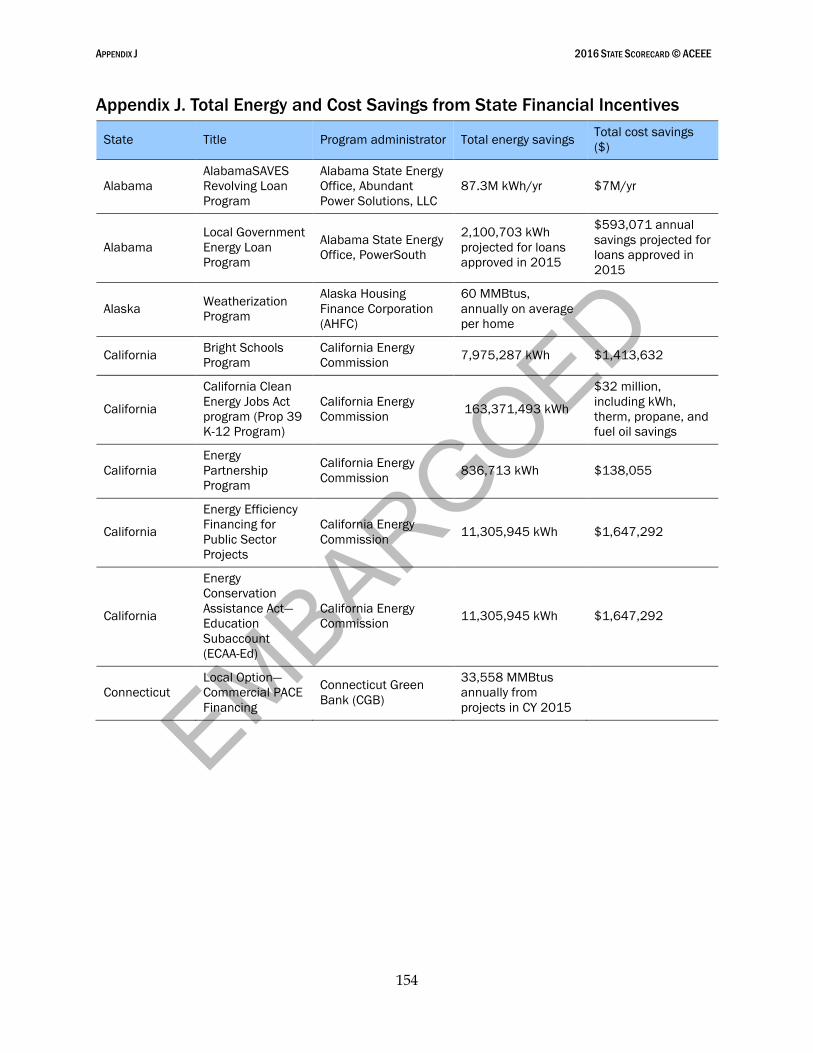
EMBARGOED
APPENDIX J 2016 STATE SCORECARD © ACEEE
154
Appendix J. Total Energy and Cost Savings from State Financial Incentives
State Title Program administrator Total energy savings Total cost savings
($)
Alabama
AlabamaSAVES
Revolving Loan
Program
Alabama State Energy
Office, Abundant
Power Solutions, LLC
87.3M kWh/yr $7M/yr
Alabama
Local Government
Energy Loan
Program
Alabama State Energy
Office, PowerSouth
2,100,703 kWh
projected for loans
approved in 2015
$593,071 annual
savings projected for
loans approved in
2015
Alaska Weatherization
Program
Alaska Housing
Finance Corporation
(AHFC)
60 MMBtus,
annually on average
per home
California Bright Schools
Program
California Energy
Commission 7,975,287 kWh $1,413,632
California
California Clean
Energy Jobs Act
program (Prop 39
K-12 Program)
California Energy
Commission 163,371,493 kWh
$32 million,
including kWh,
therm, propane, and
fuel oil savings
California
Energy
Partnership
Program
California Energy
Commission 836,713 kWh $138,055
California
Energy Efficiency
Financing for
Public Sector
Projects
California Energy
Commission 11,305,945 kWh $1,647,292
California
Energy
Conservation
Assistance Act—
Education
Subaccount
(ECAA-Ed)
California Energy
Commission 11,305,945 kWh $1,647,292
Connecticut
Local Option—
Commercial PACE
Financing
Connecticut Green
Bank (CGB)
33,558 MMBtus
annually from
projects in CY 2015
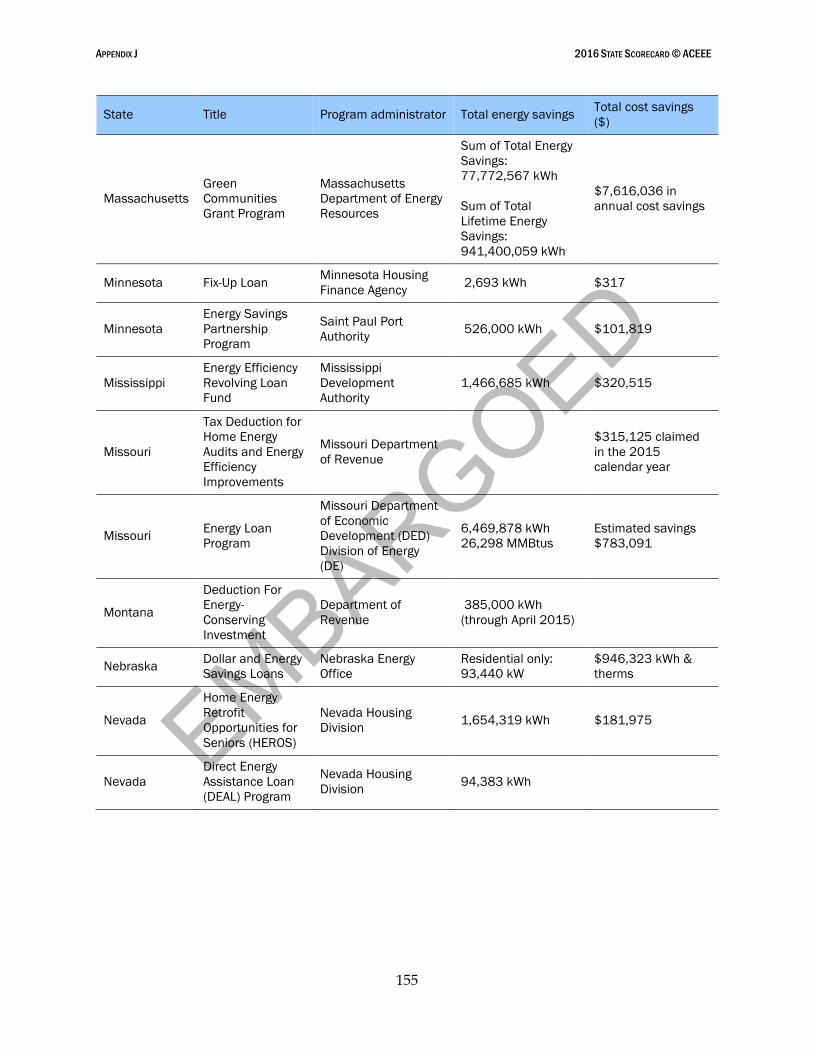
EMBARGOED
APPENDIX J 2016 STATE SCORECARD © ACEEE
155
State Title Program administrator Total energy savings Total cost savings
($)
Massachusetts
Green
Communities
Grant Program
Massachusetts
Department of Energy
Resources
Sum of Total Energy
Savings:
77,772,567 kWh
Sum of Total
Lifetime Energy
Savings:
941,400,059 kWh
$7,616,036 in
annual cost savings
Minnesota Fix-Up Loan Minnesota Housing
Finance Agency 2,693 kWh $317
Minnesota
Energy Savings
Partnership
Program
Saint Paul Port
Authority 526,000 kWh $101,819
Mississippi
Energy Efficiency
Revolving Loan
Fund
Mississippi
Development
Authority
1,466,685 kWh $320,515
Missouri
Tax Deduction for
Home Energy
Audits and Energy
Efficiency
Improvements
Missouri Department
of Revenue
$315,125 claimed
in the 2015
calendar year
Missouri Energy Loan
Program
Missouri Department
of Economic
Development (DED)
Division of Energy
(DE)
6,469,878 kWh
26,298 MMBtus
Estimated savings
$783,091
Montana
Deduction For
Energy-
Conserving
Investment
Department of
Revenue
385,000 kWh
(through April 2015)
Nebraska Dollar and Energy
Savings Loans
Nebraska Energy
Office
Residential only:
93,440 kW
$946,323 kWh &
therms
Nevada
Home Energy
Retrofit
Opportunities for
Seniors (HEROS)
Nevada Housing
Division 1,654,319 kWh $181,975
Nevada
Direct Energy
Assistance Loan
(DEAL) Program
Nevada Housing
Division 94,383 kWh
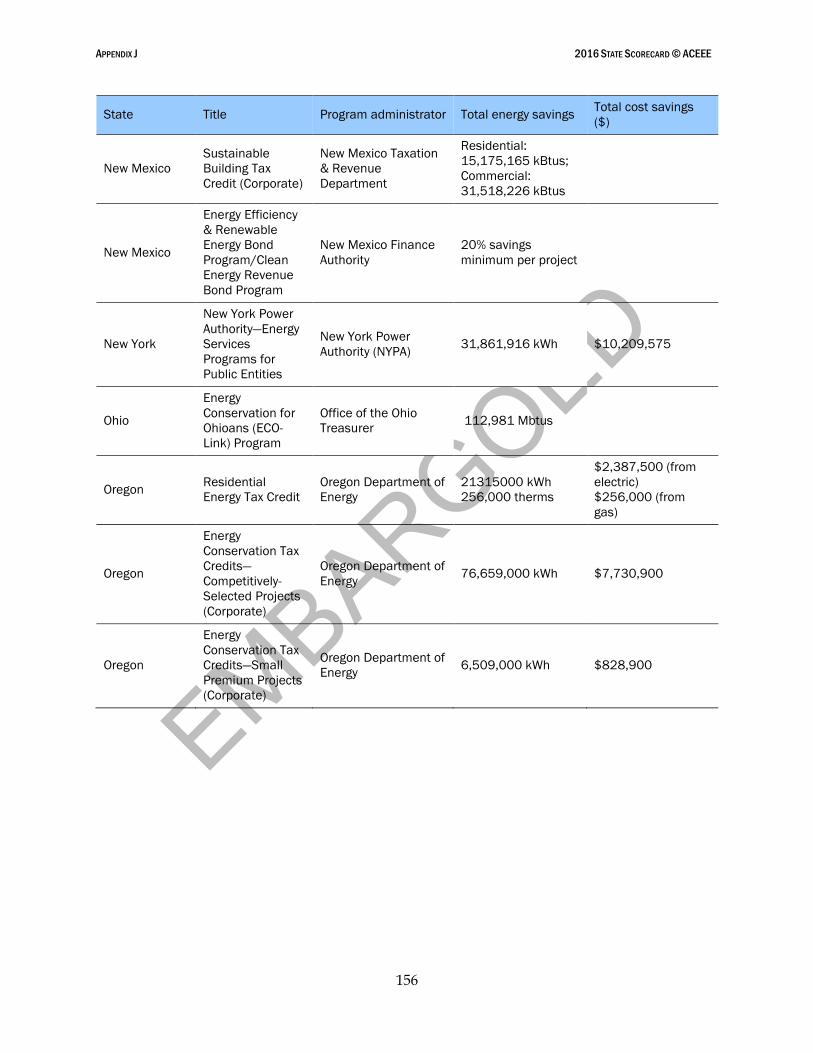
EMBARGOED
APPENDIX J 2016 STATE SCORECARD © ACEEE
156
State Title Program administrator Total energy savings Total cost savings
($)
New Mexico
Sustainable
Building Tax
Credit (Corporate)
New Mexico Taxation
& Revenue
Department
Residential:
15,175,165 kBtus;
Commercial:
31,518,226 kBtus
New Mexico
Energy Efficiency
& Renewable
Energy Bond
Program/Clean
Energy Revenue
Bond Program
New Mexico Finance
Authority
20% savings
minimum per project
New York
New York Power
Authority—Energy
Services
Programs for
Public Entities
New York Power
Authority (NYPA) 31,861,916 kWh $10,209,575
Ohio
Energy
Conservation for
Ohioans (ECO-
Link) Program
Office of the Ohio
Treasurer 112,981 Mbtus
Oregon Residential
Energy Tax Credit
Oregon Department of
Energy
21315000 kWh
256,000 therms
$2,387,500 (from
electric)
$256,000 (from
gas)
Oregon
Energy
Conservation Tax
Credits—
Competitively-
Selected Projects
(Corporate)
Oregon Department of
Energy 76,659,000 kWh $7,730,900
Oregon
Energy
Conservation Tax
Credits—Small
Premium Projects
(Corporate)
Oregon Department of
Energy 6,509,000 kWh $828,900
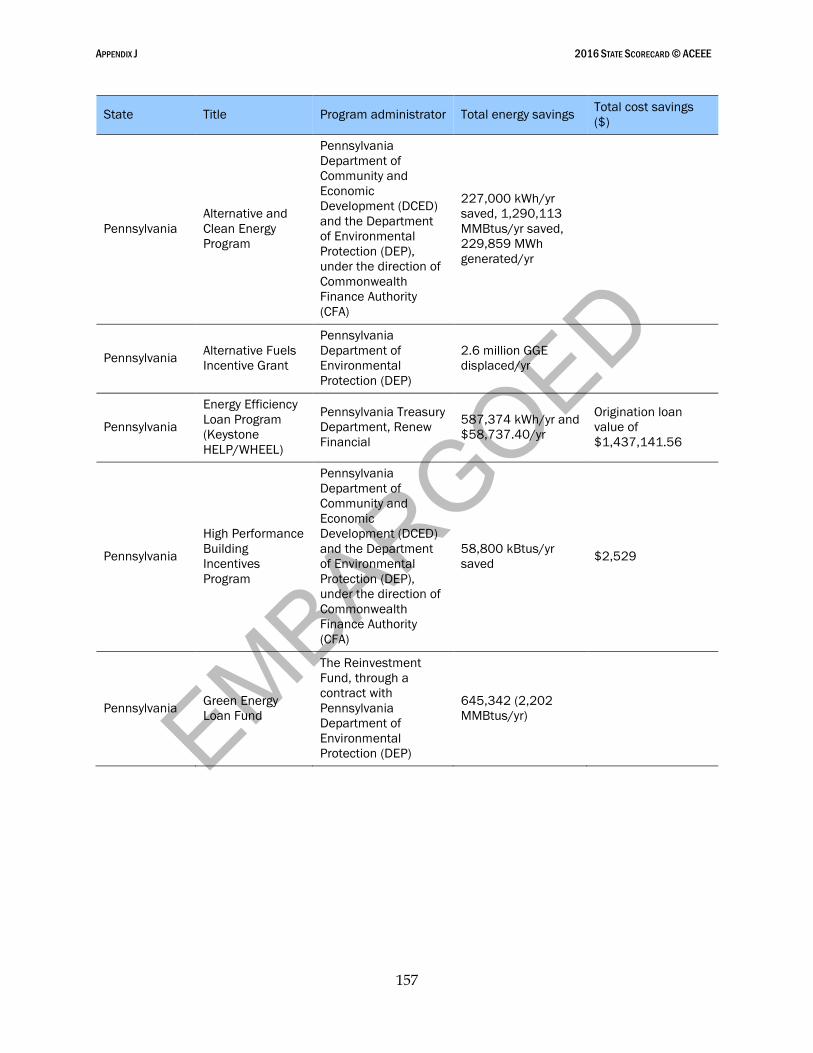
EMBARGOED
APPENDIX J 2016 STATE SCORECARD © ACEEE
157
State Title Program administrator Total energy savings Total cost savings
($)
Pennsylvania
Alternative and
Clean Energy
Program
Pennsylvania
Department of
Community and
Economic
Development (DCED)
and the Department
of Environmental
Protection (DEP),
under the direction of
Commonwealth
Finance Authority
(CFA)
227,000 kWh/yr
saved, 1,290,113
MMBtus/yr saved,
229,859 MWh
generated/yr
Pennsylvania Alternative Fuels
Incentive Grant
Pennsylvania
Department of
Environmental
Protection (DEP)
2.6 million GGE
displaced/yr
Pennsylvania
Energy Efficiency
Loan Program
(Keystone
HELP/WHEEL)
Pennsylvania Treasury
Department, Renew
Financial
587,374 kWh/yr and
$58,737.40/yr
Origination loan
value of
$1,437,141.56
Pennsylvania
High Performance
Building
Incentives
Program
Pennsylvania
Department of
Community and
Economic
Development (DCED)
and the Department
of Environmental
Protection (DEP),
under the direction of
Commonwealth
Finance Authority
(CFA)
58,800 kBtus/yr
saved $2,529
Pennsylvania Green Energy
Loan Fund
The Reinvestment
Fund, through a
contract with
Pennsylvania
Department of
Environmental
Protection (DEP)
645,342 (2,202
MMBtus/yr)
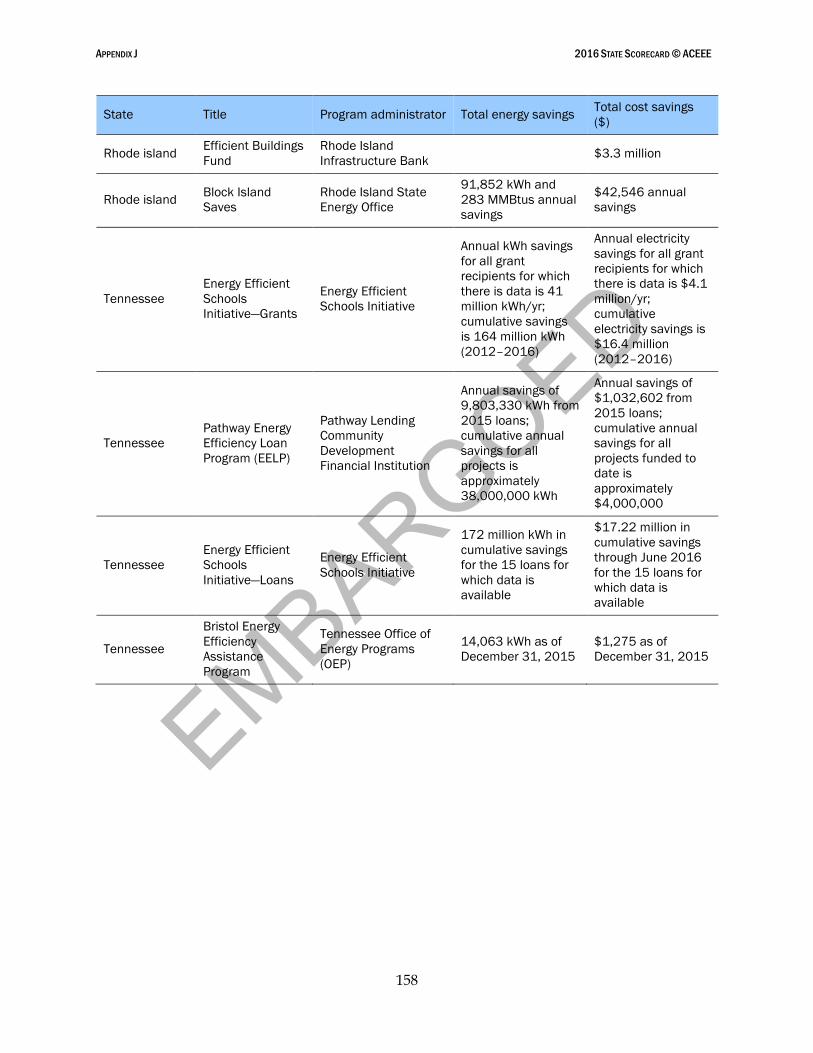
EMBARGOED
APPENDIX J 2016 STATE SCORECARD © ACEEE
158
State Title Program administrator Total energy savings Total cost savings
($)
Rhode island Efficient Buildings
Fund
Rhode Island
Infrastructure Bank $3.3 million
Rhode island Block Island
Saves
Rhode Island State
Energy Office
91,852 kWh and
283 MMBtus annual
savings
$42,546 annual
savings
Tennessee
Energy Efficient
Schools
Initiative—Grants
Energy Efficient
Schools Initiative
Annual kWh savings
for all grant
recipients for which
there is data is 41
million kWh/yr;
cumulative savings
is 164 million kWh
(2012–2016)
Annual electricity
savings for all grant
recipients for which
there is data is $4.1
million/yr;
cumulative
electricity savings is
$16.4 million
(2012–2016)
Tennessee
Pathway Energy
Efficiency Loan
Program (EELP)
Pathway Lending
Community
Development
Financial Institution
Annual savings of
9,803,330 kWh from
2015 loans;
cumulative annual
savings for all
projects is
approximately
38,000,000 kWh
Annual savings of
$1,032,602 from
2015 loans;
cumulative annual
savings for all
projects funded to
date is
approximately
$4,000,000
Tennessee
Energy Efficient
Schools
Initiative—Loans
Energy Efficient
Schools Initiative
172 million kWh in
cumulative savings
for the 15 loans for
which data is
available
$17.22 million in
cumulative savings
through June 2016
for the 15 loans for
which data is
available
Tennessee
Bristol Energy
Efficiency
Assistance
Program
Tennessee Office of
Energy Programs
(OEP)
14,063 kWh as of
December 31, 2015
$1,275 as of
December 31, 2015
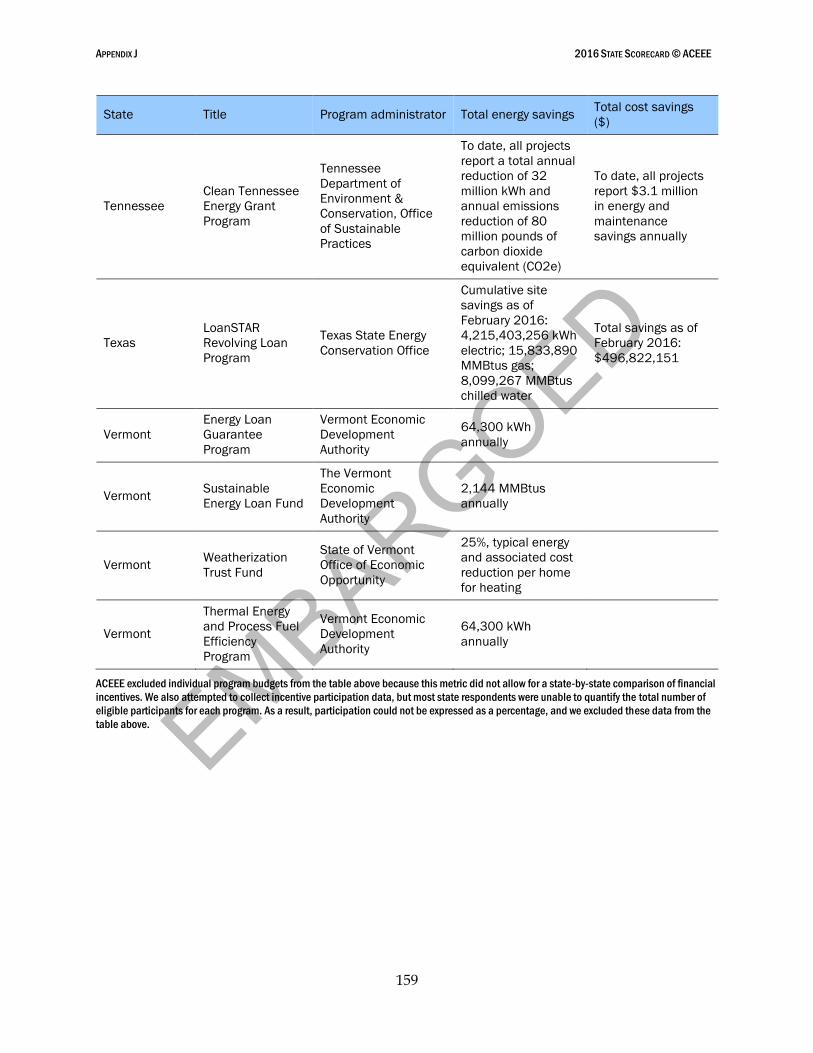
EMBARGOED
APPENDIX J 2016 STATE SCORECARD © ACEEE
159
State Title Program administrator Total energy savings Total cost savings
($)
Tennessee
Clean Tennessee
Energy Grant
Program
Tennessee
Department of
Environment &
Conservation, Office
of Sustainable
Practices
To date, all projects
report a total annual
reduction of 32
million kWh and
annual emissions
reduction of 80
million pounds of
carbon dioxide
equivalent (CO2e)
To date, all projects
report $3.1 million
in energy and
maintenance
savings annually
Texas
LoanSTAR
Revolving Loan
Program
Texas State Energy
Conservation Office
Cumulative site
savings as of
February 2016:
4,215,403,256 kWh
electric; 15,833,890
MMBtus gas;
8,099,267 MMBtus
chilled water
Total savings as of
February 2016:
$496,822,151
Vermont
Energy Loan
Guarantee
Program
Vermont Economic
Development
Authority
64,300 kWh
annually
Vermont Sustainable
Energy Loan Fund
The Vermont
Economic
Development
Authority
2,144 MMBtus
annually
Vermont Weatherization
Trust Fund
State of Vermont
Office of Economic
Opportunity
25%, typical energy
and associated cost
reduction per home
for heating
Vermont
Thermal Energy
and Process Fuel
Efficiency
Program
Vermont Economic
Development
Authority
64,300 kWh
annually
ACEEE excluded individual program budgets from the table above because this metric did not allow for a state-by-state comparison of financial
incentives. We also attempted to collect incentive participation data, but most state respondents were unable to quantify the total number of
eligible participants for each program. As a result, participation could not be expressed as a percentage, and we excluded these data from the
table above.


