
MIIMJI4IUI 4i|WHIK "'- "-^f^« ;;Vl?WTT^:fl
U.S. DEPARTMENT OF COMMERCE National Technical Information Service
AD-A029 450
The Analysis of Dominance Matrices:
Extraction of Unidimensional Orders
within a Multidimensional Context
University of Southern California
June 1976

UNIVERSITY OF SOUTHERN CALIFORNIA
UNIVERSITY PARK
LOS ANGELES. C/LIFORNIA B0O07
DEPARTMENT OF PSYCHOLOGY
August 25, 1976
Dear Colleague,
This office recently senc you our third Technical Report entitled, "The Analysis of Dominance Matrices: Extraction of Unidimensional Orders Within a Multidi- mensional Context," by Thomas J. Reynolds.
We ask that you make a correction on page 37, Line 16 of that page should read, "value from 0 to 1,..."
Thank You,
Norman Cliff
nofpasm QJJL4VWJ./ jyitouAj ■h&k.OAUL, asujl
/^« /50-373
257130
©:
O
THE ANALYSIS OF DOMINANCE MATRICES: EXTRACTION
OF UNIDIMENSIONAL ORDERS WITHIN
A MULTIDIMENSIONAL CONTEXT
Thomas J. Reynolds
Technical Report No. 3
Department of Psychology University of Southern California
Los Angeles, California 90007
June, 19' S
D O C
8 M*
Prepared under contract No. N00014-75-C-0684 NR No. 150-373, with the Personnel and
Training Research Programs, Psychological Sciences Division
Reproduction in whole or in part is permitted for any purpose of the United States Government.
Approved for public release; distrubtion unlimited
KPROOUCf D BY , NATIONAL TECHNICAL > ! INFORMATION SERVICE •
U. ». DEPARTMENT OF COMMERCE I SPRINWIELD, VA. 21<(l
Unclassified SECURITY CLASSIFICATION OF THIS PAGE (Pnan Data Eni.red;
REPORT DOCUMENTATION PAGE READ INS1 RUCTIONS BEFORE COM"LETING FORM
I. REPORT NUMBER " ~
Technical Sarau Ho. 3
2. GOVT ACCESSION NO 3. RECIPIENT'S CATALOG NUMBER
4 TITLE (and Subtitle)
THE ANALYSIS OF DOMINANCE MATRICES: EXTRACTION OF UNIDIMENSIONAL ORDERS WITHIN A MULTIDIMENSIONAL CONTEXT
S. TYPE OF REPORT ft PERIOD COVERED
Technical « PERFORMING ORG. REPORT NUMBER
7. AUTHORS
Thomas J. Reynolds
I. CONTRACT OR GRANT NUMBERS
N00014-75-C-0684
t. PERFORMING ORGANIZATION NAME AND AOORESS
Department of Psychology University of Southern California Loa Angeles. California 90007
10. PROGRAM ELEMENT. PROJECT. TASK AREA ft WORK UNIT NUMBERS
61153N, RR042-04, RR042-04-01, NR 150-373
It. CONTROLLING OFFICE NAME AND AODRESS
Personnel and Training Research Programs Office of Naval Research (Code 458)
, ArUngfnn. Virginia ???T7 It MONITORING AGENCY NAME ft AOORESSf" dlffa/anl freai Controlling Olllc»)
12. REPORT DATE
June 1976 IS. NUMBER OF PAGES
3* r) IS. SECURITY CLASS, (ol fhla nport)
Unclassified IS«. DECLASSIFICATION/DOWNGRADING
SCNEDULE
I«. DISTRIBUTION STATEMENT (ol thla ftaportj
Approved for public release; distribution unlimited
17. DISTRIBUTION STATEMENT (ol Ilia abafracl antarad In Block 20, II dllfaranf horn ftaporfj
I» SUPPLEMENTARY NOTES
It. KEY WORDS (Contlnuw on ravaraa «Ida II nacaaaary and Idtnillr by block nueibar;
(U) Factor Analysis; (U) Multidimensional Scaling; (U) Test Theory; (U) Item Dominance Relations; (U) Social Distance Scale; (U) Binary Matrix
20 ABSTRACT 'Conflnua an ravaraa »Id» II n»e»»»mrr and Identity by block nuaibar)
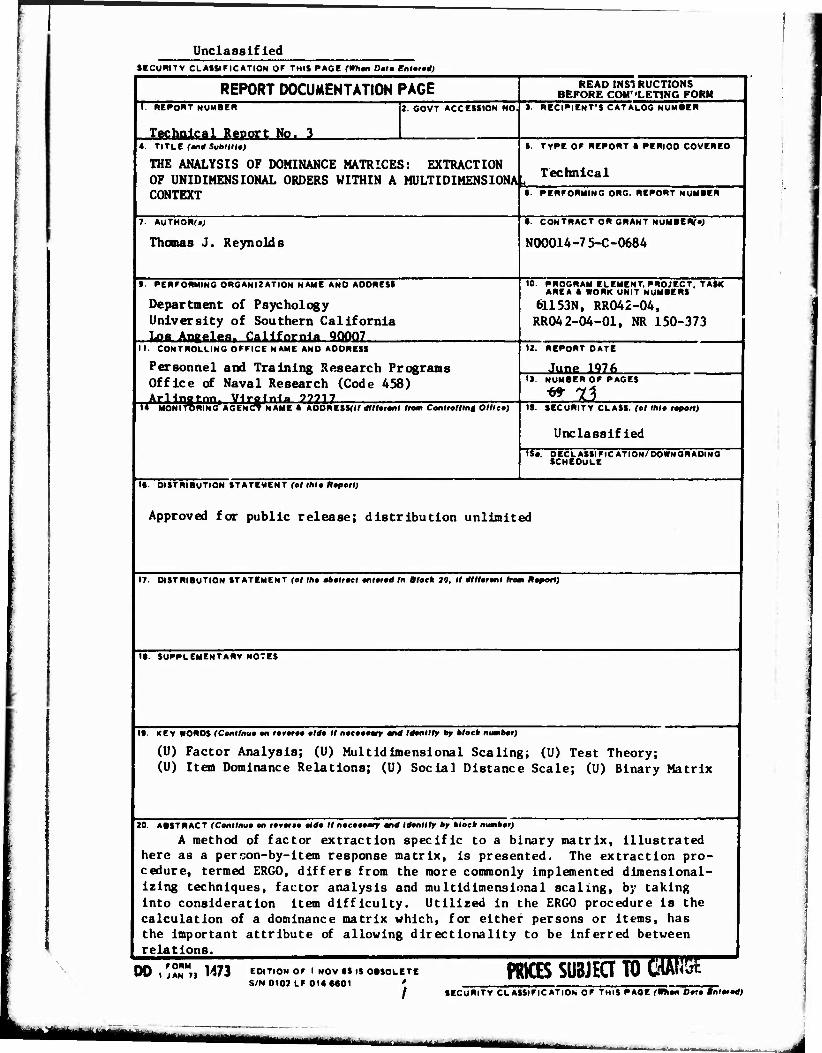
A method of factor extraction specific to a binary matrix, illustrated here as a per son-by-it em response matrix, is presented. The extraction pro- cedure, termed ERGO, differs from the more commonly implemented dimensional- izlng techniques, factor analysis and multidimensional scaling, by taking into consideration item difficulty. Utilized in the ERGO procedure is the calculation of a dominance matrix which, for either persons or items, has the important attribute of allowing directionality to be inferred between relations.
PRKKSU8JEqTOC'«A«5f:~ SECURITY CLASSIFICATION OF THIS PAOt (Whin Data Ifiiared)
DO,: Tn W3 EDITION OF I NOV •• IS OBSOLETE S/N 0102 LF 014 6601 '
■■III
KCUHITV CLASSIFICATION OF THIS P AGEflWi«! Dt» Enfnd)
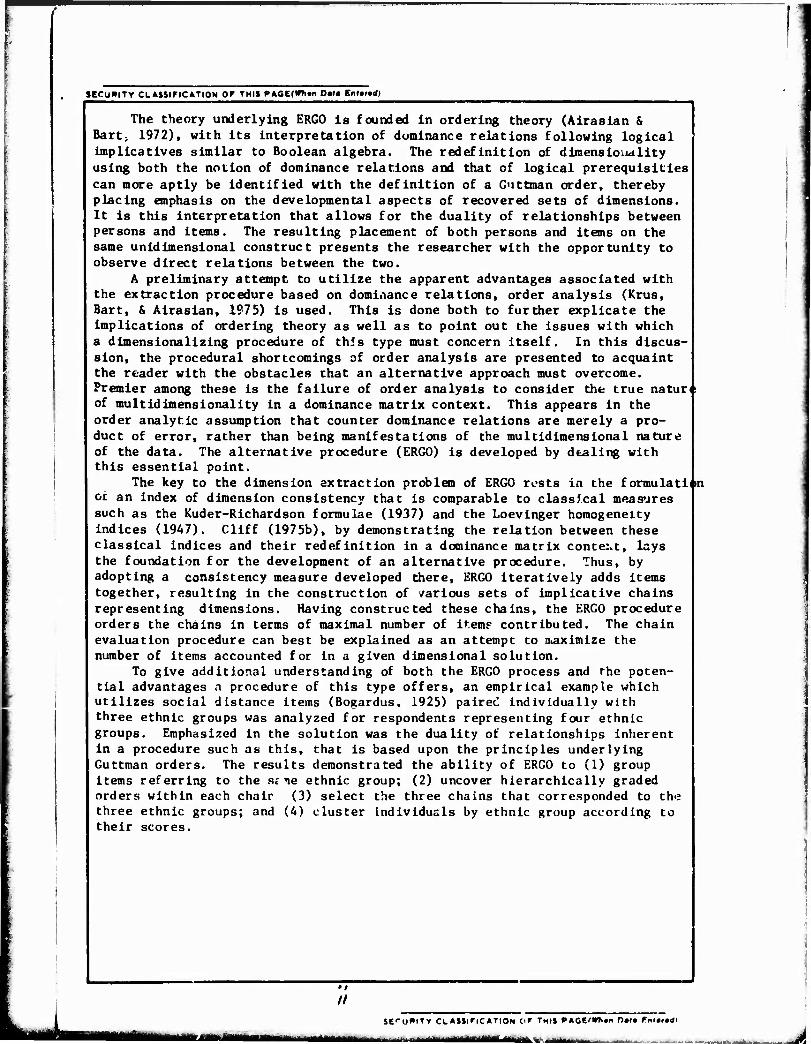
The theory underlying ERGO is founded in ordering theory (Airasian & Bart; 1972), with its interpretation of dominance relations following logical implicatives similar to Boolean algebra. The redefinition of dimensionality using both the notion of dominance relations and that of logical prerequisites can more aptly be identified with the definition of a Guttman order, thereby placing emphasis on the developmental aspects of recovered sets of dimensions. It is this interpretation that allows for the duality of relationships between persons and items. The resulting placement of both persons and items on the same unidimensional construct presents the researcher with the opportunity to observe direct relations between the two.
A preliminary attempt to utilize the apparent advantages associated with the extraction procedure based on domi.iance relations, order analysis (Krus, Bart, & Airasian, 1975) is used. This is done both to further explicate the implications of ordering theory as well as to point out the issues with which a dimensionalizing procedure of this type must concern itself. In this discus- sion, the procedural shortcomings of order analysis are presented to acquaint the reader with the obstacles that an alternative approach must overcome. Premier among these is the failure of order analysis to consider the true natun: of multidlmensionality in a dominance matrix context. This appears in the order analytic assumption that counter dominance relations are merely a pro- duct of error, rather than being manifestations of the multidimensional nature of the data. The alternative procedure (ERGO) is developed by dealing with this essential point.
The key to the dimension extraction problem of ERGO rests in the formulation or an index of dimension consistency that is comparable to classical measures such as the Kuder-Richardson formulae (1937) and the Loevinger homogeneity indices (1947). Cliff (1975b), by demonstrating the relation between these classical indices and their redefinition in a dominance matrix context, lays the foundation for the development of an alternative procedure. Thus, by adopting a consistency measure developed there, ERGO iteratively adds items together, resulting in the construction of various sets of implicative chains representing dimensions. Having constructed these chains, the ERGO procedure orders the chains in terms of maximal number of item? contributed. The chain evaluation procedure can best be explained as an attempt to maximize the number of items accounted for in a given dimensional solution.
To give additional understanding of both the ERGO process and the poten- tial advantages a procedure of this type offers, an empirical example which utilizes social distance items (Bogardus, 1925) pairec individually with three ethnic groups was analyzed for respondents representing four ethnic groups. Emphasized in the solution was the duality of relationships inherent in a procedure such as this, that is based upon the principles underlying Guttman orders. The results demonstrated the ability of ERGO to (1) group items referring to the s£ne ethnic group; (2) uncover hierarchically graded orders within each chair (3) select the three chains that corresponded to the three ethnic groups; and (4) cluster individuals by ethnic group according to their scores.
i
M^M» „«M^Ml
SE<"U«lTY CLASSIFICATION C>F THIS PAOC^IW>»n f>»(» Fnffd\
•■HaMalluaiBAMAi/,.
MtmiM*
INTRODUCTION
■'« noiMNi tf ,w M ttcto □ MMsomen a juiffiurio«
ir iBWIWIOMMIlttlWT COOB
?k<: _ . **ä; ami :«tf(ä«r
1^
£ The extraction of factors or dimensions from a data matrix has
preoccupied many a psychometrician, and methods developed to accom-
plish this task have taken many forms. From their fundamental begin-
nings in factor analytic theory (Spearman, 1904) to the more recent
multidimensional scaling procedures (MDS) (Shepard, 1962), to the most
recent, ordering theory (Airasian & Bart, 1972), all methods have the
common concern of the identification of unidlmensional structures
within a postulated multidimensional context. To date, more tradi-
tional methods of factor analysis and multidimensional scaling have
fallen short in attacking the dimensionality problem specific to the
binary matrix (Horst, 1965)« Isolating unidlmensional hierarchies
within a binary structure has recently undergone revision based upon a
unique theoretical conceptualization known as order analysis (Krus,
Bart, & Airasian, 1975)•
Instead of creating "artificial" measures of association, e.g.,
a common correlation coefficient or distance measures, order analysis
utilizes a logic model. It attempts to isolate the logical orders
among variables, and thus produces unidimensional components commonly
known as Guttman scales (Guttman, 19^). Using the terminology of
Horst (19O) and Lazarsfeld (1958), order analysis can be described
»I III |il nil II II pupp I i I m " "" ' w-«v* -'-"" — —-' -''"»T^»« .T.-,^™,™^.. -: JUiiPifWilliilWi SB
/""
2
broadly as the process of isolating the underlying structures of latent
entities and attributes within a given response set.
Logical procedures for uncovering hierarchical graded orders
via the construction of unidimensional scales have both practical as
veil as theoretical significance. The controversial issue of examining
the biuary relations in a test item by person response matrix serves to
illustrate this problem. Though notably hampered by distributional
assumptions and also by the choice of an inter-item measure of associ-
ation, the use of classical factor analysis persists as the principal
type of dimensionalizing procedure. Far more serious than the above
mentioned drawbacks, however, :.s the failure of the factor analytic
procedures to take into account the difficulty order of the items.
Because of the fundamental role of item difficulty la test theory,
this failure excludes factor analysis as a desired alternative, and
suggests the use of a dimensionalizing system that takes into account
the item difficulties. The present article suggests such a procedure,
based upon sound measurement principles underlying the Guttman simplex.
The value of relying on such a fundamental notion as Guttman-
type scales offers another, and potentially even more significant,
advantage. Instead of regarding items, particularly attltudinal
items, in a non-theoretical ranner as would be the case with factor
analysis, the possibility of inferring a qualitative structure among
variables is appealing. This possibility, stemming from the develop-
mental notion upon which Guttman scales rely, differs from the com-
pensatory theory of behavior upon which factor analysis necessarily

3
rests. Thus, Guttman-type scales allow for the consideration of
various logic models of behavior, i.e., those of a conjunctive or dis-
junctive nature (Levy., 1973)« Logic models such as these allow for
the identification of the developmental prerequisites to attitudes,
and, at the same time, allow for different developmental orders.
Recently, the development of a dimensionalizing system that
works with the logical relationship of a Guttman simplex—ordering
theory—has been proposed (Krus, Bart, & Airasian, 1975). Its
acceptance, however, has been forestalled by a number of procedural
shortcomings. Foremost among these is the failure to develop consist-
ency indices which relate to other more common consistency descrip-
tlves, such as the familiar Kuder-Richardson formulae (1937) aad the
Loevinger homogeneity indices (19^7)« A solution to this problem has
been formalized by Cliff (1975b) in the development of a scries of
measures constructed from the item-by-item dominance matrices. Impor-
tantly, these measures of consistency constructed from dominance
matrices parallel their counterpart in classical test theory. The
application of these consistency measures offers an alternative
methodology, based on sound measurement principles, for the identifi-
cation of unidimensional structure within an item-person context. In
the present study, a new factor extraction method founded in the lo?ic
of ordering theory while also incorporating Cliff's (1975b) consist-
ency indices will be presented. An empirical example using Guttman-
like social distance attitude itoms will be examined in an attempt to
evaluate how well the model performs.
Elements of Ordering Theory
Simple Orders
The construction of isomorphic number systems is the central
issue of any structured psychologica1 research. An isomorphism refers
to a similarity in pattern, viz., a situation where a one-to-one
relationship exists between an object and its numerical representa-
tion. To illustrate, consider ^he relationciiips among real numbers
which are actually meant to be representative of the interrelations
among a set of items or objects. One foundation of this real number
system is that it can be linearly ordered. Thus, the following three
properties may be said to be the axioms upon which this order/.ng i3
dependent (Coombs, Dawes, 8c Tvcrsky, 1970, pp. 366-568).
asymmetric property - aRb implies bBa where R means not i"
transitive property - aRb and bRc implies aRc
connected property - either aRb or bRa
These axioms hold wh re R indicates the logical relationship typified
by "greater than," and a, b, and c are entities in the system.
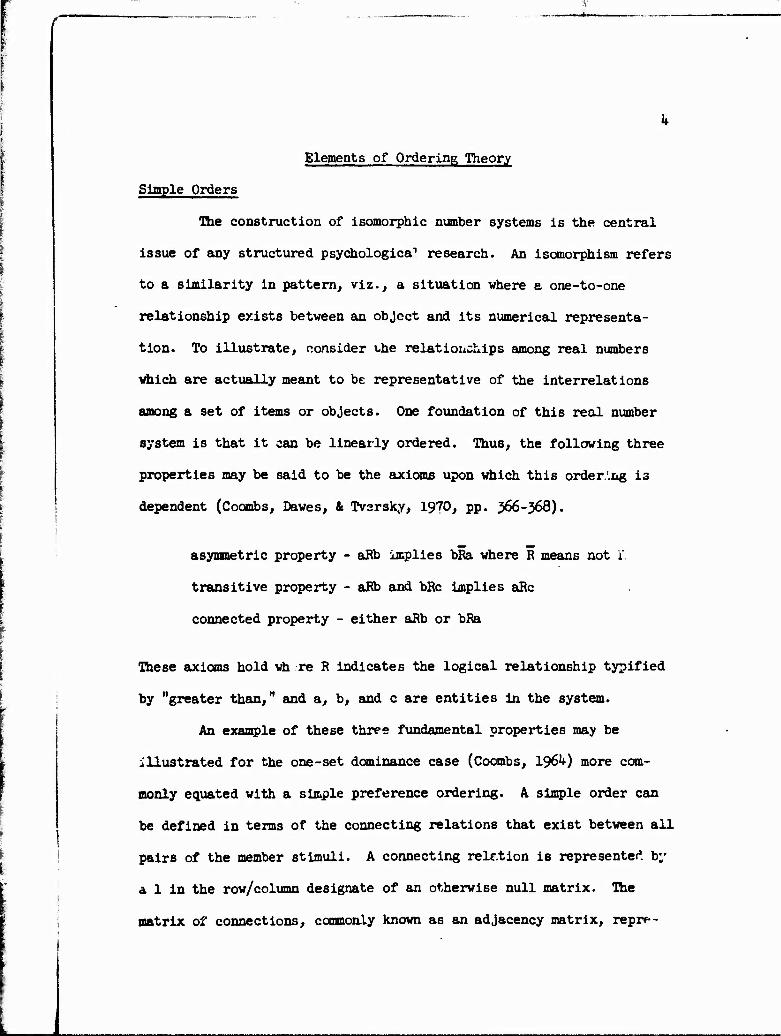
An example of these three fundamental properties may be
illustrated for the one-set dominance case (Coombs, 196*0 more com-
monly equated with a simple preference ordering. A simple order can
be defined in terms of the connecting relations that exist between all
pairs of the member stimuli. A connecting relation is representer1. by
a 1 in the row/column designate of an otherwise null matrix. The
matrix of connections, commonly known as an adjacency matrix, repre-

5
sents a digraph (directed graph) where the arcs or connections between
the vertices or stimuli are represented in the form of a binary score
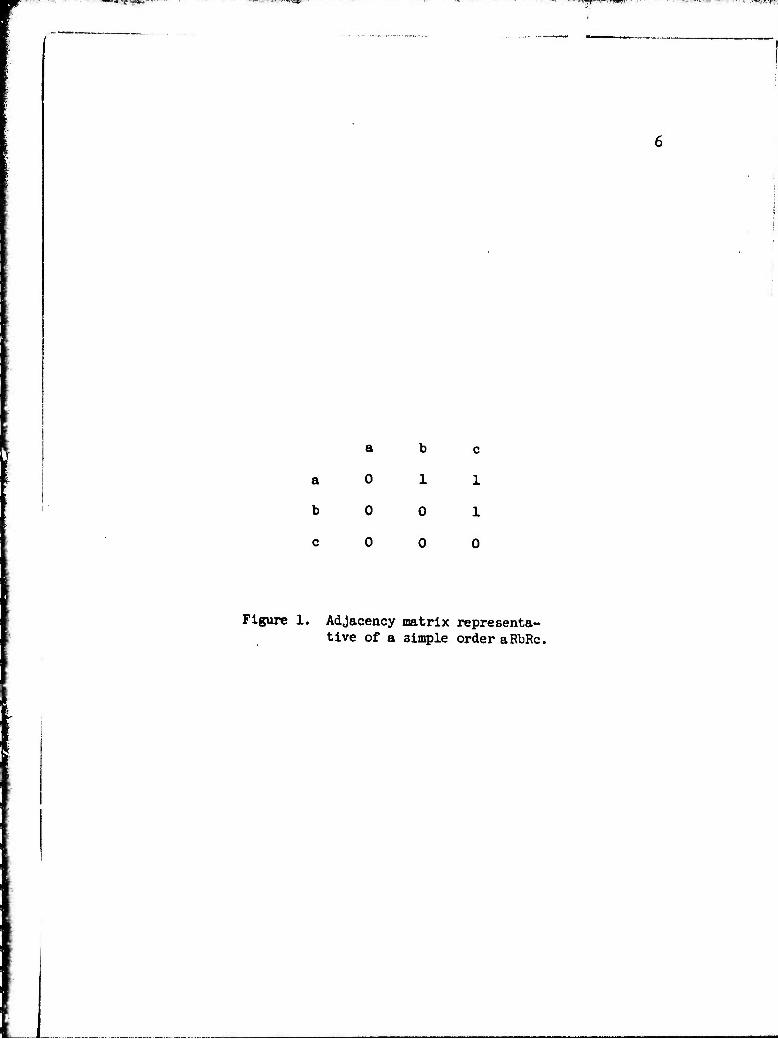
matrix (Harary, Norman, & Cartwright. 1965). The adjacency matrix in
Figure 1 represents a simple ordering between three items. In the
preference context, the connective 1 implies that the row stimulus is
preferred to the column stimulus. The property of asymmetry is shown
by the absence of symmetric l's. And, the lack of any logical contra-
dictions, such as aRb, bRc, or cBa, necessarily suggests transivity.
Thus a dimple order, aRbRc, can be said to exist.
As these essential axioms are the foundation for defining a
simple order for members of the same set, so also do they hold for
relations between two different sets. The two-set dominance classi-
fication (Coombs, 196V), in this case, refers to a set of items and a
set of persons. The persons by items matrix seen in Figure 2 can be
seen to yield a slcple difficulty ordering for items as well as an
ability ordering for persons. This dual relationship is the basic
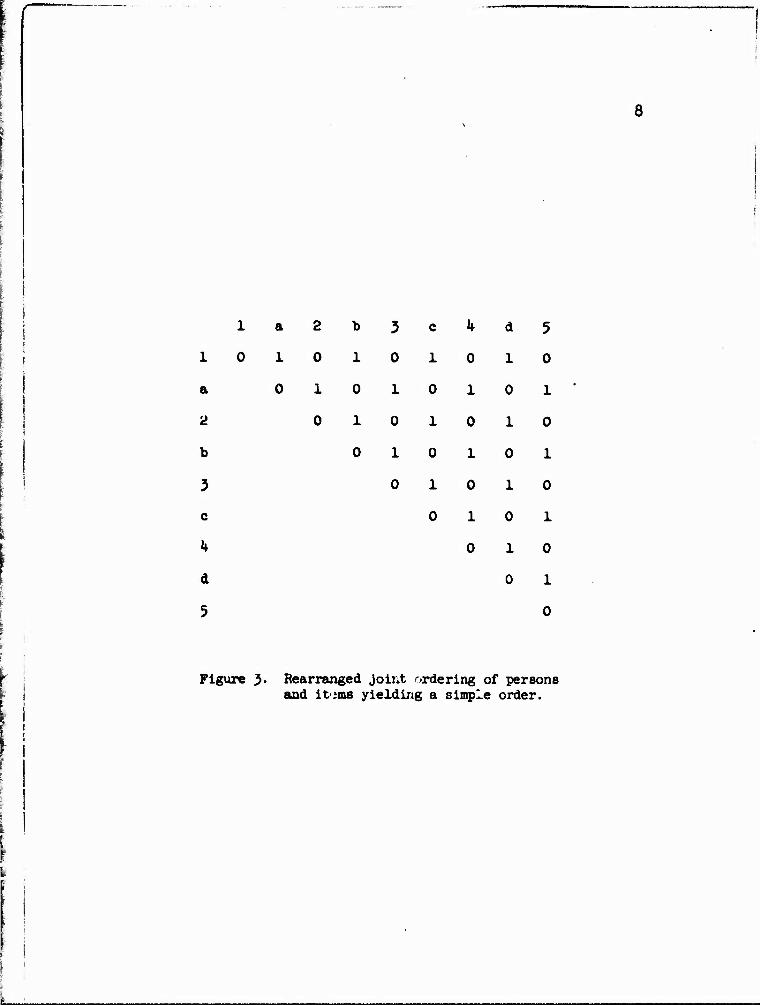
concept underlying Outtman scales, which is represented by Figure 2, a
perfect Outtman scale or simplex. Not only does there exist an item
difficulty and person ability ordering, but a Joint person-item order,
as discussed by Cliff (1975a), can also be constructed as seen in
Figure 3. This Joint ordering can also be considered a simple order,
thus operating under the same axioms.
As noted, these fundamental properties of relations between
real numbers and the objects they represent (be they items, persons,
or a combination of both) give rise to defined orders. These proper-
a
b
c
I
a
0
0
0
b
1
0
0
c
1
1
0
Figure 1. Adjacency matrix representa- tive of a simple order aRbRc.

Items
a b c d
l 1 1 1 1
s 0
2 0 1 1 1
a n 3 0 0 1 1
A It 0 0 0 1
5 0 0 0 0
Figure 2. Persons by items response matrix repre- senting a perfect Guttman simplex.
8
1 a 2 b 3 c k d 5
1 0 1 0 1 0 1 0 1 0
a 0 1 0 l 0 1 0 l
2 0 1 0 1 0 1 0
b 0 1 0 1 0 1
3 0 1 0 1 0
c 0 1 0 1
k 0 1 0
d 0 1
5 0
Figure J. Rearranged joint ordering of persons and itims yielding a simple order.
9
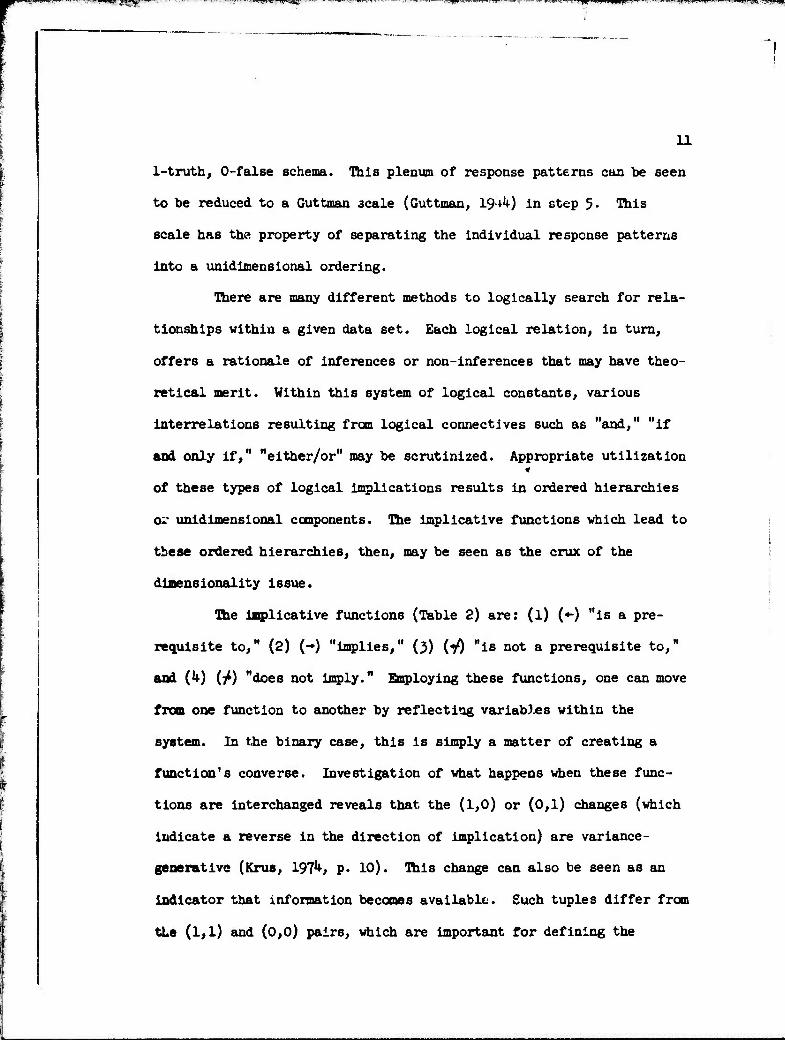
ties, known as order relations, provide the basic Justification for the
matrix man pulative procedures developed below that attempt to utilize
logic structures as a solution to the dimensionality problem.
Logic Structures
Syllogistic reasoning, as originally formulated by Aristotle,
demonstrates the use of simple logic and its cognitive counterpart,
the reflection of thought processes. The most basic of the traditional
syllogisms is the conjunction of lmplicative relations, i.e., as
A-»BariB-»C then ••• . This lmplicative chaining present in
syllogistic reasoning can also be considered as the development of a
straight-line dimensional relationship congruent with the notion of
simple order. An order, created by lmplicative relations, can be
defined as a condition of logical arrangement among cerain specifi-
cally related elements in a given set of items.
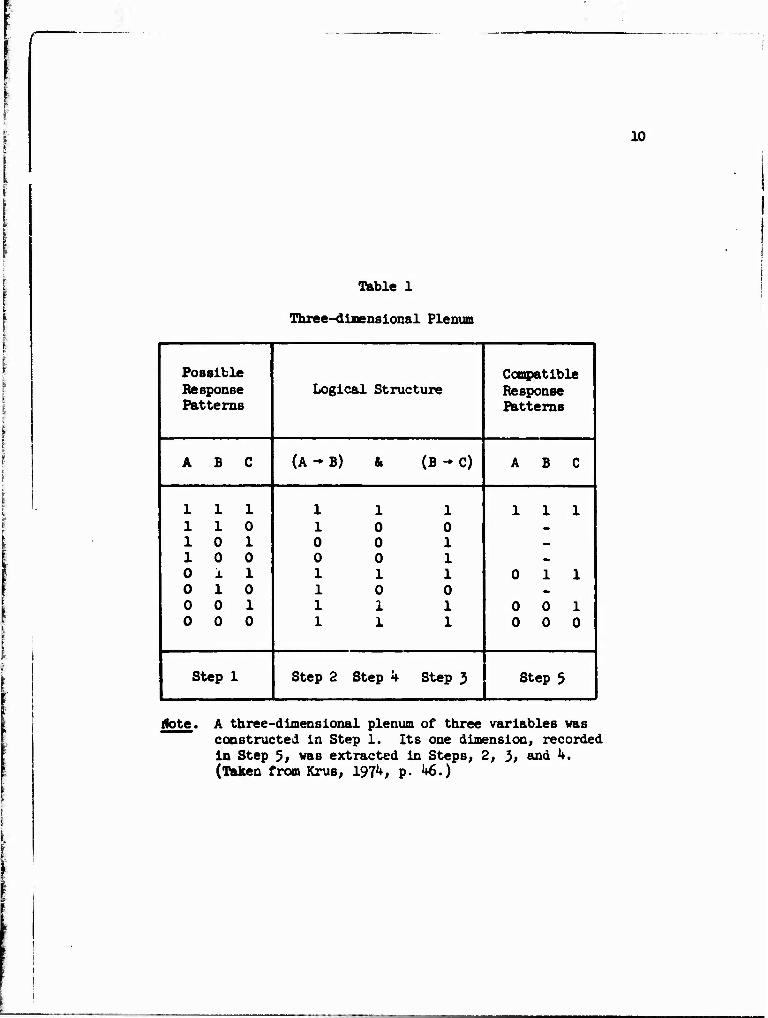
For small sets of elements, say, a, b, c, it is possible to
analyze the relationships between all possible response patterns (a
plenum), which can be separated into individual response patterns
(see Table 1).
Table 1 was arranged upon considering all possible response
patterns of values for each of the three elements, a, b, and c, as
seen in step 1. Steps 2 and 3 are essentially using a syllogistic
notation noting if the implication exists, "1," or doesn't exist, "0."
In step k, the conjunctive logic function, representing the logical
truth of the Joining of steps 2 and 3, is again indicated by a
10
Table 1
Three-dimensional Plenum
Possible Response Patterns
Logical Structure Compatible Response Patterns
ABC (A - B) & (B - C) ABC
111 110 10 1 10 0 Oil 0 10 0 0 1 0 0 0
111 10 0 0 0 1 0 0 1 111 10 0 111 111
111
Oil
0 0 1 0 0 0
Step 1 Step 2 Step k Step 3 Step 5
gate. A three-dimensional plenum of three variables was constructed in Step 1. Its one dimension, recorded in Step 5; ves extracted in Steps, 2, }, and k. (Taken from Krus, 197*+, p. U6.)
r7f-V"^~^- ■ ""^r-V-!*. ¥■'*-!.(.< I
11
1-truth, O-false schema. This plenum of response patterns can be seen
to be reduced to a Guttman 3cale (Guttman, 19*^) in step 5« This
scale has the property of separating the individual response patterns
into a unidimensional ordering.
There are many different methods to logically search for rela-
tionships within a given data set. Each logical relation, in turn,
offers a rationale of inferences or non-inferences that may have theo-
retical merit. Within this system of logical constants, various
interrelations resulting from logical connectives such as "and," "if
and only if," "either/or" may be scrutinized. Appropriate utilization «
of these types of logical implications results in ordered hierarchies
or unidimensional components. The implicative functions which lead to
these ordered hierarchies, then, may be seen as the crux of the
dimensionality issue.
The implicative functions (Table 2) are: (l) (*-) "is a pre-
requisite to," (2) (-) "implies," (j) (V) "is not a prerequisite to,"
aad CO (/) "does not imply." Employing these functions, one can move
from one function to another by reflecting variabJ.es within the
system. In the binary case, this is simply a matter of creating a
function's converse. Investigation of what happens when these func-
tions are interchanged reveals that the (1,0) or (0,1) changes (which
indicate a reverse in the direction of implication) are variance-
generative (Krus, 197*t; P- 10). This change can also be seen as an
indicator that information becomes available. Such tuples differ from
the (1,1) and (0,0) pairs, which are important for defining the

12
Table 2
Aliorelative Order-dependent Class of Fropositional Functions Used by Order Analysis to Logically Search for
Relationships within a Given Data Set
A B A -• 3 A - B A ^B A *B
1 1 1 1 0 0
1 0 0 1 1 0
0 1 1 0 0 1
0 0 1 1 0 0
a 0 c d e
Note. Column a—Plenum of response for the two arguments, A and B.
b—Implication
c—Converse of Implication
d—Negative Implication
e—Converse of Negative Implication

-*™j..i,uuin vitw ""* an nuwr" —«-»r-"»n^s«
13
vithin-order structure. While the (l,l) and (0,0) tuples determine
the order within the already determined structure, the variance-
generative tuples outline the structure of a dimension.
In the construction of such an iiaplicative logico-mathematical
system, variables are not differentially weighted. That is, no
attempt ic made to optimize or focus upon any one set of relationships.
In such cases, the most appropriate logic functions are those of nega-
tive implication and its converse. The reason for this is that they
differ only in their (1,0) and (0,1) tuples (as seen in Table 2). The
(1,0) tuple refers to a confirmatory response pattern, and the (0,1)
tuple to a disconfirmatory response pattern. These patterns of con-
firmatory and disconfirmatory response tuples have the essential
property of structuring a particular domain of response patterns in a
logical manner.
As shown by Krus (197*0 and Cliff (1975b), the frequencies of
negative implication and its converse, computed from the elements of
a binary data matrix, may be used to derive a dominance matrix.
Involved in the creation of the dominance matrix is the comparison of
all possible row/column tuples. The result of all these comparisons
is a dominance matrix with integer values in its row/column desig-
nates. These designates represent the frequency of domination of a
particular row over a particular column. This comparison of all
possible tuples—yielding a dominance matrix of frequencies—is
identical to the process of matrix m iltiplication. However, to
properly compare the appropriate (1,0) and (0,1) types, the matrix

-^.^ry-re i_jgupygHfwegHPff"**1"^^ **?'--«"" ■-'p^~"~~"!~■ »"■--" rt^gminCT^pywwwTOwipw i jip..,^JtpimyBPP..;i»i> ■ wya ,^jw.v^i|»P^9SfjpvfjjjM||p
1U
multiplication is performed on the transposed original data matrix and
its logical negation or converse. Ike dominance matrix produced from
tbis procedure is similar to a correla ion or proximity matrix, in the
same manner expressed by Coombs (1964). rhese two types of matrices,
however, differ in one important respect—the preservation of direc-
tionality.
The value of obtaining a matrix of dominance type, rather than
one proximal in nature, centers around the fact that a dominance
matrix allows for the preservation of directionality between its ele-
ments while the proximity matrix does not. The importance of this
distinction relies upon the fact that causal relations cannot be
appropriately inferred from a correlative or proximity type solution.
Because of the preservation of the directionality in dominance rela-
tions, however, the possibility of causal inferences associated with
the developmental aspects of Guttman scales becomes a reality.
Difference Relations
übe matrix of magnitudes generated from the multiplication of
the transposed data matrix times its complement may be considered a
dominance summary across all elements in the original data matrix.
The magnitude in a given cell of the dominance matrix corresponds to
the number of times an element dominates some other element. Concep-
tually, this magnitude can be thought of as the total number of (1,0)
relations existing between the two vectors. Those (1,0) changes may
also be thought of as the variance between any row vectors. This
. nptppm^niJ *■ ,JI-^"*^LI «#A^.*^^iiH^wn*/** inp^pmif^j t.i'PLij'i;ii.i"wiin|i vJ!-»liiu-Lf»ii''■ "in.««»;.- ÜJPfPS
15
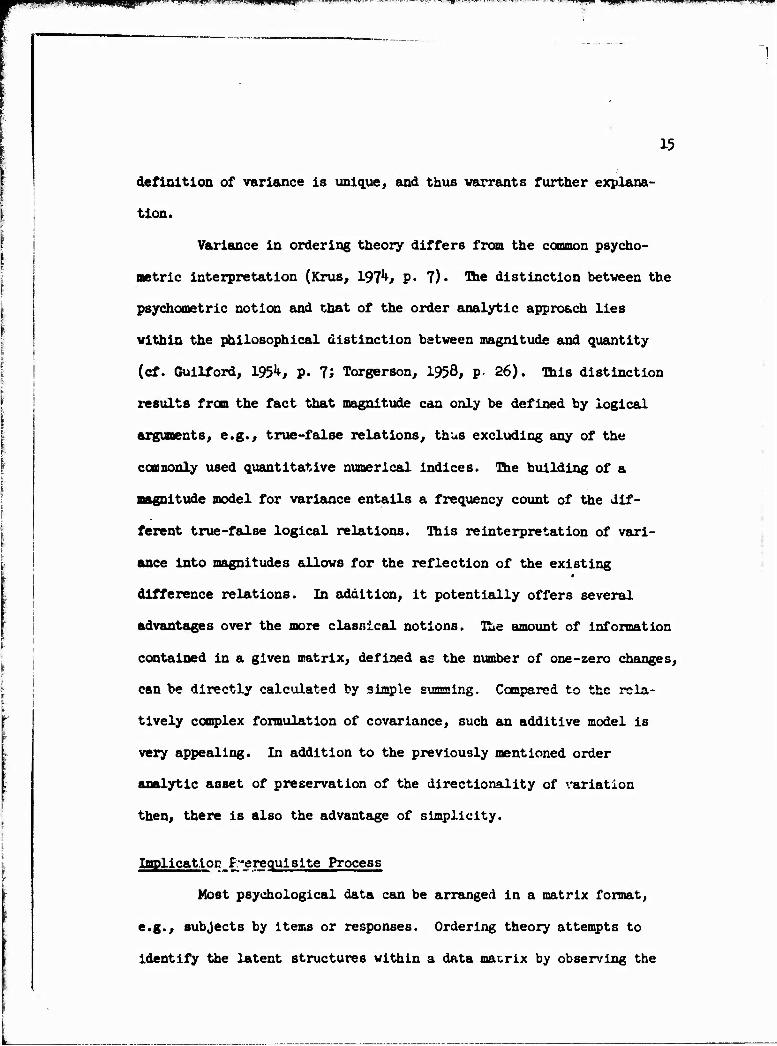
definition of variance is unique, and thus warrants further explana-
tion.
Variance in ordering theory differs from the common psycho-
metric interpretation (Krus, ±97h, p. 7). The distinction between the
psychometric notion and that of the order analytic approach lies
within the philosophical distinction between magnitude and quantity
(cf. Gullford, 1951*, P- 7i Torgerson, 1958, p- 26). This distinction
results from the fact that magnitude can only be defined by logical
arguments, e.g., true-false relations, thus excluding any of the
conmonly used quantitative numerical indices. The building of a
magnitude model for variance entails a frequency count of the dif-
ferent true-false logical relations. This reinterpretation of vari-
ance into magnitudes allows for the reflection of the existing
difference relations. In addition, it potentially offers several
advantages over the more classical notions. The amount of information
contained in a given matrix, defined as the number of one-zero changes,
can be directly calculated by simple summing. Compared to the rela-
tively complex formulation of covariance, such an additive model is
very appealing. In addition to the previously mentioned order
analytic asset of preservation of the directionality of variation
then, there is also the advantage of simplicity.
Implication f-erequislte Process
Most psychological data can be arranged in a matrix format,
e.g., subjects by items or responses. Ordering theory attempts to
identify the latent structures within a data matrix by observing the
I PL.«JHl*W*M|,||ili!l .'-■
16
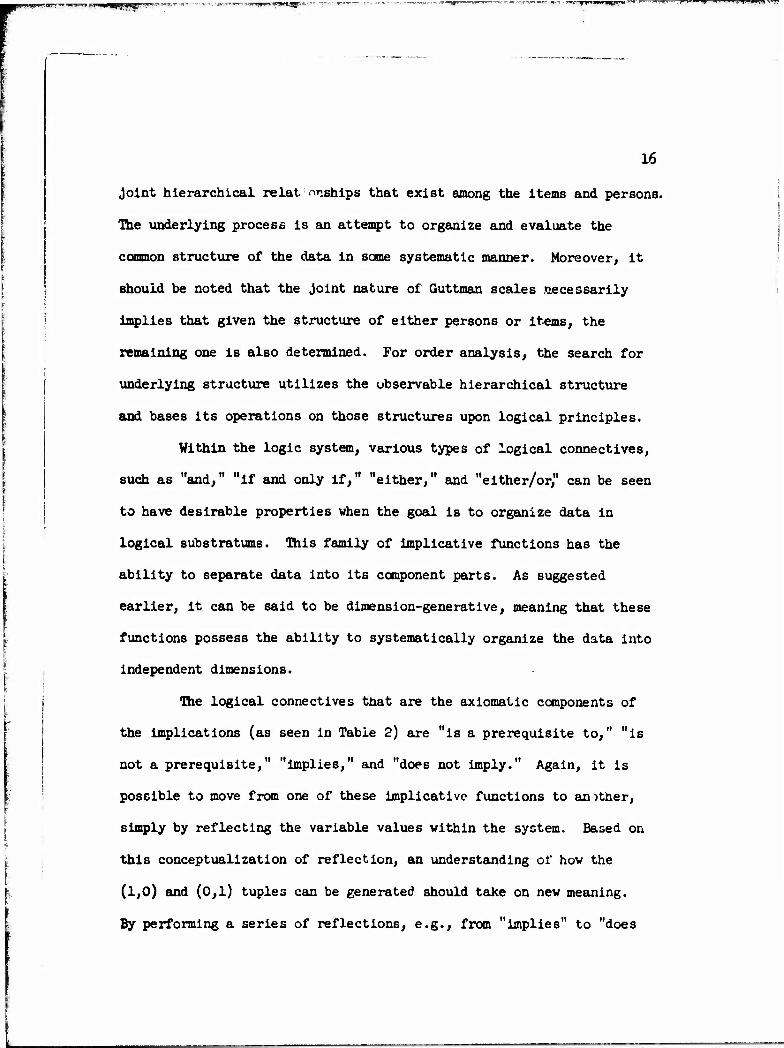
joint hierarchical relationships that exist among the items and persons.
The underlying process is an attempt to organize and evaluate the
common structure of the data in some systematic manner. Moreover, it
should be noted that the joint nature of Guttman scales necessarily
implies that given the structure of either persons or items, the
remaining one is also determined. For order analysis, the search for
underlying structure utilizes the observable hierarchical structure
and bases its operations on those structures upon logical principles.
Within the logic system, various types of logical connectives,
such as "and," "if and only if," "either," and "either/or," can be seen
to have desirable properties when the goal is to organize data in
logical substratums. This family of implicative functions has the
ability to separate data into its component parts. As suggested
earlier, it can be said to be dimension-generative, meaning that these
functions possess the ability to systematically organize the data into
independent dimensions.
The logical connectives that are the axiomatic components of
the implications (as seen in Table 2) are "is a prerequisite to," "is
not a prerequisite," "implies," and "does not imply." Again, it is
possible to move from one of these implicative functions to an )ther,
simply by reflecting the variable values within the system. Based on
this conceptualization of reflection, an understanding of how the
(1,0) and (0,1) tuples can be generated, should take on new meaning.
By performing a series of reflections, e.g., from "implies" to "does
17
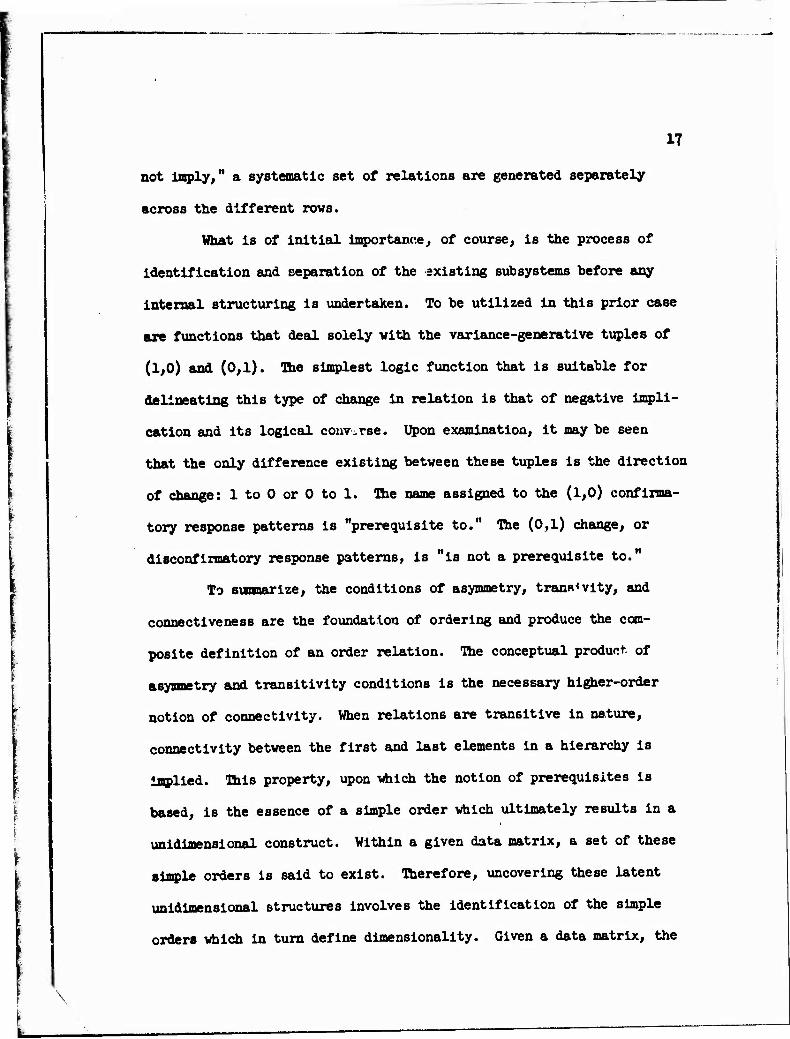
not imply," a systematic set of relations are generated separately
across the different rows.
What is of initial importance., of course, is the process of
identification and separation of the existing subsystems before any
internal structuring is undertaken. To be utilized in this prior case
are functions that deal solely with the variance-generative tuples of
(1,0) and (0,1). The simplest logic function that is suitable for
delineating this type of change in relation is that of negative impli-
cation and its logical converse. Upon examination, it may be seen
that the only difference existing between these tuples is the direction
of change: 1 to 0 or 0 to 1. The name assigned to the (1,0) confirma-
tory response patterns is "prerequisite to." The (0,1) change, or
disconfirmatory response patterns, is "is not a prerequisite to."
To summarize, the conditions of asymmetry, trans*vity, and
connectiveness are the foundation of ordering and produce the com-
posite definition of an order relation. The conceptual product of
asymmetry and transitivity conditions is the necessary higher-order
notion of connectivity. When relations are transitive in nature,
connectivity between the first and last elements in a hierarchy is
implied. This property, upon which the notion of prerequisites is
based, is the essence of a simple order which ultimately results in a
unidimensional construct. Within a given data matrix, a set of these
simple orders is said to exist. Therefore, uncovering these latent
unidimensional structures involves the identification of the simple
orders which in turn define dimensionality. Given a data matrix, the
\

38
dimensions as commonly defined are the development of a set of orders
(Russell, 1919, p. 29).
Order Analysis: An Overview
Order analysis, the prototype measurement model of ordering
theory due primarily to Krus and Bart (l973)> begins by generating an
item dominance matrix which indicates the frequency of both the (1,0)
and (0,1) item response patterns. The construction of the dominance
matrix, N, from the person by item response matrix S and its trans-
posed complement, S*, may be represented as:
M = S' S (1) *
where an element n,. is equal to the number of persons who get k wrong
and ± right, which is to say, the number of times item k dominates item
±. Thus, element n. . represents the number of (0,1) disconfirmatory
response patterns while its symmetric counterpart, n.. , represents the
number of confirmatory or (1,0) response patterns. Ibis matrix
multiplication yields a square matrix of integer values indicating, as
stated before, the number of times a row element dominates a corres-
ponding column element. As in a correlation matrix, measurement error
may also infiltrate the dominance matrix, in the form of intransitivi-
ties. To take this uncertainty into account, order analysis utilizes
a probabilistic algorithm designed to measure the relative pureness of
each particular pair of dominance relations. This is done by the con-
struction of a z-ratio (McNemar, 19^7) between the symmetric entries
*U_
19
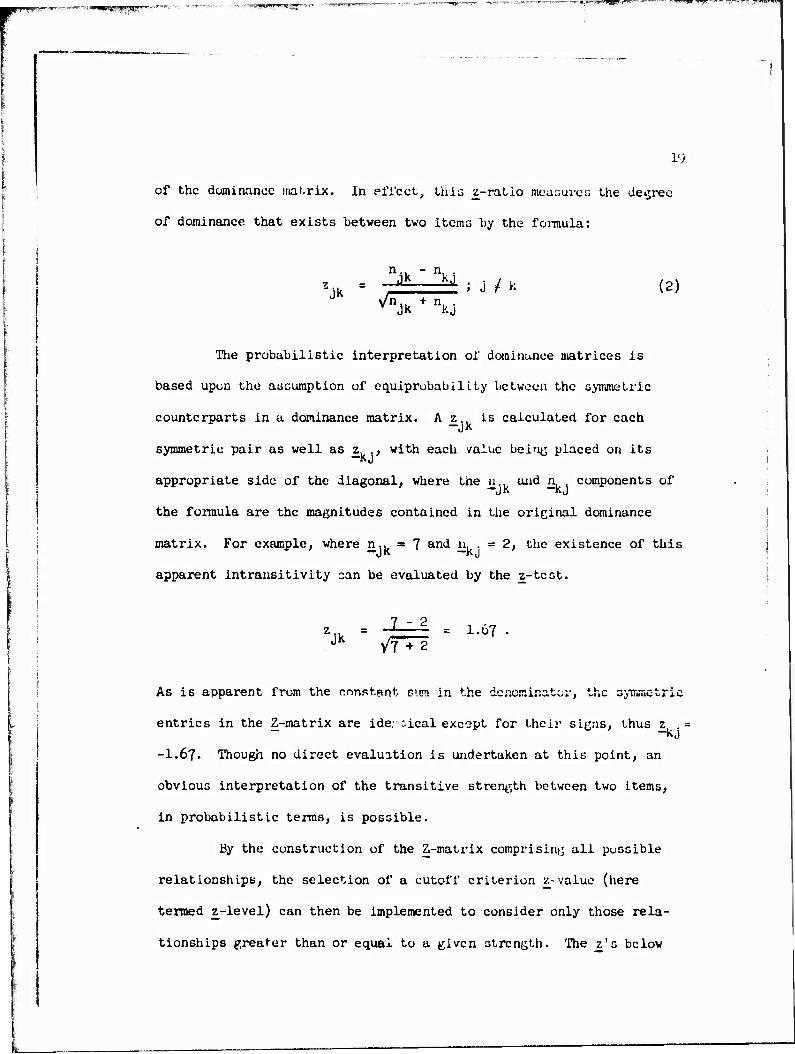
of the dominance mat-rix. In effect, this z-ratio measures the decree
of dominance that exists between two items by the formula:
*Jk
•1 "" "i a
& *A ; J i k ^njk + nKj
(2)
The probabilistic interpretation of dominance matrices is
based upon the assumption of equiprobability between the symmetric
counterparts in a dominance matrix. A z is calculated for each
symmetric pair as well as z, ., with each value being placed on its KJ
appropriate side of the diagonal, where the a., and n components of —jK kj
the formula are the magnitudes contained in the original dominance
matrix. For example, where n.. = 7 and n. . = 2, the existence of this
apparent intrausitivity can be evaluated by the z-test.
"Jk '7 + 2 = 1.67
kj
As is apparent from the constant sum in the denominator, the symmetric
entries in the Z-matrix are ide: deal except for their signs, thus z
-I.67. Though no direct evaluation is undertaken at this point, an
obvious interpretation of the transitive strength between two items,
in probabilistic terms, is possible.
By the construction of the Z-matrix comprising all possible
relationships, the selection of a cutoff criterion z-value (here
termed z-level) can then be implemented to consider only those rela-
tionships greater than or equal to a given strength. The z's below
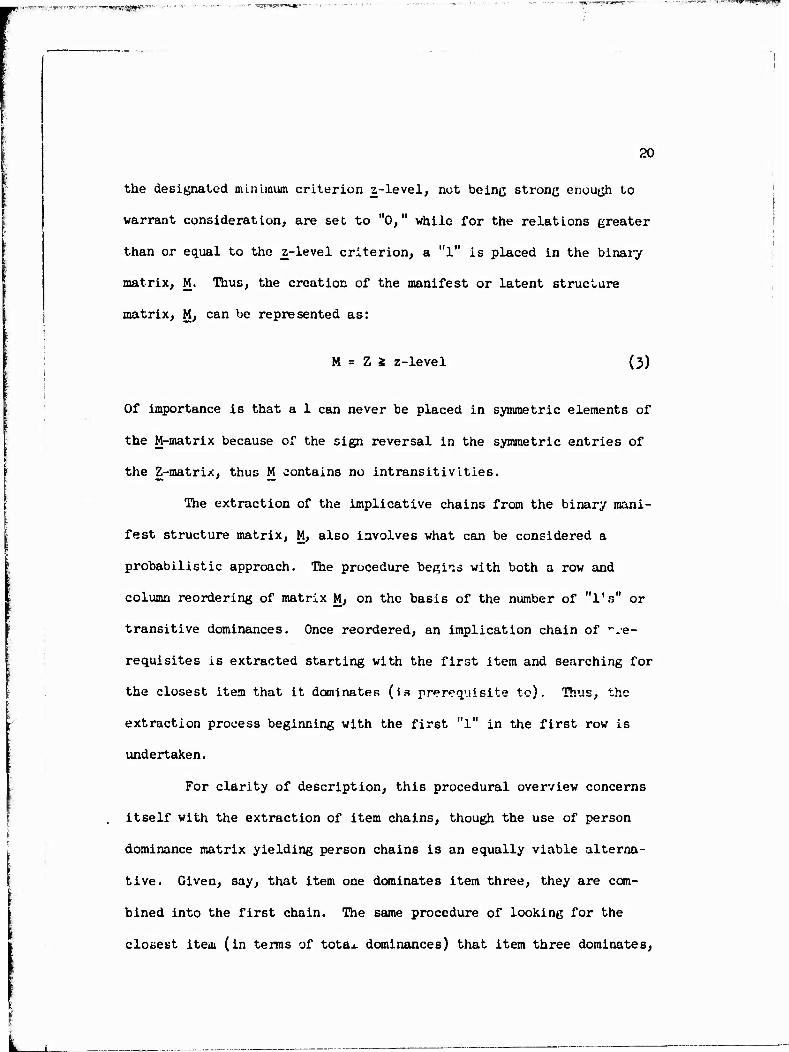
20
the designated minimum criterion z-level, net being stronc enough to
warrant consideration, are set to "0," while for the relations greater
than or equal to the z-level criterion, a "l" is placed in the binary
matrix, M. Thus, the creation of the manifest or latent structure
matrix, M, can be represented as:
M = Z i z-level (3)
Of importance is that a 1 can never be placed in symmetric elements of
the M-matrix because of the sign reversal in the symmetric entries of
the Z-matrix, thus M contains no intransitivLties.
The extraction of the implicative chains from the binary mani-
fest structure matrix, M, also involves what can be considered a
probabilistic approach. The procedure begins with both a row and
column reordering of matrix M, on the basis of the number of "l's" or
transitive dominances. Once reordered, an implication chain of "•»•e-
requisites is extracted starting with the first item and searching for
the closest item that it dominates (is prerequisite to). Thus, the
extraction process beginning with the first "l" in the first row is
undertaken.
For clarity of description, this procedural overview concerns
itself with the extraction of item chains, though the use of person
dominance matrix yielding person chains is an equally viable alterna-
tive. Given, say, that item one dominates item three, they are com-
bined into the first chain. The same procedure of looking for the
closest item (in terms of tota^ dominances) that item three dominates,
21
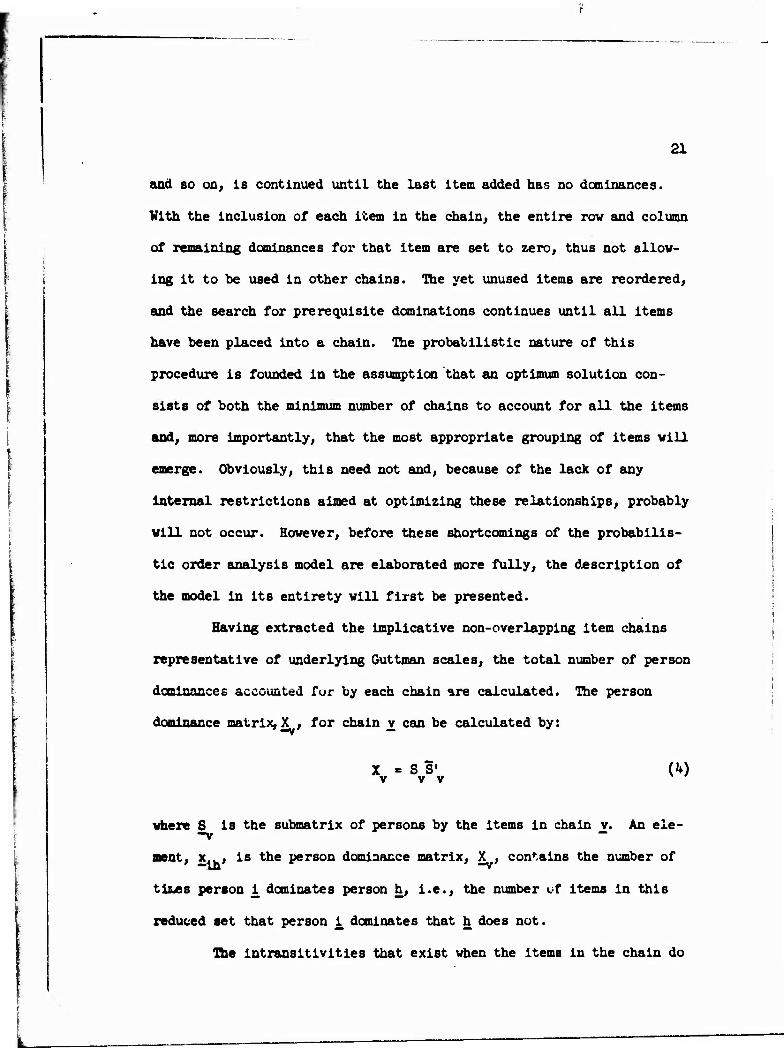
and BO on, is continued until the last item added has no dominances.
With the inclusion of each item in the chain, the entire row and column
of remaining dominances for that item are set to zero, thus not allow-
ing it to be used in other chains. The yet unused items are reordered,
and the search for prerequisite dominations continues until all items
have been placed into a chain. The probabilistic nature of this
procedure is founded in the assumption that an optimum solution con-
sists of both the minimum number of chains to account for all the items
and, more importantly, that the most appropriate grouping of items will
emerge. Obviously, this need not and, because of the lack of any
internal restrictions aimed at optimizing these relationships, probably
will not occur. However, before these shortcomings of the probabilis-
tic order analysis model are elaborated more fully, the description of
the model in its entirety will first be presented.
Having extracted the implicative non-overlapping item chains
representative of underlying Guttman scales, the total number of person
dominances accounted fur by each chain are calculated. The person
dominance matrix, X , for chain v can be calculated by:
X * S S« V V V («0
where S is the submatrix of persons by the items in chain v. An ele- -v ~
sent, x ., is the person dominance matrix, X , contains the number of
titles person _i dominates person h, i.e., the number «.f Items in this
reduced set that person i^ dominates that h does not.
The intransitivities that exist when the items in the chain do
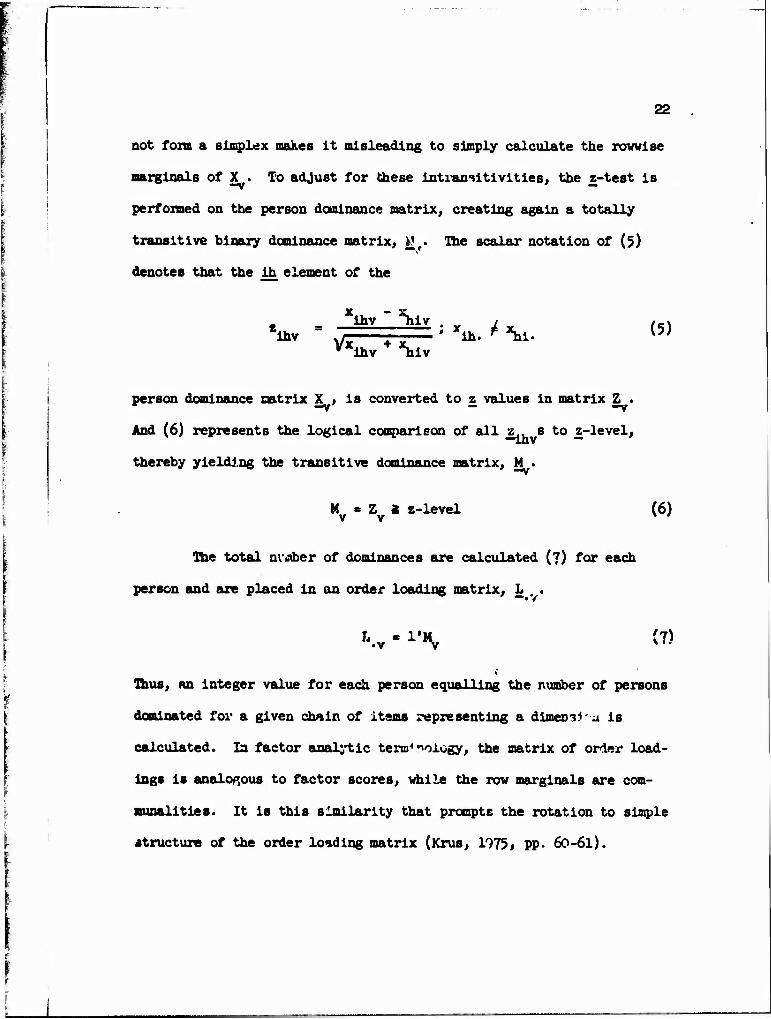
22
not form a simplex makes it misleading to simply calculate the rowise
marginals of X . To adjust for these intransitivities, the z-test is
performed on the person dominance matrix, creating again a totally
transitive binary dominance matrix, kjr. The scalar notation of (5)
denotes that the ih element of the
ihv ihv " "hi?
Vxihv + \U ; Xih. ^ *hi- (5)
person dominance natrix X , is converted to z values in matrix Z . r -V — —V
And (6) represents the logical comparison of all z s to z-level,
thereby yielding the transitive dominance matrix, M .
M - Z 2 z-level (6) v v * '
The total niihber of dominances are calculated (7) for each
person and are placed in an order loading matrix, L . .
J'.v - 1% (7)
Thus, an Integer value for each person equalling the number of persons
dominated for a given chain of items representing a dimen^'a is
calculated. In factor analytic teratology, the matrix of order load-
ing« is analogous to factor scores, while the row marginals are com-
munalities. It is this similarity that prompts the rotation to simple
structure of the order loading matrix (Krus, 1973, pp. 60-61).
g-iT.s-siLi.fi wjgmm/Bg^armn
23
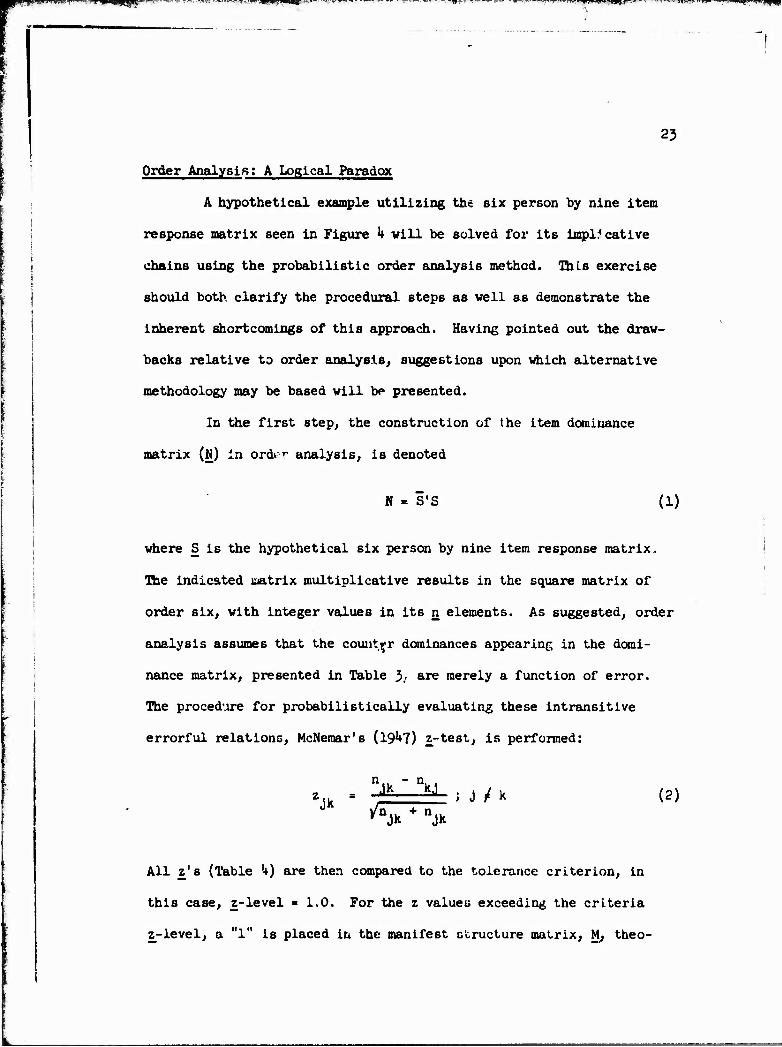
Order Analysis; A Logical Paradox
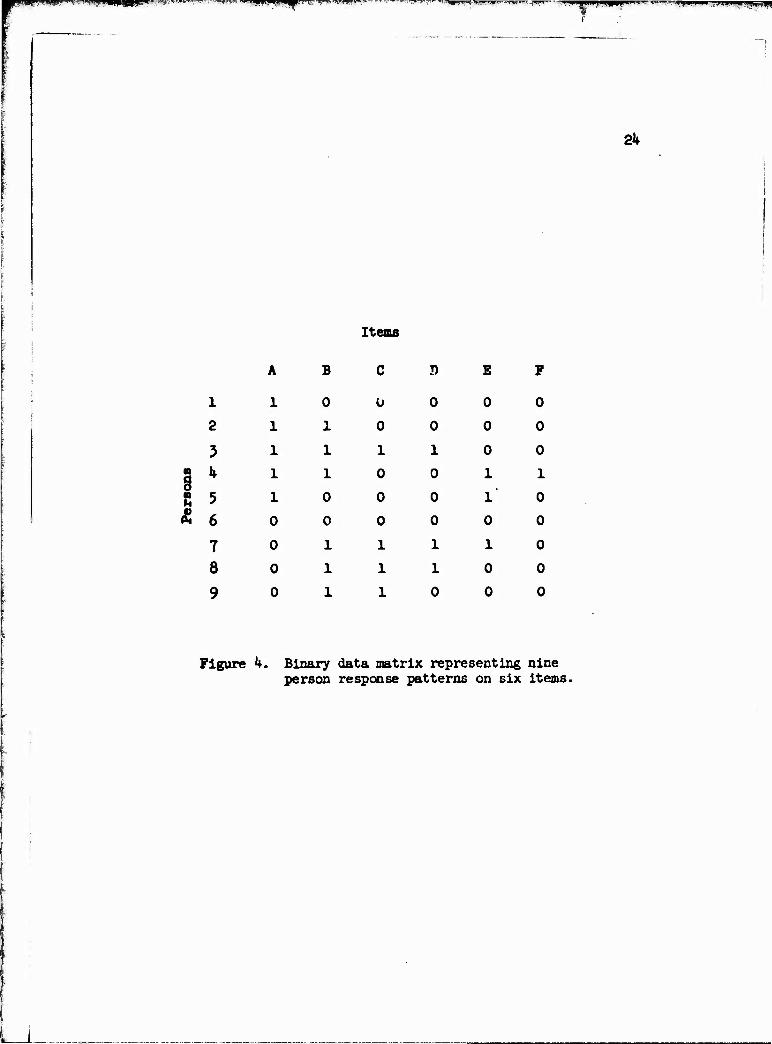
A hypothetical example utilizing the six person by nine item
response matrix seen in Figure k will be solved for its implicative
chains using the probabilistic order analysis method. This exercise
should both clarify the procedural steps as well as demonstrate the
inherent shortcomings of this approach. Having pointed out the draw-
backs relative to order analysis, suggestions upon which alternative
methodology may be based will be presented.
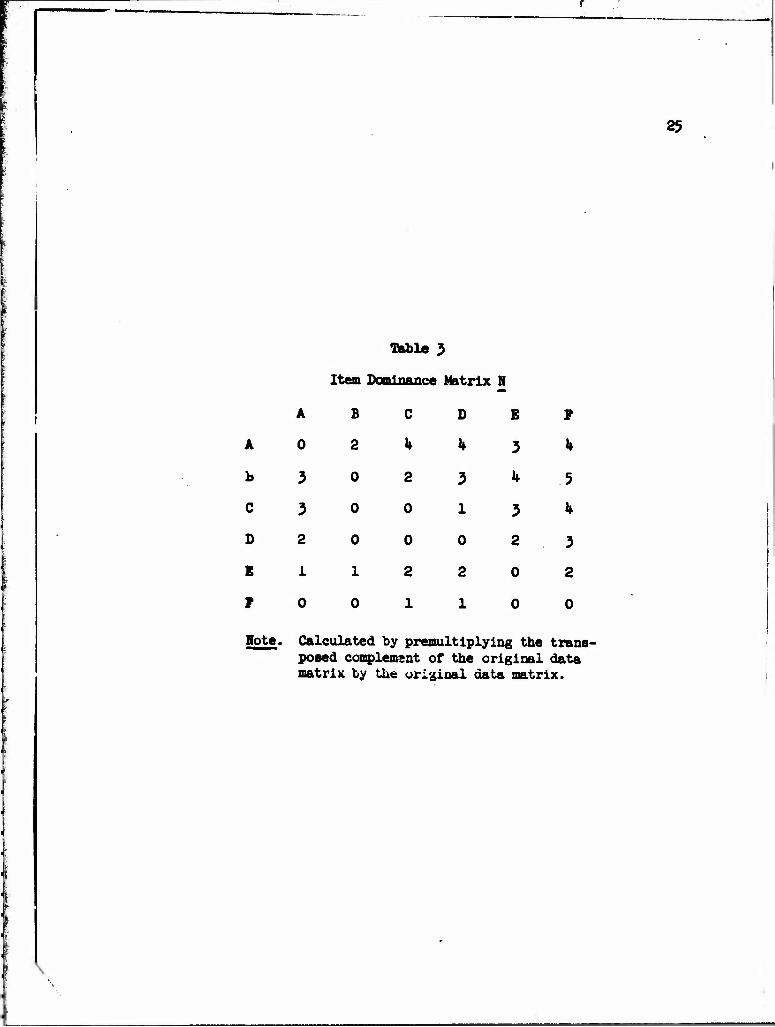
In the first step, the construction of the item dominance
matrix (N) in order analysis, is denoted
N = S'S (1)
where S is the hypothetical six person by nine item response matrix.
The indicated uatrix multiplicative results in the square matrix of
order six, with integer values in its n elements. As suggested, order
analysis assumes that the counter dominances appearing in the domi-
nance matrix, presented in Table 3; are merely a function of error.
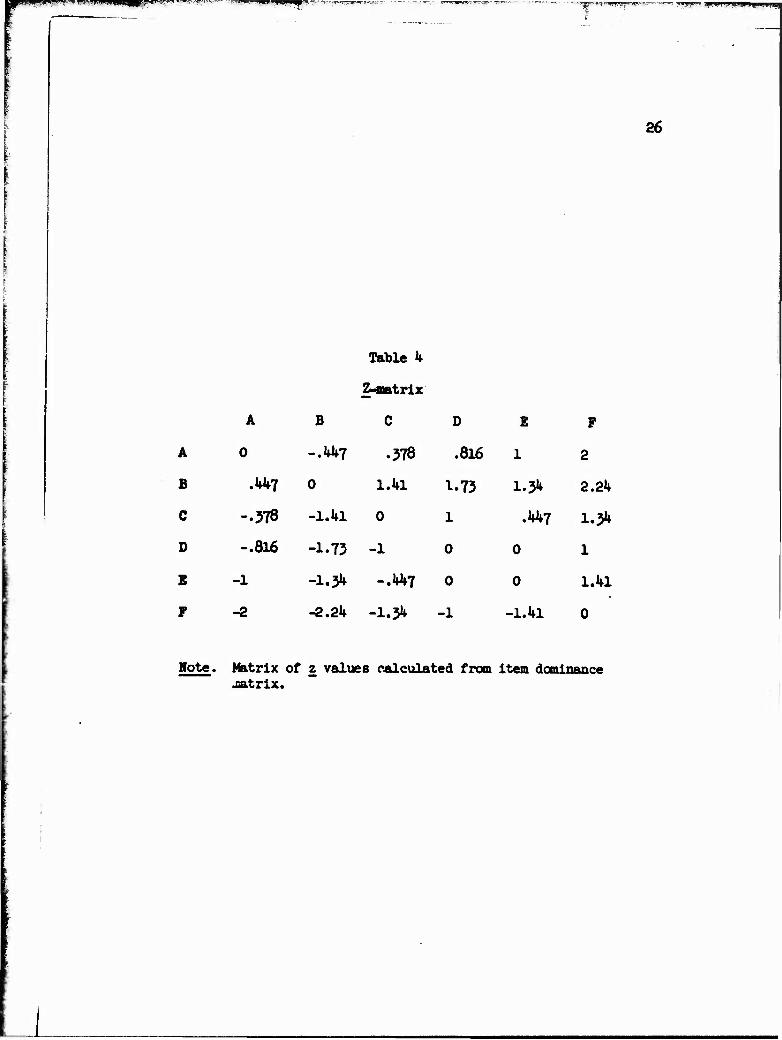
The procedure for probabilistically evaluating these intransitive
errorful relations, McNemar's (19^7) z-test, is performed:
n,, - n z Jh "J , .1 / k (2)
All z's (Table '+) are then compared to the tolerance criterion, in
this case, z-level = 1.0. For the z values exceeding the criteria
z_-level, a "1" is placed in the manifest structure matrix, M, theo-
'«■gill ll^ll I in.i j fmmußmm
Items
2k
B E
1 1 0 Ü 0 0 0
2 1 1 0 0 0 0
3 1 1 1 1 0 0
2 5
l 1 0 0 1 1
1 0 0 0 1 0
& 6 0 0 0 0 0 0
7 0 1 1 1 1 0
8 0 1 1 1 0 0
9 0 1 1 0 0 0
Figure k. Binary data matrix representing nine person response patterns on six items.
25
Table 3
Item Dominance Matrix I [
A B C D E P
A 0 2 If It 3 If
b 3 0 2 3 it 5
C 3 0 0 l 3 If
D 2 0 0 0 2 3
E 1 1 2 2 0 2
F 0 0 1 1 0 0
Rote. Calculated by premultlplying the trans- posed complement of the original data matrix by the original data matrix.
\
"T^jr-•««*■■ RflJ^*»!"» «ffflf^PC i 'JHIJiJPUpmp ~ ~~ -'>""-" ^^"nr'TT'K-™:
r ' -'»_ wr".wa.»jjii|IPPHI
26
Table 1*
2~matrix
A B C D E F
A 0 -.1*7 •378 .816 1 2
B .1*1*7 0 l.Ul 1.73 1.34 2.21*
C -.378 -1.1*1 0 1 .1*1*7 1.34
D -.816 -1.73 -1 0 0 1
E -1 -I.34 -.1*1*7 0 0 1.1*1
F -2 -2.21* -1.31* -1 -1.1*1 0
Mote. Matrix of z values calculated from item dominance jatrix.
■ m. I mHQ!,."<-'F-"'PV
f
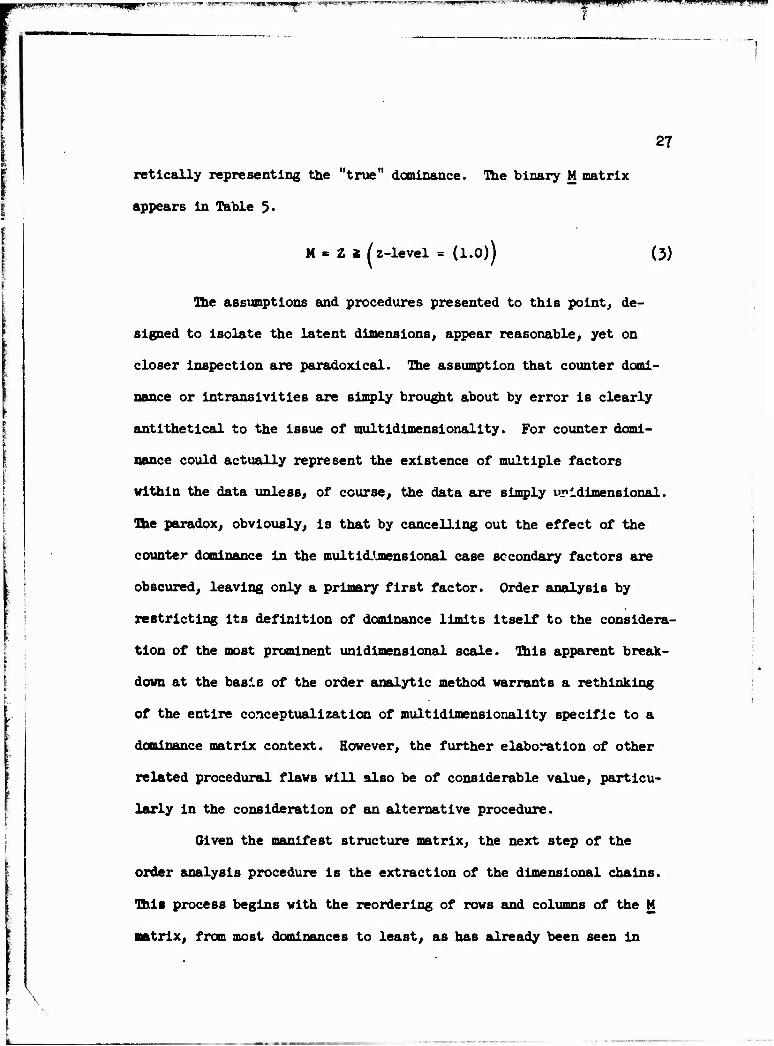
27
retically representing the true dominance. The binary M matrix
appears in Table 5.
M = Z 2 fz-level /z-level = (1.0)) (3)
The assumptions and procedures presented to this point, de-
signed to isolate the latent dimensions, appear reasonable, yet on
closer inspection are paradoxical. The assumption that counter domi-
nance or intransivities are simply brought about by error is clearly
antithetical to the issue of multidimensionality. For counter domi-
nance could actually represent the existence of multiple factors
within the data unless, of course, the data are simply Dreidimensional.
The paradox, obviously, is that by cancelling out the effect of the
counter dominance in the multidimensional case secondary factors are
obscured, leaving only a primary first factor. Order analysis by
restricting its definition of dominance limits itself to the considera-
tion of the most prominent unidimensional scale. This apparent break-
down at the basis of the order analytic method warrants a rethinking
of the entire conceptualization of multidimensionality specific to a
dominance matrix context. However, the further elaboration of other
related procedural flaws will also be of considerable value, particu-
larly in the consideration of an alternative procedure.
Oiven the manifest structure matrix, the next step of the
order analysis procedure is the extraction of the dimensional chains.
This process begins with the reordering of rows and columns of the M
matrix, from most dominances to least, as has already been seen in

i i ."Ji^ua^pppfvt HUM ,»!|iijwwipi >j#»Ji,!«»in,wj
28
Table 5
Manifest Structure Matrix M
B C A 0 E F
B 0 1 0 1 1 1
C 0 0 0 1 0 1
A 0 0 0 0 1 1
D 0 0 0 0 0 1
E 0 0 0 0 0 1
¥ 0 0 0 0 0 0
Note. Reordered manifest structure matrix, M, using a z-level = 1.0.
T
29
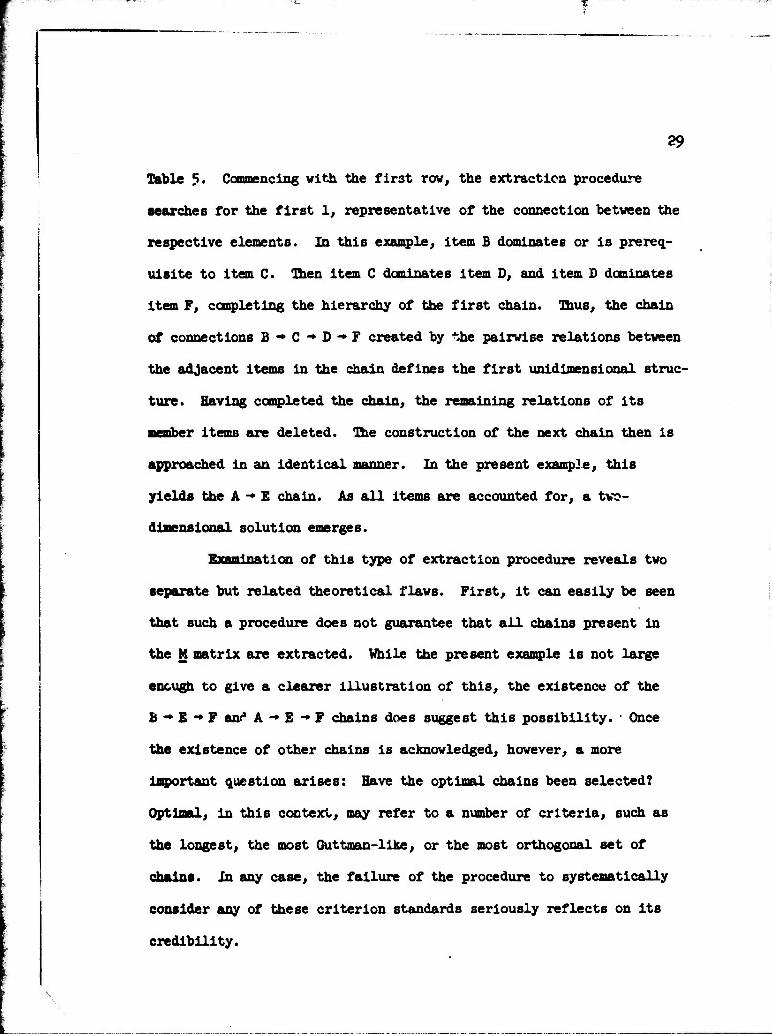
Table 5« Commencing with the first row, the extraction procedure
searches for the first 1, representative of the connection between the
respective elements. In this example, item B dominates or is prereq-
uisite to item C. Then item C dominates item D, and item D dominates
item F, completing the hierarchy of the first chain. Thus, the chain
of connections B — C ■* D ■* F created by ^he pairvise relations between
the adjacent items in the chain defines the first unidimensional struc-
ture. Having completed the chain, the remaining relations of its
member items are deleted. The construction of the next chain then is
approached in an identical manner. In the present example, this
yields the A -» E chain. As all items are accounted for, a tvo-
dimensional solution emerges.
Examination of this type of extraction procedure reveals two
separate but related theoretical flaws. First, it can easily be seen
that such a procedure does not guarantee that all chains present in
the M matrix are extracted. While the present example is not large
enough to give a clearer illustration of this, the existence of the
B -• E -» F an<* A •* E -» F chains does suggest this possibility. Once
the existence of other chains is acknowledged, however, a more
important question arises: Have the optimal chains been selected?
Optimal, in this context, may refer to a number of criteria, such as
the longest, the most Guttman-like, or the most orthogonal set of
chains. In any case, the failure of the procedure to systematically
consider any of these criterion standards seriously reflects on its
credibility.
I.TJ.«1--,*" - .-■■ ' wiji.m n »vmmmmm*
30
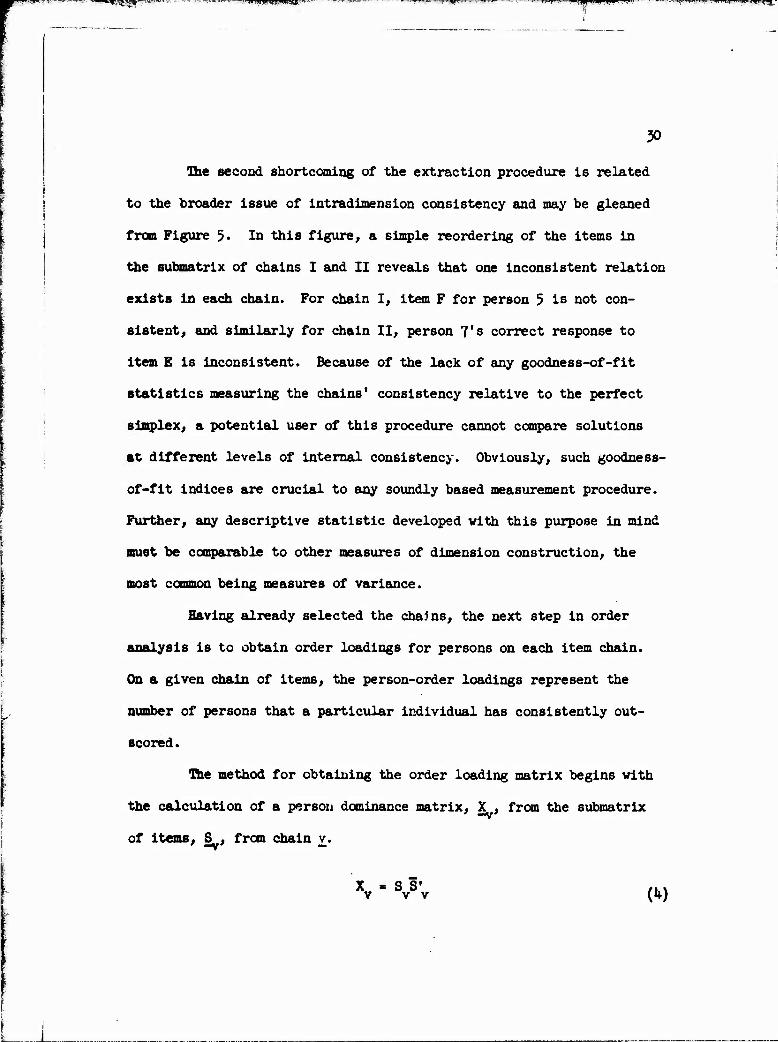
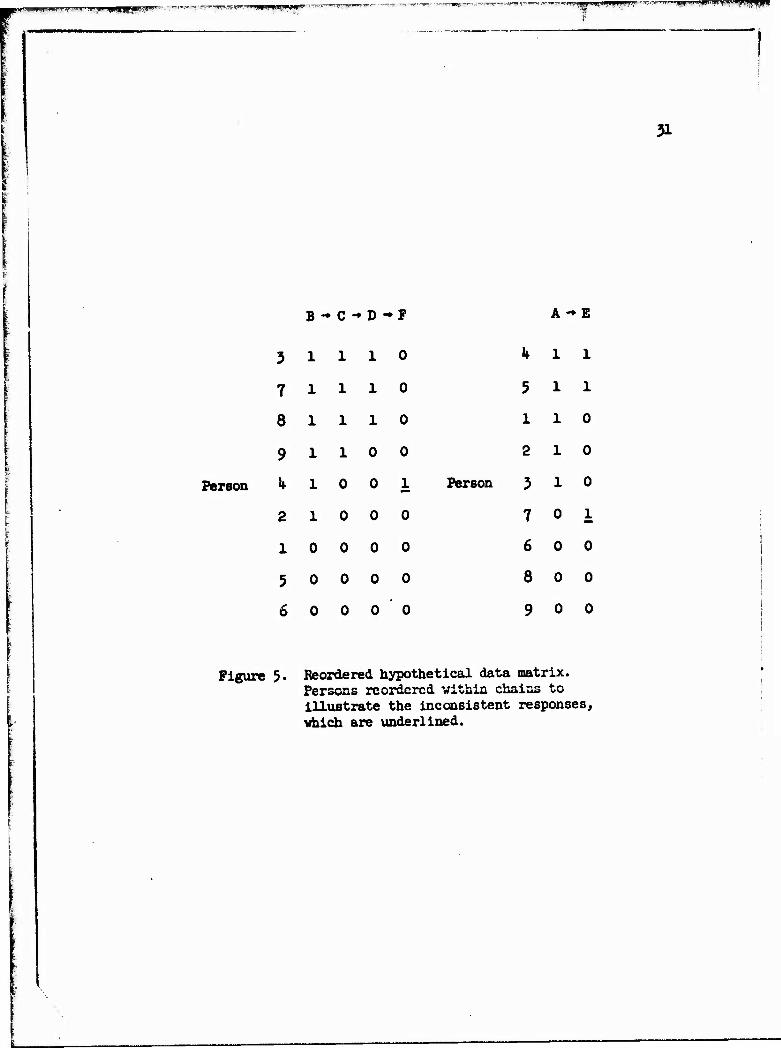
The second shortcoming of the extraction procedure is related
to the broader issue of intradimension consistency and may be gleaned
from Figure 5. In this figure, a simple reordering of the items in
the submatrix of chains I and II reveals that one inconsistent relation
exists in each chain. For chain I, item F for person 5 is not con-
sistent, and similarly for chain II, person 7's correct response to
item E is inconsistent. Because of the lack of any goodness-of-fit
statistics measuring the chains' consistency relative to the perfect
simplex, a potential user of this procedure cannot compare solutions
at different levels of internal consistency. Obviously, such goodness-
of-fit indices are crucial to any soundly based measurement procedure.
Further, any descriptive statistic developed with this purpose in mind
must be comparable to other measures of dimension construction, the
most common being measures of variance.
Having already selected the chains, the next step in order
analysis is to obtain order loadings for persons on each item chain.
On a given chain of items, the person-order loadings represent the
number of persons that a particular individual has consistently out-
scored.
The method for obtaining the order loading matrix begins with
the calculation of a person dominance matrix, X , from the submatrix
of items, S , from chain v.
v v v [k)
r,w* mmnwKffn, ■ in, BgjjW ,'. —T-yHiw^-w^wiiin. 1 ■'.,)':.f.»!,;.<pi
B *• C -*D ■*¥ A-E
Person
3 1 1 1 0
7 1 1 1 0
8 1 1 1 0
9 1 1 0 0
k 1 0 0 1
2 1 0 0 0
1 0 0 0 0
5 0 0 0 0
6 0 0 0 ' 0
Person
If
5
1
2
3
7
6
8
9
1
l
1
1
1
0
0
0
0
1
1
0
0
0
1
0
0
0
Figure 5. Reordered hypothetical data matrix. Persons reordered vithin chains to illustrate the inconsistent responses, vhich are underlined.
31
'■ ■■■«'"■w
32
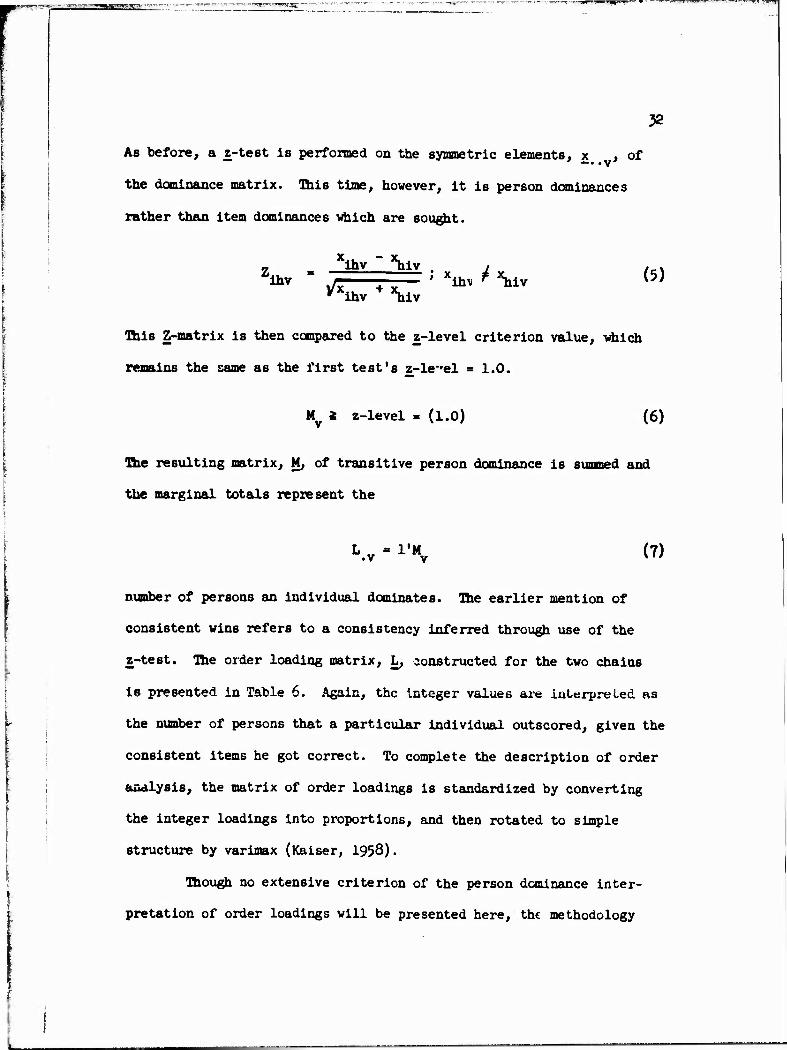
As before, a z-test is performed on the symmetric elements, x , of
the dominance matrix. This time, however, it is person dominances
rather than item dominances which are sought.
ihv
Xihv " ^iv
^xihv + *hiv ih\ *\±y (5)
This Z-matrix is then compared to the z-level criterion value, which
remains the same as the first test's z-le'rel = 1.0.
My 2 z-level = (1.0) (6)
The resulting matrix, M, of transitive person dominance is summed and
the marginal totals represent the
L „ = I'M •v v (7)
number of persons an individual dominates. The earlier mention of
consistent wins refers to a consistency inferred through use of the
z-test. The order loading matrix, L, constructed for the two chains
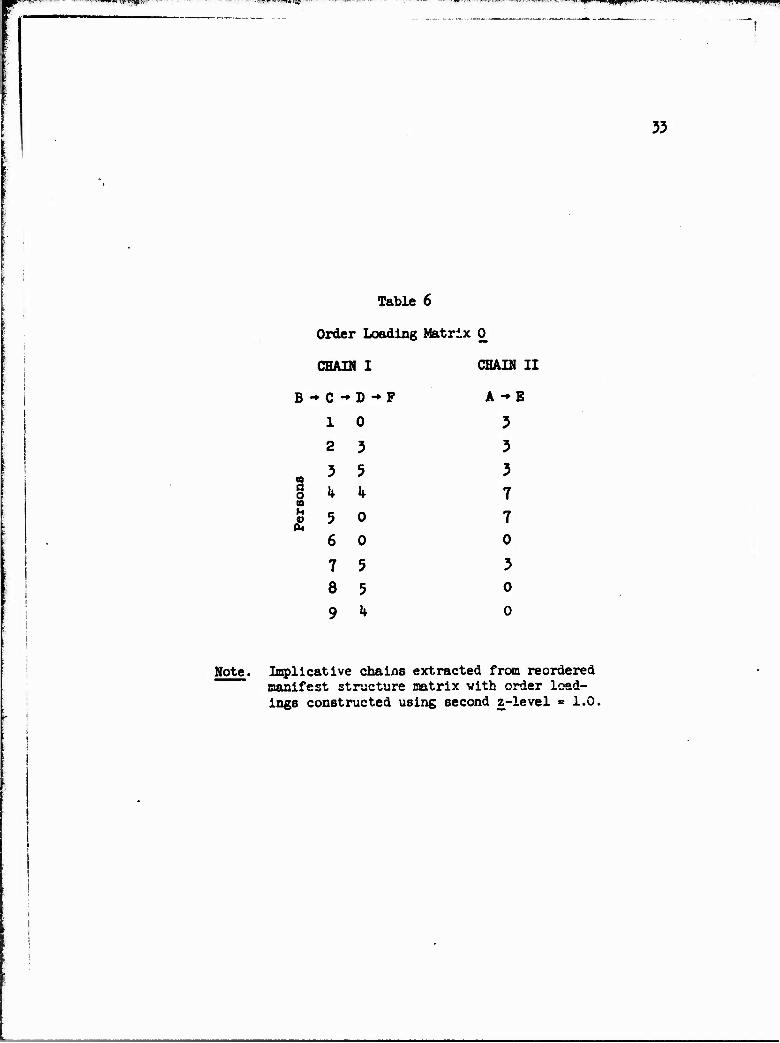
is presented in Table 6. Again, the integer values are interpreted as
the number of persons that a particular individual outscored, given the
consistent items he got correct. To complete the description of order
analysis, the matrix of order loadings is standardized by converting
the integer loadings into proportions, and then rotated to simple
structure by varimax (Kaiser, 1958).
Though no extensive criterion of the person dominance inter-
pretation of order loadings will be presented here, the methodology
■"HWyil'.y,""-J-—m "*vi*i*it-*.--*»..wmryn->u>iß.
Table 6
Order Loading Matrix 0
CHAIN I CHAIN II
B-»C-*D-*F A -» E
10 3
2 3 3 3 5 3 a a o a
M
33
if l* 7
5 0 7 6 0 0
7 5 3
8 5 0 9 U 0
Note. Implicative chains extracted from reordered " manifest structure matrix with order load-
ings constructed using second z-level = 1.0.
54
upon örtlich it is based is nonetheless subject to question (e.g., the
z-test criterion). And if the extracted chains represent unidia-.n-
sional scales underlying the data matrix, the need for rotation is
unclear. Given the serious procedural shortcomings that have been
discussed already, rotation may be nothing more than an attempt to
sift through the structure in search of meaning. Any procedure that
identifies the true unidimensional components, as order analysis pur-
ports to do, should have no need lor rotation.
In summary, an example of the probabilistic version of order
analysis has been traced through, noting its procedural shortcomings.
Two problems emerge that, if resolved, could lead to a theoretically
sound procedure for the extraction of multiple Guttman scales. First,
the internal consistency of all elements in a chain, rather than Just
its adjacent members, is crucial. A solution to this problem would,
in effect, also resolve the logical paradox of multidimensional
counter dominances or intransivities. Internal consistency redefines
the multidimensionality of the dominance matrix, allowing for an
appropriate appraisal of the existing counter dominance. The second
problem involves the development of standard procedures for selecting
the optimal chains. Necessary to the selection of the optimal chains,
however, is the consideration of all chains. Thus, the factor extrac-
tion methodology must first extract all chains before the selection
procedure can be implemented.
MODEL ADD THEORETICAL CONSTRUCTS
ERGO: A Procedure for Extracting
Reliable Guttman Orders
An alternative approach that avoids the pitfalls of order
analysis must redefine internal consistency in terms of its counter-
part in classical test theory reliability. Cliff (1975b) suggests a
series of indices, intended for a testing context, that establish a
relation between dominance matrices and classical measurement. Among
the indices described by Cliff (1975b) is a measure of internal con-
sistency calculated from a dominance matrix that functions like the
standard Kuder-Richardson formulae (KR) (1937)• In conjunction with
a methodology for defining an optimal, representative set of factors,
the application of internal consistency presented by Cliff will be
utilized in a new model termed ERGO. This alternative model attempts
to resolve the paradoxes common to order analysis, while still associ-
ating itself with certain elements of ordering theory.
Internal Consistency
The index proposed by Cliff (1975b) is based upon two param-
eters and yields a numerical value which represents the Internal
consistency of a set of dominance relations. The first parameter is
35
.-rr^-*~*-!.. ,jijj!.i'i«M^pn ij , ^^-..^-ITMFT .]i|3v]minioni j. H^T^BPWIM"
the relation of an obtained dominance matrix to a perfect Guttman
simplex, and the second parameter is the relation of an obtained
dominance matrix to a theoretically random set of dominances. Before
the assumptions underlying the development of the index ar; presented,
it should be noted that ' ae identical operations hold for both person
or item dominance matrices. However, to be illustratively consistent
vith the preceding example, the item dominance matrix will be used.
Given the item dominance matrix N, the total number of rela-
tions, u, is denoted in equation 8.
u = 221a Jk (8)
The matrix notation for this summation, when S is the binary response
matrix and (SS') its dominance matrix, is seen in equation 9.
u = l'CS'S)! (9)
If the rows and columns of the item dominance matrix are reordered in
a descending fashion and the data are perfectly consistent, all the
dominance relations will be contained in the upper triangle. Thus for
perfectly consistent data the number of dominances in the upper tri-
angle, u , would equal the toval, u. —m
u * Z Z n,. m J k>J Jk
(10)
By equating perfectly consistent oata with a Guttman simplex, incon-
sistency can thus be evaluated in terms of dominances that fall below

37
the upper triangular portion of the reordered dominance matrix. To
put these relationships into a proper perspective, however, the con-
sideration of a second parameter, a probabilistic distribution of
dominances, must also be considered.
The assumption of no order, in the context of a dominance
raatrix, necessarily suggests an equal number of dominances for each
n... In the case of equally distributed dominances, n„ and n. . can
be viewed as both estimates of the same quantity, v... Thus, it fol-
lows that by averaging the symmetric entries an expected minimum, u , m
is produced.
v ■ JÄ["#-*u**Vj)] (u)
Distributing the sums, a maximum of £u is realized.
V = u - ±u (12) m m
!Tius, a consistency index, c, relating the actual number of dominances
in the upper triangular portion to that expected by chance, can be
constructed. A one is subtracted from the upper triangular "good"
dominance-to-chance proportion in order o distribute the consistency
value from -1 to +1, thereby yielding
c - jS - 1 (13)
By simply ridding the denominator of the fraction
2u C--Ä-1
u
f
58
ve have Cliff's index of item consistency, c. By essentially the same
rationale, Cliff (1975b) redefines the Kuder-Richardson formulae
(1937) and the Loevinger index (19^7) °y considering the obtained
upper triangular dominance, the maximum possible number of dominances,
and those expected by chance. The foundation of the consistency
index, considering its utilization of the same parameter that under-
lies such classical reliability coefficients as KR20 and KR21, makes
it a most appropriate alternative for evaluating order consistency
over the entire dominance matrix. What remains, having established the
suitability of c, is the methodology through vhich it may be imple-
mented.
Selecting Optimal Chains: Internal Procedure
Optimal chains employ both internal (within chains) and
external (among chains) procedures that are directed toward selecting
the most appropriate set of item combinations to represent the data.
With the restriction that consistency across all member items remains
as high as possible, the interrul procedure concerns itself with the
chaining of certain items. This contrasts with the order analysis
procedure that Operationalizes the chaining by considering only the
adjacent connections. Once the unidimensional chains are constructed,
the external optimization procedures attempt to order the chains in
terms of their relative contribution in explaining the dimensionality
of the data structure. Necessarily, the evaluation of relative con-
tributions across chains has as a prerequisite the extraction of all
chains.
59
The Initial consideration, viz., the combining of items into
chains, involves an iterative approach. For a given item chain, the
most consistent item as determined by the highest consistency, c ,
where £ represents the Joint subset of items, is Joined to the initial
chain. If a tie in consistencies exists, the item closest, in terms
of difficulty level, is given priority. Thus, for each item, k, a
consistency is calculated, c . ., combining the new item with the -p + K
items already in the chain.
V " BaX °P + k (ll°
The iterative procedure of sequentially adding items to chain? on the
basis of the overall consistency of the chain is cperationalized for
all items by allowing each item to initialize its own chain. In
matrix terms, the rows become representative of chains while the
columns remain representative of items ■ The ij. entries of the final
consistency matrix, F, correspond to the consistency level at which the
item, J, was added to the chain, 1. An illustration of this procedure
for the hypothetical example presented previously is seen in Table 7.
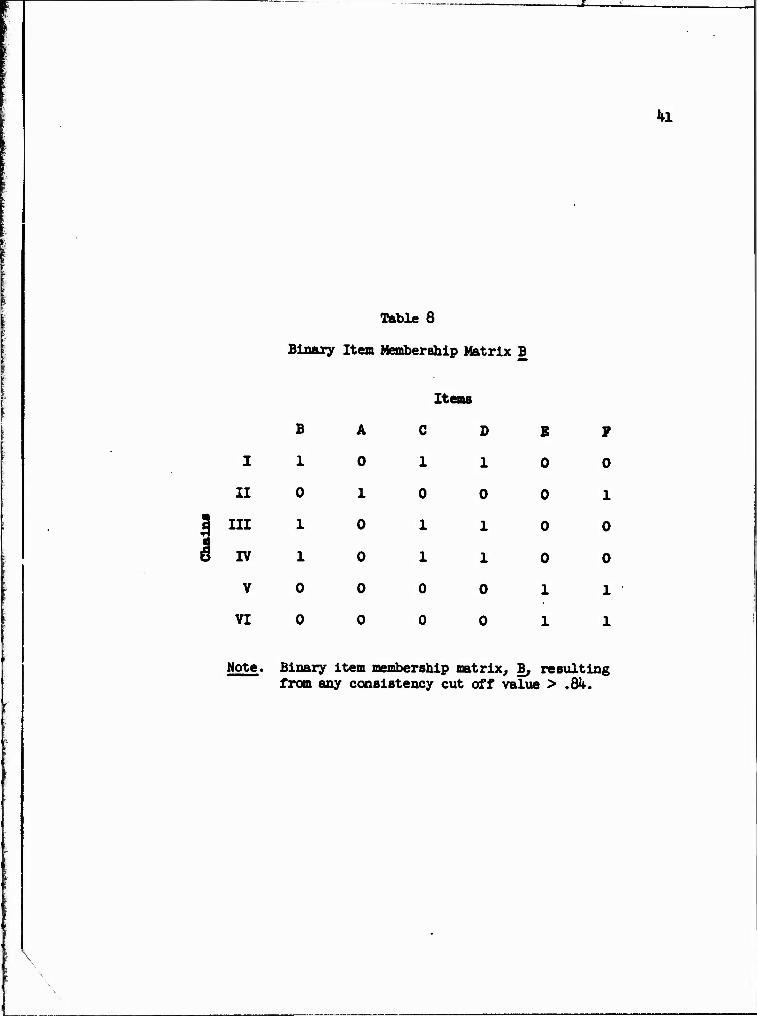
To identify member items, an element-by-element comparison of
matrix F is made to a subjectively determined consistency cutoff value,
cv. For example, by setting cv at any value greater than .&*, the
resulting binary membership matrix, B, is produced (see Table 8).
B « F 2 cv

|i,-i|iliUW«apB^-at»>»T^; -f r-g.M-v™?IHK-W.IU »i nr&jf "" • ."ingpwBWHUff ■■'"" ■ '■'"'.iLI iBiwwwBWwy»»8pifiB
1*0
Table 7
Final Consistency Matrix £
Items
B A C D E F
I 1.000 .516 1.000 1.000 .611 .800
II .680 1.000 .k6h .571 .800 1.000
CO q III 1.000 .516 1.000 1.000 .611 .800
S IV 1.000 .516 1.000 1.000 .611 .800
V .833 .680 .516 .571 1.000 1.000
VI •833 .680 .516 .571 1.000 1.000
Note. Rows represent chains and entries in reordered columns represent consistency at which item ± was added to chain i.
kl
Table 8
Binary Item Membership Matrix B
Items
B A c D E P
I 1 0 1 1 0 0
II 0 1 0 0 0 1
III 1 0 1 1 0 0
IV 1 0 1 1 0 0
V 0 0 0 0 1 1
VI 0 0 0 0 1 1
Note. Binary item membership matrix, B, resulting from any consistency cut off value > ,8k.
ft ipm 11 i imitl jtmi'^w-'-mw^mmi^fl B^WWB»" pmpmmpiiv ii * mvntMMfpii J^PPW*"
42
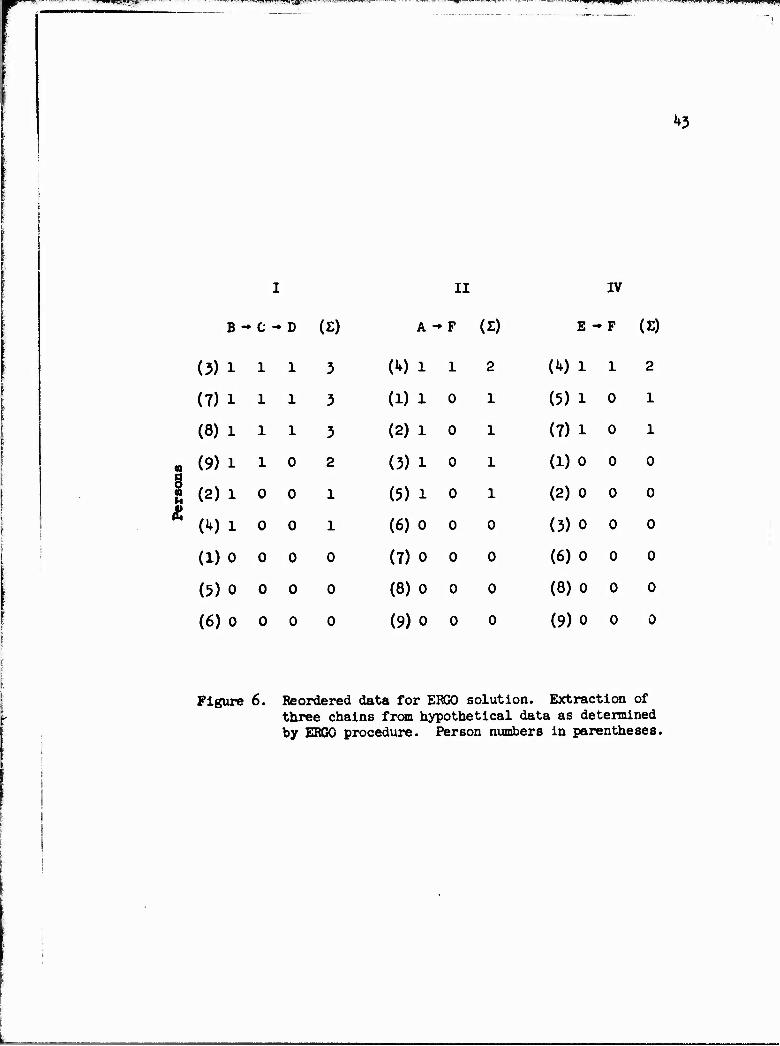
Removing the duplication, three chains are revealed, namely,
B ■* C -♦ D (I), A - F (II), and E -* F (ill). Because each chain has a
consistency value of one, as may be seen in Table 7, there are no
inconsistent relations. Figure 6 breaks down the chains into their
reppective submatrices, confirming the existing simplex for each chain.
Having completed the outline of procedures involved with
internal consistency, the procedures utilized in evaluating the con-
tributions of the extracted chains will be presented. However, before
the details of the considerations used in evaluation are brought forth,
the scoring procedure implemented in ERGO needs to be discussed. In-
stead of defining scores as person dominance as is done in order
analysis, a straightforward summary of consistent relations (see
Figure 6) for an individual for a given chain defines score. The
redefinition of score using marginal sums offers a convenience of
interpretation which will be demonstrated in the empirical example to
be presented later.
Selecting Optimal Chains: External Procedure
The decision concerning the optimal solution and ordering of
chains, like the ordering of factors in factor analysis (FA) or dimen-
sions in multidimensional scaling (MDS), must be related to the overall
epistemic contribution of the dimensions. However, the distinction
between the structure of the dimensions recovered with the ERGO
procedure and those from either FA or MDS requires a redefining of
contribution. With FA and MDS, the variables or stimuli are assigned
*">w
a u
I II IV
B - C - D (£) A - F (Z) E - P (£)
(3)1 1 1 3 (V) l 1 2 (i0 i 1 2
(7) 1 1 1 3 (1) 1 0 1 (5) 1 0 1
(8) 1 1 1 3 (2) 1 0 1 (7) l 0 1
(9) 1 1 0 2 (3) 1 0 1 (Do 0 0
(2) 1 0 0 1 (5) 1 0 1 (2)0 0 0
(10 1 0 0 1 (6)0 0 0 (3)0 0 0
(1)0 0 0 0 (7)0 0 0 (6)0 0 0
(5)0 0 0 0 (8)0 0 0 (8)0 0 0
(6)0 0 0 0 (9)0 0 0 (9)0 0 0
Figure 6. Reordered data for ERGO solution. Extraction of three chains from hypothetical data as determined by ERGO procedure. Person numbers in parentheses.
*3

weights on all factors or dimensions, but in ERGO weights are assigned
to dimensions which are actually composed of subsets of items. Thus,
a procedure for optimally combining the dimensional chains to account
for the maximum number of items appears reasonable. When additional
chains are being considered for selection, the maximum number of items
refers to unique, or yet unaccounted for, items.
A procedure for ordering the extracted chains in terms of their
maximum number of unique items added appears straightforward. Compli-
cations from ties arise, however, making additional considerations
necessary. For a given set of chains, the selection procedure first
calculates for each pair of chains the total number of unique items.
Given that one such pair of chains has more than any other, the selec-
tion is greatly simplified. The chain containing the most items is
put first, the remaining chain second, with additional chains being
added corresponding to their number of unique (yet unaccounted for)
items. In the case of a tie of unique items, the chain having the
least overlap (items in common) with the already accounted for items
is chosen. When pairs of pairs are tied in both number of unique and
number of overlapping items, a still different procedure is called for.
This is to take the pair of chains that, within the pair, demonstrates
the largest difference in terms of their resulting orders (person
orders). The largest difference is defined as the largest number of
inversions in their corresponding person orders. To amplify, a single
inversion in order exists between any pair when, say, aRb in one rank-
ing is compared to bRa in the other. Thus, by totalling the number of
45
inversions and the number of agreements and then adjusting for the
number of possible agreements, an index reflecting the degree oi dis-
similarity of the two orders is developed. The index suggested paral-
lels the procedure utilized in the calculating of Kendall's tau a
(Kendall, 1962). It differs, however, in that the most appropriate
selection (having the most inversions) is the .owest tau value, as tau
is a measure of agreement rather than disagreement.
To best illustrate the process by which chains are ordered, the
hypothetical example will again be referred to, beginning with the item
membership matrix, B. Chains III, IV, and VI in matrix B will be
removed because of their obvious redundancy, leaving for consideration
chains I, II, and V. The heuristics upon which the subsequent chain
selection procedures rely are founded in Boolean arithmetic, briefly
summarized here:
0+0=0; 0+1=1; 1+1=1; 1x1=1; 1x0=0; OxOK)
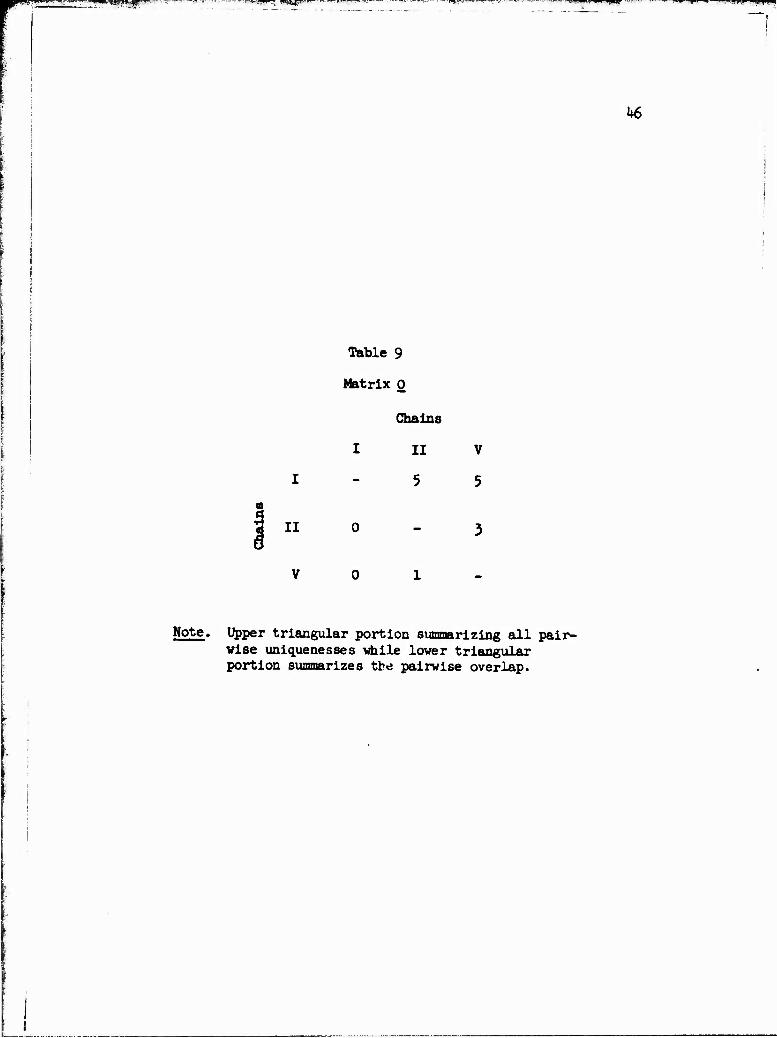
A summary of unique items between chains i and j. is computed
from the B matrix and placed in the appropriate upper triangular ij
element of matrix 0 (see Table 9)- Thus,
°u ■ £ jli (bi + V (16)
where "+" indicates Boolean arithmetic, and b. and b represent rows
corresponding to chains in the nonredundant item membership matrix B.
The lower triangular £L elements of matrix 0 are the number of over-
lapping items between chain i_ and chain ± denoted as
--' rimiiMQWälSF*"-' ;T^i~«T»3,r WmF' *-**■ ■'» 'ft■■» igwang^mBP
k6
a E
; ii 8
Table 9
Matrix 0
Chains
I II
5
V
5
Note. Upper triangular portion summarizing all pair- wise uniquenesses while lower triangular portion summarizes tbe pairwise overlap.
T7-rw>"i.-,.|m-l,!P imiP'
ggg "
°JI " JAW »»7
(17)
where "x" again Indicates Boolean arithmetic.
Inspection of Table 9 reveals that chain I is tied with chain
II and chain V with five unique items. The overlap criterion cannot
break the tie, as neither chain has any elements in common with chain
I. In this case, the next step is the correlating of the person scores
derived from their respective chains (I with II and I with V) so as to
determine the most dissimilar pair. The resulting taus as seen in the
upper half of Table 10 are -.159 and .0278, respectively. On this
basis, the I-II pair is selected. Having not accounted for all the
items (viz., item E), chain V is added, resulting in the final order of
I, II, and V.
Other situations not represented in this example need to be
mentioned. First, given that all items are accounted for, any remain-
ing chains are dropped. Second, the converse situation, where addi-
tional chains add only a relatively small number of items, thereby
having little substantive value, suggests the implementing of a scree-
type procedure to discount the smaller chains. And third, where an
attempt for orthogonality of recovered dimensions is desired, the
removal of items contained in more than one chain is suggested. To
allow for the evaluation of the above mentioned considerations, a
summary matrix for each solution as is seen in Table 6 is constructed.
The values in the upper triangular portion, as already mentioned, refer
to the taus between chains. The values in the lower triangular portion
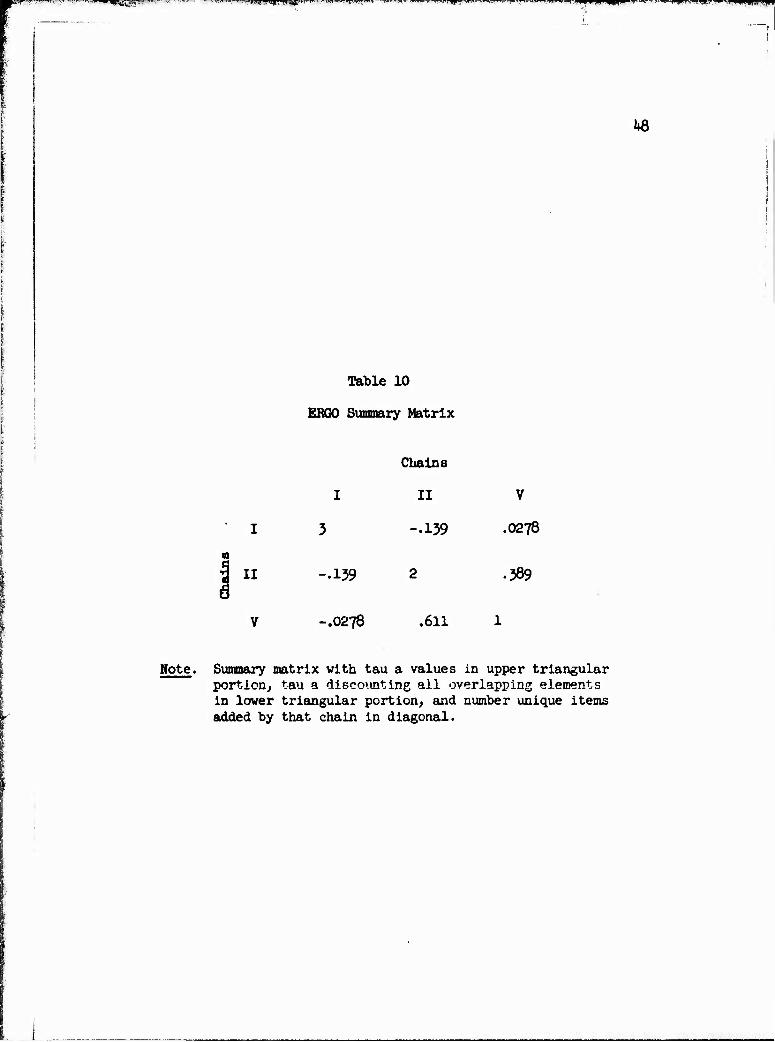
VP ... il ,unp.iinuj.!,pp
US
Table 10
ERGO Summary Matrix
c « 6 « "
3
-.139
-.0278
Chains
II
-.139
.611
V
.0278
.389
Note. Summary matrix with tau a values in upper triangular portion, tau a discounting all overlapping elements in lower triangular portion, and number unique items added by that chain in diagonal.
* v E*99P^pi£w v ^i^ v,,n,<iiwf« ^~—*— MI i vrnpn
*9
refer to the tau a correlations discounting common items, and the
integer values in the diagonal denote the number of unique elements
added to the solution by the inclusion of that chain.
In s>roary, having an index that corresponds directly to such
classical indices as the Kuder-Richardson formulae (1937) like the
internal consistency index proposed by Cliff (1975b) provides an unam-
biguous procedure for combining items into chains. One possible Im-
provement, however, is a weighting system that adjusts more fully for
item difficulty, rather than a total reliance on item consistency.
Unfortunately, the external selection process, not being grounded in
such fundamentally sound principles, cannot be considered as favorably.
The shortcomings become manifest as the dimensionality increases, thus
allowing more chance for an erroneous selection. It may be seen that
until indices are developed that maximize specific relationships,
preferably in both the item and person dominance contexts, the entire
extraction procedure may remain suspect. At any rate, a more sophis-
ticated definition of chains relating directly to the duality that
exists between item and person dominances is definitely called for. At
this time, having not resolved this issue, the selection procedures as
described will be implemented in the dimensionalizing of an empirically
derived data matrix.
Ti^^^'ifc^y:qg-^pww^"i^»firvyjTT^-.——^TWH■ ^v-'»""'-r—r-y--■ -<■"—«■—i »■,■■. i^^*.-^. eeaapi PWWBB " ' «gpgpi ny n""^j.i ip;
AN EMPIRICAL EXAMPLE
Method
To demonstrate the order extracting procedure in a practical
context, an investigation was designed to allow for may»™™ empirical
validation. Selected as a representative, well-known Guttman scale was
a Bogardus-type social distance scale (Bogardus, 1925). A question-
naire was constructed that incorporated seven social distance items in
a binary choice format (see Appendix). AU of these were then paired
with three ethnic groups: Black, Mexican-American, and Oriental. By
having members of the three ethnic minority groups, in addition to
Anglos, responding to the questionnaire, it was felt that the ordering
of the items would not only group together items referring to the same
ethnic group, hut would also serve to cluster the individuals «ith
regard to ethnic group membership.
fte 21-item social distance questionnaire was administered to
cUf undergraduates at the University of Southern California, wbo par-
ticipated in the fulfillment of cjrse requirements. Prior to the
administration, subjects were asked to consider the general image of
ethnic groups other than their own. To assure compliance with this
request, subjects were asked to construct a written outline listing
several key descriptors of each group. Once this preliminary task was
50
51
completed, the subjects were Instructed to keep in mind the Images
rather than a specific individual vhen responding to the social dis-
tance items, This was done to maximize the number of resulting
response patterns. Of the 9k respondents, 60 gave non-duplicate
response patterns for the 21 items. Ethnic composition of the 60
respondents was as follows: six Mexican-Americans, eight Blacks, four-
teen Orientals, and thirty-two Anglos.
Results
The dominance matrix, final consistency matrix, and reduced
chain by item membership matrix calculated at a minimum consistency of
• 95 are presented in the Appendix. The thirteen nonredundant chains
were subjected to the chain selection proced^e, which reduced to seven
the number of chains necessary to account for all the items. The
reordering of the seven chains followed the previously described pro-
cedural steps of first maximizing the number of unique items and in
the case of a tie selecting the chain with the fewest number of over-
lapping items. The summary matrix for the reordered set of seven
chains containing the number of unique items added in the diagonal as
well as to their rank order intercorrelations (see Table 11).
As suggested, the issue of limiting the number of chains or
dimensions to those considered "significant" is resolved by the appli-
cation of a scree-type procedure to the respective number cf unique
items added. In doing so, the apparent cutoff is the third chain, as
the fourth chain adds only 2 items to the 16 already accounted for by

52
Table 11
Sumaary Matrix for 60 Person by 21 Item Social Distance Data
Chains
X XI I VIII XIV XVIII IX
X 7 .18 .Ik .16 .76 •70 •17
XI .20 5 .15 .72 .18 .19 .12
3 l
§ m
.12 .16 k .12 .14 .22 .89
.17 M .2k 2 .10 .15 .12
XIV .kQ .07 .21 .16 1 • Ik .16
XVII A9 .11 .25 .26 •53 1 .2k
IX .18 .10 ■ 53 •3* .1.2 •39 1
Note. Tau a values between comply»? item-chains are in upper triangular portion. In lover triangular portion are tau a values for scores computed from number of unique items added by that chain, which appears in the diagonal.

- —"T-WT^ i .Hg'PfjP^P^P ' i i H I I I I H ||)W|H^
53
the first three chains. The items of which the three chains are com-
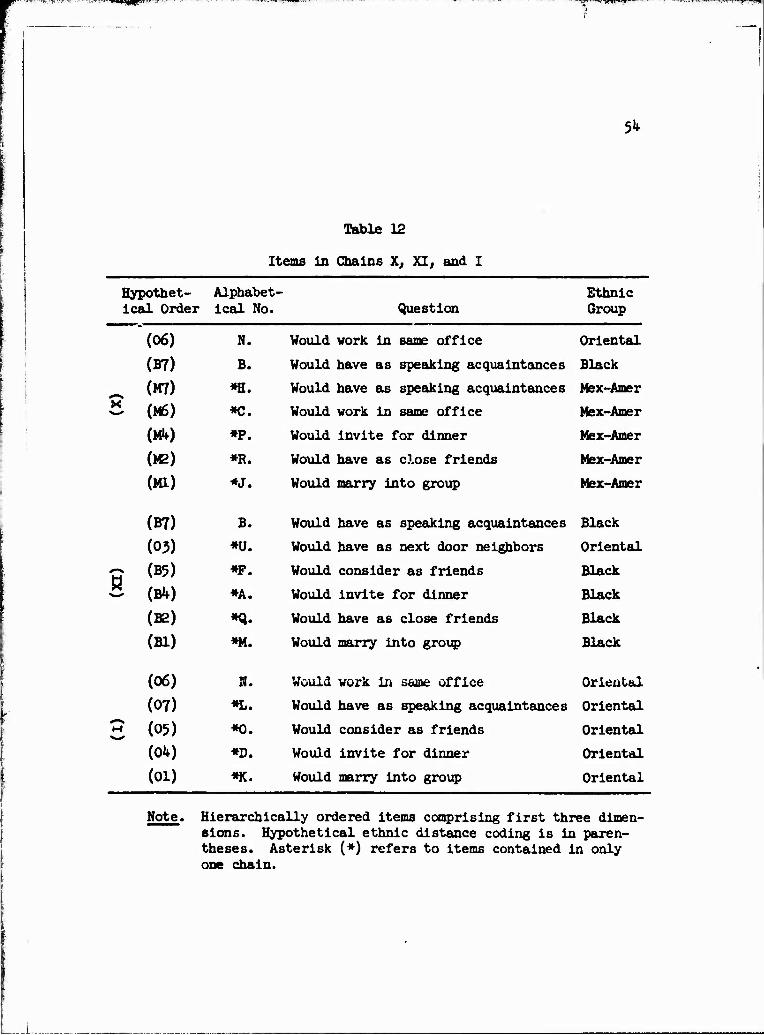
posed are listed in hierarchical order in Table 12.
As seen in Table 12, the consistency of the ethnic group refer-
enced within the vhree chains, with a few exceptions, namely items K
and ii in chain X and item U in chain XI, is apparent. Chain X is
composed of items illustrating a social distance scale for Mexican-
Americans, as are chain XI for Blacks and chain I for Orientals. Thus,
the correspondence of the three item chains to each of the three ethnic
groups reflects favorably on the chain selection procedures. However,
the existence of the exceptions within chains X anc XI does not allow
for a clear definition of an individual's social dj stance specific to
an ethnic group. In an attempt to resolve this situation, the over-
lapping items, that is, items contained in more than one chain, are
eliminated. The remaining fourteen unique items (as denoted by an
asterisk [*] in Table 12) still contain one inconsistent item, item U
in chain XI
The appropriateness of the resulting solution can be illus-
trated by comparing the recovered hierarchical groupings of items
(Table 12) to the proposed hypothetical ordering of social distance
items. Except, of course, for the one inconsistent item, U, in chain
XI, ehe ordering of the unique items within each chain corresponds
closely with the hypothetical ordering. In fact, the only exception
is the reversal of items 06 and 07 in chain I. Therefore, aside from
a few minor flaws, both the homogeneity of scales and the ordering of
items within scales resulting from the ERGO procedure would appear
quite reasonable.
5^
Table 12
Items in Chains X, XI, and I
Hypothet- ical Order
Alphabet- ical No. Question
Ethnic Group
x
Would work in sane office Oriental
Would have as speaking acquaintances Black
Would have as speaking acquaintances Mex-Amer
Would work in sane office Mex-Amer
Would invite for dinner Mex-Amer
Would have as close friends Mex-Amer
Would marry into group Mex-Amer
(06) N.
(B7) B.
(M7) *H.
(M6) *C.
<*) *P.
(M2) »R.
(Ml) *J.
(B7) B.
(03) *U.
(B5) *F.
(I*) *A.
(B2) *Q. (Bl) *M.
(06) N.
(07) *L.
(05) «0. (ok) *D.
(01) *K.
Would have as speaking acquaintances Black
Would have as next door neighbors Oriental
Would consider as friends Black
Would invite for dinner Black
Would have as close friends Black
Would marry into group Black
Would work in same office Oriental
Would have as speaking acquaintances Oriental
Would consider as friends Oriental
Would invite for dinner Oriental
Mould marry into group Oriental
Note. Hierarchically ordered items comprising first three dimen- sions. Hypothetical ethnic distance coding is in paren- theses. Asterisk (*) refers to items contained in only one chain.

1 "" p ■llfJJ'J»*.*
55
The further evaluation of the ERGO procedure, the clustering of
individuals into their appropriate ethnic groups, is realized in terms
of their scores (see Appendix). As would be expected, every ethnic
group member endorsed all the items referring to his group. More
Important, however, is the direct correspondence of an individual's
score to his relative position on the unidimensional constructs, there-
by permitting ease of interpretation. This fact, combined with the
developmental interpretation stemming from the notion of logical pre-
requisites underlying Guttman orders, adds further clarity to the sub-
stantive interpretability of person scores.
To illustrate, the scores for the first Anglo (l 3 2) can be
directly interpreted as the subject's social distance relative to the
three ethnic groups. Thus, the score of 1 for the first chain (X)
composed of the Mexican-American items corresponds to item M7 (would
have as speaking acquaintances). Similarly, the score of 3 on the
chain referring to Blacks (XI) indicates item B4 (would invite for
dinner), while the score of 2 on the Oriental item chain (i) corres-
ponds to item 05 (would consider as friends). The endorsement of the
items below the score level designated is assumed, thereby giving a
more precise meaning to the scores. The developmental notion of pre-
requisites corresponds to the previously suggested positioning of
people and items on the same unidimensional scale. This dual position-
ing allows for both persons and items to be considered in relation to
each other, yielding an increase in the number of relationships that
are directly observable.
■wap^nyaqgffWWWflW
56
However, in the case of inconsistency, which appears as the
endorsement of an item without the endorsement of its prerequisite,
the question of what score level is most appropriate may be raised.
In this example, it was assumed that the failure to positively endorse
an item precluded consideration of other endorsements further along in
the hierarchy. This highly simplistic approach to scoring (for these
particular data) did not suffer from multiple errors, which are de-
fined as the occurrence of endorsements of more than one item without
the necessary endorsement of some prerequisite. For data involving
instances where multiple errors do exist, more sophisticated types of
scoring procedures involving probabilistic evaluation of the individu-
al's response pattern need to be developed.
The overall evaluation of the results appears favorable. The
identification of hierarchically graded orders within the three ethnic
groups would verify this. In addition to the resulting ethnic-item
hierarchies, the case of interpretation of person scores along the
recovered ethnic dimensions suggests ERGO to be a viable method for
recovering dimensions in dichotomous items. The implications of com-
bining persons and items on the same scale, thereby permitting the
direct evaluation of person-item relationships, present the researcher
with many interesting possibilities, especially those involving
developmental relationships. Moreover, it is this knowledge of both
the person and item relations that has practical as well as theoretical
importance.

_ _ . ....... ... i »i M—iw'nii"i "P'i mm ' " ■ll1"1" WMH
SUtMABY
A method of factor extraction specific to a binary matrix,
Illustrated here as a person-by-item response matrix, has been pre-
sented. The extraction procedure, termed ERGO, differs from the more
commonly implemented dimensionallzing techniques, factor analysis and
multidimensional scaling, by taking into consideration item difficulty.
Utilized in the ERGO procedure is the calculation of a dominance matrix
vhich, for either persons or items, has the important attribute of
allowing directionality to be inferred between relations.
The theory underlying ERGO is founded in ordering theory
(Airasiun & Bart, 1972), with its interpretation of dominance relations
following logical implicatives similar to Boolean algebra. The re-
definition of dimensionality using both the notion of dominance rela-
tions and that of logical prerequisites can more aptly be identified
with the definition of a Guttman order, thereby placing emphasis on the
developmental aspects of recovered sets of dimensions. It is this
interpretation that allows for the duality of relationships between
persons and items. The resulting placement of both persons and items
on the same unidimensional construct presents the researcher with the
opportunity to observe direct relations between the two.
57
58
A preliminary attempt to utilize the apparent advantages asso-
ciated with the extraction procedure based on dominance relations,
order analysis (Krus, Bart, & Airasian, 1975) is used. This is done
both to further explicate the implications of ordering theory as well
as to point out the issues with which a dimensionalizing procedure of
this type must concern itself. In this discussion, the procedural
shortcomings of order analysis are presented to acquaint the reader
with the obstacles that an alternative approach must overcome. Pre-
mier among these is the failure of order analysis to consider the true
nature of multidimensionality in a dominance matrix context. This
appears in the order analytic assumption that counter dominance rela-
tions are merely a product of error, rather than being manifestations
of the multidimensional nature of the data. The alternative procedure
(ERGO) is developed by dealing with this essential point.
The key to the dimension extraction problem of ERGO rests in
the formulation of an index of dimension consistency that is comparable
to classical measures such as the Kuder-Richardson formulae (1937) anrl
the Loevinger homogeneity indices (1947). Cliff (1975b), by demon-
strating the relation between these classical indices and their
redefinition in a dominance matrix context, lays the foundation for the
development of an alternative procedure. Thus, by adopting a consist-
ency measure developed there, ERGO itcrativcly adds itcma together,
resulting in the construction of various sets of impiicative chains
representing dimensions. Having constructed these chains, the ERGO
procedure orders the chains in terms of maximal number of items
T**''"- -'»■■ ■.ITW-.g^''""-'^ 1)111,^*1^1. T™«.«» fjll UI.UII,|L|iII.J|WJfPWl^
59
contributed. The chain evaluation procedure can best be explained as
an attempt to maximize the number of items accounted for in a given
dimensional solution.
To give additional understanding of both the ERGO process and
the potential advantages a procedure of this type offers, an empirical
example which utilizes social distance items (Bogardus, 1925) paired
individually with three ethnic groups was analyzed for respondents
representing four ethnic groups. Emphasized in the solution was the
duality of relationships inherent in a procedure such as this, that is
based upon the principles underlying Guttman orders. The results
demonstrated the ability of ERGO to (l) group items referring to the
same ethnic group; (2) uncover hierarchically graded orders within
each chain; (}) select the three chains that corresponded to the three
ethnic groups; and (k) cluster individuals by ethnic group according
to their scores.
In summary, the ERGO procedure, based on the uncovering of
logical relationships within the context of a dominance relation and
postulated in ordering theory (Airasian & Bart, 1972), has been pro-
posed. The rationale, upon which a dimension extraction procedure
specific to a binary matrix is based, is accomplished by demonstrating
the shortcomings of currently implemented procedures. Given the
shortcomings and a definition of the problems confronting a procedure
whose goal is to analyze the dimensionality of a dominance matrix, an

60
alternative procedure, ERGO, is presented. In applying the ERGO pro-
cedure to well-known social distance type items (Bogardus, 1925)*
empirical validation of the procedure was attained.

REFERENCES
61
H£WW*i-,>'E¥*»?!? W^SF. -T?
REFERENCES
Airasian, P., & Bart, W. Ordering theory: A new and useful measure- ment model, Educational Technology, 1972, 1£, 56-6O.
Bogardus, E. S. Measuring social distances. Journal of Applied Sociology, 1925, 2, 38>393.
Coombs, C. H. A theory of data. New York: Wiley, I96U.
Coombs, C. H., Dowes, R. M., & Tversky, A. Mathematical psychology: An elementary introduction. Englewood Cliffs, N.J.: Prentice- Hall, 1970.
Cliff, N. Complete orders from incomplete data: Interactive ordering and tailored testing. Psychological Bulletin, 1975, 82(2), 239- 302. (a)
Cliff, N. A basic test theory generalizable to tailored testing (MR No. 150-373* Tech. Rep. No. 1). Los Angeles: University of Southern California, 1975. (b)
Guilford, J. P. Psychometric methods (2nd ed.). New York: McGraw- Hill, 195^.
Guttman, L. A. A basis for scaling qualitative data. American Sociological Review, 19Wf, £, I39-15O.
Earary, F., Norman, R., & Cartwright, D. Structural models: An introduction to the theory of directed graphs. Nev York: Wiley, I90T:
Horst, P. Factor analysis of data matrices. New York: Holt, I965.
Kaiser, H. F. The varimax criterion for analytic rotation in factor analysis. Psychometrika, 1953, £2, 187-200.
Kendall, M. G. Rank correlation methods. London: Griffin & Company, 1962.
Krus, D. J. Order analysis of binary data matrices. Los Angeles: Bieta Press, 1971*«
Krus, D. J., & Bart, W. M. An ordering-theoretic method of multi- dimensional scaling of items. Educational and Psychological Measurement, 197^> 3ji> 525-535-
62
..ii*>JNpi£yNyw' ■ ~».jgmii»— WMHW
63
Krus, D. J., Bart, W. M., & Airasian, P. W. Ordering theory and methods. Los Angeles: Theta Press, 1973«
Kuder, G. F., & Richardson, M. W. The theory of the estimation of test reliability. Psychometrika, 1937, 2, 151-160.
Lazerfeld, P. F. Latent structure analysis. In S. Koch (Ed.), Psychology: A study of a science (Vol. 3)« New York: McGraw,
Levy, P. On the relation between test theory and psychology. In P. KLine (Ed.), New approaches in psychological measurement. New York: Wiley, 1973-
Loevinger, J. A systematic approach to the construction and evalua- tion of test of ability. Psychological Monographs, 19^7, 61(k, Whole No. 285).
McNemar, Q. Note on the sampling error cf the difference between correlated proportions or percentages. Psychometrika, 19**7> 12,
153-157-
Russell, B. Introduction to mathematical psychology (1919)- New York: Simon 4 Schuster, 1971.
Shepard, R. N. The analysis of proximities: Multidimensional scaling with an unknown distance function, I. Psychometrika. 1962, 2J, 125-lMO.
Spearman, C. General intelligence objectively determined and meas- ured. American Journal of Psychology, 190k, 15_, 201-292.
Torgerson, W. S. Theory and methods of scaling. New York: Wiley, 1958.

APPENDIX
6k
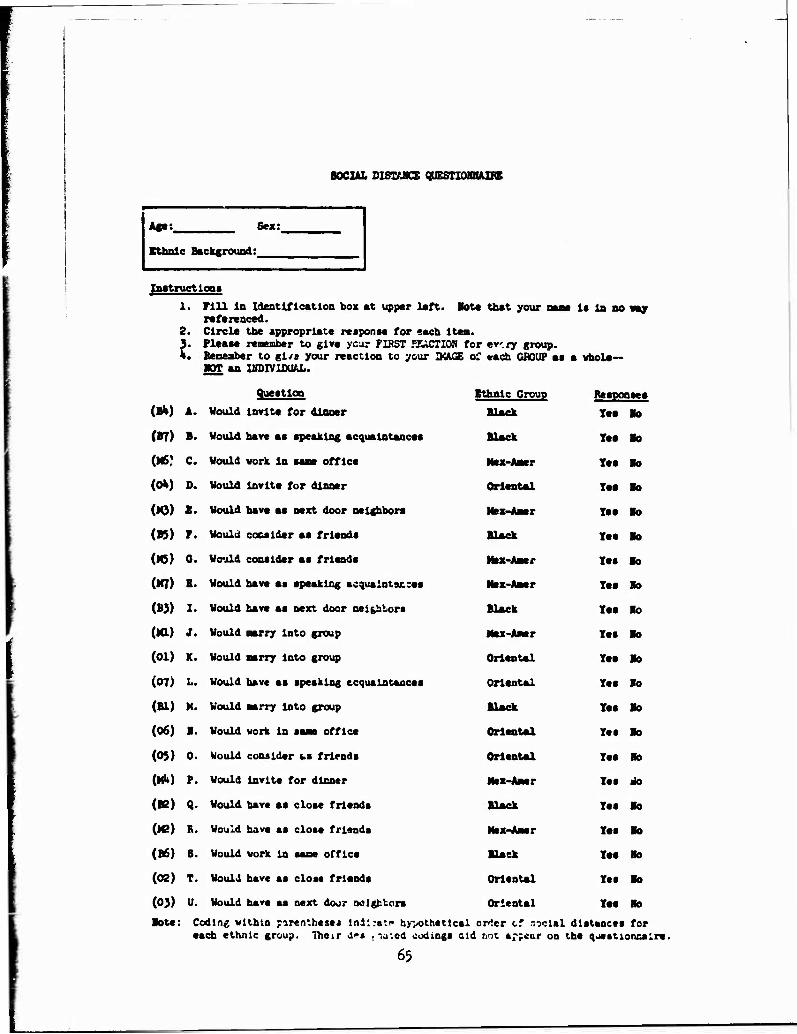
SOCIAL DISTANZ QUESTIOIBAIHB
Am: Sex:
Xthnlc Background
Instructions
1. Fill la Identification box at upper left, lote that your referenced.
2. Circle the appropriate response for «aeb ltea. 3. Please remember to give year FIRST REACTION for ev.ry group
Is In no way
Beneaiber to gi/s your reaction to your IMAGE of «ach CROUP as a vhole- MOT aa INDIVIDUAL.
Question
(B"0 A. Would invite for dinner
(B7) B. Would have as speaking acquaintances
(M6J C. Would work In sane office
(OV) D. Would Invite for dinner
(M3) *• Would have as next door neighbors
(B5) P. Would consider as friends
(16) 0. Would consider as friends
(MT) H. Would have as speaking acquaintatzen
(B3) I* Would have as next door neighbors
(ML) J. Would marry Into group
(01) K. Would marry Into group
(07) L. Would have as speaking acquaintances
(Bl) M. Would marry Into group
(06) I. Would work In same office
(OJ) 0. Would consider t>s friends
(HU) P. Would Invite for dinner
(B2) Q. Would have as close friends
(M2) R. Would have as close friends
(B6) S. Would vork In ease office
(02) T. Would have as close friends
(03) U. Would have as next door neighbors
lote:
Ethnic Croup
Black
Mex-Aaer
Oriental
Mex-Aaer
Black
Mex-Aaer
Mex-Aaer
Black
Max-Aner
Oriental
Oriental
Black
Oriental
Oriental
Mex-Aaer
Black
Mex-Aaer
Black
Oriental
Oriental
Response«
Tea lo
Tea Bo
Tes lo
les ■0
Tea lo
Tee lo
Tea lo
Tea lo
Tes ■0
Tes lo
Tes lo
Tes Bo
Tes lo
Tes lb
Tes lo
Tes do
Tes lo
Tes lo
Tes Bo
Tes ■0
Tes lo
Coding within parentheses lni::ste hypothetical orter cf .-.octal distances for each ethnic group. Their 4»« .-,j-.cd codings cid not a^;ear on the questionnaire.
65
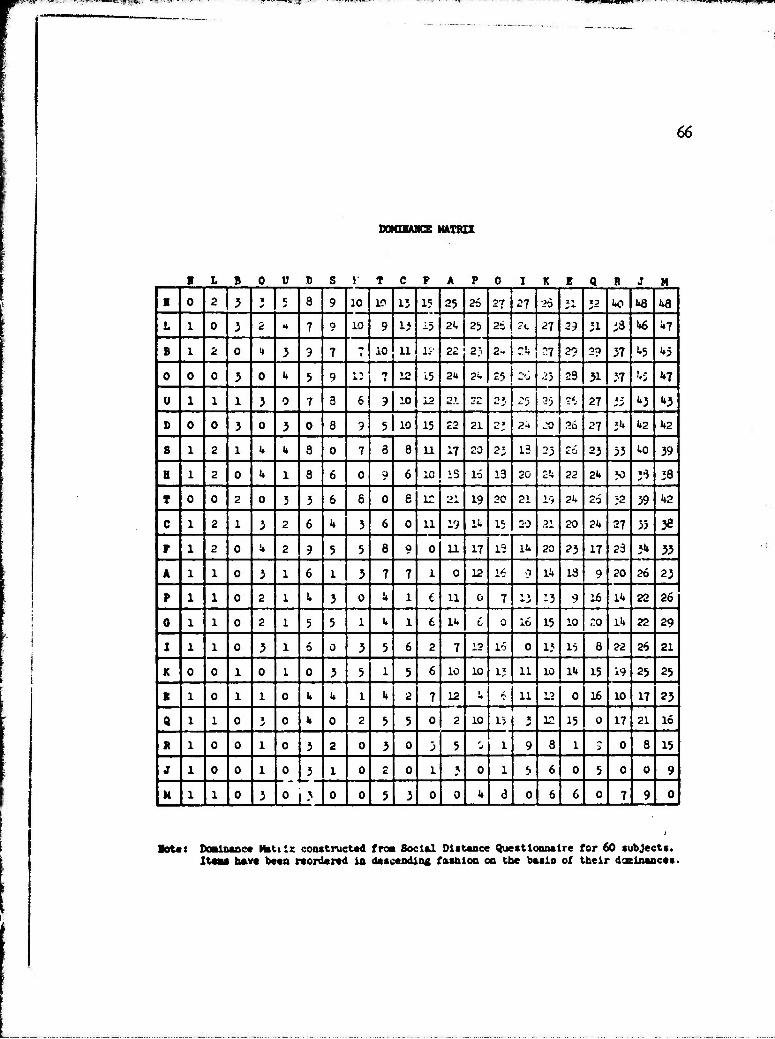
66
DOKHAHCB MATRIX
1 L B 0 0 D S J T c F A P c I K E Q R J M
1 0 2 3 * 5 8 9 10 10 15 15 25 26 2? 27 25 11 **■*■
«5 k» 1*8 1*8
L 1 0 3 2 <t 7 9 10 9 i < 15 21. 25 26 ?t 27 29 31 ;3 >*6 1*7
B 1 2 0 '4 *> 9 7 t 10 11 i:- 22 2"> 2- -!7 2? 2? 37 fc5 <*5
0 0 0 3 0 i* 5 9 i: 1 12 15 2i» 21. 25 2'J •i3 23 31 37 «.5 1*7
U 1 1 1 3 0 7 3 6 9 10 12 21 Ct» 2», 25 ?<. 27 a: "»3 *J
D 0 0 3 0 3 0 8 9 5 10 15 22 21 *?» 24 JO 26 27 * 1*2 1*2
S 1 2 1 1» 4 8 0 7 3 3 11 17 20 13 23 26 23 33 UO 39
H 1 2 0 u 1 8 6 0 9 6 1C 15 16 13 20 2h 22 2k 30 3* 38
T 0 0 2 0 3 3 6 6 0 e 12 21 19 20 21 19 2K 26 i2 39 1*2
C 1 2 1 3 2 6 i» 3 6 0 11 19 It 15 20 21 20 21* 27 35 3e T 1 2 0 !* 2 9 5 5 8 o 0 U 17 IS 11. 20 23 17 23 3«* 33
A 1 1 0 3 1 6 1 3 7 7 1 0 12 16 0 lfc 18 9 20 26 23
P 1 1 0 2 1 1* 3 0 it 1 6 11 0 7 13 9 16 11* 22 26
0 1 1 0 2 1 5 5 1 L 1 6 1«. c 0 16 15 10 20 11* 22 29
I 1 1 0 3 1 5 0 3 5 6 2 7 12 16 0 13 15 6 22 26 21
K 0 0 1 0 1 0 3 5 1 5 6 10 10 1? 11 10 1U 15 19 25 25
E 1 0 1 1 0 I» i» I l» 2 7 12 V t. 11 12 0 16 10 17 23
Q 1 1 0 * J 0 l» 0 2 3 5 0 2 10 15 12 15 0 17 21 16
R 1 0 0 1 0 3 2 0 3 0 3 5 V 1 9 8 1 3 0 8 15
J 1 0 0 1 0 3 1 0 2 0 1 j 0 1 s 6 0 5 0 0 9
M 1 1 0 3 o >
0 0 5 3 0 0 1» 3 0 6 6 0 7 9 0
lot«: Dominance Matiix constructed fro« Social Distance Questionnaire for 60 subjects. Iteas have been reordered In descending fashion on the basis of their dominances.
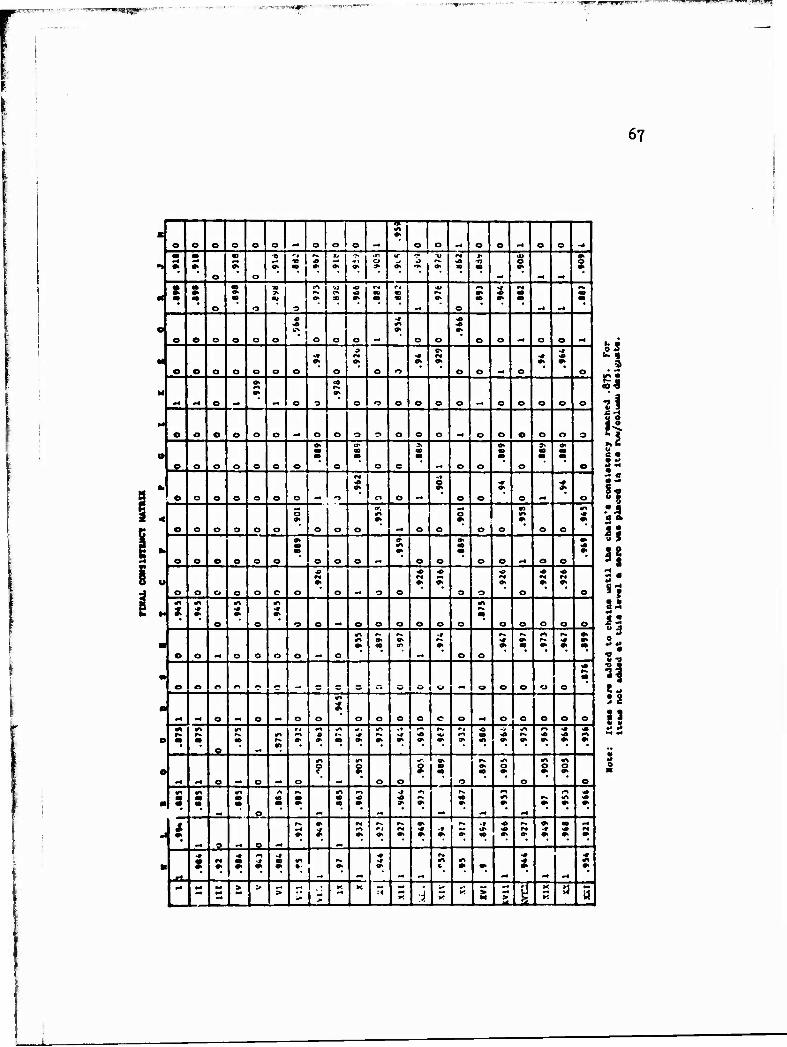
67
I
o o -#
«■3
38
e ■ Si
if 38
u J
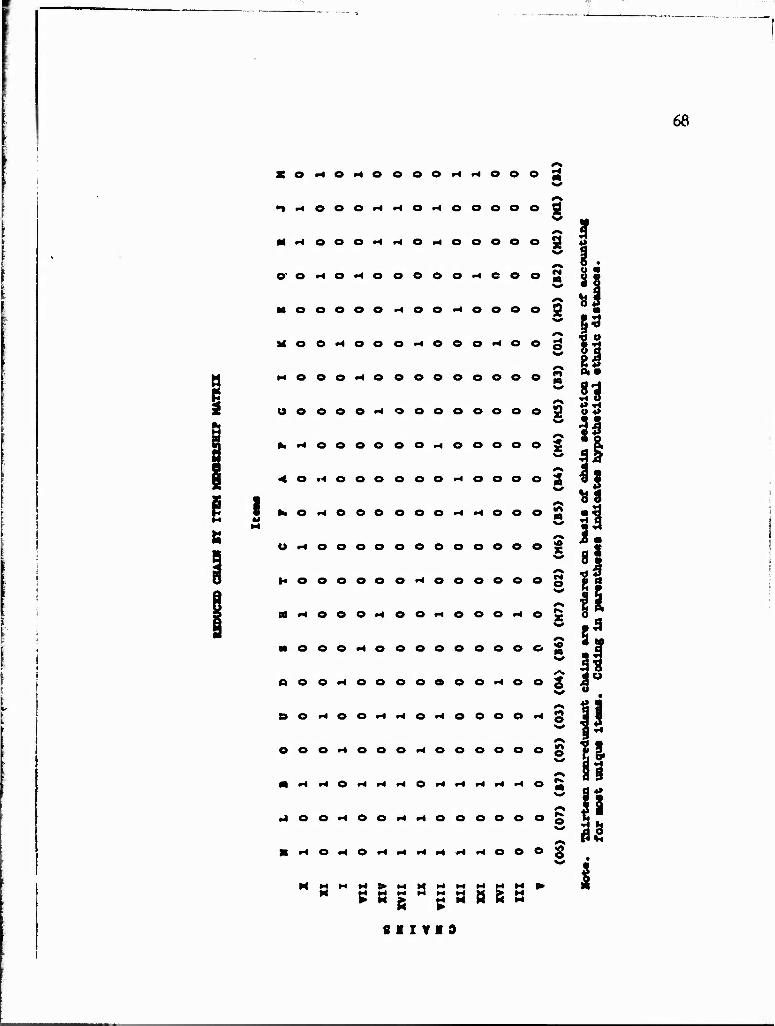
X O H O O *4 *4 O O
« *4 O
©" O
o o
0*4HO<-400000 d O
0*4*40*400000 9 o *400000*4C00 2
00*400*40000 g
MOO*4000*4000*400 g
MO0O*4O00000000 n A«
00000*4 000000
0000*400000
< o •4 000000*40000^
M I . 0 0 0 0 0 0*4 o o
0*4000000000000
H000000*4000000
■ «4000*400*4000*40
o o o oooooooo
000*40000000*40
X
*x <©
3
00*4*40*40000
o o 00*4000000
*4*40*4*4*40*4*4*4*4*4 ; if >*■ a S
»a o o o o o o
aMS5gagaSS3 8 I X VI3
s
68
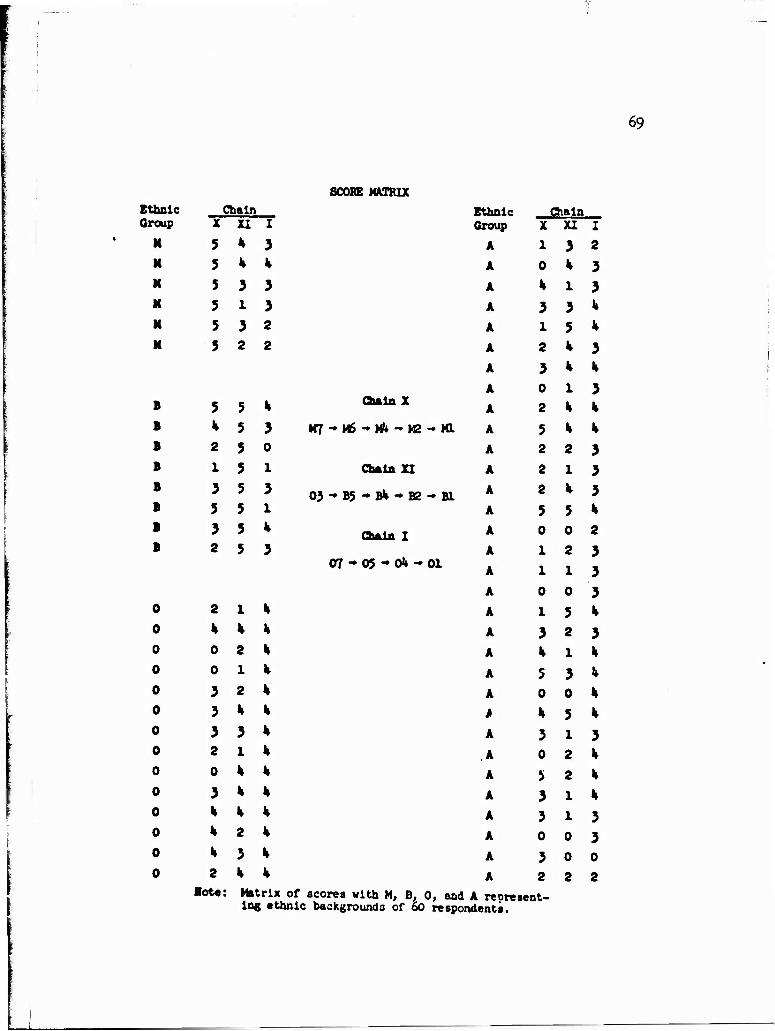
69
SCORE MATRIX Ethnic Group
II
M
If
N
If
It
0
0
0
0
0
0
0
0
0
0
0
0
0
0
Chain X
5 k
2
I
3 5 3 2
2
K
0
0
3 3 3 2
0
3
K
k
2
XI
2
1
I 2
1
2
%
3 1
%
k 2
3
I
3 %
3 3 2
2
lot«: Mtttr
Chain X
H7-»H5-Mfc-M2-KL
Chain XI
03-R5-Bfc-B2-Bl
Chain I
07 - 05 - 04 -» 01
Ethnic Group
A
A
A
A
A
A
A
A
A
A
A
A
A
A
A
A
A
A
A
A
A
A
A
j>
A
A
A
A
A
A
A
A
Chain X
1
0
k
3 l
2
3 0
2
5 2
2
2
5 0
1
1
0
1
3
5 0
3 0
5 3 3 o 3 2
XI
3
l
3 5
1
k
k
2
1
5 0
2
1
0
5 2
1
3 0
5 1
2
2
1
1
0
0
2
I 2
0
2 x of scores with M, B4 0, and A represent- — ---.»- ■•« i-ij u. V; OLUU A JXO
log ethnic backgrounds of 60 respondents


