

Confidential www.GrayAssociates.com 1 Confidential
Best Practices in Program Research: Employer Demand
March 2, 2017

Confidential www.GrayAssociates.com 2
Evaluating Markets for Programs Best-practices: inclusive process with sound data on four topics.
Student Demand
February 2
Employment March 2
Degree Fit
March 30
Competitive
Intensity March 30
Decision-Making Process April 22

Confidential www.GrayAssociates.com 3
Evaluating Markets for Programs Best-practices: inclusive process with sound data on four topics.
Student Demand
February 2
Employment March 2
Degree Fit
March 30
Competitive
Intensity March 30
Decision-Making Process April 22

Confidential www.GrayAssociates.com 4
The Bureau of Labor Statistics BLS is a primary source and its employment data is easy to access.
Confidential www.GrayAssociates.com 5
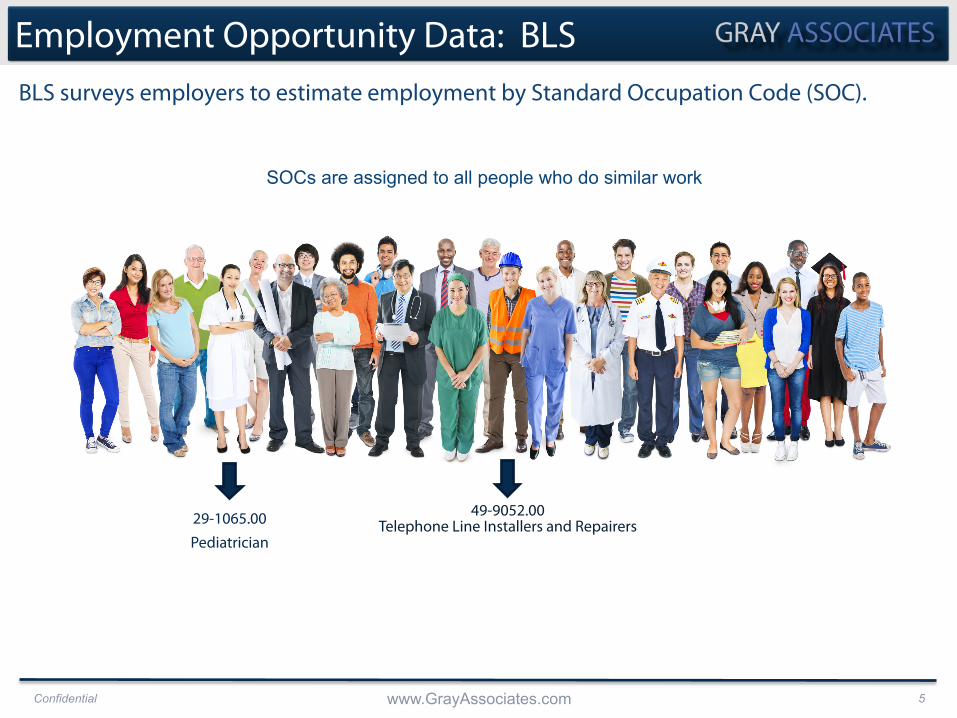
Employment Opportunity Data: BLS BLS surveys employers to estimate employment by Standard Occupation Code (SOC).
SOCs are assigned to all people who do similar work
49-9052.00 Telephone Line Installers and Repairers 29-1065.00
Pediatrician

Confidential www.GrayAssociates.com 6
NCES crosswalks intentionally draw a tight link between programs and SOCs.
NCES Crosswalks
History, General CIP 54.0101
Managers, All Other SOC 11-9199
Historians SOC 19-3093
Source: National Center for Education Statistics: SOC 2010 mapped to CIP.
History Teachers, Postsecondary SOC 25-1125
Secondary School Teachers, Except Special and Career/Technical Education
SOC 25-2031

Confidential www.GrayAssociates.com 7
1 4
462
-
50
100
150
200
250
300
350
400
450
500
CIPs (Programs) NCES Matched SOCs Actual Employment: SOCs
Count of Programs and Occupations CIP 54.0101 History, General
Reality: Loose Alignment, especially for Liberal Arts
NCES Crosswalks
Source: U.S. Census Bureau; Gray analysis of over 2.0 million records.

Confidential www.GrayAssociates.com 8
Even for one program, occupations are very diverse—from CEO to salesperson.
ACS Actual Fields of Employment
11% 7%
4% 4%
3% 2%
2% 2% 2% 2% 1% 1% 1% 1% 1% 1% 1% 1% 1% 1%
0% 5% 10% 15%
Lawyers, Judges, other Judicial Teachers: Elem. & Mid. School
Postsecondary Teachers Miscellaneous Managers
Secondary School Teachers Education Administrators
Chief Executives and Legislators Clergy
Retail Salespersons First-line Supervisors: Retail
Administrative Assistants Management Analysts
Sales Reps, Wholesale and Manufacturing Accountants and Auditors
Librarians Physicians and Surgeons
First-line Supervisors: Non-Retail Sales Customer Service Representatives
Financial Managers General and Operations Managers
What do History Majors Really Do?
Percentage of History Majors by Occupation
High Status Education
Other

Confidential www.GrayAssociates.com 9
85% of BLS projected growth rates are off by 50% or more.
BLS Forecast Accuracy
2% 3%
10%
21% 23% 23%
19%
0%
5%
10%
15%
20%
25%
<10% 10-25% 25-50% 50-75% 75-100% 100-150% 150+
Percentage of SOCs
Percentage Error
BLS Forecast Error Actual Employment vs. Projected Employment Growth
2012-2015
Source: BLS Occupational Employment Statistics and BLS Employment Projections 2012-2022. Note: BLS forecasts are for 2022. BLS 2012 base and annual growth rate vs. actual growth from 2012 to 2015.

Confidential www.GrayAssociates.com 10
BLS Occupational Outlook Handbook
Confidential www.GrayAssociates.com 11
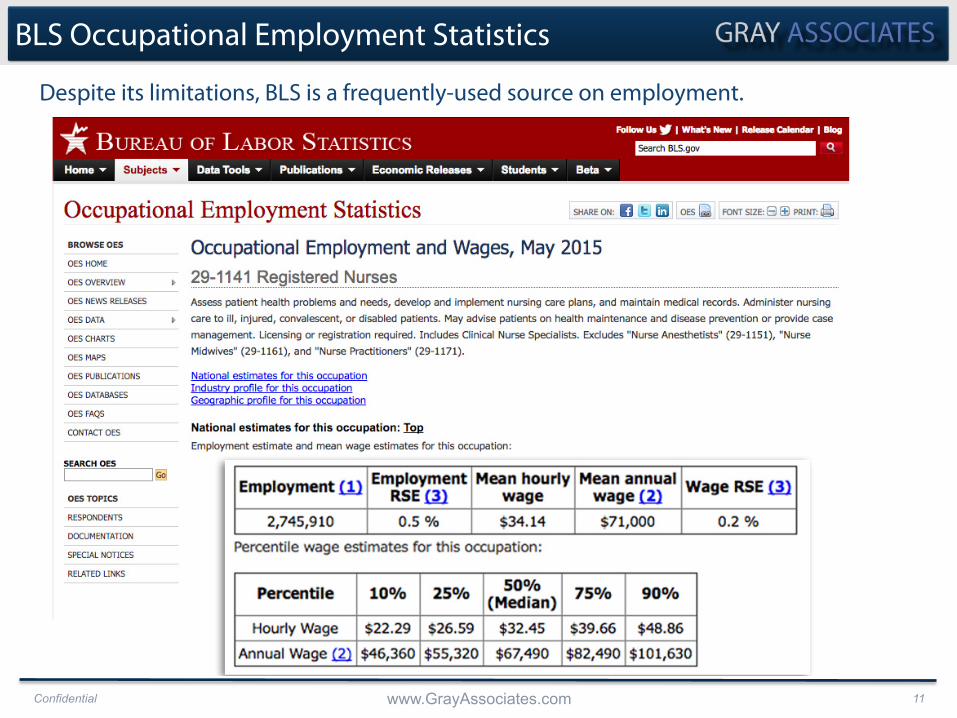
BLS Occupational Employment Statistics
Despite its limitations, BLS is a frequently-used source on employment.

Confidential www.GrayAssociates.com 12
BLS 10th-Percentile Wages
Wage profiles by occupation are available from BLS.
$57,480
$81,350
$119,280
$168,390
0
20,000
40,000
60,000
80,000
100,000
120,000
140,000
160,000
180,000
10th Percentile 25th Percentile Median 75th Percentile
BLS Wages
Wages by Percentile Marketing and Sales Manager 11-2020.00
Source: BLS Occupational Employment Statistics: http://www.bls.gov/oes

Confidential www.GrayAssociates.com 13
Educational Attainment of Workers By SOC
Educational attainment indicates the degree level needed in the occupation.

Confidential www.GrayAssociates.com 14
Placement Rates
Placement rates by program highlight the employability of program graduates.

Confidential www.GrayAssociates.com 15
Placement Rates
Regulations require many institutions to disclose placement rates on their websites.

Confidential www.GrayAssociates.com 16
Job Postings: Employer-Site or Total?
Job-posting data come from three sources, which vary in quality.
Job Sites
Recruiters
Employers ✔

Confidential www.GrayAssociates.com 17
Job Postings Data
Job postings are available from Burning Glass, CEB TalentNeuron, and others.
Confidential www.GrayAssociates.com 18
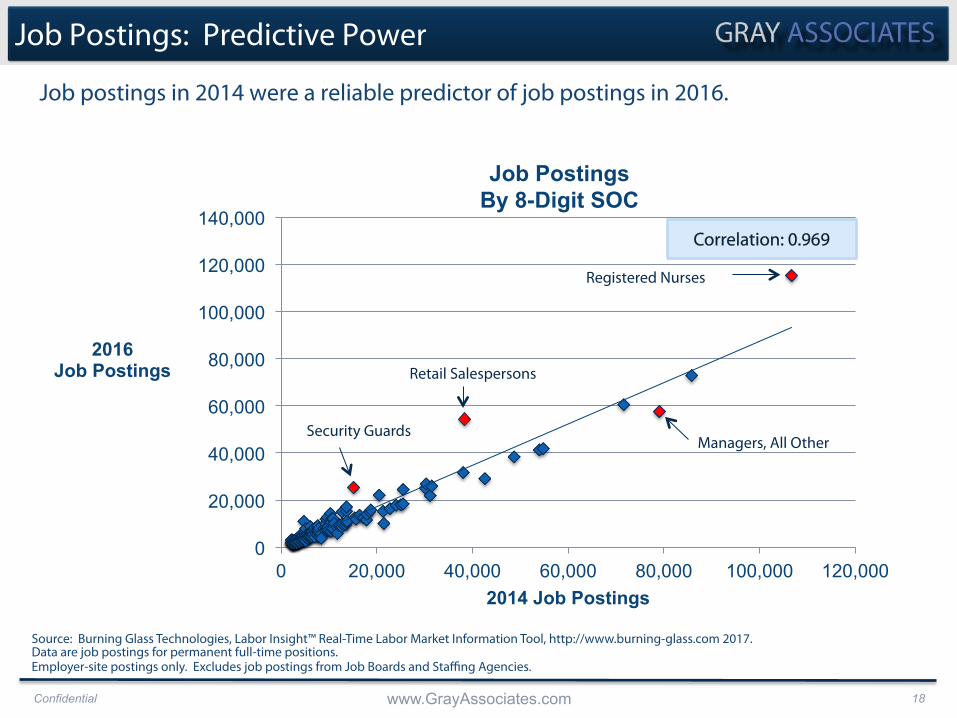
Job postings in 2014 were a reliable predictor of job postings in 2016.
Job Postings: Predictive Power
0
20,000
40,000
60,000
80,000
100,000
120,000
140,000
0 20,000 40,000 60,000 80,000 100,000 120,000
2016 Job Postings
2014 Job Postings
Job Postings By 8-Digit SOC
Source: Burning Glass Technologies, Labor Insight™ Real-Time Labor Market Information Tool, http://www.burning-glass.com 2017. Data are job postings for permanent full-time positions. Employer-site postings only. Excludes job postings from Job Boards and Staffing Agencies.
Correlation: 0.969
Registered Nurses
Retail Salespersons
Managers, All Other Security Guards

Confidential www.GrayAssociates.com 19
Data for a single program is a challenge to interpret.
Data Interpretation
New Job Postings: 153,611
?

Confidential www.GrayAssociates.com 20
0% 10% 20% 30% 40% 50% 60% 70% 80% 90%
100%
Percentiles and color codes aide interpretation.
Data Interpretation
New Job Postings Percentiles for all Programs
N =1,000
Program 1: 153,611
Program 800: 10,000
Program Percentile

Confidential www.GrayAssociates.com 21
Interpreting employment information requires a context.
Employment Data: Interpretation

Confidential www.GrayAssociates.com 22
Agenda
1. Employment Opportunity Data: Sources, Uses, and Limitations
2. U.S. Employment Trends: Job Postings

Confidential www.GrayAssociates.com 23
10%
3%
0%
-2%
-10% 0% 10% 20%
High school or vocational training
Associate's degree
Graduate or professional degree
Bachelor's degree
2016 YoY Change in Job Postings* (January through December)
Job Postings: Required Degree Level
National Job Postings illustrate degree requirements and trends.
Source: Data from Burning Glass Technologies, Labor Insight™ Real-Time Labor Market Information Tool, http://www.burning-glass.com 2017. Data are job postings for permanent full-time positions. Employer-site postings only. Excludes job postings from Job Boards and Staffing Agencies.

Confidential www.GrayAssociates.com 24
Job Postings: Geographic Density
Employment is a very local phenomenon, led by the West Coast.
Source: Data from Burning Glass Technologies, Labor Insight™ Real-Time Labor Market Information Tool, http://www.burning-glass.com 2017. Data are job postings for permanent full-time positions. Employer-site postings only. Excludes job postings from Job Boards and Staffing Agencies.
Map circle size represents ratio of job postings to employed population.
Metro Area Job Pos-ngs per 10,000 people employed
Portland-‐Vancouver-‐Hillsboro 307
San Francisco-‐Oakland-‐Hayward 301
Sea>le-‐Tacoma-‐Bellevue, 275
Denver-‐Aurora-‐Lakewood, 259
Washington-‐Arlington-‐Alexandria 256
Atlanta-‐Sandy Springs-‐Roswell 230
Dallas-‐Fort Worth-‐Arlington 219
Phoenix-‐Mesa-‐Sco>sdale 209
Boston-‐Cambridge-‐Nashua 195
Philadelphia-‐Camden-‐Wilmington 189
New York-‐Newark-‐Jersey City 159
Los Angeles-‐Long Beach-‐Anaheim 148
Houston-‐The Woodlands-‐Sugar Land 146
Chicago-‐Naperville-‐Elgin, 139
Miami-‐Fort Lauderdale-‐West Palm Beach 135
Confidential www.GrayAssociates.com 25
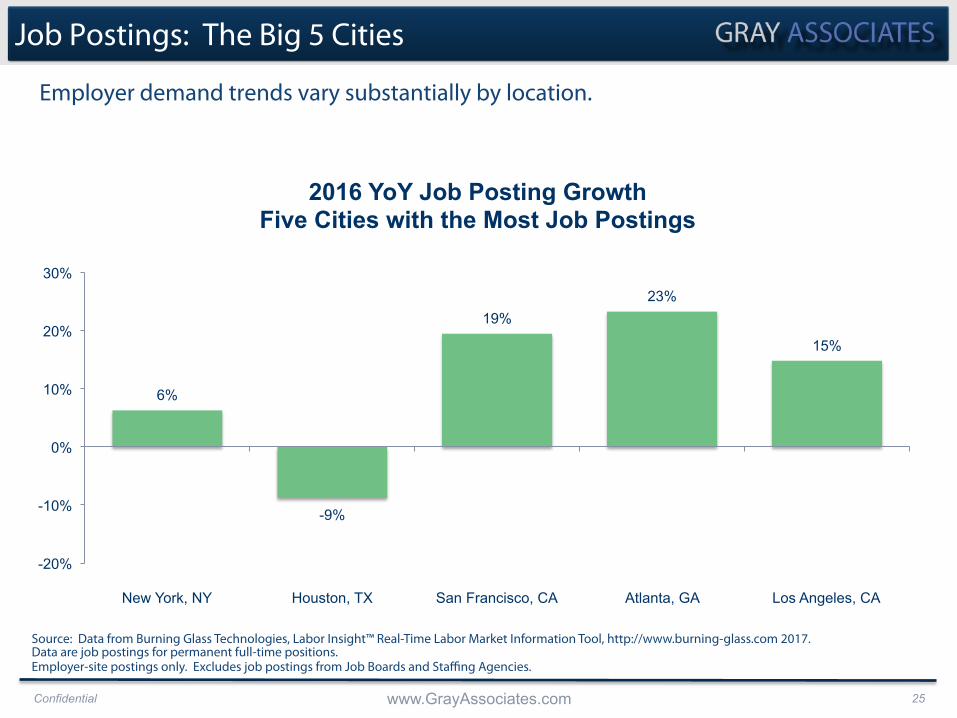
Job Postings: The Big 5 Cities
Employer demand trends vary substantially by location.
6%
-9%
19% 23%
15%
-20%
-10%
0%
10%
20%
30%
New York, NY Houston, TX San Francisco, CA Atlanta, GA Los Angeles, CA
2016 YoY Job Posting Growth Five Cities with the Most Job Postings
Source: Data from Burning Glass Technologies, Labor Insight™ Real-Time Labor Market Information Tool, http://www.burning-glass.com 2017. Data are job postings for permanent full-time positions. Employer-site postings only. Excludes job postings from Job Boards and Staffing Agencies.

Confidential www.GrayAssociates.com 26
Job Postings: Salaries in the Big 5 Cities
Wages also vary by location.
649 758 371 473 781
908 527 476 283
704
1,651
756 842
313
878
2,121
567 1,874
1,251
1,010
0
1,000
2,000
3,000
4,000
5,000
6,000
New York, NY Houston, TX San Francisco, CA Atlanta, GA Los Angeles, CA
Five Cities with the Most Job Postings 2016 Salary Distribution
More than $75,000
$50,000 to $74,999
$35,000 to $49,999
Less than $35,000
Avg. Salary $70,716 $57,014 $81,255 $77,996 $62,684
Source: Data from Burning Glass Technologies, Labor Insight™ Real-Time Labor Market Information Tool, http://www.burning-glass.com 2017. Technologies. Data are job postings for permanent full-time positions. Employer-site postings only. Excludes job postings from Job Boards and Staffing Agencies. Excludes job postings without salary information.
Job Postings
Confidential www.GrayAssociates.com 27
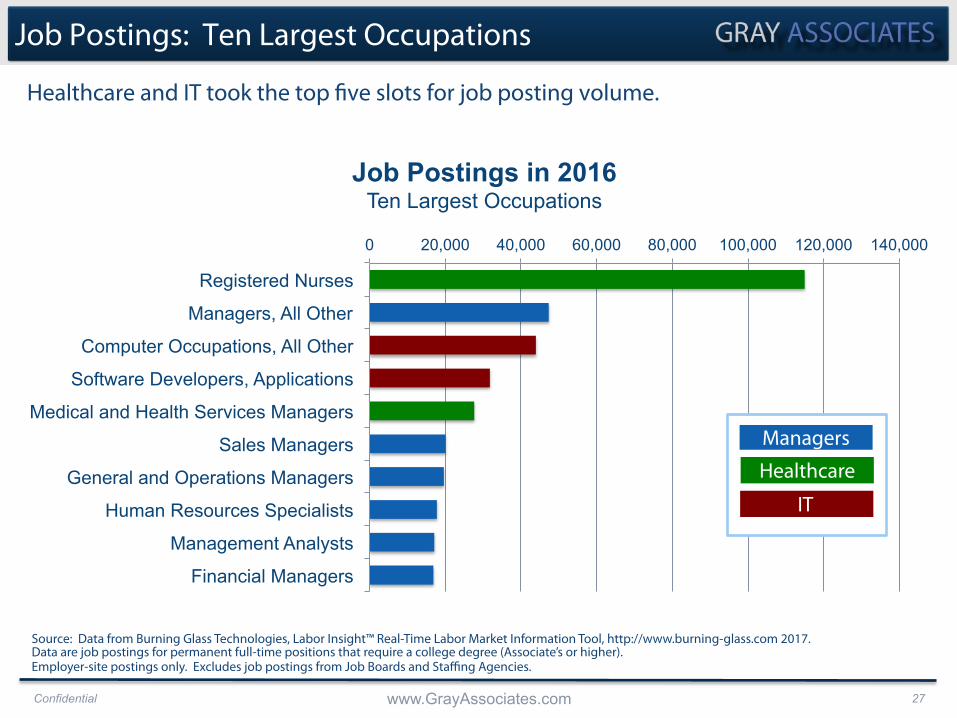
Job Postings: Ten Largest Occupations
Healthcare and IT took the top five slots for job posting volume.
0 20,000 40,000 60,000 80,000 100,000 120,000 140,000
Registered Nurses
Managers, All Other
Computer Occupations, All Other
Software Developers, Applications
Medical and Health Services Managers
Sales Managers
General and Operations Managers
Human Resources Specialists
Management Analysts
Financial Managers
Job Postings in 2016 Ten Largest Occupations
Source: Data from Burning Glass Technologies, Labor Insight™ Real-Time Labor Market Information Tool, http://www.burning-glass.com 2017. Data are job postings for permanent full-time positions that require a college degree (Associate’s or higher). Employer-site postings only. Excludes job postings from Job Boards and Staffing Agencies.
Managers Healthcare
IT

Confidential www.GrayAssociates.com 28
The fastest-growing occupations are dominated by healthcare and education.
Job Postings: Ten Fastest Growing Occupations
0% 20% 40% 60% 80% 100% 120%
Preschool Teachers, Except Special Education Pharmacists
Medical Equipment Repairers Education Administrators, Preschool and
Special Education Teachers, All Other Clinical, Counseling, and School Psychologists
Radiologic Technologists Chemists
Respiratory Therapists Speech-Language Pathologists
Job Postings in 2016 Ten Fastest-Growing Occupations in the U.S.
Source: Burning Glass Technologies, Labor Insight™ Real-Time Labor Market Information Tool, http://www.burning-glass.com 2017. Data are job postings for permanent full-time positions that require a college degree (Associate’s or higher). Employer-site postings only. Excludes job postings from Job Boards and Staffing Agencies.
Education Healthcare

Confidential www.GrayAssociates.com 29
Job Postings: Ten Most Requested Skill Clusters
The top skill cluster is Microsoft Office.
0 100,000 200,000 300,000 400,000
IT: Microsoft Office and Productivity Tools Business: People Management
Customer and Client Support: Basic Customer Finance: Budget Management
Business: Project Management Sales: General Sales
Administration: Scheduling Business: Business Process and Analysis
Business: Business Management Business: Business Strategy
Job Postings in 2016 Ten Most-Requested Skill-Clusters
Source: Burning Glass Technologies, Labor Insight™ Real-Time Labor Market Information Tool, http://www.burning-glass.com 2017. Data are job postings for permanent full-time positions that require a college degree (Associate’s or higher). Employer-site postings only. Excludes job postings from Job Boards and Staffing Agencies.

Confidential www.GrayAssociates.com 30
Job Postings: Most Requested Specialized Skills
Microsoft Excel is the most frequently-requested specialized skill.
0 50,000 100,000 150,000 200,000 250,000
Microsoft Excel Microsoft Office
Budgeting Scheduling
Supervisory Skills Customer Service
Project Management Microsoft Powerpoint
Sales Microsoft Word
Job Postings in 2016 Ten Most-Requested Specialized Skills in the US
Source: Data from Burning Glass Technologies, Labor Insight™ Real-Time Labor Market Information Tool, http://www.burning-glass.com 2017. Data are job postings for permanent full-time positions that require a college degree (Associate’s or higher). Employer-site postings only. Excludes job postings from Job Boards and Staffing Agencies.
Microsoft Other

Confidential www.GrayAssociates.com 31
Half of the ten fastest-growing specialized skill clusters are in healthcare.
Job Postings: Ten Fastest Growing Skill Clusters
0% 5% 10% 15% 20% 25% 30% 35% 40%
Supply Chain and Logistics: Inventory
Health Care: Pharmacy
Finance: Cash Management
Health Care: Medical Procedure and Regulation
Health Care: Medical Records
Marketing and Public Relations: Packaging and
Administration: Office Machines
Health Care: Patient Reception
Health Care: Medical Billing and Coding
Finance: Financial Advisement
Job Postings in 2016 Ten Fastest-Growing Skill Clusters
Source: Data from Burning Glass Technologies, Labor Insight™ Real-Time Labor Market Information Tool, http://www.burning-glass.com 2017. Data are job postings for permanent full-time positions that require a college degree (Associate’s or higher). Employer-site postings only. Excludes job postings from Job Boards and Staffing Agencies.
Other
Healthcare

Confidential www.GrayAssociates.com 32
Job Postings: Ten Most Requested Certifications
Nationally, healthcare, especially RN, dominates the jobs requiring certification.
0 20,000 40,000 60,000 80,000 100,000 120,000
Registered Nurse Security Clearance
Project Management Certification (e.g., PMP) Basic Cardiac Life Support Certification
Certified Public Accountant (CPA) Advanced Cardiac Life Support (ACLS)
Series 7 American Heart Association Certificate Cert. Info. Sys. Security. Pro. (CISSP)
Nurse Practitioner
Job Postings in 2016 Ten Most-Requested Certifications in the U.S.
1. Includes only the 200 largest certifications in occupations that require at least an Associate’s degree. Source: Burning Glass Technologies, Labor Insight™ Real-Time Labor Market Information Tool, http://www.burning-glass.com 2017. Data are job postings for permanent full-time positions. Employer-site postings only. Excludes job postings from Job Boards and Staffing Agencies.
Other
Healthcare

Confidential www.GrayAssociates.com 33
Interpreting employment information requires a context.
Employment Data: Interpretation

Confidential www.GrayAssociates.com 34
CIP 43.0107 – Criminal Justice/Police Science.
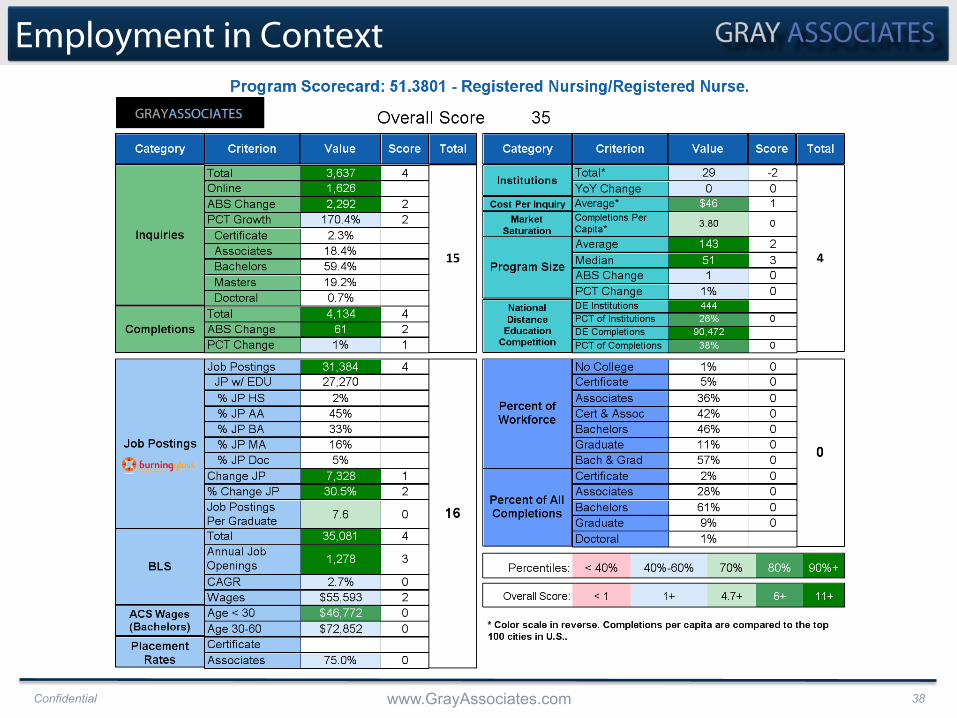
Program Scorecard: Employment

Confidential www.GrayAssociates.com 35
CIP 43.0107 – Criminal Justice/Police Science.
Program Scorecard: Employment

Confidential www.GrayAssociates.com 36
CIP 43.0107 – Criminal Justice/Police Science.
Program Scorecard: Employment

Confidential www.GrayAssociates.com 37
Evaluating Markets for Programs Best-practices: gather sound data on four topics.
Student Demand
February 2
Employment March 2
Degree Fit
March 30
Competitive
Intensity March 30
Confidential www.GrayAssociates.com 38
Employment in Context

Confidential www.GrayAssociates.com 39
Summary
§ BLS data is readily available, but is dated and a weak indicator of trends.
§ Job posting data is vital for trends in employment growth, skills and certifications.
§ Aligning labor data (SOCs) with programs (CIPs) is hard and error-prone.
§ Numbers for one program lack the context needed to interpret the data.
§ Employment is only one part of the puzzle.
§ As a result, DIY is quite expensive, time-consuming, and error-prone.
§ Gray’s Program Evaluation System can do the heavy lifting for you.
Assessing employer demand in your markets is no easy task.

Confidential www.GrayAssociates.com 40
Evaluating Markets for Programs On March 30th we will share best practices for assessing Competition and Fit.
Student Demand
February 2
Employment March 2
Degree Fit
March 30
Competitive
Intensity March 30
Decision-Making Process April 22

Confidential www.GrayAssociates.com 41
For More Information
To contact Gray Associates:
Bob Atkins CEO
Gray Associates, Inc.
[email protected] 617-366-2836


