

EMBARCADERO TECHNOLOGIESEMBARCADERO TECHNOLOGIES
The Business Value
of Data Modeling
Ron HuizengaProduct Manager – ER/[email protected]

EMBARCADERO TECHNOLOGIES
Agenda
• Introduction
• Agile teams
• Agile data architect
• Quantifiable metrics– Defects
– Defect opportunities
– Costs
• Illustration with example project
2

EMBARCADERO TECHNOLOGIES
Agile Teams
• Scrum vs. Extreme• Self-organizing team concept
– Often misinterpreted as role-less• Any person can perform any role• Can switch from sprint to sprint (iteration)• No specialization
• Often accompanied by attitude of disdain for data modelers– “They just slow us down”– “We don’t need a data model”
3

EMBARCADERO TECHNOLOGIES
Agile Data Architect
• Enabler vs. Gatekeeper
• Sprint planning
• Iterative work style
• Collaboration
• Cross-project focus
• Enterprise data perspective
4

EMBARCADERO TECHNOLOGIES
The Project – As Planned
• Supply Chain – Commercial Application Suite• 1 Common Database• Parallel Development Streams
– By functional area
• Planned Duration: 1 year• Planned Cost: $6,000,000• Agile Methodology (Extreme & Scrum)• Developers responsible for all design/development• Weekly budgeted direct staffing costs: $ 92,800
– Did not include business SMEs as they were covered in corporate budget
5

EMBARCADERO TECHNOLOGIES
Initial Weeks
• High defect rate
• Backlog growing rapidly
• By week 16, 50% of effort being spent addressing defects
– Direct cost $46,400/week
– Without being addressed, project schedule would need to be extended 40 weeks (additional cost of $ 3.7 million)
6

EMBARCADERO TECHNOLOGIES
Problem Assessment
7

EMBARCADERO TECHNOLOGIES
Define: Defect Categories & Impact
8
System Defects
& Rework
Requirements
Database & Persistence
User Interface
Business Services
Incomplete user stories
Incorrect business analysis documents
Missing foreign key constraints
Missing check constraintsMissing default values
Incorrect data type
Missing indexMissing audit columns
Incorrect table name
Incorrect column nameTables not in 3
rd Normal Form
Incorrect state transitionCalculation Error
Logic construct error
Incorrect looping or branching
Services not invoked
Messages
Navigation flow
Values not sorted in dropdownsSubfile/list overflow
Controls not working
Missing promptsScreens not user friendly
Incorrect service invoked
Entity Framework mapping error
Business Process has changed
Incorrect test cases
Defective unit tests
3rd
party widget
integration problems
Missing processes
Inadequate Subject Matter Expert Knowledge
EMBARCADERO TECHNOLOGIES
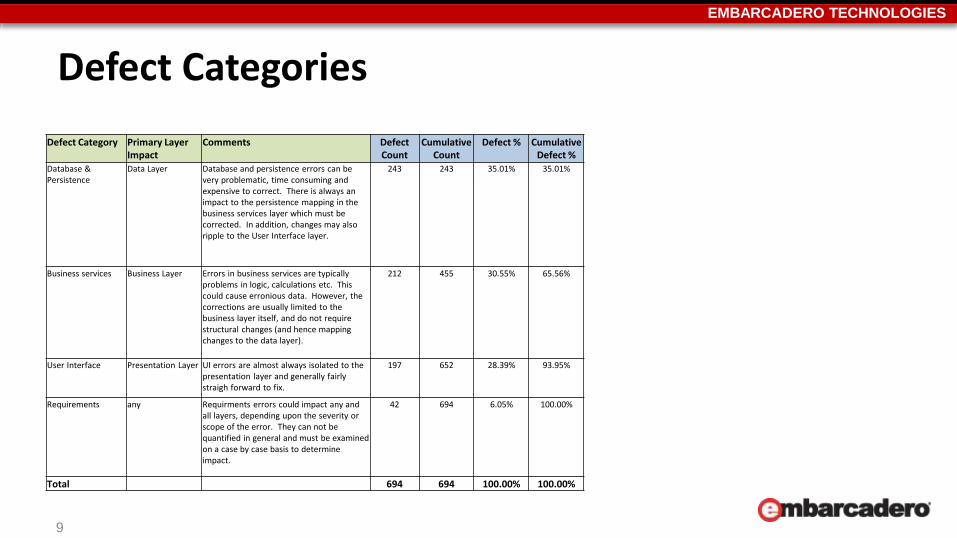
Defect Categories
9
Defect Category Primary Layer Impact
Comments Defect Count
Cumulative Count
Defect % Cumulative Defect %
Database & Persistence
Data Layer Database and persistence errors can be very problematic, time consuming and expensive to correct. There is always an impact to the persistence mapping in the business services layer which must be corrected. In addition, changes may also ripple to the User Interface layer.
243 243 35.01% 35.01%
Business services Business Layer Errors in business services are typically problems in logic, calculations etc. This could cause erronious data. However, the corrections are usually limited to the business layer itself, and do not require structural changes (and hence mapping changes to the data layer).
212 455 30.55% 65.56%
User Interface Presentation Layer UI errors are almost always isolated to the presentation layer and generally fairly straigh forward to fix.
197 652 28.39% 93.95%
Requirements any Requirments errors could impact any and all layers, depending upon the severity or scope of the error. They can not be quantified in general and must be examined on a case by case basis to determine impact.
42 694 6.05% 100.00%
Total 694 694 100.00% 100.00%

EMBARCADERO TECHNOLOGIES
Cumulative Defects
10
EMBARCADERO TECHNOLOGIES
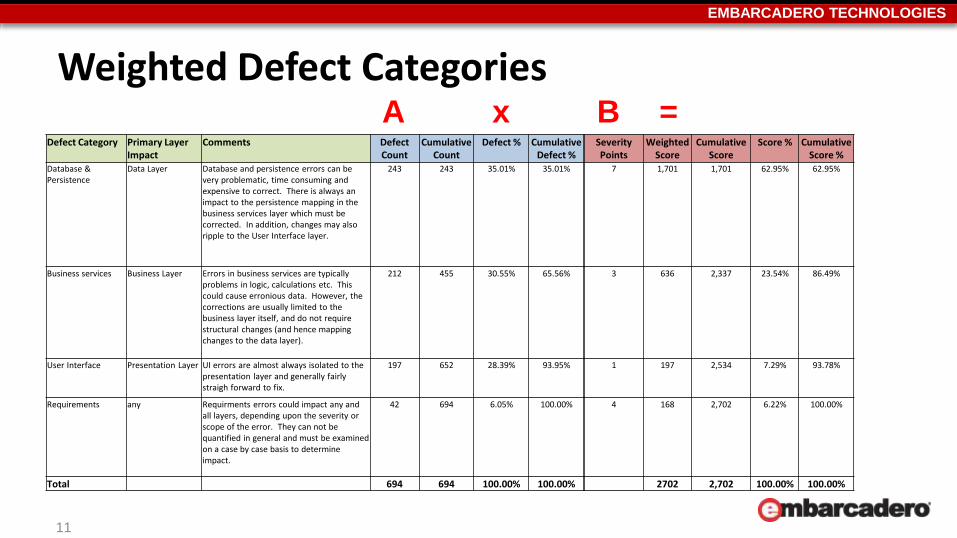
Weighted Defect Categories
11
Defect Category Primary Layer Impact
Comments Defect Count
Cumulative Count
Defect % Cumulative Defect %
Database & Persistence
Data Layer Database and persistence errors can be very problematic, time consuming and expensive to correct. There is always an impact to the persistence mapping in the business services layer which must be corrected. In addition, changes may also ripple to the User Interface layer.
243 243 35.01% 35.01%
Business services Business Layer Errors in business services are typically problems in logic, calculations etc. This could cause erronious data. However, the corrections are usually limited to the business layer itself, and do not require structural changes (and hence mapping changes to the data layer).
212 455 30.55% 65.56%
User Interface Presentation Layer UI errors are almost always isolated to the presentation layer and generally fairly straigh forward to fix.
197 652 28.39% 93.95%
Requirements any Requirments errors could impact any and all layers, depending upon the severity or scope of the error. They can not be quantified in general and must be examined on a case by case basis to determine impact.
42 694 6.05% 100.00%
Total 694 694 100.00% 100.00%
Severity Points
Weighted Score
Cumulative Score
Score % Cumulative Score %
7 1,701 1,701 62.95% 62.95%
3 636 2,337 23.54% 86.49%
1 197 2,534 7.29% 93.78%
4 168 2,702 6.22% 100.00%
2702 2,702 100.00% 100.00%
A x B =

EMBARCADERO TECHNOLOGIES
Cumulative Defect Severity
12

EMBARCADERO TECHNOLOGIES
Database Defects Point Values (Severity)
13
No. Defect Type Description Points
1 Duplicate table 10
2 Table not normalized 10
3 Primary Key Incorrect 5
4 Missing Foreign Key (relationship) 5
5 Referential Integrity constraint incorrect 3
6 Missing foreign key index 2
7 Audit Column missing 2
8 Check Constraint Missing 1
9 Default value not specified 1
10 Incorrect table naming 3
11 Column data type incorrect 2
12 Column NULL specification incorrect 1
13 Incorrect column naming 2

EMBARCADERO TECHNOLOGIES
Database & Persistence Defects
14

EMBARCADERO TECHNOLOGIES
Time Series Distribution of Defects
15

EMBARCADERO TECHNOLOGIES
Defects/Points Per Object
16

EMBARCADERO TECHNOLOGIES
Defects vs. Opportunities
17

EMBARCADERO TECHNOLOGIES
Defect Points vs. Defect Point Opportunities
18

EMBARCADERO TECHNOLOGIES
Cumulative Defect Points vs. Opportunities
19

EMBARCADERO TECHNOLOGIES
Smoothing – Cumulative Analysis
20

EMBARCADERO TECHNOLOGIES
Remediation• Use Senior Data Architect – Cross Team Focus
– Introduced in week 21 of project
• Model all changes• Generate DDL from modeling tool• 1 developer dedicated to persistence mapping
– Works for data architect
• Halt functional design/development– Redesign database– Sprints dedicated to problem cleanup
• Target: Reduce data defects by 75% minimum going forward
21

EMBARCADERO TECHNOLOGIES
Resulting Defects vs. Objects Comparison
22

EMBARCADERO TECHNOLOGIES
Objects & Defects/Week Comparison
23

EMBARCADERO TECHNOLOGIES
Resulting Defects/Points per Object
24
Previous
Scale

EMBARCADERO TECHNOLOGIES
Defects Per Object Comparison
25

EMBARCADERO TECHNOLOGIES
Smoothing – Cumulative Objects vs. Defects
26
EMBARCADERO TECHNOLOGIES
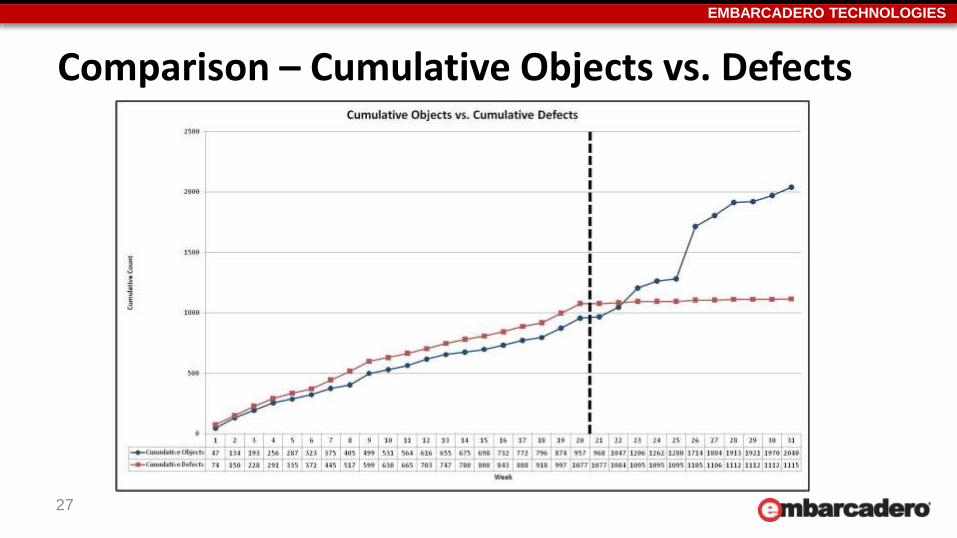
Comparison – Cumulative Objects vs. Defects
27

EMBARCADERO TECHNOLOGIES
Cumulative Defect Points vs. Opportunities
28

EMBARCADERO TECHNOLOGIES
Cumulative Defect Points vs. Opportunities
29

EMBARCADERO TECHNOLOGIES
Comparative
30
MeasurementMeasurement Period
(Weeks 1 -20)Control Period (Weeks 21 - 31)
Performance Improvement
Interval Length (weeks) 20 11
Objects Created 957 1,083
Defects 1,077 38
Defect Opportunities 4,090 4,333
Defect Points 1,696 87
Defect Point Opportunities 8,886 8,991
Average Objects/week 47.85 98.45 205.76%
Average Defects/week 53.85 3.45 1558.82%
Average Defect Points/week 84.80 7.91 1072.18%
Average defects/object 1.13 0.04 3207.37%
Average Defect Opportunities/Week 204.50 393.91
Defects/Opportunity 0.263 0.009 3002.60%
Defect Points/Opportunity 0.191 0.010 1972.46%

EMBARCADERO TECHNOLOGIES
Bottom Line Summary
• On time completion
• Avoided $3.7 million overrun
• Senior Enterprise Data Architect + Modeling Tools $200K
– Duration of project
• ROI: (3.7 million – 200K)/200K = 1,750%
– Had this been done at the beginning of the project, returns would have been even greater
31

EMBARCADERO TECHNOLOGIES
Additional Perspectives• Data Architects MUST be involved in all development
projects– The “glue” that holds everything together– Understand the complex data relationships
• It is essential to map, document & understand data landscape
• Building data quality into design is much more cost effective
• Data modeling offers value in many different ways that we did not have time to cover today!
32

EMBARCADERO TECHNOLOGIES
Thank you!
• Learn more about the ER/Studio product family: http://www.embarcadero.com/data-modeling
• Trial Downloads: http://www.embarcadero.com/downloads
• To arrange a demo, please contact Embarcadero Sales: [email protected], (888) 233-2224
33


