

The Carbon Footprint of Indian Aviation
2011
July 10th, 2012

TABLE OF CONTENTS
Executive Summary
Introduction ...................................................................................................... 2
1 Stakeholders ................................................................................................ 2
2 Carbon Footprint Data Collection .............................................................. 3
3 Calculations & Data Reliability ................................................................... 4
4 Carbon Footprint for 2011 .......................................................................... 7
5 Policy Recommendations ........................................................................ 11
6 Conclusions............................................................................................... 12

2
Executive Summary
This report maps in a comprehensive and detailed manner the first-ever carbon
footprint of Indian aviation for 2011. It identifies the main stakeholders of Indian aviation
involved in the creation of this carbon footprint, introduces the data collection process, and
analyses calculation and data reliability issues. The main part of the report presents the
emission sources and the results of various forms of carbon footprint calculations, while
policy recommendations are also made. Overall, the following conclusions have been
reached:
a) The carbon footprint of Indian scheduled airlines to/from domestic destinations was
6,755,000 tonnes of CO2. The carbon footprint of Indian scheduled airlines to/from
international destinations was 5,949,000 tonnes of CO2. Therefore, the carbon
footprint of Indian scheduled airlines for domestic and international operations was
12,704,000 tonnes of CO2. This represents a 6% increase in comparison to 2010
(11,990,000 tonnes).
b) The carbon footprint of foreign airlines serving international destinations from Indian
airports, which is based on Aviation Turbine Fuel (ATF) uplift from India, reached
3,623,000 tonnes of CO2.
c) The carbon footprint of scheduled Indian airlines and foreign airlines (to
international destinations) represents approximately 1% of the country’s total CO2
emissions, which is significantly lower than the global average contribution of
airlines, which represent approximately 2% of global anthropogenic emissions.
d) In the business-as-usual scenario, emissions of Indian scheduled airlines to/from
domestic destinations are forecast to grow to 14,500,000 and 111,000,000 tonnes
of CO2 in 2020 and 2050 respectively if no emission reduction measures are
adopted. When both domestic/international operations of these airlines are
considered, the respective forecast emissions are 27,000,000 and 209,000,000
tonnes of CO2.
e) Several Indian scheduled passenger airlines are at or below the average global
level of CO2 per RTK (i.e. 0.95 kgs), but several others exceed this value.

3
f) Emissions from Indian airport operations are estimated in the range of 700,000
tonnes of CO2.
g) Indian scheduled airlines implement reliable systems for tracking ATF consumption,
while major airports implement reliable systems for tracking fuel and electricity
consumption. At the same time, several Indian scheduled airlines and airports face
significant difficulties in collecting data for fuel consumption from their vehicle fleets
and electricity consumption.
Further to these results, four main recommendations are made:
a) The carbon footprint of Indian aviation for 2011 should be publicized both within the
Indian aviation industry (e.g., airlines, airports, DGCA website), internationally (e.g.,
ICAO, CAEP meeting in February 2013), and possibly the specialised aviation
press, in order to showcase the meaningful efforts of India regarding aviation and
climate change.
b) The development of an annual carbon footprint for the Indian aviation sector is
imperative in order to implement reduction measures, monitor progress over time,
and set targets if necessary.
c) Additional workshops could be provided to both Indian airlines and airport operators
in order to promote increased awareness concerning aviation’s role in climate
change, to improve data collection procedures and to encourage collaboration
amongst aviation’s major stakeholders.
d) The DGCA Circular 1 of 2012 (2/1/2012) on the Estimation of Carbon Footprint for
Developing National Carbon Emission Inventory for the Indian Aviation Sector
should be adjusted/updated to better meet the needs of the aviation industry and
allow airports and airlines to set-up more comprehensive and effective data
collection and analysis corporate systems.

2
Introduction An important requirement in order to formulate an effective policy to address
the challenge of climate change is to determine the sources and current level of
CO2 emissions, identify trends and make predictions about future growth. Section 1
of this report introduces the main stakeholders of Indian aviation involved in the
creation of this carbon footprint. Section 2 introduces the data collection process,
while Section 3 analyses calculation and data reliability issues.
Section 4 presents the results of various forms of carbon footprint
calculations in relation to the respective sources. More specifically, the analysis
focuses on CO2 emissions from the domestic and international operations of Indian
scheduled airlines, the emissions from foreign airlines based on their fuel uplift in
India, as well as emissions from airport operations. Predictions of future growth as
well as comparisons with global efficiency averages are made. Finally, Section 5
focuses on policy recommendations.
1. Stakeholders
development of the carbon footprint of the Indian aviation sector requires the
contribution from various institutions regarding policy developments, data
submission and collection, reviews, development of databases and other initiatives.
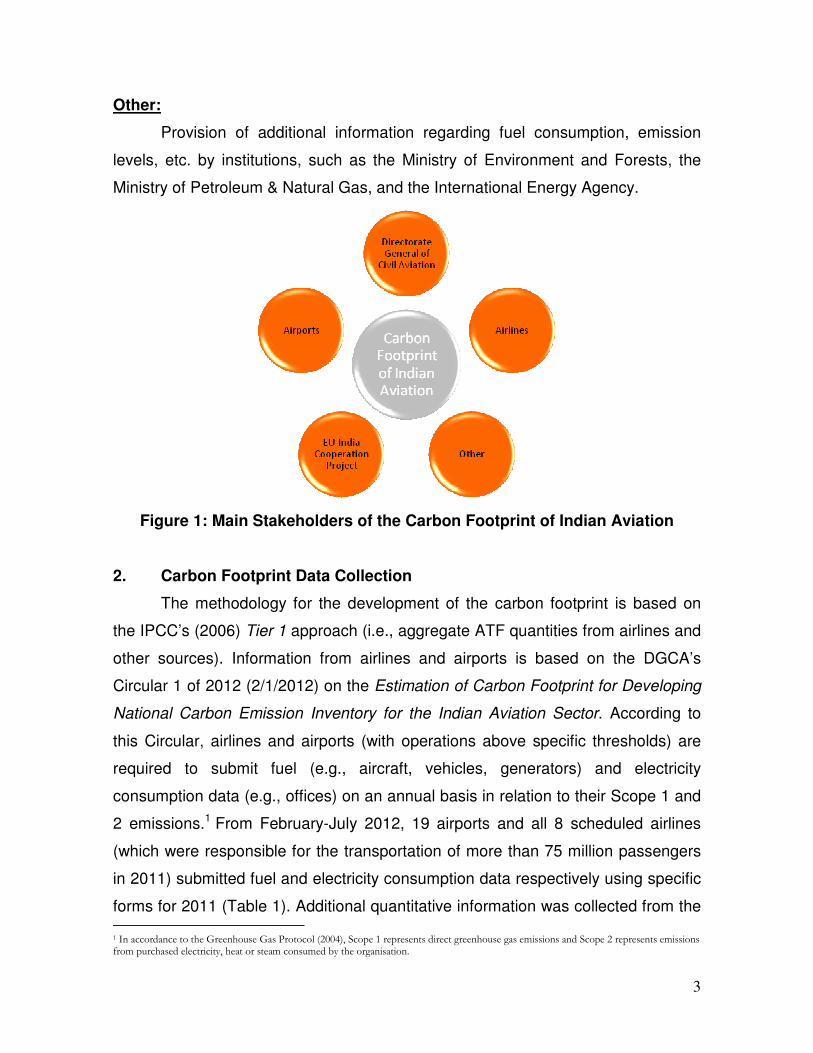
The following organisations were mainly involved with these tasks (Figure 1):
Directorate General of Civil Aviation (DGCA):
Nodal point for issuing the relevant Circular, collecting data and
communicating requests to airlines and airports.
Airlines/Airports:
Responsible for submitting information and data regarding their operations.
EU-India Civil Aviation Cooperation Project (ICCA):
Provision of resources and advise to produce the carbon footprint.
3
Other:
Provision of additional information regarding fuel consumption, emission
levels, etc. by institutions, such as the Ministry of Environment and Forests, the
Ministry of Petroleum & Natural Gas, and the International Energy Agency.
Figure 1: Main Stakeholders of the Carbon Footprint of Indian Aviation
2. Carbon Footprint Data Collection
The methodology for the development of the carbon footprint is based on
the IPCC’s (2006) Tier 1 approach (i.e., aggregate ATF quantities from airlines and
other sources). Information from airlines and airports is based on the DGCA’s
Circular 1 of 2012 (2/1/2012) on the Estimation of Carbon Footprint for Developing
National Carbon Emission Inventory for the Indian Aviation Sector. According to
this Circular, airlines and airports (with operations above specific thresholds) are
required to submit fuel (e.g., aircraft, vehicles, generators) and electricity
consumption data (e.g., offices) on an annual basis in relation to their Scope 1 and
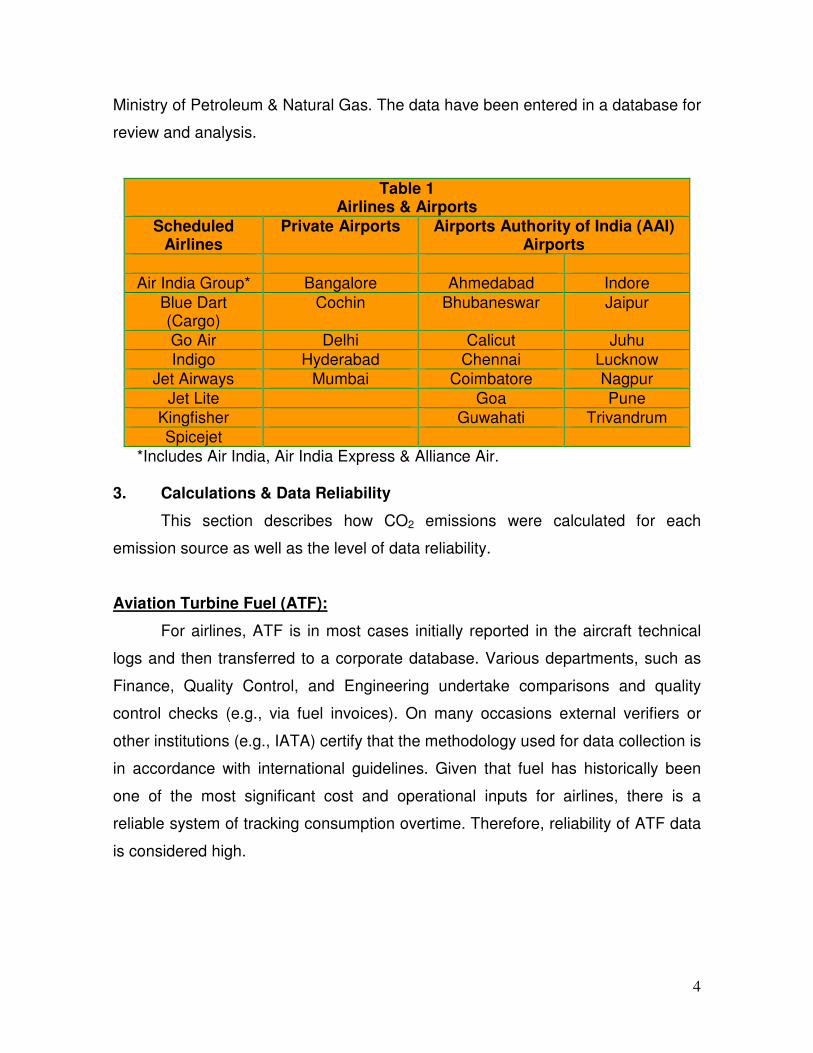
2 emissions.1 From February-July 2012, 19 airports and all 8 scheduled airlines
(which were responsible for the transportation of more than 75 million passengers
in 2011) submitted fuel and electricity consumption data respectively using specific
forms for 2011 (Table 1). Additional quantitative information was collected from the 1 In accordance to the Greenhouse Gas Protocol (2004), Scope 1 represents direct greenhouse gas emissions and Scope 2 represents emissions from purchased electricity, heat or steam consumed by the organisation.
4
Ministry of Petroleum & Natural Gas. The data have been entered in a database for
review and analysis.
Table 1 Airlines & Airports
Scheduled Airlines
Private Airports Airports Authority of India (AAI) Airports
Air India Group* Bangalore Ahmedabad Indore
Blue Dart (Cargo)
Cochin Bhubaneswar Jaipur
Go Air Delhi Calicut Juhu
Indigo Hyderabad Chennai Lucknow
Jet Airways Mumbai Coimbatore Nagpur
Jet Lite Goa Pune
Kingfisher Guwahati Trivandrum
Spicejet
*Includes Air India, Air India Express & Alliance Air. 3. Calculations & Data Reliability
This section describes how CO2 emissions were calculated for each
emission source as well as the level of data reliability.
Aviation Turbine Fuel (ATF):
For airlines, ATF is in most cases initially reported in the aircraft technical
logs and then transferred to a corporate database. Various departments, such as
Finance, Quality Control, and Engineering undertake comparisons and quality
control checks (e.g., via fuel invoices). On many occasions external verifiers or
other institutions (e.g., IATA) certify that the methodology used for data collection is
in accordance with international guidelines. Given that fuel has historically been
one of the most significant cost and operational inputs for airlines, there is a
reliable system of tracking consumption overtime. Therefore, reliability of ATF data
is considered high.

5
The Ministry of Petroleum & Natural Gas (Petroleum Planning & Analysis
Cell), also provided ATF uplift information in India broken down into categories,
such as foreign airlines, Indian airlines, and other consumption.2
Other fuels:
In the case of petrol, diesel, CNG and LPG, which are mainly used for
vehicles, generators, etc., the data sources are mainly related to invoices from
refuelling stations. Where possible, quality control is undertaken (e.g., Finance
Department via invoices). Potential sources of error may be related to mistakes in
data entry, incorrect charging of fuel type, omissions, etc. In general, the major
airports have a well-developed system for data collection and analysis, which in
some cases is also verified by external institutions (e.g., Bureau Veritas). However,
for several airlines and airports, it has become evident that data were lacking or
were not accurate due to the existence of a large number of vehicles and locations,
outsourcing or shared services, and other reasons. Therefore, the quality of this
data is considered as moderate/low for airlines and smaller airports but high for
large international airports.
Electricity:
Several airports implement adequate data collection and verification
processes, given the clear boundaries of operation and availability of electricity
invoices. However, in many cases electricity data is not available from airlines and
some airports or there is significant uncertainty about their quality and reliability.
For example, some airline field offices around the country were not in the position
to submit data because electricity consumption is not billed directly but is
incorporated into the rent. As such, the reliability of electricity data is considered
moderate/low for airlines and several airports while high for major airports.
Table 2 presents the various fuel types and their corresponding level of
reliability, the emission factors, and the relevant reference for the emission factor.
2 “Other” refers to general aviation, resellers, etc.

6
The data submitted by airports and airlines have been saved at the project
database. Given confidentiality issues, only aggregate data are presented in this
report.
Table 2 Emissions Calculation Information
Fuel Type
Data Reliability*
Emission Factor Reference
ATF Airlines: H 3.157 tonnes of CO2/tonne
ICAO (2011), Guidance Material for the Development of States’ Action Plans, p. 19
Petrol Airlines: M/L Airports: H/L
3.14 tonnes of CO2/tonne
DEFRA: 2011 Guidelines to DEFRA/DECC's GHG Conversion Factors for
Company Reporting, Annex 1, Tables 1a & 1b
Diesel Airlines: M/L Airports: H/L
3.16 tonnes of CO2/tonne
CNG Airlines: M/L Airports: H/L
2.70 tonnes of CO2/tonne
LPG Airlines: M/L Airports: H/L
1.49 tonnes of CO2/m
3 Electrici
ty NEWN
E**
Airlines: M/L Airports: H/L
0.80 tonnes of CO2/MWh
Ministry of Power (2012), Central Electricity Authority, CO2 Baseline Database for the Indian Power Sector,
Table S-1 Electricity
South**
Airlines: M/L Airports: H/L
0.75 tonnes of CO2/MWh
* H=High, M=Moderate, L=Low. Data reliability may fluctuate significantly between airlines and airports. ** Two emission factors are available depending on the location of service provision (NEWNE: Integrated North Eastern Western & North-Western regional grids and South: Southern Grid)
Meetings and discussions took place with several of the airlines and airports
to clarify issues regarding data sources, validity, etc. (Table 3). In several cases,
additional data and clarifications were requested on issues such as data collection
procedures, examples of best practices, and calculations. Airports and airlines
responded accordingly in writing. Data from different sources (e.g., airlines and
Ministry of Petroleum & Natural Gas) were compared, while indicators based on
passengers, Revenue Tonne Kilometres (RTK) and aircraft movements were used
to assess consistency of data.

7
Table 3 Airlines Meeting Schedule
Scheduled Airlines Meeting/Discussion
Air India Group* 25/5/2012
Blue Dart (Cargo)** 3/5/2012
Go Air** 22/6/2012
Indigo 29/5/2012
Jet Airways 24/5/2012
Jet Lite 22/5/2012
Kingfisher 25/5/2012
Spicejet 14/6/2012
* Includes Air India, Air India Express & Alliance Air. ** Telecom.
4. Carbon Footprint for 2011
This section provides detailed information regarding the carbon footprint of
Indian aviation for 2011.
a) Based on fuel data consumption collected directly from the 7 Indian
scheduled passenger airlines and 1 cargo airline, the carbon footprint of
Indian scheduled airlines to/from domestic destinations was 6,755,000
tonnes of CO2.3
In accordance to international standards, international aviation bunkers (i.e.,
emissions from fuel use for international civil aviation)4 should be excluded
to the degree possible from national totals but should be reported
separately.5 Based on data from the aforementioned airlines, the carbon
footprint of Indian scheduled airlines to/from international destinations was
5,949,000 tonnes of CO2 in 2011. Therefore, the carbon footprint of Indian
scheduled airlines for domestic and international operations was 12,704,000
tonnes of CO2. This represents a 6% increase in comparison to 2010
(11,990,000 tonnes).
3 There is no detailed information about fuel consumption of non-scheduled airlines. Preliminary data review and their relatively low operational share in 2010 (i.e., 1%) suggest that their fuel consumption and therefore contribution to CO2 emissions is very small. 4 According to ICAO, Guidance Material for the Development of States’ Action Plans, (2011), p. 17, international are flights with one or both terminals in the territory of a country, other than the country in which the air carriers has its principal places of business. Domestic flights are those not classifiable as international. 5 Intergovernmental Panel on Climate Change, Guidelines for National Greenhouse Gas Inventories, Understanding the Common Reporting Framework, (1996).

8
b) Based on ATF uplift data from India obtained from the Ministry of Petroleum
& Natural Gas, the carbon footprint of foreign airlines serving international
destinations from Indian airports reached 3,623,000 tonnes of CO2.
Figure 2 delineates the breakdown of CO2 emissions based on the three
major airline sources.
0
2,000,000
4,000,000
6,000,000
8,000,000
10,000,000
12,000,000
14,000,000
16,000,000
18,000,000
Indian Scheduled Airlines To/
From Domes c Des na ons:
6,755,000
Indian Scheduled Airlines To/
From Internaitonal Des na ons:
5,949,000
Foreign Airlines to Interna onal
Des na ons:
3,623,000
CO2
Emissions (tonnes)
in
2011
CO2 Emissions Distribu on
Figure 2
Global vs Indian CO2 Emissions
In 2011, global airline operations were responsible for the emissions of 676,000,000 tons of CO2, representing approximately 2% of global
anthropogenic emissions.6 In comparison, emissions of Indian scheduled airline operations to/from domestic/international destinations as well as
from foreign airlines to international destinations represent less than 1% of India’s total CO2 emissions (i.e., 1.84 billion tonnes in 2010), which is
significantly lower than the global average of 2%.
6 Air Transport Action Group (ATAG), Aviation Benefits Beyond Borders, (Geneva, Switzerland, March 2012); IPCC Fourth Assessment Report, WG III, Technical Summary (2007).

9
c) It is also important to predict the long-term evolution of CO2 emissions over
time up to 2050. This task incorporates some inherent difficulties since
predictions for the growing and changing Indian market are difficult to make.
However, such a forecast can set the baseline for Indian aviation’s future
emissions in the absence of any additional reduction measures.
The Ministry of Petroleum & Natural Gas predicts an annual growth rate of
ATF fuel consumption of 9.6% (2011-2017) and 7.9% (2017-2022).7 For the period
2022-2050, this report uses a more conservative growth rate of 7%. Figure 3
suggests that the baseline emissions of Indian scheduled airlines to/from domestic
destinations in 2020 and 2050, assuming no measures are taken for emission
reductions, are estimated at approximately 14,500,000 and 111,000,000 tonnes of
CO2 respectively. When both domestic and international operations of these
airlines are considered, the respective emissions are 27,000,000 and 209,000,000
tonnes of CO2.
27,231,306
209,035,219
14,479,904
111,151,843
0
50,000,000
100,000,000
150,000,000
200,000,000
250,000,000
2011
2012
2013
2014
2015
2016
2017
2018
2019
2020
2021
2022
2023
2024
2025
2026
2027
2028
2029
2030
2031
2032
2033
2034
2035
2036
2037
2038
2039
2040
2041
2042
2043
2044
2045
2046
2047
2048
2049
2050
Tonnes CO2
Baseline CO2 Emissions 2012-2050
Emissions of Indian Scheduled Airlines To/From Domes c & Interna onal Des na ons
Emissions of Indian Scheduled Airlines To/From Domes c Des na ons
Figure 3
7 Ministry of Petroleum & Natural Gas, Petroleum Planning & Analysis Cell, Demand Projection XII and XIII Plan (http://ppac.org.in).

10
d) Based on ATF consumption and RTK data for 2011 from the 7 Indian
scheduled passenger airlines listed in Table 1, it is possible to compare CO2
emissions per RTK of these airlines with the global average for 2011 of 0.95
Kgs/RTK. 8 According to Figure 4, several Indian scheduled passenger
airlines are at or below the average level while some exceed this value,
indicating room for improved efficiency. Furthermore, the Indian average is
higher than the global average.
0.93 0.93 0.94 0.95
1.06 1.11 1.11
1.25
1.50
0.00
0.20
0.40
0.60
0.80
1.00
1.20
1.40
1.60
Airline A Airline B Airline C Global Average Indian Average Airline D Airline E Airline F Airline G
Kgs of CO2 Emissions/RTK
Figure 3
Comparison of Indian Scheduled Passenger Airlines CO2 Emissions/RTK
Figure 4
e) It is estimated that approximately 95% of aviation’s emissions are emitted
from aircraft while just 5% come from airport related activities.9 Therefore,
applying this assumption, it is estimated that Indian airports emitted around
700,000 tonnes of CO2. This is consistent with preliminary data provided by
5 private airports and 14 airports of AAI that was converted to emissions
using the emission factors listed in Table 2. Furthermore, electricity
consumption is the main source of airport CO2 emissions.
8 P. Steele, Air Transport Action Group, Aviation & Environment, Presentation at the 68th IATA AGM Meeting (Beijing, China, June 2012). Calculations based on the 2011 average global fuel consumption of 37.49 litres/100 RTK. Due to confidentiality reasons the names of the airlines are not presented. 9 ACI-Europe & WSP (2011), Airport Carbon Accreditation Annual Report 2010-2011.
11
5. Policy Recommendations
In light of the findings reported above, the following recommendations are
made:
a) This report maps in a comprehensive and detailed manner the first-ever
carbon footprint of Indian aviation for 2011. Therefore, it should be
publicised both within the Indian aviation industry (e.g., airlines, airports,
DGCA website), internationally (e.g., ICAO, CAEP meeting in February
2013), and possibly the specialised aviation press, in order to showcase the
meaningful efforts of India regarding aviation and climate change.
b) The development of an annual carbon footprint for the Indian aviation sector
is imperative in order to implement reduction measures, monitor progress
over time, and set targets if necessary. The annual update is especially
important due to the significant growth of the aviation industry but also
because of unpredictable events, such as the scaling down of Kingfisher’s
operations (including the cessation of international operations) and the long
industrial action at Air India in 2012, which will influence the level of
emissions.
c) Additional workshops could be provided to both Indian airlines and airport
operators in order to promote increased awareness concerning aviation’s
role in climate change, to improve data collection procedures, and to
encourage collaboration amongst aviation’s stakeholders.
d) During the development of the carbon footprint it became evident that Indian
scheduled airlines implement reliable systems for tracking ATF
consumption, while major airports implement reliable systems for tracking
fuel and electricity consumption. At the same time, several Indian scheduled
airlines and airports face significant difficulties in collecting diesel, petrol and
other fuel consumption and electricity use data. Consequently, more time is
required for the set-up of internal corporate systems for the collection,
evaluation and reporting of some types of data. Therefore, Circular 1 of
2012 (2/1/2012) on the Estimation of Carbon Footprint for Developing

12
National Carbon Emission Inventory for the Indian Aviation Sector should be
adjusted/updated to better meet the needs of the aviation industry without
creating unnecessary burden to airlines, airports and the DGCA, while at the
same time ensuring that the most important data are provided in a reliable
and timely manner. The main recommendations are listed below:
1. The deadline for the submission of fuel data for the previous calendar
should be set as March 31st in order to allow adequate time for the
collection and provision of data.
2. Scheduled airlines should provide on a mandatory basis total ATF
consumption as well as passenger, RTK, cargo, and aircraft
movement information broken down into domestic and international
operations.
3. Major airports (e.g., airports with more than 10,000 annual aircraft
movements) should provide on a mandatory basis electricity
consumption as well as passenger, cargo, and aircraft movement
information broken down as domestic and international operations.
4. Airports and airlines should be encouraged to participate in national
or international voluntary emission certification or reduction
programs, such as certification in accordance to ISO 14064-1, Airport
Carbon Accreditation of ACI Europe & Asia-Pacific, and other similar
initiatives. Relevant certificates and reports to be submitted to DGCA
on an annual basis.
6. Conclusions
The process of developing the carbon footprint of the Indian aviation sector
for 2011 has provided a very good understanding of the sources of CO2 emissions
from Indian aviation, the availability of data from airlines and airports, the reliability
of this data, as well as the required future initiatives.
13
The implementation of the policy recommendations regarding the
dissemination of carbon footprint information domestically and internationally,
development of an annual carbon footprint, delivery of additional workshops of
airlines and airports and the update of the Circular on the estimation of India’s
carbon footprint together with the formulation of renewed domestic and
internationally oriented policies on climate change (that are being prepared as part
of the Indian Aviation and Environmental Policy), will underscore India’s
commitment to addressing the challenge of aviation and climate change in a
comprehensive and effective manner.


