
The Coastal Front Spring 2017 Volume VIIII-1
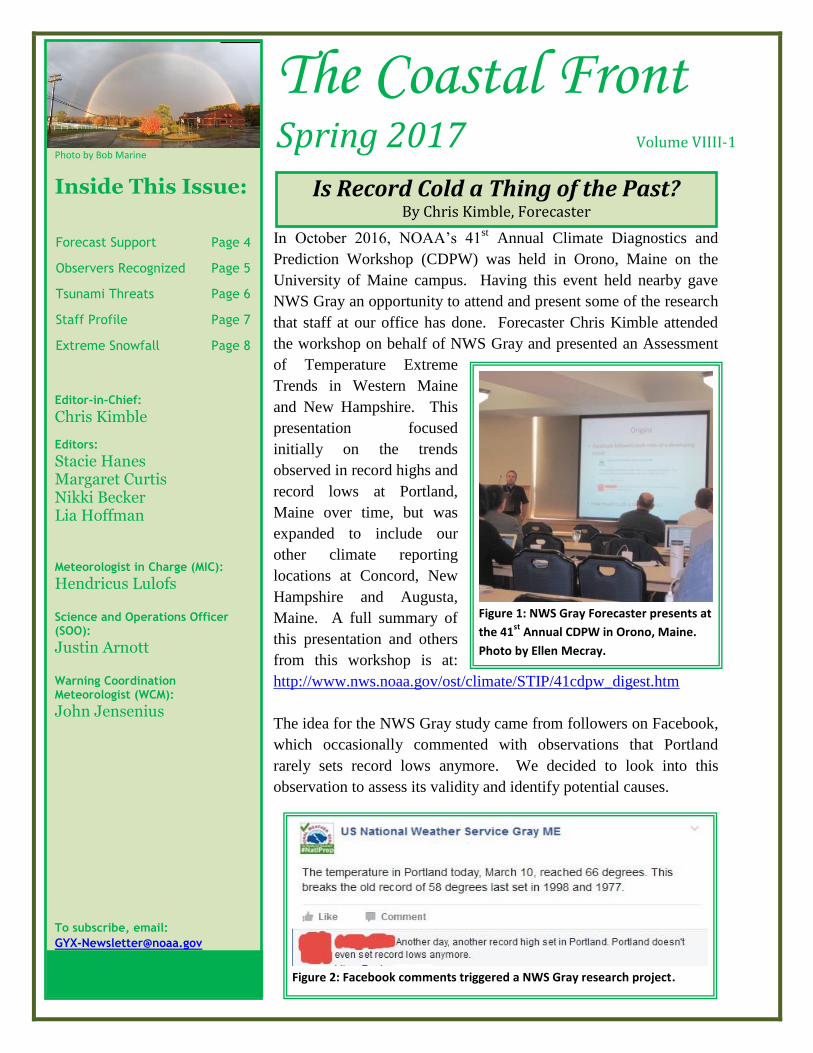
In October 2016, NOAA’s 41st Annual Climate Diagnostics and
Prediction Workshop (CDPW) was held in Orono, Maine on the
University of Maine campus. Having this event held nearby gave
NWS Gray an opportunity to attend and present some of the research
that staff at our office has done. Forecaster Chris Kimble attended
the workshop on behalf of NWS Gray and presented an Assessment
of Temperature Extreme
Trends in Western Maine
and New Hampshire. This
presentation focused
initially on the trends
observed in record highs and
record lows at Portland,
Maine over time, but was
expanded to include our
other climate reporting
locations at Concord, New
Hampshire and Augusta,
Maine. A full summary of
this presentation and others
from this workshop is at:
http://www.nws.noaa.gov/ost/climate/STIP/41cdpw_digest.htm
The idea for the NWS Gray study came from followers on Facebook,
which occasionally commented with observations that Portland
rarely sets record lows anymore. We decided to look into this
observation to assess its validity and identify potential causes.
Photo by Bob Marine
Inside This Issue:
Forecast Support Page 4
Observers Recognized Page 5
Tsunami Threats Page 6
Staff Profile Page 7
Extreme Snowfall Page 8
Editor-in-Chief:
Chris Kimble
Editors: Stacie Hanes Margaret Curtis Nikki Becker Lia Hoffman Meteorologist in Charge (MIC):
Hendricus Lulofs Science and Operations Officer (SOO):
Justin Arnott Warning Coordination Meteorologist (WCM):
John Jensenius
To subscribe, email:
Is Record Cold a Thing of the Past? By Chris Kimble, Forecaster
Figure 1: NWS Gray Forecaster presents at
the 41st
Annual CDPW in Orono, Maine.
Photo by Ellen Mecray.
Figure 2: Facebook comments triggered a NWS Gray research project.
The Coastal Front 2 Spring 2017
Record Trends (continued)
By Stacie Hanes, Senior Forecaster
By Stacie Hanes, Lead Forecaster
After combing through the record books we noted how many times each year appeared in the
records for both record highs and record lows (ties were included). If all years were just as
variable then we would set roughly the same number of record highs and record lows each year.
In truth, all years are not as variable, and the departure from the expected frequency of setting
these records can tell us something about how extreme that year was.
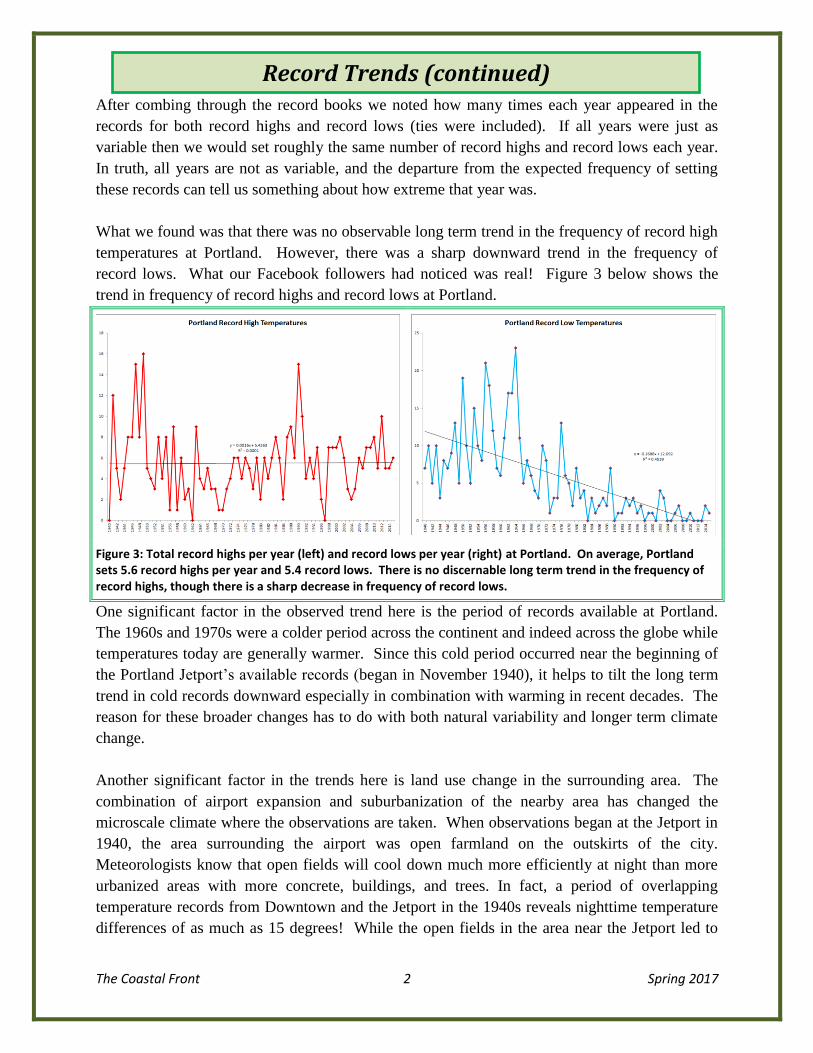
What we found was that there was no observable long term trend in the frequency of record high
temperatures at Portland. However, there was a sharp downward trend in the frequency of
record lows. What our Facebook followers had noticed was real! Figure 3 below shows the
trend in frequency of record highs and record lows at Portland.
Figure 3: Total record highs per year (left) and record lows per year (right) at Portland. On average, Portland sets 5.6 record highs per year and 5.4 record lows. There is no discernable long term trend in the frequency of record highs, though there is a sharp decrease in frequency of record lows.
One significant factor in the observed trend here is the period of records available at Portland.
The 1960s and 1970s were a colder period across the continent and indeed across the globe while
temperatures today are generally warmer. Since this cold period occurred near the beginning of
the Portland Jetport’s available records (began in November 1940), it helps to tilt the long term
trend in cold records downward especially in combination with warming in recent decades. The
reason for these broader changes has to do with both natural variability and longer term climate
change.
Another significant factor in the trends here is land use change in the surrounding area. The
combination of airport expansion and suburbanization of the nearby area has changed the
microscale climate where the observations are taken. When observations began at the Jetport in
1940, the area surrounding the airport was open farmland on the outskirts of the city.
Meteorologists know that open fields will cool down much more efficiently at night than more
urbanized areas with more concrete, buildings, and trees. In fact, a period of overlapping
temperature records from Downtown and the Jetport in the 1940s reveals nighttime temperature
differences of as much as 15 degrees! While the open fields in the area near the Jetport led to
The Coastal Front 3 Spring 2017
Record Trends (continued)
By Stacie Hanes, Senior Forecaster
By Stacie Hanes, Lead Forecaster
very cold nighttime
temperatures through the
1960s, gradually the nearby
land began to change. There
were several projects at the
Jetport itself along with
expansion of nearby
neighborhoods. In 1971,
the Maine Mall was built
nearby with more shopping
plazas complete with large
buildings and expansive
parking lots soon to follow.
Over time the character of
the land near the
observation site changed
from open fields to
suburban, making those
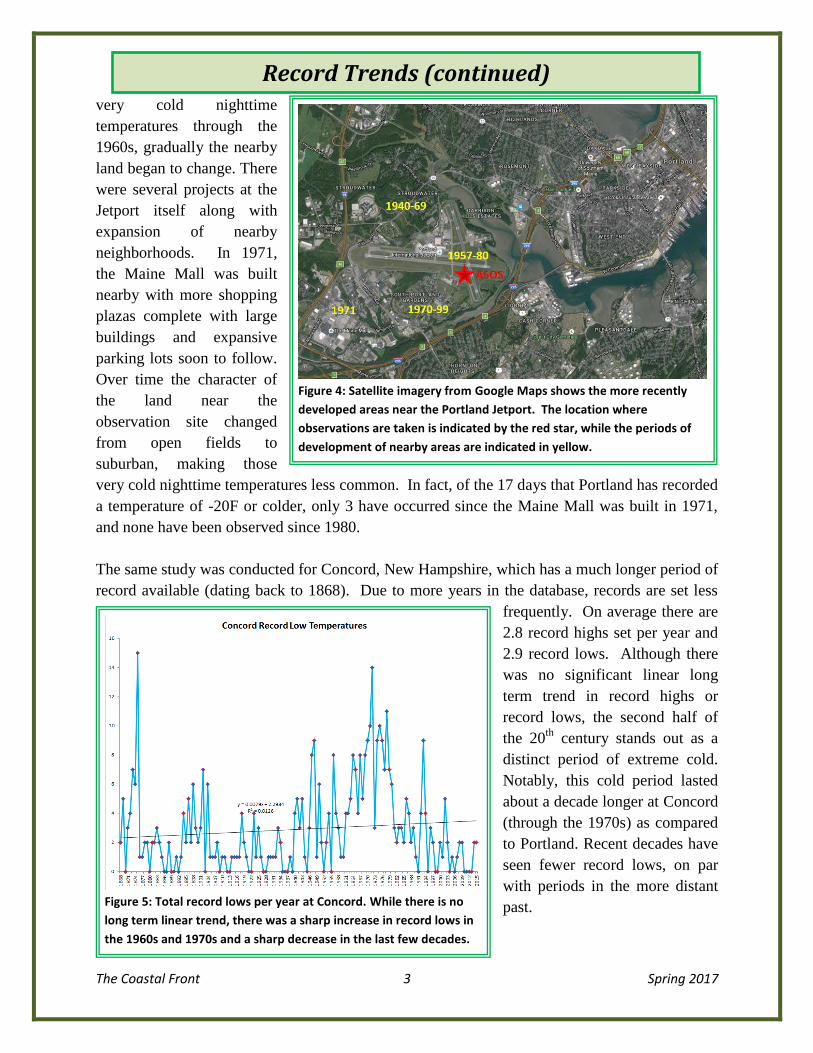
very cold nighttime temperatures less common. In fact, of the 17 days that Portland has recorded
a temperature of -20F or colder, only 3 have occurred since the Maine Mall was built in 1971,
and none have been observed since 1980.
The same study was conducted for Concord, New Hampshire, which has a much longer period of
record available (dating back to 1868). Due to more years in the database, records are set less
frequently. On average there are
2.8 record highs set per year and
2.9 record lows. Although there
was no significant linear long
term trend in record highs or
record lows, the second half of
the 20th
century stands out as a
distinct period of extreme cold.
Notably, this cold period lasted
about a decade longer at Concord
(through the 1970s) as compared
to Portland. Recent decades have
seen fewer record lows, on par
with periods in the more distant
past.
Figure 4: Satellite imagery from Google Maps shows the more recently
developed areas near the Portland Jetport. The location where
observations are taken is indicated by the red star, while the periods of
development of nearby areas are indicated in yellow.
Figure 5: Total record lows per year at Concord. While there is no
long term linear trend, there was a sharp increase in record lows in
the 1960s and 1970s and a sharp decrease in the last few decades.
The Coastal Front 4 Spring 2017
NWS Provides Weather Support for New Hampshire
By Justin Arnott, Science and Operations Officer
By Stacie Hanes, Senior Forecaster
By Stacie Hanes, Lead Forecaster
Each year, around 100,000 people descend upon Loudon, NH, for racing events at the New
Hampshire Motor Speedway in July and again in September. This number of people is similar to
the total population of Manchester, NH, making Loudon one of the largest “cities” in the state on
race day. With so many people concentrated in such a small area, there is an increased
vulnerability to weather hazards, which, during the summer and early fall, include thunderstorms
(and associated lighting, hail, winds, and tornadoes), wind, rain, and even high temperatures.
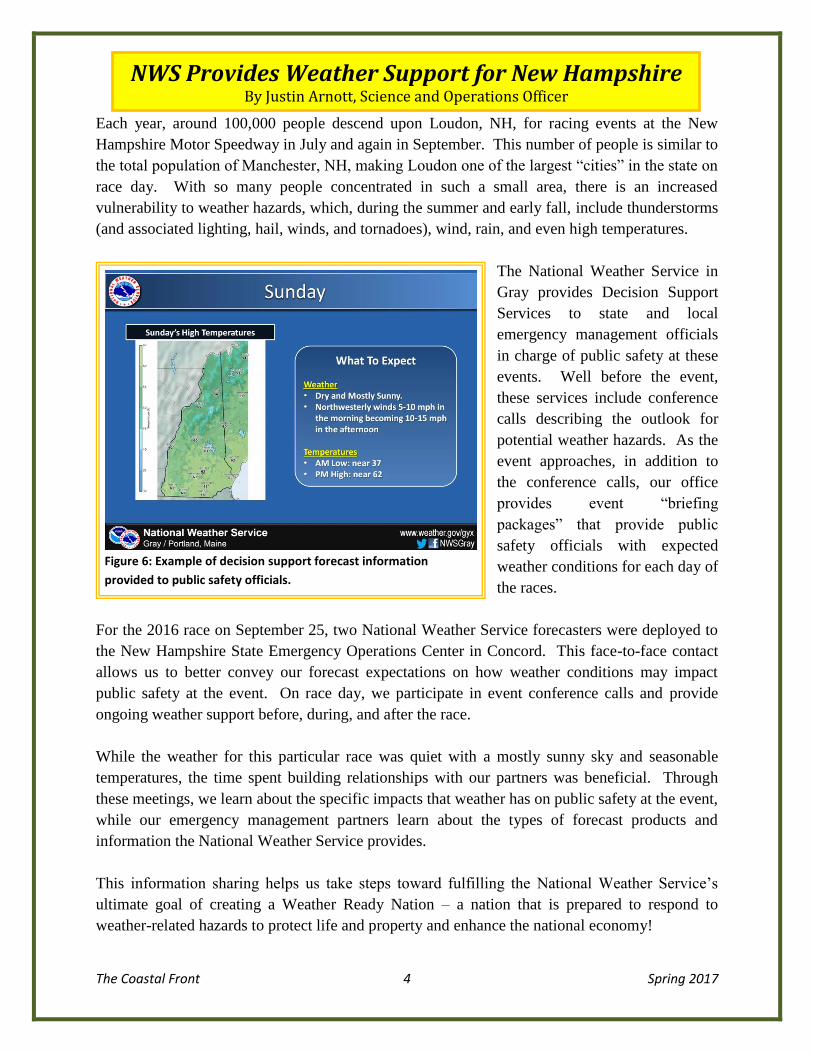
The National Weather Service in
Gray provides Decision Support
Services to state and local
emergency management officials
in charge of public safety at these
events. Well before the event,
these services include conference
calls describing the outlook for
potential weather hazards. As the
event approaches, in addition to
the conference calls, our office
provides event “briefing
packages” that provide public
safety officials with expected
weather conditions for each day of
the races.
For the 2016 race on September 25, two National Weather Service forecasters were deployed to
the New Hampshire State Emergency Operations Center in Concord. This face-to-face contact
allows us to better convey our forecast expectations on how weather conditions may impact
public safety at the event. On race day, we participate in event conference calls and provide
ongoing weather support before, during, and after the race.
While the weather for this particular race was quiet with a mostly sunny sky and seasonable
temperatures, the time spent building relationships with our partners was beneficial. Through
these meetings, we learn about the specific impacts that weather has on public safety at the event,
while our emergency management partners learn about the types of forecast products and
information the National Weather Service provides.
This information sharing helps us take steps toward fulfilling the National Weather Service’s
ultimate goal of creating a Weather Ready Nation – a nation that is prepared to respond to
weather-related hazards to protect life and property and enhance the national economy!
Figure 6: Example of decision support forecast information
provided to public safety officials.
The Coastal Front 5 Spring 2017
Cooperative Observers Recognized for Service
By Nikki Becker, Observing Program Leader By Stacie Hanes, Senior Forecaster
By Stacie Hanes, Lead Forecaster
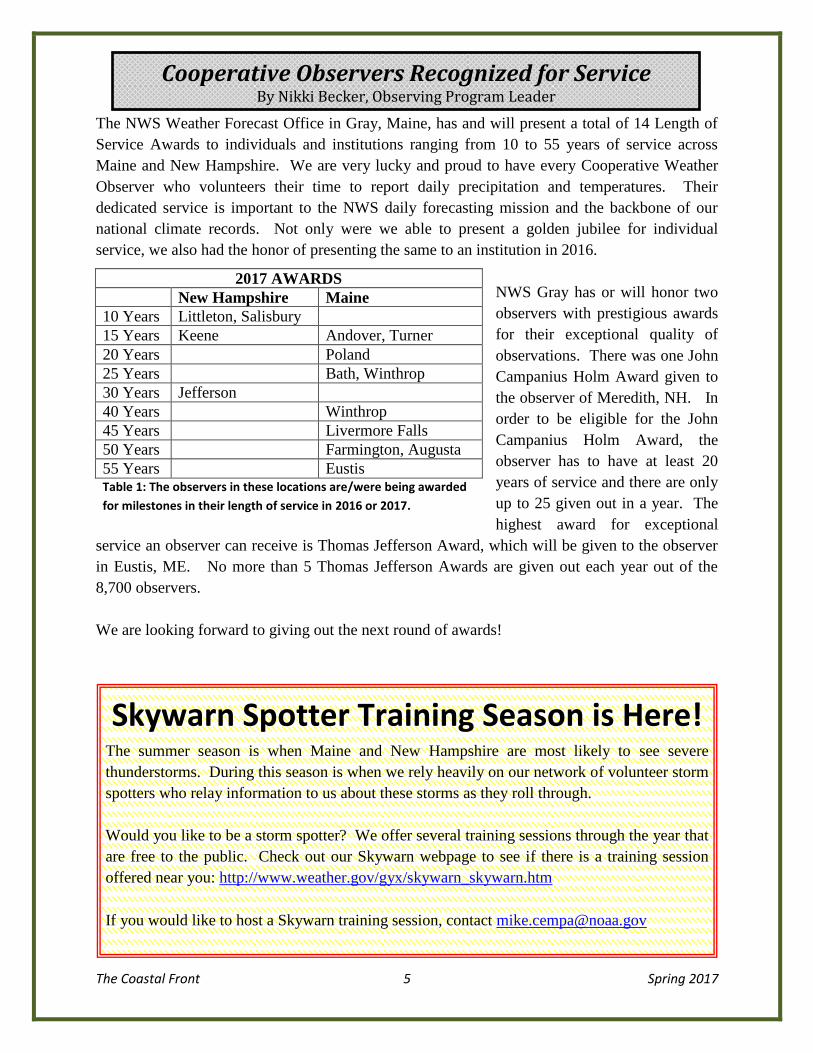
The NWS Weather Forecast Office in Gray, Maine, has and will present a total of 14 Length of
Service Awards to individuals and institutions ranging from 10 to 55 years of service across
Maine and New Hampshire. We are very lucky and proud to have every Cooperative Weather
Observer who volunteers their time to report daily precipitation and temperatures. Their
dedicated service is important to the NWS daily forecasting mission and the backbone of our
national climate records. Not only were we able to present a golden jubilee for individual
service, we also had the honor of presenting the same to an institution in 2016.
NWS Gray has or will honor two
observers with prestigious awards
for their exceptional quality of
observations. There was one John
Campanius Holm Award given to
the observer of Meredith, NH. In
order to be eligible for the John
Campanius Holm Award, the
observer has to have at least 20
years of service and there are only
up to 25 given out in a year. The
highest award for exceptional
service an observer can receive is Thomas Jefferson Award, which will be given to the observer
in Eustis, ME. No more than 5 Thomas Jefferson Awards are given out each year out of the
8,700 observers.
We are looking forward to giving out the next round of awards!
2017 AWARDS
New Hampshire Maine
10 Years Littleton, Salisbury
15 Years Keene Andover, Turner
20 Years Poland
25 Years Bath, Winthrop
30 Years Jefferson
40 Years Winthrop
45 Years Livermore Falls
50 Years Farmington, Augusta
55 Years Eustis Table 1: The observers in these locations are/were being awarded
for milestones in their length of service in 2016 or 2017.
Skywarn Spotter Training Season is Here! The summer season is when Maine and New Hampshire are most likely to see severe
thunderstorms. During this season is when we rely heavily on our network of volunteer storm
spotters who relay information to us about these storms as they roll through.
Would you like to be a storm spotter? We offer several training sessions through the year that
are free to the public. Check out our Skywarn webpage to see if there is a training session
offered near you: http://www.weather.gov/gyx/skywarn_skywarn.htm
If you would like to host a Skywarn training session, contact [email protected]
The Coastal Front 6 Spring 2017
Tsunamis Pose a Rare Threat
By John Jensenius, Warning Coordination Meteorologist By Stacie Hanes, Senior Forecaster
By Stacie Hanes, Lead Forecaster
Here in New England, most people don’t think about the possibility of a tsunami. However,
tsunamis can occur along any coastline around the world, including the coastlines of Maine and
New Hampshire. Tsunamis are one of nature’s most deadly phenomena and occur most often in
the Pacific Ocean. Although tsunamis are usually caused by rapid movements of the ocean floor,
tsunamis can also be generated by localized landslides and land slumps along the shoreline, or
even asteroids plunging into the ocean. In rare cases, fast moving atmospheric pressure waves
such as those caused by squall lines are capable of producing tsunami-like waves.
When you think of tsunamis, you probably think of the massive waves that struck areas of the
Indian and Pacific Oceans in 2004 and 2011. While many lives were lost in the devastation that
occurred over portions of Japan in 2011, dangerous tsunami waves crossed the Pacific Ocean at
speeds of over 500 mph to reach the West Coast of the United States. While the tsunami wave
that hit the West Coast was only a few feet high and arrived near the time of low tide, the
powerful currents created by the tsunami wave caused an estimated 40 million dollars in damage
when it hit California. In Crescent City harbor, the tsunami sank 16 boats, damaged 47 others,
and claimed one life near the entrance to the harbor.
While Maine and New Hampshire are somewhat sheltered by George’s Bank and the continental
shelf, waves similar to those that hit California in 2011 are possible across the region. While a 2-
foot wave may not sound like much, a tsunami wave will strike suddenly with the force of a
raging river. Particularly vulnerable are vessels, docks, and piers along the coast and in the
channels. Structures along the immediate coast also could be damaged if a tsunami would strike
near the time of high tide.
Unlike wind-driven waves, a tsunami’s speed depends on the depth of the ocean. In areas of the
Pacific where the ocean depth is 20,000 ft, tsunami waves are usually less than a foot high and
move as fast as a commercial jet. However, as a tsunami wave encounters shallower water the
speed of the wave slows and the height increases. As the tsunami approaches land, the
underwater terrain will often focus much of the wave energy on points of land that jut out into
the ocean due to underwater ridges that extend out into the sea.
Even along the coast of New England, if you notice an unexpected rise or fall of the sea level, it
might be a tsunami. The best advice is to get out of the water and move away from the water’s
edge. Be sure to monitor children closely and keep them a safe distance from the shoreline.
Always respect the power of moving water. Here are some sources of information on tsunamis:
http://www.nws.noaa.gov/om/Tsunami/
http://www.maine.gov/dacf/mgs/hazards/tsunamis/index.shtml
http://nws.weather.gov/nthmp/tpw/tsunami-preparedness-week.html

The Coastal Front 7 Spring 2017
NWS Staff Profile
By Margaret Curtis, Forecaster
By Stacie Hanes, Senior Forecaster
By Stacie Hanes, Lead Forecaster
The staff profile column introduces you to a new NWS staff member every issue. This issue we
introduce you to Forecaster Chris Kimble.
What is your role at the office? I am a General
Forecaster responsible for preparing the public and
aviation forecasts for western Maine and all of New
Hampshire as well as issuing warnings for hazardous
weather events. I also lead the office Climate program,
which ensures accurate weather records are kept and
maintains access to historical data. In addition, I prepare
the office schedule, which maintains 24/7 staffing through
the entire year. This can be a challenging process
especially during periods of low staffing or holidays. I am
also active on the social media team and am involved in
the Skywarn spotter training program. Oh, and I shouldn’t
forget I prepare and edit the newsletter!
How long have you worked for the National Weather
Service in Gray? I arrived in December, 2009, so I have
been here for 8 winters.
Where else have you worked? I got my start in the NWS
as a volunteer and later a student employee at the NWS in
Memphis, TN. I later worked as an Intern at NWS
Amarillo, TX before arriving in Maine as a Forecaster.
Where did you grow up? I grew up near Memphis, TN and lived there until I graduated high
school.
Where did you get your education? I graduated from the University of Oklahoma at Norman
in 2006.
How did you first get interested in weather? I’ve been interested in weather for about as long
as I can remember. Growing up in the south, we did not see snow that often. I remember getting
so excited any time snow was in the forecast, and I would spend as much time outside playing in
it as I could. After all, it never really lasted long. I used to spend hours a day watching the
Weather Channel and learning about all the interesting weather that goes on around the country
each day. When I went to college in Oklahoma I also developed an appreciation for severe
thunderstorms and tornados, often observing these up close. In fact, I still head out to the plains
each spring to visit with friends and chase a few storms.
Figure 7: Forecaster Chris Kimble has
worked at NWS Gray since 2009.
The Coastal Front 8 Spring 2017
NWS Staff Profile (continued)
By Stacie Hanes, Senior Forecaster
By Stacie Hanes, Lead Forecaster
Fast-Moving Storm Brings Very Heavy Snowfall
By Stacie Hanes, Lead Meteorologist
By Stacie Hanes, Senior Forecaster
By Stacie Hanes, Lead Forecaster
What is the most interesting part of your job? I enjoy looking deeply into what’s going on
with the weather and trying to figure out what’s causing it in hope that we will improve our
ability to forecast it. In New England, terrain and ocean effects often cause some interesting
weather phenomenon even on a quiet weather day.
What is the most challenging aspect of your job? Working rotating shifts is quite difficult to
adjust to. One week you’re working overnight shifts and the next you’re coming in for a day
shift bright and early at 8 AM. That’s something your body never really gets used to.
What is the most memorable weather event that you have worked? I recall the first Winter
Storm Warning I issued at NWS Gray. It was a low pressure system moving in from the ocean,
and our computer models were forecasting several inches of snowfall even though the
temperature was hovering right around freezing. I knew it was going to be a tough call on
whether it would be rain or snow. I woke up the next day after issuing the Winter Storm
Warning and I looked outside to see nothing but a dry, bare ground! When my biggest forecast
concern was whether it would be rain or snow, in the end nothing would fall at all! That’s when
I learned to never trust a storm moving in from the ocean.
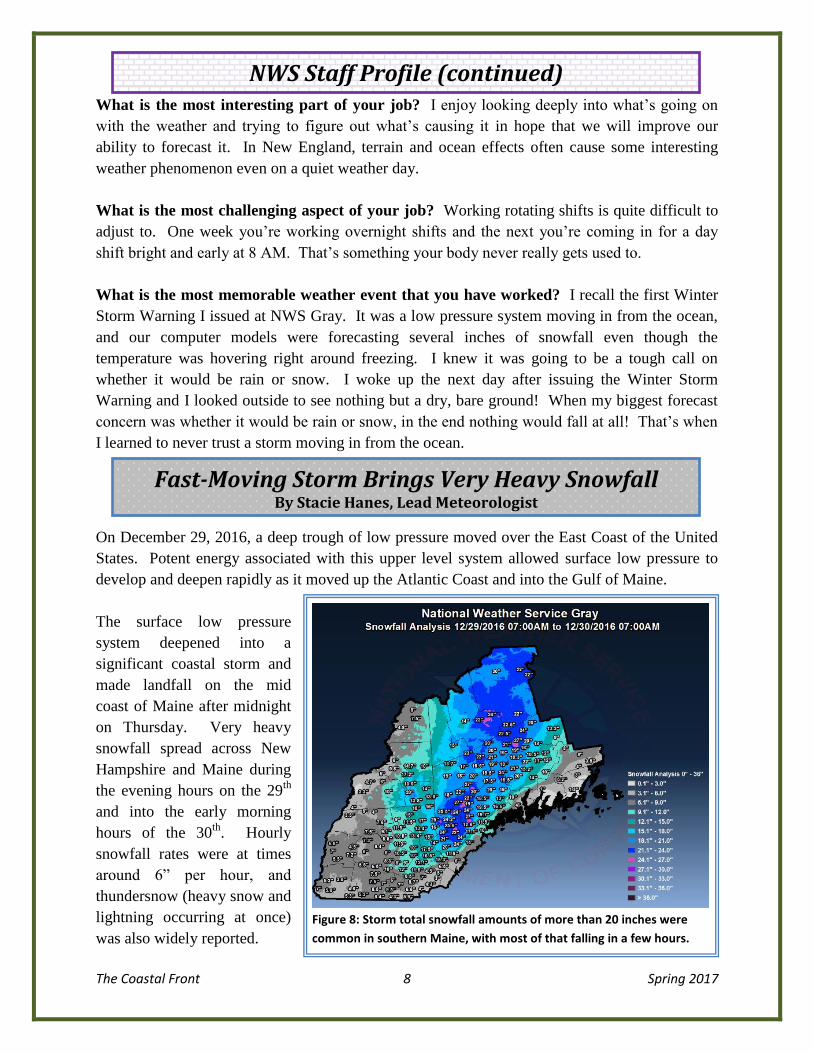
On December 29, 2016, a deep trough of low pressure moved over the East Coast of the United
States. Potent energy associated with this upper level system allowed surface low pressure to
develop and deepen rapidly as it moved up the Atlantic Coast and into the Gulf of Maine.
The surface low pressure
system deepened into a
significant coastal storm and
made landfall on the mid
coast of Maine after midnight
on Thursday. Very heavy
snowfall spread across New
Hampshire and Maine during
the evening hours on the 29th
and into the early morning
hours of the 30th
. Hourly
snowfall rates were at times
around 6” per hour, and
thundersnow (heavy snow and
lightning occurring at once)
was also widely reported.
Figure 8: Storm total snowfall amounts of more than 20 inches were
common in southern Maine, with most of that falling in a few hours.
The Coastal Front 9 Spring 2017
Very Heavy Snowfall (continued)
By Stacie Hanes, Senior Forecaster
By Stacie Hanes, Lead Forecaster
This storm had a sharp delineation between where snow fell and where rain fell as a coastal front
developed and meandered near the coast during the heaviest precipitation. This change to rain
near the coast is what made for large differences in snowfall amounts for coastal locations versus
locations just inland. At Portland 1.2 inches of snow fell early on before changing to rain, but
late that evening the front moved back through and brought 6.5 inches of snow in just a couple of
hours along with thunder and lightning. Meanwhile just a few miles inland at our office in Gray,
precipitation stayed mostly snow and accumulated to 16.6 inches.
While 12 to 24 inches of snow is not that uncommon from a Nor’easter in northern New
England, the most memorable aspect of this storm was just how heavy the snow was when it was
coming down. The storm only lasted about 12 hours and was producing snowfall rates of 6
inches per hour during the height of the storm. Snowfall rates that high are exceptionally rare
and make it impossible to maintain well-plowed roadways. Such extreme snowfall rates
occurred in part due to just how quickly the storm intensified as it interacted with warm/moist air
over the Atlantic and the cold, drier air over northern New England.
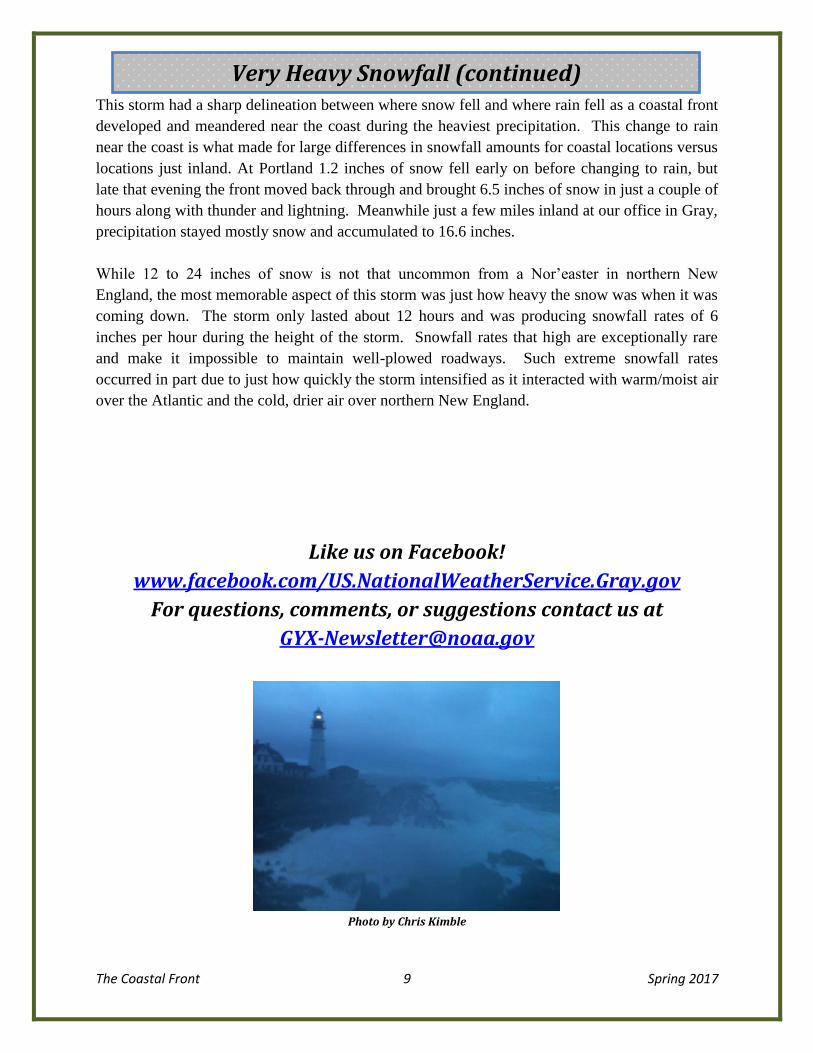
Like us on Facebook!
www.facebook.com/US.NationalWeatherService.Gray.gov
For questions, comments, or suggestions contact us at
Photo by Chris Kimble
Photo by John Jensenius


