

NBER WORKING PAPER SERIES
THE COMPARATIVE ADVANTAGE OF MEDICARE ADVANTAGE
Joseph P. NewhouseMary Beth Landrum
Mary PriceJ. Michael McWilliams
John HsuThomas McGuire
Working Paper 24289http://www.nber.org/papers/w24289
NATIONAL BUREAU OF ECONOMIC RESEARCH1050 Massachusetts Avenue
Cambridge, MA 02138February 2018
We acknowledge support from the National Institute of Aging, Grant Number P01-AG032952 andthank Tim Layton, three referees, and Frank Sloan for comments on an earlier draft. Newhouse wishesto disclose that he is a director of and holds equity in Aetna. The views expressed herein are thoseof the authors and do not necessarily reflect the views of the National Bureau of Economic Research.
NBER working papers are circulated for discussion and comment purposes. They have not been peer-reviewed or been subject to the review by the NBER Board of Directors that accompanies officialNBER publications.
© 2018 by Joseph P. Newhouse, Mary Beth Landrum, Mary Price, J. Michael McWilliams, John Hsu,and Thomas McGuire. All rights reserved. Short sections of text, not to exceed two paragraphs, maybe quoted without explicit permission provided that full credit, including © notice, is given to the source.

The Comparative Advantage of Medicare AdvantageJoseph P. Newhouse, Mary Beth Landrum, Mary Price, J. Michael McWilliams, John Hsu,and Thomas McGuireNBER Working Paper No. 24289February 2018JEL No. I11,I13,I18
ABSTRACT
We ascertain the degree of service-level selection in Medicare Advantage (MA) using individual level data on the 100 most frequent HCC’s or combination of HCC’s from two national insurers in 2012-2013. We find differences in the distribution of beneficiaries across HCC’s between TM and MA, principally in the smaller share of MA enrollees with no coded HCC, consistent with greater coding intensity in MA. Among those with an HCC code, absolute differences between MA and TM shares of beneficiaries are small, consistent with little service-level selection.
Variation in HCC margins does not predict differences between an HCC’s share of MA and TM enrollees, although one cannot a priori sign a relationship between margin and service-level selection. Margins are negatively associated with the importance of post-acute care in the HCC. Margins among common chronic disease classes amenable to medical management and typically managed by primary care physicians are larger than among diseases typically managed by specialists. These margin differences by disease are robust against a test for coding effects and suggest that the average technical efficiency of MA relative to TM may vary by diagnosis. If so, service-level selection on the basis of relative technical efficiency could be welfare enhancing.
Joseph P. NewhouseDivision of Health Policy Research and EducationHarvard University180 Longwood AvenueBoston, MA 02115-5899and [email protected]
Mary Beth LandrumHarvard Medical School Department of Health Care Policy 180 Longwood AvenueBoston, MA 02115-5899 [email protected]
Mary PriceDivision of ResearchKaiser Permanente442 Brimhall Street St. Paul, MN 55105 [email protected]
J. Michael McWilliamsHarvard Medical SchoolDepartment of Health Care Policy180 Longwood AvenueBoston, MA [email protected]
John HsuInstitute for Health Policy Massachusetts General Hospital 50 Staniford StreetRoom 901BBoston, MA [email protected]
Thomas McGuireDepartment of Health Care PolicyHarvard Medical School180 Longwood AvenueBoston, MA 02115and [email protected]
An online appendix is available at http://www.nber.org/data-appendix/w24289
As is well known, competitive insurance markets can be inefficient from sorting by individuals on
either price or covered benefits in the case of fixed contracts and also, in the case of endogenous
contracts, from service-level selection by insurers, meaning differential shadow prices for individuals
with different conditions (Rothschild and Stiglitz 1976; Cutler and Reber 1998; Frank, et al. 2000; Breyer,
et al. 2012).1 To mitigate inefficiency from service-level selection, policy uses tools such as risk
adjustment, mandates, subsidies, and reinsurance (Layton, et al. 2015; Geruso and McGuire 2016;
Layton, et al. 2016; Azevedo and Gottlieb 2017; Geruso and Layton 2017; McGuire and van Kleef 2017).
Risk adjustment addresses service-level selection by attempting to make individuals who vary in their
expected spending equally profitable to the insurer, thereby limiting the insurer’s incentives to structure
the insurance contract to attract certain beneficiaries and not others (Geruso and Layton 2017).2
Medicare’s initial risk adjustment scheme mostly relied upon age and sex and was notably
unsuccessful in preventing favorable sorting of beneficiaries into MA (Congressional Budget Office
1997).3 About a decade ago Medicare introduced two reforms to reduce the favorable sorting into MA.
It added diagnoses as a risk adjuster to the demographic risk adjusters it had previously employed, a
method it termed Hierarchical Coexisting Conditions (HCC’s), and it required beneficiaries to remain in
their chosen plan for several months, i.e., a lock-in period, whereas previously there had been no lock-
in.4 These reforms markedly reduced the favorable sorting into MA (Newhouse, et al. 2013; Newhouse
and McGuire 2014; Newhouse, et al. 2015).5 There remains the question of whether service-level
selection exists within Medicare Advantage (MA), and that is the question we address in this paper.
Note that such selection could be socially efficient if MA plans differentially attract beneficiaries with
conditions that they are technically efficient in treating relative to TM. We thus go beyond the
economics literature cited above in not assuming either the same cost function in MA and TM or
alternatively a uniform reduction in cost across all MA beneficiaries relative to TM.6
Under the current MA risk adjustment method, payments to insurers for an individual
beneficiary are proportional to the relative weight the risk adjustment scheme assigns to that
beneficiary (Pope, et al. 2004). The relative weight is based on predicted TM spending from a regression
of individual level TM spending on a number of demographic characteristics and a beneficiary’s
diagnosis or diagnoses.7 As a result, an MA plan’s revenue for one type of beneficiary relative to
another approximately equals the ratio of how much TM spends on each type of beneficiary. The
variation in plan margins across HCC’s is therefore in part a measure of the average technical efficiency
of MA relative to TM for the various HCC’s or combinations of HCC’s.
In an earlier paper (Newhouse et al., 2013) we used actual revenue and medical cost data from
one insurer for 48 unique HCC’s or combination of HCC’s to explore selection across HCC’s or
combination of HCC’s and differences in insurer margins across HCC’s. We had four main findings:
1) We saw negligible differences in the distribution of MA enrollees and TM enrollees across the
48 HCC’s in the sample, or no evidence of service-level selection. We also found no relationship
between the observed margin and the difference in MA and TM enrollee shares.
2) This was so despite large differences in margins by HCC; the range of margins from the most
to the least profitable was 160 percentage points.
3) We could not calculate standard errors for the estimated margins because we were not given
individual level data, only aggregate revenue and cost for each of the 48 HCC’s. As a result, we could not
determine how much of the variation in margins across HCC’s to attribute to sampling error.
4) Nevertheless, there was a pattern in the data; certain types of HCC’s were relatively more
profitable on average, which suggested that not all the observed variation was attributable to sampling
error. In particular, common chronic diseases typically managed by primary care physicians (PCP’s) and
for which successful medical management might prevent a potentially expensive acute episode were
relatively more profitable; examples included diabetes, chronic obstructive pulmonary disease (COPD),
and chronic heart failure (CHF). At the other extreme, chronic diseases often managed by specialists
tended to be markedly less profitable than those typically managed by PCP’s; examples included cancers
of various sites and rheumatoid arthritis. In addition, the one acute HCC among the 48 HCC’s in the
sample, unstable angina and acute ischemic heart disease, was the least profitable of all, perhaps
because there was little opportunity for medical management by the insurer. We interpreted these
findings as suggesting that MA had greater relative technical efficiency in the HCC categories with higher
margins.
This paper revisits both the theoretical and empirical work of the earlier paper with better data
that permit several improvements. Most importantly, we now have data on revenue and cost at the
individual member level so that we can estimate sampling error. Second, we use data from two insurers
rather than one, and the data are somewhat more recent, coming from calendar years 2012 and 2013.8
Third, in this work we have data on roughly twice as many HCC’s or combinations of HCC’s as in the
earlier work, namely the 100 most frequent HCC’s or combination of HCC’s from each insurer for each
year. Although there is substantial overlap, the top 100 HCC’s are not necessarily the same 100 HCC’s
for each insurer in each year. Fourth, in the earlier work we only had data for those with at least one
coded HCC; in these data we also know those not coded with an HCC, who are by far the largest group in
our sample. Finally, in these results we control for geography.
We have three main findings:
1) We now find some evidence of service-level selection across HCC’s, though the main
difference in the distribution of the MA and TM samples across HCC’s is a markedly lower MA share with

no coded HCC, consistent with more intensive diagnosis coding in MA. The differences in shares among
those with a coded HCC or combination of HCC’s are small in absolute value.
2) There is substantial variation in margins across HCC’s, even after accounting for sampling
error. We again find that common chronic diseases usually managed by PCP’s have higher margins than
chronic conditions typically managed by specialists, consistent with MA plans’ having greater average
technical efficiency for those conditions. We carry out one test of whether our finding of differential
margins by HCC is robust to coding effects and find that it is.
3) In our earlier paper we assumed that MA plans would attempt to select beneficiaries in high
margin HCC’s and interpreted the observed lack of selection as it being too costly for plans to do so. In
the next section of this paper we show that this assumption is theoretically incorrect; one cannot sign a
priori a relationship between the profit margins we observe and a plan’s incentive to attract
beneficiaries in a given HCC without making restrictive assumptions. Fundamentally this is because a
plan’s incentive to select beneficiaries with a specific HCC is a function of revenue and cost conditions at
the margin and the various HCC profit margins we observe give information on average revenue and
cost.
As a condition of obtaining the data, we agreed to keep the names of the two insurers and their
actual margins confidential. We have done so by subtracting the same arbitrary constant from each
calculated margin shown below.
The paper is organized as follows. In the next section we discuss whether one can sign a
relationship between the margin in an HCC and the difference in the shares of beneficiaries in the HCC in
MA and TM. Following that we turn to our empirical work. We describe our data, methods, and results
and conclude with a discussion.

Profit Margins and Selection Incentives in Medicare Advantage
The margin is the gap between price and cost, measured in absolute or percentage terms, as in
the case of the Lerner Index of market power. Although the relative price for an HCC in the MA market
is set by regulation and so is regarded as fixed by the MA plan, coding intensity notwithstanding, the
level of spending to treat a disease or groups of disease is partly chosen by the plan’s actions, for
example its network, formulary, and cost sharing choices, which determine its profit margins in
equilibrium. As a result, observed margins are endogenous.
It may seem intuitively appealing that a test of across-HCC or service-level selection by MA plans
is whether there is a positive association between the margin in an HCC and the MA share in that HCC
relative to TM. Indeed, Newhouse et al. (2013) assumed this was the case since it is what one would
expect if MA plans specialized in disease categories in which they had a production advantage, and
Newhouse, et al. (2013) interpreted larger profit margins in certain HCC’s as indicating production
efficiency in MA relative to TM. Selection incentives, however, relate to conditions at the margin, and
the observed profit margins across HCC’s relate to the average beneficiary in each HCC. There is thus no
necessary link between observed profit margins and selection incentives.
In particular, a number of factors in addition to production efficiency affect the relationship
between profit margins and the share of plan enrollees in MA relative to TM. Consider the simple case
of one profit-maximizing MA plan competing against a passive TM alternative for beneficiaries in various
diagnosis groups. The MA plan decides how much to spend on each group to maximize profit given the
set level of payment for the group. Payment to the plan might be high in relation to the plan’s costs for
services if the MA plan is technically efficient relative to TM for a particular diagnosis group.
But relative technical efficiency is not the only factor at play. The MA plan in this hypothetical
example has market power and a monopolist maximizes profit by restricting output. Here with a fixed
price, the MA plan restricts output (spends less) according to the elasticity of enrollment demand in a
group with respect to the level of service spending. This elasticity of demand could differ across HCC
groups in unknown ways, leading to no signed correlation between margin and share.
Yet another factor is adverse or favorable selection within a group. If the MA plan suffers
adverse selection within a group, higher enrollment would lead to lower average cost, as in the standard
Einav-Finkelstein model of a health insurance market (Einav, et al. 2010; Einav and Finkelstein 2011). On
the other hand, if the MA plan enjoys favorable selection within a group in relation to TM, the average
cost of members goes up with higher enrollment, implying lower margins with higher enrollment.
Although there now appears to be only a small amount of favorable selection overall in MA (Newhouse,
et al. 2013, 2015), selection patterns could differ across disease groups.
Finally, the model of one MA plan competing against TM does not represent our data. The plans
we study are two national plans that compete not just against TM but also against each other and
against other national plans and local plans that may be more or less efficient than our plans in some
disease areas and so contribute to any pattern of favorable or adverse selection into the plans we study.
In short, one cannot derive predictions about the relationship between profit margins and the
relative share of MA to TM enrollees by HCC without making additional assumptions that seem overly
restrictive to us. We can get somewhat further, however, by looking at characteristics of certain disease
groups and asking why MA plan cost functions relative to TM cost functions might differ across HCC’s.
As a preliminary remark, enrollment in MA tends to persist; about 90 percent of MA enrollees remain
enrolled in the same plan the following year (Medicare Payment Advisory Commission 2015).9 Because
of this persistence, MA insurers have a financial incentive to increase the likelihood that their members
with chronic diseases comply with prescribed medications, are examined at frequencies that treatment
guidelines specify, whereas TM does not offer the same financial incentive.10 MA insurers, for example,
may encourage members to purchase Part D by keeping premiums low, and they have an incentive to
optimize the use of drugs to reduce medical costs, an incentive not present in TM. MA plans also have
an incentive to discourage low-value care. At a given level of enrollment, therefore, cost functions of
MA plans for a variety of chronic disease HCC’s may lie below those of TM. By contrast, in the case of
acute conditions or chronic conditions for which treatment is considered non-discretionary or
customarily follows a certain protocol, cost functions in MA and TM may be more similar.
One aspect of medical management that MA plans can implement is more judicious use of post-
acute care, a key driver of geographic variation in TM cost (Newhouse and Garber 2013). We test
whether the intensity of post-acute care in an HCC relates to the observed margin.11 We use the
proportion of TM spending on post-acute care in an HCC as a measure of post-acute intensity.
Cost functions may also differ for certain HCC’s if, relative to other HCC’s, they are
disproportionately treated by specialists or at hospitals with greater market power, since MA plans
negotiate price whereas TM sets a take-it-or-leave-it price. Cancer in particular is often managed by an
oncologist or a hematologist and may be treated at a specialty cancer hospital. Such hospitals are much
less numerous than general hospitals and thus may have greater market power.12
Not only specialty hospitals, but also specialist physicians are likely to have more market power
than the more numerous PCP’s. In commercial insurance fees relative to TM are higher for both medical
and surgical specialists than fees for PCP’s, consistent with greater market power of specialists (White,
et al. 2013; Baker, et al. 2014; Austin and Baker 2015; Cooper, et al. 2015; Clemens and Gottlieb 2017).
Although MA fees for all physicians are less than commercial fees – otherwise MA plans would have
difficulty competing with TM – a differential between MA specialist fees and MA primary care physician
fees relative to TM may hold as well; indeed, White, et al. (2013) show this is the case in the 13 markets
they studied.13
The foregoing highlighted production efficiency and possibly input prices as sources of
difference in MA and TM margins and cost functions, but margin functions may also differ across HCC’s
because of differential coding intensity between MA and TM. Because payment under the MA risk
adjustment system relies on diagnoses coded on encounter forms, MA insurers have an incentive to
code all diagnoses. TM gives hospitals a similar coding incentive, since their payment also depends on
coded diagnoses. TM payment to physicians, however, does not depend on diagnosis, although
Medicare asks physicians to record diagnoses on the claims form. Presumably because physician
reimbursement is unaffected by coding intensity, physician claims in TM are incomplete with respect to
diagnosis, and coding intensity is greater in MA (Medicare Payment Advisory Commission 1998; Kronick
and Welch 2014; Geruso and Layton 2015). To adjust for greater coding intensity, CMS has made annual
downward adjustments in overall MA plan payment since 2010.14 Before 2014, the period from which
our data come, these adjustments were uniform across HCC’s.15
MA plans may use various mechanisms to maximize coding. One is the use of Health Risk
Assessments carried out during a home health visit. Information from such Assessments can be used to
assign HCC’s. This mechanism is not used in TM. Another is to contact a physician to verify that a
beneficiary still has a specific diagnosis or may have a more complex version of the same diagnosis.
CMS uses prospective risk adjustment, meaning that the diagnoses used to assign HCC’s are
those from the prior year. Not all MA patients with HCC’s assigned from Health Risk Assessments or
calls to physicians have medical claims in the prior year. Such patients would thus appear in the no-HCC
group in TM but would have an HCC coded in MA. If these MA patients who are assigned an HCC in MA
but not in TM are of lower cost in the current year than other patients in the HCC group to which they
are assigned, margins in that HCC group would increase. Such an increase, however, would be unrelated
to relative technical efficiency. We test the sensitivity of our results to omitting those with an HCC but
no medical claim in the prior year.
Data
As mentioned above, the data we analyze come from two national insurers and include the
revenues they received as well as the medical and drug cost they paid on behalf of their MA
membership for 2012 and 2013 for the 100 most frequent HCC’s or combination of HCC’s for each
insurer and year. The profit margins we calculate are gross margins that exclude the insurers’
administrative cost and profit. The denominator of the margin is thus simply the medical and drug cost
the plans paid. The numerator includes all revenue the plans received on behalf of an individual
enrollee, including the plans’ bid, any premium the enrollee paid for the medical or the drug plan, and
any risk adjustment revenue less medical and drug cost.16 The first two elements of the revenue are the
same for each enrollee in a county. As a result, the variation in margins across HCC’s that we observe is
dominated by two elements: the relative weight for that HCC in the risk adjustment scheme, which is
approximately proportional to TM spending for that HCC, and the MA insurer’s medical and drug cost
for that HCC.17 Thus, HCC’s with higher margins could indicate greater technical efficiency in MA relative
to TM. We assigned HCC’s using the v12 model, which was in effect in 2012 and 2013.
MA enrollees may be individual or group, the latter coming from an employer with retiree
health benefits where MA is available to all qualified retirees from that employer. In the case of group
enrollees, drug cost and revenue are not always available because the employer may contract with
another insurer or a pharmacy benefit manager for the drug benefit. Our main results therefore rely on
only individual MA members, who constitute the large majority of the sample (and the large majority of
all MA enrollees). For the individual members we include all medical and drug revenue and cost. In an
appendix we show results including group members; these are shown with just medical costs for the
entire sample (individual plus group) and also for medical and drug costs for the subset of members for
whom we have drug cost. The inclusion of group MA members does not change our conclusions.
The data we have do not include enrollment dates, so persons in our sample may participate for
only part of a year or for a full year. Thus, we effectively assume persons enrolled for part of a year are
distributed at random across HCC’s. Any bias from violations of this assumption should be small given
the large persistence of enrollment from year to year described above.18 We did, however, exclude the
0.2% of persons who switched plans within the same insurer within a year.19 We also excluded MA
beneficiaries who were under 66 (9% in our sample), who are largely the disabled, as well as
institutionalized beneficiaries (1%) because selection mechanisms and cost functions may differ for
those groups. We also excluded new Medicare enrollees (4%), because HCC’s are not available for them
(prior year claims are lacking) and therefore CMS uses only demographic variables to risk adjust
payment for them.
Statistical Methods
We began by testing for the degree of service-level HCC selection. To do so we compared the
distribution of MA enrollees across HCC’s or combinations of HCC’s with the distribution of TM enrollees
across the same HCC’s or combination of HCC’s.20 We corrected for the geographic distribution
differences between MA and TM enrollment using inverse probability weights applied at the age,
gender, and Hospital Referral Region (HRR) level; that is, we weighted the proportion of the MA sample
in HCCi to resemble the age, gender, and geographic distribution of the TM sample using the weight
[∑ 𝑇𝑇𝑇𝑇𝑖𝑖𝑖𝑖𝑖𝑖𝑖𝑖𝑖𝑖/𝑖𝑖 ∑ 𝑇𝑇𝑇𝑇𝑖𝑖𝑖𝑖𝑖𝑖𝑖𝑖𝑖𝑖]/[∑ 𝑇𝑇𝑀𝑀𝑖𝑖𝑖𝑖𝑖𝑖𝑖𝑖𝑖𝑖/𝑖𝑖 ∑ 𝑇𝑇𝑀𝑀𝑖𝑖𝑖𝑖𝑖𝑖𝑖𝑖𝑖𝑖]𝑖𝑖𝑖𝑖𝑖𝑖𝑖𝑖𝑖𝑖𝑖𝑖𝑖𝑖𝑖𝑖𝑖𝑖𝑖𝑖 , where i indexes the HCC, j indexes the
beneficiary, k indexes the HRR, m indexes age, and n indexes gender.

We then turned to estimating margins by HCC and first determined the similarity of margins
across the two insurers and two years. To do so we computed a correlation matrix of the margins for
the two firms and two years.21
To gain precision at the HCC level our next step was to pool the data from both plans and years
and estimate margins and their associated standard errors for each HCC or combination of HCC’s.
Margins at the individual level, however, are very skewed because some individuals in HCC’s with high
reimbursement have little spending in a year. As a result, estimated standard errors were large, even
with substantial trimming. Consequently, we proceeded indirectly by first estimating cost for each HCC
or combination of HCC’s and then using predicted cost to estimate a margin. More specifically, we
estimated adjusted cost from a mixed model with a random effect for each HCC or combination of
HCC’s:
𝐶𝐶𝐶𝐶𝐶𝐶𝐶𝐶𝑖𝑖𝑖𝑖 = 𝑋𝑋𝑖𝑖𝑖𝑖𝛽𝛽 + 𝑢𝑢𝑖𝑖 + 𝑒𝑒𝑖𝑖𝑖𝑖 (1)
where 𝐶𝐶𝐶𝐶𝐶𝐶𝐶𝐶𝑖𝑖𝑖𝑖 is the cost for the jth individual with the ith HCC or combination of HCC’s, 𝑢𝑢𝑖𝑖 is a random
variance component, and 𝑒𝑒𝑖𝑖𝑖𝑖 is a randomly distributed error term; 𝑢𝑢 and 𝑒𝑒 are assumed to be
distributed N(0, σu2) and N(0, σe
2), respectively, and uncorrelated with each other. The 𝑋𝑋 vector includes
indicator variables for age (in 5 year bins with a top group of 85+), gender, age*gender, the original
reason for Medicare eligibility (disability, end stage renal disease, or age), Medicaid status, and indicator
variables for Hospital Referral Region (HRR), year, and insurer.
We next calculated a predicted cost for each HCC or combination of HCC’s as 𝑋𝑋𝑖𝑖𝑖𝑖�̂�𝛽 + 𝑢𝑢𝑖𝑖, where
�̂�𝛽 is the estimate of 𝛽𝛽 and then calculated an adjusted margin for HCCi as:
� 1𝑖𝑖𝑖𝑖� [∑ 𝑀𝑀𝑀𝑀𝑀𝑀𝑖𝑖 𝑅𝑅𝑀𝑀𝑅𝑅𝑀𝑀𝑖𝑖𝑅𝑅𝑀𝑀𝑖𝑖𝑖𝑖
𝑃𝑃𝑃𝑃𝑀𝑀𝑃𝑃𝑖𝑖𝑃𝑃𝑃𝑃𝑀𝑀𝑃𝑃 𝐶𝐶𝐶𝐶𝐶𝐶𝑃𝑃𝑖𝑖𝑖𝑖− 1𝑖𝑖 ] (2)
where 𝑛𝑛𝑖𝑖 is the number of beneficiaries in HCCi.
Standard errors for margins calculated using equations (1) and (2) were bootstrapped using 100
replications of the process just described; that is, we re-estimated equation (1) 100 times and used the
results to calculate (2). Because we control for geography at the level of the HRR, our method of
estimation suppresses across-county variation in revenue within HRR, but that should be modest
relative to the variation at the individual level in medical and drug cost in the denominator.
As a result, our estimated standard errors have a downward bias that is probably small.
The HCC model that CMS uses for risk adjustment is mainly additive in disease groups or HCC’s
with few HCC*HCC interactions (Pope, et al. 2004). In Newhouse, et al. (2013) we found that margins
varied with the number of HCC’s. This could stem from too few disease-disease interaction terms in the
CMS-HCC model, from efficiency differences as the number of HCC’s increases, or from differential
coding intensity across HCC’s. We have repeated that test with these newer data.
As mentioned above, to test for the importance of coding we exploit MA plans’ ability to code
diagnoses that are ascertained on Health Risk Assessments (HRA’s) during home health visits. MedPAC
has raised concern about diagnoses found in HRA’s that were not followed up by any physician claim
(Medicare Payment Advisory Commission 2016). Because the HCC’s established by such visits are
thought to be an important source of the additional coding intensity in MA, we compare margins using
all the claims with those computed by excluding beneficiaries with an HCC code in 2012 but no medical
claim in 2011 and similarly for the pair of years 2012 and 2013. For this group we infer the HCC code in
2012 came from an in-home visit in 2011 and similarly for 2013 and 2012. We can therefore test the
robustness of our results to omitting this group.
In Appendix A we describe another test of coding effects that we carried out using results from
Kronick and Welch (2014). The results of that test, however, left us unable to distinguish coding effects
from production efficiencies.
Results
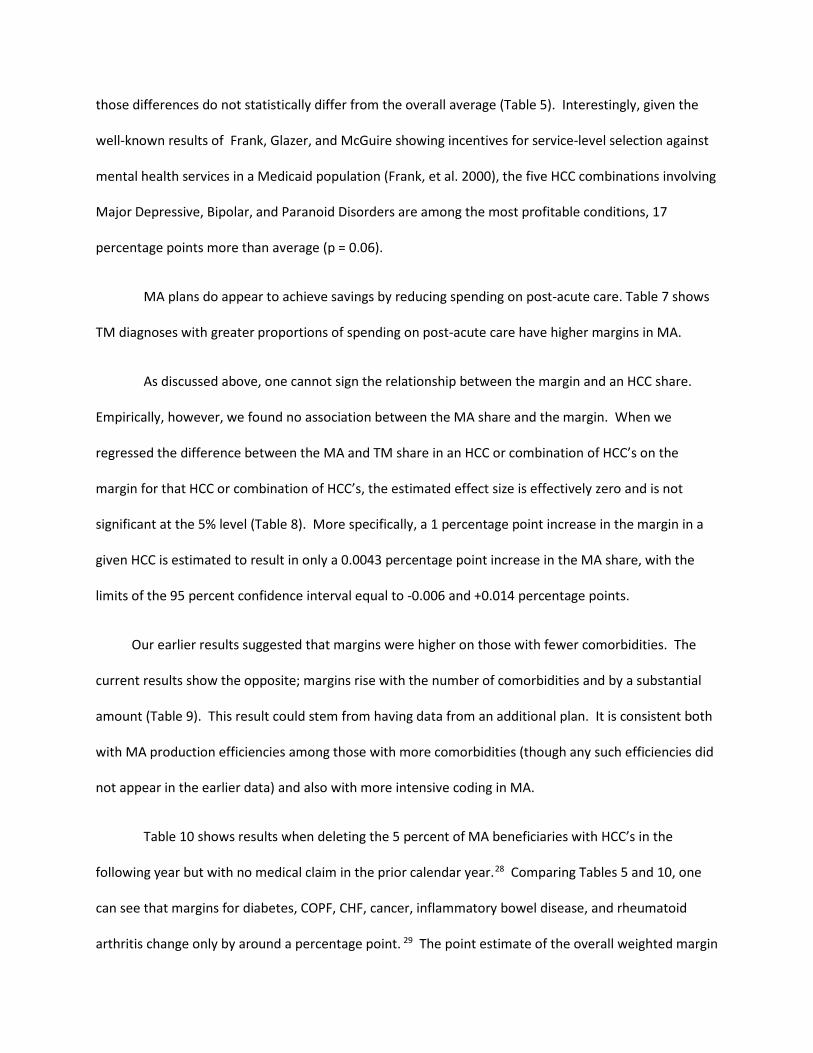
Figure 1 shows differences in the distributions of MA and TM beneficiaries across HCC’s and
combinations of HCC’s. Although not shown in Figure 1 to avoid compressing the scale, by far the
largest difference between the two distributions is the group with no coded HCC; 65 percent of the TM
group has no coded HCC but only 52 percent of the MA group has no coded HCC, consistent with more
intensive coding in MA (Kronick and Welch 2014).
As one can see in Figure 1, among coded HCC’s the absolute differences in percentage shares
are small. Other than the 13 percentage point difference in the no coded HCC group, a majority of
remaining differences are less than 0.1 percentage point and almost 90 percent are less than 0.25
percentage points (Table 1).
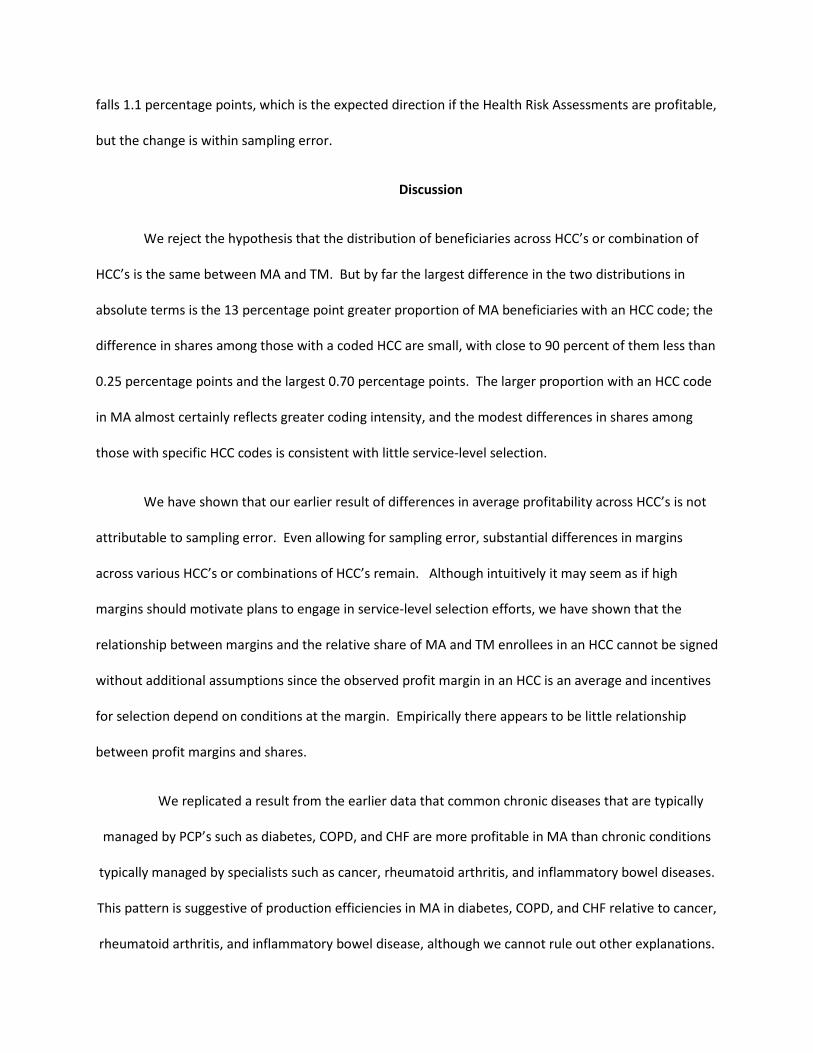
We now turn to profit margins at the HCC level. Table 2 shows the correlation matrix of
unadjusted margins for each insurer-year, weighted by the proportion of spending in each HCC or
combination of HCC’s. The n shown is the number of common HCC’s for that pair of insurer-years.
Within year, the correlation coefficients between the two firms are 0.29 in 2012 and 0.48 in 2013 for the
87 and 91 HCC’s or combination of HCC’s that are common across the two insurers in those years,
respectively. Within insurer the correlation coefficients are 0.67 and 0.73 across the two years. The
larger correlations within insurer reflect the stability of enrollees in each plan over time, but that all the
correlations are well below 1.0 indicates the magnitude of random error from the right-skewness of
health care spending. To improve precision, the remainder of our results pool across the two insurers
and two years.
Appendix Table B1 gives margins for all 117 HCC’s or combinations of HCC’s in our data, but to
simplify presentation for the reader Table 3 gives the margins (minus an arbitrary constant) for just the
HCC’s with the ten largest and ten smallest margins.22 Margins with 95% confidence intervals that
exclude zero are bolded.
Like the results in Newhouse, et al. (2013), the margins of the various HCC’s or combination of
HCC’s span a wide range.23 The range of the unadjusted (raw) margins is 166 percentage points from
the most profitable HCC, disorders of immunity, to the least profitable, a combination of congestive
heart failure with comorbidities of angina pectoris/old myocardial infarction, heart arrhythmias, and
vascular disease. Using the adjusted margins, the range is somewhat less but still large, 129 percentage
points. Overall, the adjustments do not much change the estimated margins; the Pearson correlation
coefficient between the adjusted and unadjusted margins is 0.98. The modest effect of the adjustments
implies the standard errors of the adjusted margins are mainly driven by the error variance rather than
the variance explained by the covariates in the 𝑋𝑋 vector.
The results shown in Table 3 and Appendix Table B1 are for the insurers’ individual MA business.
In Appendix Table B2 we show the results including their group MA business, with drug claims for that
portion of the group business for which there are data and with medical claims only for the entire
sample.24 Our conclusions are not materially changed by including data from the group MA plans.
We found in Newhouse, et al. (2013) that diabetes, chronic heart failure (CHF), and chronic
obstructive pulmonary disease (COPD), diseases capable of medical management and typically managed
by PCP’s, had notably higher margins than diseases typically managed by specialists such as cancer and
rheumatoid arthritis.25 In the earlier paper we simply assumed the type of physician that managed the
various conditions; Table 4 confirms that the earlier assumption about which type of physician managed
which disease was correct. Using the 20% random sample of TM Part B, it shows the percent of all Part
B charges and the percent of all outpatient charges generated by primary care providers in 2012 and
2013 for six diagnoses.26 We have added inflammatory bowel disease to the group of diseases typically
managed by specialists used in the earlier paper; this disease was not in the earlier sample of 48 HCC’s.
One can reject the hypothesis of no difference between the proportion of the charges allowed from
PCP’s for each of the three diseases usually managed by primary care providers and each of the three
managed by specialists at the 0.001 level.
That the three diseases typically managed by PCP’s and capable of medical management have
higher margins than those commonly managed by specialists can be seen in Table 5, which summarizes
the results in Appendix Table B1 for the diseases shown in Table 4. For example, of the 117 HCC’s or
combinations of HCC’s shown in Appendix Table B1, 39 involve diabetes. Table 5 shows that those 39
diabetes HCC’s, when weighted by their frequency of occurrence, are 7.3 percentage points (= -0.268 - (-
0.341)) more profitable than the weighted average of all HCC’s.27 The 21 HCC’s that involve COPD are
6.1 percentage points more profitable than the weighted average, and the 19 that involve CHF are 13.9
percentage points more profitable. As in the earlier work, the 17 various cancer HCC’s as well as
rheumatoid arthritis are less profitable than average, 6 and 5 percentage points respectively.
Inflammatory bowel disease is much less profitable than average.
Taken as a group, the three diseases managed by PCP’s and capable of medical management
have a 13.7 percentage point higher profit margins than the group of three diseases commonly
managed by specialists (Table 6).
In the earlier study the one acute disease in the sample of 48 HCC’s, unstable angina and other
ischemic heart disease, was the least profitable. The current sample has two acute conditions, unstable
angina and other acute ischemic heart disease and hip fracture/dislocation. The point estimates of their
margins show they are both less profitable than average, 2 and 16 percentage points respectively, but
those differences do not statistically differ from the overall average (Table 5). Interestingly, given the
well-known results of Frank, Glazer, and McGuire showing incentives for service-level selection against
mental health services in a Medicaid population (Frank, et al. 2000), the five HCC combinations involving
Major Depressive, Bipolar, and Paranoid Disorders are among the most profitable conditions, 17
percentage points more than average (p = 0.06).
MA plans do appear to achieve savings by reducing spending on post-acute care. Table 7 shows
TM diagnoses with greater proportions of spending on post-acute care have higher margins in MA.
As discussed above, one cannot sign the relationship between the margin and an HCC share.
Empirically, however, we found no association between the MA share and the margin. When we
regressed the difference between the MA and TM share in an HCC or combination of HCC’s on the
margin for that HCC or combination of HCC’s, the estimated effect size is effectively zero and is not
significant at the 5% level (Table 8). More specifically, a 1 percentage point increase in the margin in a
given HCC is estimated to result in only a 0.0043 percentage point increase in the MA share, with the
limits of the 95 percent confidence interval equal to -0.006 and +0.014 percentage points.
Our earlier results suggested that margins were higher on those with fewer comorbidities. The
current results show the opposite; margins rise with the number of comorbidities and by a substantial
amount (Table 9). This result could stem from having data from an additional plan. It is consistent both
with MA production efficiencies among those with more comorbidities (though any such efficiencies did
not appear in the earlier data) and also with more intensive coding in MA.
Table 10 shows results when deleting the 5 percent of MA beneficiaries with HCC’s in the
following year but with no medical claim in the prior calendar year.28 Comparing Tables 5 and 10, one
can see that margins for diabetes, COPF, CHF, cancer, inflammatory bowel disease, and rheumatoid
arthritis change only by around a percentage point. 29 The point estimate of the overall weighted margin
falls 1.1 percentage points, which is the expected direction if the Health Risk Assessments are profitable,
but the change is within sampling error.
Discussion
We reject the hypothesis that the distribution of beneficiaries across HCC’s or combination of
HCC’s is the same between MA and TM. But by far the largest difference in the two distributions in
absolute terms is the 13 percentage point greater proportion of MA beneficiaries with an HCC code; the
difference in shares among those with a coded HCC are small, with close to 90 percent of them less than
0.25 percentage points and the largest 0.70 percentage points. The larger proportion with an HCC code
in MA almost certainly reflects greater coding intensity, and the modest differences in shares among
those with specific HCC codes is consistent with little service-level selection.
We have shown that our earlier result of differences in average profitability across HCC’s is not
attributable to sampling error. Even allowing for sampling error, substantial differences in margins
across various HCC’s or combinations of HCC’s remain. Although intuitively it may seem as if high
margins should motivate plans to engage in service-level selection efforts, we have shown that the
relationship between margins and the relative share of MA and TM enrollees in an HCC cannot be signed
without additional assumptions since the observed profit margin in an HCC is an average and incentives
for selection depend on conditions at the margin. Empirically there appears to be little relationship
between profit margins and shares.
We replicated a result from the earlier data that common chronic diseases that are typically
managed by PCP’s such as diabetes, COPD, and CHF are more profitable in MA than chronic conditions
typically managed by specialists such as cancer, rheumatoid arthritis, and inflammatory bowel diseases.
This pattern is suggestive of production efficiencies in MA in diabetes, COPD, and CHF relative to cancer,
rheumatoid arthritis, and inflammatory bowel disease, although we cannot rule out other explanations.

Furthermore, the differences in margins among these six conditions are not much affected by excluding
claims from beneficiaries who had an HCC established through an in-home Health Risk Appraisal but had
no subsequent medical claim. We also showed that HCC’s with a higher proportion of spending on post-
acute care in TM have higher margins in MA, consistent with efficiency from better medical
management in MA or with more favorable selection in those HCCs. Further progress on assessing
relative production efficiencies across HCC’s is likely to require more detailed clinical data. Finally, that
20 percent of MA beneficiaries had an HCC code from an in home visit and no subsequent medical claim
indicates that subsequent research comparing MA and TM that uses HCC codes or risk scores derived
from claims data needs to consider potential biases from coding effects.
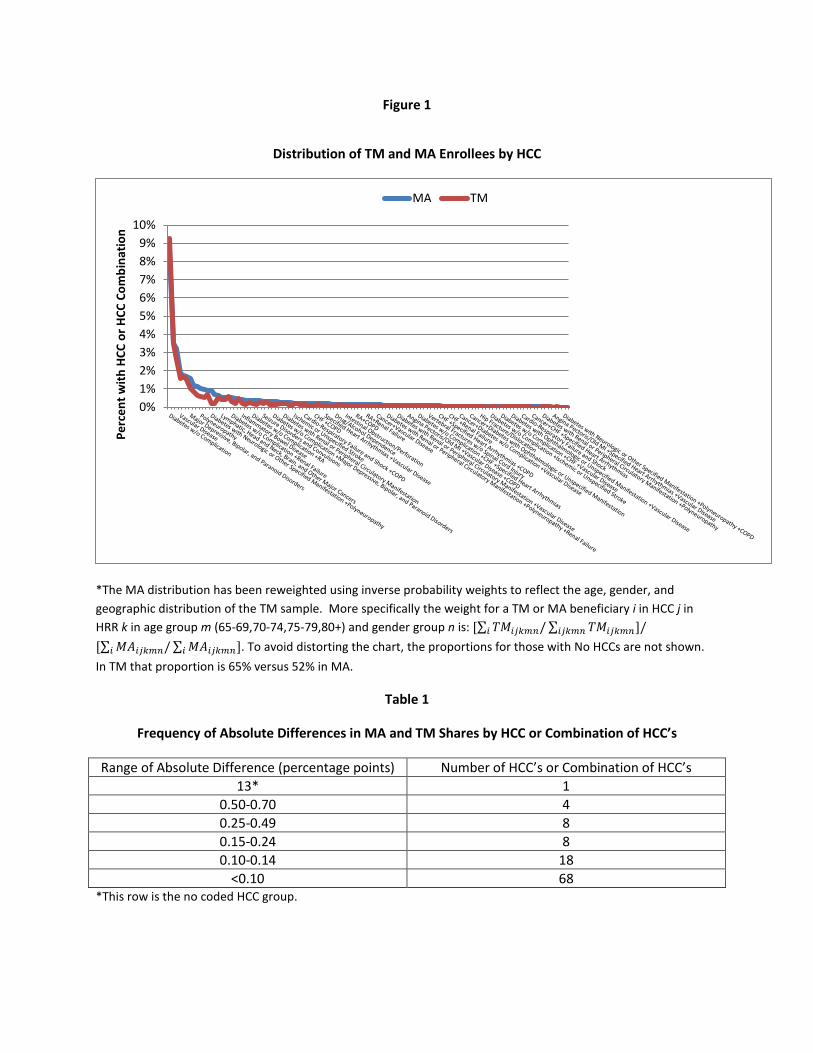
Figure 1
Distribution of TM and MA Enrollees by HCC
*The MA distribution has been reweighted using inverse probability weights to reflect the age, gender, and geographic distribution of the TM sample. More specifically the weight for a TM or MA beneficiary i in HCC j in HRR k in age group m (65-69,70-74,75-79,80+) and gender group n is: [∑ 𝑇𝑇𝑇𝑇𝑖𝑖𝑖𝑖𝑖𝑖𝑖𝑖𝑖𝑖/𝑖𝑖 ∑ 𝑇𝑇𝑇𝑇𝑖𝑖𝑖𝑖𝑖𝑖𝑖𝑖𝑖𝑖]/𝑖𝑖𝑖𝑖𝑖𝑖𝑖𝑖𝑖𝑖
[∑ 𝑇𝑇𝑀𝑀𝑖𝑖𝑖𝑖𝑖𝑖𝑖𝑖𝑖𝑖/𝑖𝑖 ∑ 𝑇𝑇𝑀𝑀𝑖𝑖𝑖𝑖𝑖𝑖𝑖𝑖𝑖𝑖]𝑖𝑖 . To avoid distorting the chart, the proportions for those with No HCCs are not shown. In TM that proportion is 65% versus 52% in MA.
Table 1
Frequency of Absolute Differences in MA and TM Shares by HCC or Combination of HCC’s
Range of Absolute Difference (percentage points) Number of HCC’s or Combination of HCC’s 13* 1
0.50-0.70 4 0.25-0.49 8 0.15-0.24 8 0.10-0.14 18
<0.10 68 *This row is the no coded HCC group.
0%1%2%3%4%5%6%7%8%9%
10%
Perc
ent w
ith H
CC o
r HCC
Com
bina
tion
MA TM
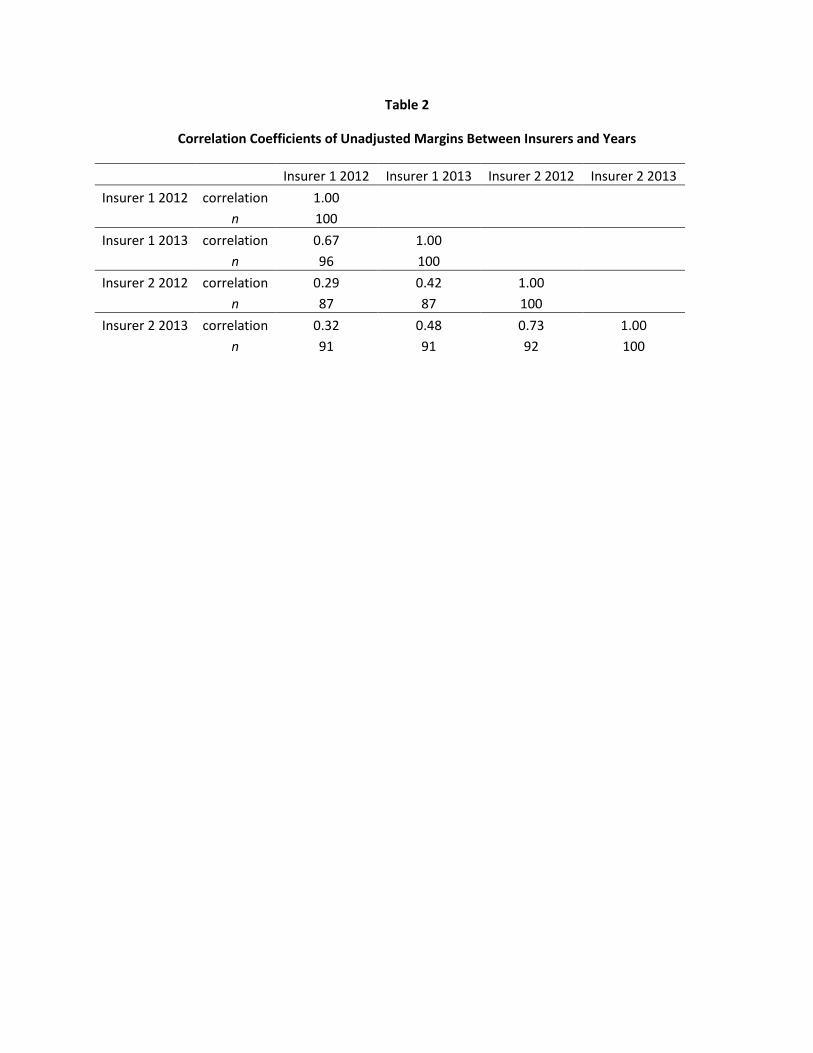
Table 2
Correlation Coefficients of Unadjusted Margins Between Insurers and Years
Insurer 1 2012 Insurer 1 2013 Insurer 2 2012 Insurer 2 2013
Insurer 1 2012 correlation 1.00
n 100
Insurer 1 2013 correlation 0.67 1.00
n 96 100
Insurer 2 2012 correlation 0.29 0.42 1.00
n 87 87 100
Insurer 2 2013 correlation 0.32 0.48 0.73 1.00
n 91 91 92 100

Table 3
The Ten HCC’s with the Most Positive and Most Negative Margins Minus an Arbitrary Constant
Using Pooled Results for the Non-Group Business of Both Insurers for Both Years*
HCC1 HCC2 HCC3 Adjusted Margin
Unadjusted Margin
The Ten Most Positive HCC’s or Combinations Disorders of Immunity 0.582 0.864 Diabetes with Renal or Peripheral Circulatory Manifestation
Polyneuropathy Vascular Disease /Renal Failure** 0.487 0.497
Congestive Heart Failure Renal Failure 0.343 0.252
Diabetes with Neurologic or Other Specified Manifestation Polyneuropathy
Chronic Obstructive Pulmonary Disease
0.332 0.251
Diabetes without Complication Congestive Heart Failure
Chronic Obstructive Pulmonary Disease
0.284 0.115
Major Depressive, Bipolar, and Paranoid Disorders Vascular Disease 0.241 0.279
Diabetes with Renal or Peripheral Circulatory Manifestation
Polyneuropathy Vascular Disease 0.222 0.169
Diabetes with Renal or Peripheral Circulatory Manifestation
Polyneuropathy Renal Failure 0.212 0.263
Vascular Disease Chronic Obstructive Pulmonary Disease Renal Failure 0.186 0.247
Diabetes with Renal or Peripheral Circulatory Manifestation
Vascular Disease Renal Failure 0.176 0.188

The Ten Most Negative HCC’s or Combinations Hip Fracture/Dislocation -0.501 -0.541
Congestive Heart Failure Vascular Disease Chronic Obstructive Pulmonary Disease -0.503 -0.630
Diabetes with Ophthalmologic or Unspecified Manifestation Vascular Disease -0.506 -0.577
Angina Pectoris/Old Myocardial Infarction
Specified Heart Arrhythmias Vascular Disease -0.518 -0.578
Breast, Prostate, Colorectal and Other Cancers and Tumors
Angina Pectoris/Old Myocardial Infarction
-0.525 -0.558
Inflammatory Bowel Disease -0.565 -0.560
Congestive Heart Failure Angina Pectoris/Old Myocardial Infarction
Vascular Disease -0.600 -0.705
Diabetes without Complication Congestive Heart Failure Vascular Disease -0.601 -0.693
Lung, Upper Digestive Tract, and Other Severe Cancers -0.643 -0.672
Congestive Heart Failure Angina Pectoris/Old Myocardial Infarction
Specified Heart Arrhythmias/Vascular Disease**
-0.703 -0.792
*Margin is Revenue from HCCi/Medical and Drug Cost of HCCi - 1. An arbitrary constant has been subtracted from each value to preserve confidentiality. **For these two rows only, there were four conditions that were coded; to save adding a column, we show both the third and fourth comorbidity in one cell.
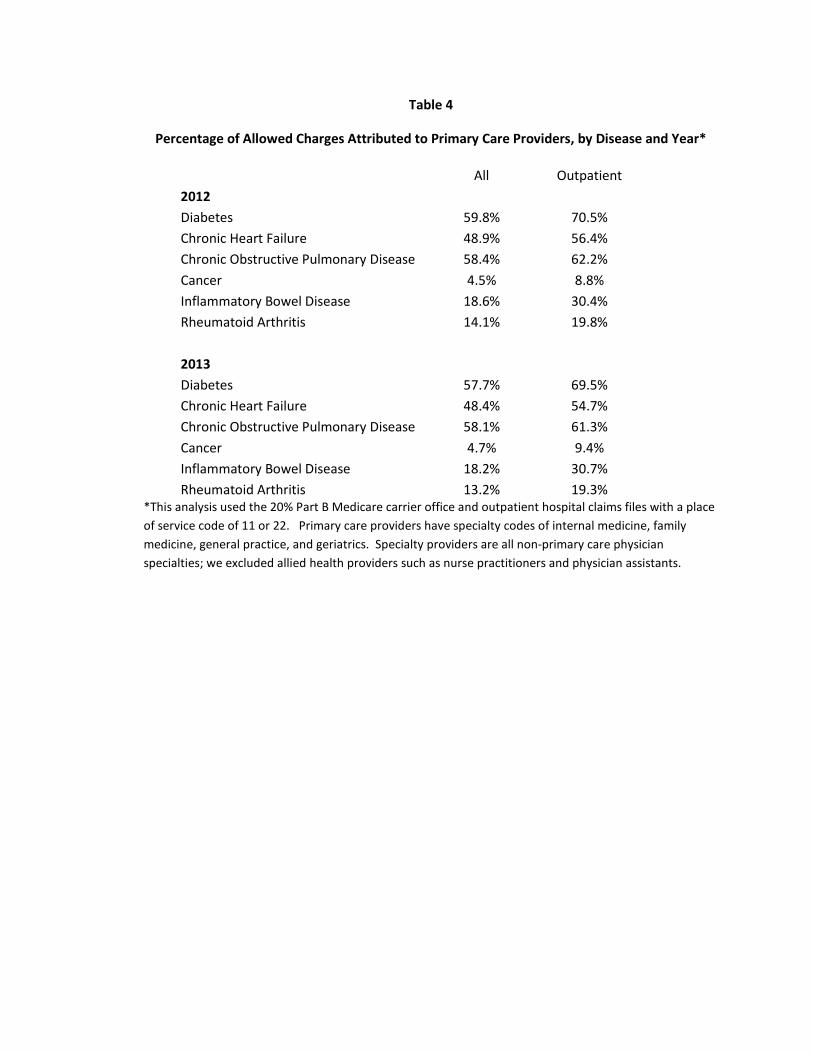
Table 4
Percentage of Allowed Charges Attributed to Primary Care Providers, by Disease and Year*
All Outpatient
2012 Diabetes 59.8% 70.5%
Chronic Heart Failure 48.9% 56.4% Chronic Obstructive Pulmonary Disease 58.4% 62.2% Cancer 4.5% 8.8% Inflammatory Bowel Disease 18.6% 30.4% Rheumatoid Arthritis 14.1% 19.8%
2013 Diabetes 57.7% 69.5%
Chronic Heart Failure 48.4% 54.7% Chronic Obstructive Pulmonary Disease 58.1% 61.3% Cancer 4.7% 9.4% Inflammatory Bowel Disease 18.2% 30.7% Rheumatoid Arthritis 13.2% 19.3%
*This analysis used the 20% Part B Medicare carrier office and outpatient hospital claims files with a place of service code of 11 or 22. Primary care providers have specialty codes of internal medicine, family medicine, general practice, and geriatrics. Specialty providers are all non-primary care physician specialties; we excluded allied health providers such as nurse practitioners and physician assistants.
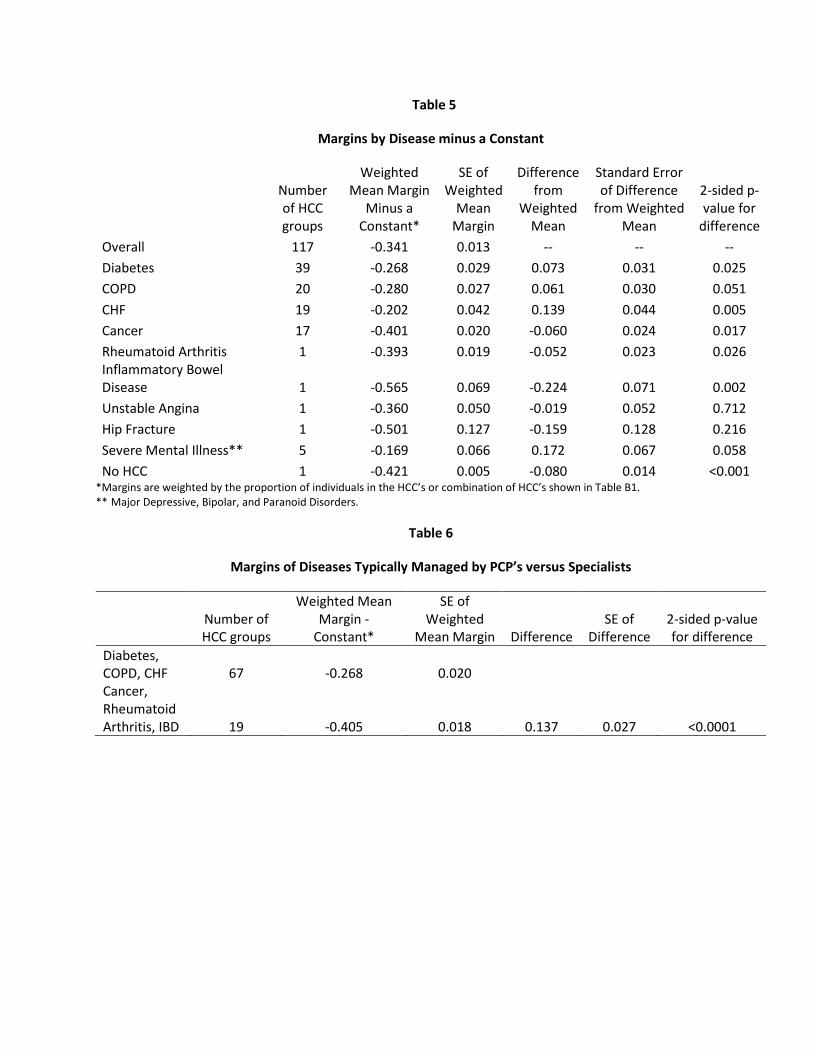
Table 5
Margins by Disease minus a Constant
Number of HCC groups
Weighted Mean Margin
Minus a Constant*
SE of Weighted
Mean Margin
Difference from
Weighted Mean
Standard Error of Difference
from Weighted Mean
2-sided p-value for
difference Overall 117 -0.341 0.013 -- -- -- Diabetes 39 -0.268 0.029 0.073 0.031 0.025 COPD 20 -0.280 0.027 0.061 0.030 0.051 CHF 19 -0.202 0.042 0.139 0.044 0.005 Cancer 17 -0.401 0.020 -0.060 0.024 0.017 Rheumatoid Arthritis 1 -0.393 0.019 -0.052 0.023 0.026 Inflammatory Bowel Disease 1 -0.565 0.069 -0.224 0.071 0.002 Unstable Angina 1 -0.360 0.050 -0.019 0.052 0.712 Hip Fracture 1 -0.501 0.127 -0.159 0.128 0.216 Severe Mental Illness** 5 -0.169 0.066 0.172 0.067 0.058 No HCC 1 -0.421 0.005 -0.080 0.014 <0.001
*Margins are weighted by the proportion of individuals in the HCC’s or combination of HCC’s shown in Table B1. ** Major Depressive, Bipolar, and Paranoid Disorders.
Table 6
Margins of Diseases Typically Managed by PCP’s versus Specialists
Number of HCC groups
Weighted Mean Margin -
Constant*
SE of Weighted
Mean Margin Difference SE of
Difference 2-sided p-value for difference
Diabetes, COPD, CHF 67 -0.268 0.020
Cancer, Rheumatoid Arthritis, IBD 19 -0.405 0.018 0.137 0.027 <0.0001

Table 7
Relationship between Margins and % of TM Parts A and B Charges from Post-Acute Care*
Coefficient SE p-value 95% CI
% Post-Acute 0.0391 0.0058 <0.0001 0.0277 0.0505 Intercept -0.3380 0.0595 <0.0001 -0.4558 -0.2202
*Post-Acute Care is defined as the proportion of all TM Parts A and B charges that are from Skilled Nursing Facilities, home health, Inpatient Rehabilitation Facilities, and Long-Term Care Hospitals. These results are weighted by the number of beneficiaries in the HCC. This relationship is robust if the observations are not weighted and also if beneficiaries with an HCC but no medical claim are deleted from the sample.
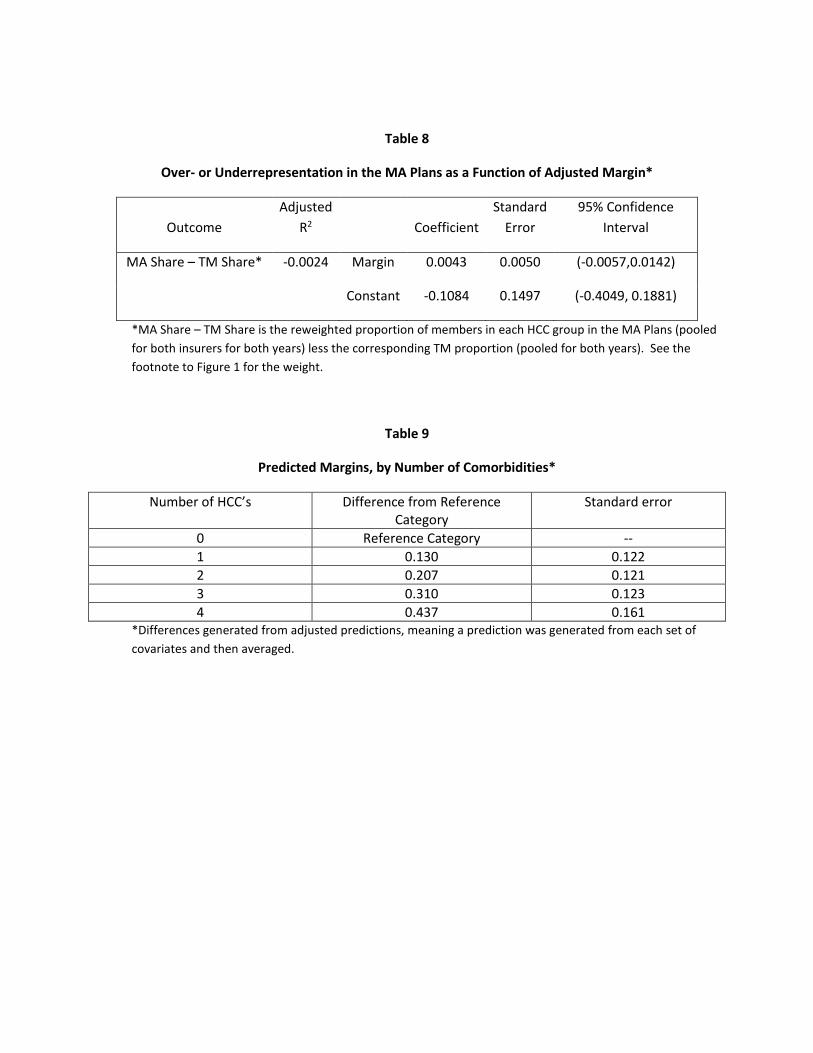
Table 8
Over- or Underrepresentation in the MA Plans as a Function of Adjusted Margin*
Outcome Adjusted
R2 Coefficient Standard
Error 95% Confidence
Interval
MA Share – TM Share* -0.0024 Margin 0.0043 0.0050 (-0.0057,0.0142)
Constant -0.1084 0.1497 (-0.4049, 0.1881)
*MA Share – TM Share is the reweighted proportion of members in each HCC group in the MA Plans (pooled for both insurers for both years) less the corresponding TM proportion (pooled for both years). See the footnote to Figure 1 for the weight.
Table 9
Predicted Margins, by Number of Comorbidities*
Number of HCC’s Difference from Reference Category
Standard error
0 Reference Category -- 1 0.130 0.122 2 0.207 0.121 3 0.310 0.123 4 0.437 0.161
*Differences generated from adjusted predictions, meaning a prediction was generated from each set of covariates and then averaged.
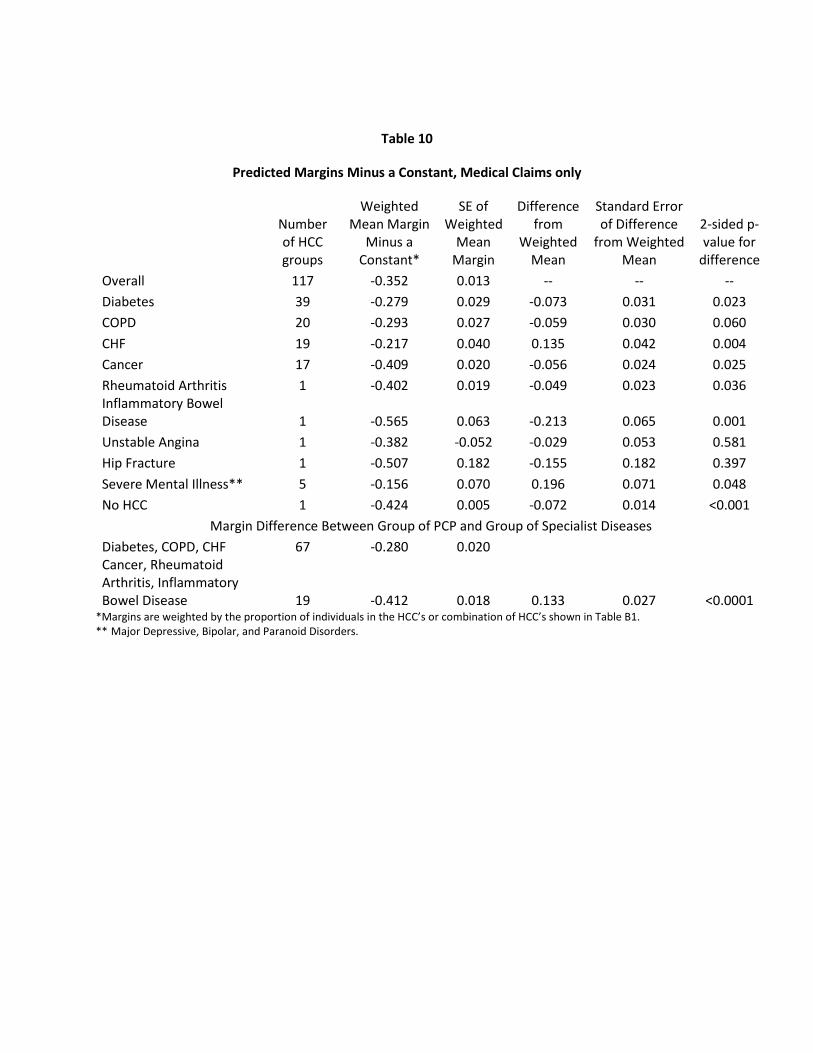
Table 10
Predicted Margins Minus a Constant, Medical Claims only
Number of HCC groups
Weighted Mean Margin
Minus a Constant*
SE of Weighted
Mean Margin
Difference from
Weighted Mean
Standard Error of Difference
from Weighted Mean
2-sided p-value for
difference Overall 117 -0.352 0.013 -- -- -- Diabetes 39 -0.279 0.029 -0.073 0.031 0.023 COPD 20 -0.293 0.027 -0.059 0.030 0.060 CHF 19 -0.217 0.040 0.135 0.042 0.004 Cancer 17 -0.409 0.020 -0.056 0.024 0.025 Rheumatoid Arthritis 1 -0.402 0.019 -0.049 0.023 0.036 Inflammatory Bowel Disease 1 -0.565 0.063 -0.213 0.065 0.001 Unstable Angina 1 -0.382 -0.052 -0.029 0.053 0.581 Hip Fracture 1 -0.507 0.182 -0.155 0.182 0.397 Severe Mental Illness** 5 -0.156 0.070 0.196 0.071 0.048 No HCC 1 -0.424 0.005 -0.072 0.014 <0.001
Margin Difference Between Group of PCP and Group of Specialist Diseases Diabetes, COPD, CHF 67 -0.280 0.020 Cancer, Rheumatoid Arthritis, Inflammatory Bowel Disease 19 -0.412 0.018 0.133 0.027 <0.0001
*Margins are weighted by the proportion of individuals in the HCC’s or combination of HCC’s shown in Table B1. ** Major Depressive, Bipolar, and Paranoid Disorders.
REFERENCES
Austin, Daniel R., and Laurence C. Baker. (2015). "Less Physician Practice Competition Is Associated with Higher Prices Paid for Common Procedures." Health Affairs, 34(10): 1753-1760.
Azevedo, Eduardo M., and Daniel Gottlieb. (2017). "Perfect Competition in Markets with Adverse Selection." Econometrica, 85(1): 67-105.
Baker, Laurence C., M. Kate Bundorf, Anne B. Royalty, and Zachary Levin. (2014). "Physician Practice Competitioin and Prices Paid by Private Insurers for Office Visits." JAMA, 312(16): 1653-1662.
Breyer, Friedrich, M. Kate Bundorf, and Mark V. Pauly. (2012). "Health Care Spending Risk, Health Insurance, and Payment to Health Plans." In Handbook of Health Economics. Edited by Mark V. Pauly, Thomas G. McGuire, and Pedro Pita Barros. 2: 691-762. Amsterdam: North-Holland.
Brown, Jason, Mark Duggan, Ilyana Kuziemko, and William Woolston. (2014). "How Does Risk Selection Respnd to Risk Adjustment? Evidence from the Medicare Advantage Program." American Economic Review, 104(10): 3335-3364.
Clemens, Jeffrey, and Joshua D. Gottlieb. (2017). "In the Shadow of a Giant: Medicare's Influence on Private Physician Payments." Journal of Political Economy, 125(1): 1-39.
Congressional Budget Office. (1997). "Predicting How Changes in Medicare Payment Rates Would Affect Risk-Sector Enrollment and Costs." Washington, DC: Congressional Budget Office.
Cooper, Zack, Stuart V. Craig, Martin Gaynor, and John van Reenen. (2015). "The Price Ain't Right? Hospital Prices and Health Spending on the Privately Insured." Cambridge: National Bureau of Economic Research. Working Paper 21815.
Cutler, David M., and Sarah J. Reber. (1998). "Paying for Health Insurance: The Tradeoff Between Competition and Adverse Selection." Quarterly Journal of Economics, 113(2): 433-466.
Einav, Liran, and Amy Finkelstein. (2011). "Selection in Insurance Markets: Theory and Empirics in Pictures." Journal of Economic Perspectives, 25(1): 115-138.
Einav, Liran, Amy Finkelstein, and Mark. R. Cullen. (2010). "Estimating Welfare in Insurance Markets Using Variation in Prices." Quarterly Journal of Economics, 125(3): 877-921.
Frank, Richard G., Jacob Glazer, and Thomas G. McGuire. (2000). "Adverse Selection in Managed Health Care." Journal of Health Economics, 19(6): 829-854.
Geruso, Michael, and Timothy J. Layton. (2015). "Upcoding: Evidence from Medicare on Squishy Risk Adjustment." Cambridge, MA: National Bureau of Economic Research. Working Paper 21222.
Geruso, Michael, and Timothy J. Layton. (2017). "Risk Selection and Regulatory Interventions." Journal of Economic Perspectives, 31(4): 23-50.
Geruso, Michael, Timothy J. Layton, and Daniel Prinz. (2017). "Screening in Contract Design: Evidence from the ACA Health Insurance Exchanges." Cambridge: National Bureau of Economic Research. Working Paper 22832.
Geruso, Michael, and Thomas G. McGuire. (2016). "Tradeoffs in the Design of Health Plan Payment Systems: Fit, Power, and Balance." Journal of Health Economics, 47: 1-19.
Kronick, Richard, and W. Pete Welch. (2014). "Measuring Coding Intensity in the Medicare Advantage Program." Medicare & Medicaid Research Review, 4(2): E1-E19.
Layton, Timothy J., Randall P. Ellis, and Thomas G. McGuire. (2015). "Assessing Incentives for Selection in Health Insurance Payment Systems." Cambridge: National Bureau of Economic Research. Working Paper 21531.
Layton, Timothy J., Thomas G. McGuire, and Richard C. van Kleef. (2016). "Deriving Risk Adjustment Payment Weights to Maximize Efficiency of Health Insurance Markets." Cambridge: National Bureau of Economic Research. Working Paper 22642.
Luft, Harold S. (1981). Health Maintenance Organizations. New York: Wiley.

McGuire, Thomas G., and Richard C. van Kleef. (2017). "Introduction to the Special Section: Health Plan Payment in Regulated Competition." Journal of Health Economics, 56: 234-236.
Medicare Payment Advisory Commission. (1998). "Report to the Congress: Medicare Payment Policy, March 1998, Analytical Papers, Volume II." Washington, DC: Medicare Payment Advisory Commission.
Medicare Payment Advisory Commission. (2011). "Medicare and the Health Care Delivery System." Washington, DC: Medicare Payment Advisory Commission.
Medicare Payment Advisory Commission (2015), "Report to the Congress: Medicare Payment Policy. Washington, DC, Medicare Payment Advisory Commission.
Medicare Payment Advisory Commission. (2016). "Report to the Congress: Medicare Payment Policy." Washington, DC: Medicare Payment Advisory Commission.
Newhouse, Joseph P. (2017). "Risk Adjustment with an Outside Option." Journal of Health Economics, 56: 256-258.
Newhouse, Joseph P., and Alan M. Garber. (2013). "Geographic Variation in Medicare Services." New England Journal of Medicine, 368(16): 1465-1468.
Newhouse, Joseph P., and Thomas G. McGuire. (2014). "How Successful Is Medicare Advantage?" The Milbank Quarterly, 92(2): 351-394.
Newhouse, Joseph P., J. Michael McWilliams, Mary Price, Jie Huang, Bruce Fireman, and John Hsu. (2013). "How Much Do Health Plans Select?" Journal of Health Economics, 32(6): 1278-1288.
Newhouse, Joseph P., Mary Price, J. Michael McWilliams, John Hsu, and Thomas G. McGuire. (2015). "How Much Selection Is Left in Medicare Advantage?" American Journal of Health Economics, 1(1): 1-26.
Pope, Gregory C., John Kautter, Randall P. Ellis, Arlene S. Ash, John Z. Ayanian, Lisa I. Iezzoni, Melvin J. Ingber, Jesse M. Levy, and John Robst. (2004). "Risk Adjustment of Medicare Capitation Payments Using the CMS-HCC Model." Health Care Financing Review, 25(4): 119-141.
Rothschild, Michael, and Joseph Stiglitz. (1976). "Equilibrium in Competitive Insurance Markets: An Essay on the Economics of Imperfect Information." Quarterly Journal of Economics, 90(4): 629-650.
Schwartz, Aaron L., Bruce E. Landon, Adam G. Elshaug, Michael E. Chernew, and J. Michael McWilliams. (2014). "Measuring Low-Value Care in Medicare." JAMA Internal Medicine, 174(7): 1067-1076.
White, Chapin, Amelia M. Bond, and James D. Reschovsky. (2013). "High and Varying Prices for Privately Insured Patients Underscore Hospital Market Power." Washington, DC Center for Studying Health System Change. Report Number 27. http://www.hschange.org/CONTENT/1375/1375.pdf
Endnotes
1 The availability of in-network specialists in one type of disease, for example, might be greater, the more attractive are patients with that type of disease to the insurer. 2 In practice these policy tools are imperfect; for example, the ACA’s exchange contracts for the under 65 have placed drugs used by some disfavored classes of patients on a high tier. 3 Medicare does not use reinsurance except in Part D. Medicare Part A is free to individuals who qualify for Social Security benefits. Although Parts B and D require a premium, they are sufficiently subsidized that selection into the insured pool (as opposed to not purchasing Parts B and D) is not a serious problem. 4 The initial lock-in period in 2006 was the last six months of the calendar year, but that has now been extended to the last 10.5 months of the year. In commercial insurance the lock-in period is almost always a calendar year. 5 These findings are not without controversy. (Brown, et al. 2014) find that diagnosis-based risk adjustment increased within-HCC selection, but Newhouse et al. (2015) show that Brown, et al.’s findings do not hold up in a larger sample with additional years and that the within-HCC degree of selection did not appreciably change from before to after the reforms. 6 The health services research literature starting with Luft (1981) has typically assumed a uniformly lower cost of treatment in health maintenance organizations or empirically shown lower utilization in the aggregate, for example, a lower rate of inpatient admissions. 7 In addition to diagnoses, the characteristics accounted for are age, sex, Medicaid status, institutional status, and original reason for Medicare eligibility (age, disability, end stage renal disease, amyotrophic lateral sclerosis), plus a small number of interactions. Unlike risk adjustment in the exchanges for the under 65, which is zero-sum among participating insurers, risk adjustment in Medicare is normed on Traditional Medicare (Newhouse 2017). 8 One of the two insurers here is the same as in the earlier paper. In the earlier work we also obtained margin data from a second insurer for 2006 and 2007, but that insurer calculated its margins with its administrative cost allocated to individual HCC’s. Thus, the margins of the two insurers were not directly comparable although they were positively correlated (r = 0.39, p < 0.003), probably because 80-85 percent of the insurer’s costs are medical. Most administrative costs are joint across HCC’s and many are also joint across other lines of business, so any allocation of those costs to HCC’s introduces an arbitrary element into the margin. 9 Of the 10 percent that switch, 8 percent switch to another MA plan and 2 percent switch to TM. Some switches are involuntary because the MA plan withdrew from the local market. 10 For a discussion of low-value services see (Schwartz, et al. 2014). 11 Specialty drugs represent a variant of the market power argument, because the pharmaceutical firm has market power for single source drugs. For diseases or indications in which a specialty drug is both the dominant treatment choice and a substantial share of the cost of treatment, MA plans would have little competitive advantage; in contrast, for indications in which there is a large price range in treatment substitutes or for which appropriate treatments for many patients could involve substitution of less expensive drugs, MA plans could have cost advantages when compared to TM. We tested whether margins were higher in HCC’s with greater use of Part B drugs, which are often single source and expensive, but found no relationship. 12 There are 47 National Cancer Institute designated comprehensive cancer hospitals. Examples include M.D. Anderson and Memorial Sloan-Kettering. A complete list can be found at https://www.cancer.gov/research/nci-role/cancer-centers . 13 Commercial fees are about 25 percent above TM fees (Medicare Payment Advisory Commission 2011). 14 Cumulatively the adjustments have been substantial; 3.41% in 2010, 2011, 2012, and 2013, 4.91% in 2014 and 2015, 5.41% in 2016, and 5.66% in 2017 (Medicare Payment Advisory Commission 2016). 15 In 2014 CMS introduced a new set of HCC weights that adjusted down some weights in HCC’s that it suspected were being more aggressively coded (Medicare Payment Advisory Commission 2016). 16 The calculated margin is thus the reciprocal of the Medical Loss Ratio at the HCC level. 17 There is also some variation from the different geographical distribution of MA enrollees by HCC relative to TM enrollees. We have corrected for this by controlling for the Hospital Referral Region. We also ignore any variation in reinsurance payments from Part D. These are not separately identified in the data, but should be small relative
to other elements of across-HCC variation. Note many cancer drugs are covered under Part B where there is no reinsurance. 18 Deaths are not random across HCC’s, but the distribution of deaths across HCC’s in MA should approximate the distribution of deaths across HCC’s in TM, and so this lack of randomness should not much affect our results. Spending of decedents is included for the part of the year they were alive. 19 These were persons with two plan identification numbers. 20 For this purpose we only used TM beneficiaries enrolled in both Parts A and B because Medicare Advantage enrollees are required to enroll in both Parts A and B. 21 We show Pearson correlation coefficients below; Spearman correlation coefficients are very similar. 22 Although we had data on the 100 most frequent HCC’s or combination of HCC’s for each insurer-year, these HCC’s and combinations were not the same across insurers or years, so there are 117 unique HCC’s or combination of HCC’s across the four insurer-years. 23 The data in Table 2 are averages of ratios whereas the data in Newhouse (2013) were ratios of averages. Although these quantities will in general differ, the similar qualitative results are reassuring. 24 The margins with drug claims are always lower than with medical claims only because the revenue for the Part D drug plan is included in revenue in both columns in Table B2. 25 In Newhouse (2013) we treated multiple sclerosis as a disease typically managed by specialists that it is not in the top 100 HCC’s in the current sample if we restrict the sample to only individual MA business. It does appear when we add the group business to the sample (Appendix Table B2). In that sample using the adjusted results it is among the ten most negative margin HCC’s. 26 The percentages are lower for all outpatient settings since specialists are more often providing inpatient care. 27 We calculate average margins in this fashion rather than a regression of beneficiary spending on a main effect only model for two reasons. First, any selection by diagnosis has to be done at the individual level where diagnoses are bundled. Second, we do not wish to assume no interactions among comorbidities. 28 The proportion of beneficiaries with an HCC but no medical claim in the subsequent year varied by HCC, from 0% to 20%. 29 We subtracted the same constant from Tables 3 and 6.


