

THE COMPLEX OF 2-AMINOTHIOPHENOL LIGAND WITH PLATINUM:
A NOVEL PLATINUM BLUES CONTAINING SULFUR DONOR LIGAND
A THESIS SUBMITTED TO THE GRADUATE SCHOOL OF NATURAL AND APPLIED SCIENCES
OF MIDDLE EAST TECHNICAL UNIVERSITY
BY
İSMAİL ERİLHAN
IN PARTIAL FULFILLMENT OF THE REQUIREMENTS FOR
THE DEGREE OF MASTER OF SCIENCE IN
DEPARTMENT OF CHEMISTRY
JUNE 2007

iii
I hereby declare that all information in this document has been obtained and presented in accordance with academic rules and ethical conduct. I also declare that, as required by these rules and conduct, I have fully cited and referenced all material and results that are not original to this work. Name, Last name :
Signature :

iv
ABSTRACT
COMPLEX OF 2-AMINOTHIOPHENOL LIGAND WITH PLATINUM:
A NOVEL PLATINUM BLUES CONTAINING SULFUR DONOR LIGAND
Erilhan, İsmail
M.S. Department of Chemistry
Supervisor: Prof. Dr. Hüseyin İşçi
Co-supervisor: Assoc. Prof. Dr. Şeniz Özalp Yaman
June 2007, 68 pages
The reaction of K2PtCl4 with 2-aminothiophenol (H2-atp), C6H5(SH)(NH2),
yielded a dark blue solid product. This work is about the characterization of this dark
blue solid and the investigation of its binding interaction to DNA and enzyme activity.
The blue solid product or the “blue complex” (as we called it in this work) is
soluble in acetone, acetonitrile and DMSO yielding a blue solution. It is stable in
solution and has a very strong absorption band at 724 nm (molar absorptivity in acetone
is 57782 M-1cm-1 per mole of platinum).

v
The product is paramagnetic and displays one kind of platinum in XPS (platinum
4f7/2 and 4f5/2 binding energies were obtained at 71.1 and 74.6 eV, respectively). The
elemental (C, H, N, S, Pt) analysis indicated that the platinum to ligand (2-
aminothiophenolate) mole ratio is 1:2. The interpretation of the data collected from
elemental analysis and ESR, XPS, 1H-, 13C-, 195Pt-NMR, CV measurements leads to
conclude that the blue complex prepared in this work is a new platinum blues with a
formula [PtIIIPt3II(2-atp)8(OH)(H2O)], where 2-atp is 2-aminothiophenolate ligand. This
is the first example of platinum blues, in which the bridging ligand is a nitrogen and
sulfur donor one. The proposed structure can be visualized as a dimer of binuclear head-
to-head isomer of [Pt2II(2-atp)4], with C2h symmetry. The band at 724 nm is assigned to
an allowed electronic transition from a metal-5dz2 orbitals based MO to metal-6pz
orbitals based MO in tetranuclear core.
In order to determine the binding mode of the blue complex to ct-DNA,
electronic absorption spectroscopy is employed and hyperchromism about 17.5 % is
observed, which indicates a weak binding of the blue complex to DNA, such as
electrostatic interaction of metal ions or H-bonding through the hydroxyl group of the
complex. Voltammetric titration carried out in solution suggested the preferential
stabilization of Pt(III) to Pt(II) on binding to DNA. The blue complex inhibits the GSTs
activity between 45-200 µM, in sheep liver GST enzyme. The GST enzymes causes drug
resistance, therefore inhibition of this enzyme suggests that this complex can be used in
combined chemotherapy.
Keywords: Platinum Blues, Mixed-Valenced Platinum Complexes, Sulfur Donor
Ligand, Spectroelectrochemistry.

vi
ÖZ
2-AMİNOTİYOFENOL LİGANDININ
PLATİN İLE KOMPLEKSİ: SÜLFÜRLÜ LİGAND İÇEREN
YENİ PLATİN MAVİSİ
Erilhan, İsmail
Yüksek Lisans, Kimya Bölümü
Tez Yöneticisi: Prof. Dr. Hüseyin İşçi
Ortak Tez Yöneticisi: Doç. Dr. Şeniz Özalp Yaman
Haziran 2007, 68 sayfa
K2PtCl4 ile 2-aminotiyofenol (H2-atp), C6H5(SH)(NH2), ligandının reaksiyonu
sonucunda lacivert katı bir ürün elde edilmiştir. Bu çalışma, bu lacivert katının
karakterizasyonu, DNA bağlanma etkileşimi ve enzim aktivitesinin araştırılması ile
ilgilidir.
Katı lacivert ürün veya bu çalışmada adlandırıldığı şekliyle “mavi kompleks”,
asetonda, asetonitrilde ve DMSO içerisinde çözünür olup mavi bir çözelti vermektedir.
Çözelti içerisinde kararlı olup, 724 nm’de çok güçlü bir soğurma bandı vermektedir
(Asetonda molar soğurma katsayısı platin başına 57782 M-1cm-1’dir).

vii
Ürün paramanyetiktir ve XPS’te tek çeşit platin vermektedir (Platin 4f7/2 ve 4f5/2
bağlanma enerjileri 71.1 ve 74.6 eV’tur). Element analizi (C, H, N, S, Pt) platinin
liganda (2-aminotiyofenolat) mol oranının 1:2 olduğunu göstermiştir. Element analizi,
ESR, XPS, 1H-, 13C-, 195Pt-NMR, CV’den elde edilen bilgilerin yorumlanması, bu
çalışmada üretilen mavi kompleksin, [PtIIIPt3II(2-atp)8(OH)(H2O)] şeklinde formüle
edilebilen yeni bir “platin mavisi” olduğu sonucunu göstermektedir. Bu ürün, köprü
ligandının azot ve kükürtten bağlandığı ilk platin mavisi örneğidir. Önerilen molekül
yapısı C2h simetrisine sahip [Pt2II(2-atp)4] binükleer kompleksinin dimeri şeklinde
düşünülebilir. 724 nm’deki bant, metal-5dz2 orbitallerinden, metal-6pz orbitallerine
serbest bir elektron geçişinden kaynaklanmaktadır.
Kompleksin ct-DNA ile bağlanıp bağlanmadığına karar vermek için elektron
soğurma spektrumu kullanılmıştır. % 17.5 dolaylarında hiperkromizm gözlenmesi
kompleksin DNA’ya zayıf bir bağla, kompleksteki hidroksil grubundan hidrojen bağıyla
veya metal iyonları arasındaki elektrostatik etkileşimle, bağlandığını göstermiştir.
Voltametrik titrasyon, DNA bağlanmasında Pt(III)’ün Pt(II)’ye göre daha kararlı
olduğunu göstermiştir. Mavi kompleks, 45-200 µM aralığında koyun karaciğerindeki
GST enziminin aktivitesini düşürmüştür. GST enzimi ilaç direncine sebep olduğundan,
mavi kompleksin bu enzimi inhibe etmesi mavi kompleksin kombine kemoterapide
kullanılabileceğini göstermiştir.
Anahtar Kelimeler: Platin Mavisi, Karışık Değerlikli Platin Kompleksleri, Sülfürden
Bağlanan Ligandlar, Spektroelektrokimya.

viii
To My Parents

ix
ACKNOWLEDGMENTS
First, I would like to express my sincere thanks to Prof. Dr. Hüseyin İşçi and Assoc.
Prof. Dr. Şeniz Özalp Yaman for their supervision, support and encouragement
throughout this thesis study.
I would also like to express my special thanks to Prof. Dr. Ahmet M. Önal, Assist. Prof.
Dr. Belgin S. İşgör, Assist. Prof. Dr. Atilla Cihaner and Inst. Seha Tirkeş for their help
and support.
I am grateful to my family for their support, trust and encouragement.
I would also like to express my thanks to all stuff in METU Chemistry Department and
Atılım University Chemistry Group for their support during this study.

x
TABLE OF CONTENTS
ABSTRACT…………………………………………………………….iv
ÖZ............................................................................................................vi
ACKNOWLEDGMENTS.......................................................................ix
TABLE OF CONTENTS………........………..……………...................x
LIST OF TABLES………………………………………………...........xii
LIST OF FIGURES……………………………………….......………...xiii
CHAPTERS
1. INTRODUCTION…………………..……………….………...............1
1.1. Platinum…………………..…………….…………………………....1
1.2. Platinum Blues…………………..…………………..…………….....2
1.3. Antitumor Active Platinum-Blues ..................………………………6
1.4. The Present Work............................................................................... 8
2. EXPERIMENTAL PART…………………….............…...….............11
2.1. Preparation of Compounds ……………………………………........11
2.1.1. Preparation of H2[PtCl4] ………………………………………….11
2.1.2. Preparation of K2[PtCl4]………………...……………..………….12
2.1.3.Preparation of the Blue Complex.....................................................12
2.2. Electrochemistry.................................................................................13
2.2.1. Cyclic Voltammetry........................................................................ 13
2.2.2. Spectroelectrochemistry...................................................................15
2.2.3. Coulometry………………………………………………………...16
2.3. Electron Spin Resonance ....................................................................17
2.4. Nuclear Magnetic Resonance .............................................................17
2.5. Scanning Electron Microscope (SEM)................................................17
2.6. X-Ray Photoelectron Spectroscopy (XPS)..........................................17
2.7. DNA Binding Studies………………………………………………..18

xi
2.7.1. Preparation of Tris Buffer Solution………………………………..18
2.7.2. UV Titration.....................................................................................18
2.7.3. Voltammetric Titration.....................................................................18
2.7.4. Enzymatic Activity...........................................................................19
2.7.5. Determination of Cytosolic GSTs Activity………………………..19
3. RESULTS AND DISCUSSION………………………………………21
3.1. Synthesis and Identification of the Blue Complex, a Novel
Platinum Blues………………………………………………………..21
3.1.1. The Electronic Absorption Spectra and Molecular Orbital
(MO) Energy Levels.........................................................................25
3.1.2. Electron Spin Resonance Spectrum…..……………………....…....32
3.1.3. X-Ray Photoelectron Spectrum of the Blue Complex......................34
3.1.4. 1H, 13C and 195Pt NMR Spectra…………………………………….35
3.2. Electrochemistry...................................................................................39
3.2.1. The Blue Complex ……………………………………………........40
3.2.2. 2-aminothiophenol, H2-atp ………………………………………...44
4. DNA BINDING STUDIES……………………………………………..50
4.1. UV Titration…………………………….……………………...……..50
4.2. Voltammetric Titration……………………………….……….……...54
4.3. Enzyme Activity of the Blue Complex……………………………….58
5. CONCLUSION…………………………………..……………..............62
REFERENCES……..……………..………………….................................64

xii
LIST OF TABLES
TABLE
1. Composition of the reaction mixture for GSTs activity
measurements against CDNB…………………………………….……....19
2. Composition of the reaction mixture for total GST activity
measurements against CDNB in the presence of the blue complex……...20
3. Electronic absorption spectral data for the blue complex..........................27
4. Platinum 4f7/2 and 4f5/2 binding energies of some platinum
complexes………………………………………………………………...34
5. NMR data for H2-atp and the blue complex……………............................35
6. Cyclic Voltammetric data for H2-atp and the blue complex
in acetone-[(n-C4H9)4N]BF4 solvent-electrolyte couple…….....................39
7. Voltametric and UV titration data for the blue complex
with ct-DNA.................................................................................................57

xiii
LIST OF FIGURES
FIGURE
1. A possible polymeric structure of the original blue
Pt(CH3CONH)2.………………………………………………………2
2. Stereodiagram for the [Pt(2.25+)4(NH3)8(µ-α-pyridonato)4]5+
cation, together with the loosely associated nitrate ions……………...4
3. Different structures identified by X-ray diffraction,
where the abbreviated N-O is used to express each bridging
amidate ligand and X denotes axial donors such as OH2,
NO3-, NO2
-, Cl-, and Br-. ……………………………………………..5
4. Two novel structures observed for Pt(3.0+)2, and an octaplatinum
chain structure observed in the acyclic amidate systems……………..6
5. Structure of the antitumor drug, cisplatin, and its inactive trans
isomer, transplatin…………………………………………………….7
6. The structure of a binuclear complex with the general formula
[XM(B-B)4MX]n-……………………………………………………..9
7. The relative energies and symmetries of the molecular orbitals
resulting from metal-metal bonding in M(B-B)4M complex……….10
8. Molecular structure of 2-aminothiophenol (H2-atp)………………...10
9. The cyclic voltammetry cell; WE: Pt-bead, CE: Pt-wire,
RE: Ag- wire or SCE………………………………………………...14
10. The electrolysis cell used for in situ measurements of UV-Vis
spectrum of the electrolysis solution; WE: Pt gauze, CE: Pt-plate,
RE: Ag-wire……………………………………….…………………16

xiv
11. The proposed molecular structure of the yellow
product..................................................................................................22
12. The proposed molecular structure of the green product
(H-H isomer)........................................................................................23
13. The proposed molecular structure of the blue complex.......................25
14. The electronic absorption spectrum of the ligand, H2-atp, in
acetonitrile (Concentration of H2-atp = 9.64 x 10⁻⁴ M).……………..26
15. The electronic absorption spectrum of the blue complex in
acetonitrile (Concentration based on the formula as
[Pt2(2-atp)4(H2O)(OH)] =1.11x10⁻⁵ M)…………................................26
16. The electronic absorption spectrum of the blue complex in
acetone between 330-590 nm ranges. (Concentration based on
the formula as [Pt2(2-atp)4(H2O)(OH)] =1.32x10⁻⁴ M)……………….28
17. The electronic absorption spectrum of the blue complex in
acetone between 800-1000 nm ranges. (Concentration based
on the formula as [Pt2(2-atp)4(H2O)(OH)] =1.32x10⁻⁴ M)…………...28
18. The relative energies and the symmetries of the
frontier molecular orbitals of Pt2(2-atp)4 (C2h).……………………...31
19. The relative energies and the symmetries of the molecular
orbitals which results from two binuclear
[Pt2(2-atp)4] interaction……………………………………………….32
20. The ESR spectrum of the blue complex in acetone at 150 K………...33
21. The XPS of the blue complex………………………………………...35
22. 1H-NMR of H2-atp in acetone-d6…………………………………….36
23. 13C-NMR of H2-atp in acetone-d6……………………………………37
24. 1H-NMR of the blue complex in acetone-d6………………………….37
25. 13C-NMR of the blue complex in acetone-d6…………………………38
26. The 195Pt-NMR spectrum of blue product in acetone-d6……………..38
xv
27. CV of 0.001 M the blue complex in acetone vs Ag-wire.
(a) Anodic sweep (b) Cathodic sweep. (Molar concentration is
based on the formula [Pt2(2-atp)4(H2O)(OH)]).....................................40
28. Variation of anodic current (µA) with the square root of
voltage scan rate (mV/s). a H2-atp; b the blue complex………………41
29. Variation of current function I/(CV1/2), with the
logarithm of the voltage scan rate plot of H2-atp (a) and
the blue complex (b) for the 1st oxidation peaks, where I(µA)
is the peak current, V(mV/s) the voltage scan rate and
C(mol/L) is the molar concentration…………………………………42
30. Recorded changes in the electronic absorption spectrum
of the blue complex during the constant potential electrolysis
in acetone (a) electrolysis at the 1st oxidation peak potential
followed by the 2nd peak potential (b) spectral changes obtained
at the end of 1st, 2nd and 3rd consecutive e- transfer…………………..43
31. The cyclic voltammogram of H2-atp in acetone vs SCE:
(a) Anodic sweep, (b) Cathodic sweep.................................................45
32. The spectral changes in the electronic absorption spectrum of
H2-atp in acetone during the constant potential
electrochemical oxidation, at the first and then followed at the
second oxidation peak potentials……………………………...……..46
33. The electronic absorption spectrum of H2-atp in
acetone after electrochemical oxidation; (a) after 1e- transfer,
(b) after 2e- transfer…………………………………………………..47
34. DNA-Acridine interaction as an example of intercalative mode…….51
35. Groove binding of DNA-Distamycin………………………………...51
36. UV titration of the blue complex in 5 mM tris buffer
(50 mM NaCl-acetone (8:2) mixture at pH 7.1 where R=2 to 10)…..53
37. UV titration of the blue complex with DNA for R= 2,3,4,8,10
values in tris buffer–acetone mixture (8:2)………………………….54

xvi
38. CV of the blue complex (a) in the absence (b) in the
presence of DNA in 5 mM tris buffer (50 mM NaCl-acetone
(8:2) mixture at pH 7.1 where R=0 and 5)……………….……….…56
39. Inhibition of the sheep liver GST enzyme activity by the
blue complex………………………………………………………...60
40. Concentration-response plot for the blue complex on the
GST enzyme activity………………………………………………...61

1
CHAPTER 1
INTRODUCTION
1.1. Platinum
Although in use as a metal since at least the 7th century B.C., the chemistry
of platinum and the systematic study of its metallurgical and physico–chemical
properties did not start until about 250 years ago, following the rediscovery of
“platina” (spanish: little silver) in Columbia by the Spanish, and its subsequent
announcement in Europe. Platina was by no means a single metal as we know today,
but rather an ore that contained approximately ten other metallic elements, among
others all the other platinum group metals and Fe, Mn and traces of Cu. It
immediately caught the attention of chemists at that time with studies carried out
mainly in Spain and England [1].
The 19th century brought the discovery of the first organometallic compound
of any metal, K[PtCl3(C2H4)]·H2O by Zeise (1830), and numerous reports on
inorganic platinum ammine complexes by scientists such as Peyrone, Reiset, Cossa,
Cleve, and Magnus [1]. It was the ‘Theory of Coordination’ of Werner, which by the
end of 19th century, provided an explanation for the constitution of many of these
complexes. During the 20th century the development of metal catalysts for industrial
production processes, many of which contain Pt or platinum group metals [2], was a
major goal. Termed once a “master of transmutation”, platinum has been estimated
to be used in the manufacture of one out of five of today’s products [3].
Rosenberg’s serendipitous discovery of the ability of a metal coordination
compound, cis-Pt(NH3)2Cl2, to block DNA replication and cell division [4] and
subsequent findings that the very same agent, then termed “cisplatin”, and many
structural analogues are potent antitumor agents [5], has influenced tremendously the

2
development of inorganic metal coordination chemistry over the last 30 years. For
the first time the usefulness of drugs containing a heavy metal in cancer
chemotherapy had been demonstrated. Today cisplatin is considered one of the most
successful antitumor agents [6]. It is generally agreed upon that the discovery of
cisplatin and attempts to understand its mode of action had a substantial impact on
the research of interactions between metal ions and living matter in general, and on
the whole field of bioinorganic chemistry [7].
1.2. Platinum Blues
A family of deeply colored platinum compounds, usually called platinum
blues, has attracted wide interest for years not only because of their unusual color
and intriguing chemistry, but also for their high antitumor activities [8]. In contrast to
the usual yellow, orange, red, or colorless platinum complexes, platinum blues are
unusual for their intense blue or purple colors [9]. The first blue platinum compound
was prepared by German chemists in 1908 [10]. This unusual material was prepared
by the reaction of Ag2SO4 with yellow cis- PtIICl2(CH3CN)2 and was first proposed
to have a mononuclear composition of PtII(CH3CONH)2.H2O. However, the
compound was later proposed to be polymeric with bridging acetamidate linkages
[11]. Owing to later studies made by using cis-Pt(NH3)2Cl2, it is thought that the
original “platinblau” may have the structural framework illustrated in Figure 1 or one
having slightly modified bridging modes [9].
Figure 1. A possible polymeric structure of the original blue Pt(CH3CONH)2.

3
In order to account for the origin of the blue color, various platinum blues
compounds were further prepared with a variety of amide ligands, mostly using
K2PtCl4 as the starting material [12-22]. However, none of these studies afforded a
clear conclusion about the structure and the formula, due to the failure of obtaining
single crystals suitable for determining the structure using X-rays.
Several decades later, progress was made in determining the chemistry of
platinum blues by employing the “cis-Pt(NH3)2” moiety of cis-Pt(NH3)2Cl2. Since
Rosenberg discovered the antitumor activity of cis-Pt(NH3)2Cl2 (cis-DDP, cisplatin)
[23-26], the chemistry of cis-DDP and its analogs have received considerable
attention because of their potential application as anticancer drugs. Moreover, special
attention was paid to the platinum blues produced from the reactions between the
hydrolysis product of cis-DDP (i.e., cis-[Pt(NH3)2(OH2)2]2+) and pyrimidine bases
such as uracil, since these so-called “platinum-pyrimidine-blues” were found to have
a high index of antitumor activity with a lower associated nephrotoxicity than cis-
DDP [27-28]. The medical interest thus required chemists to unveil the structure of
platinum blues. However, no structural evidence for the platinum-pyrimidine-blues
was obtained until the first structural analysis of α-pyridonate-blue was reported [29-
30].
The first direct evidence for the structure of platinum blues was provided by
the single-crystal X-ray studies of cis-diammineplatinum α-pyridonate-blue,
[Pt(2.25+)4(NH3)8(µ-α-pyridonato-N,O)4](NO3)5. H2O [29-30]. Figure 2 shows an
ORTEP view of the α-pyridonate-blue cation. The chemical formula and the
structure reveal that the complex cation is mixed-valent, comprised of three Pt(II)
and a Pt(III) atoms, whose platinum oxidation state is formally expressed as PtII3PtIII
(abbreviated as Pt(2.25+)4), and the tetraplatinum chain structure is composed of two
binuclear cis-[Pt2(NH3)4(C5H6NO)2]n+ units, having two amidate bridging ligands in
a head-to-head arrangement. One Pt(III) atom has one unpaired electron and imparts
paramagnetism to the compound. Both the intra- and interdimer Pt-Pt distances
2.7745 and 2.8770 Å, respectively, revealed that the platinum centers are metal-metal
bonded to each other [29].

4
Figure 2. Stereodiagram for the [Pt(2.25+)4(NH3)8(µ-α-pyridonato)4]5+
cation, together with the loosely associated nitrate ions.
Following these reports, several structural analogues with different average
platinum oxidation states, Pt(2.0+), Pt(2.25+), and Pt(2.5+), and Pt (3.0+) have been
structurally characterized. These oxidation states correspond to their formal
oxidation states of Pt(II)2, Pt(II)3 Pt(III), Pt(II)2Pt(III)2, and Pt(III)2, respectively [9].
In addition to this classification, the structures can also be grouped according
to the orientation of the two bridging amidate ligands within a dimeric unit; head-to-
head (HH) and head-to-tail (HT) are known to Pt(II)2 and Pt(III)2 compounds [31-32-
33-34]. However, only the HH isomers afford a dimer of dimers, leading to the
tetraplatinum chain structure of platinum-blues. On the other hand, the HT isomers
do not dimerize to give the tetramer due to the steric bulk of the exocyclic amidate

5
rings at the ends of the dimeric unit. But this is not the case for amidate-bridged
dimer compounds with chain (or acyclic) amidates such as acetamidate. The third
classification is related to the nuclearity of the complex; two major groups exist,
dimer and tetramer. In addition, the chain structures are classified based on whether
they have axial ligands. All these classified structures are shown in Figure 3. In
addition to these dimeric and tetrameric structures, two other groups, illustrated in
Figure 4, are also known. Compounds E1 [35] and E2 are produced as a result of
deprotonation at one of the four equatorial ammine ligands of the dinuclear α-
pyrrolidonate Pt(3.0+) species. Two octanuclear platinum-blues (F1) are known
when acyclic amidate (acetamidate and 2-fluoroacetamidate) is employed instead of
cyclic ones [36-38].
Figure 3. Different structures identified by X-ray diffraction, where the abbreviated
N-O is used to express each bridging amidate ligand and X denotes axial donors such
as OH2, NO3-, NO2
-, Cl-, and Br-.

6
Figure 4. Two novel structures observed for Pt(3.0+)2, and an octaplatinum
chain structure observed in the acyclic amidate systems.
1.3. Antitumor Active Platinum-Blues
Cisplatin was chemically described in 1845, but its antitumor properties were
only found accidentally by Rosenberg in 1965. While investigating the influence of
an electric field on the growth of the E.coli bacteria, Rosenberg found that cells
stopped dividing and displayed strong filamentous growth. Following this discovery
a large number of platinum complexes were tested for their antiproliferative effect.
The complexes having cis geometry were found to be antitumor active and cisplatin
is the most active one. The trans isomer of Pt(NH3)2Cl2, transplatin, showed no
antitumor activity. The structures of cisplatin and transplatin are shown in Figure 5.

7
PtNH3
Cl
Cl
NH3
PtCl
Cl
H3N
NH3
Cisplatin Transplatin
Figure 5. Structure of the antitumor drug, cisplatin, and its inactive trans
isomer, transplatin.
Cisplatin successfully entered into clinical trials in 1971. The first clinical test
was performed by Hill et al. and was approved by the United States FDA in 1978.
Cisplatin is routinely used in the clinic, appearing the most effective against
testicular and ovarian cancer. With testicular cancer, when recognized in an early
stage, curing rates exceed 90%.
Common problems associated with cisplatin in the clinic include
nephrotoxicity, mototoxicity and myelosuppression. Toxic side effects of cisplatin
limit the dose that can be administrated to patients.
The other main reason for a failure of cisplatin chemotherapy is resistance of
tumors to the drug. The resistance can be intrinsic or acquired and limits the
applicability of cisplatin to a relatively narrow range of tumors.
The most significant advantage in obviating the side effects of cisplatin has
become from the process of analogues development, i.e. the search for structural
analogous cisplatin that fulfill one or all of the next criterions:
1. Development of new selectivities, including an activity spectrum wider than
cisplatin and, especially, activity in cisplatin-resistant tumors.
2. Modification of the therapeutic index, that is to say, a higher clinical efficacy
to reduce toxicity, with activity at least in the same range as cisplatin.
3. Modification of the pharmacological properties, such as solubility, which
could result in improved ways of administration.

8
New antitumor drugs are designed to increase therapeutic efficacy. Efforts have
been made to found compounds that are more effective and have an acceptable effect
on the patient’s quality of life. Thus,
1. to develop orally active platinum drugs,
2. to reduce serious side effects,
3. to overcome drug resistance
are the main goals of producing new drugs.
Since the discovery of antitumor activity of cisplatin, a large number of new
compounds have been synthesized and tested for antitumor activity.
1.4. The Present Work
One of our research interests is to investigate binuclear metal complexes, in
particular, platinum ones [46,125]. The general formula of these complexes can be
represented as [M2(B-B)4]n- or [M2(B-B)4X2]
n-, where, M = Cr, Mo, W, Te, Re, Ru,
Os, Rh, Pt; B-B = homo- or hetero-donor bidentate bridging ligand, such as RCO2-,
CO32-, SO4
2-, HPO42- (oxygen donors); H2P2O5
2- (phosphorus donor); RCS2- (sulfur
donor); RCONH-, α-pyridonate (oxygen and nitrogen donor); pyrimidine-2-thionate
(sulfur and nitrogen donor); X = axial monodentate ligand. They all have a common
structure, which consists of two square-planar MO4, MP4, MS4, MO2N2, MN2S2 units
linked together face to face given usually an eclipsed or almost eclipsed M2O8, M2P8,
M2S8, M2N4O4, M2S4N4 (nitrogen-oxygen, nitrogen-sulfur donors) cluster with short
metal-metal distances (Figure 6). Monodentate ligands occupy axial positions. These
compounds are also important from the cluster chemistry stand point, because they
represent the simplest metal clusters.

9
x- axis
B B
B B
X M M X z - axis
B B
y-axis B B
Figure 6. The structure of a binuclear complex with the general formula
[XM(B-B)4MX]n-.
The easiest way to visualize metal-metal bonding is to consider the overlap of
d-orbitals on each metal atom in a binuclear metal cluster, M2 (Figure 7). If we
assume metal-metal axis is the z-axis of our coordinate system, dx2
-y2 will be used in
metal-ligand bonding, so metal-metal bond will result from the overlap of four d-
orbitals on each metal atom. These are dz2(σ), dxz(π), dyz(π) and dxy(δ). Thus we will
have 4 bonding molecular orbitals (one σ, two π and one δ), and four antibonding
molecular orbitals.
The metal-metal bond order of these complexes changes from four to zero
according to the number of electrons filling these orbitals. The highest bond order is
for d4-d4 system, which is four and the lowest bond order is for d8-d8 system, which
is zero. In general there is a relationship between calculated bond order and the
observed metal-metal distance. As the bond order increases the metal-metal distance
decreases.
As part of our effort to further our understanding the chemistry of binuclear
complexes, we tried to prepare a new binuclear platinum complex by reacting
K2PtCl4 with 2-aminothiophenol (H2-atp) in basic aqueous solution (Figure 8). When
appropriate experimental conditions were employed a dark blue solid product was
obtained. This blue product, which will be referred as “the blue complex” in this
thesis, is a new mixed-valance platinum blues with sulfur and nitrogen donors

10
bridging bidentate ligand, 2-aminothiophenolate (2-atp) anion. The blue complex has
a very intense absorption band, at 724 nm, in its absorption spectrum in acetonitrile.
E σ* π*
δ*
dz2, dxz, dz2, dxz,
dyz, dxy, dyz, dxy, δ π
σ
MB4 M(B-B)4M MB4
Figure 7. The relative energies and symmetries of the molecular orbitals
resulting from metal-metal bonding in M(B-B)4M complex.
In the first part of this work we tried to characterize the nature of the blue
complex by using UV-Vis, ESR, XPS, SEM, 1H-, 13C- and 195Pt-NMR, cyclic
voltammetry, elemental analysis techniques. In the second part, preliminary DNA
binding studies and enzymatic activity studies of the blue complex are performed.
H2N SH
Figure 8. Molecular structure of 2-aminothiophenol (H2-atp).
11
CHAPTER 2
EXPERIMENTAL PART
2.1. Preparation of Compounds
The starting material for the platinum complexes was metallic platinum. The
ligand, 2-aminothiophenol, is obtained commercially (ACROSS).
2.1.1. Preparation of H2[PtCl4]
7.70 g of platinum metal was cut into very small pieces and dissolved in 70
mL aqua regia. The mixture is evaporated until the volume decreased to 20 mL, and
50 mL of concentrated HCl is added in order to complete the volume back to 70 mL.
This process is repeated for six times. Finally 30 mL of orange colored H2PtCl6
solution is obtained. Stoichiometric amount of hydrazine dihydrogendichloride
N2H4.2HCl is dissolved in 30 mL water and added to H2PtCl6 solution drop by drop
to reduce Pt(IV) to Pt(II). Resulting cherry red solution is cooled in the refrigerator
overnight. The solution might have contained small amount of H2PtCl6. Therefore, in
order to precipitate [PtCl6]2- as (NH4)2[PtCl6], saturated ammonium chloride solution
is added to cherry red solution drop by drop while stirring. Orange colored
(NH4)2[PtCl6] precipitates are separated by filtration. This procedure is repeated until
no more precipitation occurred. The amount of platinum in the cherry red solution is
determined by ash analysis as 0.1007 g/mL, which is used as stock solution (H2PtCl4)
for further preparations.

12
2.1.2. Preparation of K2[PtCl4]
15 mL from the stock solution of H2PtCl4 (0.1007 gPt/1mL) is taken and
reacted with stoichiometric amount of saturated aqueous solution of potassium
chloride. The mixture is evaporated to dryness and at the end red crystals of
K2[PtCl4] is obtained. The percent yield was 85.13 %.
H2PtCl4(aq) + 2 KCl(aq) → K2[PtCl4](aq) + 2 HCl(aq) (1)
2.1.3. Preparation of the Blue Complex
100.2 mg (0.241 mmol) of K2PtCl4 was dissolved in 5 mL of deionized water
in 20 mL round bottom flask and pH of the solution was adjusted to 13 using
concentrated aqueous solution of NaOH. Then, 2 mL DMF solution of 57.48 µL H2-
atp (0.48 mmol) ligand was added to the K2PtCl4 solution drop wise while stirring.
An immediate yellow precipitate formation was observed. The solution at this stage
was acidic. A few drops of sodium hydroxide solution was added to this mixture
until the pH was about seven and then refluxed in an oil bath at 40ºC for about 2
hours. In the first quarter of reflux, the color of the solution was changed from
yellow to dark green. At the end of reflux, the color turned to navy blue. The solution
was removed from the oil bath and cooled down first at room temperature and then in
refrigerator for 2 hours. The dark blue solid was collected by suction filtration using
a sintered glass funnel, washed with water and dried under vacuum at room
temperature. The yield was 82.50 mg.
RT PtCl4
- + 2 (H2-atp) PtII(2-atp)2 + 2HCl (yellow product) (2)
pH = 13
40o C 2 PtII(2-atp)2 + 2H2O Pt2
II,II (2-atp)4.2H2O (green product) (3)
pH =7, 30 min
40o C

13
2 Pt2II,II (2-atp)4.2H2O Pt(2.25+)4(2-atp)8(OH)(H2O) + H+ + 2 H2O (4)
pH =7, 2 h
Elemental Analysis:
Anal. Calc. For Pt2S4N4H28C24O2 (green product):
C: 31.2%, H: 3.06%, N: 6.07%, S: 13.9%; Found: C: 29.9%, H: 2.61%, N: 5.87%, S:
13.6%. Volhard method indicated no chlorine presence.
Anal. Calc. For Pt4S8N8H51C48O2 (blue product):
C: 31.9%, H: 2.84%, N: 6.19%, S: 14.2%; Found: C: 32.5%, H: 2.87%, N: 6.83%, S:
14.8%. Volhard method indicated no chlorine presence.
Anal. Calc. For Pt4S8N8H50C48O (blue product):
C: 32.2%, H: 2.76%, N: 6.26%, S: 14.3%; Found: C: 32.5%, H: 2.87%, N: 6.83%, S:
14.8%.
Pt-Ash Analysis calculated for Pt4S8N8H51C48O2: Pt: 43.14%, Found: Pt: 42.07%.
SEM Analysis (blue product): Presence of platinum, nitrogen and sulfur atoms is
detected. There is no chlorine atom.
2.2. Electrochemistry
2.2.1. Cyclic Voltammetry
Cyclic voltammetry (CV) is known as a potential-controlled electrochemical
experiment, which yields information on the I-E (current-potential) dependence.
During CV measurements, a cyclic potential sweep is applied on an electrode
resulting a current response. A potentiostat system controls the parameter, imposes
on an electrode a cyclic linear potential sweep and outputs the resulting current-
potential curve.

14
The electrochemical reaction under study takes place at the working electrode
(WE). The electrical current at the working electrode is called faradaic current. Solid
disk electrodes are the most common WE used in CV experiments. Platinum, glassy
carbon, gold, and silver are also used. An auxiliary or ‘counter’ electrode (CE) is
used to balance the faradaic process at the WE having an electron transfer of
opposite direction. A reference electrode (RE) is also needed and the most common
ones are Ag/AgCl and the calomel electrode. The CV response is plotted as current
versus potential. During the forward sweep the reduced form is oxidized and on the
reverse sweep the oxidized form near the electrode is reduced again. In the case of
having a chemical reaction, the shape of the CV is affected. The absence of the
reversed peak means that the oxidized species have been removed by a chemical
reaction.
Electrochemical behavior of our complex and H2-atp was investigated by
cyclic voltammetry using Volta Lab PGZ 301 Dynamic Voltammetry. The cell,
which is used for the cyclic voltammetry analysis is presented in Figure 9.
Figure 9. The cyclic voltammetry cell; WE: Pt-bead, CE: Pt-wire, RE: Ag-
wire or SCE.

15
Cyclic voltammetry studies were made in acetone-[(n-C4H9)4N]BF4 (tetra-n-
butylammoniumtetrafluoroborate) solvent electrolyte couple at room temperature.
Argon gas was allowed to pass through the solution prior to each measurement in
order to eliminate oxygen from the system.
A three-electrode system was used during cyclic voltammetry studies. In this
system, Ag-wire or SCE (saturated calomel electrode) were used as reference
electrode, platinum bead or glassy carbon electrodes were used as working electrode
and platinum wire or coil electrodes were used as auxiliary (counter) electrode.
Those three electrodes were positioned as close as possible in order to minimize IR
drop.
The concentration of our complex and H2-atp was about 0.001 M for each
measurement. Scan rate during the recording of cyclic voltammograms was 100
mV/s or 200 mV/s.
2.2.2. Spectroelectrochemistry
Constant potential electrolysis of ligand H2-atp, and the blue complex at their
peak potentials were carried out in acetone-[(n-C4H9)4N]BF4 solvent-electrolyte
couple versus Ag-wire reference electrode. Platinum gauze (0.5 cm2) electrodes
served as working and counter electrode as well. The electrolysis cell, which was
used for the in situ measurements at room or below temperatures, is given in Figure
10.

16
Figure 10. The electrolysis cell used for in situ measurements of UV-Vis
spectrum of the electrolysis solution; WE: Pt gauze, CE: Pt-plate, RE: Ag-
wire.
Electronic absorption spectra were recorded for every 50 mC intervals in situ,
using HP 82524A Diode Array Spectrophotometer. During the electrolysis, nitrogen
gas was purged through the electrolysis solution for stirring purposes between the
scans.
2.2.3. Coulometry
Coulometric analyses were made by chronocoulometric method, in which
quantity of charge versus time is recorded. The total quantity of charge, which is
obtained from the point corresponding to the plateau of the curve, is used to calculate
the number of electrons.

17
Chronocoulometry of the ligand and the complex were carried out at the peak
potentials in acetone-[(n-C4H9)4N]BF4, solvent-electrolyte system using Volta Lab
PGZ 301 Dynamic Voltammetry at platinum gauze electrodes versus Ag-wire.
2.3. Electron Spin Resonance
ESR (or EPR) spectra of blue complex in the solid powder form and in frozen
acetone were recorded by using Bruker Xepr Elexsys-580 Spectrometer in quartz
ESR-cell at various temperatures (from + 25°C to -150°C ), where diphenyl
picryldihydrazyl (DPPH) was used as a reference.
2.4. Nuclear Magnetic Resonance
1H-, 13C- and 195Pt-NMR spectra of ligand and blue complex were recorded
on Bruker GmbH DPX-400, 400 MHz High-Performance Digital FT NMR, using
acetone-d6 as a solvent and TMS as an internal reference.
2.5. Scanning Electron Microscope (SEM)
Analysis of the surface morphologies of blue complex were done by using
JEOL JSM-6400 scanning electron microscope.
2.6. X-Ray Photoelectron Spectroscopy (XPS)
XPS spectrum of blue complex was measured by using SPECS ESCA system
with Mg/Al dual anode.

18
2.7. DNA Binding Studies
2.7.1. Preparation of Tris Buffer Solution
5 mM (80.1 mg) Tris.HCl (C4H11NO3.HCl) and 50 mM (292.7 mg) NaCl
were placed in a 100 mL flask and dissolved in approximately 70 mL deionized
water. pH of the solution was adjusted to 7.0 with 1.0 M NaOH before making the
volume 100 mL.
2.7.2. UV Titration
UV titration of the platinum blue complex was performed in tris buffer-
acetone mixture (2:10) for R=0, 2, 4, 6, 8 and 10, where R is the concentration ratio
of ct-DNA(calf thymus) to the platinum blue complex. Prior to each measurement ct-
DNA and platinum blue complex were incubated about 15 minutes. The changes in
the electronic absorption spectrum were recorded by using HP 82524A diode array
UV-VIS spectrophotometer.
2.7.3. Voltammetric Titration
Voltammetric titration of platinum blue complex with ct-DNA was carried
out by using cyclic voltammetry in tris buffer, which contains 20% acetone. The
voltammetric changes were recorded for R= 0, 5 and 10 (R= [DNA]/[Pt-complex])
by using Volta Lab PGZ 301 Dynamic Voltammetry. Ag-wire was used as a
reference electrode. Glassy carbon electrode and Pt-wire electrode were employed as
a working and auxiliary (counter) electrode, respectively. Measurements were made
under argon gas atmosphere.

19
2.7.4. Enzymatic Activity
1-chloro-2,4-dinitrobenzene (CDNB), reduced glutathione (GSH), were
purchased from Sigma Chemical Company, St. Louis, MO, U.S.A. Cytosols of sheep
liver were supplied from METU (Group of Assoc. Prof. Dr. Nursen Çoruh in
Chemistry Department).
2.7.5. Determination of Cytosolic GSTs Activity
The GST (Glutathione S-Transferase) activity is determined against the
substrate 1-chlor-2,4-dinitrobenzene (CDNB). The enzyme activity assay was
conducted at room temperature. GST activity against the CDNB was determined
spectrophotometrically by monitoring the formation of the conjugation product under
the condition given in Table 1 and 2 [39-41]
Table 1. Composition of the reaction mixture for GSTs activity
measurements against CDNB.
Constituents of The
Reaction Mixture
Added volume
(µl)
Substrate Solution 50
Combination Solution
- Buffer
- 50.0 mM GSH,
- H2O,
900
Enzyme Source
- Sheep Liver Cytosol
50

20
Table 2. Composition of the reaction mixture for total GST activity
measurements against CDNB in the presence of the blue complex.
Constituents of The Reaction Mixture
Added volume (µl)
Substrate Solution 50
Combination Solution - Buffer - 50.0 mM GSH, - H2O,
800
Drug (The Blue Complex)
100
Enzyme Source - Sheep Liver Cytosol
50

21
CHAPTER 3
RESULTS AND DISCUSSION
3.1. Synthesis and Identification of the Blue Complex, a Novel Platinum
Blues
Binuclear metal complexes of general formula [M2(B-B)4X2]n- where B-B is
bridging bidentate ligand with homo or hetero donor atoms and X is a monodentate
ligand which is relatively weakly coordinated to the metals at axial positions, have a
lantern structure (Figure 6), with relatively short metal-metal distance [42]. They
have attracted increasing attention in the last three decades due to their potential use
as drugs for cancer therapy [43], catalysts for industrially important reactions [44],
and precursors for the preparation of materials with unusual physical properties [45].
They have emerged as a new class of metal complexes to be explored.
For the last twenty years we have been interested in studying the properties of
binuclear metal complexes. Thus in our research lab we investigated the electronic,
structural, axial ligand substitution reaction kinetics, electrochemical and chemical
redox properties of some binuclear metal complexes [46,125].
As continuation of this research, in this thesis work, we aimed to synthesize
new binuclear complexes. The potential bridging ligands chosen were 2-
aminothiophenol, 3-aminothiophenol and 4-aminothiophenol, and the metal was
platinum. No work has been reported in the literature on the complexes of platinum
with aminothiophenol ligands. Among the three ligands, 4-aminothiophenol is
unstable at room temperature, and in 3-aminothiophenol the donor atoms were too
far apart to bridge the two platinum atoms in binuclear complex structure.

22
The reaction of 2-aminothiophenol (H2-atp), with K2PtCl4 in water yielded
yellow precipitate (Figure 11). The yellow precipitate was insoluble in common
solvents, such as water, acetonitrile, acetone, dichloromethane, ethanol, DMF and
DMSO, therefore we were not able to measure the electronic absorption spectrum of
it. Stoichometric experiments made in the synthesis have suggested that the metal to
ligand ratio is 1:2. The complex is most likely to be a monomeric square-planar
complex of platinum(II), as [Pt(2-atp)2].
K2PtCl4 (aq) + 2 H2-atp (l) [Pt(2-atp)2] (s) + 2KCl (aq) + 2HCl (aq) (5)
(yellow product)
NH2
S
S
H2N
Pt
Figure 11. The proposed molecular structure of the yellow product.
The same reaction was carried out at a little higher temperature, 40ºC, in
order to increase the yield of the yellow product. In the course of the reaction, the
yellow product was precipitated first, but then the color of precipitate changed to
green when heated to 40ºC for about 30 minutes while stirring. Green product was
collected and analyzed by elemental analysis, SEM analysis and chemical methods
(volhard method). SEM measurements revealed the presence of Pt, N and S atoms,
whereas no chlorine atoms were detected. Volhard method was also used to check
the absence of chlorine; the result was consistent with SEM analysis.

23
The elemental analysis of the green product suggested that the metal to ligand
ratio is still 1:2, and it is consistent with the formula as [Pt2(2-atp)4.(H2O)2].
2 [Pt(2-atp)2] (s) + 2H2O (l) [Pt2(2-atp)4.(H2O)2] (s) (6) (green product)
The green product was insoluble in any common solvents, thus solution
absorption spectrum could not be measured. On the bases of our experimental
observation this product is a binuclear complex of platinum (II) with 2-atp bridging
ligand (Figure 12).
Pt Pt
S NH2
SH2N
SNH2
SH2N
OH2H2O
Figure 12. The proposed molecular structure of the green product (H-H
isomer).
In one of the trial synthesis experiment a very dark blue colored solid was
isolated accidentally. Unlike the yellow and green product, the dark blue solid, which

24
we call it “the blue complex”, was pretty soluble in acetone and in acetonitrile and
yielded blue colored solution. The electronic absorption spectrum of the blue
complex in acetonitrile has a very intense band at 724 nm, which is responsible for
the dark blue color. This observation was very exciting in the sense that first, 724 nm
band might have indicated the presence of very strong metal-metal interaction;
second, this might have been a new platinum blues, which constitute a family of
complexes generally containing a chain of four platinum atoms of mixed valences
and metal-metal bonds. When we wanted to prepare more of this blue product by
reacting K2PtCl4 with H2-atp we ended up with yellow or green product. It took real
effort and a lot of experimentations to develop the procedure to reproducibly
synthesize the blue complex, described in the experimental part.
When the green product in water acidified, it was converted to the yellow
product. This observation indicated that the pH of the reaction medium is an
important factor in determining the product complex. The ligand H2-atp is an amine,
therefore it is a base, on the other side it is a thiol, and therefore it can also be
considered as an acid. Increasing the pH of the solution increases the coordinating
ability of the amine nitrogen, and the thiol sulfur. Upon coordination of H2-atp
ligand from the sulfur atom it releases a proton, thus making the reaction mixture
acidic. In acidic medium amine nitrogen is protonated. This will decrease the
coordination ability of the ligand from the nitrogen atom. Thus, keeping the pH of
the reaction medium at about seven or little higher than seven is the crucial point for
the synthesis of the blue complex.
The C, N, H, S and Pt analysis of the blue complex indicated that the metal to
ligand ratio is 1:2 and the best fit to the found analysis is obtained by assuming the
molecular formula as [Pt4(2-atp)8(OH)(H2O)] with an average oxidation state of the
platinum is “+2.25”. This can be visualized as three Pt(II) and one Pt(III) in the unit
formula (Figure 13).
2 Pt2(2-atp)4.(H2O)2 (s) + H2O (l) [Pt4(2-atp)8(OH)(H2O)] (s) (7) (blue complex)

25
Pt Pt
S NH2
SH2N
SNH2
SH2N
Pt Pt
S NH2
SH2N
SNH2
SH2N
HO OH2
Figure 13. The proposed molecular structure of the blue complex.
As seen from the proposed structure of the blue complex shown in Figure 13,
it is a dimer of HH-binuclear complexes, with OH- and H2O coordinating to the two
end-platinum atoms at axial positions. The most probable structure must allow the
hydrogen bonding type interaction between the hydrogens of the amine groups of
one binuclear unit with the lone pair electrons on the sulfur of the other binuclear
unit. In addition to the metal-metal interactions between the dimers, the above
mentioned hydrogen bonding type interaction may be the main driving force for the
formation of the blue complex.
3.1.1. The Electronic Absorption Spectra and Molecular Orbital (MO)
Energy Levels
The electronic absorption spectra of H2-atp, the ligand, and the blue complex
measured in acetonitrile are given in Figure 14 and Figure 15, respectively. Spectral
data, indicating band positions and the molar absorptivities are tabulated in Table 3.
The electronic absorption spectrum of the blue complex was also measured in
acetone. Two segments of the spectrum in acetone, higher energy side (350-600 nm)
and lower energy side (800-1000 nm) of the most intense band at 724 nm are shown
in Figures 16 and 17, respectively. Spectral data are included in Table 3.

26
Figure 14. The electronic absorption spectrum of the ligand, H2-atp, in
acetonitrile (Concentration of H2-atp = 9.64 x 10⁻⁴ M).
Figure 15. The electronic absorption spectrum of the blue complex in
acetonitrile (Concentration based on the formula as [Pt2(2-atp)4(H2O)(OH)]
=1.11x10⁻⁵ M).
Wavelength (nm)200 300 400 500 600 700
Ab
so
rba
nc
e (
AU
)
0
0.25
0.5
0.75
1
1.25
1.5
1.75
2
Wavelength (nm)200 300 400 500 600 700
Ab
so
rba
nc
e (
AU
)
0
0.2
0.4
0.6
0.8
1
1.2

27
Table 3. Electronic absorption spectral data for the blue complex. (Calculated
molar absorptivities are based on the molecular formula [Pt4(2-
atp)8(H2O)(OH)] = 1808.81 g/mol and for [Pt2(2-atp)4(H2O)(OH)] = 921.92
g/mol)
In Acetone
ε(M-1cm-1)
Band No
λ(nm) For
[Pt4(2-atp)8(H2O)(OH)]
For
[Pt2(2-atp)4(H2O)(OH)]
I 418 13275 6773
II 539 10672 5445
III 610 18642 9511
IV 724 226505 115564
V 832 10915 5569
VI 949 7642 3899
In Acetonitrile
ε(M-1cm-1)
Band No
λ(nm) For
[Pt4(2-atp)8(H2O)(OH)]
For
[Pt2(2-atp)4(H2O)(OH)]
I 418 18224 9298
II 542 16186 8258
III 614 28696 14641
IV 724 176345 89972
V 832 16472 8404
VI 951 10527 5371

28
Figure 16. The electronic absorption spectrum of the blue complex in acetone
between 330-590 nm ranges. (Concentration based on the formula as [Pt2(2-
atp)4(H2O)(OH)] =1.32x10⁻⁴ M).
Figure 17. The electronic absorption spectrum of the blue complex in acetone
between 800-1000 nm ranges. (Concentration based on the formula as [Pt2(2-
atp)4(H2O)(OH)] =1.32x10⁻⁴ M).
Wavelength (nm)850 900 950 1000
Ab
so
rba
nc
e (
AU
)
0.3
0.4
0.5
0.6
0.7
0.8
Wavelength (nm)350 400 450 500
Ab
so
rba
nc
e (
AU
)
0.6
0.7
0.8
0.9
1
1.1
1.2
1.3
1.4

29
The absorption spectrum of the ligand (Figure 14) has two distinct bands at
340 nm and 220 nm. The band at 220 nm is about four times more intense than the
one at 340 nm. There are no absorptions in the region of the spectrum λ>400 nm.
The most important feature in the spectrum of the blue complex is the intense
band at 724 nm. The energy and the intensity of this band are consistent with
previously reported platinum blues [9]. This is the band which is responsible for its
blue color. The higher energy part of the spectrum is similar to that of free ligand
spectrum, but shifted to little bit higher energy. For example, the band at 340 nm in
the free ligand is shifted to 320 nm in the coordinated ligand. It seems very obvious
that the absorptions which appear in the higher energy region (λ<400 nm) in the
spectrum of the blue complex result from the electronic excitations within the
coordinated ligand. Thus the intense band at 724 nm and less intense bands in the
two sides of it must result from the excitations involving metal based molecular
orbitals. Similar band in [Pt2(P2O5H2)4]4- appears at 369 nm with molar absorptivity
of 31000 cm-1M-1 [46].
To form a base for a better understanding of the origin of the intense
absorptions at 724 nm and around it, let us examine possible molecular orbitals
which might have been involved in the excitations resulting these bands. The
molecular orbitals, which result from the interactions of platinum (II) 5d and 6p
orbitals in binuclear HH-[Pt2(2-atp)4] complex with C2h symmetry are shown in
Figure 18. The lowest energy excitations in this complex is expected from 3bu [σ*
(dz2-dz
2)] to 4ag [σ(pz-pz)] electron transitions. When the two HH-[Pt2(2-atp)4]
(Figure 12) dimerizes to form a tetranuclear molecule [Pt4(2-atp)8] (Figure 13) in
eclipsed configuration, with C2h symmetry (the amines of one unit are across the
sulfur of the other) the molecular orbitals which are in axial direction of the binuclear
[Pt2(2-atp)4] complex, those are 1ag, 3bu, 4ag and 4bu, will overlap to form strongest
(with respect to other MO’s) bonding interactions. The relative energies of the MO’s,
which will result from this interaction in the tetranuclear complex, are given in
Figure 19. When the tetranuclear complex is mixed valence as “Pt(III) Pt3(II)”, the
HOMO orbital, which is designated as 2buı in Figure 19, becomes partially filled.
This will impart paramagnetism to the blue complex. On the other hand, the energy

30
of the lowest energy allowed electronic transition (3bu → 4ag) in the binuclear
complex will be red shifted in the tetranuclear complex (2buı → 3ag
ı). The electronic
excitations 2agı → 2bu
ı and 2agı → 3bu
ı are also allowed transitions. According to the
argument put forward above, the most logical assignment for the intense band at 724
nm in the electronic absorption spectrum of the blue complex is 2Bu → 2Ag (2buı →
3agı).

31
4bu σ*(pz-pz)
pz pz
4ag σ (pz-pz)
E ↑↓
3bu σ*(dz2-dz2)
3ag ↑↓ π
* (dxz-dxz) bg ↑↓ π
* (dyz-dyz) 2bu ↑↓ δ
* (dxy -dxy) nd ↑↓ ↑↓ nd ↑↓ ↑↓
↑↓ ↑↓ ↑↓ ↑↓ 2ag ↑↓ δ (dxy -dxy)
au ↑↓ π (dyz-dyz) 1bu ↑↓ π (dxz- dxz)
1ag ↑↓ σ (dz2- dz2 )
Pt(II) [Pt2(2-atp)4] Pt(II)
Figure 18. The relative energies and the symmetries of the frontier molecular
orbitals of Pt2(2-atp)4 (C2h).

32
σ* 3buı
4ag σ(pz-pz) σ(pz-pz) 4ag
σ 3ag
ı
E σ* ↑ 2bu
ı
3bu ↑↓ σ*(dz2- dz2) σ*
(dz2-dz2 ↑↓ 3bu
σ
↑↓ 2agı
σ
* ↑↓ 1buı
1ag ↑↓ σ (dz2- dz2) σ
(dz2- dz2) ↑↓ 1ag
σ ↑↓ 1agı
[Pt2(2-atp)4] (C2h) [Pt4(2-atp)8]
+ (C2h) [Pt2(2-atp)4] (C2h)
Figure 19. The relative energies and the symmetries of the molecular orbitals
which results from two binuclear [Pt2(2-atp)4] interaction.
3.1.2. Electron Spin Resonance Spectrum
As explained in section 3.1.1., if the blue complex is a mixed-valence
tetranuclear complex, with a metal core “Pt(III) Pt(II)3”, it will have an unpaired
electron in 2buı orbital (Figure 19), thus it must be paramagnetic. 2bu
ı orbital is a
linear combination of dz2 orbitals on four platinum atoms, so the unpaired electron
will be delocalized over four platinum atoms.
33
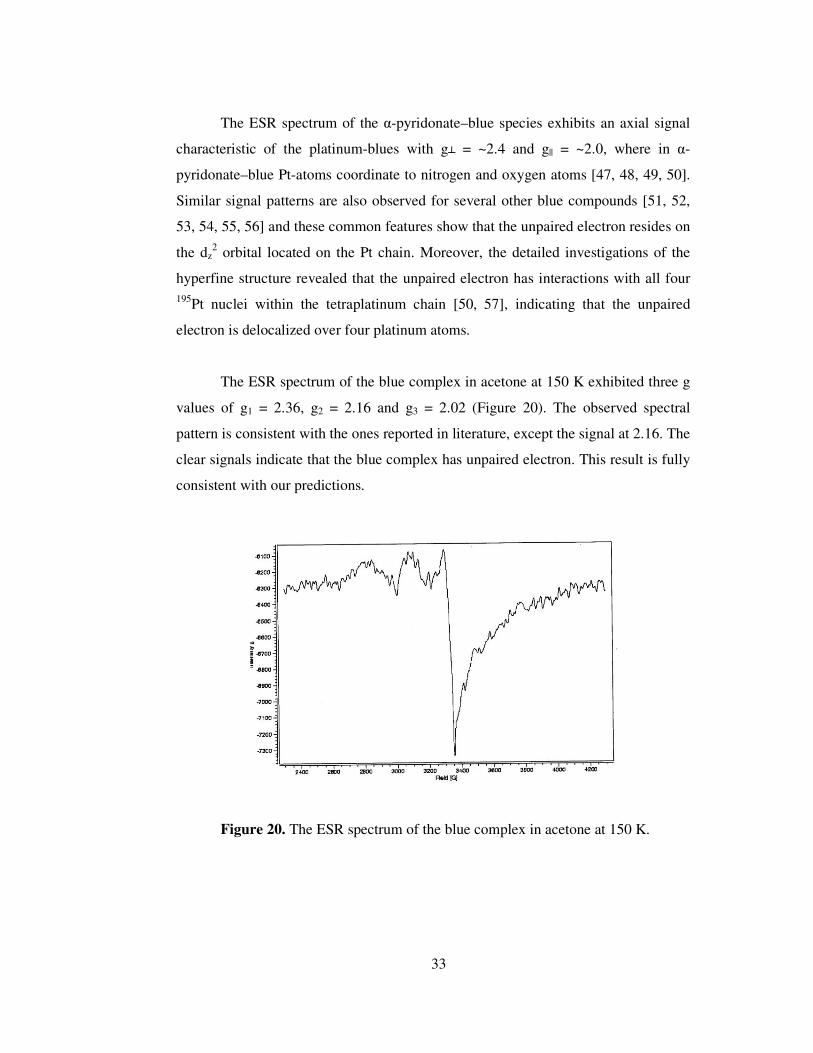
The ESR spectrum of the α-pyridonate–blue species exhibits an axial signal
characteristic of the platinum-blues with g┴ = ~2.4 and g|| = ~2.0, where in α-
pyridonate–blue Pt-atoms coordinate to nitrogen and oxygen atoms [47, 48, 49, 50].
Similar signal patterns are also observed for several other blue compounds [51, 52,
53, 54, 55, 56] and these common features show that the unpaired electron resides on
the dz2 orbital located on the Pt chain. Moreover, the detailed investigations of the
hyperfine structure revealed that the unpaired electron has interactions with all four 195Pt nuclei within the tetraplatinum chain [50, 57], indicating that the unpaired
electron is delocalized over four platinum atoms.
The ESR spectrum of the blue complex in acetone at 150 K exhibited three g
values of g1 = 2.36, g2 = 2.16 and g3 = 2.02 (Figure 20). The observed spectral
pattern is consistent with the ones reported in literature, except the signal at 2.16. The
clear signals indicate that the blue complex has unpaired electron. This result is fully
consistent with our predictions.
Figure 20. The ESR spectrum of the blue complex in acetone at 150 K.

34
3.1.3. X-Ray Photoelectron Spectrum of the Blue Complex
X-Ray photoelectron spectroscopy (XPS), is a good means to probe the
oxidation state of the metal centers by observing the Pt 4f7/2 and 4f5/2 binding
energies. The Pt 4f binding energies for the common Pt(IV) compounds are 2-3 eV
higher than those for the common Pt(II) complexes. On the other hand, it must
always be kept in mind that substitution of the donor ligands can also lead to a shift
of 1-2 eV at each peak [9].
The XPS of the blue complex is given in Figure 21. The platinum 4f7/2 and
4f5/2 binding energies were obtained at 71.1 and 74.6 eV, respectively. These values
were lower than the reported results, for which nitrogen and oxygen donor ligands
complexes were examined (Table 4) [9]. The observed shifts in the binding energies
of platinum atoms in our complex can be ascribed to the coordination of sulfur donor
ligands.
The observation of only two peaks indicates the presence of one type of
platinum from the oxidation stand point. This result is consistent with the
delocalization of all electrons in dz2 based molecular orbitals in the proposed
tetranuclear structure for the blue complex.
Table 4. Platinum 4f7/2 and 4f5/2 binding energies of some platinum
complexes [9].
Chemical Formula Pt 4f5/2 Pt 4f7/2
Cis-PtCl2(NH3)2 (Pt(II)) 75.4 72.0
HH-[Pt(2.0+)2(en)2(PRI)2]2(NO3)4 76.4 73.1
HH-[Pt(2.25+)2(NH3)4(PRI)2]2(NO3)5.H2O 76.2 72.8
HH-[Pt(2.5+)2(NH3)4(PRO)2]2(NO3)6.2H2O 76.4 72.9
HH-[Pt(3.0+)2(NH3)4(PRO)2(NO2)(NO3)] (NO3)2.H2O 77.9 74.6
The Blue Complex prepared in this work 74.6 71.1

35
Figure 21. The XPS of the blue complex.
3.1.4. 1H, 13C and 195Pt NMR Spectra
The 1H and 13C NMR spectra of the blue complex (Figure 24, 25) were
measured in acetone-d6 solvent. For the comparison reason, 1H and 13C NMR spectra
of the free ligand, H2-atp (Figure 22, 23), were also measured in acetone-d6. The
chemical shift values are tabulated in Table 5.
Table 5. NMR data for H2-atp and the blue complex.
The Blue Complex
δ(N-H)2.7; δ(H1)6.9; δ(H2)7.0; δ(H3)7.3; δ(H4)7.7
1H-NMR (ppm) H2-atp δ(N-H)3.5; δ(S-H)5.2; δ(H1)6.4; δ(H2)6.5; δ(H3)6.7
δ(H4)6.8 The Blue Complex
δ 115.8; δ 117.6; δ 118.3; δ 132.2; δ 137.0
13C-NMR (ppm) H2-atp
δ 109.3; δ 119.4; δ 121.7; δ 125.2; δ 126.8; δ 146.8 195Pt-NMR (ppm) δ –3175
Chemical shifts (δ) are given in ppm, relative to TMS in acetone-d6.

36
Careful examination of the chemical shift values indicates that the blue
complex do contain 2-aminothiophenol ligand. In the 1H-NMR spectrum of the blue
complex, the peak corresponding to the thiol hydrogen at 5.2 ppm is missing, and
also the peak corresponding to the amine hydrogens is shifted from 3.5 ppm to 2.7
ppm going from free ligand to the coordinated one. These observations clearly
indicate that the H2-atp coordinates to the platinum from sulfur and nitrogen, and it
is also anionic.
Figure 22. 1H-NMR of H2-atp in acetone-d6.

37
Figure 23. 13C-NMR of H2-atp in acetone-d6.
Figure 24. 1H-NMR of the blue complex in acetone-d6.

38
Figure 25. 13C-NMR of the blue complex in acetone-d6.
Figure 26. The 195Pt-NMR spectrum of blue product in acetone-d6.

39
The 195Pt-NMR spectrum of the blue complex was also measured in acetone-
d6. The spectrum of the blue complex is presented in Figure 26. A signal at -3175
ppm was observed as referenced to K2PtCl4 set at “0” ppm, which indicates the
presence of two nitrogen and two sulfur atoms around the platinum atom within the
range of -3100 and -3200 ppm [9, 58]. Since the blue complex is paramagnetic due to
the unpaired electron on the platinum atoms, the 195Pt-NMR spectrum is not reliable.
3.2. Electrochemistry
Electrochemical behavior of the blue complex and the ligand, H2-atp, were
studied via cyclic voltammetry (CV) and UV-Vis spectroscopy using platinum (or
glassy carbon) electrodes versus SCE (or Ag-wire) in acetone-[(n-C4H9)4N]BF4
solvent-electrolyte couple. The cyclic voltammetric data are summarized in Table 6.
Table 6. Cyclic Voltammetric data for H2-atp and the blue complex in
acetone-[(n-C4H9)4N]BF4 solvent-electrolyte couple.
a Oxidation peak potential; b Reduction peak potential. c Reversible peak potential.
Difference between the peak potentials of the reversible peaks were given in parenthesis in mV.
Compound Ea(V)a Ec(V)b Reference
Electrode
0.75
1.08
- 0.67 SCE
H2-atp
0.84
1.26
- 0.42 Ag-wire
0.90c (72)
1.53
-0.36c (50)
-1.15c (50)
SCE
The Blue Complex
1.10c (58)
1.67
-0.14c (62)
-0.92c (60)
Ag-wire

40
3.2.1. The Blue Complex
The cyclic voltammogram of the blue complex in acetone, displays two
oxidations, at 1.10 V (rev) and 1.67 V, and two reversible reduction, at -0.14 V (rev)
and -0.92 V (rev), peaks versus Ag-wire reference electrode (Figure 27).
-0 ,2 0 ,0 0 ,2 0 ,4 0 ,6 0 ,8 1 ,0 1 ,2 1 ,4 1 ,6 1 ,8 2 ,0
-1 0
-5
0
5
1 0
1 5
2 0
2 5
3 0
Cu
rre
nt
(uA
)
P o te n tia l (V )
Figure 27. CV of 0.001 M the blue complex in acetone vs Ag-wire. (a)
Anodic sweep (b) Cathodic sweep. (Molar concentration is based on the
formula [Pt2(2-atp)4(H2O)(OH)])
Controlled potential electrolysis of the blue complex was carried out both at
the first and second oxidation peak potentials by chrono-coulometry in order to
calculate the number of electrons transferred during the electro-oxidation. The
(a)
(b)

41
quantity of the charge is followed with respect to time in chrono-coulometry and the
electrolysis at the peak potentials were ended when the coulometric plot reached to
the plateau. The calculations, depending on the quantity of charge, indicated one and
two electron transfer processes for the 1st and 2nd peak potentials, respectively. The
number of the electron transferred during the electrochemical oxidation of the blue
complex at the peak potentials was also confirmed by peak-clipping method, where
the area under the each wave was integrated and compared with that of the
ferrocene/ferrocenium couple, which was in the same concentration of the blue
complex.
A plot of the peak current (Ia) versus the square root of the voltage scan rate
(V1/2) within the range of 100 to 900 mV/s, is given in Figure 28. According to the
“Nichelson-Shain” criteria, the positive slope in Figure 28 indicates a diffusion
controlled electron exchange reaction at the first oxidation peak potential of the blue
complex. The plot of current function I/(CV1/2) vs log V gave a straight line parallel
to horizontal axis for the 1st oxidation potential indicating a reversible exchange
reaction according to “Nichelson-Shain” criteria (Figure 29). Furthermore, the ratio
Ipc/Ipa was independent of scan rate and equal to unity for scan rates changing from
100 to 900 mV/s.
Figure 28. Variation of anodic current (µA) with the square root of voltage
scan rate (mV/s). a H2-atp; b the blue complex.
0
50
100
150
5 10 15 20 25 30
V1/2
I a
a
b

42
2000
4000
6000
8000
10000
1,5 1,7 1,9 2,1 2,3 2,5 2,7 2,9
Log V
I a/(
C.V
1/2)
Figure 29. Variation of current function I/(CV1/2), with the logarithm of the
voltage scan rate plot of H2-atp (a) and the blue complex (b) for the 1st
oxidation peaks, where I(µA) is the peak current, V(mV/s) the voltage scan
rate and C(mol/L) is the molar concentration.
Constant potential electrolysis of the complex in acetone was performed at
the two oxidation peak potentials consecutively, at -5±1 ºC, versus Ag wire. The
changes in the electronic absorption spectrum of the blue complex, which were
measured in situ during the electrolysis, are shown in Figure 30.
The controlled potential electrolysis carried out at the first oxidation peak
potential results an increase in the intensity of the band at 724 nm in Figure 30 (a). If
the most intense absorption band at 724 nm is assigned to metal to metal electron
transfer transition due to the mixed valance character, the increase in the intensity of
this band would indicate the formation of more “blue complex” in the electrolyte
solution. During the electro-reduction of the blue complex at the same electrode
potential, the original complex spectrum was also obtained.
a
b

43
During the electrochemical oxidation at the 2nd oxidation peak potential
following the 1st electron transfer, the band at 724 nm diminished indicating the
production of unstable Pt(III) species in tetranuclear form (Figure 30 (b)). Then this
(Pt3IIIPtII) species decomposed completely to an unknown compound at the end of the
electrolysis. No new band formation and isosbestic points were obtained during the
electron transfer processes at the 1st and 2nd peak potentials.
Figure 30. Recorded changes in the electronic absorption spectrum of the
blue complex during the constant potential electrolysis in acetone (a)
electrolysis at the 1st oxidation peak potential followed by the 2nd peak
potential (b) spectral changes obtained at the end of 1st, 2nd and 3rd
consecutive e- transfer.
Consequently, the spectroscopic and coulometric results suggest that the
electrochemical oxidation of blue complex at the 1st and 2nd oxidation peak potentials
Wavelength (nm)400 500 600 700 800 900
Ab
so
rba
nc
e (
AU
)
0
0.25
0.5
0.75
1
1.25
1.5
1.75
Wavelength (nm)660 680 700 720 740 760
Ab
so
rba
nc
e (
AU
)
1
1.1
1.2
1.3
1.4
1.5
1.6
1.7
1.8
(a)
(b)
1e 2nd e 3rd e Before electrolysis Decomposition

44
takes place through the metal center. A possible mechanism for the electrochemical
oxidation of the blue complex is as follows;
2Pt2II → PtIIIPt3
II + e- (Ia) (8)
PtIIIPt3II → Pt3
IIIPtII + 2e- (IIa) (9)
↓
Decomposes to an unknown product.
The two reversible cathodic peaks at -0.36 and -1.15 V vs SCE can be assigned as
PtIII/PtII and PtII/PtI electron transfer processes, respectively, depending on the
coulometric and spectroscopic results.
Pt3IIPtIII + e- ↔ 2Pt2
II (Ic) (10)
2Pt2II + e- ↔ Pt3
IIPtI (IIc) (11)
PtII/PtI electron transfer process was also suggested at around the same peak potential
in literature for a mononuclear Pt-complex containing sulfur donor ligand,
diethyldithiocarbomate [59].
3.2.2. 2-Aminothiophenol, H2-atp
The cyclic voltammogram of H2-atp was taken in acetone at room
temperature, which is shown in Figure 31. As shown in the Figure, CV of ligand
consists of two irreversible oxidation peaks at around 0.75 V and 1.08 V and an
irreversible reduction peak at -0.67 V vs SCE (Table 6).

45
Figure 31. The cyclic voltammogram of H2-atp in acetone vs SCE: (a)
Anodic sweep, (b) Cathodic sweep.
Controlled potential coulometry and the peak clipping methods confirmed
one electron transfer at the 1st oxidation peak potential and 2e- transfer at the 2nd
oxidation peak potential.
According to the “Nichelson-Shain” criteria, the positive slope in Figure 28
indicates a diffusion controlled electron exchange reaction at the first oxidation peak
potential of H2-atp. The negative slope of the plot of I/(CV1/2) vs log V shows a
-0,2 0,0 0,2 0,4 0,6 0,8 1,0 1,2 1,4
-1
0
1
2
3
4
5
6
7
I (u
A)
E (V)
-1,0 -0,8 -0,6 -0,4 -0,2 0,0
-350
-300
-250
-200
-150
-100
-50
0
50
I (u
A)
E (V)
(a)
(b)

46
reversible electron transfer, which is followed by a chemical reaction (Figure 29).
Appearance of irreversible peaks at Ia (Figure 31), instead of a reversible one, can be
explained by a fast chemical reaction following the electrochemical one.
Constant potential electrolysis of H2-atp was carried out at 100 mV more
positive potentials than the original peak potentials at platinum electrodes vs Ag-wire
in acetone-Bu4NBF4 solvent-electrolyte couple at room temperature. The spectral
changes that occur during the oxidation were followed in situ on a UV-VIS
spectrophotometer. The spectral changes during the electrolysis were displayed in
Figure 32. During the electrochemical oxidation of H2-atp at the first oxidation peak
potential, the band at 355 nm, which is the characteristic band in the spectrum of H2-
atp, increase its intensity gradually while a new shoulder at about 499 nm appeared
with the change in the color of the electrolyte solution from colorless to pink. No
isosbestic point was observed during this process. At the end of the 1e- transfer, the
potential was switched to the 2nd oxidation peak potential and the changes in the
spectrum were also monitored in situ by using UV-VIS spectrophotometer (Figure
33).
Figure 32. The spectral changes in the electronic absorption spectrum of H2-
atp in acetone during the constant potential electrochemical oxidation, at the
first and then followed at the second oxidation peak potentials.
Wavelength (nm)400 500 600 700 800 900
Ab
so
rba
nc
e (
AU
)
0
0.5
1
1.5
2
2.5
3
3.5
4

47
Figure 33. The electronic absorption spectrum of H2-atp in acetone after
electrochemical oxidation; (a) after 1e- transfer, (b) after 2e- transfer.
Electrolysis at the 2nd oxidation peak potential showed that the intensity of the
shoulder at 499 nm increased and became a peak while the band at 355 nm was much
more intense. Moreover, a new band formation was also observed at around 808 nm
with two isosbestic points at 656 and 866 nm, indicating one step electrode reaction
in the electrolyte solution. Color of the electrolyte solution turned to dark pink at the
end of this step and changed to colorless within a few minutes after the electrolysis
stopped.
Similar spectral changes were also obtained when the electrolysis carried out
at low temperature (-5 ± 1ºC).
In the light of the voltammetric, coulometric and spectroscopic findings, the
electrochemical process involving H2-atp in acetone, can be summarized as follow:
NH2
SH
NH2
S
+ 1e-+ H+
(12)
Wavelength (nm)400 500 600 700 800 900
Ab
so
rba
nc
e (
AU
)
0
0.5
1
1.5
2
2.5
3
3.5
(a) 1e-
(b) 2nd e-

48
S
NH2
S
NH2NH2
S
2
(13)
S
NH2
S
NH2
S+
NH2
S+
NH2
+ 2e-
(14)
S+
NH2
S+
NH2
S+
NH2
2slow
(15)
SH
NH2
+
S-
NH2
+ 1/2 H2e-
(16)
These observations suggest an oxidation process involving the initial
formation of an RS radical as in Equation 12, followed by dimerization to the
disulfide (RSSR) as in Equation 13. The disulfide can be afterwards oxidized to

49
disulfide cation, RS+-+SR, by 2 electron transfer as shown in Equation 14. Then,
RS+S+R is slowly decomposed to the sulfenium cation, RS+ (Equation 15) [60, 61].
The reduction processes, on the other hand, yielded the thiophenolate ion (RS-)
(Equation 16), which was quickly transferred to thiophenol, RSH as a result of
attacking of H+ present in the electrolyte solution.
All these results indicated that the oxidation and reduction processes took
place in the CV of the blue complex are metal based rather than ligand.

50
CHAPTER 4
DNA BINDING STUDIES
4.1. UV Titration
DNA plays an important role in the life process because it carries heritage
information and instructs biological synthesis of proteins and enzymes through the
process of replication and transcription of genetic information in living cells.
Interaction of DNA with drugs is one of the important aspects of biological
studies in drug discovery and pharmaceutical development processes [62, 63].
Anticancer drugs interact with DNA in different ways. One of them is the
intercalation of planar aromatic ring systems between base pairs. Planar organic
molecules containing several aromatic condensed rings often bind DNA in an
intercalative mode as in the case of DNA-acridine interaction as shown in Figure 34
[64].
Groove binding interaction is the 2nd mode as presented in the Figure 35 for
DNA-distamycin [65], in which the drug interacts with two grooves (minor and
major) of DNA-double helix. Minor binding causes intimate contacts with the walls
of the groove and the numerous hydrogen bonding and electrostatic interactions with
the bases and phosphate backbone. Major groove binding causes hydrogen bonding
to DNA, forming a DNA triple helix.
The third type of interaction is the electrostatic interaction. Generally metal
ion interactions can be given as an example of this kind of interactions [66-68].

51
Figure 34. DNA-Acridine interaction as an example of intercalative mode.
Figure 35. Groove binding of DNA-Distamycin.
The interactions of DNA with nucleic acid binding molecules has been
extensively studied by a variety of techniques such as DNA-footprinting [69-70],

52
NMR [71-72], mass spectrometry [73-79], spectrophotometric methods [80], FTIR
and Raman spectroscopy [81-82], molecular modeling techniques [83-85],
equilibrium dialysis [86], electric linear dichroism [87-91], capillary electrophoresis
[92-96] and surface plasmon resonance (an optical method to measure the refractive
index near a sensor surface within 300 nm) [97-100].
Electronic absorption spectroscopy is universally employed to determine the
binding of complexes with DNA. In order to determine the DNA binding
characteristics of the blue complex, the interaction of complex with calf thymus (ct)-
DNA were monitored using electronic absorption spectroscopic titration at room
temperature at fixed concentration (4.33x10⁻⁵ M) of complex and increasing
concentrations of DNA (8.66x10⁻⁵ M (R=2), 1.30x10⁻⁴ M (R=3), 1.73x10⁻⁴ M (R=4),
2.60x10⁻⁴ M (R=6), 3.46x10⁻⁴ M (R=8), and 4.33x10⁻⁴ M (R=10) in tris buffer (50
mM NaCl)-acetone (8:2) mixture at pH=7.1. The blue complex is not soluble in
aqueous solution, thus acetone was used to overcome this solubility problem of the
complex in tris-buffer solution. Although the electronic absorption spectrum of the
blue complex in acetone contains only one intense band at 724 nm, an additional
band appeared at about 550 nm upon the addition of the tris buffer solution (Figure
36). Accordingly, an equilibrium was established between the aqueous solvent
coordinated and uncoordinated form of the blue complex in tris-acetone mixture. The
change in tris buffer-acetone volume ratio disturbed this equilibrium. It was observed
that, increasing the volume ratio of tris buffer in this solvent mixture led an increase
in the intensity of the band at 550 nm, unlike the band at 724 nm, to a certain extent.
Otherwise, sudden precipitation of complex occurred as a result of further dilution
with tris-buffer solution. Therefore, the spectroscopic titration of our complex with
ct-DNA was made in optimized conditions in which the acetone amount was kept
minimum.
Complex bound to DNA through intercalation usually results in
hypochromism (decrease in molar absorbance) and red shift (bathocromism), due to
the intercalative mode involving a strong stocking interaction between aromatic
chromophore and the base pairs of DNA. The extent of the hypochromism is
commonly consistent with the strength of intercalative interaction [101-103]. In

53
contrast, an increase in molar absorptivity (hyperchromism) about 17.5% with an
insignificant red shift may be ascribed as the weak binding of the blue complex
involving hydrogen bonding interaction between hydroxyl group attached to the
complex, when interacted with DNA, or may support the electrostatic binding of ct-
DNA (Figure 36). However, the exact binding modes can be defined only if the
crystal structures of the complex-DNA adduct are determined. The similar
hyperchromism has been observed for porphyrins [104] and 1,3,5,8,10,12-
hexaazocyclotetradecane containing macro cyclic Cu[II] complexes and penta
coordinated Co(II) complexes containing 1,8-dihydro-1,3,6,8,10,13-
hexaazocyclotetradecane containing macro cyclic Cu(II) complexes [105-106].
Figure 36. UV titration of the blue complex in 5 mM tris buffer
(50 mM NaCl-acetone (8:2) mixture at pH 7.1 where R=2 to 10).
For the blue complex, the intrinsic binding constant, Kb, was determined from
the spectroscopic titration data using Equation 17.
[DNA / [εA – εF]] = [DNA] / [εB – εF] + 1 / Kb[εB – εF] (17)
Where εA, εF and εB correspond to A(abs)/ [Pt], the extinction coefficient for
the free platinum complex and the extinction coefficient for the platinum complex in
Wavelength (nm)400 500 600 700 800
Ab
so
rba
nc
e (
AU
)
0.2
0.4
0.6
0.8
1
1.2

54
the fully bound form; respectively. In the plot of [DNA] / [εA – εF] versus DNA
(Figure 37), Kb is then calculated by the ratio of the slope to intercept. The binding
constant obtained for the complex was 5 x 10⁻⁴. This Kb value much lower than those
observed for typical classical intercalators (ethidium-DNA 1.4 x 10⁶ M-1) is also
indicative of binding of complex with DNA with a weak interaction such as
hydrogen bonding or electrostatic mode.
Figure 37. UV titration of the blue complex with DNA for R= 2, 3, 4, 8, 10
values in tris buffer–acetone mixture (8:2).
4.2. Voltammetric Titration
In recent years, there has been a growing interest in the electrochemical
investigations of interaction between anticancer drugs and DNA. One of the practical
applications of electrochemistry is the determination of electrode redox processes.
Due to the existing a distinct parallelism between electrochemical and biological
reactions it can be assumed that the redox mechanisms taking place at the electrode
and in the body share similar principles [107-108].
Electrochemical investigations of nucleic acid binding molecules-DNA
interactions can provide a useful complement to the spectroscopic methods, e.g.
0
2
4
6
8
10
0,5 1,5 2,5 3,5 4,5
[DNA]x 10-4
[DN
A]/
(EA-E
F)x
10
-8

55
spectroscopically inactive species yield information about the mechanism of
intercalation and the conformation of anticancer drug- DNA adduct [109].
The explanation of the mechanism of interaction between anticancer drugs
and DNA by electrochemical methods is mainly based on the electrochemical
behavior of the anticancer drugs in the presence or absence of DNA. Observation of
the electrochemical signal related to DNA-DNA interactions or DNA-drug
interactions can provide evidence for the interaction mechanism, the nature of the
complex formed, binding constants and the role of free radicals generated during
interaction in the drug action. For the electrochemical detection of interaction
between drug and DNA, drug should be redox active.
The changes as a dramatic decrease/increase at the peak currents of the drug
which selectively binds with double stranded (ds)-DNA or that of the electroactive
DNA-bases such as guanine or adenine and the shifts of the formal potentials of the
redox couple caused by the intercalation of nucleic acid binding molecules into ds-
DNA, are used to determine the action mode of drug to DNA.
Drug- DNA interactions are investigated by using different electrochemical
techniques, including cyclic voltammetry [110], square wave voltammetry [111-
112], differential pulse voltammetry [113], and chronopotentiometry [114]. The
interaction mechanism can be investigated in three different ways, i.e., DNA
modified electrode, drug modified electrode and interaction in solution [115].
In this study the interaction of the blue complex with DNA is investigated in
solution (Tris buffer at pH=7) where complex and calf thymus (ct)-DNA are placed
in the same solution and after some given time of interaction (15 minute), the
changes in the electrochemical signals of complex-DNA compound are compared
with the signal of complex alone by using cyclic voltammetry. The cyclic
voltammogram of the blue complex in aqueous solution (tris buffer at pH=7)
displayed two waves at about 0.64 V (quasireversible) for PtII/PtIII and 1.18 V for
PtIII/PtIV couples versus Ag wire; as shown in Figure 38. This significant change in
oxidation potential in aqueous medium towards less positive values (Table 7) is most

56
probably due to the differing interactions of the solvent to the complex, since water
has better hydrogen bonding capability than acetone. In aqueous solution, the
platinum redox potentials are lower than that observed in acetone medium.
Figure 38. CV of the blue complex (a) in the absence (b) in the presence of
DNA in 5 mM tris buffer (50 mM NaCl-acetone (8:2) mixture at pH 7.1
where R=0 and 5)
In the presence of DNA, reversibility of the electron transfer was not
maintained. The positive shift in the 1st oxidation peak potential with increasing ratio
of total concentration of DNA to blue product suggests a difference in the binding
properties of PtII/PtIII species to DNA.
From reversible redox reactions of the free and bound species, the ratio of the
corresponding equilibrium constants for binding of each oxidation is calculated by
the Nernst Equation (18) [101-103].
Ebº - Efº = 0.0591 log [K+2/K+3] (18)
-0,2 0,0 0,2 0,4 0,6 0,8 1,0 1,2 1,4 1,6
-20
-10
0
10
20
30C
urr
ent
(uA
)
Potential (V)
(b)
(a)

57
where Ebº and Efº are the peak potentials of bound and free complex,
respectively. K+2 and K+3 are the corresponding binding constants for PtII and PtIII
species to ct-DNA. For the blue product, the K+2/K+3 is found to be 0.0966 where Eb
= 0.58 V and Ef = 0.64 V. The K+2/K+3 value of the complex is less than unity,
suggesting preferential stabilization of PtIII over PtII on binding to DNA. In addition
to the changes in formal potential upon addition of ct-DNA, the voltammetric current
decreases (Figure 38), which can be attributed to the slow diffusion of the metal
complexes bound to the large, slowly diffusing DNA molecules [116].
[PtII-PtIII] PtIII-PtIII + e-
K+2 ↑↓ K+3↑↓
[PtII-PtIII]-DNA [PtIII-PtIII]-DNA + e-
Under the assumption of reversible diffusion-controlled electron transfer
[117], non-linear regression analysis of experimental data was performed by using
following equations [118].
It = B [Xf Df1/2 + Xb Db
1/2] (19)
B = 2,69 x 10⁵ .n3/2 .A . V1/2 (20)
where It is the total anodic/cathodic peak current, A is the area of the working
electrode [7.85 x 10⁻⁷ m2], n is the number of electrons [1e-] involved in the redox
reaction, V is the scan rate [100 mV/s], Xf and Xb are the mole fractions of free and
bound species to DNA respectively.
A summary of the titration results is given in Table 7. Db is calculated by
using a general assumption in which describing Db as 6.4% of Df value [119-120]. Df
and Db are diffusion constants of free and bound species, respectively.

58
Table 7. Voltametric and UV titration data for the blue complex with ct-
DNA.
Complex Df (10-4) Db(10-5) Kb(10-4) K2+/K3+
The Blue Complex 2.90 1.85 5.00 0.0966
4.3. Enzyme Activity of the Blue Complex Human beings ingest number of foreign chemicals, collectively referred to as
XENOBIOTICS (xeno means foreign). These include pharmaceuticals, pesticides,
herbicides and industrial chemicals as well as complex structures. Many of them
insoluble in water, but soluble in fat and therefore tend to participate into the
hydrocarbon layer of membranes. Against to the wide range of xenobiotics,
organisms have developed several defense mechanisms such as drug efflux pumps,
drug sequestration, drug metabolism, and repair of drug-target sites. The vital
function of the chemical defense is known as detoxification and is affected
principally by the liver.
Detoxification of xenobiotics is one of the major functions of reduced
glutathione (GSH). Toxic electrophiles conjugate with GSH, either spontaneously or
enzymatically in Glutathione S-transferases catalyzed reactions.
Glutathione S-transferases (GSTs) are enzymes that participate in cellular
detoxification of endogenous as well as foreign electrophilic compounds.
GSH + RX → GSR + HX (21)
Thus, transferase reactions are the major pathway for GSH utilization in the
liver. GSTs are found in all human tissues. Normal levels of GSH in humans are 10-
30 µM (plasma) 1-3 µM (urine), 3 mM in kidney and 1-10 mM in tumors of various
organ sites [121].

59
Six different classes of soluble GSTs have been identified; alpha (α), mu (µ),
pi (π), sigma (σ), theta (θ) and zeta (δ). This classification is in accordance with the
substrate specify, chemical affinity, structure, aminoacid sequence and kinetic
behavior of the enzyme [122].
The expression level of the different classes of GST is tissue specific, in
human liver. The GST alpha class forms 80 % of the total GST expressed and the
GST A1-1 isoform predominates. In contrast, human colonic tissue expressed GST pi
as the major class of GST.
Differential expression also occurs within an organ, eg: in the kidney, GST
alpha predominates in the proximal tubules, whereas GST pi and GST mu are the
major isoforms in the thin loop of Henle, the distal tubules and the collecting ducts
[123].
The GST in addition to their enzymatic activities, bind with high affinity to a
variety of hydrophobic compounds such as heme, billirubin, hormones and drugs,
which suggests that may serve as introcellular carrier proteins for the transport of
various ligands. A marked increase in GST activity has been observed in tumor cells
resistant to anticancer drugs [124]. It has also been shown that alterations in GST and
GST levels are related not only in vitro drug resistance but also to clinical response
to chemotherapy [123].
In our study, enzyme activity of the blue complex was determined by
following the changes on total GST activity in sheep liver with the addition of
different concentrations of complex solution prepared in phosphate buffer at pH 6.5.
1-chloro-2,4-dinitrobenzene (CDNB) was used as a substrate which is known as the
universal substrate for GSTs since it is used for the demonstration of multiple forms
of GSTs in various biological species. When conjugated with GSH, it gives S-(2,4-
dinitrophenyl) glutathione, a compound possessing an absorbance spectrum
sufficiently different from that of CDNB to allow a simple spectrophotometric assay
at 340 nm [41].
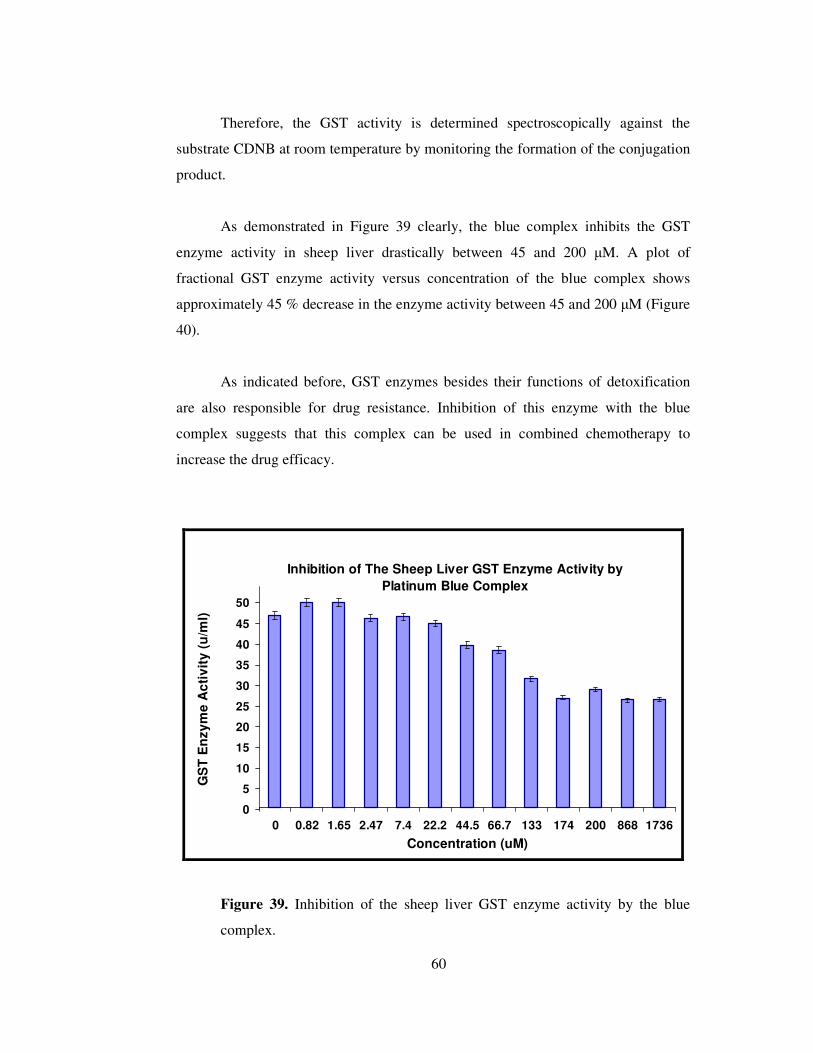
60
Therefore, the GST activity is determined spectroscopically against the
substrate CDNB at room temperature by monitoring the formation of the conjugation
product.
As demonstrated in Figure 39 clearly, the blue complex inhibits the GST
enzyme activity in sheep liver drastically between 45 and 200 µM. A plot of
fractional GST enzyme activity versus concentration of the blue complex shows
approximately 45 % decrease in the enzyme activity between 45 and 200 µM (Figure
40).
As indicated before, GST enzymes besides their functions of detoxification
are also responsible for drug resistance. Inhibition of this enzyme with the blue
complex suggests that this complex can be used in combined chemotherapy to
increase the drug efficacy.
Inhibition of The Sheep Liver GST Enzyme Activity by
Platinum Blue Complex
0
5
10
15
20
25
30
35
40
45
50
0 0.82 1.65 2.47 7.4 22.2 44.5 66.7 133 174 200 868 1736
Concentration (uM)
GS
T E
nzy
me
Ac
tiv
ity
(u
/ml)
Figure 39. Inhibition of the sheep liver GST enzyme activity by the blue
complex.

61
Concentration-Response Plot for The Platinum Blue
Complex on The GST Enzyme Activity
0.40
0.50
0.60
0.70
0.80
0.90
1.00
0 0.82 1.65 2.47 7.4 22.2 44.5 66.7 133 174 200 868 1736
Concentration (uM)
Fra
cti
on
al
GS
T E
nzy
me
Ac
tiv
ity
Figure 40. Concentration-response plot for the blue complex on the GST
enzyme activity.

62
CHAPTER 5
CONCLUSION
Reaction of K2PtCl4 with 2-aminothiophenol (H2-atp), in basic aqueous
solution yielded, first a yellow solid, then, followed by refluxing at around 40ºC
yielded a green, and finally a blue solid product. Elemental analysis of all three
products suggested that the platinum to 2-aminothiophenolate ratio is 1:2 in all three
solids. Among these three, only the blue product, which we call it “the blue
complex”, was soluble in acetone, acetonitrile, DMSO and DMF. The blue complex
is stable in solution and exhibited very strong electronic absorption band at 724 nm.
ESR measurement of the blue complex indicated that it is paramagnetic.
On the bases of the results gathered from elemental analysis, UV-Vis, ESR,
XPS, 1H-, 13C- and 195Pt-NMR, CV measurements it is proposed that the blue
complex is a new “platinum blues”, first time synthesized in this work, with a
formula [Pt4(2-atp)8(OH)(H2O)]. The structure can be visualized as the dimer of the
head-to-head isomer of binuclear [Pt2(2-atp)4] complex. It is a mixed valence
complex with one platinum “+3” and the other three platinums “+2” oxidation state
in tetranuclear unit “Pt(III) Pt(II)3”. The 2-aminothiophenolate ligand act as bridging
ligand coordinating to one platinum from the nitrogen and to the other platinum from
the sulfur in a binuclear unit. Dimerization of the binuclear complexes took place
with partial oxidation of the metal center yielding a mixed valence tetranuclear
complex, in which relatively strong hydrogen bonding type interaction exist between
the amine hydrogens of one binuclear unit and the lone pair electrons on the sulfur
atom of the other.
The molecular orbital consideration clearly indicates that going from
binuclear complex to the tetranuclear complex, the energy of the electronic transition
involving metal based molecular orbitals will shift to lower energy part of the

63
spectrum. The assignment of the electronic transition resulting the distinct 724 nm
band is done as 2Bu → 2Ag (2buı → 3ag
ı) (Figure 19).
All platinum blues reported in the literature so far contains nitrogen and
oxygen donor atom ligands. The blue complex prepared in this work is the first
example of the platinum blues, which contain nitrogen and sulfur donor ligands. It is
also interesting that in all previous platinum blues the bridging ligand forms 5-
membered ring upon coordination (two platinum atoms and three ligand atoms), in
our case the bridging ligand forms 6-membered ring upon coordination. It will be
interesting to determine the Pt-Pt distance and compare it with others. Unfortunately,
all efforts to prepare a single crystal of the blue complex, appropriate for x-ray
analysis, failed. The result of the x-ray structure determination must be ultimate goal
in the continuation of this work. This will be the best way to check all hypotheses
made on the blue complex in this work.
Electronic absorption spectroscopy is employed to determine the binding
mode of the blue complex to ct-DNA. Hyperchromism about 17,5 % with an
insignificant red shift revealed a weak binding of the blue complex to DNA, such as
electrostatic interaction of metal ions or H-bonding through the hydroxyl group of
the complex. The binding constant obtained for the complex was 5x10⁻⁴ which is
lower than those observed for classical intercalators, is also indicative of weak
binding mode of the blue complex. Voltammetric titration carried out in solution
suggested the preferential stabilization of Pt(III) to Pt(II) and Pt(IV) to Pt(III) on
binding to DNA.
Enzymatic activity of the blue complex was determined in sheep liver GST
enzymes spectroscopically. The blue complex inhibits the GSTs activity between
45-200 µM. Since GST enzymes besides their function of detoxification are also
responsible for drug resistance, inhibition of this enzyme with the blue complex
suggest that this complex can be used in combined chemotherapy, as well.

64
REFERENCES
[1] Lippert, B., Coord. Chem. Rev., 1999, 182, 263.
[2] Thompson, D.T., Chem. Br. (1984) 333.
[3] Young, G., Natl. Geogr. 164 (1983) 686.
[4] B. Rosenberg, L. VanCamp, Nature 205 (1965) 698.
[5] B. Rosenberg, L. VanCamp, J.E. Trosko, V.H. Mansour, Nature 222 (1969) 385.
[6] H.M. Pinedo, J.H. Schornagel (Eds.), Platinum and Other Metal Coordination
Compounds in Cancer Chemotherapy, Plenum Press, New York, 1996.
[7] S.J. Lippard, Science 261 (1993) 699.
[8] Tejel, C., Ciriano, M.A., Oro, L.A., Chem. Eur. J., 1999, 5, 1131
[9] Matsumoto, K., Sakai., Adv. Inorg. Chem., 2000, 49, 375
[10] Hoffmann, K.A., Bugge, G., Berichte., 1908, 41, 312
[11] Gillard, R.D., Wilkinson, G., J. Chem. Soc., 1964, 2835
[12] Schmuckler, G., Limoni, B., J. Inorg. Nucl. Chem., 1977, 39, 137
[13] Flynn, C. M., Viswanthan, T. S., Martin, R. B., J. Inorg. Nucl. Chem., 1977, 39,
347
[14] Laurent, M. P., Tewksbury, J. C., Krogh-Jespersen, M.B., Inorg. Chem., 1980,
19, 1656
[15] Arrizabalaga, P., Castan, P., Laurent, J. P., Trans. Met. Chem., 1980, 5, 204
[16] Burness, J. H., Inorg. Chim. Acta., 1980, 44, L49
[17] Ettorre, R., Inorg. Chim. Acta., 1980, 46, L27
[18] Allen Chan, C., Marcotte, R. B., Patterson, H. H., Inorg. Chem., 1981, 20, 1632
[19] Laurent, J. P., Lepage, P., Can. J. Chem., 1981, 59, 1083
[20] Laurent, J. P., Lepage, P., Castan, P., Arrizabalaga, P., Inorg. Chem. Acta.,
1982, 67, 31
[21] Arrizabalaga, P., Castan, P., Laurent, J. P., J. Am. Chem. Soc., 1984, 106, 1300
[22] Arrizabalaga, P., Castan, P., Laurent, J. P., J. Am. Chem. Soc., 1984, 106, 4814
[23] Rosenberg, B., Van Camp, L., Krigas, T., Nature (London), 1965, 205, 698

65
[24] Rosenberg, B., Van Camp, L., Trosko, J. E., Mansour, V. H., Nature (London),
1969, 222, 385
[25] Rosenberg, B., Van Camp, L., Cancer Res., 1970, 30, 1799
[26] Hill, J. M., Loeb, E., Mclellan, A., J. Cancer Chemother. Rep., 1975, 59, 589
[27] Davidson, J. P., Faber, P. J., Fisher. R. G., Cancer Chemother. Rep., 1975, 59,
287
[28] Rosenberg, B., Van Camp, L., Krigas, T., Nature (London), 1965, 205, 698
[29] Barton, J. K., Rabinowitz, H. N., Szalda, D. J., Lippard, S. J., J. Am. Chem.
Soc., 1977, 99, 2827
[30] Barton, J. K., Rabinowitz, H. N., Szalda, D. J., Lippard, S. J., Waszczak, J. V., J.
Am. Chem. Soc., 1979, 101, 1434
[31] O’Halloran, T.V., Lippard. S.J., J. Am. Chem. Soc., 1983, 105, 3341.
[32] O’Halloran, T.V., Lippard. S.J., J. Am. Chem. Soc., 1989, 28, 1289.
[33] Hollis, L.S., Lippard. S.J., Inorg. Chem., 1983, 22, 2605.
[34] Hollis, L.S., Lippard. S.J., Inorg. Chem., 1982, 21, 2116.
[35] Matsumoto, K., Harashima, K., Inorg. Chem., 1991, 30, 3032.
[36] Sakai, K., Matsumoto, K., J. Am. Chem. Soc., 1989, 111, 3074.
[37] Sakai, K., Matsumoto, K., Nishio, K., Tokisue, Y., Ito, R., Nishide, T., Shichi,
Y., J. Am. Chem. Soc., 1992, 114, 8110.
[38] Sakai, K., Matsumoto, K., Nishio, K., Chem. Lett., 1991, 1081.
[39] Gillham, B., Biochem. J., 1971, 121, 667.
[40] Habig, W.H., Jakoby, W.B., Methods Enzymol., 1981, 77, 398.
[41] Habig, W.H., Pabst, M.J., Jakoby, W.B., J. Biol. Chem., 1974, 249, 7130.
[42] Cotton, F.A., Walton, R.A., Multiple Bonds Between Metal Atoms, 2nd ed.,
Clarendon Press., Oxford, 1993.
[43] Bear, J.L., Gray, H.B., Rainen, L., Chang, I.M., Howard, R., Serio, G., Kimball,
A.P., Cancer Chemother. Rep., 1975, 59, 611.
[44] Hui, B.C.Y., Teo, W.K., Rempel, G.L., Inorg. Chem., 1973, 12, 757.
[45] Barbera, J., Esteruelas, M.A., Levelut, A.M., Oro, L.A., Serrano, J.L., Sola, E.,
Inorg. Chem., 1992, 31, 732.
[46] Isci, H., Mason, W.R., Inorg. Chem., 1985, 24, 1761.
[47] Barton, J.K., Rabinowitz, H.N., Szalda, D.J., Lippard, S.J., J. Am. Chem. Soc.,
1977, 99, 2827.

66
[48] Barton, J.K., Rabinowitz, H.N., Szalda, D.J., Waszcak, J.V., Lippard, S.J., J.
Am. Chem. Soc., 1979, 101, 1434.
[49] Lippert, B., Neugebauer, D., Raudaschl, G., Inorg. Chim. Acta, 1983, 78,161.
[50] Barton, J.K., Caravana, C., Lippard, S.J., J. Am. Chem. Soc., 1979, 101, 7269.
[51] Laurent, J.P., Lepage, P., Castan, P., Arrizabalaga, P., Inorg. Chim. Acta, 1982,
67, 31.
[52] Zaki, A.A., McAuliffe, C.A., Friedman, M.E., Hill, W.E., Kohl, H.H., Inorg.
Chim. Acta, 1983, 69, 93.
[53] O’Halloran, T.V., Mascharak, P.K., Williams, I.D., Roberts, M.M., Lippard,
S.J., J. Inorg. Chem., 1987, 26, 1261.
[54] Matsumoto, K., Urata, H., Chem. Lett., 1994, 307.
[55] Matsumoto, K., Sakai, K., Nishio, K., Tokisue, Y., Ito, R., Nishide, T., Shichi,
Y., J. Am. Chem. Soc., 1992, 114, 8110.
[56] Matsumoto, K., Sakai, K., Nishio, K., Chem. Lett., 1991, 1081.
[57] Matsumoto, K., Watanabe. T., J. Am. Chem. Soc., 1986, 108, 1308.
[58] Lempers, E. L. M., Reedijk, J., Inorg. Chem., 1990, 29, 217.
[59] Yaman, Ş. Ö., Önal, A. M., Isci, H., Z. Naturforsch., 2001, 56, 202.
[60] Lund, H., Hammerich, O., Marcell Dekker Inc., 2001, 621.
[61] Borsan, M., Cannio, M., Gavioli, G., Electroanalysis, 2003, 15, 1192.
[62] Rauf, S., Gooding, J.J., Akhtar, K., Ghauri, M.A., Rahman, M., Anwar, M.A.,
Khalid, A.M., J. Pharm. Biomed. Anal., 2004, 34, 879.
[63] Erdem, A., Ozsoz, M., Electroanalysis, 2002, 14, 965.
[64] Boldron, C., Ross, S.A., Pitie, M., Meunier, B., Bioconjugate Chem., 2002, 13,
1013.
[65] Pitie, M., Burrows, C.J., Meunier, B., Nucleic Acid Res., 2000, 28, 4856.
[66] Bleckburn, G.M., Gait, M.N., Nucleic Acids in Chem. Biol., 1990, 297.
[67] Graves, D.E., Velea, L.M., Curr. Org. Chem., 2000, 4, 915.
[68] Duan, D., Pharmacology, 2004, 601, 61.
[69] Fox, K.R., Waring, M.J., Nucl. Acids Res., 1984, 12, 9271.
[70] Hadman, R.D., Skellern, G.G., Weigh, R.D., Nucl. Acids Res., 1998, 26, 3053.
[71] Kessler, H., Gehrke, M., Griesinger, C., Angew. Chem. Int. Edn. Engl., 1988,
27, 490.
[72] Powers, R., J. Struct. Func. Genom., 2002, 2, 113.

67
[73] Yamashita, M. Fenn, J.B., J. Phys. Chem., 1984, 88, 4451.
[74] Karas, M., Backmann, D., Bahr, U., Hillenkamp, F., Int. J. Mass Spectrom. Ion
Process., 1987, 78, 53.
[75] Berkel, G.J.V., Eur. J. Mass Spectrom., 2003, 9, 539.
[76] Barber, M., Bordoli, R.S., Elliot, G.J., Sedgwick, R.N., Tayler, A.N., Anal.
Chem., 1982, 54, 645.
[77] Mohan, J., Organic Spectroscopy, 2000, 351.
[78] TomLinson, A.J., Benson, L.M., Jhonson, K.L., Naylor, S., J. Chromatogr.,
1993, 621, 239.
[79] Yoshitsigu, H., Fuhuhara, T., Ishibashi, M., Nanbo, T., Kagi, N., J. Mass
Spectrom., 1994, 34, 1063.
[80] Gopal, M., Shahabuddin, M.S., Inamdar, S.R., Proc. Indian Acad. Sci., 2002,
114, 687.
[81] Morjani, H., Riou, J.F., Nabiev, I., Cancer Res., 1993, 53, 4784.
[82] Le Gal, J.M., Morjani, H., Cancer Res., 1993, 53, 3681.
[83] Caldwell, J., Kollman, P.A., Biopolimers, 1986, 25, 249.
[84] Cieplak, P., Rao, S.N., Biopolimers, 1990, 29, 717.
[85] Huang, Y.Q., Jiang, H.L., Luo, M.X., Acta Pharmacol, 2000, 21, 536.
[86] Delahoussaye, Y.M., Hay, M.P., Pruijn, F.B., Denny, W.A., Biochem.
Pharmacol. 2003, 65, 1807.
[87] Bailly, C., Colson, P., Houssier, C., Nucl. Acids Res., 1996, 24, 1460.
[88] Houssier, C., Molecular Electro-Optics., 1981, 363.
[89] Bailly, C., Henichart, J.P., Colson, P., J. Mol. Recognit., 1992, 5, 155.
[90] Colson, P., Bailly, C., Houssier, C., Biophys. Chem., 1996, 58, 125.
[91] Eriksson, M., Norden, B., Meth. Enzymol, 2001, 340, 68.
[92] Guttman, A., Cooke, N., Anal. Chem., 1991, 63, 2038.
[93] Kraak, J.C., Bush, S., Poppe, H., J. Chromatogr. 1992, 680, 405.
[94] Heegard, N.H.H., J. Chromatogr., 1994, 680, 405.
[95] Hadman, I.I., Skellern, G.G., Waigh, R.D., Nucl. Acids Res., 1998, 26, 3053.
[96] Kemp, G., Biotechnol. Appl. Biochem., 1998, 27, 9.
[97] Jonsson, U., Malmquist, M., Adv. Biosens., 1992, 2, 291.
[98] Gambari, R., Curr. Med. Chem., 2001, 1, 277.
[99] Schuck, P., Annu. Rev., Biophys. Biomol. Struct., 1997, 26, 541.

68
[100] Merwe, V.D., Brown, P.A., Barclay, A.N., Trends Biochem. Sci., 1994, 19,
354.
[101] Barton, J.K., Danishefsky, A.T., Goldberg, J.M., J. Am. Chem. Soc., 1984,
106, 2172.
[102] Tysoe, S.A., Morgan, R.J., Baker, A.D., J. Phys. Chem., 1993, 97, 1707.
[103] Kelly, T.M., Tossi, A.B., McConnell, D.J., Strekas, T.C., Nucleic Acids Res.,
1985, 13, 6017.
[104] Pasternack, R.F., Gibbs, E.J., Villafranca, J.J., Biochemistry, 1983, 22, 2406.
[105] Liu, J., Zhang, T., Lu, T., Qu, L., Zhou, H., Zhang, Q., Ji, L., J. Of Inorg.
Biochem., 2002, 91, 269.
[106] Tabassum, S., Rarveen, S., Arjmand, F., Actabiomaterial, 2005, 1, 677.
[107] Suzen, S., Demircigil, B.T., Ozkan, S.A., New J. Chem., 2003, 6, 1007.
[108] Kauffmann, J.M., Vire, J.C., Anal. Chim. Acta, 1993, 173, 329.
[109] Wang, J., Cai, X., Rivas, G., Shraishi, H., Biosens. Bioelectron, 1997, 12, 587.
[110] Kissinger, P.T., J. Chem. Educ., 1983, 60, 702.
[111] Laviron, E., Electroanalytical Chem., 1982, 53.
[112] Nagy, Z., Modern Aspects of Elect., 1990, 237.
[113] Bond, A.M., Modern Polar. Meth. In Anal. Chem., 1980, 269.
[114] Brett, C.M.A., Elect. Principles., 1993, 208.
[115] Erdem, A., Ozsos, M., Electroanalysis, 2002, 14, 965.
[116] Hirohama, T., Kuranuki, Y., Ebina, E., J. of Inorg. Biochem., 2005, 99, 1205.
[117] Srinivasan, S., Annaraj, J., Athappan, P.R., J. of Inorg. Biochem., 2005, 99,
876.
[118] Mahadevan, S., Palaniandavar, M., Inorg. Chim. Acta, 1997, 254, 291.
[119] Carter, M.T., Rodriguez, M., Bard, A.J., J. Am. Chem. Soc., 1989, 111, 8901.
[120] Vaidyanathan, V.G., Balachandran, U.N., Royal Soc. Of Chem., 2005, 2842.
[121] Tew, K.D., Picket, C.B., Mantle, T.J., Mannervik, B., Hayes, J.D., Structure
and Function of Glutathione Transferases, 1993.
[122] Landi, S., Mutation Research, 2000, 463, 247.
[123] Kearns, P.R., Hall, A.G., DDT., 1998, 3, 113.
[124] Daniel, V., Crit. Rev. Biochem and Mol. Biol., 1993, 3, 173.
[125] Yaman, Ş.Ö., Önal, A.M., Isci, H., Zeitschrift für Naturforschung, 2003, 58b,
563.


