
U.S. Department of TransportationNational HighwayTraffic Safety Administration
DOT HS 808 338 January 1996NHTSA Technical Report
The Crash OutcomeData Evaluation System
(CODES)
This document is available to the public from the National Technical Information Service, Springfield, Virginia 22161
i
Technical Report Documentation Page1. Report No. 2. Government Accession No. 3. Recipient’s Catalog No.
DOT HS 808 3384. Title and Subtitle 5. Report Date
The Crash Outcome Data Evaluation System (CODES) January 19966. Performing Organization Code
7. Author(s) 8. Performing Organization Report No.
Sandra W. Johnson and Jonathan Walker9. Performing Organization Name and Address 10. Work Unit No. (TRAIS)
Mathematical Analysis DivisionNational Center for Statistics and Analysis400 7th Street, SWWashington, DC 20590
11. Contract or Grant No.
12. Sponsoring Agency Name and Address 13. Type of Report and Period Covered
Research and Development NHTSA Technical ReportNational Highway Traffic Safety Administration400 7th Street, SWWashington, DC 20590
14. Sponsoring Agency Code
15. Supplementary Notes
This document is an accompaniment to the Report to Congress on “Benefits of Safety Belts and MotorcycleHelmets, based on data from The Crash Outcome Data Evaluation System (CODES),” December, 1995.16. Abstract
The CODES Technical Report presents state-specific results from the Crash Outcome Data EvaluationSystem project. These results confirm previous NHTSA studies and show that safety belts and motorcyclehelmets are effective in reducing fatalities and injuries. The Report also shows that safety belt andmotorcycle use in the seven CODES states (Hawaii, Maine, Missouri, New York, Pennsylvania, Utah, andWisconsin) could save millions of dollars in direct medical costs. The CODES project represents the firsttime that occupant-specific medical outcome and cost data for all occupants involved in motor vehiclecrashes were available for highway safety evaluation. The technical report provides detailed descriptions ofthe crash, EMS, emergency department, hospital discharge and other state data files used to generate thepopulation-based information for the Report to Congress. It describes the background of the CODESproject, the selection of the seven states, the formation of the CODES advisory committees within eachstate (crucial to a project which depended on the cooperation of various data owners and data users) andthe concepts of probabilistic linkage. Variations and similarities among the states are discussed regardingthe availability of state data, file preparation, linkage variables, the linkage process and resulting linkagerates, and validation of the linkage results. It elaborates on the uniform research model used and discussesthe outcome variables, additional risk factors used as covariates, models used in the logistic regressions,and methods of computing weighted averages of odds ratios and effectiveness. It compares odds ratios torisk ratios and ‘effectiveness’ and presents state-specific results for the safety-belt analyses of injury andcost of injury. Finally, the document gives digests of other state-specific analyses, covering topics such as:data quality, additional linkages to improve the results, data outliers (extreme values, as in inpatientcharges), alcohol and drug use, age factors, types of safety belts, and geographic patterns in crashcharacteristics.
17. Key Words 18. Distribution Statement
Safety belts, motorcycle helmets, probabilistic linkage, No Restrictions. This document is available tocrash, injury, state data ,logistic regression, CODES, the public through the National Technicalmedical costs, brain injuries, motorcycles, passenger Information Service, 5285 Port Royal Road,cars, light trucks. Springfield, VA 2216119. Security Classification (of this report) 20. Security Classification (of this page) 21. No. of Pages 22. Price
Unclassified Unclassified 95
Form DOT F 1700.7 (8-72) Reproduction of completed page authorized
CODES Technical Report ii January 1996
ACKNOWLEDGMENT
The National Center for Statistics and Analysis of the National Highway Traffic Safety
Administration wishes to acknowledge the outstanding collaborative effort by the many
individuals and organizations in the seven CODES states -- Hawaii, Maine, Missouri, New York,
Pennsylvania, Utah, and Wisconsin -- in generating the data for and assisting in the preparation of
this report.
CODES Technical Report iii January 1996
INTRODUCTION . . . . . . . . . . . . . . . . . . . . . . . . . . . . . . . . . . . . . . . . . . . . . . . . . . . . . . . . . . 1Intermodal Surface Transportation Efficiency Act (ISTEA) . . . . . . . . . . . . . . . . . . . 1Format of the Report . . . . . . . . . . . . . . . . . . . . . . . . . . . . . . . . . . . . . . . . . . . . . . . . . . 1Background . . . . . . . . . . . . . . . . . . . . . . . . . . . . . . . . . . . . . . . . . . . . . . . . . . . . . . . . . 2
CONCEPTS OF LINKAGE . . . . . . . . . . . . . . . . . . . . . . . . . . . . . . . . . . . . . . . . . . . . . . . . . . 3Probabilistic Linkage . . . . . . . . . . . . . . . . . . . . . . . . . . . . . . . . . . . . . . . . . . . . . . . . . . 4
DESCRIPTION OF THE CODES STATES . . . . . . . . . . . . . . . . . . . . . . . . . . . . . . . . . . . . . 5CODES Advisory Committees . . . . . . . . . . . . . . . . . . . . . . . . . . . . . . . . . . . . . . . . . . 7
DESCRIPTION OF CRASH AND INJURY STATE DATA FOR LINKAGE . . . . . . . . . . 9Characteristics of Statewide Data. . . . . . . . . . . . . . . . . . . . . . . . . . . . . . . . . . . . . . . . 9Advantages of Linkage . . . . . . . . . . . . . . . . . . . . . . . . . . . . . . . . . . . . . . . . . . . . . . . 11Non-Medical Data Resources . . . . . . . . . . . . . . . . . . . . . . . . . . . . . . . . . . . . . . . . . . 12
POLICE CRASH REPORT. . . . . . . . . . . . . . . . . . . . . . . . . . . . . . . . . . . . . . . 12VEHICLE REGISTRATION DATA . . . . . . . . . . . . . . . . . . . . . . . . . . . . . . . . 14DRIVER LICENSING DATA . . . . . . . . . . . . . . . . . . . . . . . . . . . . . . . . . . . . . 14CENSUS . . . . . . . . . . . . . . . . . . . . . . . . . . . . . . . . . . . . . . . . . . . . . . . . . . . . . 14ROADWAY/INFRASTRUCTURE . . . . . . . . . . . . . . . . . . . . . . . . . . . . . . . . . 14
Medical Data Resources . . . . . . . . . . . . . . . . . . . . . . . . . . . . . . . . . . . . . . . . . . . . . . 15EMERGENCY MEDICAL SERVICES. . . . . . . . . . . . . . . . . . . . . . . . . . . . . . 15EMERGENCY DEPARTMENT . . . . . . . . . . . . . . . . . . . . . . . . . . . . . . . . . . . 16INPATIENT HOSPITAL AND REHABILITATIVE RECORDS . . . . . . . . . . 17LONG-TERM HEALTH CARE (NURSING HOMES) INFORMATION. . . . 19DEATH CERTIFICATE . . . . . . . . . . . . . . . . . . . . . . . . . . . . . . . . . . . . . . . . . 19OTHER INJURY DATA SYSTEMS. . . . . . . . . . . . . . . . . . . . . . . . . . . . . . . . 19INSURANCE CLAIMS . . . . . . . . . . . . . . . . . . . . . . . . . . . . . . . . . . . . . . . . . . 19
FILE PREPARATION . . . . . . . . . . . . . . . . . . . . . . . . . . . . . . . . . . . . . . . . . . . . . . . . . . . . . 21Linkage Variables With The Power To Discriminate . . . . . . . . . . . . . . . . . . . . . . . 23Ancillary Linkages Performed by Each State. . . . . . . . . . . . . . . . . . . . . . . . . . . . . . 25
THE LINKAGE PROCESS . . . . . . . . . . . . . . . . . . . . . . . . . . . . . . . . . . . . . . . . . . . . . . . . . 27The Sequence of Linkage. . . . . . . . . . . . . . . . . . . . . . . . . . . . . . . . . . . . . . . . . . . . . . 27The Linkage Results . . . . . . . . . . . . . . . . . . . . . . . . . . . . . . . . . . . . . . . . . . . . . . . . . 28
SIGNIFICANCE OF THE LINKAGE RATES . . . . . . . . . . . . . . . . . . . . . . . . 31Validation of the Linkage Results . . . . . . . . . . . . . . . . . . . . . . . . . . . . . . . . . . . . . . . 32
FALSE POSITIVES: (Internal Validity). . . . . . . . . . . . . . . . . . . . . . . . . . . . . 32FALSE NEGATIVES: (External Validity). . . . . . . . . . . . . . . . . . . . . . . . . . . . 33
CODES Technical Report iv January 1996
Obstacles to Linkage . . . . . . . . . . . . . . . . . . . . . . . . . . . . . . . . . . . . . . . . . . . . . . . . . 35
MANDATED RESEARCH MODEL FOR SAFETY BELTS AND HELMETS . . . . . . . . 36The Study Population . . . . . . . . . . . . . . . . . . . . . . . . . . . . . . . . . . . . . . . . . . . . . . . . 36
OUTCOME MEASURES . . . . . . . . . . . . . . . . . . . . . . . . . . . . . . . . . . . . . . . . 37COSTS AS AN OUTCOME MEASURE. . . . . . . . . . . . . . . . . . . . . . . . . . . . . 39
Discussion of Charge Versus Costs. . . . . . . . . . . . . . . . . . . . . . . . . . . 39INDEPENDENT VARIABLES: (Covariates). . . . . . . . . . . . . . . . . . . . . . . . . 41STATISTICAL METHODS. . . . . . . . . . . . . . . . . . . . . . . . . . . . . . . . . . . . . . . 42
RESULTS--BENEFITS OF SAFETY BELTS . . . . . . . . . . . . . . . . . . . . . . . . . . . . . . . . . . . 46Odds Ratios . . . . . . . . . . . . . . . . . . . . . . . . . . . . . . . . . . . . . . . . . . . . . . . . . . . . . . . . 46
DIED . . . . . . . . . . . . . . . . . . . . . . . . . . . . . . . . . . . . . . . . . . . . . . . . . . . . . . . . 47DIED AND/OR INPATIENT . . . . . . . . . . . . . . . . . . . . . . . . . . . . . . . . . . . . . 50DIED, INPATIENT, OR TRANSPORTED. . . . . . . . . . . . . . . . . . . . . . . . . . . 52ANY INJURY . . . . . . . . . . . . . . . . . . . . . . . . . . . . . . . . . . . . . . . . . . . . . . . . . 54
Effectiveness. . . . . . . . . . . . . . . . . . . . . . . . . . . . . . . . . . . . . . . . . . . . . . . . . . . . . . . . 56Reduction in inpatient charges . . . . . . . . . . . . . . . . . . . . . . . . . . . . . . . . . . . . . . . . . 60
COMPARISON OF CHARGE TO COST. . . . . . . . . . . . . . . . . . . . . . . . . . . . 61PAYER SOURCES. . . . . . . . . . . . . . . . . . . . . . . . . . . . . . . . . . . . . . . . . . . . . 62CHARGE EFFECTS BY STATE. . . . . . . . . . . . . . . . . . . . . . . . . . . . . . . . . . 64
RESULTS--BENEFITS OF HELMETS . . . . . . . . . . . . . . . . . . . . . . . . . . . . . . . . . . . . . . . 66Previous Studies. . . . . . . . . . . . . . . . . . . . . . . . . . . . . . . . . . . . . . . . . . . . . . . . . . . . . 66Odds Ratios . . . . . . . . . . . . . . . . . . . . . . . . . . . . . . . . . . . . . . . . . . . . . . . . . . . . . . . . 66
DIED . . . . . . . . . . . . . . . . . . . . . . . . . . . . . . . . . . . . . . . . . . . . . . . . . . . . . . . . 67DIED AND/OR INPATIENT . . . . . . . . . . . . . . . . . . . . . . . . . . . . . . . . . . . . . 67DIED, INPATIENT, OR TRANSPORTED. . . . . . . . . . . . . . . . . . . . . . . . . . . 67ANY INJURY . . . . . . . . . . . . . . . . . . . . . . . . . . . . . . . . . . . . . . . . . . . . . . . . . 67CONSOLIDATION . . . . . . . . . . . . . . . . . . . . . . . . . . . . . . . . . . . . . . . . . . . . . 67
Prevention of Brain Injury. . . . . . . . . . . . . . . . . . . . . . . . . . . . . . . . . . . 68Cost of Crash Injuries to Motorcycle Riders . . . . . . . . . . . . . . . . . . . . . . . . . . . . . . 69Discussion of Motorcycle Helmet Analysis. . . . . . . . . . . . . . . . . . . . . . . . . . . . . . . . 72
SUMMARY OF THE MANDATED MODEL . . . . . . . . . . . . . . . . . . . . . . . . . . . . . . . . . . 72
OTHER STATE SPECIFIC ANALYSES USING THE LINKED STATE DATA . . . . . . 73Data Quality . . . . . . . . . . . . . . . . . . . . . . . . . . . . . . . . . . . . . . . . . . . . . . . . . . . . . . . . 73
REPORTED SAFETY BELT USAGE. . . . . . . . . . . . . . . . . . . . . . . . . . . . . . . 73OVER-REPORTING OF BELT USAGE. . . . . . . . . . . . . . . . . . . . . . . . . . . . . 73ERRORS IN THE CHARGES. . . . . . . . . . . . . . . . . . . . . . . . . . . . . . . . . . . . . 75
Ancillary Linkages to Improve the Results . . . . . . . . . . . . . . . . . . . . . . . . . . . . . . . . 75
CODES Technical Report v January 1996
EMERGENCY DEPARTMENT DATA . . . . . . . . . . . . . . . . . . . . . . . . . . . . . 76Other Factors Affecting the Relationship between Crash and Injury Severity . . . 76
OUTLIERS . . . . . . . . . . . . . . . . . . . . . . . . . . . . . . . . . . . . . . . . . . . . . . . . . . . 76TYPES OF RESTRAINTS AND CRASHES. . . . . . . . . . . . . . . . . . . . . . . . . . 76ALCOHOL AND DRUG USE. . . . . . . . . . . . . . . . . . . . . . . . . . . . . . . . . . . . . 77COST OF CARE. . . . . . . . . . . . . . . . . . . . . . . . . . . . . . . . . . . . . . . . . . . . . . . 77RELATIONSHIP OF CRASH INJURY AND AGE. . . . . . . . . . . . . . . . . . . . . 78
Geographic Patterns of Crash Characteristics. . . . . . . . . . . . . . . . . . . . . . . . . . . . . 79GENDER, AGE, TIME OF DAY, DAY OF WEEK, MONTH. . . . . . . . . . . . 79TRAFFIC AREAS . . . . . . . . . . . . . . . . . . . . . . . . . . . . . . . . . . . . . . . . . . . . . . 79NEIGHBORHOODS. . . . . . . . . . . . . . . . . . . . . . . . . . . . . . . . . . . . . . . . . . . . 79TRAFFIC VOLUME, DAILY WORK PATTERNS, AFTERNOON AND
WEEKEND ACTIVITIES, HOLIDAYS, WEATHER . . . . . . . . . . . . . 80
ANALYTICAL ISSUES . . . . . . . . . . . . . . . . . . . . . . . . . . . . . . . . . . . . . . . . . . . . . . . . . . . . 80
SIGNIFICANCE OF CODES . . . . . . . . . . . . . . . . . . . . . . . . . . . . . . . . . . . . . . . . . . . . . . . . 80
REFERENCES . . . . . . . . . . . . . . . . . . . . . . . . . . . . . . . . . . . . . . . . . . . . . . . . . . . . . . . . . . . 82
CODES Technical Report 1 January 1996
INTRODUCTION
Over the years, NHTSA studies have shown that safety belts are 40-50 percent effective inpreventing mortality and 45-55 percent effective in preventing morbidity. As a result, fatal and1
non-fatal injuries have gradually decreased. However, injuries resulting from crashes continue tobe a major public health problem responsible for $83 billion in societal costs excluding propertydamage. Direct health care costs of $14 billion comprise a significant part of these societal costs. 2
To reduce these costs, the focus must shift from monitoring just the occurrence of injuries to amore systematic approach to injury control that includes prevention, acute care, and rehabilitation. Priorities need to address the reduction of the occurrence and severity of injuries and their healthcare costs.
Intermodal Surface Transportation Efficiency Act (ISTEA)
Congress indicated its concern about rising health care costs in the Intermodal SurfaceTransportation Efficiency Act (ISTEA) of 1991. Section 1031, part (b) of ISTEA called for astudy of the benefits of safety belts and motorcycle helmets:
1)IN GENERAL. -- The Secretary shall conduct a study or studies todetermine the benefits of safety belt use and motorcycle helmet usefor individuals involved in motor vehicle crashes and motorcyclecrashes, collecting and analyzing data from regional trauma systemsregarding differences in the following: the severity of injuries;acute, rehabilitative and long-term medical costs, including thesources of reimbursement and the extent to which these sourcescover actual costs; government, employer, and other costs; andmortality and morbidity outcomes. The study shall cover arepresentative period after January 1, 1990.
With these requirements, Congress expanded its focus beyond fatal injuries to include the severityof non-fatal injuries and their costs. Five million dollars were provided to the National HighwayTraffic Safety Administration for the study with the results to be reported to Congress byFebruary, 1996.
Format of the Report
The Report to Congress focused on the benefits of safety belts and helmets. Benefits interms of mortality, morbidity, severity, and cost were generated by each state and then combinedfor the Report. The state specific results are reported in this technical report which also providesa detailed description of the state data files, the linkage process, and the mandated research modelused to generate the information for the Report to Congress. In addition, the state specific
CODES Technical Report 2 January 1996
analyses performed by each state and the importance of linked data for injury control purposes arediscussed.
The Introduction includes a discussion of the options for the study design and summarizesthe requirements each applicant met for funding for the Report to Congress. The second sectiondiscusses the concepts of linkage. In the third section, details are provided about each granteeand the necessary collaboration between the owners and users of state data. The fourth and fifthsections describe the crash and injury data resources and how the data files were prepared forlinkage. The sixth and seventh sections discuss the linkage process and the mandated researchmodel. They are followed by two sections which present the results of the analyses of the benefitsof safety belts and helmets. Following a summary of the results of the mandated model, theremaining sections present the state specific applications of the linked data, discuss someanalytical issues, and highlight the significance of CODES. Included in the final section arerecommendations about state data and the importance of linking these data to generate outcomeinformation for highway safety.
Background
In designing the study to meet the congressional mandate, NHTSA considered thepopulation upon which the study would be based and the availability of information relevant tospecific analytical requirements called for in the legislation. Choice of a study population isimportant because the desired effect of most injury control countermeasures, including safety beltsand helmets, is to cause a reduction in the occurrence and severity of injuries, i.e., reducing thefatal or severe injury to moderate, minor or none at all. If the study population includes onlyinjured persons, the obvious successes (those who use the countermeasure and receive no injury)and those not affected (those who do not use the countermeasure and receive no injury) are notavailable to provide a basis for comparison. The same is true if the study population includes onlyfatalities or even the most seriously injured, such as those persons treated at trauma centers. Again, the lack of information about the uninjured makes it impossible to measure the downwardshift from injured to not injured and to evaluate both the failures and successes resulting from theuse of safety measures.
In an individual state, the comprehensive source of information about all persons involvedin motor vehicle traffic crashes (including those involving passenger cars, vans, light trucks andmotorcycles) is the statewide database created from crash reports filed by police agencies. Policeofficers, who investigate the crash at the scene, complete a report which includes informationabout the crash, vehicles, and persons involved. Selected data from these reports are entered intoan electronic database from which most states produce an annual report describing the crashesoccurring in that state. The availability of the database in electronic format makes the data readilyavailable for statistical analysis.
CODES Technical Report 3 January 1996
Crash data, however, do have some limitations. They do not contain medical informationon the outcome of the crash or information on the financial consequences to the injured victims. Thus, by themselves, they were not able to satisfy the ISTEA requirements.
A potential source of medical and financial outcome data was the injury data collected atthe time of treatment. These data, collected locally at the scene, en route, at the emergencydepartment, in the hospital, and after discharge, are the richest source of information on thenature, cause, and costs of injury resulting from motor vehicle crashes. If they could be linkedtogether and with the crash data, then each data set linked would provide outcome informationfor the previous set and so on making it possible to describe the injury event from the time ofonset, through the medical care system to final disposition. Thus, linkage would provide accessto the medical and financial outcome information required by ISTEA for the Report to Congress.
But linkage would provide even more. Linkage enhances the value of each state data filebeing linked by expanding the comprehensiveness of each data set while incidentally improvingdata quality over time. At the same time, the delay and expense of new data collection is avoided. Linkage promotes standardized data which, in turn, facilitate identifying state and nationalpriorities. Characteristics of the crash, vehicle, and occupant behavior for the motor vehicle crashare permanently linked to the specific medical and financial consequences for each personinvolved in the crash. Detailed medical information is generated about the patient’s symptoms,level of severity, treatment, and disposition. Instead of a one purpose data base, linked data canbe used by multiple users for different purposes at any time. For example, severity can be definedat the local level in functional, physiologic, or anatomic terms to monitor high crash rates,populations at risk, or unique crash characteristics; at the state level to monitor and improvemortality and morbidity rates, health care practices, and the cost of care; and, at the national levelto set priorities for federal legislation, regulation, resource allocations, and the implementation ofcountermeasures.
Thus NHTSA decided that the most efficient strategy for generating the population-basedpatient specific outcome data necessary to meet the ISTEA requirements would be to collaboratewith states to link the crash and injury state data.
CONCEPTS OF LINKAGE
Prior to the CODES project, linkage of traffic records files was initially performedmanually and then, as computer capabilities expanded, with an ad hoc linkage methodology. Themanual method involved the actual paper records. All information included in the record wasavailable to decide the validity of a record pair. This method was time consuming and laborintensive for small files, but neither efficient nor feasible for linking a large volume of records. The ad hoc computer method was more efficient for a large volume of records, but was restrictedto using only the information which was computerized. It also required that the linkage

CODES Technical Report 4 January 1996
information (age, sex, date, identification number, etc.) match exactly in both files. In order tocompensate for the inevitable errors and missing data, multiple passes were necessary to adjustthe linkage data. For example, age was adjusted plus or minus one year and the linkage repeatedwith the adjusted value. Additional passes also were needed so that groups of records most likelyto match could be submitted for linkage first and those least likely to match submitted last.
Probabilistic Linkage
Probabilistic linkage techniques became available for highway safety data linkage in theform of newly developed software (AUTOMATCH) that increased the volume and likelihood for3
accurate matches in a phenomenally short amount of time compared to the other linkagemethodologies. This type of computerized data linkage focused on the probability of a match andthus did not require exact matches to link the files, a crucial asset for the crash to injury linkage inwhich it is uncertain when a crash report actually has a corresponding injury record and when aninjury record has a corresponding crash record. Probabilistic linkage was effective because of thefollowing characteristics.
First, probabilistic linkage simplifies the linkage problem by first sorting the files intoblocks of 10-20 records and then limiting the linkage to the records within each block. All of therecords within the block match on the same set of blocking variables, usually indirect identifierswith complete and accurate data on each record. Records which are not included within theblocks do not participate in the linkage process. Thus different blocking variables are used foreach pass. Usually only two passes are required to ensure that records not included among theblocks in the first pass will be included within the blocks of the second pass. Other indirectidentifiers, usually those not chosen to block the file, are used to link the records. Both direct(unique person identifiers) and combinations of indirect (date of birth, gender, town code, time,etc.) identifiers are important for blocking and linking. Together, the content of the data must besufficiently powerful to discriminate among events and the people involved in a specific event.
Second, weights are assigned to each attribute value of the linkage variables according toits frequency of occurrence. Rare occurrences have a higher value than more frequentoccurrences. One weight is assigned based on the likelihood of matching among valid matchedpairs and is called the agreement weight. The other weight is assigned based on the likelihood ofmatching among unmatched pairs, called the disagreement weight, and is expressed as theprobability of chance agreement. When two attribute values match, the value is expressed as alogarithm to the base two of the ratio of the agreement (match) weight and the disagreement(chance agreement) weight. When two attribute values do not match, the value is calculated asthe logarithm to the base two of the ratio of one minus the agreement (match) weight and oneminus the disagreement (chance agreement) weight. Assignment of the agreement anddisagreement weights includes a lower penalty for mismatches caused by missing data.
CODES Technical Report 5 January 1996
Third, the linkage process assigns a value to the linkage of two attributes. Exact matchesreceive the full weight. When they do not match exactly, adjustments to the weights are madeaccording to pre-determined match parameters which allow weights to be prorated within anacceptable range or percentage, or to be adjusted when a character varies or when a match occurswithin an array of choices, etc. Thus, the process considers the value of all available information.
Fourth, the attribute weights are totaled and a composite weight is assigned to each recordpair. The composite weight will be positive for a match and negative for a non-match. The unsurematches include the low positive weights, duplicates, and record pairs which do not match oncritical attributes.
Fifth, unsure, unusual, and duplicate matches are manually reviewed and reclassified as amatch or non-match. False positives and false negatives are minimized by adjusting the cut-offweights, the range of weights defining the unsure matches. On average, each state was able tolimit the number of matched pairs requiring manual review to about 10 percent of the record pairsgenerated by the computer during each pass of the crash and injury linkage.
DESCRIPTION OF THE CODES STATES
NHTSA sought grant applicants with existing statewide crash and injury data systemscapable of generating medical and financial outcome information after linkage. Any state agency,non-profit organization, or educational institution was eligible to develop and coordinate acoalition of data owners and users to perform the linkage.
Because of the necessity to generate specific data to conduct the require analyses, NHTSAdecided not to fund any states which would need to create new databases. To promotecooperation between owners and users of the required databases, the grants would be made to asingle applicant in a state who would be responsible for obtaining cooperation of the owners andusers of the data. Selection of the states also was independent of their belt and helmet use ratesand current legislation.
In a May 5, 1992, Federal Register notice, NHTSA issued a grant solicitation noticerequesting applications from states. Applicants were required to demonstrate the existence of andthe capability to access computerized state crash, EMS, emergency department, hospital,outpatient, rehabilitative, long term care, and insurance claims data. They were also required towork cooperatively with NHTSA to implement the probabilistic linkage algorithm, and toguarantee transfer of their linked data base to NHTSA for use in preparing the Report toCongress. Agencies in 20 states responded to the solicitation.
Hawaii, Maine, Missouri, New York, Pennsylvania, Utah, and Wisconsin were awardedgrants effective October 1, 1992, to generate Crash Outcome Data Evaluation Systems (CODES)
CODES Technical Report 6 January 1996
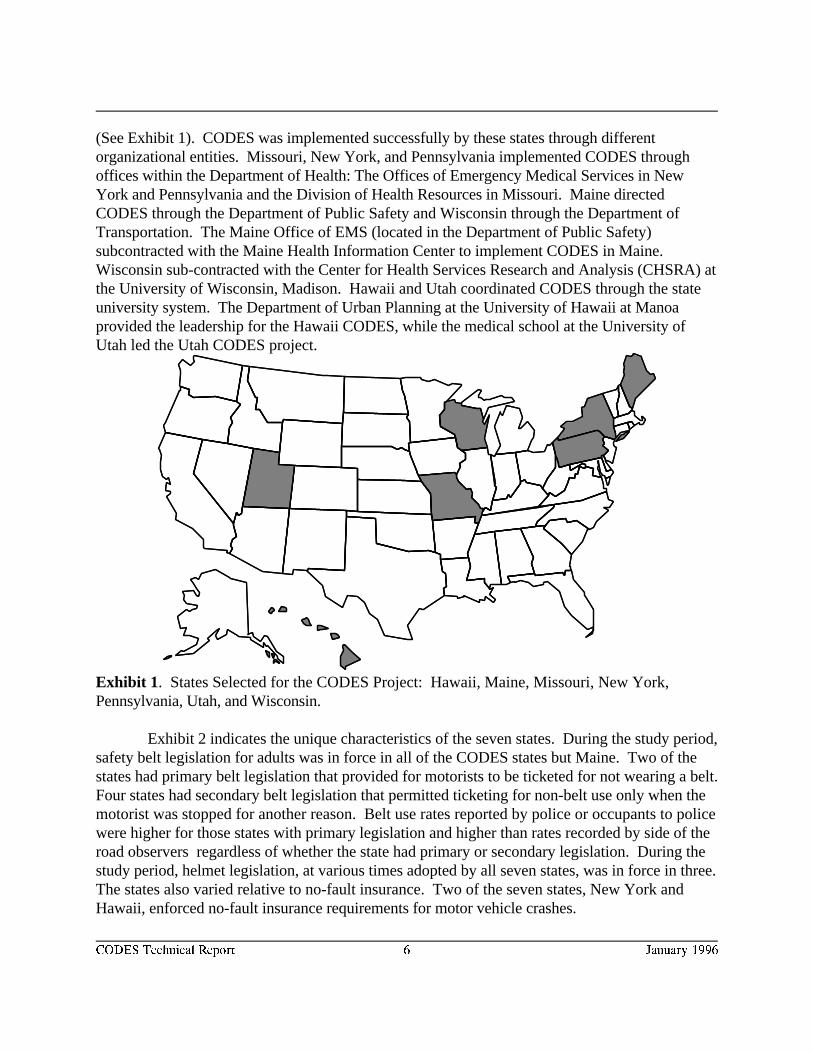
(See Exhibit 1). CODES was implemented successfully by these states through differentorganizational entities. Missouri, New York, and Pennsylvania implemented CODES throughoffices within the Department of Health: The Offices of Emergency Medical Services in NewYork and Pennsylvania and the Division of Health Resources in Missouri. Maine directedCODES through the Department of Public Safety and Wisconsin through the Department ofTransportation. The Maine Office of EMS (located in the Department of Public Safety)subcontracted with the Maine Health Information Center to implement CODES in Maine. Wisconsin sub-contracted with the Center for Health Services Research and Analysis (CHSRA) atthe University of Wisconsin, Madison. Hawaii and Utah coordinated CODES through the stateuniversity system. The Department of Urban Planning at the University of Hawaii at Manoaprovided the leadership for the Hawaii CODES, while the medical school at the University ofUtah led the Utah CODES project.
Exhibit 1 . States Selected for the CODES Project: Hawaii, Maine, Missouri, New York,Pennsylvania, Utah, and Wisconsin.
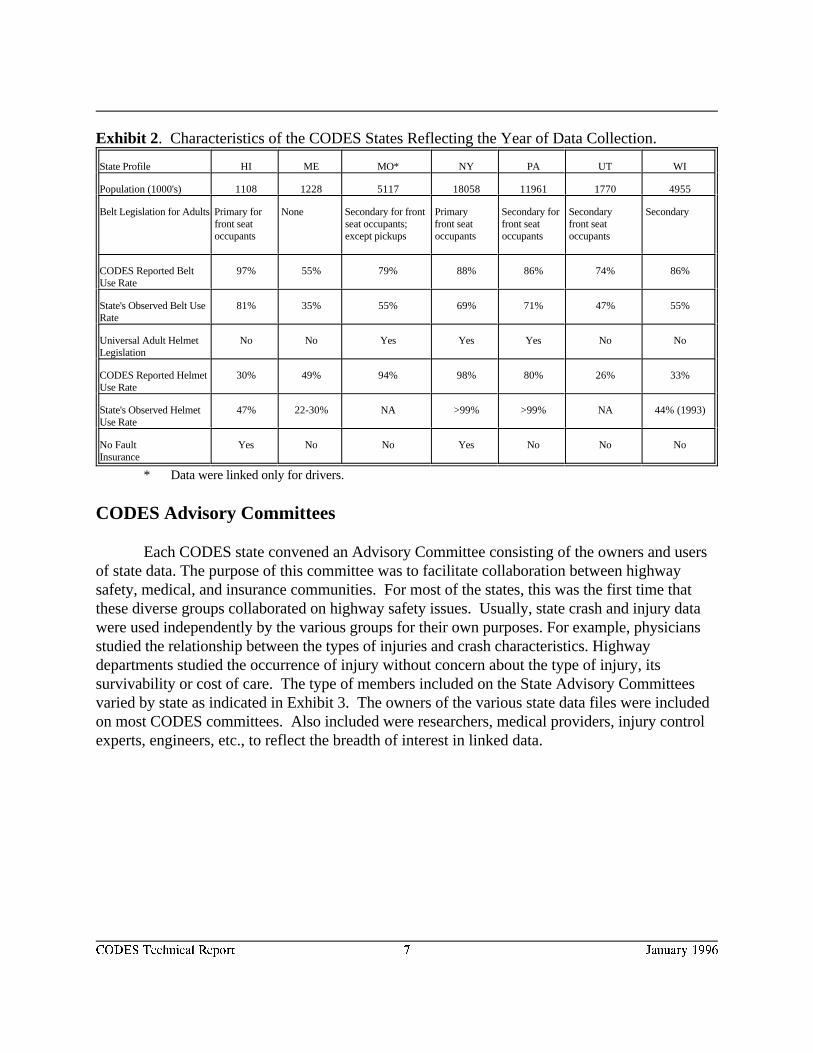
Exhibit 2 indicates the unique characteristics of the seven states. During the study period,safety belt legislation for adults was in force in all of the CODES states but Maine. Two of thestates had primary belt legislation that provided for motorists to be ticketed for not wearing a belt. Four states had secondary belt legislation that permitted ticketing for non-belt use only when themotorist was stopped for another reason. Belt use rates reported by police or occupants to policewere higher for those states with primary legislation and higher than rates recorded by side of theroad observers regardless of whether the state had primary or secondary legislation. During thestudy period, helmet legislation, at various times adopted by all seven states, was in force in three. The states also varied relative to no-fault insurance. Two of the seven states, New York andHawaii, enforced no-fault insurance requirements for motor vehicle crashes.
CODES Technical Report 7 January 1996
Exhibit 2 . Characteristics of the CODES States Reflecting the Year of Data Collection.
State Profile HI ME MO* NY PA UT WI
Population (1000's) 1108 1228 5117 18058 11961 1770 4955
Belt Legislation for Adults Primary for None Secondary for front Primary Secondary for Secondary Secondaryfront seat seat occupants; front seat front seat front seatoccupants except pickups occupants occupants occupants
CODES Reported Belt 97% 55% 79% 88% 86% 74% 86%Use Rate
State's Observed Belt Use 81% 35% 55% 69% 71% 47% 55%Rate
Universal Adult Helmet No No Yes Yes Yes No NoLegislation
CODES Reported Helmet 30% 49% 94% 98% 80% 26% 33%Use Rate
State's Observed Helmet 47% 22-30% NA >99% >99% NA 44% (1993)Use Rate
No Fault Yes No No Yes No No NoInsurance
* Data were linked only for drivers.
CODES Advisory Committees
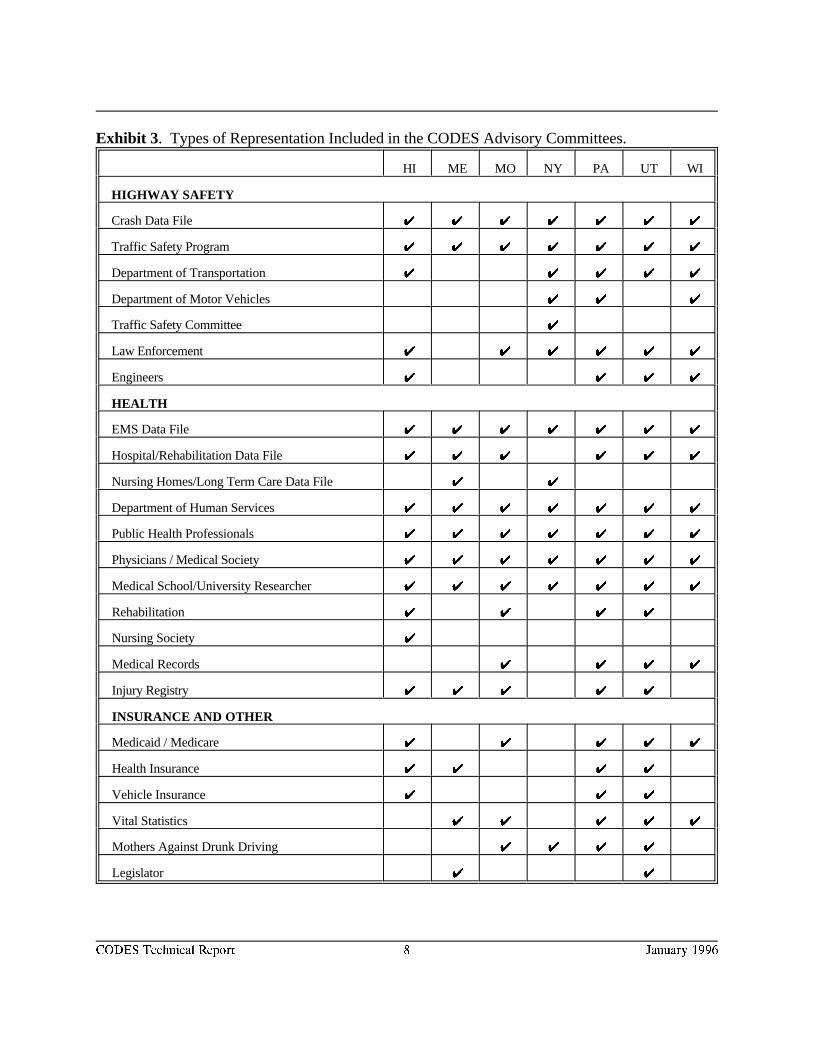
Each CODES state convened an Advisory Committee consisting of the owners and usersof state data. The purpose of this committee was to facilitate collaboration between highwaysafety, medical, and insurance communities. For most of the states, this was the first time thatthese diverse groups collaborated on highway safety issues. Usually, state crash and injury datawere used independently by the various groups for their own purposes. For example, physiciansstudied the relationship between the types of injuries and crash characteristics. Highwaydepartments studied the occurrence of injury without concern about the type of injury, itssurvivability or cost of care. The type of members included on the State Advisory Committeesvaried by state as indicated in Exhibit 3. The owners of the various state data files were includedon most CODES committees. Also included were researchers, medical providers, injury controlexperts, engineers, etc., to reflect the breadth of interest in linked data.
CODES Technical Report 8 January 1996
Exhibit 3 . Types of Representation Included in the CODES Advisory Committees.
HI ME MO NY PA UT WI
HIGHWAY SAFETY
Crash Data File UU UU UU UU UU UU UU
Traffic Safety Program UU UU UU UU UU UU UU
Department of Transportation UU UU UU UU UU
Department of Motor Vehicles UU UU UU
Traffic Safety Committee UU
Law Enforcement UU UU UU UU UU UU
Engineers UU UU UU UU
HEALTH
EMS Data File UU UU UU UU UU UU UU
Hospital/Rehabilitation Data File UU UU UU UU UU UU
Nursing Homes/Long Term Care Data File UU UU
Department of Human Services UU UU UU UU UU UU UU
Public Health Professionals UU UU UU UU UU UU UU
Physicians / Medical Society UU UU UU UU UU UU UU
Medical School/University Researcher UU UU UU UU UU UU UU
Rehabilitation UU UU UU UU
Nursing Society UU
Medical Records UU UU UU UU
Injury Registry UU UU UU UU UU
INSURANCE AND OTHER
Medicaid / Medicare UU UU UU UU UU
Health Insurance UU UU UU UU
Vehicle Insurance UU UU UU
Vital Statistics UU UU UU UU UU
Mothers Against Drunk Driving UU UU UU UU
Legislator UU UU
CODES Technical Report 9 January 1996
Together the members of the committee resolved problems related to data access, dataquality, data processing, patient confidentiality, and appropriate interpretation of the linked data.In the process they promoted standardization of definitions across data files, encouraged timelydata processing, and expanded data content to facilitate linkage. By monitoring the linkageresults and applications of the linked data to ensure appropriateness, they engaged in a multi-disciplinary approach to decision making. To date, all of the Advisory Committees havedeveloped data release policies to encourage use of the linked data. They also considered variousalternatives for promoting on-going linkage of state data to support injury control.
DESCRIPTION OF CRASH AND INJURY STATE DATA FOR LINKAGE
Outcome information is important to identify specific populations at risk, and the causes,nature, and severity of their injuries over time. CODES generated outcome information fromexisting crash and injury population-based state data. Most state data sets are designed to meetthe specific needs of the agency collecting the data. These needs may be non-medical and focuson the circumstances of the injury event as recorded by the police at the scene. Or the needs maybe medical and focus on a particular phase of patient care recorded by medically trained personnelsuch as emergency medical services personnel at the scene and en route, nurses and physicians atthe emergency department and in the hospital, medical personnel responsible for rehabilitation andlong term care, and by non-medical personnel responsible for billing and payment. No state datafile by itself is sufficiently comprehensive to support injury control efforts.
Characteristics of Statewide Data
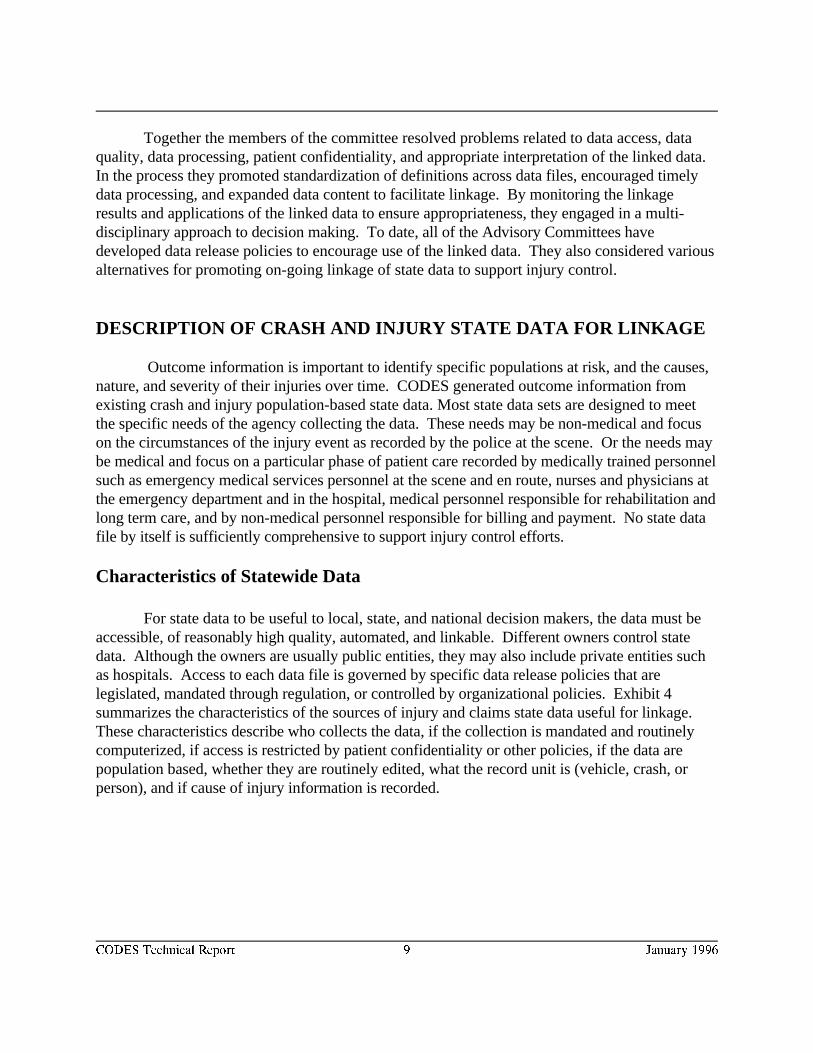
For state data to be useful to local, state, and national decision makers, the data must beaccessible, of reasonably high quality, automated, and linkable. Different owners control statedata. Although the owners are usually public entities, they may also include private entities suchas hospitals. Access to each data file is governed by specific data release policies that arelegislated, mandated through regulation, or controlled by organizational policies. Exhibit 4summarizes the characteristics of the sources of injury and claims state data useful for linkage. These characteristics describe who collects the data, if the collection is mandated and routinelycomputerized, if access is restricted by patient confidentiality or other policies, if the data arepopulation based, whether they are routinely edited, what the record unit is (vehicle, crash, orperson), and if cause of injury information is recorded.
CODES Technical Report 10 January 1996
Exh
ibit
4. C
hara
cter
istic
s of
the
Inju
ry, a
nd C
laim
s D
ata
Sou
rces
Use
d by
the
CO
DE
S S
tate
s.
Da
ta S
ou
rce
Dat
a C
olle
ctor
Sta
tew
ide
Pop
ulat
ion
Bas
edE
dite
dR
ecor
d U
nit
Indi
cate
sC
rash
CR
AS
H
Dep
artm
ent o
f Tra
nspo
rtat
ion/
Pub
lic S
afet
y / M
otor
Veh
icle
s
UU
UU
Cra
shUU
Veh
icle
Reg
istr
atio
nD
epar
tmen
t of M
otor
Veh
icle
s
UU
UU
Veh
icle
Driv
er L
icen
sing
Dep
artm
ent o
f Mot
or V
ehic
les
UU
UU
Driv
er
Cen
sus
Dep
artm
ent o
f Hea
lth
UU
UU
Per
son
Roa
dway
/Infr
astr
uctu
reD
epar
tmen
t of T
rans
port
atio
n
UU
UU
Roa
dM
arke
r
UU
ME
DIC
AL
DA
TA
SO
UR
CE
S
EM
SD
epts
of H
ealth
or
Pub
lic S
afet
yE
xcep
tW
isco
nsin
UU
Eve
nt
UU
Em
erge
ncy
outp
atie
ntH
ospi
tal/C
laim
sE
vent
Hos
pita
l dis
char
ge
Dep
t. of
Hea
lth
UU
UU
UU
Eve
ntN
Y O
nly
Reg
istr
ies:
Tra
uma,
Hea
d &
Spi
nal C
ord,
Poi
son
Hos
pita
l or
Dep
t. of
Hea
lth
UU
Per
son
UU
Dea
th C
ertif
icat
esD
ept o
f Vita
l Sta
tistic
s
UU
UU
UU
Per
son
UU
INS
UR
AN
CE
CLA
IMS
DA
TA
Med
icai
d, M
edic
are
Dep
t of H
ealth
UU
UU
Cla
im
Priv
ate
Hea
lth In
sura
nce
Hea
lth In
sura
nce
Co
C
laim
Wor
ker's
Com
pens
atio
nD
ept.
of L
abor
UU
UU
Cla
im
Priv
ate
Veh
icle
Insu
ranc
eV
ehic
le In
sura
nce
Co
C
laim
UU
Nat
iona
l Aut
o In
sura
nce
File
sA
ssoc
iatio
n of
Insu
ranc
eC
ompa
nies
C
laim
UU
CODES Technical Report 11 January 1996
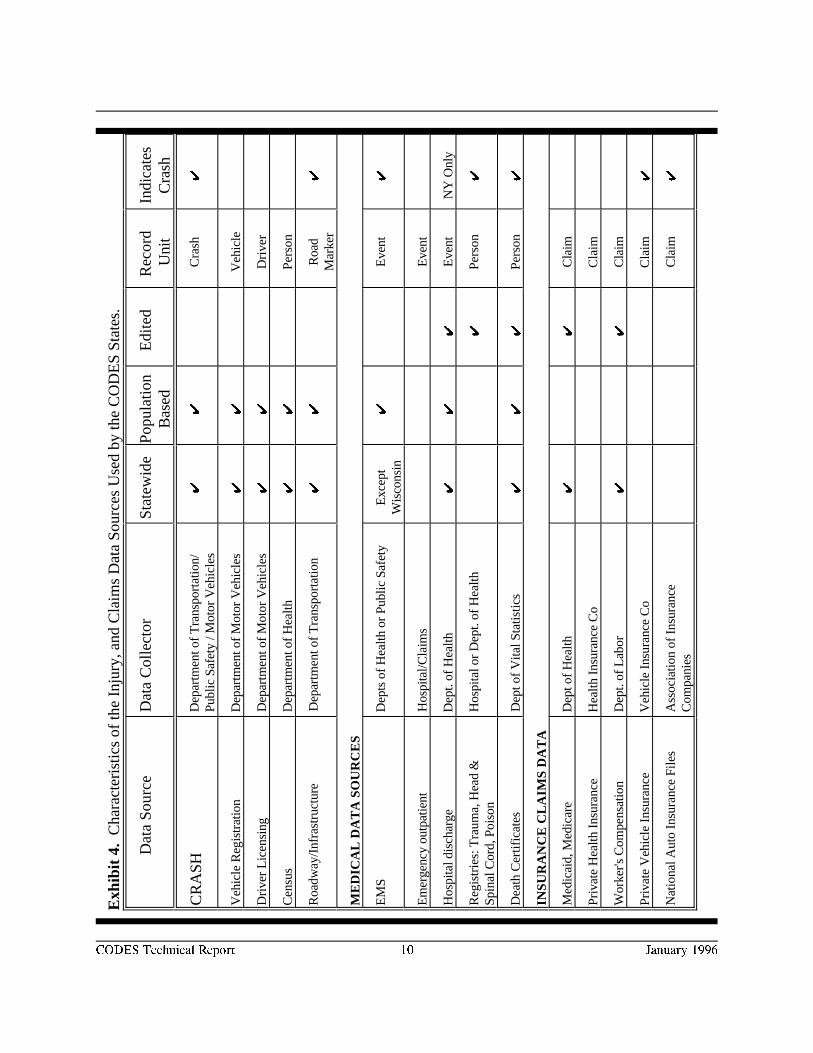
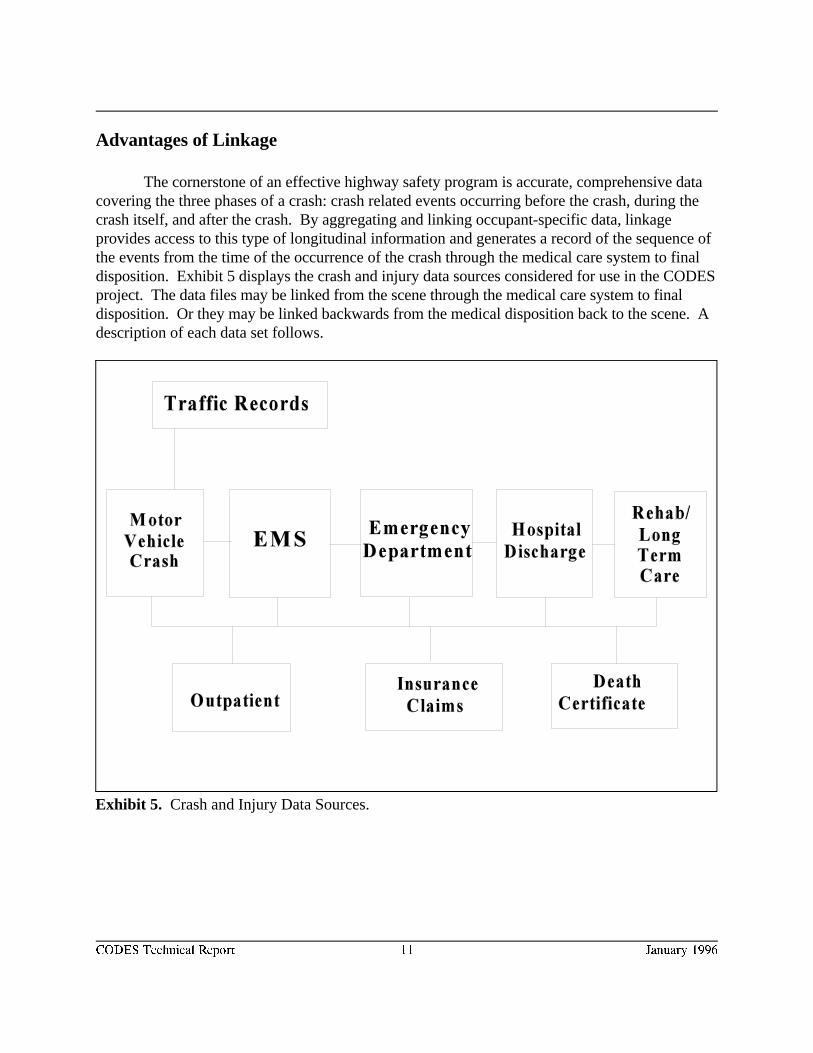
Exhibit 5. Crash and Injury Data Sources.
Advantages of Linkage
The cornerstone of an effective highway safety program is accurate, comprehensive datacovering the three phases of a crash: crash related events occurring before the crash, during thecrash itself, and after the crash. By aggregating and linking occupant-specific data, linkageprovides access to this type of longitudinal information and generates a record of the sequence ofthe events from the time of the occurrence of the crash through the medical care system to finaldisposition. Exhibit 5 displays the crash and injury data sources considered for use in the CODESproject. The data files may be linked from the scene through the medical care system to finaldisposition. Or they may be linked backwards from the medical disposition back to the scene. Adescription of each data set follows.

CODES Technical Report 12 January 1996
Non-Medical Data Resources
Non-medical state data may be crash specific or provide descriptive information about acomponent of the environment surrounding the event. Crash specific information is generated bythe crash report. Environmental data are generated from vehicle registration, driver licensing, andcensus data which provide non-crash specific reference information about the driver, vehicle, andgeographic location.
POLICE CRASH REPORT
The police crash report is a crash specific record that describes the characteristics of thecrash, vehicle, and occupant behavior at the time of the crash. This information includes the typeof crash, contributing factors, type of roadway, driver identifiers and actions, injured occupants,use of safety devices such as belts and helmets, etc. Police crash data are the major source ofinformation indicating the time of onset for the crash-related injury. Exhibit 6 indicates that fiveof the seven CODES states collected complete data for both injured and uninjured occupants whowere involved in the crash. Wisconsin reported safety belt and helmet use information for theuninjured passengers but not their identifiers such as age and sex. Missouri excluded theuninjured passengers altogether. Uninjured passengers are an important source of informationdescribing the success stories (such as those occupants who are not injured or who suffer lessserious injuries because they were wearing safety belts). Lack of information about all involvedoccupants, injured and uninjured, may result in an under-representation in the linked data ofmusculoskeletal injuries such as whiplash, for example, or occult abdominal injuries such aslacerated spleen.
Police document injury severity using a functional measure of severity consisting of fivelevels: killed (K), severe or incapacitating injury (A), non incapacitating injury (B), possible injury(C), and not injured (0). Because evaluation of severity is based on level of functioning, injurieswhich are minor in terms of survivability may be included among the severe injuries and viceversa. Often, just the transport of a crash victim for treatment is enough for the police officer tocode “incapacitating injury.” In contrast, some types of head injuries are not evident at the scenebut may become life threatening within hours of the crash. Police do not have the time or trainingto collect detailed medical information at the scene or to obtain other medical data generatedeither en route or at the hospital. The police severity score, KABC0, is useful for predictinglinkage to an injury record, but is associated with survivability only for those who are killed at thescene .
Designation of the severity levels varied among the CODES states. For example, aboutone-third of the occupants involved in crashes in New York were coded as suffering possibleinjuries compared to about 10 percent in the other CODES states. Linkage made it
CODES Technical Report 13 January 1996
possible to standardize the severity levels among the CODES states by redefining them accordingto the location of treatment (died, inpatient, transported and/or ED, slightly injured).
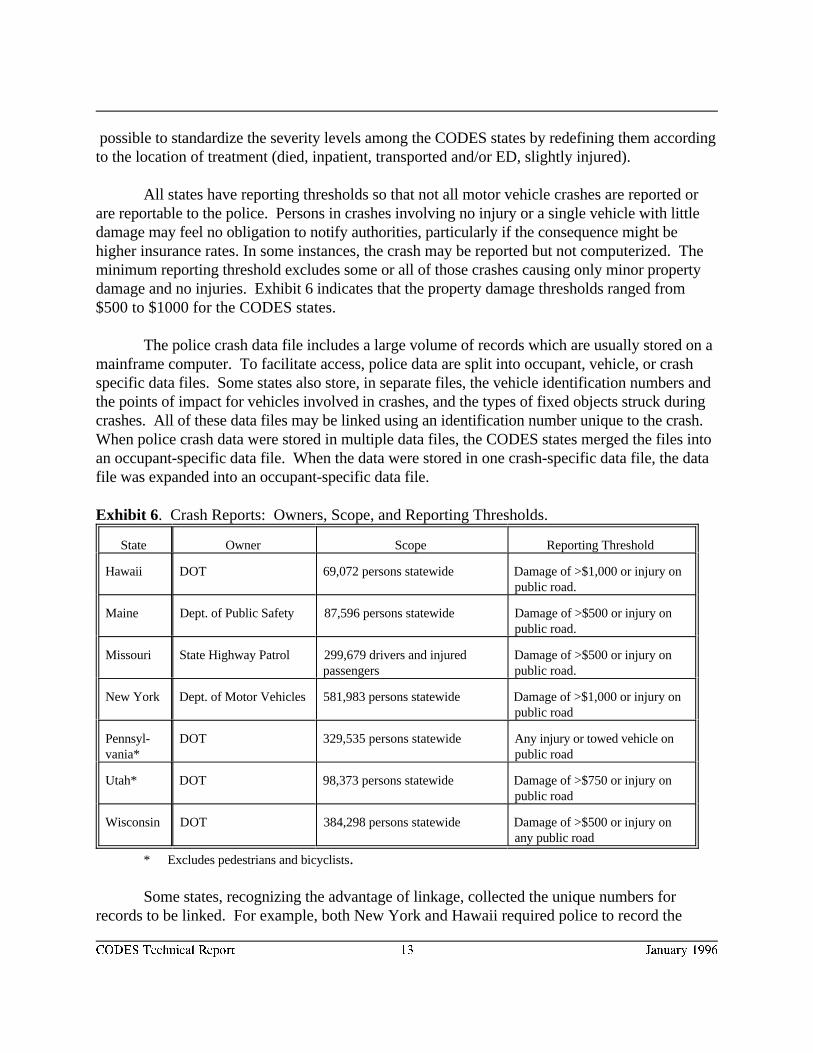
All states have reporting thresholds so that not all motor vehicle crashes are reported orare reportable to the police. Persons in crashes involving no injury or a single vehicle with littledamage may feel no obligation to notify authorities, particularly if the consequence might behigher insurance rates. In some instances, the crash may be reported but not computerized. Theminimum reporting threshold excludes some or all of those crashes causing only minor propertydamage and no injuries. Exhibit 6 indicates that the property damage thresholds ranged from$500 to $1000 for the CODES states.
The police crash data file includes a large volume of records which are usually stored on amainframe computer. To facilitate access, police data are split into occupant, vehicle, or crashspecific data files. Some states also store, in separate files, the vehicle identification numbers andthe points of impact for vehicles involved in crashes, and the types of fixed objects struck duringcrashes. All of these data files may be linked using an identification number unique to the crash. When police crash data were stored in multiple data files, the CODES states merged the files intoan occupant-specific data file. When the data were stored in one crash-specific data file, the datafile was expanded into an occupant-specific data file.
Exhibit 6 . Crash Reports: Owners, Scope, and Reporting Thresholds.
State Owner Scope Reporting Threshold
Hawaii DOT 69,072 persons statewide Damage of >$1,000 or injury onpublic road.
Maine Dept. of Public Safety 87,596 persons statewide Damage of >$500 or injury onpublic road.
Missouri State Highway Patrol 299,679 drivers and injured Damage of >$500 or injury onpassengers public road.
New York Dept. of Motor Vehicles 581,983 persons statewide Damage of >$1,000 or injury onpublic road
Pennsyl- DOT 329,535 persons statewide Any injury or towed vehicle onvania* public road
Utah* DOT 98,373 persons statewide Damage of >$750 or injury onpublic road
Wisconsin DOT 384,298 persons statewide Damage of >$500 or injury onany public road
* Excludes pedestrians and bicyclists.
Some states, recognizing the advantage of linkage, collected the unique numbers forrecords to be linked. For example, both New York and Hawaii required police to record the
CODES Technical Report 14 January 1996
EMS run report number on the crash report. However, budget considerations led to the decisionnot to computerize this information so it was not available for linkage.
VEHICLE REGISTRATION DATA
Vehicle registration data describe detailed characteristics of the vehicle being registered. This information includes vehicle identifiers including identification number (VIN). The VIN canbe decoded to obtain information about the type of restraint system, vehicle weight and othervehicle characteristics useful for evaluating the consequences of particular types of crashes. Whenthe VIN is also collected on the crash report, the crash and vehicle registration files can be linkeddirectly. Linked crash, vehicle registration, and injury data generate information that relatespecific types and characteristics of the vehicle to urban and rural crash patterns and their specificmedical and financial consequences.
DRIVER LICENSING DATA
Driver licensing data are driver-specific and include the driver license number, birth date,social security number (SSN) and sometimes the driver’s history of citations. When driverinformation from the crash data are combined with medical cost and citation information, thisinformation is useful to assess the societal costs caused by repeat offenders. Linkage of the crashand driver licensing data files provides access to the SSN to facilitate linkage to insurance claimsdata, such as Medicaid.
CENSUS
Census data are not crash specific but provide information about the geographic locationwhere the crash occurred. These data generate population estimates for geographic areas, usuallytowns and counties. These data can be linked to square mile estimates and then used tostandardize crash locations in terms of population density (population per square mile) to indicateareas such as metro, urban, suburban, rural or wilderness. This information is useful for intra orinter-state comparisons.
ROADWAY/INFRASTRUCTURE
Roadway/infrastructure data are not crash specific. Instead they describe bridges,pavements, roadside inventories, etc. that describe the type of road where the crash occurred. These data, when linked to the crash and medical cost data, are useful to determine the cost-effectiveness of options for maintaining and upgrading streets and highways.Medical Data Resources
Medical data are collected by medically trained providers treating the patient at the scene,en route, at the emergency department, in the hospital, and after discharge for rehabilitative and
CODES Technical Report 15 January 1996
long term care and by non-medical personnel responsible for billing and insurance claims. Themedical outcome files useful for highway safety are described below.
EMERGENCY MEDICAL SERVICES
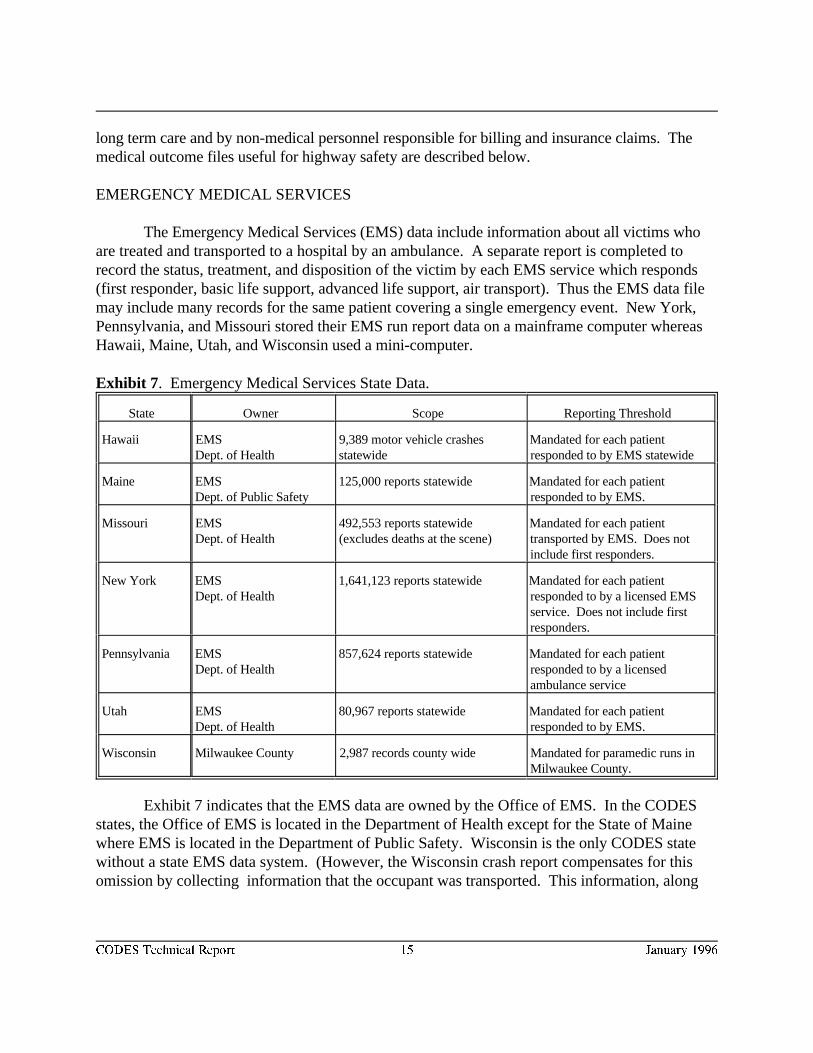
The Emergency Medical Services (EMS) data include information about all victims whoare treated and transported to a hospital by an ambulance. A separate report is completed torecord the status, treatment, and disposition of the victim by each EMS service which responds(first responder, basic life support, advanced life support, air transport). Thus the EMS data filemay include many records for the same patient covering a single emergency event. New York,Pennsylvania, and Missouri stored their EMS run report data on a mainframe computer whereasHawaii, Maine, Utah, and Wisconsin used a mini-computer.
Exhibit 7 . Emergency Medical Services State Data.
State Owner Scope Reporting Threshold
Hawaii EMS 9,389 motor vehicle crashes Mandated for each patientDept. of Health statewide responded to by EMS statewide
Maine EMS 125,000 reports statewide Mandated for each patientDept. of Public Safety responded to by EMS.
Missouri EMS 492,553 reports statewide Mandated for each patientDept. of Health (excludes deaths at the scene) transported by EMS. Does not
include first responders.
New York EMS 1,641,123 reports statewide Mandated for each patientDept. of Health responded to by a licensed EMS
service. Does not include firstresponders.
Pennsylvania EMS 857,624 reports statewide Mandated for each patientDept. of Health responded to by a licensed
ambulance service
Utah EMS 80,967 reports statewide Mandated for each patientDept. of Health responded to by EMS.
Wisconsin Milwaukee County 2,987 records county wide Mandated for paramedic runs inMilwaukee County.
Exhibit 7 indicates that the EMS data are owned by the Office of EMS. In the CODESstates, the Office of EMS is located in the Department of Health except for the State of Mainewhere EMS is located in the Department of Public Safety. Wisconsin is the only CODES statewithout a state EMS data system. (However, the Wisconsin crash report compensates for thisomission by collecting information that the occupant was transported. This information, along
CODES Technical Report 16 January 1996
with date of birth and zip code of residence for all injured passengers, enables the Wisconsin crashdata to be linked to the hospital discharge and claims data in the absence of EMS data.)
EMS reports are the first medical records completed for people injured in motor vehiclecrashes requiring transport to the emergency department. Severity is described in physiologicalterms based on the patient’s vital signs which are associated with survivability.
The availability of cause-of-injury information on the EMS record varied in the CODESstates. Missouri recorded “trafficway” to indicate the EMS pick-up location. The other statesused a box to indicate motor vehicle crash. Although this information is useful for patient careand facilitates linkage between the crash and EMS data, the quality was often perceived asunreliable for case selection for linkage. EMS data are the only source of routinely collectedinformation which directly link the events at the scene with the hospital. None of the EMSrecords include information about crash victims not transported by EMS. Use of occupantprotection devices and alcohol/substances recorded in the EMS data were used to corroboratesimilar information on the crash report.
EMERGENCY DEPARTMENT
At the emergency department, a report is completed for each patient treated. Informationis first recorded in the emergency department log and then subsequently in notes completed by thetriage nurse, the attending physician and nurse, in addition to the medical and mental healthspecialists who provide treatment. Billing data, including patient identifiers, are collected andusually computerized more frequently than the patient care data. The emergency department isthe source of information about crash victims who are not transported by EMS but who obtainoutpatient medical treatment at a hospital. It also provides information about the additionaltreatment and disposition for those crash victims who were transported by EMS. Like the EMSreport, severity is recorded in physiological terms based on the patient’s vital signs.
In spite of the importance of emergency department information for highway safety andinjury control in general, only Missouri has mandated its collection and computerizationstatewide. Utah and Hawaii obtained statewide emergency department information from hospitalcase mix data and health claims data respectively. New York obtained population basedemergency department data for New York City only from the New York City Health andHospitals Corporation. This Corporation maintains an ambulatory care database including billingand summary discharge data for all patients treated at emergency departments in municipalhospitals and by EMS services within New York City. Maine and Wisconsin obtained limited EDdata from their claims data. Pennsylvania merged uniform emergency department billing datafrom a stratified sample of hospitals to determine the feasibility of creating a statewide data file forlinkage purposes.
INPATIENT HOSPITAL AND REHABILITATIVE RECORDS
CODES Technical Report 17 January 1996
Once admitted as an inpatient for acute care, a medical record is completed during thelength of stay and abstracted into a discharge record for every patient. Patients who receiverehabilitation services in the same acute care hospital are also included in the inpatient data systemas a separate admit and discharge. When rehabilitation speciality hospitals are required to submitdischarge data to the state, these records become part of the hospital discharge data file. Hospitaldata have been standardized for reporting to the Health Care Financing Administration forpayment under Medicare/Medicaid. The data include patient, hospital and provider identifiers,procedures and diagnoses, disposition, charges, etc. Hospital data provide a source of routinelycollected financial information describing total charges and, in some states, hospital-basedphysician charges. Charges for other professional services are not included but are estimated torepresent an amount equal to 25 percent of inpatient charges . The charges reported reflect the4
price charged and do not represent the actual cost of providing care to that specific patient or therevenue received by the hospital.
All states had routinely computerized statewide inpatient data files except Hawaii andUtah. Hawaii’s hospital discharge data were generated from an Injury-in-Hawaii projectsponsored by the Department of Health and funded by the Centers for Disease Control. For thisproject all hospital discharge data were collected for all patients discharged from acute carehospitals in Hawaii statewide for a three year period. This file was unique because it also includedindicators of the patient’s level of functioning at the time of discharge. The Utah CODES teammerged hospital-specific case-mix data statewide using a data set which excluded sensitiveinformation. After performing the linkage, they returned the linked data to the data owner toreplace the sensitive information only for those records which linked.
Because inpatient data are collected by licensed/certified trained medical recordstechnicians and serve as the basis for payment, data quality is usually higher than other injury data.Quality may vary for specific data elements, such as the E-codes or EMS run report numbers, notroutinely used for billing purposes. For example, New York is the only CODES state whichrecords the EMS run report number on the hospital discharge abstract. However, because thesedata are not related to hospital use and thus are not monitored, only 17 percent of the records hada valid EMS number.
The discharge diagnosis codes recorded in the inpatient data can be used to generate aninjury severity score (ISS) to standardize severity according to the types of injuries. The ISS is5
an anatomic measure based on body region injured as defined by a narrative description of theinjury or by the International Classification of Diseases, 9th Revision, Clinical Modification (ICD-9-CM) hospital discharge diagnosis codes.
Hospital records do not computerize information about the use of occupant protectiondevices, and alcohol related information may be restricted from public access.
CODES Technical Report 18 January 1996
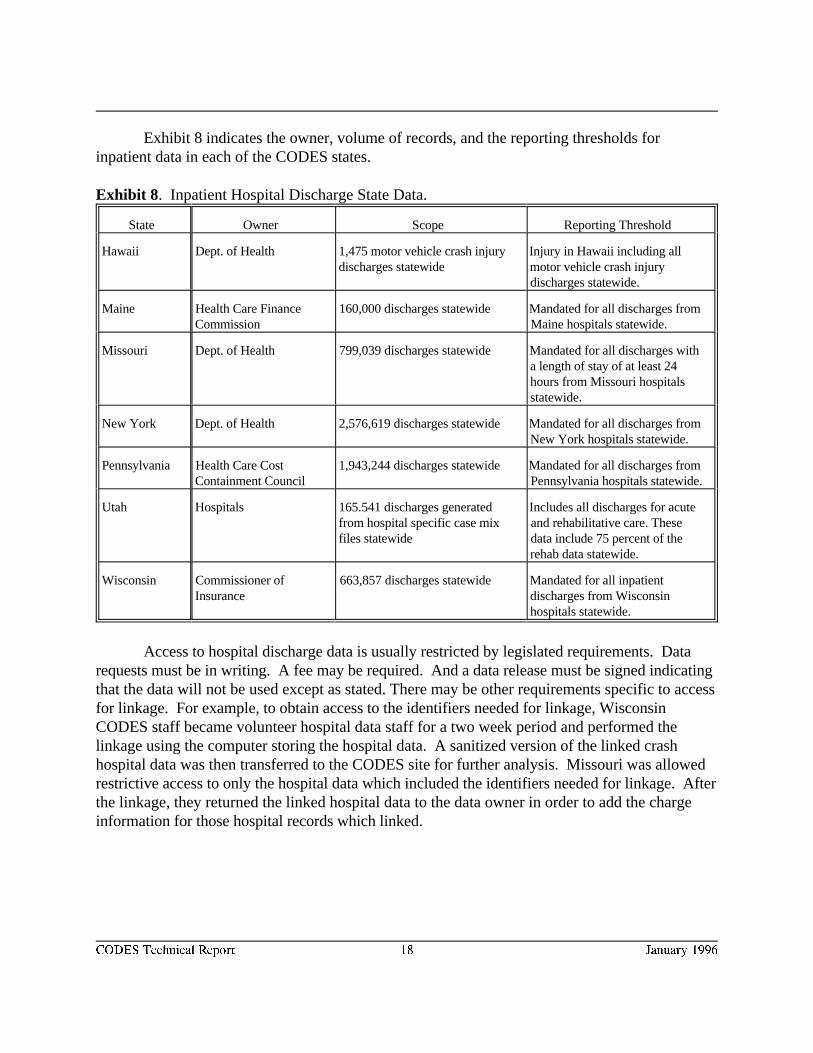
Exhibit 8 indicates the owner, volume of records, and the reporting thresholds forinpatient data in each of the CODES states.
Exhibit 8 . Inpatient Hospital Discharge State Data.
State Owner Scope Reporting Threshold
Hawaii Dept. of Health 1,475 motor vehicle crash injury Injury in Hawaii including alldischarges statewide motor vehicle crash injury
discharges statewide.
Maine Health Care Finance 160,000 discharges statewide Mandated for all discharges fromCommission Maine hospitals statewide.
Missouri Dept. of Health 799,039 discharges statewide Mandated for all discharges witha length of stay of at least 24hours from Missouri hospitalsstatewide.
New York Dept. of Health 2,576,619 discharges statewide Mandated for all discharges fromNew York hospitals statewide.
Pennsylvania Health Care Cost 1,943,244 discharges statewide Mandated for all discharges fromContainment Council Pennsylvania hospitals statewide.
Utah Hospitals 165.541 discharges generated Includes all discharges for acutefrom hospital specific case mix and rehabilitative care. Thesefiles statewide data include 75 percent of the
rehab data statewide.
Wisconsin Commissioner of 663,857 discharges statewide Mandated for all inpatientInsurance discharges from Wisconsin
hospitals statewide.
Access to hospital discharge data is usually restricted by legislated requirements. Datarequests must be in writing. A fee may be required. And a data release must be signed indicatingthat the data will not be used except as stated. There may be other requirements specific to accessfor linkage. For example, to obtain access to the identifiers needed for linkage, WisconsinCODES staff became volunteer hospital data staff for a two week period and performed thelinkage using the computer storing the hospital data. A sanitized version of the linked crashhospital data was then transferred to the CODES site for further analysis. Missouri was allowedrestrictive access to only the hospital data which included the identifiers needed for linkage. Afterthe linkage, they returned the linked hospital data to the data owner in order to add the chargeinformation for those hospital records which linked.
CODES Technical Report 19 January 1996
LONG-TERM HEALTH CARE (NURSING HOMES) INFORMATION
More-seriously-injured crash victims may require long-term medical care in a nursinghome. Long term care medical data are collected to meet the needs of the facility and forpayment by Medicaid and Medicare. These data document the functional status of the patientreceiving long-term care. They are rarely computerized statewide and must be accessed directlyfrom the long-term care facility. Both Maine and New York had access to computerizedstatewide long-term care data because of participation in a pilot study. However, only Maine wassuccessful linking to the actual data file. Severity information is generated from data describingthe patient’s level of impairment and vital signs. Computerization of this information varies byfacility.
DEATH CERTIFICATE
The death certificate data describe the medical causes, time, location, and mechanisms ofinjury for all injury deaths, including those caused by motor vehicle crashes. They do not includestandardized diagnosis codes describing the medical condition such as are recorded on theinpatient hospital data file; but they do use standardized codes to document the causes of death. The death certificate also records the time and location for the onset of an injury which can beused to corroborate information on the crash report. Unfortunately this latter informationsometimes is not computerized. These files record all deaths, regardless of the residence of thevictim, occurring within the state and all deaths of residents who die out of state. Deathcertificate data are computerized statewide according to standards that are uniform nationally.
OTHER INJURY DATA SYSTEMS
Medical status, treatment, and disposition information for injured victims of crashes maybe obtained from other injury data generated by hospitals, health maintenance organizations, andgovernment agencies. These data systems include trauma registries, primary care data systems,Fatal Accident Reporting System (FARS), etc. Trauma registry data are usually generated bydesignated trauma centers and, thus, are considered a subset of the EMS and hospital data forthose patients with the most serious injuries. Some states, particularly those without statewidehospital discharge data systems, may include all patients statewide with injuries requiringhospitalization in their trauma registries. Centralized primary care data systems include datacollected when outpatient care is provided, such as by health maintenance organizations. FARSdata are generated by NHTSA from police and EMS data and include all victims of crashes whodie within 30 days of the crash or who suffer non-fatal injuries in fatal crashes.
INSURANCE CLAIMS
Limited medical and health care financial information are generated as part of the claimsprocess for health and vehicle insurance. Medical treatment and payment data describing injured

CODES Technical Report 20 January 1996
crash victims over 65 years of age or disabled may be obtained from Medicare, for victims whoare financially needy from Medicaid, for victims of occupational injuries from Worker’sCompensation, and for victims whose care is paid by specific insurance groups such as BlueCross/Blue Shield, Allstate, Aetna, State Farm, etc. The advantage of claims data is that they mayinclude both outpatient (emergency department) and inpatient medical and financial information,and they are carefully edited to facilitate payment. The disadvantage is that the data reflectinformation necessary to process an insurance claim and usually do not provide the detailedmedical information, including injury severity, required to evaluate patient outcome. In addition,claims data files are usually very large since they include multiple claims records per event andmultiple events per person. Records must be identified that relate to the specific event beingstudied.
Use of insurance claims data for linkage to crash data is complicated by the fact that morethan one insurance company may be involved and not all pay at the same rate. In most cases, theno-fault insurance carrier or the automobile insurance company is liable for the health carecharges. However, some victims file the claim with their health insurer to avoid having to payhigher automobile insurance rates. When the victim is also eligible for Medicare, the claim toMedicare will be filed last since Medicare pays at a lower rate. On the other hand for Medicaideligible recipients, the claim may be filed first since Medicaid is often willing to recoup expensesfrom the payer who is liable for the costs. It is not surprising that the lag between billing andprocessing causes a delay in the availability of data for linkage and that the various co-paymentarrangements complicate the process of documenting the actual payers for analytical purposes. However, linked claims data are useful to audit and cross-check cases across different databases,and thus are significant to insurance companies and health providers interested in controllingcosts.
National insurance data facilitate linkage. The American Insurance Services Group(AISG) describes its national Insurance Index System as a leading national clearing house forbodily injury claims. It is administered by the AISG and is considered the leading industry-sponsored provider of loss data. This extensive system of claims records was initiated in the1920’s by the Association of Casualty Insurance Companies as a research tool to defendsupporting insurance carriers against fraudulent bodily injury claims. The system is currentlysupported by 1,450 property/casualty insurance companies, 1,500 self-insurers, and 120 claimsadministrators that represent over 93 percent of the industry in premium volume. The IndexSystem serves all of North America and the American possessions. These national data can besplit into statewide files to support the linkage of state data.
CODES Technical Report 21 January 1996
FILE PREPARATION
The purpose of data linkage is to identify records for the same person that are located indifferent data files, most of which were not designed to be linked together. Unique personalidentifiers frequently are not uniformly computerized or available for linkage. Instead, individualsmust be identified using a combination of indirect identifiers.
All files must be prepared prior to linkage regardless of the linkage method. This step maytake months, particularly if the state data are not routinely edited or monitored to support localdecision making.
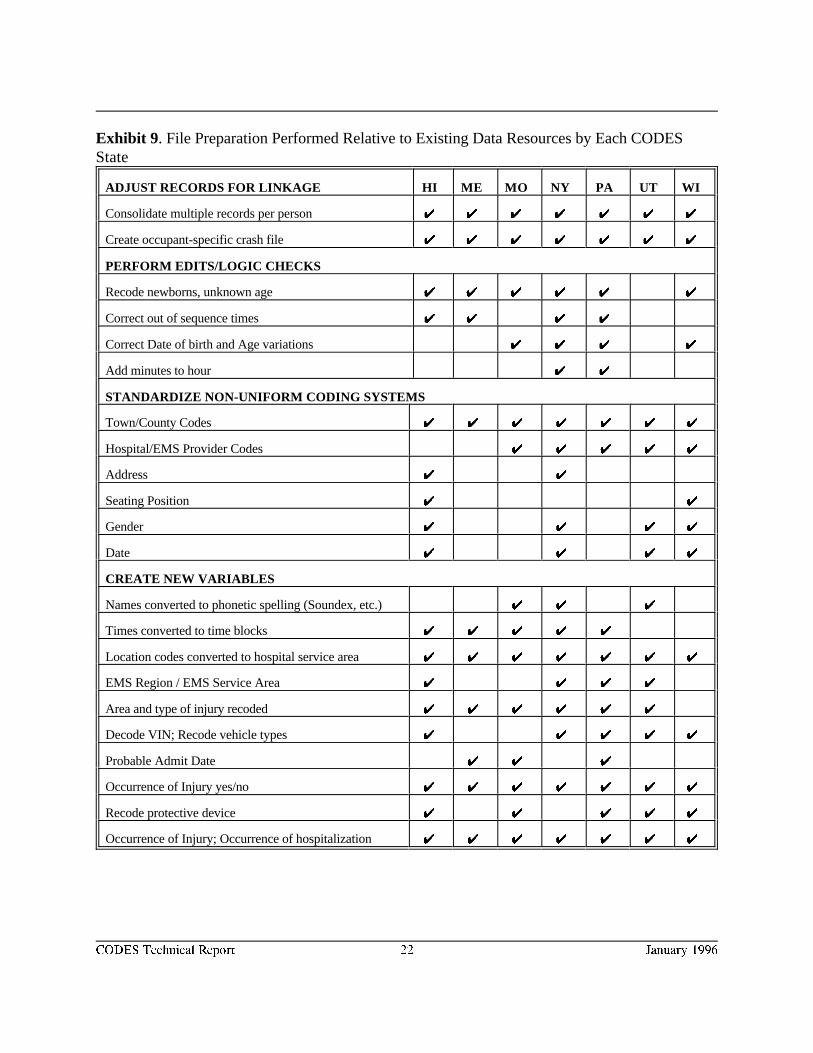
The data resources varied among of the CODES states. Exhibit 9 summarizes the filepreparation performed by each CODES state. File preparation usually began with the creation ofan occupant-specific file for linkage. Then the data files were edited. Except for Wisconsin,which benefitted from state data which were extensively edited routinely, all of the states spenttime, sometimes months, preparing their data. In most states, the hospital data required the leastamount of editing. Preparation included converting the coding conventions for town/countycodes, facility/provider, address, gender, and date in one file to match the codes in the other file. New variables were created to expand the use of existing information.
CODES Technical Report 22 January 1996
Exhibit 9 . File Preparation Performed Relative to Existing Data Resources by Each CODESState
ADJUST RECORDS FOR LINKAGE HI ME MO NY PA UT WI
Consolidate multiple records per person UU UU UU UU UU UU UU
Create occupant-specific crash file UU UU UU UU UU UU UU
PERFORM EDITS/LOGIC CHECKS
Recode newborns, unknown age UU UU UU UU UU UU
Correct out of sequence times UU UU UU UU
Correct Date of birth and Age variations UU UU UU UU
Add minutes to hour UU UU
STANDARDIZE NON-UNIFORM CODING SYSTEMS
Town/County Codes UU UU UU UU UU UU UU
Hospital/EMS Provider Codes UU UU UU UU UU
Address UU UU
Seating Position UU UU
Gender UU UU UU UU
Date UU UU UU UU
CREATE NEW VARIABLES
Names converted to phonetic spelling (Soundex, etc.) UU UU UU
Times converted to time blocks UU UU UU UU UU
Location codes converted to hospital service area UU UU UU UU UU UU UU
EMS Region / EMS Service Area UU UU UU UU
Area and type of injury recoded UU UU UU UU UU UU
Decode VIN; Recode vehicle types UU UU UU UU UU
Probable Admit Date UU UU UU
Occurrence of Injury yes/no UU UU UU UU UU UU UU
Recode protective device UU UU UU UU UU
Occurrence of Injury; Occurrence of hospitalization UU UU UU UU UU UU UU
CODES Technical Report 23 January 1996
Linkage Variables With The Power To Discriminate
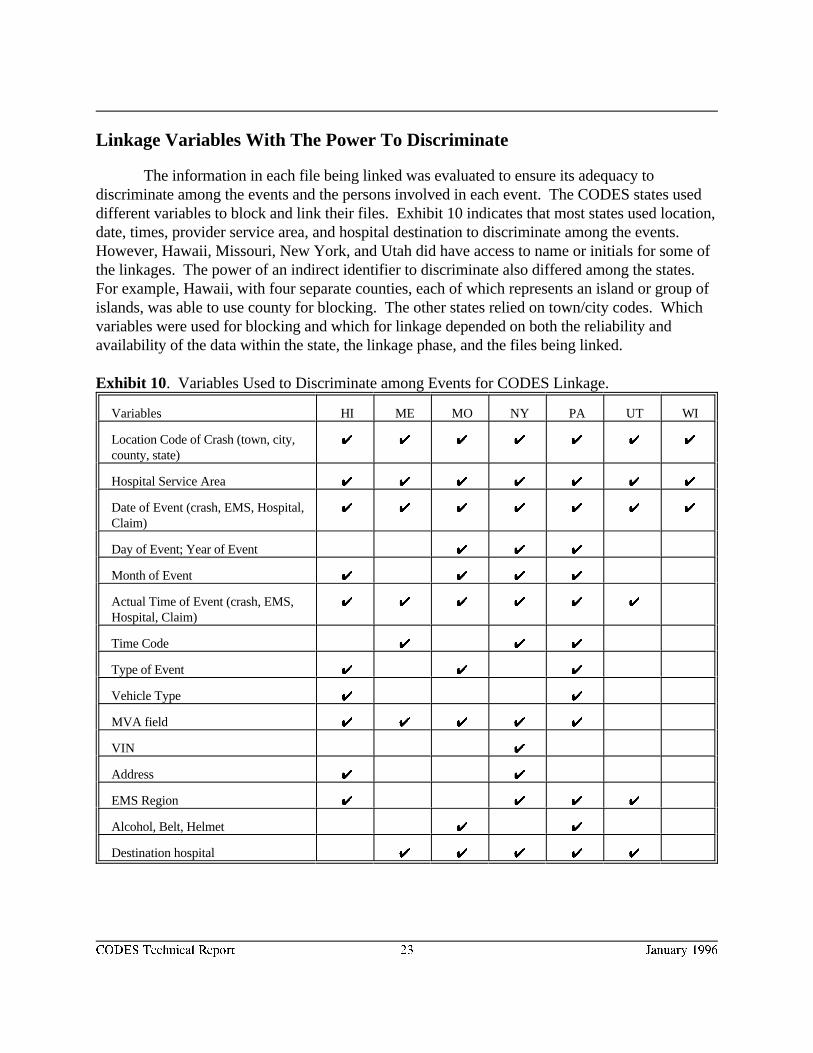
The information in each file being linked was evaluated to ensure its adequacy todiscriminate among the events and the persons involved in each event. The CODES states useddifferent variables to block and link their files. Exhibit 10 indicates that most states used location,date, times, provider service area, and hospital destination to discriminate among the events. However, Hawaii, Missouri, New York, and Utah did have access to name or initials for some ofthe linkages. The power of an indirect identifier to discriminate also differed among the states. For example, Hawaii, with four separate counties, each of which represents an island or group ofislands, was able to use county for blocking. The other states relied on town/city codes. Whichvariables were used for blocking and which for linkage depended on both the reliability andavailability of the data within the state, the linkage phase, and the files being linked.
Exhibit 10. Variables Used to Discriminate among Events for CODES Linkage.
Variables HI ME MO NY PA UT WI
Location Code of Crash (town, city,county, state)
UU UU UU UU UU UU UU
Hospital Service Area UU UU UU UU UU UU UU
Date of Event (crash, EMS, Hospital,Claim)
UU UU UU UU UU UU UU
Day of Event; Year of Event UU UU UU
Month of Event UU UU UU UU
Actual Time of Event (crash, EMS,Hospital, Claim)
UU UU UU UU UU UU
Time Code UU UU UU
Type of Event UU UU UU
Vehicle Type UU UU
MVA field UU UU UU UU UU
VIN UU
Address UU UU
EMS Region UU UU UU UU
Alcohol, Belt, Helmet UU UU
Destination hospital UU UU UU UU UU
CODES Technical Report 24 January 1996
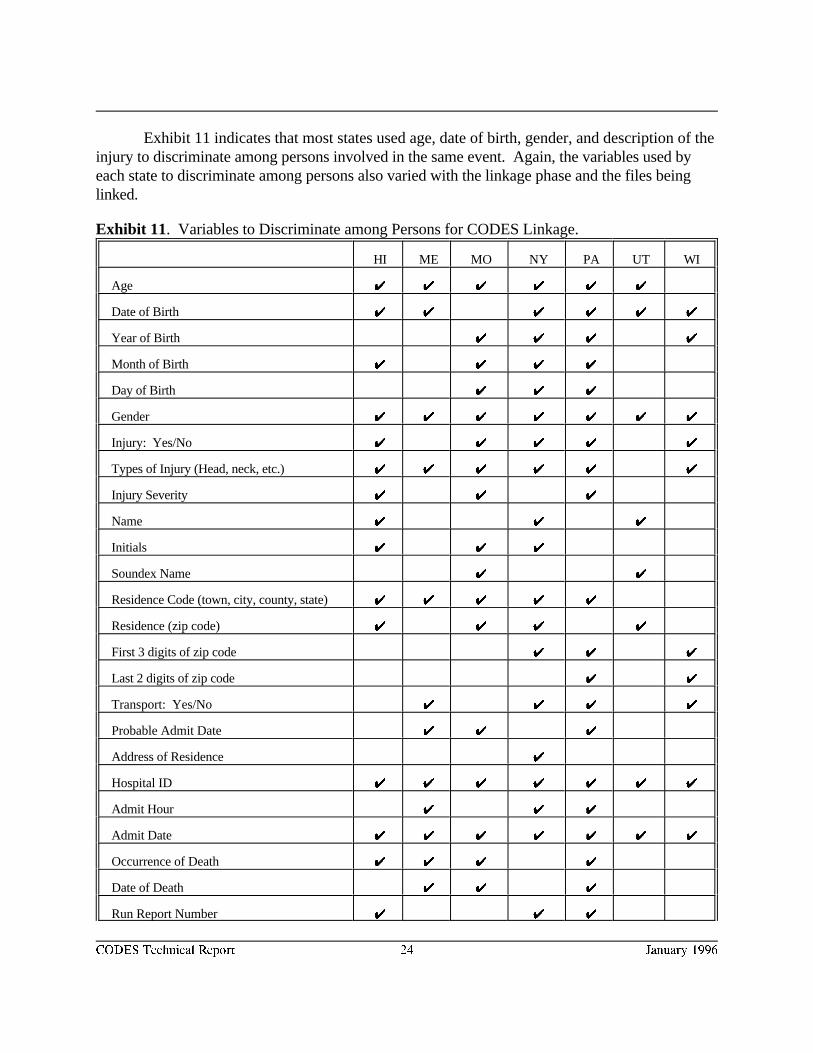
Exhibit 11 indicates that most states used age, date of birth, gender, and description of theinjury to discriminate among persons involved in the same event. Again, the variables used byeach state to discriminate among persons also varied with the linkage phase and the files beinglinked.
Exhibit 11. Variables to Discriminate among Persons for CODES Linkage.
HI ME MO NY PA UT WI
Age UU UU UU UU UU UU
Date of Birth UU UU UU UU UU UU
Year of Birth UU UU UU UU
Month of Birth UU UU UU UU
Day of Birth UU UU UU
Gender UU UU UU UU UU UU UU
Injury: Yes/No UU UU UU UU UU
Types of Injury (Head, neck, etc.) UU UU UU UU UU UU
Injury Severity UU UU UU
Name UU UU UU
Initials UU UU UU
Soundex Name UU UU
Residence Code (town, city, county, state) UU UU UU UU UU
Residence (zip code) UU UU UU UU
First 3 digits of zip code UU UU UU
Last 2 digits of zip code UU UU
Transport: Yes/No UU UU UU UU
Probable Admit Date UU UU UU
Address of Residence UU
Hospital ID UU UU UU UU UU UU UU
Admit Hour UU UU UU
Admit Date UU UU UU UU UU UU UU
Occurrence of Death UU UU UU UU
Date of Death UU UU UU
Run Report Number UU UU UU
HI ME MO NY PA UT WI
CODES Technical Report 25 January 1996
Social Security Number UU
Year of Admission UU UU UU
Month of Admission UU UU UU
Day of Admission UU UU UU
Year of Discharge UU UU
Month of Discharge UU UU
Day of discharge UU UU UU
Disposition UU UU UU
Pay Source UU UU
Position in Vehicle UU
Diagnosis Codes UU UU UU
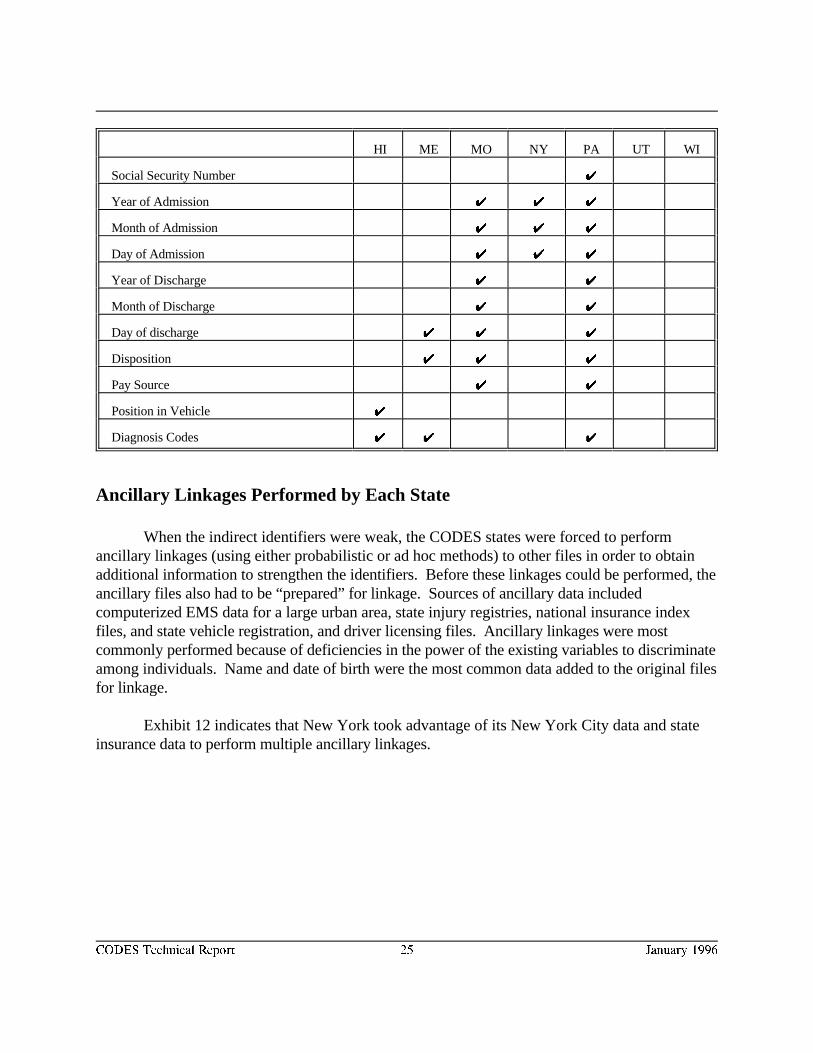
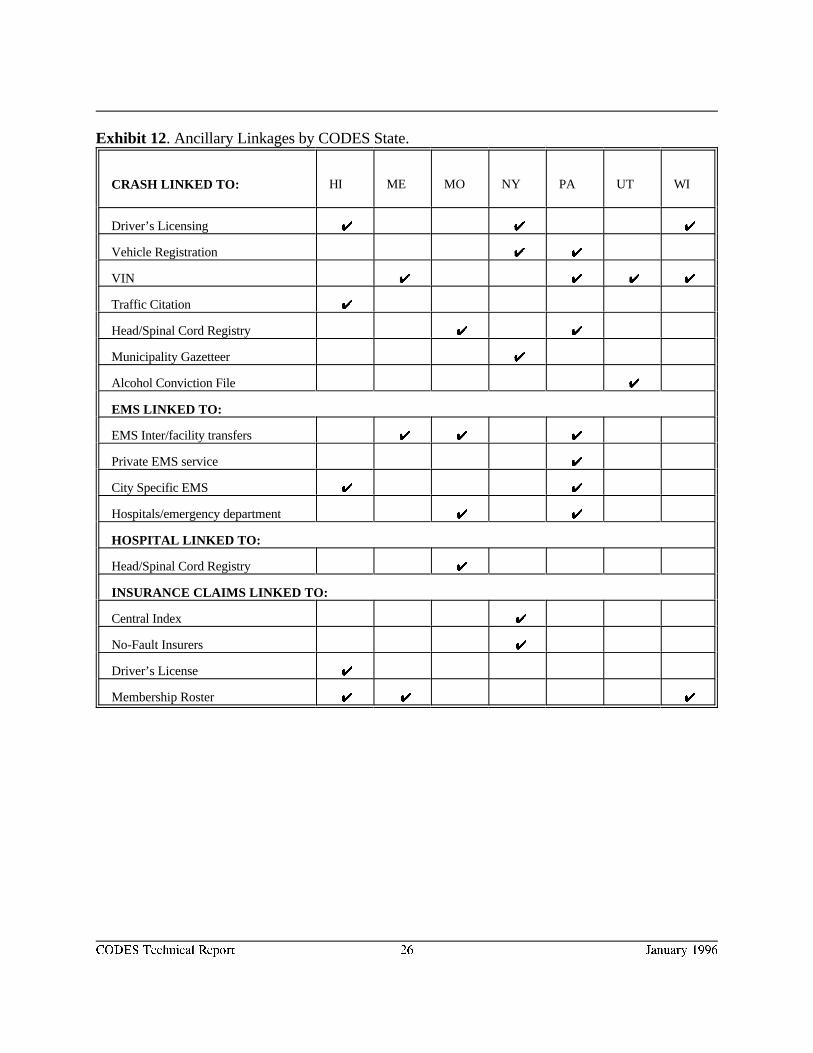
Ancillary Linkages Performed by Each State
When the indirect identifiers were weak, the CODES states were forced to performancillary linkages (using either probabilistic or ad hoc methods) to other files in order to obtainadditional information to strengthen the identifiers. Before these linkages could be performed, theancillary files also had to be “prepared” for linkage. Sources of ancillary data includedcomputerized EMS data for a large urban area, state injury registries, national insurance indexfiles, and state vehicle registration, and driver licensing files. Ancillary linkages were mostcommonly performed because of deficiencies in the power of the existing variables to discriminateamong individuals. Name and date of birth were the most common data added to the original filesfor linkage.
Exhibit 12 indicates that New York took advantage of its New York City data and stateinsurance data to perform multiple ancillary linkages.
CODES Technical Report 26 January 1996
Exhibit 12. Ancillary Linkages by CODES State.
CRASH LINKED TO: HI ME MO NY PA UT WI
Driver’s Licensing UU UU UU
Vehicle Registration UU UU
VIN UU UU UU UU
Traffic Citation UU
Head/Spinal Cord Registry UU UU
Municipality Gazetteer UU
Alcohol Conviction File UU
EMS LINKED TO:
EMS Inter/facility transfers UU UU UU
Private EMS service UU
City Specific EMS UU UU
Hospitals/emergency department UU UU
HOSPITAL LINKED TO:
Head/Spinal Cord Registry UU
INSURANCE CLAIMS LINKED TO:
Central Index UU
No-Fault Insurers UU
Driver’s License UU
Membership Roster UU UU UU
CODES Technical Report 27 January 1996
THE LINKAGE PROCESS
The Sequence of Linkage
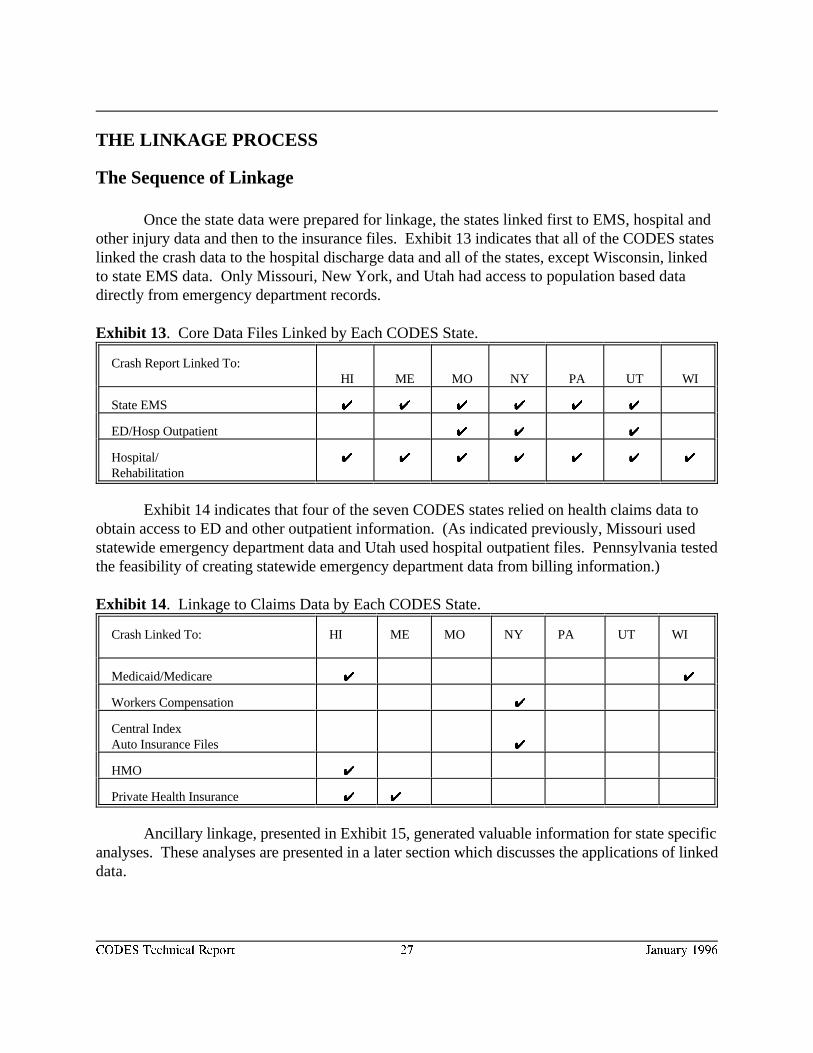
Once the state data were prepared for linkage, the states linked first to EMS, hospital andother injury data and then to the insurance files. Exhibit 13 indicates that all of the CODES stateslinked the crash data to the hospital discharge data and all of the states, except Wisconsin, linkedto state EMS data. Only Missouri, New York, and Utah had access to population based datadirectly from emergency department records.
Exhibit 13. Core Data Files Linked by Each CODES State.
Crash Report Linked To: HI ME MO NY PA UT WI
State EMS UU UU UU UU UU UU
ED/Hosp Outpatient UU UU UU
Hospital/Rehabilitation
UU UU UU UU UU UU UU
Exhibit 14 indicates that four of the seven CODES states relied on health claims data toobtain access to ED and other outpatient information. (As indicated previously, Missouri usedstatewide emergency department data and Utah used hospital outpatient files. Pennsylvania testedthe feasibility of creating statewide emergency department data from billing information.)
Exhibit 14. Linkage to Claims Data by Each CODES State.
Crash Linked To: HI ME MO NY PA UT WI
Medicaid/Medicare UU UU
Workers Compensation UU
Central IndexAuto Insurance Files UU
HMO UU
Private Health Insurance UU UU
Ancillary linkage, presented in Exhibit 15, generated valuable information for state specificanalyses. These analyses are presented in a later section which discusses the applications of linkeddata.
CODES Technical Report 28 January 1996
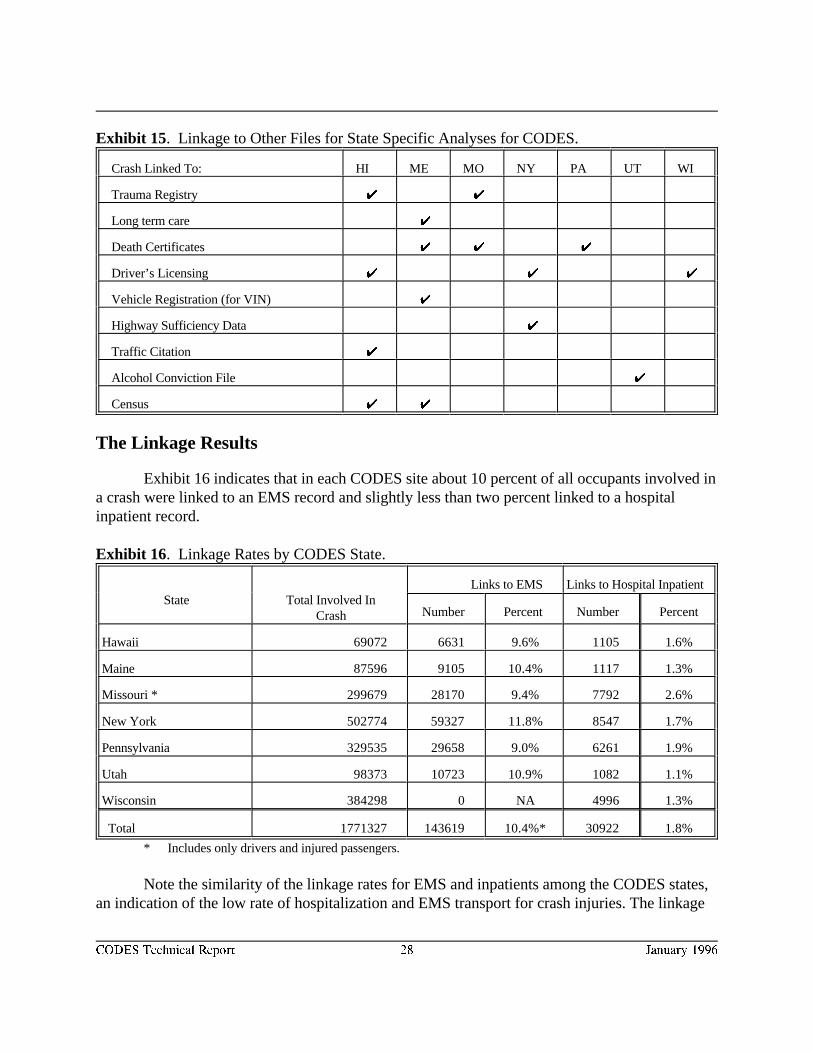
Exhibit 15. Linkage to Other Files for State Specific Analyses for CODES.
Crash Linked To: HI ME MO NY PA UT WI
Trauma Registry U U
Long term care U
Death Certificates U U U
Driver’s Licensing U U U
Vehicle Registration (for VIN) U
Highway Sufficiency Data U
Traffic Citation U
Alcohol Conviction File U
Census U U
The Linkage Results
Exhibit 16 indicates that in each CODES site about 10 percent of all occupants involved ina crash were linked to an EMS record and slightly less than two percent linked to a hospitalinpatient record.
Exhibit 16. Linkage Rates by CODES State.
State Total Involved InLinks to EMS Links to Hospital Inpatient
Crash Number Percent Number Percent
Hawaii 69072 6631 9.6% 1105 1.6%
Maine 87596 9105 10.4% 1117 1.3%
Missouri * 299679 28170 9.4% 7792 2.6%
New York 502774 59327 11.8% 8547 1.7%
Pennsylvania 329535 29658 9.0% 6261 1.9%
Utah 98373 10723 10.9% 1082 1.1%
Wisconsin 384298 0 NA 4996 1.3%
Total 1771327 143619 10.4%* 30922 1.8%
* Includes only drivers and injured passengers.
Note the similarity of the linkage rates for EMS and inpatients among the CODES states,an indication of the low rate of hospitalization and EMS transport for crash injuries. The linkage
5 % Transported by EMS but not Hospitalized
0.2 % Fatalities1.4 % Hospitalized
CODES Technical Report 29 January 1996
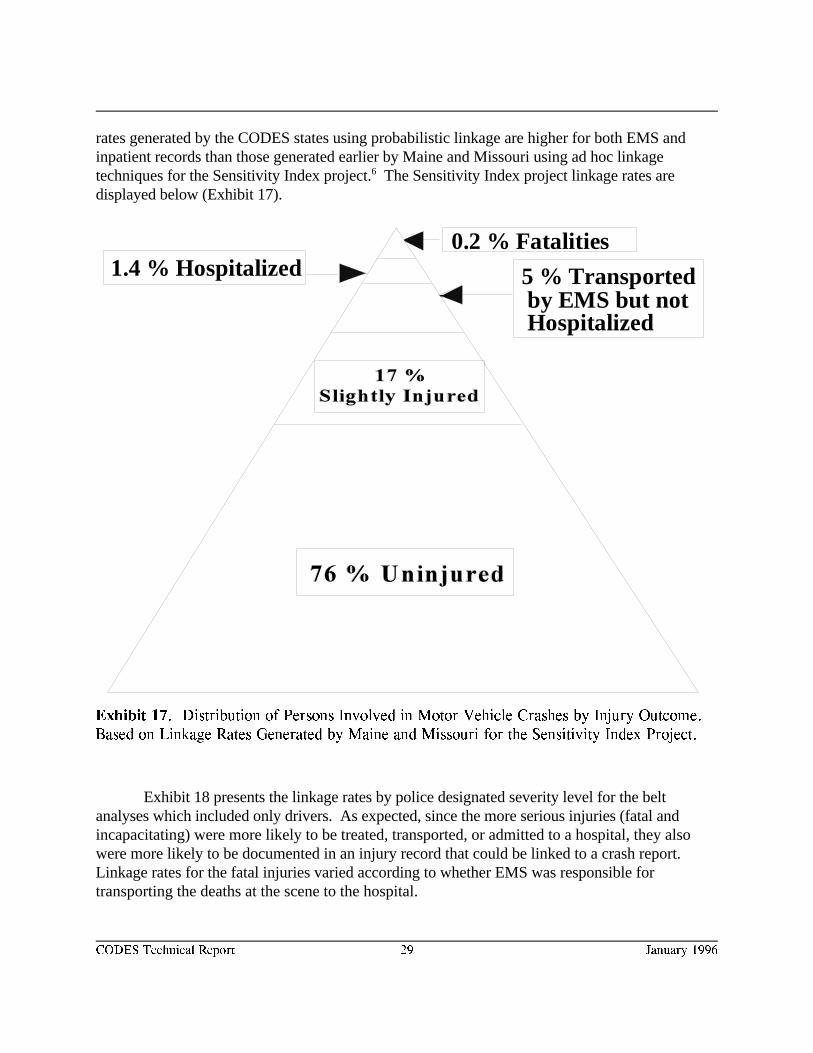
Exhibit 17. Distribution of Persons Involved in Motor Vehicle Crashes by Injury Outcome.
Based on Linkage Rates Generated by Maine and Missouri for the Sensitivity Index Project.
rates generated by the CODES states using probabilistic linkage are higher for both EMS andinpatient records than those generated earlier by Maine and Missouri using ad hoc linkagetechniques for the Sensitivity Index project. The Sensitivity Index project linkage rates are6
displayed below (Exhibit 17).
Exhibit 18 presents the linkage rates by police designated severity level for the beltanalyses which included only drivers. As expected, since the more serious injuries (fatal andincapacitating) were more likely to be treated, transported, or admitted to a hospital, they alsowere more likely to be documented in an injury record that could be linked to a crash report. Linkage rates for the fatal injuries varied according to whether EMS was responsible fortransporting the deaths at the scene to the hospital.
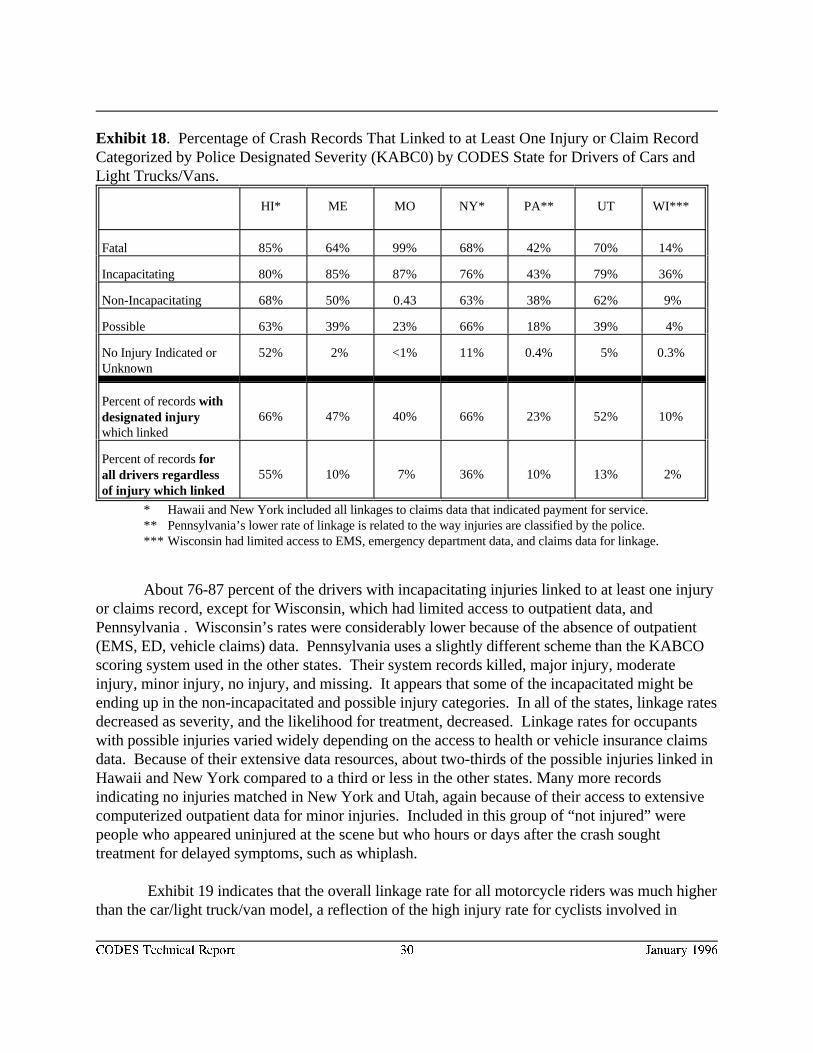
CODES Technical Report 30 January 1996
Exhibit 18. Percentage of Crash Records That Linked to at Least One Injury or Claim RecordCategorized by Police Designated Severity (KABC0) by CODES State for Drivers of Cars andLight Trucks/Vans.
HI* ME MO NY* PA** UT WI***
Fatal 85% 64% 99% 68% 42% 70% 14%
Incapacitating 80% 85% 87% 76% 43% 79% 36%
Non-Incapacitating 68% 50% 0.43 63% 38% 62% 9%
Possible 63% 39% 23% 66% 18% 39% 4%
No Injury Indicated or 52% 2% <1% 11% 0.4% 5% 0.3%Unknown
Percent of records withdesignated injurywhich linked
66% 47% 40% 66% 23% 52% 10%
Percent of records forall drivers regardlessof injury which linked
55% 10% 7% 36% 10% 13% 2%
* Hawaii and New York included all linkages to claims data that indicated payment for service.** Pennsylvania’s lower rate of linkage is related to the way injuries are classified by the police.*** Wisconsin had limited access to EMS, emergency department data, and claims data for linkage.
About 76-87 percent of the drivers with incapacitating injuries linked to at least one injuryor claims record, except for Wisconsin, which had limited access to outpatient data, andPennsylvania . Wisconsin’s rates were considerably lower because of the absence of outpatient(EMS, ED, vehicle claims) data. Pennsylvania uses a slightly different scheme than the KABCOscoring system used in the other states. Their system records killed, major injury, moderateinjury, minor injury, no injury, and missing. It appears that some of the incapacitated might beending up in the non-incapacitated and possible injury categories. In all of the states, linkage ratesdecreased as severity, and the likelihood for treatment, decreased. Linkage rates for occupantswith possible injuries varied widely depending on the access to health or vehicle insurance claimsdata. Because of their extensive data resources, about two-thirds of the possible injuries linked inHawaii and New York compared to a third or less in the other states. Many more recordsindicating no injuries matched in New York and Utah, again because of their access to extensivecomputerized outpatient data for minor injuries. Included in this group of “not injured” werepeople who appeared uninjured at the scene but who hours or days after the crash soughttreatment for delayed symptoms, such as whiplash.
Exhibit 19 indicates that the overall linkage rate for all motorcycle riders was much higherthan the car/light truck/van model, a reflection of the high injury rate for cyclists involved in
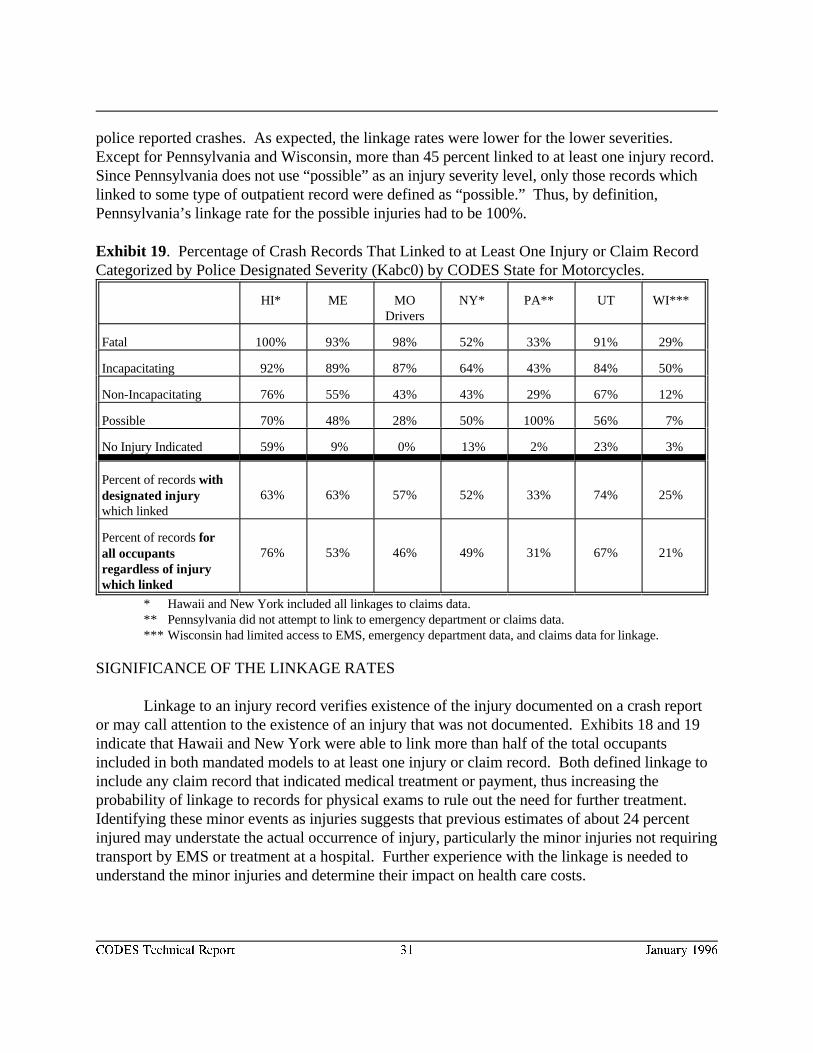
CODES Technical Report 31 January 1996
police reported crashes. As expected, the linkage rates were lower for the lower severities. Except for Pennsylvania and Wisconsin, more than 45 percent linked to at least one injury record.
Since Pennsylvania does not use “possible” as an injury severity level, only those records whichlinked to some type of outpatient record were defined as “possible.” Thus, by definition,Pennsylvania’s linkage rate for the possible injuries had to be 100%.
Exhibit 19. Percentage of Crash Records That Linked to at Least One Injury or Claim RecordCategorized by Police Designated Severity (Kabc0) by CODES State for Motorcycles.
HI* ME MO NY* PA** UT WI***Drivers
Fatal 100% 93% 98% 52% 33% 91% 29%
Incapacitating 92% 89% 87% 64% 43% 84% 50%
Non-Incapacitating 76% 55% 43% 43% 29% 67% 12%
Possible 70% 48% 28% 50% 100% 56% 7%
No Injury Indicated 59% 9% 0% 13% 2% 23% 3%
Percent of records withdesignated injurywhich linked
63% 63% 57% 52% 33% 74% 25%
Percent of records forall occupantsregardless of injurywhich linked
76% 53% 46% 49% 31% 67% 21%
* Hawaii and New York included all linkages to claims data.** Pennsylvania did not attempt to link to emergency department or claims data.*** Wisconsin had limited access to EMS, emergency department data, and claims data for linkage.
SIGNIFICANCE OF THE LINKAGE RATES
Linkage to an injury record verifies existence of the injury documented on a crash reportor may call attention to the existence of an injury that was not documented. Exhibits 18 and 19indicate that Hawaii and New York were able to link more than half of the total occupantsincluded in both mandated models to at least one injury or claim record. Both defined linkage toinclude any claim record that indicated medical treatment or payment, thus increasing theprobability of linkage to records for physical exams to rule out the need for further treatment. Identifying these minor events as injuries suggests that previous estimates of about 24 percentinjured may understate the actual occurrence of injury, particularly the minor injuries not requiringtransport by EMS or treatment at a hospital. Further experience with the linkage is needed tounderstand the minor injuries and determine their impact on health care costs.
CODES Technical Report 32 January 1996
Validation of the Linkage Results
Since we do not know which records should link, the crash to injury linkage occurs underconditions of uncertainty which make it difficult to validate the linkage results. Crash recordsindicating the more serious injuries (fatality, incapacitating injury) and the EMS or hospitaldischarge records indicating motor vehicle crash as the cause of injury are expected to have a linkamong the EMS or hospital records. However, the matching record may not be available becauseof reporting thresholds (i.e., exclusion of private roadways, out-of state residents), failure toenforce reporting requirements, or data collection and processing problems. On the other hand,records not expected to match may have a matching record. For example, crash recordsdesignating no injury may have a match among the injury records. Injury records which fail todesignate cause of injury may have a match among the crash records. Linkage depends on thedata files available for linkage. Occupants injured in motor vehicle crashes may be treated in aphysician’s office or location other than an emergency department or hospital. So, although theoccurrence of the injury is documented on the crash report, if the data files being linked do notinclude all treatment locations (physician office, EMS, emergency department, hospital, otheroutpatient, etc.), then some of the records that should link will not link.
When conditions of uncertainty exist, linkage equals “injury.” Non-linkage equals “notinjured” except when assumptions are made that a fatal or incapacitating injury which does notlink should be considered an injury. Thus, by definition, the “linked” records, or injuredoccupants, are a very different population from the “unlinked” records, or uninjured occupants. So, it is important to determine if the “linked” records are representative of the injured populationand the “unlinked” records are representative of the uninjured population.
In order to validate the linkage results, the CODES states manually linked a randomsample of crash reports and/or reviewed all records indicating a crash injury. They also reviewedthe case-mix of linked and unlinked records for potential systematic biases that might affect use ofthe linked data analytically for the Report to Congress.
FALSE POSITIVES: (Internal Validity)
A false positive match represents a pair of records which matched but the two records donot represent the same person. The states assigned a high priority to ensuring a low rate of falsepositive cases and conservatively set the weight defining a match to a higher positive score tominimize the opportunity for false positives to occur. At the same time, they were careful not toset the score so high that too many pairs would require manual review.
The false positive rate ranged from 3.0 - 8.8 percent for the seven states and was viewedas not significant since the linked data included thousands of records estimated to represent atleast half of all occupants involved in motor vehicle crashes in the seven CODES states (SeeExhibit 16).
CODES Technical Report 33 January 1996
Besides differences in strategy, the states also varied in the availability of direct identifierssuch as name (to ensure certainty when declaring a valid match). False positives were measuredby identifying a random sample of crash and/or injury records and reviewing those that linked toverify that a motor vehicle crash was the cause of injury. Maine, Pennsylvania, and Wisconsinread the actual paper crash, EMS, and hospital records to validate the linkage. Missouricompared agreement on key linkage variables such as injury county, last initial, date of event,trafficway/trauma indicators, date of birth, or sex. Wisconsin determined that the false positiverate for the Medicaid linkage varied from that for hospitalizations generally since Medicaid caseswere more likely to be found in urban areas.
FALSE NEGATIVES: (External Validity)
A false negative, on the other hand, represents a record (crash or injury) that did notmatch but should have. For the most part, these are injury records with a motor vehicle crashdesignated as the cause which did not link to a crash report. However, it is also possible to have acrash record with a designated severe injury (i.e. fatal, incapacitating) for which no match wasfound.
The rates for false negatives varied from 4-30 percent depending on the linkage pass andthe files being linked. The higher rates occurred when the power of the linkage variables todiscriminate among the crashes and the occupants involved was problematical. False negativeswere measured by first identifying the records which should match. These included crash reportsindicating ambulance transport, EMS records indicating motor vehicle crash as the cause of injuryor hospital records listing an E code indicating a motor vehicle crash. These records were thencompared to the linked records to identify those that did not link. False negatives were alsoidentified by randomly selecting a group of crash reports and manually reviewing the paperrecords to identify those which did not link.
Crash and injury records failed to match when one or the other was never submitted, thelinking criteria were too restrictive, key data linkage variables were in error or missing, the caseselection criteria, such as the E-code, were in error or missing, the crash-related hospitalizationoccurred after several hours or days had passed, the crash or the treatment occurred out-of-state,etc. Lack of date of birth on the crash report for passengers was a major obstacle to linkage forall of the states except Wisconsin which included this information for all injured passengers. Asthe result of the linkage process, Maine targeted the importance of including this data element onthe crash report. Among the false negatives identified by Wisconsin, 12 percent occurred becausethe admission was not the initial admission for the crash and 10 percent occurred because keylinkage variables were missing. Another 7.5 percent occurred because the linking criteria weretoo strict. About 7 percent were missing a crash report because the crash occurred out of state orthe patient had been transferred from another institution. Twelve percent of the false negativeswere admitted as inpatients initially for other reasons than the crash. It was not possible todetermine the false negative rates when the key data linkage variables or E-code were in error,

CODES Technical Report 34 January 1996
when out of state injuries were treated in Wisconsin Hospitals and when the crash record was notreceived at DOT.
Missouri estimated linkage rates of 65 percent of the hospital discharge, 75 percent of theEMS records, and 88 percent of the head and spinal cord injury registry records when motorvehicle crash as the cause of injury was designated on the record. Comparison of Missouri’slinked and unlinked records suggested that actual linkage rates were even higher, as unlinkedrecords contained records not likely to be motor vehicle related injuries (such as gunshot,laceration, punctures, and stabs). The linked records showed higher rates of fractures and softtissue injuries, which are typical of motor vehicle crashes. Seventy-nine percent of the fractureswere linked, as were 78 percent of soft tissue injuries. The absence of a record in the crash fileprevented linkage to an injury record; the absence of a cause of injury code risked a denominatorinflated with non-motor vehicle crashes.
The comparison of linked and unlinked records do not suggest that significant numbers ofimportant types of records are not being linked, though perhaps some less severely injuredpatients may be missed. Because ambulance linkage was used as an important intermediate linkfor the hospital discharge file, some individuals not injured severely enough to require anambulance may have been missed, but they would also be less likely to require hospitalization. Any effect of this would be to erroneously raise slightly the estimate of average charges forhospitalized patients.
False negatives were considered less serious than a false positive so the states adjusted thecut-off weight defining a non-match to give priority to minimizing the total matched pairsrequiring manual review.
It must be noted that although the rates for the false negatives and false positives were notsignificant for the belt and helmet analyses, they may be significant for other analyses usingdifferent outcome measures and smaller population units. For example, analyses of rural/urbanpatterns may be sensitive to missing data from specific geographic areas. Analyses of EMSeffectiveness may be sensitive to missing data from specific EMS ambulance services or agegroups. Another concern focuses on the definition of injury. When minor injuries are defined asinjuries only if their existence is verified by linkage, then by definition the unlinked cases becomenon-injuries relative to the data sources used in the linkage. States using data sources coveringthe physician’s office through to tertiary care will have more linkages and thus more “injuries.” Estimates of the percentage injured, transported, admitted as inpatients, and the total charges willvary accordingly.
CODES Technical Report 35 January 1996
Obstacles to Linkage
The major obstacles to linkage resulted from data which had insufficient power todiscriminate among the events and persons involved in the events and which failed to documentthe cause of injury. Data quality and lack of computerization were the two most important causesof non-discriminating identifiers.
All of the CODES states successfully negotiated the various problems associated with thelinkage process. While police crash reports are most often considered public records for thepurposes of access, patient medical records are considered confidential and thus access to thesedata systems was restricted by legislative or administrative policies. Access required collaborationwith the owners of the data and compliance with all restrictions including written data requests,data releases, and in some cases a fee for access to the data. State data were frequently stored ondifferent storage media, and the CODES teams learned to delegate to an expert the job of creatingoccupant-specific files and downloading large mainframe data files to a microcomputer.
The states worked with data files, advertised as computerized, which upon closerexamination revealed that some of the important identifiers were not computerized uniformlystatewide. Or if the identifiers were computerized, some of the attribute values would be missingor inaccurate. Missouri became adept at discovering transpositions among the initials. Moststates culled newborns from the unknown ages. All of the states found the sevens which shouldhave been nines, threes instead of fives, the 91 year old who was really 19, etc. Differentcombinations of the indirect identifiers were tried when the data content initially producedinsufficient information to discriminate among events and the multiple occupants involved in thesame event. Reporting thresholds and submission rates by police agency or medical providerwere reviewed to determine when records were not available for linkage. Cause-of-injuryinformation was not always available making it difficult to know which records to choose forlinkage.
Most of the states found the inter-agency political barriers manageable. However,Pennsylvania’s legislature managed to delay its approval of the expenditure of CODES projectfunds for nine months. Wisconsin was permitted to link the hospital data only at the site of theowner of the hospital data.
Probabilistic linkage requires computerized data. Failure to computerize EMS, emergencydepartment, rehabilitative, and long term care data complicated the process of tracing the patientthrough the sequence of medical care. Wisconsin and Missouri failed to computerize sufficientinformation to include the uninjured passengers in the linkage. Hawaii collected EMS runnumbers, driver’s license number, and license plate numbers but did not computerize thisinformation.
CODES Technical Report 36 January 1996
Implementing AUTOMATCH required expertise in data file management and the datafiles being linked, particularly information about how the EMS system responds. No one personhad all these skills. The most common equipment problems were caused by unfamiliarity with theequipment or the network to which it was attached. States which received the linkage softwarefirst were delayed by bugs in the early versions of the software.
MANDATED RESEARCH MODEL FOR SAFETY BELTS AND HELMETS
To meet the requirement of the ISTEA to estimate the benefits of safety belts and helmetswith respect to mortality, morbidity and injury severity, each of the CODES states was required toimplement a uniform research model to ensure comparable results across diverse states for theReport to Congress.
The Study Population
The study population for the mandated model was defined to include all drivers involvedin police reported crashes statewide for a twelve month period beginning on or after January 1,1990. All of the CODES sites used the state data which was most current at the time of thestudy: Hawaii and Missouri used 1990 data; New York used 1992 data; and the other states used1991 data.
Two variations of the models were calculated for the safety belts, one for drivers (allstates) and one for all occupants 5 and older. The second model excluded Missouri andWisconsin because their crash reports had insufficient information to link the records for uninjuredpassengers. Age and sex information was not recorded for uninjured passengers in Wisconsin; noinformation was collected about the uninjured passengers in Missouri. In the other states,passengers under 5 years old were excluded to insure the results did not include child safety seatdata. The safety belt analyses were limited to passenger cars, light trucks, and vans. The helmetanalyses, which used all riders, were limited to motorcycle crashes. Both the belt and helmetanalyses were limited to crashes reported by the police.
The linking of the various databases in the grantee states produced a large number ofcrashes which contributed 879,670 drivers for the belt analysis and 10,353 motorcyclists for thehelmet analyses (See Exhibit 20). The groups chosen as the study populations for the mandatedmodels represent all riders of motorcycles involved in police reported crashes and about 53percent of all occupants involved in passenger car/light truck crashes
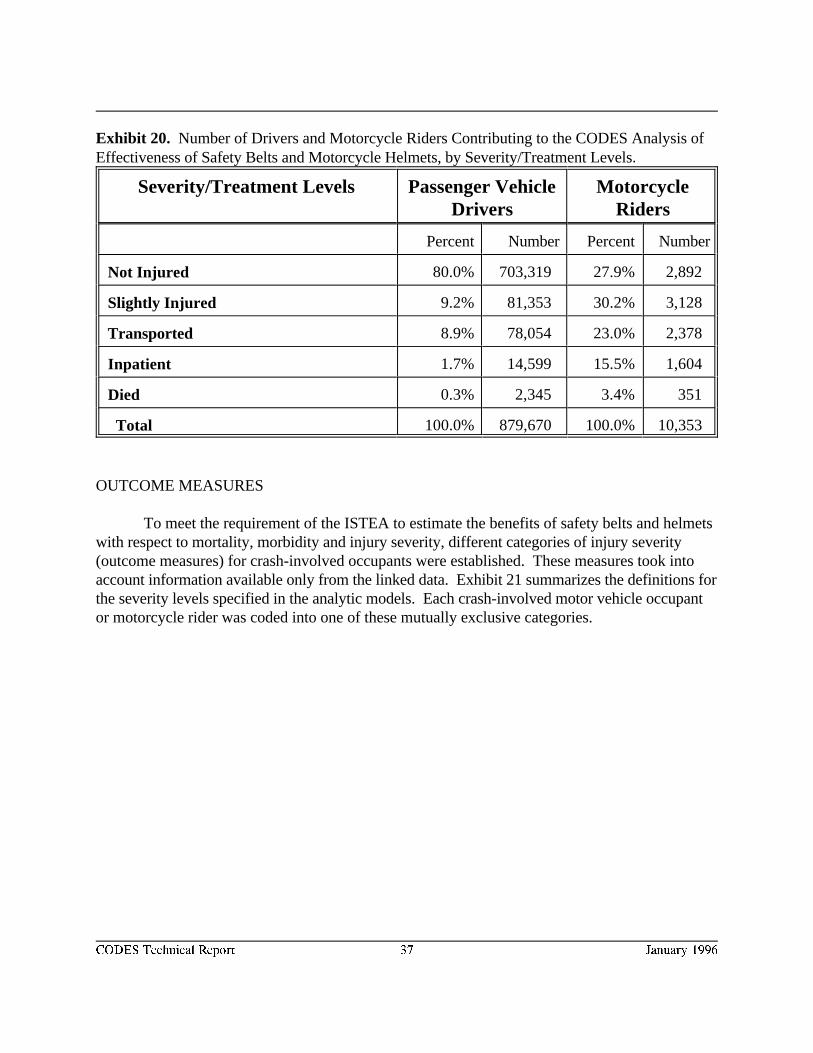
CODES Technical Report 37 January 1996
Exhibit 20. Number of Drivers and Motorcycle Riders Contributing to the CODES Analysis ofEffectiveness of Safety Belts and Motorcycle Helmets, by Severity/Treatment Levels.
Severity/Treatment Levels Passenger Vehicle MotorcycleDrivers Riders
Percent Number Percent Number
Not Injured 80.0% 703,319 27.9% 2,892
Slightly Injured 9.2% 81,353 30.2% 3,128
Transported 8.9% 78,054 23.0% 2,378
Inpatient 1.7% 14,599 15.5% 1,604
Died 0.3% 2,345 3.4% 351
Total 100.0% 879,670 100.0% 10,353
OUTCOME MEASURES
To meet the requirement of the ISTEA to estimate the benefits of safety belts and helmetswith respect to mortality, morbidity and injury severity, different categories of injury severity(outcome measures) for crash-involved occupants were established. These measures took intoaccount information available only from the linked data. Exhibit 21 summarizes the definitions forthe severity levels specified in the analytic models. Each crash-involved motor vehicle occupantor motorcycle rider was coded into one of these mutually exclusive categories.
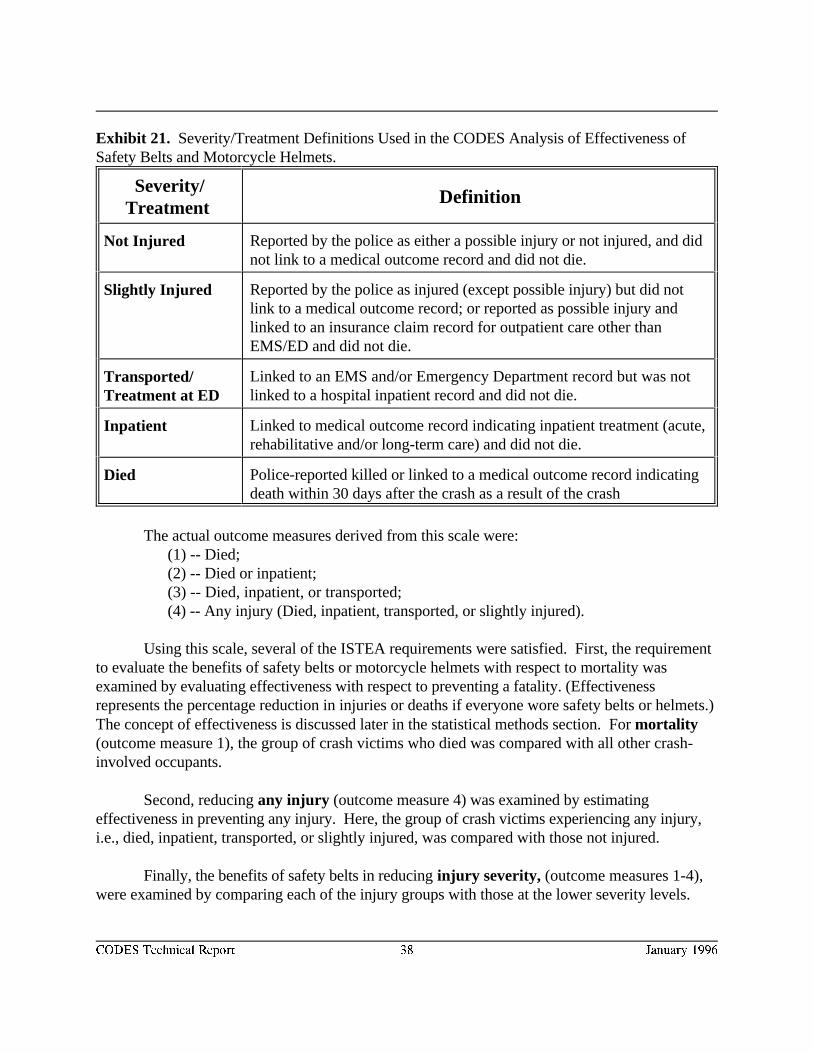
CODES Technical Report 38 January 1996
Exhibit 21. Severity/Treatment Definitions Used in the CODES Analysis of Effectiveness ofSafety Belts and Motorcycle Helmets.
Severity/Treatment
Definition
Not Injured Reported by the police as either a possible injury or not injured, and didnot link to a medical outcome record and did not die.
Slightly Injured Reported by the police as injured (except possible injury) but did notlink to a medical outcome record; or reported as possible injury andlinked to an insurance claim record for outpatient care other thanEMS/ED and did not die.
Transported/Treatment at ED
Linked to an EMS and/or Emergency Department record but was notlinked to a hospital inpatient record and did not die.
Inpatient Linked to medical outcome record indicating inpatient treatment (acute,rehabilitative and/or long-term care) and did not die.
Died Police-reported killed or linked to a medical outcome record indicatingdeath within 30 days after the crash as a result of the crash
The actual outcome measures derived from this scale were:(1) -- Died;(2) -- Died or inpatient;(3) -- Died, inpatient, or transported;(4) -- Any injury (Died, inpatient, transported, or slightly injured).
Using this scale, several of the ISTEA requirements were satisfied. First, the requirementto evaluate the benefits of safety belts or motorcycle helmets with respect to mortality wasexamined by evaluating effectiveness with respect to preventing a fatality. (Effectivenessrepresents the percentage reduction in injuries or deaths if everyone wore safety belts or helmets.)The concept of effectiveness is discussed later in the statistical methods section. For mortality(outcome measure 1), the group of crash victims who died was compared with all other crash-involved occupants.
Second, reducing any injury (outcome measure 4) was examined by estimatingeffectiveness in preventing any injury. Here, the group of crash victims experiencing any injury,i.e., died, inpatient, transported, or slightly injured, was compared with those not injured.
Finally, the benefits of safety belts in reducing injury severity, (outcome measures 1-4),were examined by comparing each of the injury groups with those at the lower severity levels.
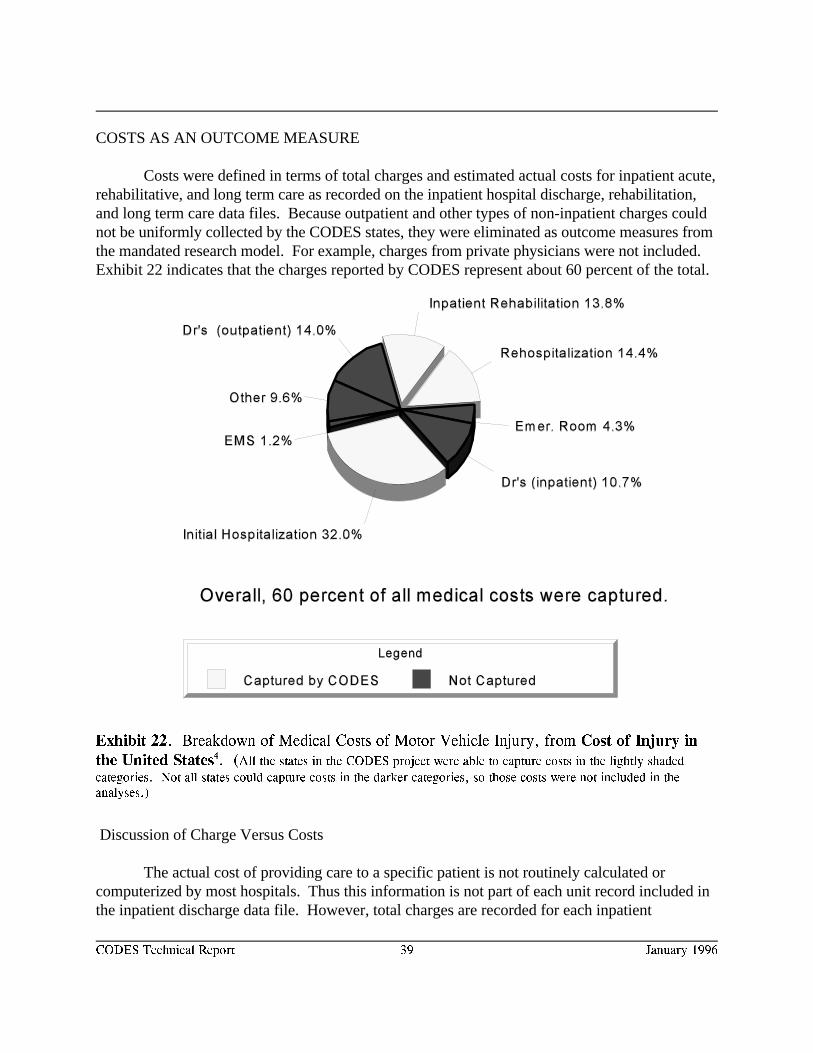
CODES Technical Report 39 January 1996
Exhibit 22. Breakdown of Medical Costs of Motor Vehicle Injury, from Cost of Injury in
the United States . (All the states in the CODES project were able to capture costs in the lightly shaded4
categories. Not all states could capture costs in the darker categories, so those costs were not included in the
analyses.)
COSTS AS AN OUTCOME MEASURE
Costs were defined in terms of total charges and estimated actual costs for inpatient acute,rehabilitative, and long term care as recorded on the inpatient hospital discharge, rehabilitation,and long term care data files. Because outpatient and other types of non-inpatient charges couldnot be uniformly collected by the CODES states, they were eliminated as outcome measures fromthe mandated research model. For example, charges from private physicians were not included. Exhibit 22 indicates that the charges reported by CODES represent about 60 percent of the total.
Discussion of Charge Versus Costs
The actual cost of providing care to a specific patient is not routinely calculated orcomputerized by most hospitals. Thus this information is not part of each unit record included inthe inpatient discharge data file. However, total charges are recorded for each inpatient

CODES Technical Report 40 January 1996
discharged from a facility. The charge represents the retail price for inpatient services beforediscounts. They do not represent what was actually paid for the services. As in any otherbusiness, the price consists of cost plus a markup factor established by each health care providerto ensure the overall viability of the facility by covering bad debts, cost shifting among the payers,profit/surplus revenue, etc. Total charges do not reflect the discounts and so when totaled do notreflect the total revenue received by the facility. All health care facilities negotiate at regularintervals discounted rates with the payers covering patients treated at their facilities. Because therates vary by payer and by facility, the same procedure in the same facility and among differentfacilities may be “priced” differently for different payers. Charge data for inpatients are collectedby licensed medical records experts and recorded per uniform billing guidelines established by thepayers. The data are subject to routine edits. As a result, these data, in the absence of actualcosts, have become a credible measure routinely used by states to statistically monitor usepatterns and to estimate actual costs.
In this analysis, costs for inpatient care are estimated using a charge to cost ratio obtainedfrom the Medicare cost reports for each inpatient facility. Although the cost reports are generatedto support management of the Medicare program, the data used to calculate the ratio include allpatients treated at the facility. Each facility reports the ratio of gross patient revenue plus otheroperating revenue divided by total operating expenses for all patients, outpatient and inpatients,treated at the hospital. The ratios shown in Exhibit 23 represent the median ratio for the state forthe year reported. The ratio is valid at the state level but is not generalizable to payer source orother smaller units of analysis.
Exhibit 23. Charge-to-cost Ratio for Year of Data Collection for Each CODES State.7
HI ME MO NY PA UT WI1990 1991 1990 1992 1991 1991 1991
Ratio of Charge to 1.15 1.43 1.47 1.36 1.71 1.3 1.29Cost
For the CODES mandated analyses, total inpatient costs were estimated by dividing theratio into the total inpatient charges for each CODES state, and then totaling the results for theseven states. Average actual costs was then calculated by dividing the total patients receivinginpatient care into the total actual costs.
Long term care charges for the first twelve months represent only a fraction of the totaloverall charges and were available only for Maine and New York. However, only Maine includedthe charges in the mandated model. The Maine charges were included in the total to calculate theactual costs.
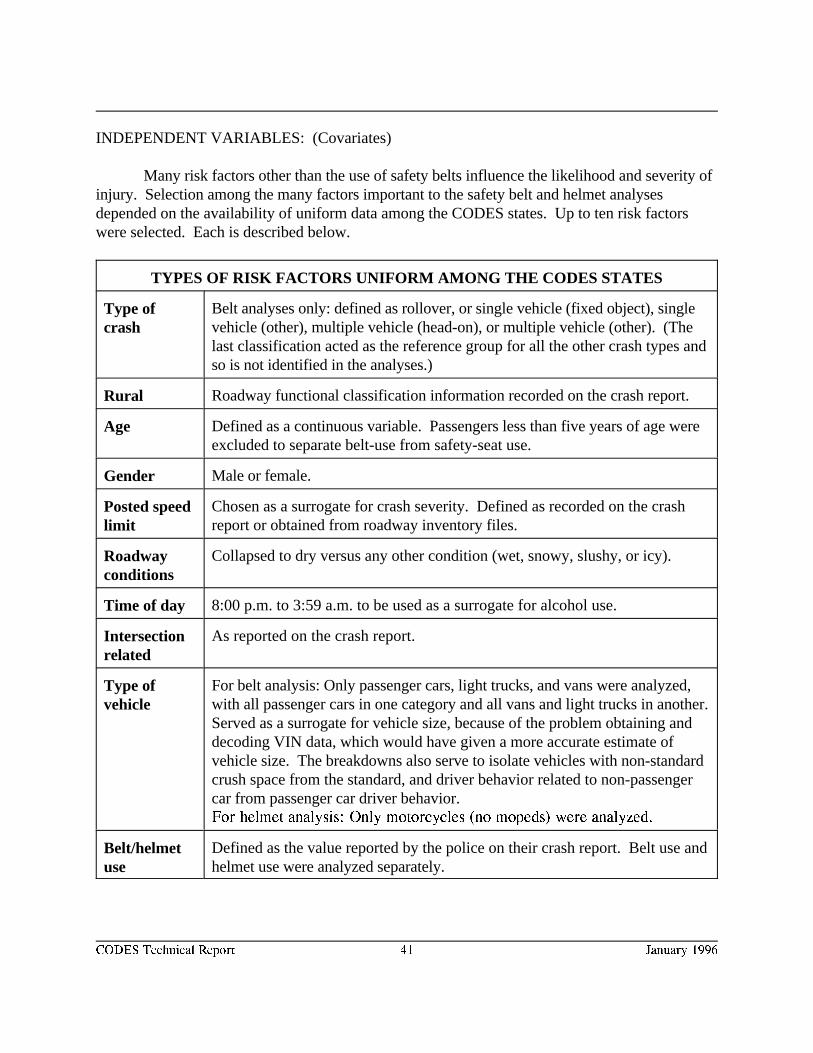
CODES Technical Report 41 January 1996
INDEPENDENT VARIABLES: (Covariates)
Many risk factors other than the use of safety belts influence the likelihood and severity ofinjury. Selection among the many factors important to the safety belt and helmet analysesdepended on the availability of uniform data among the CODES states. Up to ten risk factorswere selected. Each is described below.
TYPES OF RISK FACTORS UNIFORM AMONG THE CODES STATES
Type ofcrash
Belt analyses only: defined as rollover, or single vehicle (fixed object), singlevehicle (other), multiple vehicle (head-on), or multiple vehicle (other). (Thelast classification acted as the reference group for all the other crash types andso is not identified in the analyses.)
Rural Roadway functional classification information recorded on the crash report.
Age Defined as a continuous variable. Passengers less than five years of age wereexcluded to separate belt-use from safety-seat use.
Gender Male or female.
Posted speedlimit
Chosen as a surrogate for crash severity. Defined as recorded on the crashreport or obtained from roadway inventory files.
Roadwayconditions
Collapsed to dry versus any other condition (wet, snowy, slushy, or icy).
Time of day 8:00 p.m. to 3:59 a.m. to be used as a surrogate for alcohol use.
Intersectionrelated
As reported on the crash report.
Type ofvehicle
For belt analysis: Only passenger cars, light trucks, and vans were analyzed,with all passenger cars in one category and all vans and light trucks in another. Served as a surrogate for vehicle size, because of the problem obtaining anddecoding VIN data, which would have given a more accurate estimate ofvehicle size. The breakdowns also serve to isolate vehicles with non-standardcrush space from the standard, and driver behavior related to non-passengercar from passenger car driver behavior.For helmet analysis: Only motorcycles (no mopeds) were analyzed.
Belt/helmetuse
Defined as the value reported by the police on their crash report. Belt use andhelmet use were analyzed separately.
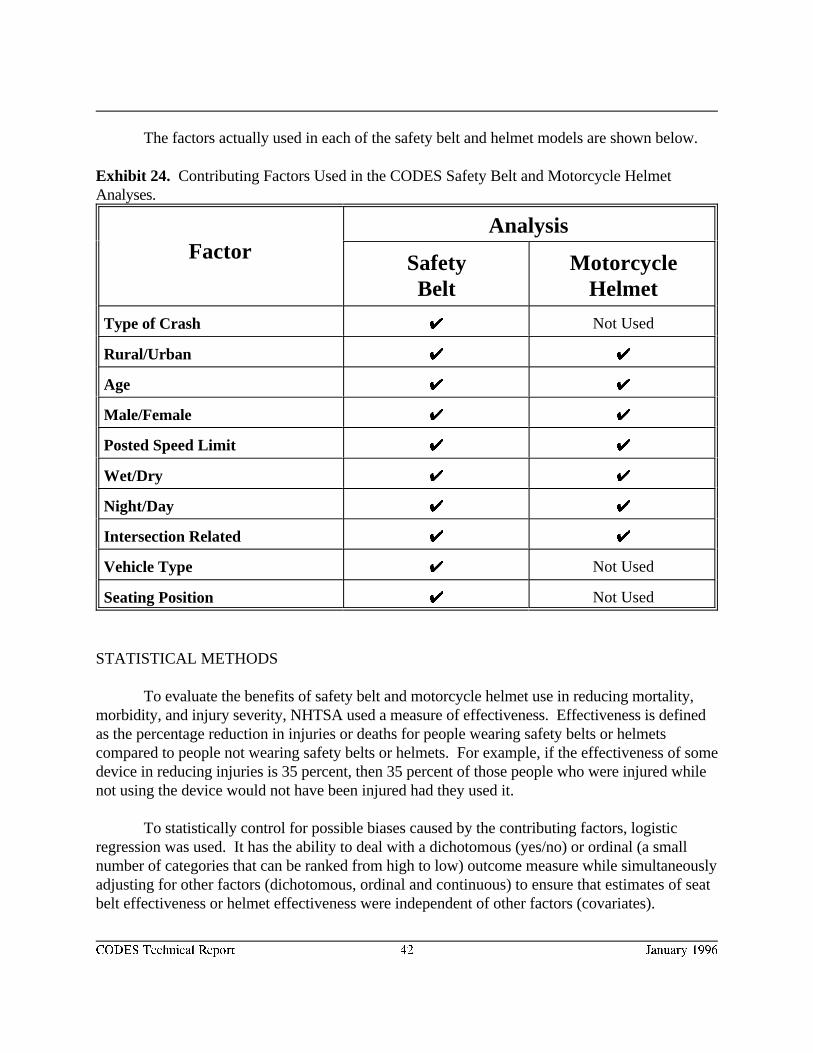
CODES Technical Report 42 January 1996
The factors actually used in each of the safety belt and helmet models are shown below.
Exhibit 24. Contributing Factors Used in the CODES Safety Belt and Motorcycle HelmetAnalyses.
FactorAnalysis
Safety MotorcycleBelt Helmet
Type of Crash UU Not Used
Rural/Urban UU UU
Age UU UU
Male/Female UU UU
Posted Speed Limit UU UU
Wet/Dry UU UU
Night/Day UU UU
Intersection Related UU UU
Vehicle Type UU Not Used
Seating Position UU Not Used
STATISTICAL METHODS
To evaluate the benefits of safety belt and motorcycle helmet use in reducing mortality,morbidity, and injury severity, NHTSA used a measure of effectiveness. Effectiveness is definedas the percentage reduction in injuries or deaths for people wearing safety belts or helmetscompared to people not wearing safety belts or helmets. For example, if the effectiveness of somedevice in reducing injuries is 35 percent, then 35 percent of those people who were injured whilenot using the device would not have been injured had they used it.
To statistically control for possible biases caused by the contributing factors, logisticregression was used. It has the ability to deal with a dichotomous (yes/no) or ordinal (a smallnumber of categories that can be ranked from high to low) outcome measure while simultaneouslyadjusting for other factors (dichotomous, ordinal and continuous) to ensure that estimates of seatbelt effectiveness or helmet effectiveness were independent of other factors (covariates).
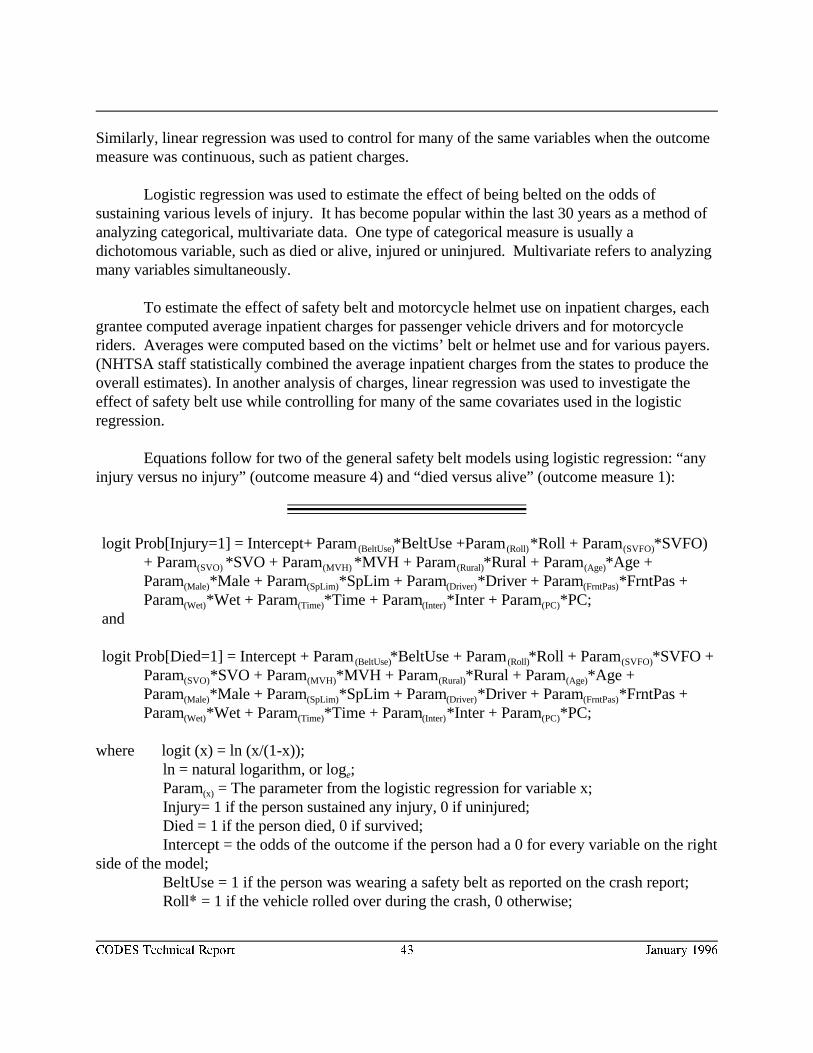
CODES Technical Report 43 January 1996
Similarly, linear regression was used to control for many of the same variables when the outcomemeasure was continuous, such as patient charges.
Logistic regression was used to estimate the effect of being belted on the odds ofsustaining various levels of injury. It has become popular within the last 30 years as a method ofanalyzing categorical, multivariate data. One type of categorical measure is usually adichotomous variable, such as died or alive, injured or uninjured. Multivariate refers to analyzingmany variables simultaneously.
To estimate the effect of safety belt and motorcycle helmet use on inpatient charges, eachgrantee computed average inpatient charges for passenger vehicle drivers and for motorcycleriders. Averages were computed based on the victims’ belt or helmet use and for various payers. (NHTSA staff statistically combined the average inpatient charges from the states to produce theoverall estimates). In another analysis of charges, linear regression was used to investigate theeffect of safety belt use while controlling for many of the same covariates used in the logisticregression.
Equations follow for two of the general safety belt models using logistic regression: “anyinjury versus no injury” (outcome measure 4) and “died versus alive” (outcome measure 1):
logit Prob[Injury=1] = Intercept+ Param *BeltUse +Param *Roll + Param *SVFO)(BeltUse) (Roll) (SVFO)
+ Param *SVO + Param *MVH + Param *Rural + Param *Age +(SVO) (MVH) (Rural) (Age)
Param *Male + Param *SpLim + Param *Driver + Param *FrntPas +(Male) (SpLim) (Driver) (FrntPas)
Param *Wet + Param *Time + Param *Inter + Param *PC;(Wet) (Time) (Inter) (PC)
and
logit Prob[Died=1] = Intercept + Param *BeltUse + Param *Roll + Param *SVFO +(BeltUse) (Roll) (SVFO)
Param *SVO + Param *MVH + Param *Rural + Param *Age +(SVO) (MVH) (Rural) (Age)
Param *Male + Param *SpLim + Param *Driver + Param *FrntPas +(Male) (SpLim) (Driver) (FrntPas)
Param *Wet + Param *Time + Param *Inter + Param *PC;(Wet) (Time) (Inter) (PC)
where logit (x) = ln (x/(1-x));ln = natural logarithm, or log ;e
Param = The parameter from the logistic regression for variable x;(x)
Injury= 1 if the person sustained any injury, 0 if uninjured;Died = 1 if the person died, 0 if survived;Intercept = the odds of the outcome if the person had a 0 for every variable on the right
side of the model;BeltUse = 1 if the person was wearing a safety belt as reported on the crash report;Roll = 1 if the vehicle rolled over during the crash, 0 otherwise;
CODES Technical Report 44 January 1996
SVFO = 1 if no roll-over occurred and it was a single-vehicle crash and the vehiclestruck a fixed object (anything from a bush to a bridge abutment, but most often a tree, pole, orsign), 0 otherwise;
SVO = 1 if no roll-over occurred and it was a single-vehicle crash and the vehiclestruck a non-fixed object (anything from an animal or pedestrian to a parked car or locomotive), 0 otherwise;
MVH = 1 if no roll-over occurred and it was a multiple-vehicle crash and the twovehicles collided head-on, 0 otherwise;
Rural = 1 if crash occurred in a rural area, 0 if in an urban area;Age = the age of occupant in years;Male = 1 if occupant was a male, 0 if a female;SpLim = the posted speed limit at the crash location;Driver = 1 if occupant was a driver, 0 otherwise;FrntPas = 1 if occupant was a front seat passenger, 0 otherwise;Wet = 1 if roadway was slippery for any reason, 0 if dry;Time = 1 if crash occurred between 8:00 pm and 3:59 am (Heavy drinking hours), 0 if
it occurred between 4:00 am and 7:59 pm;Inter = 1 if crash occurred at an intersection, 0 otherwise;PC = 1 if vehicle was a passenger car, 0 if it was a light truck or van (Heavy trucks
and buses not included in any analyses, motorcycles included only in the helmet analyses).
The four crash-type variables (Roll, SVFO, SVO, and MVH) use non-head-on multiple-vehiclecrashes as a reference group, e.g. the 0 group. For all states, this was also the largest crash type. Likewise, the two seating variables (Driver and FrntPas) use back-seat passengers as a referencegroup. Unlike the crash-type reference group, this reference group was usually the smallest of theseating position groups.
Exhibit 25 shows the differences between odds ratios and relative risk (from whicheffectiveness is derived). The data are fictitious, and only look at belt use and two outcomemeasures (“died versus survived” and “any injury versus no injury”). For simplicity’s sake theother independent variables (contributing factors/covariates) are ignored.
Note that in the “Any Injury” column, the Odds Ratio is smaller than Relative Risk. This is true whenever relative risk is less than one, even though the difference in the “Mortality”column is so small it is less than rounding error. If (A) is very small relative to (B), and (C) isvery small relative to (D), the Odds Ratio will be very close to the Relative Risk.
Effectiveness can be interpreted as an effect on the unsafe condition: For the mortalityfigures, “About 90 percent of the unbelted drivers would have survived had they been wearing asafety belt. In this situation, ninety-two lives could have been saved.” (88.5% * 104 = 92). For
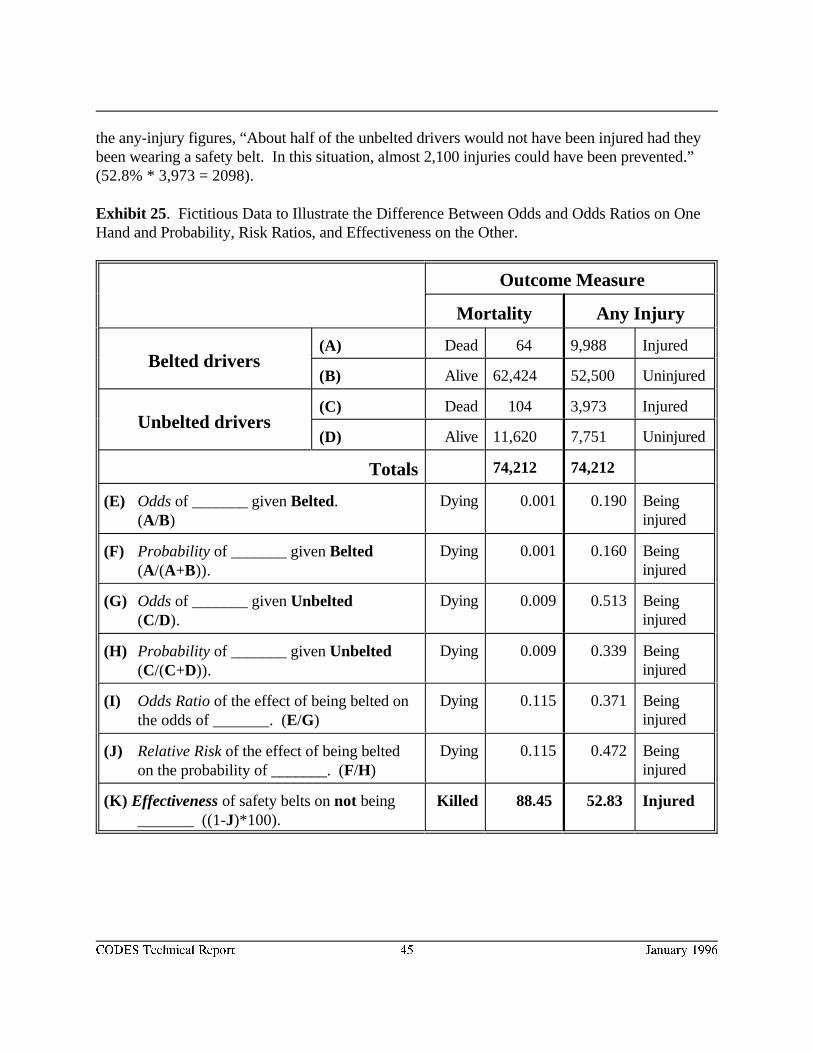
CODES Technical Report 45 January 1996
the any-injury figures, “About half of the unbelted drivers would not have been injured had theybeen wearing a safety belt. In this situation, almost 2,100 injuries could have been prevented.”(52.8% * 3,973 = 2098).
Exhibit 25. Fictitious Data to Illustrate the Difference Between Odds and Odds Ratios on OneHand and Probability, Risk Ratios, and Effectiveness on the Other.
Outcome Measure
Mortality Any Injury
Belted drivers(A) Dead 64 9,988 Injured
(B) Alive 62,424 52,500 Uninjured
Unbelted drivers(C) Dead 104 3,973 Injured
(D) Alive 11,620 7,751 Uninjured
Totals 74,212 74,212
(E) Odds of _______ given Belted. (A/B)
Dying 0.001 0.190 Beinginjured
(F) Probability of _______ given Belted(A/(A+B)).
Dying 0.001 0.160 Beinginjured
(G) Odds of _______ given Unbelted (C/D).
Dying 0.009 0.513 Beinginjured
(H) Probability of _______ given Unbelted (C/(C+D)).
Dying 0.009 0.339 Beinginjured
(I) Odds Ratio of the effect of being belted on the odds of _______. (E/G)
Dying 0.115 0.371 Beinginjured
(J) Relative Risk of the effect of being belted on the probability of _______. (F/H)
Dying 0.115 0.472 Beinginjured
(K) Effectiveness of safety belts on not being Killed 88.45 52.83 Injured_______ ((1-J)*100).
CODES Technical Report 46 January 1996
RESULTS--BENEFITS OF SAFETY BELTS
Odds Ratios
NHTSA has completed many analyses of the effectiveness of safety belts. Based on thesestudies NHTSA believes that the effectiveness of safety belts is in the range of 40-50 percent forpreventing death and in the range of 45-55 percent for preventing injury. These estimates are notentirely consistent with those produced from the CODES analyses, and NHTSA believes that theCODES results may be inflated by over-reporting of belt use on the police crash reports. Thelatter means estimates of “percentage belted” from police reports are always much higher thanestimates from independent observers of safety belt use, an indication that people put themselvesin a favorable light, even in Maine, where adults did not have to wear safety belts. Such adirectional misclassification has the effect of artificially magnifying the effectiveness of safetybelts.
The benefits of safety belts are presented below, by injury level and state, as odds ratios(Exhibits 26-34), and then as effectiveness rates (Exhibits 34 and 37). The odds ratios have beenstatistically adjusted for all the control variables listed in Exhibit 24, and thus should beindependent of those variables. However, they have not been adjusted for the “over-reportingfactor.”
Another interpretation issue arises from the computation of the weighted averages . The8
odds ratios themselves were not averaged, rather their natural logarithms, weighted by theirstandard errors, were averaged. The parameters and their standard errors were taken from thestates’ logistic regressions. For each state, the reciprocal of the square of the standard error ofthe belt parameter became the weight. These were summed to become the denominator of theweighted average. Each state’s belt parameter was multiplied by the weight, and these productswere summed to become the numerator of the weighted average. Because the standard errors arestrongly influenced by the number of cases, larger states disproportionately influenced theweighted averages. For example, in the fatality analysis, New York and Pennsylvania contributed57 percent of the numerator and 58 percent of the denominator for the weighted average.
However, this method of weighting the averages has the advantage of yielding a test ofhomogeneity (how well the states agreed with each other) and a test of association (whether theassociation between injury level and safety belt use was significant over all the states). All thetests of homogeneity failed, which meant there were significant differences among some of thestates, not withstanding the large overlaps in their standard errors. These differences becamesmaller as the outcome measure concentrated on more serious injuries, but there were stillsignificant differences at the “died/survived” level. This conveys the misleading conclusion thatsafety belts are more effective in Wisconsin than in Maine. Future investigations will attempt tofind the factors accounting for these differences. In the mean time, it should be stressed that all
CODES Technical Report 47 January 1996
safety-belt odds ratios from all states agree that safety belts are highly effective at all analysislevels. It is also felt that the weighted averages are the best estimates of the overall effects.However, one possible interpretation of the differences among the states is that the standarderrors of the weighted averages are far too small, and should be ignored.
DIED
The best odds ratio (for drivers only) was 0.076 (Hawaii). This means the driver's odds ofdying, given a police-reported crash occurred and the safety belt was not worn, were 13.2 timesthe odds of dying if the safety belt was worn. The odds ratio for not wearing a safety belt is thereciprocal of the odds ratio for wearing a safety belt: 1/0.076 = 13.2. See Exhibit 26. The leastfavorable odds ratio in the same situation was 0.257 (Maine). This translates to 3.9 times higherodds if the belt is not worn. Note that even the “least favorable” odds ratio is a highly significantsafety effect. Note also that the confidence intervals for even the most extreme state, Maine,overlap with Utah. A combined estimate for drivers from all the states is an odds ratio of 0.107. This translates to the odds of dying being 9.4 times higher if a safety belt was not worn (see therightmost I-beam in Exhibit 26). It must be stressed, for Exhibits 26-33, that the weightedaverage is not as precise as suggested by its confidence intervals. This is due to differing errorbars among the states. For example, compare the length of the confidence interval in Maine tothat in New York. This is to be expected, since the variance is strongly influenced by the samplesize, and the largest state has roughly eight times as many drivers as the smallest state. Nevertheless, the states are remarkably consistent.
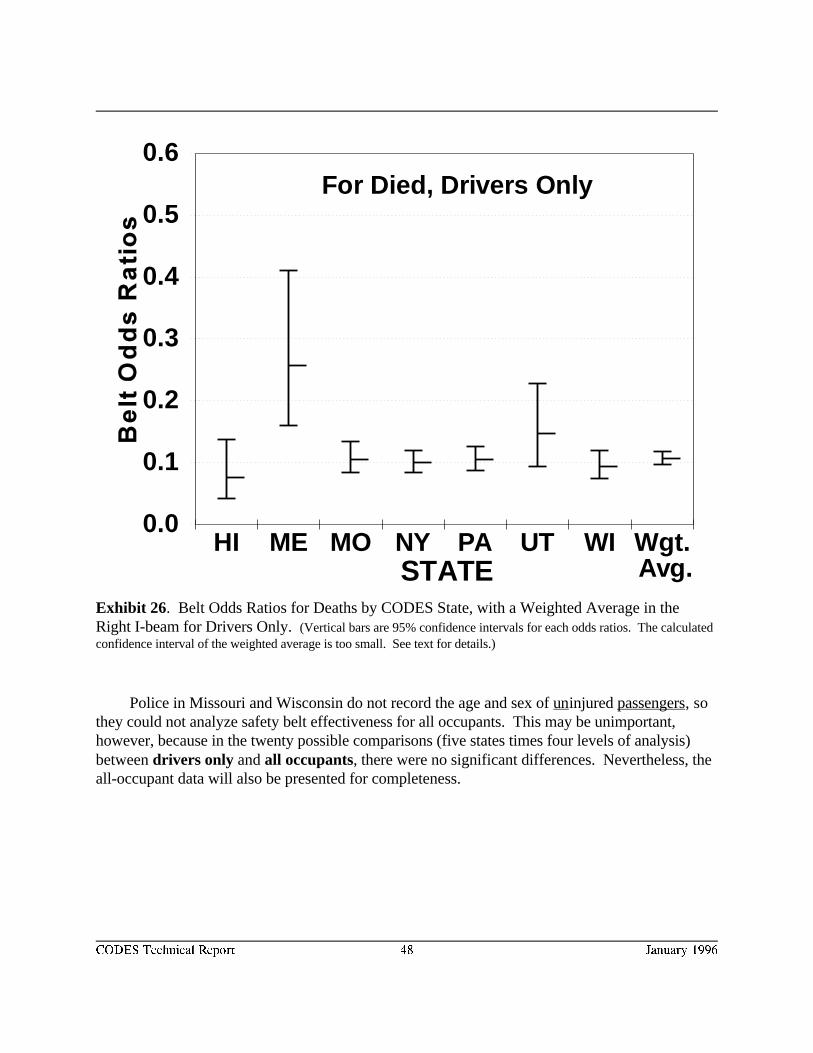
0.0
0.1
0.2
0.3
0.4
0.5
0.6
HI ME MO NY PA UT WI Wgt.STATE Avg.
For Died, Drivers Only
CODES Technical Report 48 January 1996
Exhibit 26. Belt Odds Ratios for Deaths by CODES State, with a Weighted Average in theRight I-beam for Drivers Only. (Vertical bars are 95% confidence intervals for each odds ratios. The calculatedconfidence interval of the weighted average is too small. See text for details.)
Police in Missouri and Wisconsin do not record the age and sex of uninjured passengers, sothey could not analyze safety belt effectiveness for all occupants. This may be unimportant,however, because in the twenty possible comparisons (five states times four levels of analysis)between drivers only and all occupants, there were no significant differences. Nevertheless, theall-occupant data will also be presented for completeness.
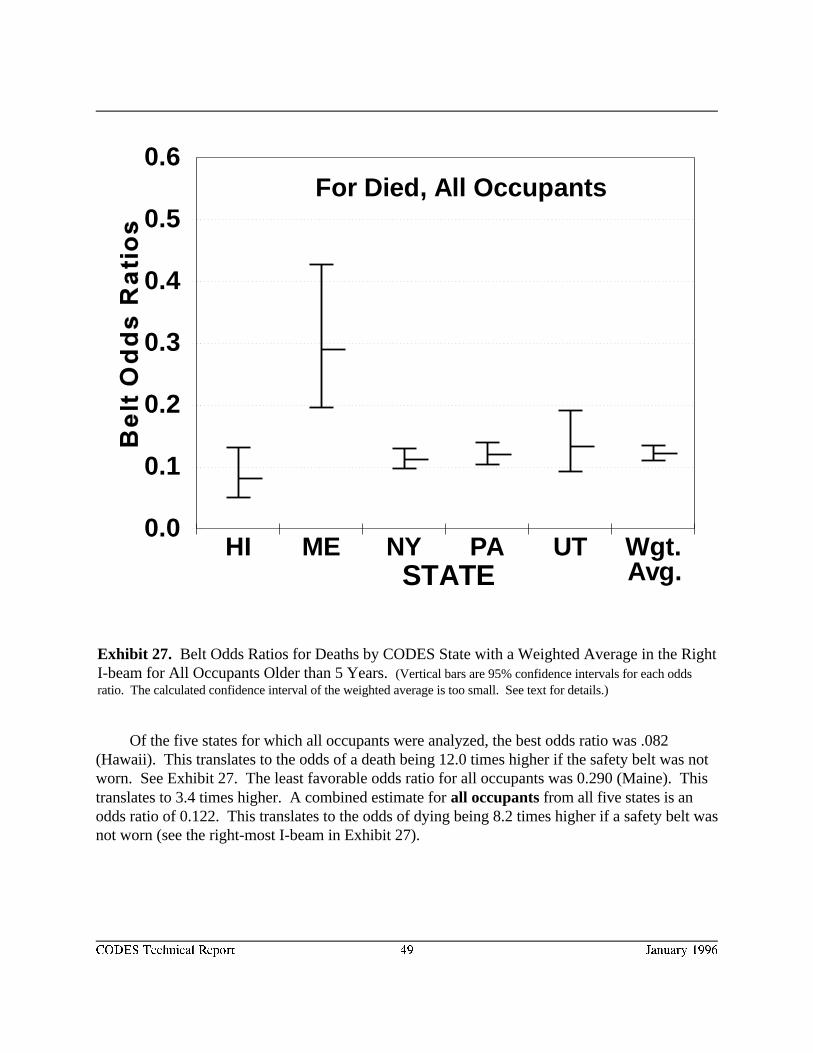
0.0
0.1
0.2
0.3
0.4
0.5
0.6
HI ME NY PA UT Wgt.STATE Avg.
For Died, All Occupants
CODES Technical Report 49 January 1996
Exhibit 27. Belt Odds Ratios for Deaths by CODES State with a Weighted Average in the RightI-beam for All Occupants Older than 5 Years. (Vertical bars are 95% confidence intervals for each oddsratio. The calculated confidence interval of the weighted average is too small. See text for details.)
Of the five states for which all occupants were analyzed, the best odds ratio was .082(Hawaii). This translates to the odds of a death being 12.0 times higher if the safety belt was notworn. See Exhibit 27. The least favorable odds ratio for all occupants was 0.290 (Maine). Thistranslates to 3.4 times higher. A combined estimate for all occupants from all five states is anodds ratio of 0.122. This translates to the odds of dying being 8.2 times higher if a safety belt wasnot worn (see the right-most I-beam in Exhibit 27).
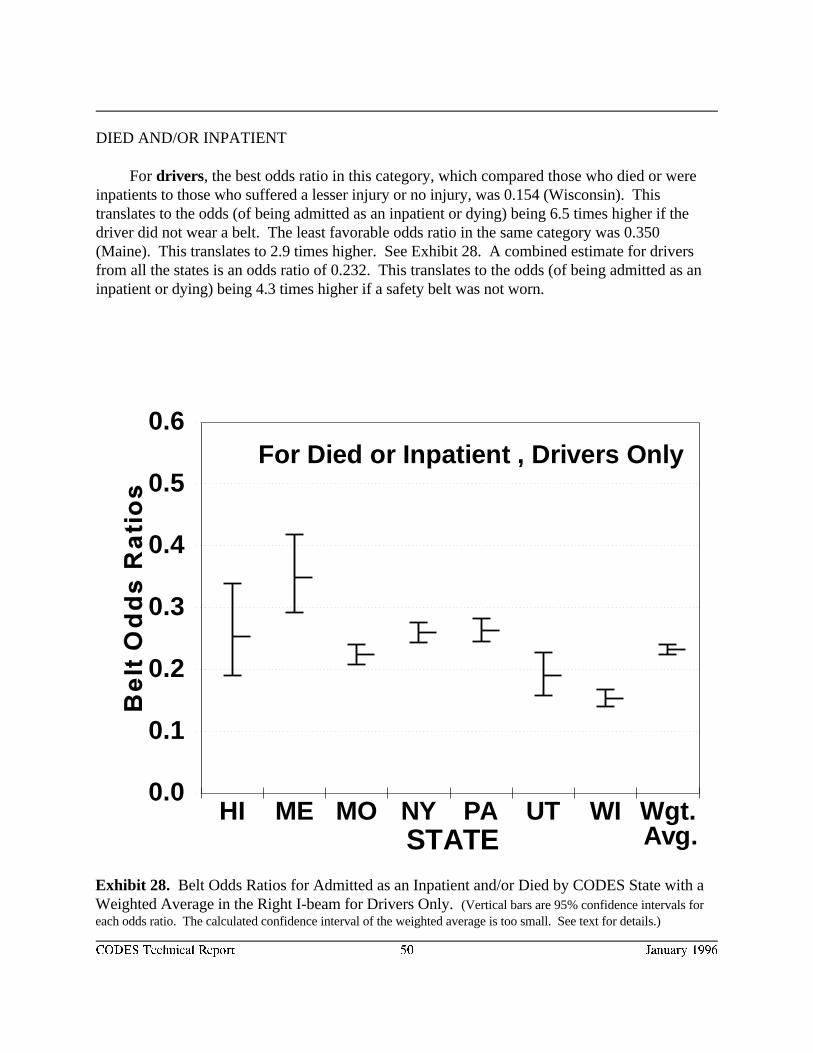
0.0
0.1
0.2
0.3
0.4
0.5
0.6
HI ME MO NY PA UT WI Wgt.STATE Avg.
For Died or Inpatient , Drivers Only
CODES Technical Report 50 January 1996
Exhibit 28. Belt Odds Ratios for Admitted as an Inpatient and/or Died by CODES State with aWeighted Average in the Right I-beam for Drivers Only. (Vertical bars are 95% confidence intervals foreach odds ratio. The calculated confidence interval of the weighted average is too small. See text for details.)
DIED AND/OR INPATIENT
For drivers, the best odds ratio in this category, which compared those who died or wereinpatients to those who suffered a lesser injury or no injury, was 0.154 (Wisconsin). Thistranslates to the odds (of being admitted as an inpatient or dying) being 6.5 times higher if thedriver did not wear a belt. The least favorable odds ratio in the same category was 0.350(Maine). This translates to 2.9 times higher. See Exhibit 28. A combined estimate for driversfrom all the states is an odds ratio of 0.232. This translates to the odds (of being admitted as aninpatient or dying) being 4.3 times higher if a safety belt was not worn.
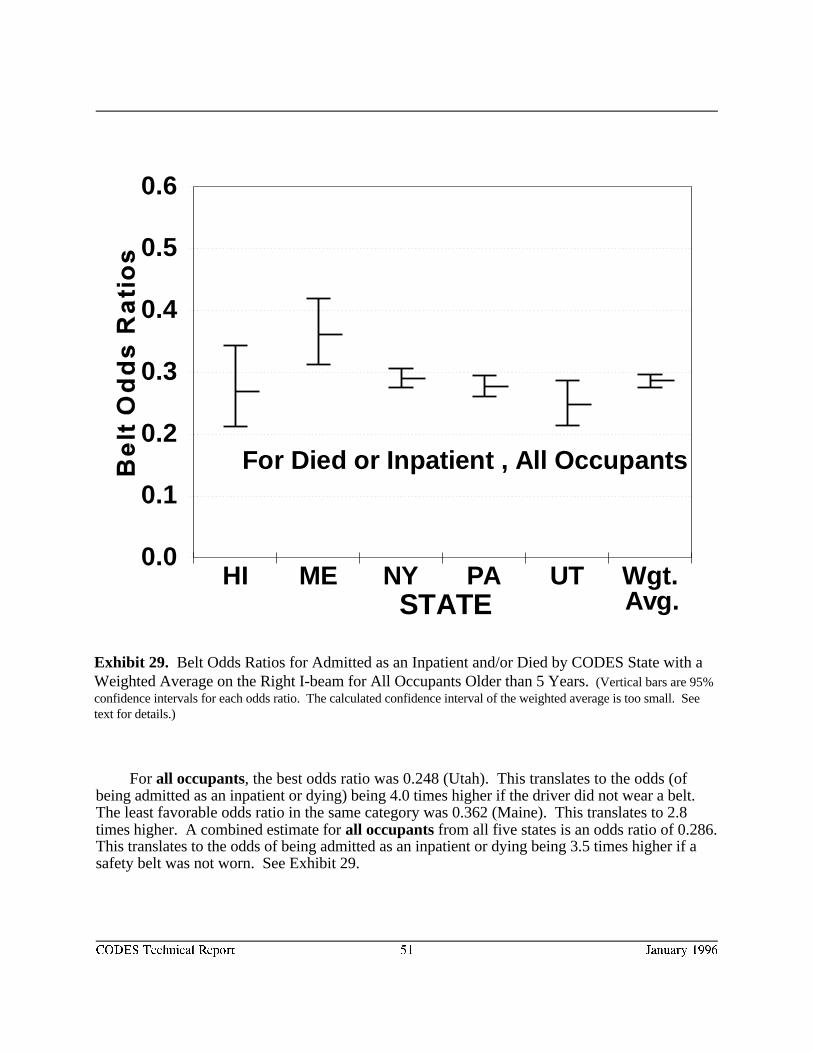
0.0
0.1
0.2
0.3
0.4
0.5
0.6
HI ME NY PA UT Wgt.STATE Avg.
For Died or Inpatient , All Occupants
CODES Technical Report 51 January 1996
Exhibit 29. Belt Odds Ratios for Admitted as an Inpatient and/or Died by CODES State with aWeighted Average on the Right I-beam for All Occupants Older than 5 Years. (Vertical bars are 95%confidence intervals for each odds ratio. The calculated confidence interval of the weighted average is too small. Seetext for details.)
For all occupants, the best odds ratio was 0.248 (Utah). This translates to the odds (ofbeing admitted as an inpatient or dying) being 4.0 times higher if the driver did not wear a belt. The least favorable odds ratio in the same category was 0.362 (Maine). This translates to 2.8times higher. A combined estimate for all occupants from all five states is an odds ratio of 0.286. This translates to the odds of being admitted as an inpatient or dying being 3.5 times higher if asafety belt was not worn. See Exhibit 29.
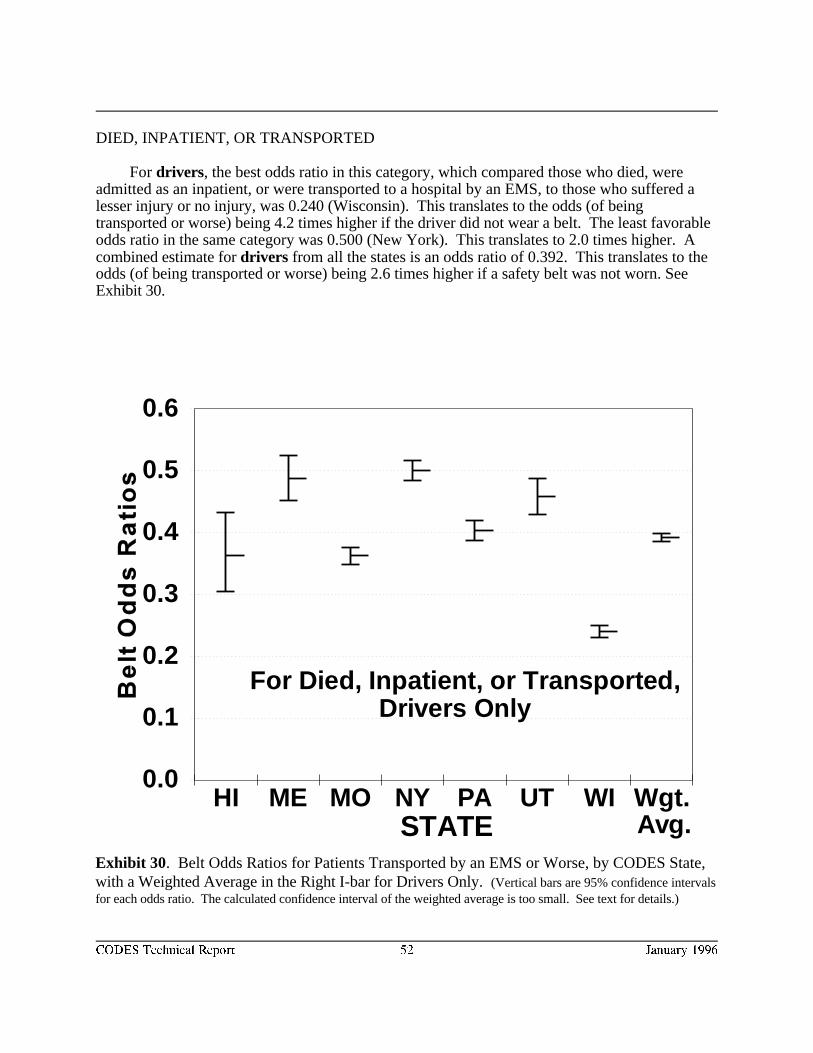
0.0
0.1
0.2
0.3
0.4
0.5
0.6
HI ME MO NY PA UT WI Wgt.STATE Avg.
For Died, Inpatient, or Transported, Drivers Only
CODES Technical Report 52 January 1996
Exhibit 30. Belt Odds Ratios for Patients Transported by an EMS or Worse, by CODES State,with a Weighted Average in the Right I-bar for Drivers Only. (Vertical bars are 95% confidence intervalsfor each odds ratio. The calculated confidence interval of the weighted average is too small. See text for details.)
DIED, INPATIENT, OR TRANSPORTED
For drivers, the best odds ratio in this category, which compared those who died, wereadmitted as an inpatient, or were transported to a hospital by an EMS, to those who suffered alesser injury or no injury, was 0.240 (Wisconsin). This translates to the odds (of beingtransported or worse) being 4.2 times higher if the driver did not wear a belt. The least favorableodds ratio in the same category was 0.500 (New York). This translates to 2.0 times higher. Acombined estimate for drivers from all the states is an odds ratio of 0.392. This translates to theodds (of being transported or worse) being 2.6 times higher if a safety belt was not worn. SeeExhibit 30.
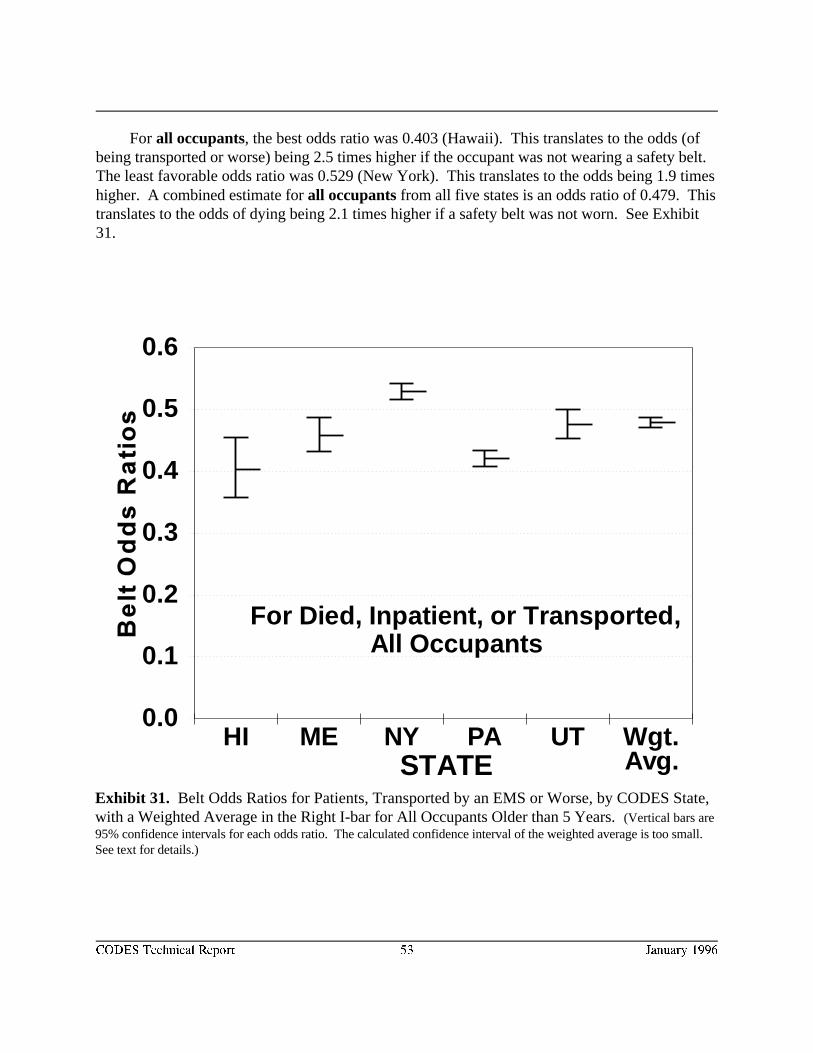
0.0
0.1
0.2
0.3
0.4
0.5
0.6
HI ME NY PA UT Wgt.STATE Avg.
For Died, Inpatient, or Transported, All Occupants
CODES Technical Report 53 January 1996
Exhibit 31. Belt Odds Ratios for Patients, Transported by an EMS or Worse, by CODES State,with a Weighted Average in the Right I-bar for All Occupants Older than 5 Years. (Vertical bars are95% confidence intervals for each odds ratio. The calculated confidence interval of the weighted average is too small. See text for details.)
For all occupants, the best odds ratio was 0.403 (Hawaii). This translates to the odds (ofbeing transported or worse) being 2.5 times higher if the occupant was not wearing a safety belt. The least favorable odds ratio was 0.529 (New York). This translates to the odds being 1.9 timeshigher. A combined estimate for all occupants from all five states is an odds ratio of 0.479. Thistranslates to the odds of dying being 2.1 times higher if a safety belt was not worn. See Exhibit31.
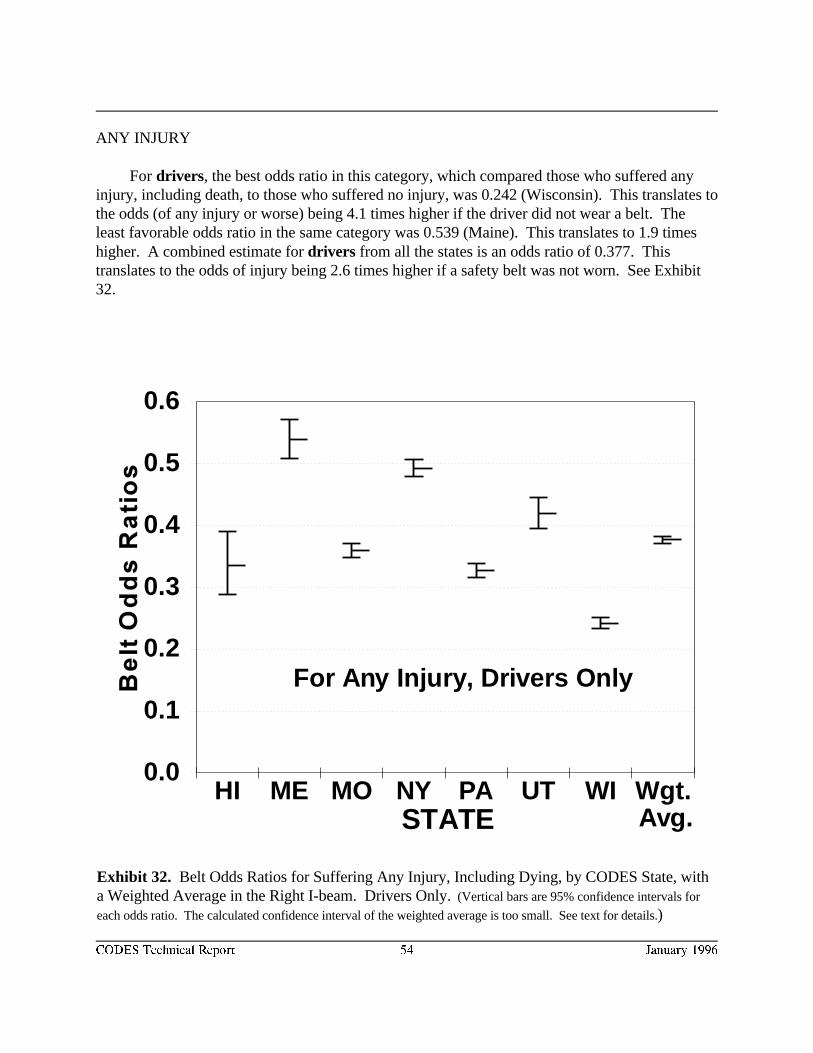
0.0
0.1
0.2
0.3
0.4
0.5
0.6
HI ME MO NY PA UT WI Wgt.STATE Avg.
For Any Injury, Drivers Only
CODES Technical Report 54 January 1996
Exhibit 32. Belt Odds Ratios for Suffering Any Injury, Including Dying, by CODES State, witha Weighted Average in the Right I-beam. Drivers Only. (Vertical bars are 95% confidence intervals for
each odds ratio. The calculated confidence interval of the weighted average is too small. See text for details.)
ANY INJURY
For drivers, the best odds ratio in this category, which compared those who suffered anyinjury, including death, to those who suffered no injury, was 0.242 (Wisconsin). This translates tothe odds (of any injury or worse) being 4.1 times higher if the driver did not wear a belt. Theleast favorable odds ratio in the same category was 0.539 (Maine). This translates to 1.9 timeshigher. A combined estimate for drivers from all the states is an odds ratio of 0.377. Thistranslates to the odds of injury being 2.6 times higher if a safety belt was not worn. See Exhibit32.
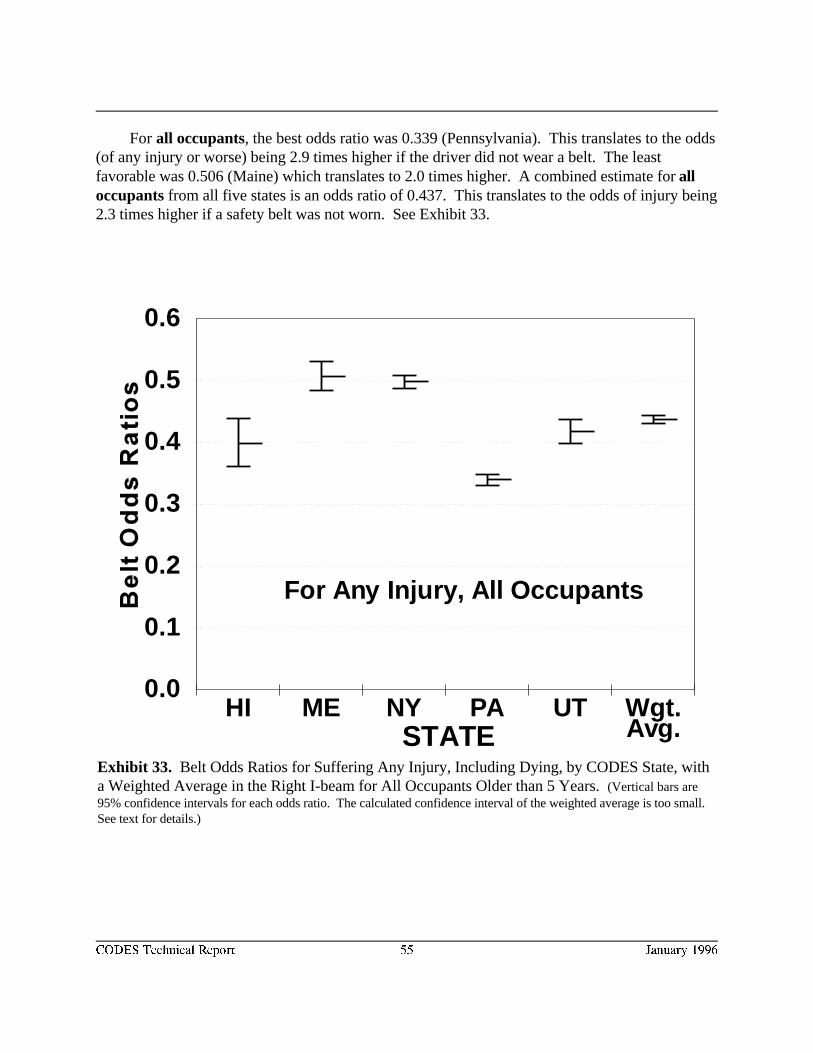
0.0
0.1
0.2
0.3
0.4
0.5
0.6
HI ME NY PA UT Wgt.STATE Avg.
For Any Injury, All Occupants
CODES Technical Report 55 January 1996
Exhibit 33. Belt Odds Ratios for Suffering Any Injury, Including Dying, by CODES State, witha Weighted Average in the Right I-beam for All Occupants Older than 5 Years. (Vertical bars are95% confidence intervals for each odds ratio. The calculated confidence interval of the weighted average is too small. See text for details.)
For all occupants, the best odds ratio was 0.339 (Pennsylvania). This translates to the odds(of any injury or worse) being 2.9 times higher if the driver did not wear a belt. The leastfavorable was 0.506 (Maine) which translates to 2.0 times higher. A combined estimate for alloccupants from all five states is an odds ratio of 0.437. This translates to the odds of injury being2.3 times higher if a safety belt was not worn. See Exhibit 33.

CODES Technical Report 56 January 1996
Effectiveness
Effectiveness ratings cannot be directly computed from odds ratios, although if theprobabilities of a positive response (e.g., dying) are very small, the computed odds ratio is almostidentical to relative risk, and 1 - relative risk = effectiveness. However, that is the exception.Generally, relative risk is closer to one than its corresponding odds ratio if there is a significant safety effect. (An odds ratio or relative risk of one indicates neutrality.) Thus, for safety belts,effectiveness ratings are lower than what might be expected from the odds ratios.
Nevertheless, effectiveness ratings are very useful because they have become standard inNHTSA reports. Moreover, they lead to the following interpretation: “This means that X percentof the unbelted drivers would have survived had they been wearing their safety belt,” a conceptunderstood by the lay-person. Therefore, the following algorithm, expanded in Appendix A, wasused to compute approximations of them:
PROC LOGISTIC wrote the predicted probability for each case (along with many9
other variables) to an output file. Then a DATA step computed the logit of the estimatedprobability, and if the occupant was belted, subtracted the parameter (beta-weight) for beltuse. This gave the logit of each occupant’s “unbelted” probability. Also, if the occupantwas not belted, it added the parameter (beta-weight) for belt use, resulting in the logit of theoccupant's “belted” probability. Then it computed the exponents of both logits, giving thepredicted probabilities in both situations. Then PROC MEANS computed the means of9
these probabilities. These means represent the population probabilities of a positiveresponse (e.g., dying), adjusted for the covariates (other independent variables) in the model. An estimate of the risk ratio was obtained by dividing the mean probability if everyone wasbelted by the mean probability if everyone was not belted. This was done for every state andanalysis level, for drivers only. Fleiss’ procedure (for averaging the odds ratios) gave a8
weighted average of the risk ratios among the states. However, the standard errors from theodds ratios had to be used, because there were no appropriate standard errors from therelative risk computations.
The resulting approximations are listed in Exhibit 34. They show safety belts are effectiveboth in preventing any injury (effectiveness of 52 percent) and in reducing the likelihood of adeath (effectiveness of 89 percent), given involvement in a crash. In reducing the severity ofinjuries, safety belts also are effective. Observe that effectiveness increases as the severity of theoutcome increases. This shows that safety belts have a protective effect-causing a downward shiftin the severity of injury sustained by vehicle occupants when injured in a crash.
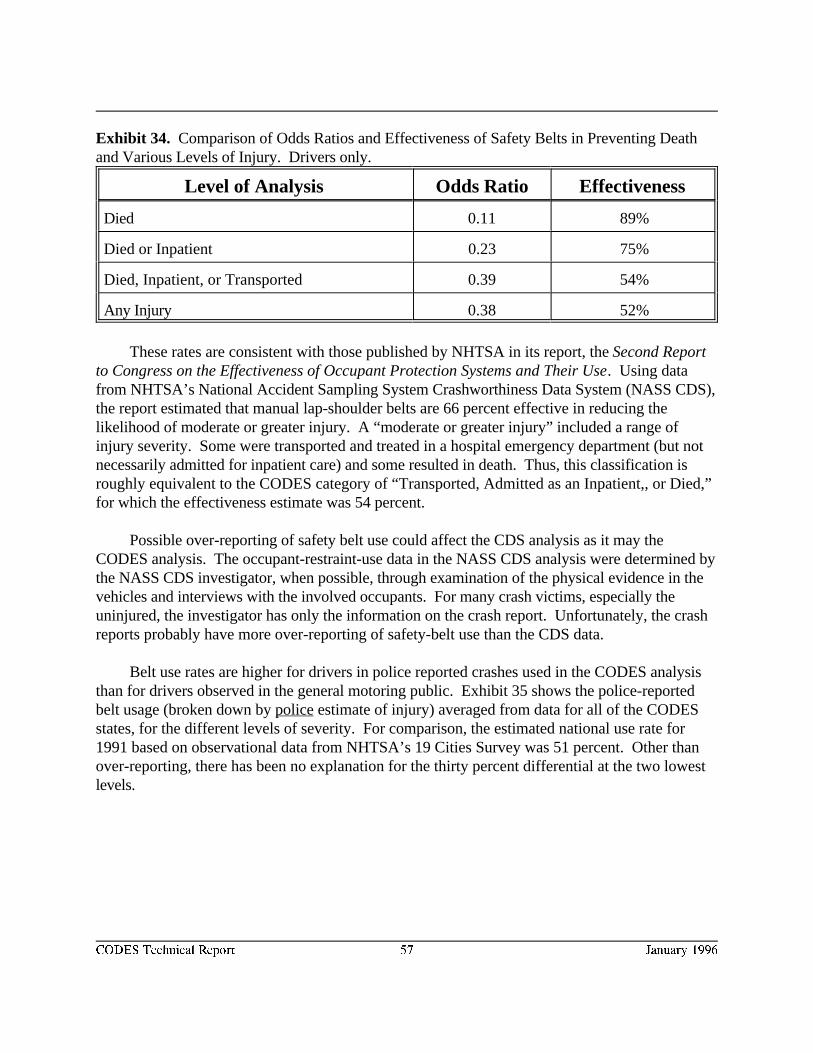
CODES Technical Report 57 January 1996
Exhibit 34. Comparison of Odds Ratios and Effectiveness of Safety Belts in Preventing Deathand Various Levels of Injury. Drivers only.
Level of Analysis Odds Ratio Effectiveness
Died 0.11 89%
Died or Inpatient 0.23 75%
Died, Inpatient, or Transported 0.39 54%
Any Injury 0.38 52%
These rates are consistent with those published by NHTSA in its report, the Second Reportto Congress on the Effectiveness of Occupant Protection Systems and Their Use. Using datafrom NHTSA’s National Accident Sampling System Crashworthiness Data System (NASS CDS),the report estimated that manual lap-shoulder belts are 66 percent effective in reducing thelikelihood of moderate or greater injury. A “moderate or greater injury” included a range ofinjury severity. Some were transported and treated in a hospital emergency department (but notnecessarily admitted for inpatient care) and some resulted in death. Thus, this classification isroughly equivalent to the CODES category of “Transported, Admitted as an Inpatient,, or Died,”for which the effectiveness estimate was 54 percent.
Possible over-reporting of safety belt use could affect the CDS analysis as it may theCODES analysis. The occupant-restraint-use data in the NASS CDS analysis were determined bythe NASS CDS investigator, when possible, through examination of the physical evidence in thevehicles and interviews with the involved occupants. For many crash victims, especially theuninjured, the investigator has only the information on the crash report. Unfortunately, the crashreports probably have more over-reporting of safety-belt use than the CDS data.
Belt use rates are higher for drivers in police reported crashes used in the CODES analysisthan for drivers observed in the general motoring public. Exhibit 35 shows the police-reportedbelt usage (broken down by police estimate of injury) averaged from data for all of the CODESstates, for the different levels of severity. For comparison, the estimated national use rate for1991 based on observational data from NHTSA’s 19 Cities Survey was 51 percent. Other thanover-reporting, there has been no explanation for the thirty percent differential at the two lowestlevels.
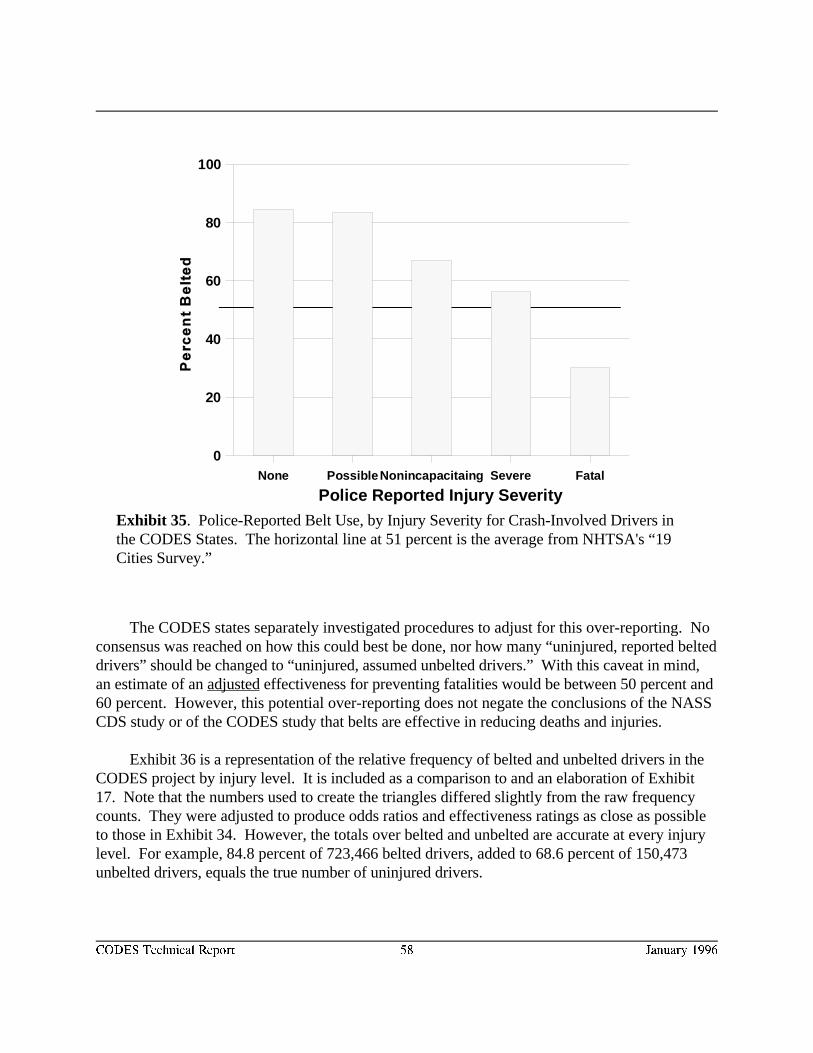
Police Reported Injury SeverityNone Possible Nonincapacitaing Severe Fatal
0
20
40
60
80
100
CODES Technical Report 58 January 1996
Exhibit 35. Police-Reported Belt Use, by Injury Severity for Crash-Involved Drivers inthe CODES States. The horizontal line at 51 percent is the average from NHTSA's “19Cities Survey.”
The CODES states separately investigated procedures to adjust for this over-reporting. Noconsensus was reached on how this could best be done, nor how many “uninjured, reported belteddrivers” should be changed to “uninjured, assumed unbelted drivers.” With this caveat in mind,an estimate of an adjusted effectiveness for preventing fatalities would be between 50 percent and60 percent. However, this potential over-reporting does not negate the conclusions of the NASSCDS study or of the CODES study that belts are effective in reducing deaths and injuries.
Exhibit 36 is a representation of the relative frequency of belted and unbelted drivers in theCODES project by injury level. It is included as a comparison to and an elaboration of Exhibit17. Note that the numbers used to create the triangles differed slightly from the raw frequencycounts. They were adjusted to produce odds ratios and effectiveness ratings as close as possibleto those in Exhibit 34. However, the totals over belted and unbelted are accurate at every injurylevel. For example, 84.8 percent of 723,466 belted drivers, added to 68.6 percent of 150,473unbelted drivers, equals the true number of uninjured drivers.
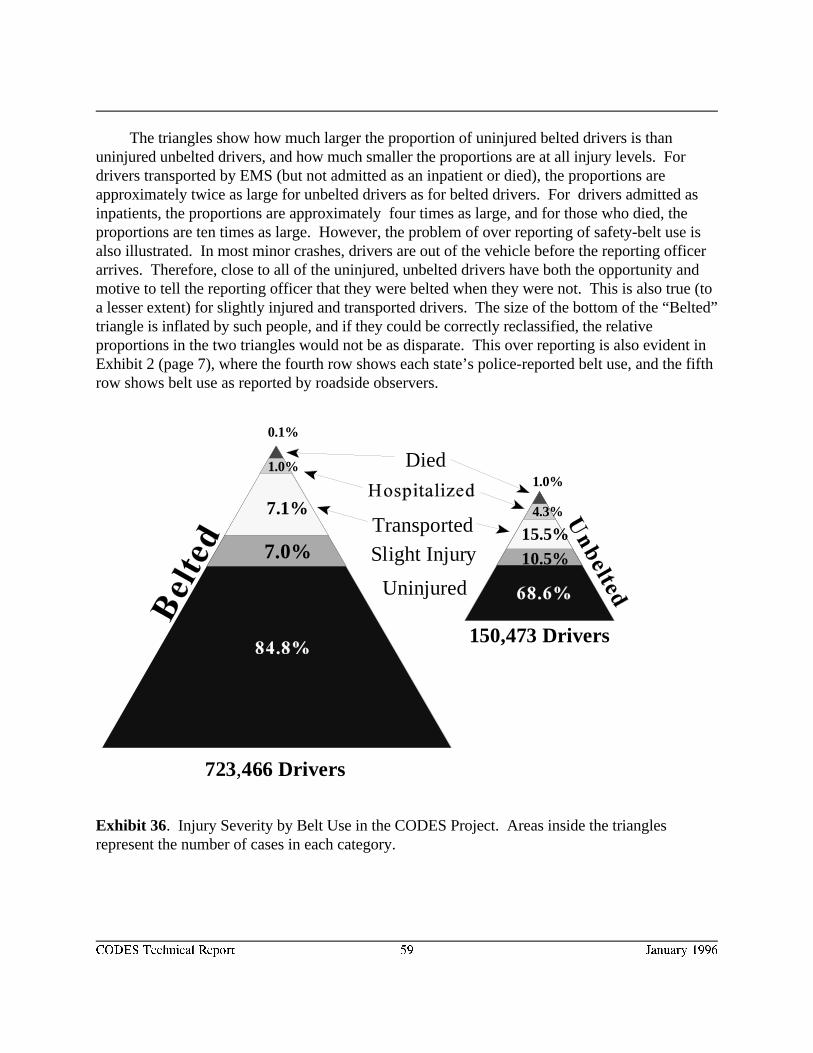
Uninjured
Transported
Slight Injury
Died
7.0%
7.1%
1.0%
0.1%
1.0%
4.3%
15.5%10.5%
723,466 Drivers
150,473 Drivers
CODES Technical Report 59 January 1996
Exhibit 36. Injury Severity by Belt Use in the CODES Project. Areas inside the trianglesrepresent the number of cases in each category.
The triangles show how much larger the proportion of uninjured belted drivers is thanuninjured unbelted drivers, and how much smaller the proportions are at all injury levels. For drivers transported by EMS (but not admitted as an inpatient or died), the proportions areapproximately twice as large for unbelted drivers as for belted drivers. For drivers admitted asinpatients, the proportions are approximately four times as large, and for those who died, theproportions are ten times as large. However, the problem of over reporting of safety-belt use isalso illustrated. In most minor crashes, drivers are out of the vehicle before the reporting officerarrives. Therefore, close to all of the uninjured, unbelted drivers have both the opportunity andmotive to tell the reporting officer that they were belted when they were not. This is also true (toa lesser extent) for slightly injured and transported drivers. The size of the bottom of the “Belted”triangle is inflated by such people, and if they could be correctly reclassified, the relativeproportions in the two triangles would not be as disparate. This over reporting is also evident inExhibit 2 (page 7), where the fourth row shows each state’s police-reported belt use, and the fifthrow shows belt use as reported by roadside observers.
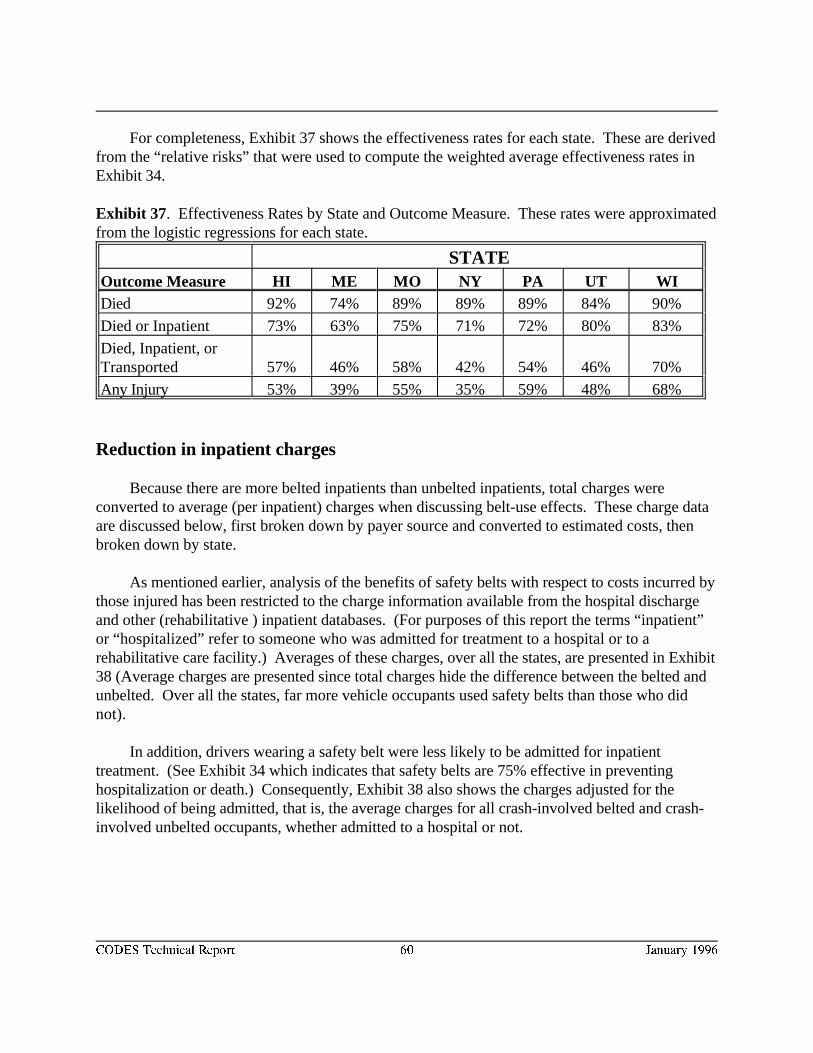
CODES Technical Report 60 January 1996
For completeness, Exhibit 37 shows the effectiveness rates for each state. These are derivedfrom the “relative risks” that were used to compute the weighted average effectiveness rates inExhibit 34.
Exhibit 37. Effectiveness Rates by State and Outcome Measure. These rates were approximatedfrom the logistic regressions for each state.
STATEOutcome Measure HI ME MO NY PA UT WIDied 92% 74% 89% 89% 89% 84% 90%
Died or Inpatient 73% 63% 75% 71% 72% 80% 83%
Died, Inpatient, orTransported 57% 46% 58% 42% 54% 46% 70%
Any Injury 53% 39% 55% 35% 59% 48% 68%
Reduction in inpatient charges
Because there are more belted inpatients than unbelted inpatients, total charges wereconverted to average (per inpatient) charges when discussing belt-use effects. These charge dataare discussed below, first broken down by payer source and converted to estimated costs, thenbroken down by state.
As mentioned earlier, analysis of the benefits of safety belts with respect to costs incurred bythose injured has been restricted to the charge information available from the hospital dischargeand other (rehabilitative ) inpatient databases. (For purposes of this report the terms “inpatient”or “hospitalized” refer to someone who was admitted for treatment to a hospital or to arehabilitative care facility.) Averages of these charges, over all the states, are presented in Exhibit38 (Average charges are presented since total charges hide the difference between the belted andunbelted. Over all the states, far more vehicle occupants used safety belts than those who didnot).
In addition, drivers wearing a safety belt were less likely to be admitted for inpatienttreatment. (See Exhibit 34 which indicates that safety belts are 75% effective in preventinghospitalization or death.) Consequently, Exhibit 38 also shows the charges adjusted for thelikelihood of being admitted, that is, the average charges for all crash-involved belted and crash-involved unbelted occupants, whether admitted to a hospital or not.
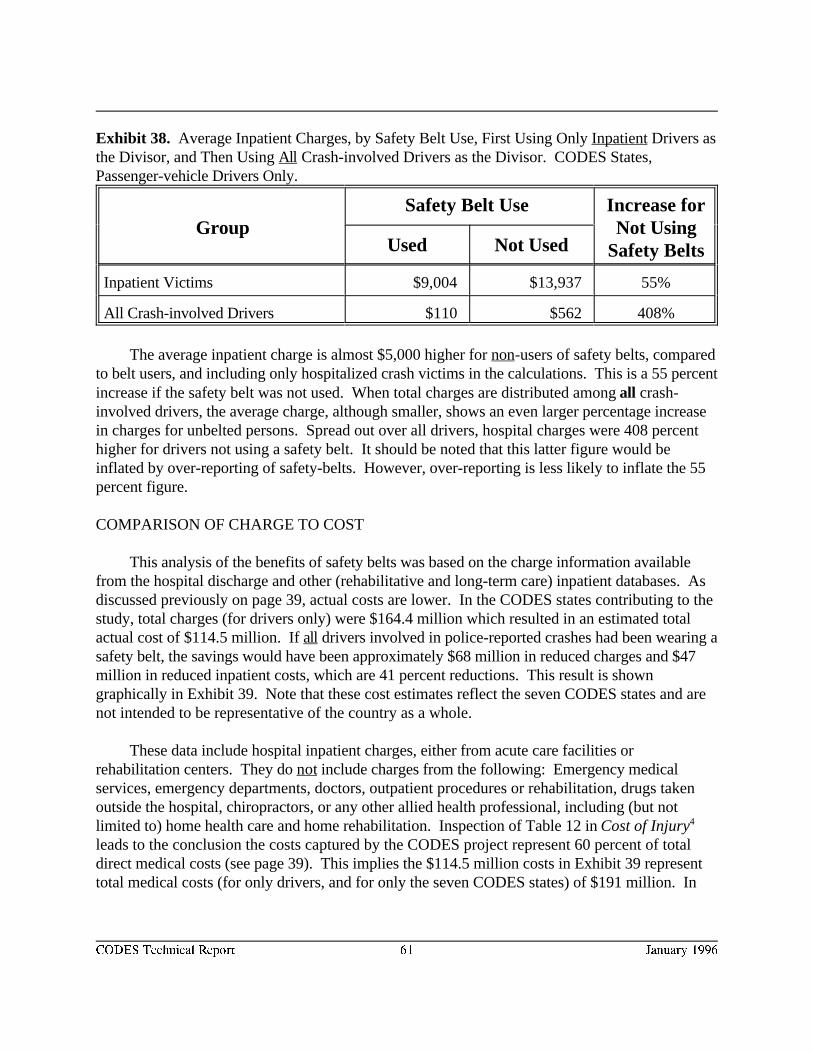
CODES Technical Report 61 January 1996
Exhibit 38. Average Inpatient Charges, by Safety Belt Use, First Using Only Inpatient Drivers asthe Divisor, and Then Using All Crash-involved Drivers as the Divisor. CODES States,Passenger-vehicle Drivers Only.
Group Not UsingSafety Belt Use Increase for
Safety BeltsUsed Not Used
Inpatient Victims $9,004 $13,937 55%
All Crash-involved Drivers $110 $562 408%
The average inpatient charge is almost $5,000 higher for non-users of safety belts, comparedto belt users, and including only hospitalized crash victims in the calculations. This is a 55 percentincrease if the safety belt was not used. When total charges are distributed among all crash-involved drivers, the average charge, although smaller, shows an even larger percentage increasein charges for unbelted persons. Spread out over all drivers, hospital charges were 408 percenthigher for drivers not using a safety belt. It should be noted that this latter figure would beinflated by over-reporting of safety-belts. However, over-reporting is less likely to inflate the 55percent figure.
COMPARISON OF CHARGE TO COST
This analysis of the benefits of safety belts was based on the charge information availablefrom the hospital discharge and other (rehabilitative and long-term care) inpatient databases. Asdiscussed previously on page 39, actual costs are lower. In the CODES states contributing to thestudy, total charges (for drivers only) were $164.4 million which resulted in an estimated totalactual cost of $114.5 million. If all drivers involved in police-reported crashes had been wearing asafety belt, the savings would have been approximately $68 million in reduced charges and $47million in reduced inpatient costs, which are 41 percent reductions. This result is showngraphically in Exhibit 39. Note that these cost estimates reflect the seven CODES states and arenot intended to be representative of the country as a whole.
These data include hospital inpatient charges, either from acute care facilities orrehabilitation centers. They do not include charges from the following: Emergency medicalservices, emergency departments, doctors, outpatient procedures or rehabilitation, drugs takenoutside the hospital, chiropractors, or any other allied health professional, including (but notlimited to) home health care and home rehabilitation. Inspection of Table 12 in Cost of Injury4
leads to the conclusion the costs captured by the CODES project represent 60 percent of totaldirect medical costs (see page 39). This implies the $114.5 million costs in Exhibit 39 representtotal medical costs (for only drivers, and for only the seven CODES states) of $191 million. In
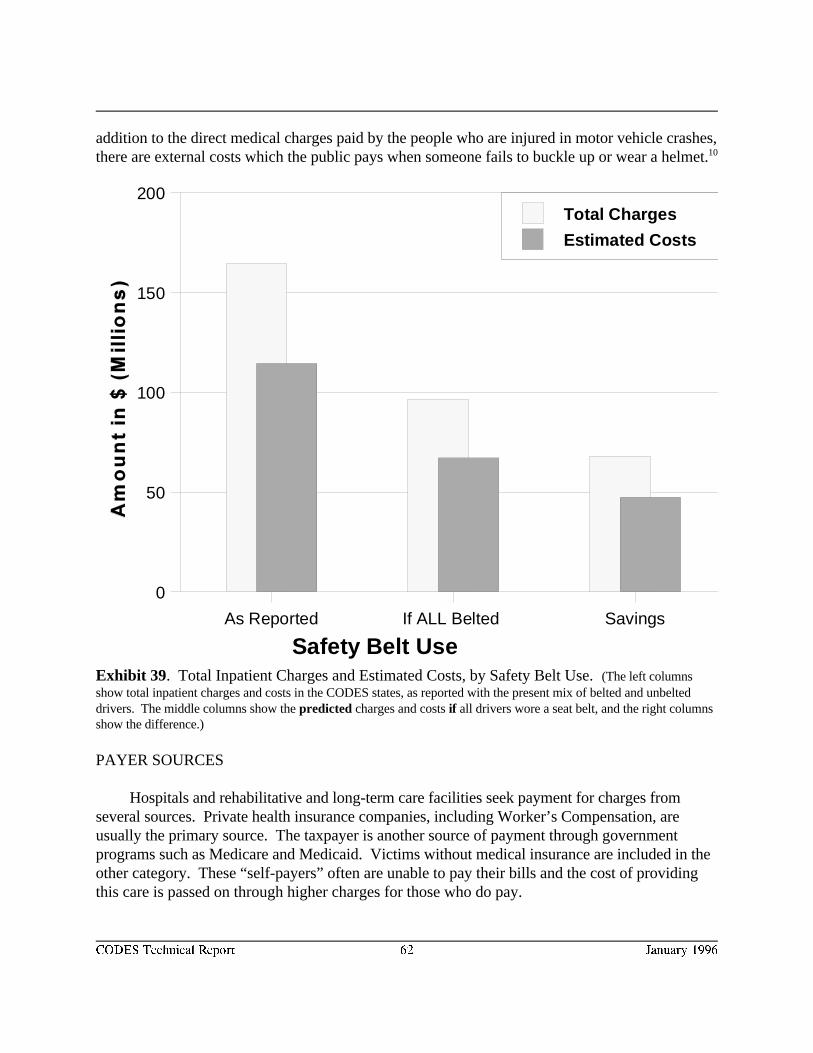
Safety Belt Use As Reported If ALL Belted Savings
0
50
100
150
200Total Charges
Estimated Costs
CODES Technical Report 62 January 1996
addition to the direct medical charges paid by the people who are injured in motor vehicle crashes,there are external costs which the public pays when someone fails to buckle up or wear a helmet.10
Exhibit 39. Total Inpatient Charges and Estimated Costs, by Safety Belt Use. (The left columnsshow total inpatient charges and costs in the CODES states, as reported with the present mix of belted and unbelteddrivers. The middle columns show the predicted charges and costs if all drivers wore a seat belt, and the right columnsshow the difference.)
PAYER SOURCES
Hospitals and rehabilitative and long-term care facilities seek payment for charges fromseveral sources. Private health insurance companies, including Worker’s Compensation, areusually the primary source. The taxpayer is another source of payment through governmentprograms such as Medicare and Medicaid. Victims without medical insurance are included in theother category. These “self-payers” often are unable to pay their bills and the cost of providingthis care is passed on through higher charges for those who do pay.
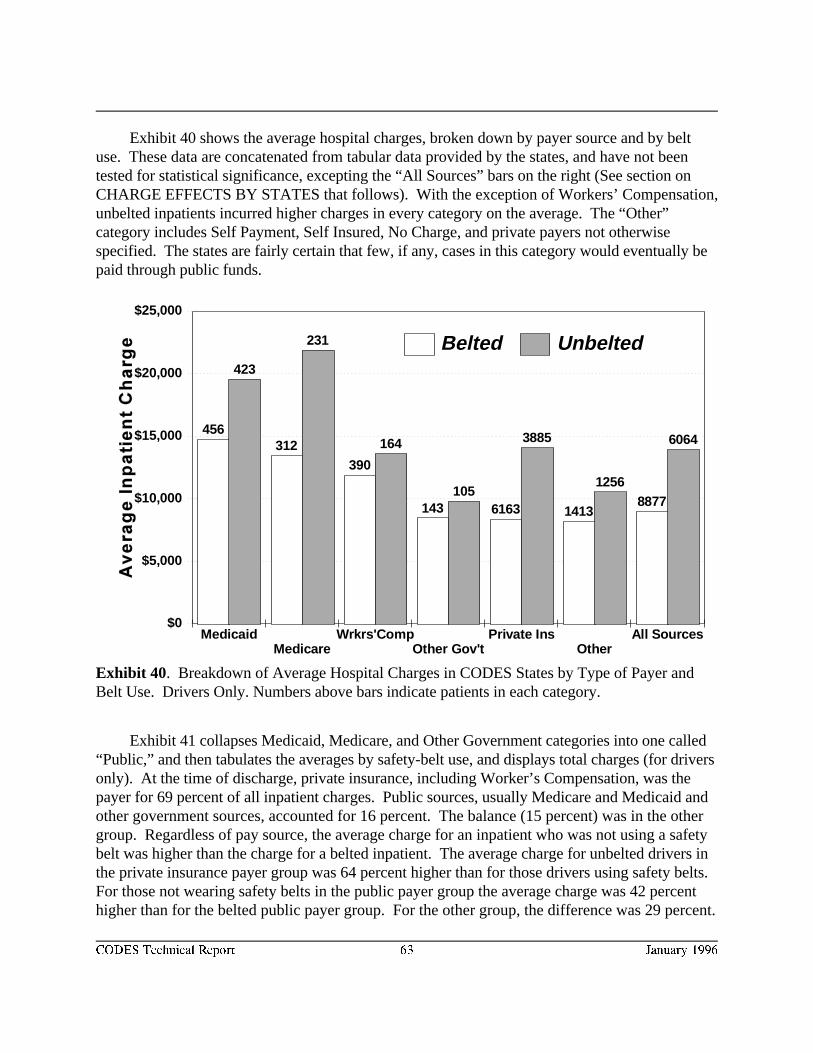
$0
$5,000
$10,000
$15,000
$20,000
$25,000
MedicaidMedicare
Wrkrs'CompOther Gov't
Private InsOther
All Sources
456312
390
143 6163 14138877
423
231
164
105
3885
1256
6064
Belted Unbelted
CODES Technical Report 63 January 1996
Exhibit 40. Breakdown of Average Hospital Charges in CODES States by Type of Payer andBelt Use. Drivers Only. Numbers above bars indicate patients in each category.
Exhibit 40 shows the average hospital charges, broken down by payer source and by beltuse. These data are concatenated from tabular data provided by the states, and have not beentested for statistical significance, excepting the “All Sources” bars on the right (See section onCHARGE EFFECTS BY STATES that follows). With the exception of Workers’ Compensation,unbelted inpatients incurred higher charges in every category on the average. The “Other”category includes Self Payment, Self Insured, No Charge, and private payers not otherwisespecified. The states are fairly certain that few, if any, cases in this category would eventually bepaid through public funds.
Exhibit 41 collapses Medicaid, Medicare, and Other Government categories into one called“Public,” and then tabulates the averages by safety-belt use, and displays total charges (for driversonly). At the time of discharge, private insurance, including Worker’s Compensation, was thepayer for 69 percent of all inpatient charges. Public sources, usually Medicare and Medicaid andother government sources, accounted for 16 percent. The balance (15 percent) was in the othergroup. Regardless of pay source, the average charge for an inpatient who was not using a safetybelt was higher than the charge for a belted inpatient. The average charge for unbelted drivers inthe private insurance payer group was 64 percent higher than for those drivers using safety belts. For those not wearing safety belts in the public payer group the average charge was 42 percenthigher than for the belted public payer group. For the other group, the difference was 29 percent.
CODES Technical Report 64 January 1996
Note that the most severely injured people who become medically needy can apply for Medicaidas a result of their injuries. Therefore, the reader is cautioned not to draw any unwarrantedinferences about higher charges to public payers, a subject that was not studied in this project.
Exhibit 41. Average Inpatient Charge and Total Inpatient Charges by Source of Payment andSafety Belt Use for Crash Involved Drivers in the CODES States.
Source of Safety Belt Use Payment Difference Total
Used Not Used
Public* $13,322 $18,922 $5,600 $26,498,675
Private Insurance** $8,581 $14,058 $5,477 $113,156,421
Other*** $8,180 $10,534 $2,354 $24,788,922
Total All Sources $9,004 $13,937 $4,933 $164,444,018
*Includes all charges to Government Funded Sources including Medicaid, Medicare, etc.**Private Insurance Companies including Worker’s Compensation***Usually Self Payment
CHARGE EFFECTS BY STATE
Each state computed a multiple regression analysis using charges as the dependentvariable, and the same set of independent variables as in the logistic regression analysis (seeExhibit 24). In the four states with larger populations (New York, Missouri, Pennsylvania, andWisconsin), there were significant decreases in the average hospital charge when the patient wasbelted. The smaller states had so few cases that the differences were not statistically significant. Overall, the average hospital charge of a belted driver was 35 percent less than that of an unbelteddriver. See Exhibit 42. The Exhibit shows only the coefficient for safety-belt use, i.e., the effecton the driver's charge if he or she wore a safety belt. The vertical bars, as in previous Exhibits,show the 95 percent confidence interval about the coefficient. If a vertical bar crosses the $0 line,there was no statistically significant effect in that state. If there were sufficient cases, a stateshowed a significant cost savings when the belt was worn, ranging from about $2,500 inPennsylvania to $4,000 in Wisconsin. States with less than 2,000 cases (Hawaii, Maine, andUtah) showed no significant decrease.
The effects from the multiple regression are smaller than the averages presented inprevious paragraphs. Three factors account for the differences. First, the multiple regressionanalysis included nine other factors that can also influence charges. The overall variance ispartitioned among all the variables. Second, the regression analysis includes passengers for five ofthe seven states (Hawaii, Maine, New York, Pennsylvania, and Utah); passengers are generally
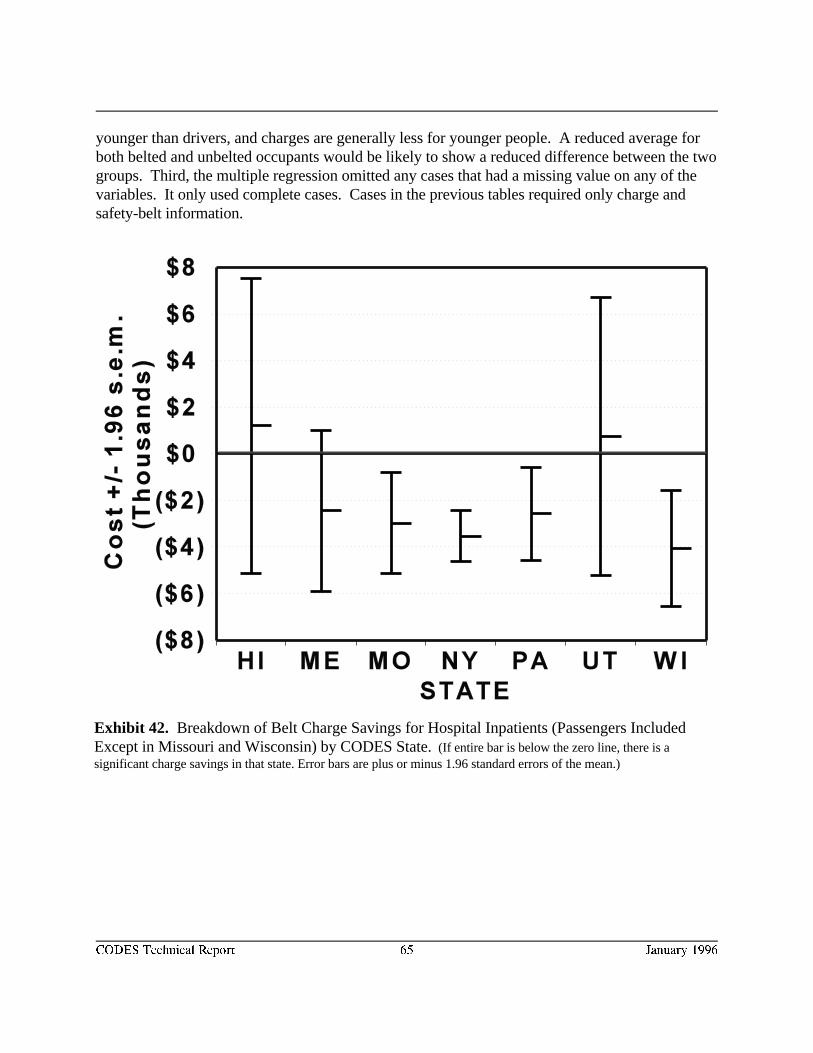
CODES Technical Report 65 January 1996
Exhibit 42. Breakdown of Belt Charge Savings for Hospital Inpatients (Passengers IncludedExcept in Missouri and Wisconsin) by CODES State. (If entire bar is below the zero line, there is asignificant charge savings in that state. Error bars are plus or minus 1.96 standard errors of the mean.)
younger than drivers, and charges are generally less for younger people. A reduced average forboth belted and unbelted occupants would be likely to show a reduced difference between the twogroups. Third, the multiple regression omitted any cases that had a missing value on any of thevariables. It only used complete cases. Cases in the previous tables required only charge andsafety-belt information.
CODES Technical Report 66 January 1996
RESULTS--BENEFITS OF HELMETS
Previous Studies
As with analyses of safety belt effectiveness, NHTSA has conducted and published manyanalyses on the effectiveness of motorcycle helmets in reducing fatalities and injuries. A 1989NHTSA analysis estimated that motorcycle helmets were 29 percent effective against a fatal11
injury. A 1986 NHTSA analysis found that repeal of helmet use laws was associated with an12
estimated 10.4 to 33.3 percent increase in the per crash fatality rate between 1975 and 1984. A1989 report updated this estimate to an increase of 9.9 to 31.1 percent from 1975 to 1988. A13
1994 report estimated that, between 1984 and 1993, motorcycle helmets saved 6,410 lives.14
Odds Ratios
Each of the grantee states computed a logistic regression analysis on motorcycleoccupants involved in traffic crashes. This was analogous to the logistic regression for safetybelts. Results showed the extent of the benefits of motorcycle helmets, with respect to theoutcome of the crash. The outcome measures were identical to those used in the safety beltanalysis. Several covariates (type of crash, vehicle type, and seating position) used in the safetybelt analysis were not included because they were inappropriate for the helmet analysis.
Wearing helmets reduced the odds of injury or death very significantly in some states, butthe results were not as consistent as they were for belt use. This is due to several factors: Thefirst was the small sample sizes. Hawaii, Maine, and Utah had less than 600 cases each. Even thelargest state, New York, had fewer than 4,600 cases (compared to almost 400,000 for their safetybelt data).
The second factor is a different pattern in use and reporting of helmets. In states wherethere is a universal helmet law, such as Missouri, New York and Pennsylvania, observationalstudies estimate compliance is above 95 percent. Presumably, this is because it is easier for policeto catch unhelmeted occupants on motorcycles than unbelted occupants of cars and trucks. Thismakes it difficult to find a reasonable sample of injured, unhelmeted motorcyclists, especially atthe more severe injury levels.
The last factor relates to type of injury. Several states remarked that only head injuriesshould be included as injuries, since helmets only protect the head. NHTSA requested a “head-injury-only” analysis from each of the CODES states. Of the two states that responded,Wisconsin, which does not have a helmet law, and consequently has a sufficient sample ofunhelmeted people with head injuries, found significant differences in favor of wearing helmets. New York, which has a helmet law, and therefore had a sample of unhelmeted head injuries ofless than ten, found no differences due to this small sample.
CODES Technical Report 67 January 1996
DIED
Odds ratios (for dead versus alive and for helmet use) ranged from 0.033, in New York, to1.686. The latter figure, from Utah, suggested a non-protective effect for helmets, but was notsignificant. Utah had only twenty-one deaths out of 586 usable cases. In addition, Utah policeofficers had no way to specify “helmet not used,” so Utah's analyses are based on “helmet used”versus “unknown,” which biases their analyses toward non-significance. The former odds ratio(0.033) means an unhelmeted motorcyclist has thirty times the odds of a death compared with ahelmeted motorcyclist. This was a very extreme figure in the “good” direction, and it must benoted that New York had a very small number of unhelmeted fatalities. In addition, 38 percent ofthe motorcycle cases were “unknown” helmet use. If even a quarter of these “unknowns” wereactually “helmet not used,” the odds ratio would be much less extreme. Because of these variousfactors, the helmet odds ratios are not portrayed graphically below.
DIED AND/OR INPATIENT
The range for this category was 0.136, in New York, (seven times the odds if no helmetworn) to 0.927, in Utah (not significant).
DIED, INPATIENT, OR TRANSPORTED
The range for this category was 0.250, in New York, (four times the odds if no helmetworn) to 0.994. The latter was not significant, but in this case it was from Pennsylvania.
ANY INJURY
The range for this category was 0.173, in Missouri, (six times the odds if no helmet worn)to 1.387. The latter was not significant, and also from Hawaii.
CONSOLIDATION
To increase the power of the analyses, and to investigate the effect of helmets on brain injury,NHTSA consolidated the data from six of the states: Hawaii, Maine, Missouri, New York,Pennsylvania, and Wisconsin. Utah's data were excluded because they could not identify “helmetnot used.” Exhibit 43 shows the results of the mandated model analysis for this larger sample. This table differs from the safety belt data in that the effectiveness rates were calculated from rawdata to maximize the sample size. In other words, when combining the states’ motorcycle data,the control variables (age, speed limit, rural/urban, etc.) were not included.
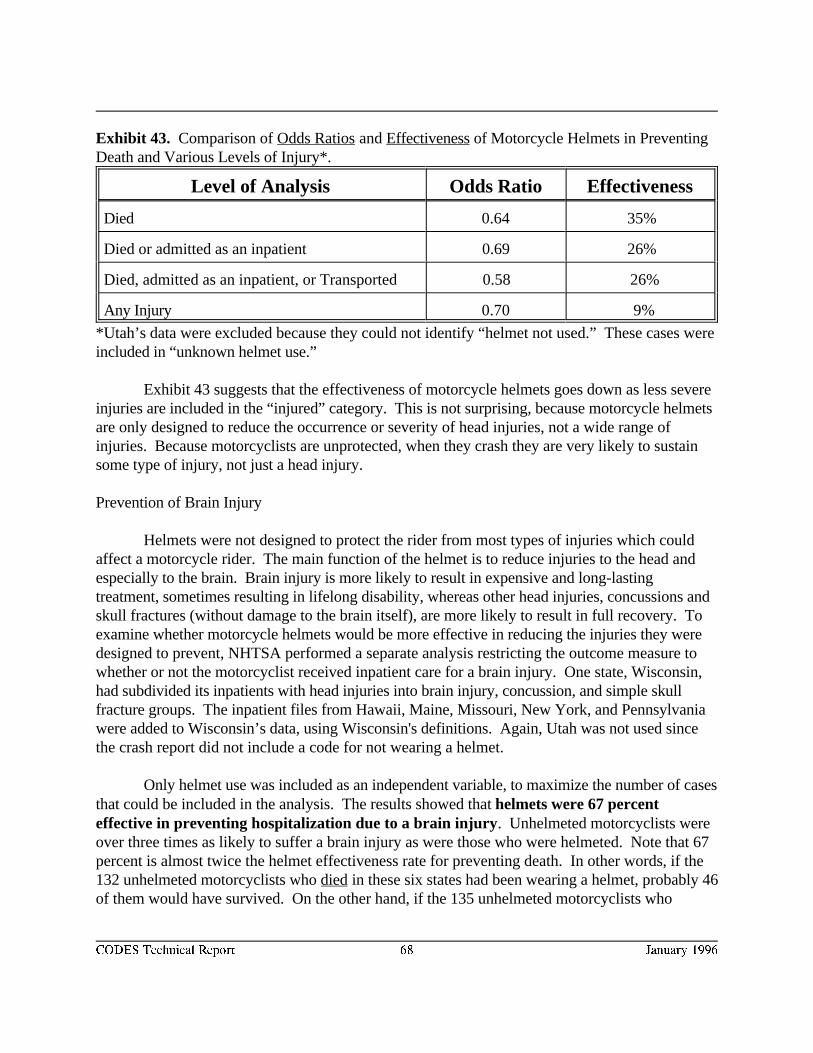
CODES Technical Report 68 January 1996
Exhibit 43. Comparison of Odds Ratios and Effectiveness of Motorcycle Helmets in PreventingDeath and Various Levels of Injury*.
Level of Analysis Odds Ratio Effectiveness
Died 0.64 35%
Died or admitted as an inpatient 0.69 26%
Died, admitted as an inpatient, or Transported 0.58 26%
Any Injury 0.70 9%
*Utah’s data were excluded because they could not identify “helmet not used.” These cases wereincluded in “unknown helmet use.”
Exhibit 43 suggests that the effectiveness of motorcycle helmets goes down as less severeinjuries are included in the “injured” category. This is not surprising, because motorcycle helmetsare only designed to reduce the occurrence or severity of head injuries, not a wide range ofinjuries. Because motorcyclists are unprotected, when they crash they are very likely to sustainsome type of injury, not just a head injury.
Prevention of Brain Injury
Helmets were not designed to protect the rider from most types of injuries which couldaffect a motorcycle rider. The main function of the helmet is to reduce injuries to the head andespecially to the brain. Brain injury is more likely to result in expensive and long-lastingtreatment, sometimes resulting in lifelong disability, whereas other head injuries, concussions andskull fractures (without damage to the brain itself), are more likely to result in full recovery. Toexamine whether motorcycle helmets would be more effective in reducing the injuries they weredesigned to prevent, NHTSA performed a separate analysis restricting the outcome measure towhether or not the motorcyclist received inpatient care for a brain injury. One state, Wisconsin,had subdivided its inpatients with head injuries into brain injury, concussion, and simple skullfracture groups. The inpatient files from Hawaii, Maine, Missouri, New York, and Pennsylvaniawere added to Wisconsin’s data, using Wisconsin's definitions. Again, Utah was not used sincethe crash report did not include a code for not wearing a helmet.
Only helmet use was included as an independent variable, to maximize the number of casesthat could be included in the analysis. The results showed that helmets were 67 percenteffective in preventing hospitalization due to a brain injury. Unhelmeted motorcyclists wereover three times as likely to suffer a brain injury as were those who were helmeted. Note that 67percent is almost twice the helmet effectiveness rate for preventing death. In other words, if the132 unhelmeted motorcyclists who died in these six states had been wearing a helmet, probably 46of them would have survived. On the other hand, if the 135 unhelmeted motorcyclists who

CODES Technical Report 69 January 1996
suffered a brain injury had been wearing a helmet, probably 90 of them would have escaped braininjury.
Cost of Crash Injuries to Motorcycle Riders
NHTSA used the same consolidated sample for a cost analysis, similar to the one forsafety belts. Again, the analysis has been restricted to the charge information available from theinpatient databases. A summary of these results is presented in Exhibit 44.
Exhibit 44. Average Inpatient Charges for Inpatient Victims and All Crash Involved MotorcycleRiders, by Helmet Use. Data from Utah Were Excluded.
Average ChargesMotorcycle Helmet Use Percent
DifferenceUsed Not Used
Inpatient Victims $14,377 $15,578 8%
All Crash Involved Riders $2,064 $2,808 36%
The average inpatient charge for motorcycle crash victims who did not use their helmet is$1,201 higher than for those who did, a difference of 8 percent. When adjusted for all crash-involved occupants, the difference is smaller, $744, but the relative difference increases to 36percent. These differences are not as dramatic as those seen for safety belts. But this is likely tobe an effect of both the smaller sample sizes involved and the likelihood that motorcycle riderswill be injured in a crash, helmeted or not. Exhibit 45 shows this result graphically.
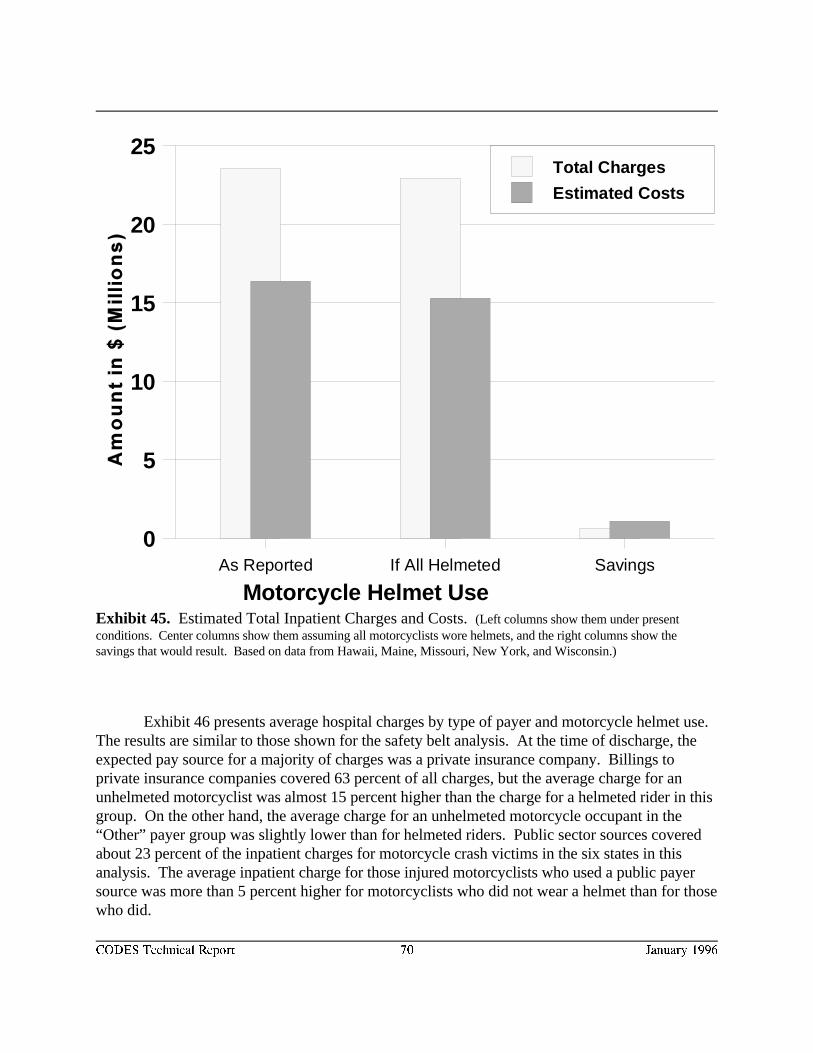
Motorcycle Helmet Use As Reported If All Helmeted Savings
0
5
10
15
20
25Total Charges
Estimated Costs
CODES Technical Report 70 January 1996
Exhibit 45. Estimated Total Inpatient Charges and Costs. (Left columns show them under presentconditions. Center columns show them assuming all motorcyclists wore helmets, and the right columns show thesavings that would result. Based on data from Hawaii, Maine, Missouri, New York, and Wisconsin.)
Exhibit 46 presents average hospital charges by type of payer and motorcycle helmet use. The results are similar to those shown for the safety belt analysis. At the time of discharge, theexpected pay source for a majority of charges was a private insurance company. Billings toprivate insurance companies covered 63 percent of all charges, but the average charge for anunhelmeted motorcyclist was almost 15 percent higher than the charge for a helmeted rider in thisgroup. On the other hand, the average charge for an unhelmeted motorcycle occupant in the“Other” payer group was slightly lower than for helmeted riders. Public sector sources coveredabout 23 percent of the inpatient charges for motorcycle crash victims in the six states in thisanalysis. The average inpatient charge for those injured motorcyclists who used a public payersource was more than 5 percent higher for motorcyclists who did not wear a helmet than for thosewho did.
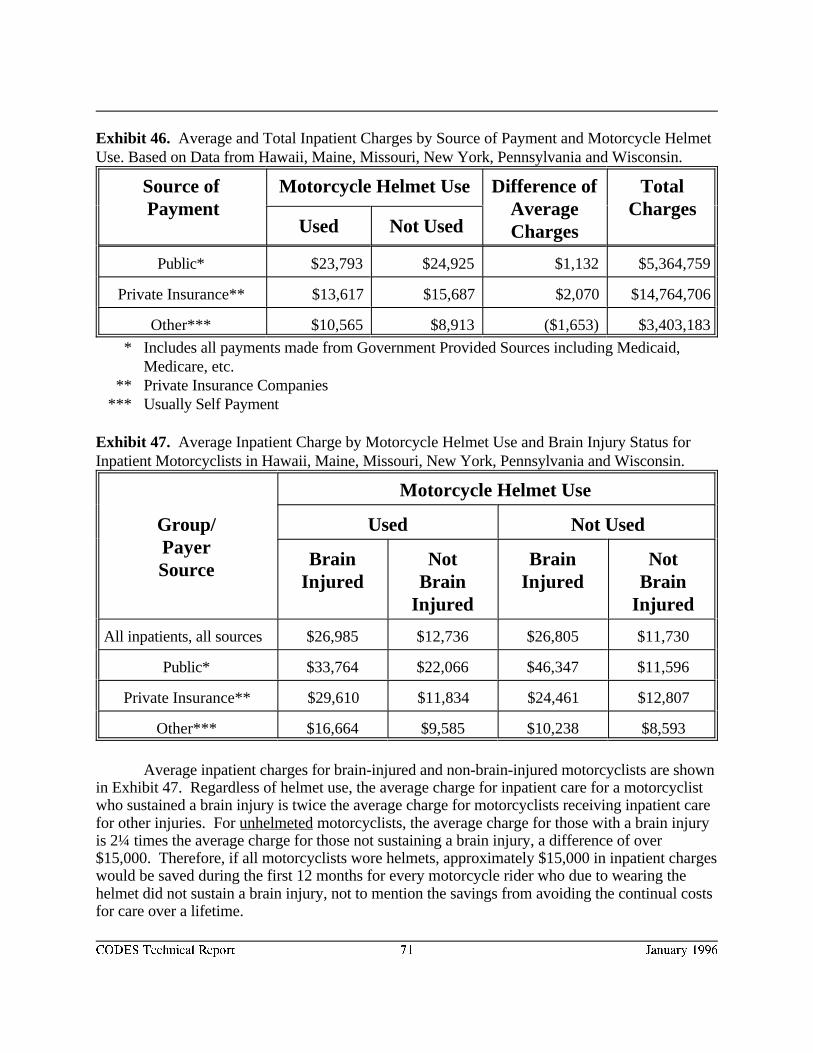
CODES Technical Report 71 January 1996
Exhibit 46. Average and Total Inpatient Charges by Source of Payment and Motorcycle HelmetUse. Based on Data from Hawaii, Maine, Missouri, New York, Pennsylvania and Wisconsin.
Source of Motorcycle Helmet Use Difference of Total Payment Average Charges
ChargesUsed Not Used
Public* $23,793 $24,925 $1,132 $5,364,759
Private Insurance** $13,617 $15,687 $2,070 $14,764,706
Other*** $10,565 $8,913 ($1,653) $3,403,183
* Includes all payments made from Government Provided Sources including Medicaid, Medicare, etc.
** Private Insurance Companies*** Usually Self Payment
Exhibit 47. Average Inpatient Charge by Motorcycle Helmet Use and Brain Injury Status forInpatient Motorcyclists in Hawaii, Maine, Missouri, New York, Pennsylvania and Wisconsin.
Group/ Used Not UsedPayerSource
Motorcycle Helmet Use
Brain Not Brain NotInjured Brain Injured Brain
Injured Injured
All inpatients, all sources $26,985 $12,736 $26,805 $11,730
Public* $33,764 $22,066 $46,347 $11,596
Private Insurance** $29,610 $11,834 $24,461 $12,807
Other*** $16,664 $9,585 $10,238 $8,593
Average inpatient charges for brain-injured and non-brain-injured motorcyclists are shownin Exhibit 47. Regardless of helmet use, the average charge for inpatient care for a motorcyclistwho sustained a brain injury is twice the average charge for motorcyclists receiving inpatient carefor other injuries. For unhelmeted motorcyclists, the average charge for those with a brain injuryis 2¼ times the average charge for those not sustaining a brain injury, a difference of over$15,000. Therefore, if all motorcyclists wore helmets, approximately $15,000 in inpatient chargeswould be saved during the first 12 months for every motorcycle rider who due to wearing thehelmet did not sustain a brain injury, not to mention the savings from avoiding the continual costsfor care over a lifetime.

CODES Technical Report 72 January 1996
Discussion of Motorcycle Helmet Analysis
Regarding the effectiveness of motorcycle helmets in reducing fatalities and injuries, theresults are also consistent with previous analyses NHTSA has conducted. The 35 percent figurefrom Exhibit 11 is very close to a 1989 NHTSA analysis which estimated that motorcycle11
helmets were 29 percent effective against fatal injury. The minimal effectiveness of helmets whenlesser injuries are added to the analysis should not be surprising. Helmets prevent head injury, notall injuries.
This makes the analysis of brain injury all the more important, because it shows thathelmets are effective in reducing the types of injury they were designed to reduce. They were 67percent effective in the six selected states, which is more than twice the fatality effectiveness. Helmets also reduce the cost where it counts. In these six states, cases with brain injury weremore than twice as costly as non-brain injury during the first twelve months.
With motorcycle helmets, the over-reporting problem does not exist, because it is easier tosee “helmet use” than “belt use.” There is no substantial group of motorcyclists claiming theywere wearing helmets when they were not. No adjustments need be contemplated as in thesafety-belt analysis. However, there is a problem with missing data on motorcycle helmet use. New York, with a helmet-use law, showed “unknown helmet use” on 38 percent of itsmotorcyclist records. Wisconsin, without a helmet-use law, showed only 9 percent. In general,states with laws are more likely to have missing data. Police may be reluctant to give a ticket fornot wearing a helmet to a motorcyclist who has just suffered a crash.
SUMMARY OF THE MANDATED MODEL
This study confirms and amplifies previous studies that found safety belts and motorcyclehelmets were effective in reducing fatalities and injuries and in reducing inpatient costs. Evenwithout including smaller (but more numerous) charges from EMS services, emergencyrooms/departments, private doctor or chiropractor visits, home health services, andpharmaceutical expenses, seven states show possible belt savings in the tens of millions ofdollars, and six states show possible helmet savings in the millions of dollars for inpatientcharges alone.
The study also shows the efficiency with which disparate files can be merged usingprobabilistic matching, and how the linked files can generate comprehensive and precise answersto safety problems. The best illustration obtained from the data so far is the success of helmets inpreventing brain injury, which could only have been computed with both crash and hospital datatogether.
CODES Technical Report 73 January 1996
OTHER STATE SPECIFIC ANALYSES USING THE LINKED STATEDATA
Each of the CODES states also performed state specific analyses to investigate issuesrelated to the safety belt and helmet analyses, to issues related to the quality of the linked data, tofactors related to crash and injury severity, and to geographic patterns of crash characteristics. The results from these studies are summarized below.
Data Quality
REPORTED SAFETY BELT USAGE
Missouri took advantage of the linked data to determine variations in reported belt use asrecorded on the linked crash, EMS, and Head and Spinal Cord Injury/Trauma (HSCIT) files. Eighty percent of the linked records with no missing data agreed on belt use/non use. Agreementrates between the linked crash and EMS and the linked crash and HSCIT files were slightlyhigher. Agreement among linked pairs for the helmet variable was similar though the crash andEMS links showed 93 percent agreement. Average charges were studied to assess the affect ofthe disagreements in the three files. The results indicated that average charges for belt use weresimilar regardless of the file used. Results were less consistent for motorcyclists because ofinsufficient cases for analysis.
Maine compared reported belt use between police and EMS records and found overallagreement for belt use at 87 percent and for alcohol use at 97 percent. A comparison of policeand hospital reporting of injury indicates a much lower level of reliability. While police reportsare able to reasonably identify the general area of injury, the reports lack specificity in theirreporting (i.e. head vs. face). If we use the hospital discharge abstract record as a benchmark, thepolice often identify a secondary injury as the “most severe.” Bleeding or complaint of pain arenot very useful indicators for the analysis of motor vehicle crash injuries. The comparison ofEMS and hospital reporting of head and spinal trauma suggested evidence that the EMS checkboxes were underutilized. The results reported reinforced the view that valid reporting of theinjury outcome of motor vehicle crashes can best be accomplished through the linkage of crash tohospital discharge and other medical records.
OVER-REPORTING OF BELT USAGE
Maine performed a within-vehicle analysis using conditional logistic regression todetermine whether an alternative analytic technique would lead to similar conclusions as thosereported in the Report to Congress. This analysis compared the outcome for individuals withinthe same vehicle, thus controlling for the severity of the crash without actually measuring severitydirectly. Because the nature and coding of the variables relevant to severity available at the
CODES Technical Report 74 January 1996
various CODES states differed, part of the interstate differences in the estimate of efficacy ofsafety belts may reflect not actual differences in efficacy but instead variation in the extent towhich confounding by severity can be removed in the unconditional analyses. A within-vehicleanalysis may generate results that can be validly pooled across all states, whereas results based onunconditional logistic regression could be more likely to be biased by differences among states. With a conditional analysis, the estimates of efficacy were found to be somewhat reduced relativeto the estimates from the unconditional analysis. However, the degree of this difference was notsubstantial, and strong evidence for efficacy was provided by the conditional (i.e., within-vehicle)analysis. Consequently, it seems likely that the unconditional analyses do not yield estimates ofefficacy that overstate the true efficacy appreciably. Use of safety belts reduces the odds of injuryby about 35 percent for drivers and nearly 50 percent for passengers. The upper confidence limitsfor these estimates indicate that the true efficacy in Maine is unlikely to be less than about a 12percent reduction in injuries for drivers or less than about 30 percent for passengers.
Maine also performed an ordered logistic regression to better fit the ordinal nature of thedependent variables and thus increase the power to reject the notion that safety belts are notprotective. The results indicate that for the safety belt model, the NHTSA model of four separateanalyses produced a more precise measure of the benefits of safety belts. However, formotorcycles, the ordered logistic regression was as effective as the NHTSA model.
Utah studied the effect of the misclassification on the calculated odds ratio associated withsafety belt use. Adjustment of the fraction of correct classification of safety belt use amongreported belt users decreased the protective effect associated with safety belt use for the levels ofinjury studied. Although adjustment decreased the magnitude of the protective effect of belts,safety belts continued to be protective in preventing injuries and fatalities.
To determine the net effect of over-reported belt use on estimates of belt effectiveness,Wisconsin developed a new model for estimating the probability of belt use among crashoccupants. A field observation study, conducted in the same period as the CODES study year,found a 55% belt use rate among Wisconsin passenger car occupants, compared with a reported86% belt use rate among passenger car occupants in crashes. The Wisconsin team used logisticregression analyses on the data from the field observation study to determine whether occupant,vehicle and site characteristics were significant predictors of belt use. Logit parameters foroccupant, vehicle and site characteristics were computed. Variables from the field observationstudy were mapped into variables in the crash data. Using the logit parameters and the variablesin the crash data, a probability of belt use was computed for every passenger vehicle occupantwhose crash record contained sufficient vehicle, site and occupant information. Finally, a newdichotomous variable was created to represent occupants’ belt use, using the following algorithm:
1. The distribution of yes/no values for the new variable was to equal the distributionof belted/unbelted occupants in the field observation study (55%/45%).
CODES Technical Report 75 January 1996
2. Belt use was left as reported for unbelted occupants, and for occupants who died.
3. The value of the new variable was “no” for the N occupants with the lowestprobabilities such that N plus the number of self-reported non-wearers totaled 45%of the occupants.
4. The value of the new variable was “yes” for all remaining occupants.
A medical record review conducted in conjunction with this study found that amongoccupants injured seriously enough to be admitted as inpatients, belt use is over-reported but notas extensively as among uninjured occupants. Analyses of safety belt effectiveness using the newbelt use variable yielded lower estimates of the protective effect -- closer to the 50 percenteffectiveness that has been demonstrated in other studies, including matched pair analyses. Inanalyses that estimate the risk of sustaining an injury outcome associated with safety belt non-use,over-reporting of belt use inflates the risk estimate by at least 212 percent (passengers:hospitalization or death, 6.25/2.94) and as much as 490 percent (drivers: death, 10.64/2.14).
ERRORS IN THE CHARGES
Missouri identified records with discrepant charges or length of stay and forwarded themto the hospitals for correction. Average charge and LOS were then recalculated with the errorscorrected. Differences in average charges and LOS by belt use were not significantly differentregardless of whether corrected or uncorrected values were used.
Ancillary Linkages to Improve the Results
Missouri linked the hospital discharge data to the Head and Spinal Cord/Trauma InjuryData (HSCIT) to compare hospital charges. Sixty percent of the records had no differences incharges and 76 percent had a difference of less than five percent. Although larger differencesexisted in some of the remaining records, they made relatively small difference in the averagecharges on those records where both were present. Although the HSCIT reports data for patientstreated at a trauma center, some HSCIT records did not link to hospital discharge data. Themajority of the unlinked HSCIT records were found to have low charges and a length of stay ofone. These patients were not defined as inpatients by the hospital discharge data. HSCIT recordswhich did link to the hospital discharge data were found to represent more severely injuredpatients (more emergency department discharges to the operating room and ICU units, moredischarges to skilled nursing facilities and rehab units, more fatalities, fewer superficial injuries,etc). After contacting hospitals regarding some of the largest discrepancies, it was apparent thatcharges and length of stay from the hospital discharge file were most often correct. Thus,inpatient charges were always assigned from the hospital discharge file; they were assigned fromthe HSCIT file only if the charges were missing from the hospital discharge file. Belt users werefound to have lower charges whether the corrections to the charges and length of stay were made
CODES Technical Report 76 January 1996
or not. The implication is that conclusions about belt use by drivers of cars and trucks arerelatively impervious to the range of error occurring in these data.
EMERGENCY DEPARTMENT DATA
Emergency department data are frequently not computerized statewide; however, thisinformation is important for highway safety to evaluate injuries not requiring hospitalization. Pennsylvania attempted to create statewide emergency department data by merging electronicbilling data at a stratified sample of all hospitals. While virtually all Pennsylvania hospitals use theUB-92 uniform billing format, most fail to permanently store ED patient billing data in computer-retrievable format. More than 2/3 of hospitals purged ED billing data from their computer systemwithin six months and only 10 percent stored billing data on computer disk or tape after it waspurged. For ED patients who were not admitted, three quarters of Pennsylvania hospitalsincluded diagnostic and treatment information on these patients in their computerized informationsystem. Important data on outpatient injuries may, therefore, be available from this source. Mostcomputerized ED patient registration, billing and log systems are integrated systems, thusincreasing the likelihood for standardization of patient data for later merging at the state level.
Other Factors Affecting the Relationship between Crash and Injury Severity
OUTLIERS
Missouri identified an outlier charge of $914,331 for a belted, truck driver. Beltedness forthis driver was confirmed in all three files (crash, EMS, HSCIT) and the high charge wasdetermined to be unusual for belted patients. It had the effect of distorting the average charge forbelted patients by 7 percent. Two other victims were involved in the same crash. Both wereunbelted and suffered fatal injuries but incurred no hospital charges. These three records revealthe difficulty in using hospital charges as an outcome variable to assess safety belt effectiveness. When the outlier was dropped from the analyses, the 95 percent confidence interval decreasedaround the average patient charge for belted patients when drivers of cars and trucks wereincluded together. When trucks were analyzed separately, exclusion of the outlier decreased theaverage charges from $20,247 to $10,934! However, since the data, though an outlier,represented a valid linked record for a belted driver, including it in the analyses was perceived asbeing less objectionable.
TYPES OF RESTRAINTS AND CRASHES
Hawaiian belt usage (representing one of the highest rates in the United States) wasstudied in relationship to injuries among crash-involved front seat occupants of motor vehicles. Injury was defined using the KABC0 levels of no injury, possible/non-incapacitating,incapacitating/fatal. Crash type was defined as head-on, rollover, and other. Safety belt usagewas defined as no restraint use, lap only, shoulder only, and combined lap-shoulder protection
CODES Technical Report 77 January 1996
systems. Lap-shoulder systems afforded the greatest level of protection, followed by lap only,shoulder only. No restraints increased the likelihood of a fatal or incapacitating injury as didrollover or head-on crashes.
ALCOHOL AND DRUG USE
Hawaii developed a structural model to explain the relationships between certain drivercharacteristics and behaviors, crash types, and injury severity once a crash has occurred. Themodel clarified the role of driver characteristics and behaviors in the causal sequence leading tomore severe injuries. The effects of various factors were studied to determine how much eachfactor increased or decreased the odds of more severe crash types and injuries. The resultsindicated that driver behaviors of alcohol or drug use and lack of safety belt use greatly increasethe odds of more severe crashes and injuries. Driver errors were found to have a small effect,while personal characteristics of age and sex were generally insignificant. The study failed to findany strong association between age, sex, and driver behavior suggesting that the young malesinvolved in crashes are not much more likely to be engaging in these negligent behaviors thananyone else involved in crashes. As a result, they are not much more likely to be involved in themore severe crashes and injuries as one might expect from a disproportionately high rate ofnegligent behavior.
COST OF CARE
The New York CODES mandated model failed to establish a direct relationship (R-square= 0.02) between crash parameters and cost of care. Separate consideration of the crashparameters was studied to determine the relationship between the type and severity of injury withvariations in the cost of care. The injury severity for drivers' admitted as inpatients, measured bythe maximum abbreviated injury scale (MAIS) score, was shown to be a fair (R-square = 0.25)predictor of case level cost as measured by hospital charges. However, there was wide variancein cost by body region ($3,623 for external injuries to $15,874 for abdominal injuries) within thesame severity level. Since AIS severity level assignments reflect only a single injury and a crashvictim may be treated for several injuries, the Injury Severity Score (ISS) was substituted toimprove the cost model. ISS measures cumulative injury severity across multiple body regions. As expected, inclusion of the multiple injuries per victim caused approximately 14 percent of allcases to shift to higher severity levels with ISS versus the MAIS. In addition, many averagehospital charge values changed significantly. The progressive increase of charges by severity levelwas much more consistent across all body regions with ISS severities. More consistent averagecharge values at the injury category level did not change the estimated total charges significantly,and did not improve the situation at the case level. High variances within injury categories meanthat low confidence cases still contribute approximately one-third of the estimated total charges. Case level models using ISS severity showed only slight improvements over models using MAISseverity. These study results suggest that case level cost prediction using diagnosis codes andcomputer algorithms for translation to injury severity, body region, and average cost may be an
CODES Technical Report 78 January 1996
effective approach. However, model predictions should be coupled with medical record data thatidentify transfers, extraordinary treatment cases, or other outliers.
Wisconsin used linked crash and Medicaid claims data to obtain information on healthoutcomes and service utilization for each Medicaid-injured crash occupant for one year followingthe crash. The Wisconsin Medicaid program paid $6.5 million to cover crash-related costsincurred during the year following the crash, for eligible beneficiaries who were in crashes anytime during 1991. In fiscal year 1991, $6.5 million was paid by Wisconsin Medicaid to covercrash-related costs incurred during the year following the crash for eligible beneficiaries. Over $4million was paid by Medicaid for inpatient hospital services, slightly less than $1 million was paidfor physician services, and one-half million dollars was paid for outpatient services. Over $3.5million was paid on behalf of beneficiaries involved in passenger car crashes, with payments forcrash-involved pedestrians and motorcyclists totaling approximately $1 million for each group. Costs were incurred immediately for (1) individuals who were Medicaid-eligible prior to thecrash, and (2) individuals who became eligible immediately following the crash as a result ofsevere injuries requiring expensive care. Many others became eligible after their casualtyinsurance reached its maximum limits. Although this study tracked Medicaid costs for only thefirst year following each occupant’s crash date, some severely-injured occupants become eligiblefor Medicaid two or three years after the crash when the payments from their liability settlementsfinally run out. An algorithm was developed to identify the crash-related health care specificallyfor physician, hospital, long term care, and other services provided to Medicaid beneficiaries. TheMedicaid population of drivers, more likely to be female and younger, suffered higher injuryseverity possibly because of a higher reported rate of alcohol use and a lower rate of safety beltuse.
RELATIONSHIP OF CRASH INJURY AND AGE
New York used the linked data to investigate whether crash related injuries differedbetween older and younger drivers hospitalized as the result of a motor vehicle crash. All driverswere assigned to groups covering a span of 10 years (16-24, 25-34, etc.). Only 68 percent of thedrivers hospitalized age 16-54 were belted compared to 81 percent of the drivers age 55 andolder. Almost 90 percent of the crashes were defined as low speed. Older drivers hospitalizedwere more likely to sustain a wide spectrum of crash related injuries (internal injuries, fractures,and contusions or superficial injuries) than younger drivers. Length of stay was longer (10 daysversus 6 for younger drivers) and hospital charges greater (26 percent higher for the age group65-74). Although belted and driving more slowly, elderly drivers are likely to suffer more seriousinjuries than younger drivers. Thus programs targeted at the elderly should include crashprevention.
CODES Technical Report 79 January 1996
Geographic Patterns of Crash Characteristics
GENDER, AGE, TIME OF DAY, DAY OF WEEK, MONTH
Using geographic information systems technologies, data collected on all reported mopedcollisions in the City and County of Honolulu during 1990 were combined and used to evaluatethe impact of gender, age, time of day, day of week, and month on the location of moped crashes. The results identified intersections, roadways, and districts experiencing high moped crash rates. By identifying the areas where moped collisions occur, it is possible to coordinate trafficenforcement, public education, and training programs designed to enhance moped safety. Temporal strategies include developing enforcement and education campaigns targeted atMonday mornings and Friday evenings when moped collisions are likely to occur. Institutionalapproaches are necessary because tourists and students make up a large proportion of personsinvolved. Finally individual approaches are necessary to encourage the use of helmets and otherprotective gear.
TRAFFIC AREAS
CODES data were used to perform a spatial analysis of Honolulu motor vehicle crashes in1990. Most crashes were found to occur closer to employment centers than to population centerssuggesting that the distribution of crashes followed the distribution of traffic. Motorcycle crashesappear to be significantly higher in the major recreational, entertainment, and tourist center of theisland. Moped crashes are higher around the University of Hawaii and in areas near severalcommunity colleges. Exceptions were noted for fatalities, crashes involving serious injuries andcrashes involving alcohol, suggesting an interaction between speed, poor driving conditions,residential activities and alcohol. Different types of vehicle crashes were shown to have differentspatial patterns suggesting either different population pools or different activities. In generaltraffic crashes were related to the conditions producing traffic and, in particular, to “attractors” oftraffic more than to “generators.” GIS makes it possible to estimate a likely level of crasheswhich is useful for monitoring the significance of existing patterns of crashes. It alsodemonstrates the interrelationships between travel patterns, activity level, and the organization ofthe area.
NEIGHBORHOODS
A spatial lag model was developed to examine the relationship between motor vehiclecrashes, population and several categories of employment. Crash predictors were found tofluctuate according to different trip generating activities and changed considerably over the day. Land use was found to interact with trip generating activities. This crash analysis method focusesattention on characteristics of neighborhoods and areas, and not just on the road system.
CODES Technical Report 80 January 1996
TRAFFIC VOLUME, DAILY WORK PATTERNS, AFTERNOON AND WEEKENDACTIVITIES, HOLIDAYS, WEATHER
Changes in daily motor vehicle crashes during 1990 were examined for the City andCounty of Honolulu. Daily crashes fluctuated according to an interaction between traffic volume,daily work patterns, afternoon and weekend activities, holidays and weather. Major holidaysgenerate fewer daily crashes, primarily because of lower traffic volumes, but minor holidaysgenerate more daily crashes. Rainfall, while reducing traffic volumes, also increased the risk ofcrashes. The interaction between Friday afternoons and rainfall is particularly dangerous.
ANALYTICAL ISSUES
Measures such as effectiveness rates for countermeasures are not affected unless the falsenegative rate is high enough to reduce the power of the sample to represent the group. However,the failure to link crash reports which should have linked may result in system measures, such astotal EMS transports, hospitalizations, charges, and hospital days, to be understated. In addition,average charges may be understated if the unlinked records contain severe cases with highhospital charges and long lengths of stay. Thus, before performing any analyses, the accuracy andcompleteness of the linked data must be evaluated relative to the population and the outcomemeasures implemented.
One of the advantages of data linkage is that it highlights the under-submission of recordswhen it exists. Variations in reporting thresholds and in submission rates by police agency,provider, or geographic service area were evaluated by each state to ensure that specificpopulation groups, types of services, etc. were not under- or over-reported for either the injuredor uninjured. Of particular interest was the potential for variations in the quality for each linkagevariable to cause under- or over-representation of a particular group or unit of measure.
Systematic bias may occur during specific linkage phases because of variations in thepower of the linkage variables to discriminate. For example, except for Wisconsin, date of birthwas available on the crash report only for drivers. Adding date of birth to the EMS data increasedthe probability that driver records would match and their characteristics would prevail. Asindicated before, the CODES states varied in their abilities to obtain date of birth throughancillary linkages.
SIGNIFICANCE OF CODES
CODES represents a successful experiment using state linked data that demonstrated notonly a decrease in the number and severity of injuries but also a reduction in health care charges
CODES Technical Report 81 January 1996
and estimated actual costs with the use of belts and helmets. In addition, the implementation ofCODES promoted collaboration among the highway safety, medical, and insurance communitiesin the CODES states and improved the quality of state data for future use.
The linked data provide unique insights into the financial outcome of highway crashes. Police crash reports provide information about the crash environment and driver/occupants; EMSreports and hospital discharge data add medical information about injury type and severity; andhospital discharge and insurance claims data reveal the financial consequences. Taken together,these linked data generated greater value than when considered alone.
Hundreds of thousands of police-reported crashes were included in the statewide linkeddata. This large volume of vehicle-related information increased the available statistical powerto discriminate among specific vehicle attributes while controlling for non-vehicle-related factorsand generating cost benefit analyses of vehicle safety performance standards.
An important concern of the public health community relates to the availability ofmedical services and their impact on outcome. The availability of linked injury and crashinformation supports collaboration between the non-medical and medical communities. Thesedata can be used to demonstrate the effectiveness of the emergency response by police, EMS, andthe acute care system, and to predict the need for an aggressive medical response when specificcrash, vehicle, and behavioral characteristics exist.
NHTSA often examines state data to evaluate the benefits of specific highway safetycountermeasures. CODES linked data allow the agency to examine not only a more accuratedescription of injury consequences, but also the public health cost savings associated withhighway safety initiatives. Since a high percentage of these costs are funded by citizens throughincreased taxes to cover the expenses of uninsured and underinsured crash victims, documentationof the costs is important to motivate public and legislative support for stricter laws andenforcement actions. CODES provides documentation, generated from a state's own linked data,that is more credible among local decision makers who may be tempted to repeal the safetymandates, such as helmet legislation. CODES information has the capability to demonstrate theincreased costs associated with head injuries for unhelmeted riders, to identify the health carecosts for specific vehicles, crashes, and behaviors (e.g. alcohol involvement, unsafe drivingactions), to generate community-based information to support community based traffic safetyprograms, and to target specific populations at risk at the local, regional, or state levels. All ofthis information identifies and supports outcome-based injury control activities that have the mostpotential for reducing health care costs.
CODES Technical Report 82 January 1996
1. Final Regulatory Impact Analysis: Amendment to Federal Motor Vehicle Safety Standard208 Passenger Car Front Seat Occupant Protection. Washington, D.C.: U.S. Department ofTransportation, National Highway Traffic Safety Administration. Report number DOT HS 806572, July, 1984.
2. Blincoe, Larry and Faigin, Barbara. The Economic Cost of Motor Vehicle Crashes,1990. DOT HS 807-876, Sept. 1992.
3. Jaro, Mathew A. Advances in Record-Linkage Methodology as Applied to Matching the 1985Census of Tampa, Florida. American Statistical Association Journal: 84(406), 414-420. 1995. A discussion of the software can be found in Jaro, Mathew A. Probabilistic Linkage ofLarge Public Health Data Files. Statistics in Medicine: 14(5/6/7), 491-498. 1995.
4. Dorothy P. Rice, Ellen J. MacKenzie, and Associates. Cost of Injury in the United States: AReport to Congress 1989. San Francisco, CA: Institute for Health & Aging (University ofCalifornia), and Injury Prevention Center (The Johns Hopkins University), 1989. Costs quotedcome from Table 12 on page 55.
5. Copes, W.S., Champion, H.R., Sacco, W.J., et al. The Injury Severity Score Revisited. Journal of Trauma 28:591-599, 1988.
6. Sensitivity Index Demonstration Project--Final Report. Johnson, S.W. and VanSciver, E. Washington, DC: National Association of Governors’ Highway Safety Representatives, 1991.
7. Almanac of Hospital Financial and Operating Indicators. Cleverley, William O. Center
for Health Care Industry Studies, Ohio State University (published annually).
8. Fleiss, J. L. Statistical Methods for Rates and Proportions (Second Edition). New York: John Wiley & Sons, 1981.
9. SAS/STAT User's Guide, Version 6, Fourth Edition, Volume 2. SAS Institute Inc. Cary,®
NC: SAS Institute Inc., 1989.
10. Testimony of Ted Miller before House Subcommittee on Surface Transportation, March 3,1994.
11. The Effectiveness of Motorcycle Helmets in Preventing Fatalities. Wilson, D. DOT HS 807416, NHTSA Technical Report, March, 1989.
12. The Effect of Helmet Law Repeal on Motorcycle Fatalities. de Wolf, V. DOT HS 807 065,NHTSA Technical Report, March, 1986.
REFERENCES
CODES Technical Report 83 January 1996
13. “The Effect of Helmet Law Repeal on Motorcycle Fatalities-A Four Year Update.” Hertz,E., Research Note, September, 1989.
14. “NHTSA Fatalities and Estimates of Lives Saved, 1993.” DOT, NHTSA.
CODES Technical Report 84 January 1996
Appendix A.SAS code for estimating effectiveness from PROC LOGISTIC output.®
The SAS program below was used to estimate the effectiveness estimates from the PROC1
LOGISTIC regression output. This method allows the covariates to be accounted for inaddressing system effects. Effectiveness estimates cannot be directly computed from odds ratios,although if the probabilities of a positive response (e.g., dying) are very small, the computed oddsratio is almost identical to the relative risk, and (1 - relative risk) * 100 = effectiveness. However,that is the exception. Generally, relative risk is closer to one than its corresponding odds ratio ifthere is a significant safety effect.
Nevertheless, effectiveness estimates are very useful because they have become standardin NHTSA reports. Moreover, they lead to the following interpretation: “This means that Xpercent of the unbelted drivers would have survived had they been wearing their safety belt,” aconcept understood by a wider audience than the use of odds ratios. Therefore, the followingalgorithm was used to compute approximations of them:
PROC LOGISTIC wrote the predicted probability for each case (along with many othervariables) to an output file. Then a DATA step computed the logit of the estimated probability,and if the occupant was belted, subtracted the beta-weight for belt use. Occupants who wereunbelted needed no adjustment. This gave an “unbelted” logit for every occupant, whether beltedor not. Conversely, if the occupant was not belted, the data step added the beta-weight for beltuse, resulting in the occupant's “belted” logit. Occupants who were belted needed no adjustment. This gave a “belted” logit for every occupant, whether belted or not. Then the DATA stepcomputed the exponents of both logits, giving the predicted probabilities in both situations. ThenPROC MEANS computed the means of these probabilities. These means represent the1
population probabilities of a positive response (e.g., dying), adjusted for the covariates (otherindependent variables) in the model. In a spread sheet, an estimate of the risk ratio was obtainedby dividing the mean probability if everyone was belted by the mean probability if everyone wasnot belted. This was done for every state and analysis level, for drivers only.
The following is the SAS LOG from a run for Wisconsin. The original output had no®
bold or Italics. Bold text is usually original text that has been bolded for emphasis. All Italicstext is added explanation. Credit Ellen Hertz and Terry Klein for the original formulas. Variablenames with the letters Hat in them mean the variable is a statistical estimate.
/*Jon Walker. CODES. PROC LOGISTIC for Wisconsin data.* Runs ALL levels with OUTPUT statements added to capture * predicted probabilities, prior to calculating * the probabilities of 'injured/died, given Unbelted' and * 'injured/died, given Belted' for each analysis level.* The means of these will be used to estimate effectiveness.

CODES Technical Report 85 January 1996
* From file WiLog9.SAS;6*/
OPTIONS LS=165 PS=64 NOCENTER NOOVP ;NOOVP stops overprinting, which is only appropriate for impact or line printers.The linesize and pagesize are set up for landscape printing.
PROC FORMAT; VALUE Yes2No
0 = "No"1 = " Yes " /*Makes odds ratios go in right direction*/;
RUN ;
LIBNAME CRASH '##############';File name deleted for security reasons./* DataSet within [############] is ######## *//* Includes proper vehicles (and cycles) for mandated model. */
DATA NoCycle; SET CRASH.######## ;
IF Case type = 1 /* Car/van/pickup Drivers only, Cycles deleted */ ;Above is specific to Wisconsin.M_OutC_A, M_OutC_B, M_OutC_C, and M_OutC_D are the four outcome variables inWisconsin. See the following ATTRIB statements.
KEEP M_OutC_A M_OutC_B M_OutC_C M_OutC_DBeltUse Roll SVFO SVO MVH Rural AgeMale SpLim Wet Time Inter PC ; (Only these variables were needed.)
ATTRIB M_OutC_A FORMAT=Yes2No. LABEL="Any Injury " ;ATTRIB M_OutC_B FORMAT=Yes2No. LABEL="Trans+ " ;ATTRIB M_OutC_C FORMAT=Yes2No. LABEL="Hosp+ " ;ATTRIB M_OutC_D FORMAT=Yes2No. LABEL="Died " ;/* Reformat Injury Levels: Put Odds Ratios in right direction. */RUN ;
PROC LOGISTIC DATA=NoCycle SIMPLE ; MODEL M_OutC_A = BeltUse Roll SVFO SVO MVH Rural Age Male SpLim Wet Time Inter PC ; OUTPUT OUT= WI_OutA P= PHatA ; PHatA is a programmer-assigned name that serves asa reminder that it contains an estimate of the predicted probability of injury for each person. Aand a are only necessary because all four analyses are being run before the averages arecalculated. It would probably be easier to run a PROC LOGISTIC, then a DATA step, and then

CODES Technical Report 86 January 1996
a PROC MEANS together for each analysis level.TITLE1 ' CODES: WI: Hospital (Large) dataset. PROC LOGISTIC for the odds of any injury for Car/van/pickups drivers. ' ;RUN ;
The following NOTE comes from the SAS LOG. It probably occurs because the Yes2No format®
forces SAS to model the probability differently than the default model. However, this methodforces the odds ratios into the direction that NHTSA mandated.NOTE: PROC LOGISTIC is modeling the probability that M_OUTC_A=' Yes'. One way tochange this to model the probability that M_OUTC_A='No' is to specify the DESCENDINGoption on the PROC statement. Refer to Technical Report P-229 or the SAS System Help Filesfor details.
PROC LOGISTIC DATA=NoCycle SIMPLE ; MODEL M_OutC_B = BeltUse Roll SVFO SVO MVH Rural Age Male SpLim Wet Time Inter PC ; OUTPUT OUT= WI_OutB P= PHatB ;TITLE1 ' CODES: WI: Hospital (Large) dataset. PROC LOGISTIC for the odds of EMS trans+ for Car/van/pickups drivers. ' ;RUN ;
PROC LOGISTIC DATA=NoCycle SIMPLE ; MODEL M_OutC_C = BeltUse Roll SVFO SVO MVH Rural Age Male SpLim Wet Time Inter PC ; OUTPUT OUT= WI_OutC P= PHatC ;TITLE1 ' CODES: WI: Hospital (Large) dataset. PROC LOGISTIC for the odds of hosp/death for Car/van/pickups drivers. ' ;RUN ;
PROC LOGISTIC DATA=NoCycle SIMPLE ; MODEL M_OutC_D = BeltUse Roll SVFO SVO MVH Rural Age Male SpLim Wet Time Inter PC ; OUTPUT OUT= WI_OutD P= PHatD ;TITLE1 ' CODES: WI: Hospital (Large) dataset. PROC LOGISTIC for the odds of dieing for Car/van/pickups drivers. ' ;RUN ;
DATA ; SET WI_OUTA ;LnPHatA= LOG( PHatA / ( 1 - PHatA )) ; /*Compute Logit of est. prob.*/Note: The logic in the next two lines only works if BeltUse=1 for belted and BeltUse = 0 forunbelted. It will not work if the values are reversed or if values of 1 and 2 are used.LnQHatA= LnPHatA - BeltUse * -1.4185 ; /*Subtract Beta(BeltUse) if Belted*/
CODES Technical Report 87 January 1996
LnRHatA= LnPHatA + (1-BeltUse) * -1.4185 ; /*Add Beta(BeltUse) if NOT Belted*/QHatA = Exp(LnQHatA)/(1 + Exp(LnQHatA)) ; /*Estimate PHat if NO ONE Belted */RHatA = Exp(LnRHatA)/(1 + Exp(LnRHatA)) ; /*Estimate PHat if EVERYONE Belted */TITLE1 ' CODES: WI: Hospital (Large) dataset. PROC MEANS for the odds of any injury for Car/van/pickups drivers. ' ;RUN ;The value -1.4185 is the BeltUse Parameter from a previous PROC LOGISTIC run, identical tothe one above. It may not be necessary to make two runs. There are two optional output datasets in PROC LOGISTIC: OUT= DataSetName1 (pages 1077, 1084-1085, 1096 ) contains a1
record for each person with all of the variables in the final model plus output variables that theprogrammer lists by keyword; OUTEST= DataSetName2 (page 1077, 1078, 1095 ) contains1
final parameter estimates (as a minimum) in one record (more if the covariance matrix isrequested. DataSetName2 would contain the needed values, but merging the two data setscorrectly would not be elementary. Example 2 in the SAS manual lists both data sets (pages1
1105-1106) but does not merge them.
PROC MEANS ;Add VAR QHatA RHatA ; to get the means for only the essential variables.
DATA ; SET WI_OUTB ;LnPHatB= LOG( PHatB / ( 1 - PHatB )) ; /*Compute Logit of est. prob.*/LnQHatB= LnPHatB - BeltUse * -1.4269 ; /*Subtract Beta(BeltUse) if Belted*/LnRHatB= LnPHatB + (1-BeltUse) * -1.4269 ; /*Add Beta(BeltUse) if NOT Belted*/QHatB = Exp(LnQHatB)/(1 + Exp(LnQHatB)) ; /*Estimate PHat if NO ONE Belted */RHatB = Exp(LnRHatB)/(1 + Exp(LnRHatB)) ; /*Estimate PHat if EVERYONE Belted */TITLE1 ' CODES: WI: Hospital (Large) dataset. PROC MEANS for the odds of EMS trans+ for Car/van/pickups drivers. ' ;RUN ;
PROC MEANS ;Add VAR QHatB RHatB ; to get the means for only the essential variables.
DATA ; SET WI_OUTC ;LnPHatC= LOG( PHatC / ( 1 - PHatC )) ; /*Compute Logit of est. prob.*/LnQHatC= LnPHatC - BeltUse * -1.8725 ; /*Subtract Beta(BeltUse) if Belted*/LnRHatC= LnPHatC + (1-BeltUse) * -1.8725 ; /*Add Beta(BeltUse) if NOT Belted*/QHatC = Exp(LnQHatC)/(1 + Exp(LnQHatC)) ; /*Estimate PHat if NO ONE Belted */RHatC = Exp(LnRHatC)/(1 + Exp(LnRHatC)) ; /*Estimate PHat if EVERYONE Belted */TITLE1 ' CODES: WI: Hospital (Large) dataset. PROC MEANS for the odds of hosp/death for Car/van/pickups drivers. ' ;RUN ;
CODES Technical Report 88 January 1996
PROC MEANS ;Add VAR QHatC RHatC ; to get the means for only the essential variables.
DATA ; SET WI_OUTD ;LnPHatD= LOG( PHatD / ( 1 - PHatD )) ; /*Compute Logit of est. prob.*/LnQHatD= LnPHatD - BeltUse * -2.3652 ; /*Subtract Beta(BeltUse) if Belted*/LnRHatD= LnPHatD + (1-BeltUse) * -2.3652 ; /*Add Beta(BeltUse) if NOT Belted*/QHatD = Exp(LnQHatD)/(1 + Exp(LnQHatD)) ; /*Estimate PHat if NO ONE Belted */RHatD = Exp(LnRHatD)/(1 + Exp(LnRHatD)) ; /*Estimate PHat if EVERYONE Belted */TITLE1 ' CODES: WI: Hospital (Large) dataset. PROC MEANS for the odds of dying for Car/van/pickups drivers. ' ;RUN ;
PROC MEANS ;Add VAR QHatD RHatD ; to get the means for only the essential variables.
Relative Risk equals RHat divided by QHat. RR = RHat/QHat.
Effectiveness = (1 - RR) * 100.
To find the Odds Ratio equivalent to this Relative Risk, use the following formula: OR = RHat/(1-RHat) / (QHat/(1-QHat)).
The odds ratios that result from this formula, which should be identical to the odds ratiosfrom PROC LOGISTIC, are slightly higher, which means, given that all the odds are less than 1.0,they are slightly conservative. The “new” odds ratios average 5 percent higher relative to theoriginal odds ratios. The range over 28 data points (four analyses times seven states) is 1.6percent to 9.1 percent. However, the differences in effectiveness estimates are not as great. A 5percent increase in odds ratios roughly translated to a 1 percent decrease in effectiveness.
Fleiss's procedure (for averaging the odds ratios) gave a weighted average of the riskratios among the states. However, the standard errors from the odds ratios had to be used,because there were no appropriate standard errors from the relative risk computations. Theeffectiveness estimates in the final report are derived from these weighted averages.
CODES Technical Report 89 January 1996
REFERENCES (for Appendix A)
1. SAS/STAT® User's Guide, Version 6, Fourth Edition, Volume 2. SAS Institute Inc. Cary,NC: SAS Institute Inc., 1989.
2. SAS® Language Guide for Personal Computers, Release 6.03 Edition. SAS Institute Inc. Cary, NC: SAS Institute Inc., 1988.
3. This step could be added to the SAS program by generating an output data set in PROC®
MEANS, and adding another DATA step to manipulate the means. In the present case it wasmore convenient to transfer the means to a computer spreadsheet where the weighted averages ofthe risk ratios from all states were later computed and graphed.


