

THE ECONOMIC COST OF IPR INFRINGEMENT IN THE
SMARTPHONES SECTOR
ww
w.e
uipo
.eur
opa.
eu
ww
w.it
u.in
t
February 2017

www.euipo.europa.euwww.itu.int
THE ECONOMIC COST OF IPR INFRINGEMENT IN THE SMARTPHONES SECTOR
EUIPO PROJECT TEAM
ACKNOWLEDGEMENTS
Nathan Wajsman, Chief EconomistCarolina Arias Burgos, Economist
The authors would like to thank members of the Economics & Statistics Working Group of the Observatory who provided useful comments on the reports in this series and on the methodology used. Valuable support was received from the Telecommunication Development Bureau (BDT) of the International Telecommunication Union (ITU), especially from the Regulatory and Market Environment Division (RME) and the ICT Data and Statistics Division (IDS). In addition, the Mobile & Wireless Forum (MWF) has provided information on the smartphones marketplace in the EU.

Contents
1. Foreword2. Executive Summary
2.1. Methodology and data2.2. Mainfindings2.3. Non-economic impacts of counterfeit smartphones
3. Introduction3.1. The global market for smartphones
4. Country level results 5. Methodology
5.1. First stage: real versus expected sales5.2. The second stage econometric model
6. Conclusions and perspectives7. References
04060606111314162222303537
THE ECONOMIC COST OF IPR INFRINGEMENT IN THE SMARTPHONES SECTOR
www.euipo.europa.eu | www.itu.int4|
THE ECONOMIC COST OF IPR INFRINGEMENT IN THE SMARTPHONES SECTOR
1. FOREWORD
The European Observatory on infringements of Intellectual Property Rights (the Observatory) was created to improve the understanding of the role of Intellectual Property and of the negative consequences of Intellectual Property Rights (IPR) infringements. It was transferred from the Commission to EUIPO in 2012 by Regulation 386/2012.
The International Telecommunication Union (ITU) is the United Nations specialised agency for Information and Communication Technologies (ICTs), with responsibilities that include among others the allocation of global radio spectrum and satellite orbits, the development of technical standards that ensure networks and technologies seamlessly interconnect, and effortstoimproveaccesstoICTstounderservedcommunitiesworldwide.Thegoalistobringthebenefitsofmoderncommunicationtechnologiestopeopleeverywhereinanefficient,safe,easyandaffordablemanner.
Ina studycarriedout in collaborationwith theEuropeanPatentOffice1, the EUIPO, acting through the Observatory, estimated that approximately 42% of total economic activity and 28% of all employment in the EU is directly generated by IPR-intensive industries, with a further 10% of jobs in the EU arising from purchases of goods and services from other industries by IPR-intensive industries.
Another study2 compared economic performance of European companies that own IPRs with thosethatdonot,findingthatIPRsowners’revenueperemployeeis28%higheronaveragethanfornon-owners,withaparticularlystrongeffectforSmallandMedium-SizedEnterprises(SMEs). Although only 9% of SMEs own registered IPRs, those that do have almost 32% more revenue per employee than those that do not.
Perceptions and behaviours of European citizens regarding Intellectual Property andcounterfeiting and piracy3 were also assessed as part of an EU-wide survey. This survey revealedthatalthoughcitizensrecognisethevalueofIPinprinciple,theyalsotendtojustifyinfringements at individual level in certain cases.
The Observatory is seeking to complete the picture by assessing the economic impact of counterfeiting and piracy.
In 2016, EUIPO and ITU signed an agreement to collaborate in the publication of a study on the economic impact of intellectual property rights (IPR) infringement in smartphones. The present report is the result of that agreement.
1 - “Intellectual Property Rights intensive industries and economic performance in the European Union”, EUIPO/EPO, October 2016.
2 - “Intellectual Property Rightsandfirmperformance in Europe: an economic analysis”, June 2015.
3-“Europeancitizensand intellectual property: perception, awareness and behaviour”, November 2013, updated report 2017 (forthcoming).
www.itu.int | www.euipo.europa.eu |5
This exercise is challenging from a methodological point of view, as it attempts to shed light on a phenomenon that by its very nature is not directly observable. To pave the way towards quantificationofthescope,scaleandimpactofIPRinfringements,asidentifiedinitsmandate,the Observatory has developed a step by step approach to evaluate the negative impact of counterfeiting and its consequences for legitimate businesses, governments and consumers, and ultimately for society as a whole.
Several IPR intensive industries whose products are known or thought to be subject to counterfeiting have been selected. Previous studies have examined the following sectors: cosmetics & personal care; clothing, footwear and accessories; sports goods; toys & games; jewellery & watches; handbags & luggage; recorded music; spirits & wine; medicines; and pesticides.
The sectorial studies published to date estimate the impact of counterfeit goods in the EU marketplace. This eleventh study, covering the smartphone sector, is published in collaboration with ITU, a UN agency with a global focus. Therefore, while it uses a similar methodology to that applied in previous sectorial studies it is not limited to EU countries. Due to the need to include awidersetofcountriesandtothespecialnatureofthesector,differentdatasourcesandadjustments of the methodology were required.

THE ECONOMIC COST OF IPR INFRINGEMENT IN THE SMARTPHONES SECTOR
www.euipo.europa.eu | www.itu.int6|
THE ECONOMIC COST OF IPR INFRINGEMENT IN THE SMARTPHONES SECTOR
2. EXECUTIVE SUMMARY
2.1. Methodology and data
The study aims to estimate the scale of the economic impact of counterfeiting in the legitimate sector. The starting point of this analysis is the number of smartphones sold in 86 countries basedonpoint-of-saletrackingofconsumers’purchases.Expectedsalesareestimatedbasedon new smartphones connections and expected replacement of devices. Subsequently, the difference between expected and actual sales estimated for each country is analysedusingstatisticalmethods.Thisdifferencecanbepartlyexplainedbysocio-economic factors such as per capita GDP or mobile broadband services prices. In addition, factors related to counterfeiting are considered, such as the legal and regulatory environment4.
The methodology is explained in detail in section 5.
2.2. Main findings
Region5-level estimates of lost sales expressed both as a percentage of sales and in euros, are showninthetablebelowalongwiththeconfidenceintervals.
4 - The Worldwide Governance Indicator of Government Effectivenessfromthe World Bank is used in this study. This indicator captures perceptions of the quality of public services, the quality of the civil service and the degree of its independence from political pressures, the quality of policy formulation and implementation, and the credibility ofthegovernment’scommitment to such policies.
5 - The countries included in each region are shown in Table 4.
It is estimated that in 2015, 14 million smartphones fewer were sold by the legitimate industry across the EU than would have been the case in the absence of counterfeiting. This translates to approximately 4.2 billion EUR lost due to the presence of counterfeit smartphones in the EU marketplace, corresponding to 8.3% of the sector’s sales.
Worldwide, the effect of counterfeiting on smartphone sales is estimated at 184 million units, valued at 45.3 billion EUR or 12.9% of total sales.

www.itu.int | www.euipo.europa.eu |7
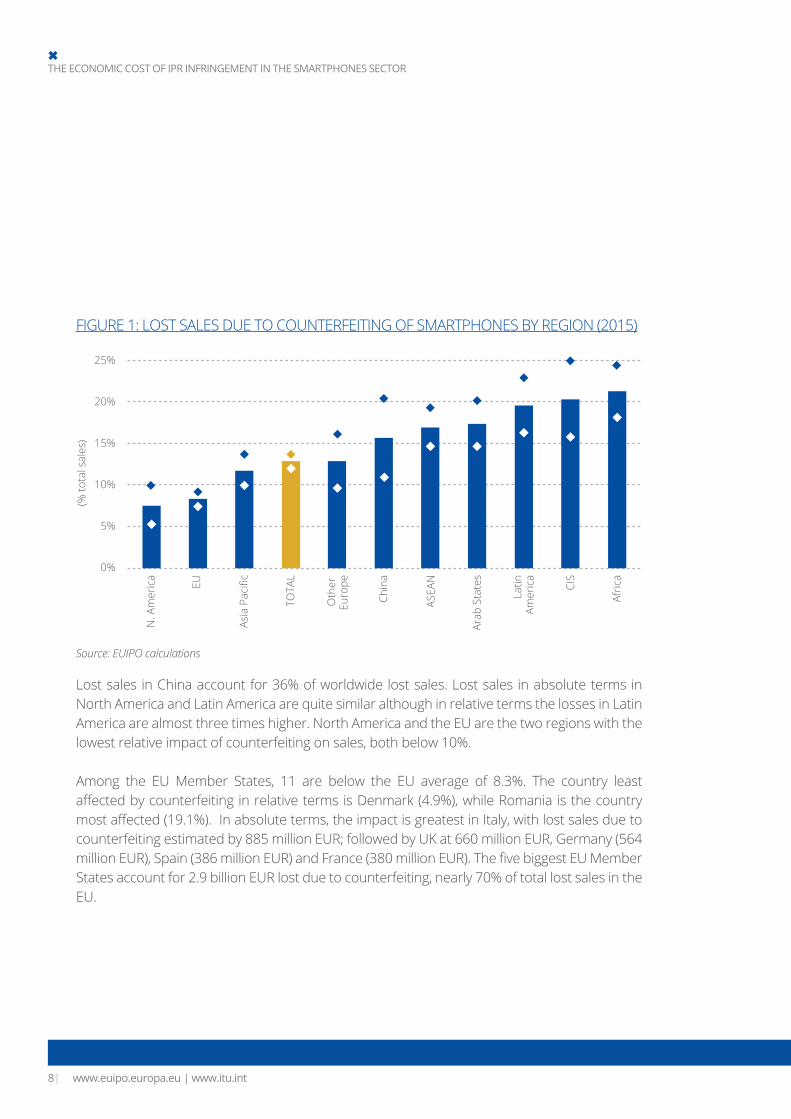
The resulting estimates of lost sales due to counterfeit smartphones in each region are shown inthefigurebelow.Thebarindicatestheimpactofcounterfeitingonthelegitimatesector’ssales,expressedasapercentageofsales,whilethediamondsindicatethe95%confidenceinterval of that estimate6.
*EU28 except Malta and Bulgaria**CIS Commonwealth of Independent States***Asia-PacificregionexceptChinaandASEANcountries**** ASEAN Association of Southeast Asian NationsSource: EUIPO calculations
6-The95%confidenceinterval is a statistical
calculation which means that there is a 95% probability that thetruefigureliesbetween the lower and upper bounds of that interval. For
example, for the EU as a whole, the estimated
percentage of lost sales is 8.3%, with a
95% probability that the true percentage
lies between 7.4% and 9.1%.
TABLE 1: LOST SALES DUE TO COUNTERFEITING OF SMARTPHONES BY REGION AND CONFIDENCE INTERVALS (2015)
Lost sales (million EUR) Lost (%) Upper Lower
European Union* 4,212.2 8.3% 9.1% 7.4%Other European Countries 1,207.0 12.9% 16.1% 9.7%CIS** 1,122.9 20.3% 25.0% 15.7%Asia-Pacific*** 7,166.6 11.8% 13.7% 10.0%ASEAN**** 2,674.9 16.9% 19.3% 14.6%Arab States 1,975.7 17.4% 20.2% 14.6%Africa 1,024.9 21.3% 24.4% 18.2%Latin America 4,706.5 19.6% 22.9% 16.2%North America 4,927.2 7.6% 9.9% 5.3%China 16,335.8 15.6% 20.4% 10.9%TOTAL 45,353.8 12.9% 13.7% 12.0%
THE ECONOMIC COST OF IPR INFRINGEMENT IN THE SMARTPHONES SECTOR
www.euipo.europa.eu | www.itu.int8|
FIGURE 1: LOST SALES DUE TO COUNTERFEITING OF SMARTPHONES BY REGION (2015)
25%
20%
15%
10%
5%
0%
(% to
tal s
ales
)
N. A
mer
ica
EU
Asia
Pac
ific
TOTA
L
Oth
er
Euro
pe
Latin
Amer
ica
Chin
a
ASEA
N
Arab
Sta
tes
CIS
Afric
a
Source: EUIPO calculations
Lost sales in China account for 36% of worldwide lost sales. Lost sales in absolute terms in North America and Latin America are quite similar although in relative terms the losses in Latin America are almost three times higher. North America and the EU are the two regions with the lowest relative impact of counterfeiting on sales, both below 10%.
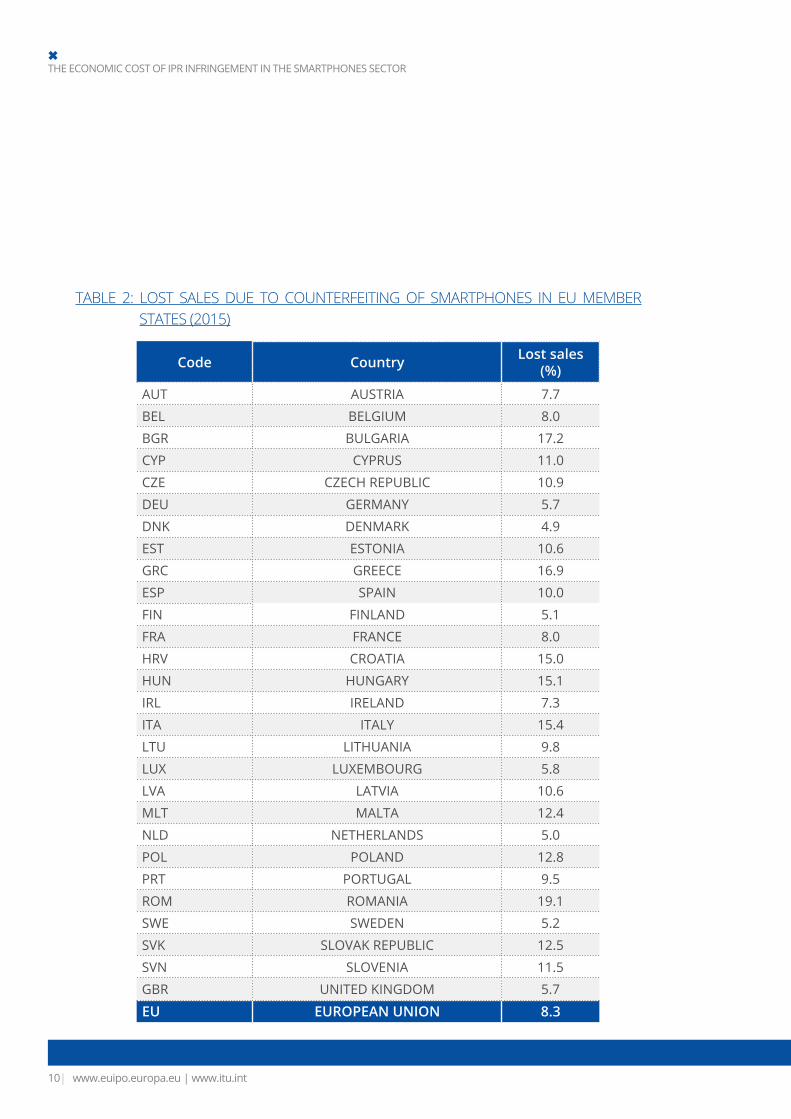
Among the EU Member States, 11 are below the EU average of 8.3%. The country least affectedbycounterfeitinginrelativetermsisDenmark(4.9%),whileRomaniaisthecountrymostaffected(19.1%).Inabsoluteterms,theimpactisgreatestinItaly,withlostsalesduetocounterfeiting estimated by 885 million EUR; followed by UK at 660 million EUR, Germany (564 millionEUR),Spain(386millionEUR)andFrance(380millionEUR).ThefivebiggestEUMemberStates account for 2.9 billion EUR lost due to counterfeiting, nearly 70% of total lost sales in the EU.
www.itu.int | www.euipo.europa.eu |9
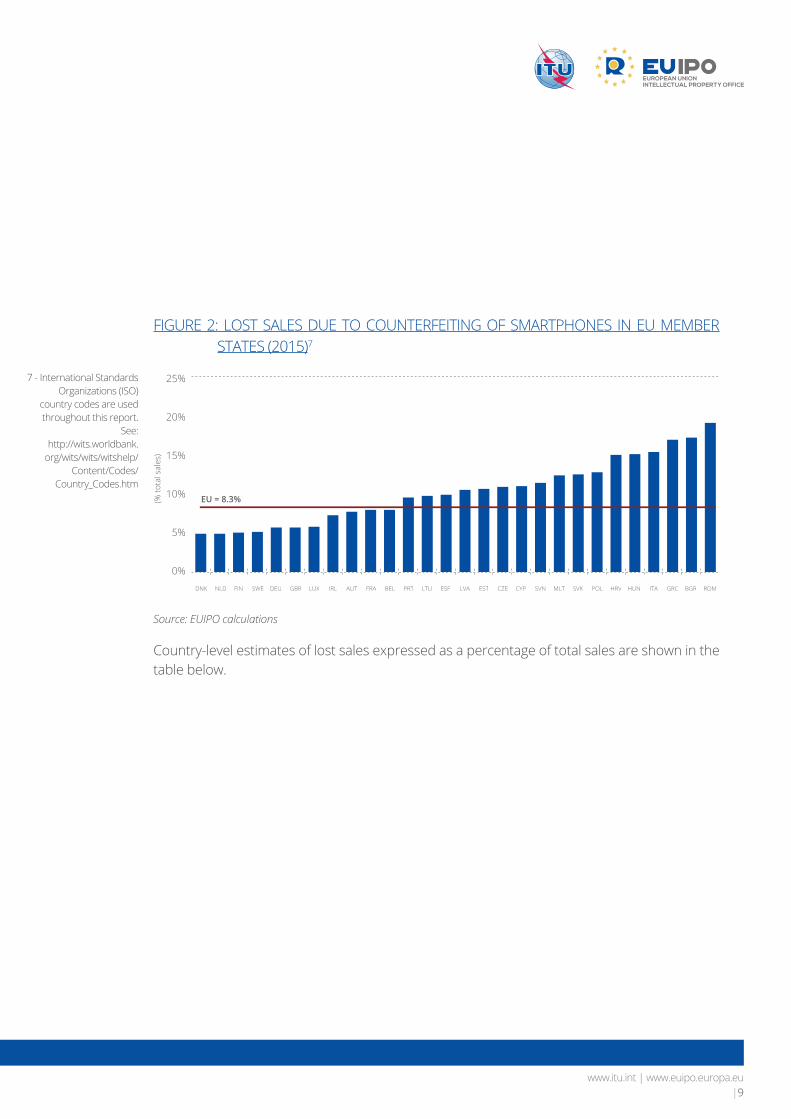
FIGURE 2: LOST SALES DUE TO COUNTERFEITING OF SMARTPHONES IN EU MEMBER STATES (2015)7
Source: EUIPO calculations
Country-level estimates of lost sales expressed as a percentage of total sales are shown in the table below.
25%
20%
15%
10%
5%
0%
EU = 8.3%(% to
tal s
ales
)
DNK NLD FIN SWE DEU GBR LUX IRL AUT FRA BEL PRT LTU ESP LVA EST CZE CYP SVN MLT SVK POL HRV HUN ITA GRC BGR ROM
7 - International Standards Organizations(ISO)
country codes are used throughout this report.
See:http://wits.worldbank.
org/wits/wits/witshelp/Content/Codes/
Country_Codes.htm
THE ECONOMIC COST OF IPR INFRINGEMENT IN THE SMARTPHONES SECTOR
www.euipo.europa.eu | www.itu.int10|
TABLE 2: LOST SALES DUE TO COUNTERFEITING OF SMARTPHONES IN EU MEMBER STATES (2015)
Code Country Lost sales (%)
AUT AUSTRIA 7.7
BEL BELGIUM 8.0
BGR BULGARIA 17.2
CYP CYPRUS 11.0
CZE CZECH REPUBLIC 10.9
DEU GERMANY 5.7
DNK DENMARK 4.9
EST ESTONIA 10.6
GRC GREECE 16.9
ESP SPAIN 10.0
FIN FINLAND 5.1
FRA FRANCE 8.0
HRV CROATIA 15.0
HUN HUNGARY 15.1
IRL IRELAND 7.3
ITA ITALY 15.4
LTU LITHUANIA 9.8
LUX LUXEMBOURG 5.8
LVA LATVIA 10.6
MLT MALTA 12.4
NLD NETHERLANDS 5.0
POL POLAND 12.8
PRT PORTUGAL 9.5
ROM ROMANIA 19.1
SWE SWEDEN 5.2
SVK SLOVAK REPUBLIC 12.5
SVN SLOVENIA 11.5
GBR UNITED KINGDOM 5.7
EU EUROPEAN UNION 8.3

www.itu.int | www.euipo.europa.eu |11
2.3. Non-economic impacts of counterfeit smartphones
This report focuses on the economic consequences of counterfeit smartphones. However, there are a number of other impacts in areas such as health and safety, environmental damage, network quality, cyber-security and privacy. A recent report by the ITU singles out the following non-economiceffectsofcounterfeitmobiledevices8:
lowering the quality of service of mobile telecommunication services, thus impacting the experience of consumers and businesses;
creatingasafetyhazardforconsumersduetouseofdefectiveorinadequatecomponentsor materials;
raising cybersecurity-related threats;
jeopardizingconsumerprivacy;
impairing the safety of digital transactions;
hurtingthemostfinanciallyvulnerableconsumersbyfailingtoprovideanywarrantiestotheconsumer and otherwise violating consumer law requirements;
creating risks to the environment and consumer health due to the use of hazardoussubstances in the manufacturing of these devices.
Many of these impacts are particularly serious in regions such as Africa where many consumers rely on their smartphones to an even greater extent than consumers in Europe or North America. The smartphone is often the only way to access the internet, and the main source of banking services (the M-PESA mobile banking service in Kenya being a well-known example). Any malware or other security breach that can be found in counterfeit devices has serious consequences in this context.
Counterfeit products, because of their poor assembly and use of poor quality components, containhazardous substances that arebanned inmany countriesunder the restrictionofhazardoussubstances(RoHS)ornationalequivalentlegislation.Thisposesriskstobothhealthand safety of the users and to the environment.
8 - “Counterfeit ICT equipment”, ITU
Technical Report, December 2015.
THE ECONOMIC COST OF IPR INFRINGEMENT IN THE SMARTPHONES SECTOR
www.euipo.europa.eu | www.itu.int12|
While the non-economic impacts outlined in this sub-section are beyond the scope of this report, they are clearly of significant societal importance andmust be kept inmindwhenconsidering the phenomenon of counterfeit smartphones.
www.itu.int | www.euipo.europa.eu |13
THE ECONOMIC COST OF IPR INFRINGEMENT IN THE SMARTPHONES SECTOR
3. INTRODUCTION
A major problem which has hindered the effective enforcement of Intellectual PropertyRights (IPR) in the EU is related to a lack of knowledge in relation to the precise scope, scale and impact of IPR infringements. Many attempts to quantify the scale of counterfeiting and itsconsequencesforbusinesses,consumersandsocietyasawholehavesufferedfromtheabsence of a consensual and consistent methodology for collecting and analysing data on counterfeitingandpiracyacrossvarioussectors.Differentapproacheshavebeenused,suchassurveys,mysteryshoppingormonitoringofonlineactivities,makingitallthemoredifficultto aggregate results for the whole economy. The very nature of the phenomenon under investigation makes it extremely challenging to quantify reliably, as obtaining comprehensive dataforahiddenandsecretiveactivityisbynecessitydifficult.
These challenges have in turn hindered the tasks of those involved in enforcing IP rights and in charge of establishing precise priorities, programmes and targets for enforcement, as they limit the possibilities to design more focused policies as well as evidence-based public awareness campaigns.
To help overcome these challenges while taking fully into account of methodological constraints,theObservatorydevelopedaspecificapproachthathassofarbeenappliedtothe Cosmetics and Personal Care; Clothing, Footwear and Accessories; Sports Goods; Games and Toys; Jewellery and Watches; Handbags and Luggage; Recorded Music; Wine and Spirits; Pharmaceutical; and Pesticides sectors. In the present report the Observatory focuses its attention on the smartphones sector.
Theincreasingrolethatmobiledevices,specificallysmartphones,areplayingincommunicationservices, applications and e-services (m-payments, m-agriculture, m-learning and many others) have raised the importance of such devices, and made them essential. The number of mobile phones, which started out as simple voice communication terminals, has steadily increased around the world, evolving towards smartphones in many cases. While this has created economic and social and opportunities for people around the world, it has also raised concerns regarding trust and security of such devices, in particular with policy makers and National ICT Regulatory Authorities (NRAs). When equipment is not fully trustworthy, the quality of service ofcommunicationcanbeaffected,personalinformationmaybemisusedorirrecoverable,andhealth and security harmed.

THE ECONOMIC COST OF IPR INFRINGEMENT IN THE SMARTPHONES SECTOR
www.euipo.europa.eu | www.itu.int14|
3.1. The global market for smartphones
Based on GfK data9 1.3 billion smartphones were sold in 2015 globally, meaning that 1 in 6 people in the world have purchased a smartphone that year, roughly equal to the entire population of China or India.
China, with 20% of the World population and a smartphones penetration of 65 connections per 100 inhabitants10 is the leading market with 30% of smartphones sold accounting for385millionunits.TheAsia -Pacificarea11, with 29% of the total population and a smartphones penetration ratio of 25, registers 221 million smartphones sold in 2015, 17% of total sales; North America has the highest penetration ratio at 78 connections per 100 inhabitants and sales are estimated at 190 million units; and the EU12, with a penetration of 76, registered more than 150 million units sold13.
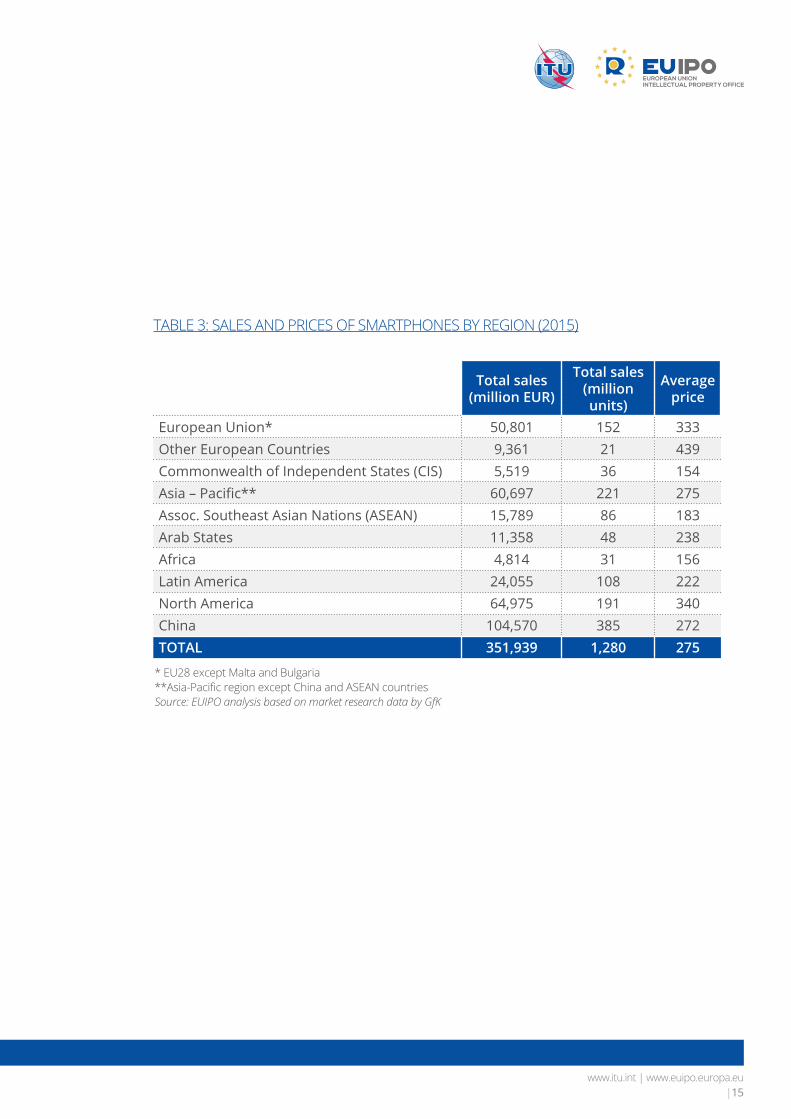
Thevalueofthedevicessoldin2015is352billionEUR,hencetheaveragenonsubsidizedprice14 of smartphones sold in all countries is 275 EUR. The value of devices sold in China is 105 billion EUR with an average price of 272 EUR per unit. The nine African countries included in this study and the CIS countries show the lowest average prices of 156 and 154 EUR per unit and sales values around 5 billion EUR. In North America total sales amount to 65 billion EUR with an average price of 340 EUR and in EU countries total sales are 51 billion EUR at an average price of 333 EUR. Finally, the average price in the rest of Europe is 439 EUR per unit, resulting in a market value of 9 billion EUR. The table below shows sales and average prices by region.
Thefiguresinthisreportrefertosalesofnewsmartphones.Insomeregions,particularlyin low-income countries, there is an important market for second-hand and refurbished smartphones. In the refurbished market there is a further potential for IPR infringement, for example when the outer shell of a genuine branded smartphone is combined with non-originalcomponents.Inprinciple,theeffectofthistypeofinfringementiscapturedby the methodology used in this study, but in the absence of reliable data it is not feasible toquantifyitsimpactseparately.Suchquantificationcouldbethesubjectofafuturestudy.
9 - GfK Retail & Technology GmbH is a German market research institute:
http://www.gfk.com/about-gfk/about-gfk/. The data on smartphones used in this report cover more than 90 countries representing 94% of the World population. Only Africa has a lower coverage including 56% of the population in the region, with Ethiopia, Democratic Republic of the Congo and Sudan the most populous missing countries. The data and methodology used in this report are described in Section 5.
10-Penetrationratioisdefinedinthis report as the number of smartphone connections per 100 inhabitants in contrast with other definitionsusingsubscriptionsper 100 inhabitants. The term ‘connections’defineswirelessaccounts and corresponds to the number of SIM cards. This term is differentfromuniquesubscribers.
11-TheAsia-Pacificregion,as
definedinthisreport,doesnotinclude China or the ASEAN countries. Table 4 shows the countries included in each region.
12 - The data for the EU is based
on 26 Member States, as data for Malta and Bulgaria was not available.
13 - List of countries included in each region are shown in Section 4.
14 - Nonsubsidized(orunsubsidized)price of a phone is the full price of the device, covering the actual cost paid to the phone manufacturer including taxes such as VAT. This price is comparable among countries and in time, in contrast to the subsidized price often part of a contract for voice and data services, conditional on the acceptance of restricting the device during a period of time to one particular operator. The differencebetweenrealcostandthe price paid by the consumer is the subsidy paid by carriers.
www.itu.int | www.euipo.europa.eu |15
TABLE 3: SALES AND PRICES OF SMARTPHONES BY REGION (2015)
Total sales (million EUR)
Total sales (million units)
Average price
European Union* 50,801 152 333Other European Countries 9,361 21 439Commonwealth of Independent States (CIS) 5,519 36 154Asia – Pacific** 60,697 221 275Assoc. Southeast Asian Nations (ASEAN) 15,789 86 183Arab States 11,358 48 238Africa 4,814 31 156Latin America 24,055 108 222North America 64,975 191 340China 104,570 385 272TOTAL 351,939 1,280 275
* EU28 except Malta and Bulgaria**Asia-PacificregionexceptChinaandASEANcountries Source: EUIPO analysis based on market research data by GfK
THE ECONOMIC COST OF IPR INFRINGEMENT IN THE SMARTPHONES SECTOR
www.euipo.europa.eu | www.itu.int16|
THE ECONOMIC COST OF IPR INFRINGEMENT IN THE SMARTPHONES SECTOR
4. COUNTRY LEVEL RESULTS
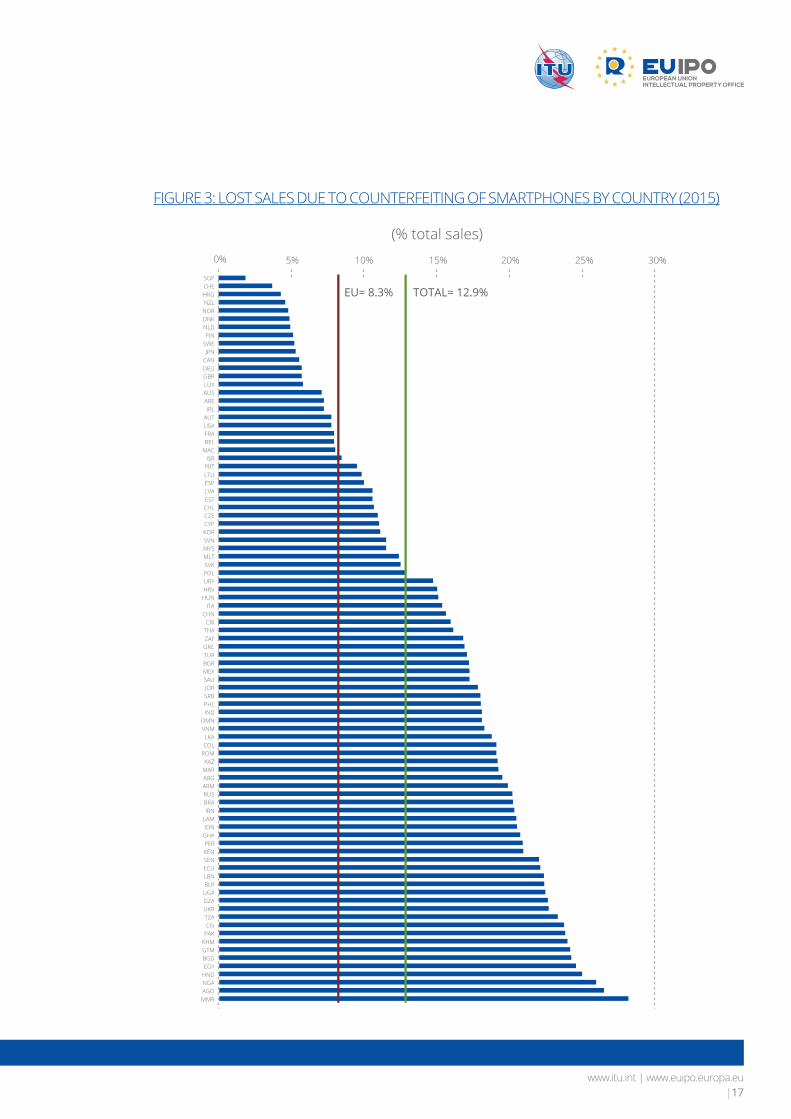
The resulting estimates of the lost sales due to counterfeit smartphones for all countries analysedare shown in thefigurebelow. Foreachcountry, thebar indicates the impactofcounterfeitingonthelegitimatesector’ssales,expressedasapercentageofsalesinyear2015.Theverticallinesrepresenttheaverageeffectinallcountriesandinthe26EUMemberStatesincluded in the study.
www.itu.int | www.euipo.europa.eu |17
FIGURE 3: LOST SALES DUE TO COUNTERFEITING OF SMARTPHONES BY COUNTRY (2015)
SGP
EU= 8.3% TOTAL= 12.9%CHEHKGNZL
NORDNKNLDFIN
SWEJPN
CANDEUGBRLUXAUSAREIRL
AUTUSAFRABEL
MACISR
PRTLTUESPLVAESTCHLCZECYPKORSVNMYSMLTSVKPOLURYHRV
HUNITA
CHNCRI
THAZAF
GRCTURBGRMEXSAUJORSRBPHLIND
OMNVNMLKACOL
ROMKAZ
MARARGARMRUSBRAIRN
LAMIDN
GHAPERKENSENECULBNBLR
UGADZAUKRTZACIV
PAKKHMGTMBGDEGY
HNDNGAAGOMMR
0% 5% 10% 15% 20% 25% 30%
(% total sales)
THE ECONOMIC COST OF IPR INFRINGEMENT IN THE SMARTPHONES SECTOR
www.euipo.europa.eu | www.itu.int18|
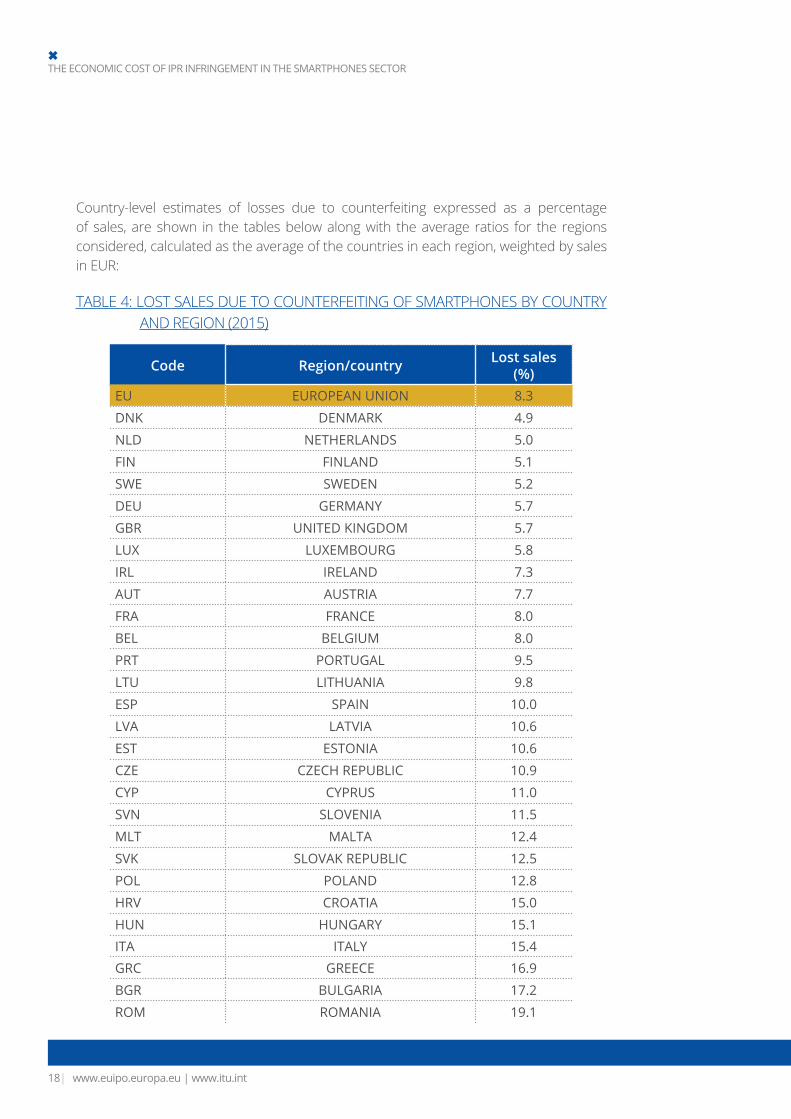
Country-level estimates of losses due to counterfeiting expressed as a percentage of sales, are shown in the tables below along with the average ratios for the regions considered, calculated as the average of the countries in each region, weighted by sales in EUR:
TABLE 4: LOST SALES DUE TO COUNTERFEITING OF SMARTPHONES BY COUNTRY AND REGION (2015)
Code Region/country Lost sales (%)
EU EUROPEAN UNION 8.3
DNK DENMARK 4.9
NLD NETHERLANDS 5.0
FIN FINLAND 5.1
SWE SWEDEN 5.2
DEU GERMANY 5.7
GBR UNITED KINGDOM 5.7
LUX LUXEMBOURG 5.8
IRL IRELAND 7.3
AUT AUSTRIA 7.7
FRA FRANCE 8.0
BEL BELGIUM 8.0
PRT PORTUGAL 9.5
LTU LITHUANIA 9.8
ESP SPAIN 10.0
LVA LATVIA 10.6
EST ESTONIA 10.6
CZE CZECH REPUBLIC 10.9
CYP CYPRUS 11.0
SVN SLOVENIA 11.5
MLT MALTA 12.4
SVK SLOVAK REPUBLIC 12.5
POL POLAND 12.8
HRV CROATIA 15.0
HUN HUNGARY 15.1ITA ITALY 15.4GRC GREECE 16.9
BGR BULGARIA 17.2
ROM ROMANIA 19.1

www.itu.int | www.euipo.europa.eu |19
EUR OTHER EUROPEAN COUNTRIES 12.9
CHE SWITZERLAND 3.7
NOR NORWAY 4.8
ISR ISRAEL 8.5
TUR TURKEY 17.1
SRB SERBIA 18.0
Code Region/country Lost sales (%)
CIS CIS COUNTRIES** 20.3
KAZ KAZAKHSTAN 19.2
ARM ARMENIA 19.8
RUS RUSSIAN FEDERATION 20.2
BLR BELARUS 22.4
UKR UKRAINE 22.7
LA LATIN AMERICA 19.6
CHL CHILE 10.7
URY URUGUAY 14.7
CRI COSTA RICA 16.0
MEX MEXICO 17.2
COL COLOMBIA 19.1
ARG ARGENTINA 19.5
BRA BRAZIL 20.2
LAM OTHER LATIN AMERICAN 20.5
PER PERU 20.9
ECU ECUADOR 22.1
GTM GUATEMALA 24.2
HND HONDURAS 25.0
NOA NORTH AMERICA 7.6
CAN CANADA 5.5
USA UNITED STATES 7.8

THE ECONOMIC COST OF IPR INFRINGEMENT IN THE SMARTPHONES SECTOR
www.euipo.europa.eu | www.itu.int20|
Code Region/country Lost sales (%)
ASP ASIAN AND PACIFIC COUNTRIES 11.8
HKG HONG KONG SAR, CHINA 4.3
NZL NEW ZEALAND 4.6
JPN JAPAN 5.3
AUS AUSTRALIA 7.1
MAC MACAO SAR, CHINA 8.0
KOR KOREA, REP. 11.1
IND INDIA 18.1
LKA SRI LANKA 18.7
IRN IRAN, ISLAMIC REP. 20.3
PAK PAKISTAN 23.8
BGD BANGLADESH 24.3
CHN CHINA 15.6
ASEAN ASEAN COUNTRIES* 16.9
SGP SINGAPORE 1.9
MYS MALAYSIA 11.6
THA THAILAND 16.1
PHL PHILIPPINES 18.0
VNM VIETNAM 18.2
IDN INDONESIA 20.5
KHM CAMBODIA 24.0
MMR MYANMAR 28.1

www.itu.int | www.euipo.europa.eu |21
* ASEAN Association of Southeast Asian Nations**CIS = Commonwealth of Independent StatesSource: EUIPO calculations
The biggest relative impact of counterfeiting is observed in Myanmar where 28% of sales are lost due to counterfeit smartphones. Lost sales due to counterfeiting are above 20% in a total of 26 countries, mostly in Africa (8) and Latin America (6).
At the other extreme, lost sales due to counterfeiting in Singapore are estimated to be less than 2% of total sales. Another 26 countries have lost sales below 10%, including US and Canada and 14 EU Member States.
Code Region/country Lost sales (%)
ARB ARAB STATES 17.4
ARE UNITED ARAB EMIRATES 7.2
SAU SAUDI ARABIA 17.2
JOR JORDAN 17.8
OMN OMAN 18.1
MAR MOROCCO 19.3
LBN LEBANON 22.4
DZA ALGERIA 22.6
EGY EGYPT, ARAB REP. 24.5AFR AFRICA 21.3
ZAF SOUTH AFRICA 16.8
GHA GHANA 20.7
KEN KENYA 21.0
SEN SENEGAL 22.1
UGA UGANDA 22.4
TZA TANZANIA 23.3
CIV CÔTE D'IVOIRE 23.7
NGA NIGERIA 26.0
AGO ANGOLA 26.4

THE ECONOMIC COST OF IPR INFRINGEMENT IN THE SMARTPHONES SECTOR
www.euipo.europa.eu | www.itu.int22|
THE ECONOMIC COST OF IPR INFRINGEMENT IN THE SMARTPHONES SECTOR
5. METHODOLOGY
The methodology builds on an adaptation of a methodology developed for the European Commission15sothatitcanbeusedonasectoriallevelratherthanonafirmlevelwhichprovedverydifficulttoapplyinpractice.
Themethodologyusedfortheestimationoftheeconomiceffectsofcounterfeitingisdepictedinthefollowingfigure:
The first stage is comprised of the compilation of actual sales of smartphones and thedevelopment of a forecasting model of sales in each country.
5.1. First stage: real versus expected sales
Data on sales of smartphones in units and value in USD and EUR were purchased from GfK16. The database includes quarterly data for the period 2013-2015 of consumer purchases basedonpoint-of-sale(POS)trackingof86countries.ThePOStrackingsplitsalesintodifferentretail channels (technical superstores, operators, other telecommunication specialists, direct sales,etc.)toensureanappropriatecoverageofdifferentdistributionchannels.WhenPOSdata is compared to the total market, which is estimated based on inputs such as annual shipments from vendors to the country and information from third parties (e.g. associations), a coverage gap remains. This coverage gap is usually caused by missing distribution channels, as GfK ensures complete coverage of the channels present in its data by applying extrapolation factors for missing retailers within a channel. To calculate total market sales, the missing channels are extrapolated to reach 100% coverage and this is the value used for this study.
SALESBY COUNTRY
B: COUNTERFEITINGRELATED VARIABLES
A: SOCIO-EC VARIABLES
FORECASTING ERRORSFORECAST MODEL
15 - RAND (2012): Measuring IPR infringements in the internal market. Report prepared for the European Commission. RAND proposed to analyse ex-post the forecast errors on the level of individual companies, usingcompany-specificexplanatory variables. However, attempts at implementing the methodology in this manner were not successful, mainly due to the fact that most companies are not able or willing to provide the required data on past budgeted and actual sales revenues. Therefore, the methodology has beenmodifiedtoallowits use on sector-level data which can be obtained from public sources.
16 - http://www.gfk.com/solutions/point-of-sales-tracking/point-of-sales-tracking/

www.itu.int | www.euipo.europa.eu |23
The coverage of total sales based on POS data is an average of 83% of total units sold in 2015. Ten countries have a coverage ratio below 50% and 20 countries between 50 and 70%. Among large countries France (55%) and India (43%) show the lowest coverage ratio based on POS.
North American sales are estimated based on proprietary market modelling and consumer research rather than POS data so that sales for United States and Canada are not included separately but as a total for North America. The totals for Mexico, Panama and other Latin America countries17 are also estimated based on modelling and presented jointly as ‘rest of LatinAmerica’.
Finally,valuesinUSDandEURarebasedonnonsubsidizedretailpricingincludingtaxessuchas VAT. Prices at country level can be estimated based on sales in units and EUR and provide the basic information to transform lost sales in units into lost sales in EUR.
Expected sales in units are estimated based on a methodology developed for the ITU18 by TelecomAdvisoryServices,aninternationalconsultingfirmspecialisinginprovidingadvisoryservices to telecommunications and technology companies, governments and international organisations. The methodology estimates the number of smartphones sold based on the new connections and new smartphones resulting from replacing obsolete devices. The number of replaced smartphones was calculated based on a replacement factor determined a priori basedonthemarketcharacteristicsofeachcountry.Thismethodologyhasbeenmodifiedtoconsiderdifferentsmartphonesreplacementfactorsincountrieswithdifferentcharacteristicssuch as the development level in ICT (Information and Communication Technology) as well as the relationship between real sales and smartphones connections in previous years.
The analysis is based on data published by the GSMA Association19 on the number of smartphone mobile connections20. In the present report the number of smartphone SIM connections is used, as opposed to unique mobile subscribers. Therefore, multiple connections of a single subscriber correspond to multiple devices and this is why this measure is appropriate here, althoughinotherstudiesmarketpenetrationisdefinedbasedonuniquesubscribers.
Expected sales are estimated as the yearly increase of smartphone connections (new smartphone users as well as feature phone users who have migrated to a smartphone while keeping the same SIM card) added to the smartphones replaced from previous year (replacing obsolete smartphones). The second term is a replacement factor which depends on the propensity of users to replace their old smartphone with a new one in any given year. This factordiffersfromcountrytocountry.
17 - Bolivia, Cuba, Dominican Republic,
El Salvador, Haiti, Nicaragua, Paraguay,
Puerto Rico, Trinidad y TobagoandVenezuela
are also included in this aggregate, in
addition to a number of smaller territories
with less than one million inhabitants.
18 - “Methodology
for estimating smartphones and
feature phones worldwide annual
shipments”, unpublished
manuscript http://www.teleadvs.com/
19 - https://www.gsmaintelligence.com/
20 - The term “connections”defineswireless accounts and equals the number of
SIM cards. This term is differentfromunique
subscribers.
THE ECONOMIC COST OF IPR INFRINGEMENT IN THE SMARTPHONES SECTOR
www.euipo.europa.eu | www.itu.int24|
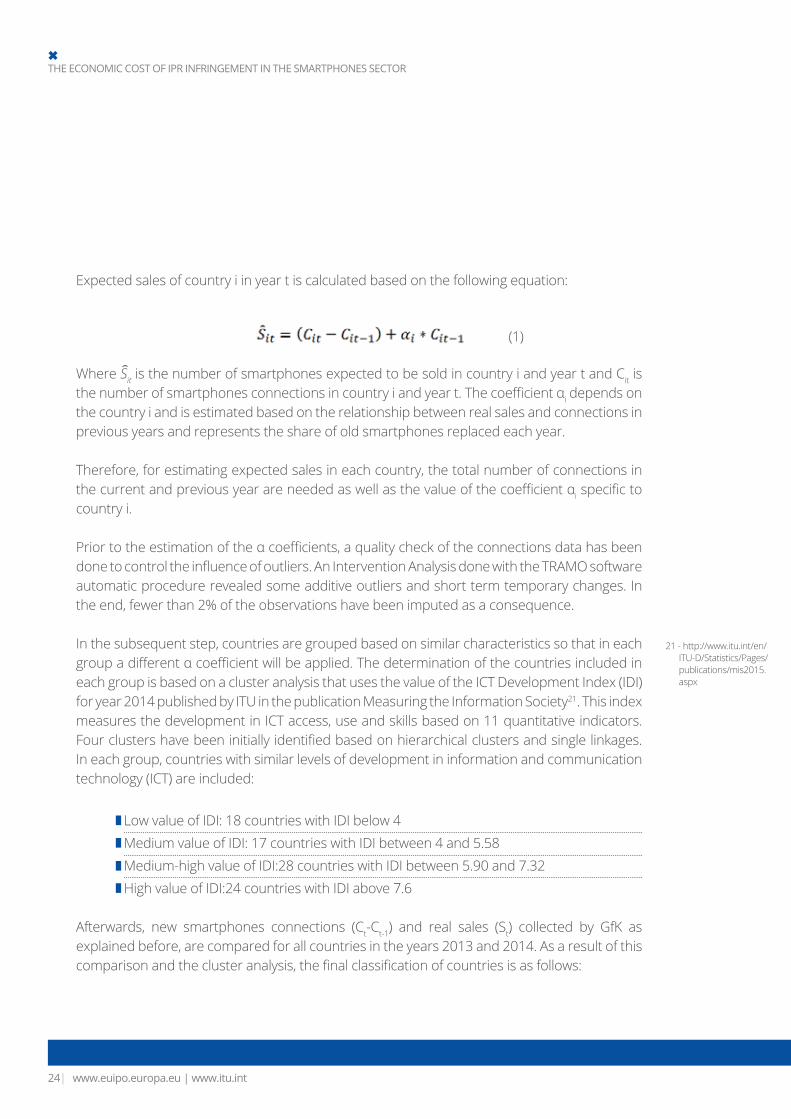
Expected sales of country i in year t is calculated based on the following equation:
Where Sit is the number of smartphones expected to be sold in country i and year t and Cit is thenumberofsmartphonesconnectionsincountryiandyeart.Thecoefficientαi depends on the country i and is estimated based on the relationship between real sales and connections in previous years and represents the share of old smartphones replaced each year.
Therefore, for estimating expected sales in each country, the total number of connections in thecurrentandpreviousyearareneededaswellasthevalueofthecoefficientαispecifictocountry i.
Prior to the estimation of the αcoefficients,aqualitycheckoftheconnectionsdatahasbeendonetocontroltheinfluenceofoutliers.AnInterventionAnalysisdonewiththeTRAMOsoftwareautomatic procedure revealed some additive outliers and short term temporary changes. In the end, fewer than 2% of the observations have been imputed as a consequence.
In the subsequent step, countries are grouped based on similar characteristics so that in each groupadifferentαcoefficientwillbeapplied.Thedeterminationofthecountriesincludedineach group is based on a cluster analysis that uses the value of the ICT Development Index (IDI) for year 2014 published by ITU in the publication Measuring the Information Society21. This index measures the development in ICT access, use and skills based on 11 quantitative indicators. Fourclustershavebeeninitiallyidentifiedbasedonhierarchicalclustersandsinglelinkages.In each group, countries with similar levels of development in information and communication technology (ICT) are included:
Low value of IDI: 18 countries with IDI below 4 Medium value of IDI: 17 countries with IDI between 4 and 5.58 Medium-high value of IDI:28 countries with IDI between 5.90 and 7.32 High value of IDI:24 countries with IDI above 7.6
Afterwards, new smartphones connections (Ct-Ct-1) and real sales (St) collected by GfK as explained before, are compared for all countries in the years 2013 and 2014. As a result of this comparisonandtheclusteranalysis,thefinalclassificationofcountriesisasfollows:
21 - http://www.itu.int/en/ITU-D/Statistics/Pages/publications/mis2015.aspx
(1)
www.itu.int | www.euipo.europa.eu |25
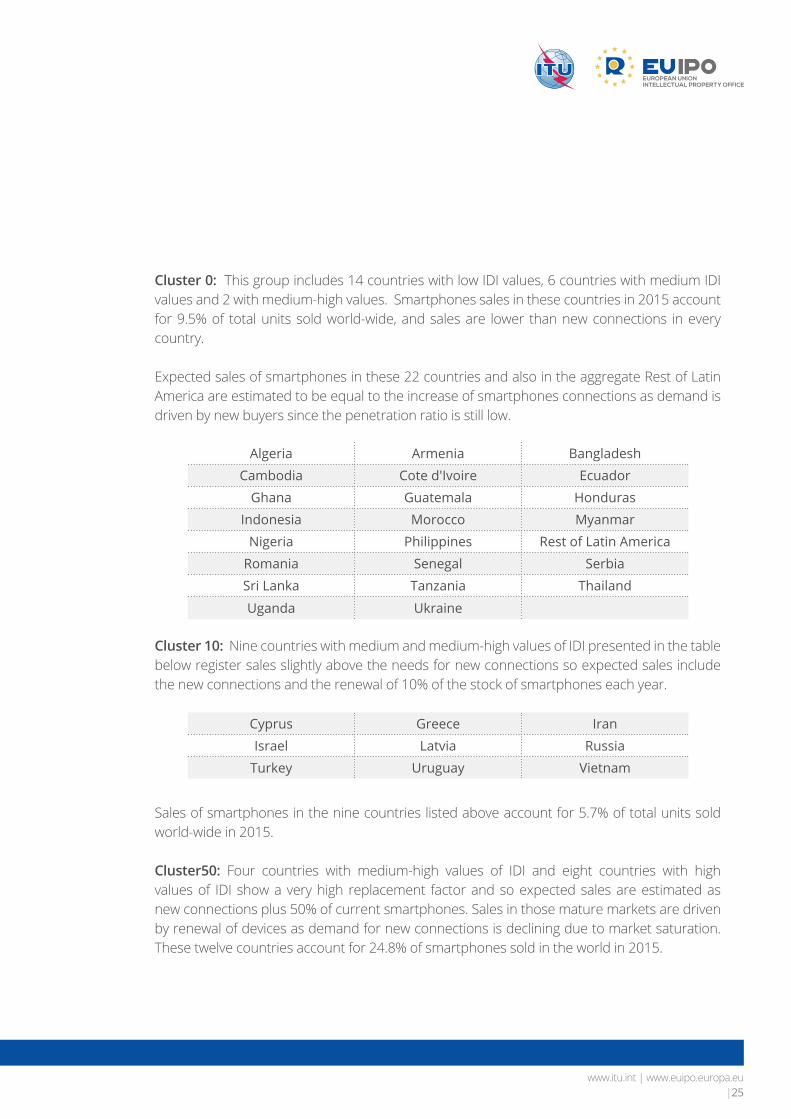
Cluster 0: This group includes 14 countries with low IDI values, 6 countries with medium IDI values and 2 with medium-high values. Smartphones sales in these countries in 2015 account for 9.5% of total units sold world-wide, and sales are lower than new connections in every country.
Expected sales of smartphones in these 22 countries and also in the aggregate Rest of Latin America are estimated to be equal to the increase of smartphones connections as demand is driven by new buyers since the penetration ratio is still low.
Cluster 10: Nine countries with medium and medium-high values of IDI presented in the table below register sales slightly above the needs for new connections so expected sales include the new connections and the renewal of 10% of the stock of smartphones each year.
Sales of smartphones in the nine countries listed above account for 5.7% of total units sold world-wide in 2015.
Cluster50: Four countries with medium-high values of IDI and eight countries with high values of IDI show a very high replacement factor and so expected sales are estimated as new connections plus 50% of current smartphones. Sales in those mature markets are driven by renewal of devices as demand for new connections is declining due to market saturation. These twelve countries account for 24.8% of smartphones sold in the world in 2015.
Algeria Armenia Bangladesh
Cambodia Cote d'Ivoire Ecuador
Ghana Guatemala Honduras
Indonesia Morocco Myanmar
Nigeria Philippines Rest of Latin America
Romania Senegal Serbia
Sri Lanka Tanzania Thailand
Uganda Ukraine
Cyprus Greece Iran
Israel Latvia Russia
Turkey Uruguay Vietnam

THE ECONOMIC COST OF IPR INFRINGEMENT IN THE SMARTPHONES SECTOR
www.euipo.europa.eu | www.itu.int26|
Cluster25: The remaining 42 countries cover 60% of the smartphones sold world-wide in 2015 and expected sales are estimated as new connections plus 25% of older smartphones. This group of countries is considered as the base for comparison purposes.
The presence of several highly developed countries in the last group (18 EU Member States as well as Australia, Japan, New Zealand, Norway and Singapore) is explained by lower replacement factors found in those countries, compared with the 12 countries included in cluster50.
The α coefficient (replacement factor) estimated for all 86 countries is 21% and can beunderstood as an average period of “obsolescence” of four years and nine months.
Finally, equation 1 is used to estimate expected sales in 2015 based on smartphones connectionsin2015and2014anddifferentαcoefficients:0;0.10;0.25;and0.50dependingon the cluster in which each country is included.
Canada Chile Germany
Hong Kong Ireland Jordan
Lebanon Saudi Arabia South Korea
Spain United Kingdom United States
Angola Argentina Australia Austria
Belarus Belgium Brazil China
Colombia Costa Rica Croatia Czech Republic
Denmark Egypt Estonia Finland
France Hungary India Italy
Japan Kazakhstan Kenya Lithuania
Luxembourg Macau Malaysia Netherlands
New Zealand Norway Oman Pakistan
Peru Poland Portugal Slovakia
Slovenia Singapore South Africa Sweden
Switzerland U. Arab Emirates

www.itu.int | www.euipo.europa.eu |27
Theforecasterroristhedifferencebetweenexpectedandrealsalesandforthepurposesofcomparability is expressed as a proportion of actual sales, as shown in the following equation:
where Sit is the number of units sold in country i and year t (2015) and Sit is the number of units expected to be sold in that year, as calculated in the previous step.
The relative error q*it measures the extent to which the model has predicted a higher or lower
value (as a share of actual sales) versus the actual level of sales, expressed in units.
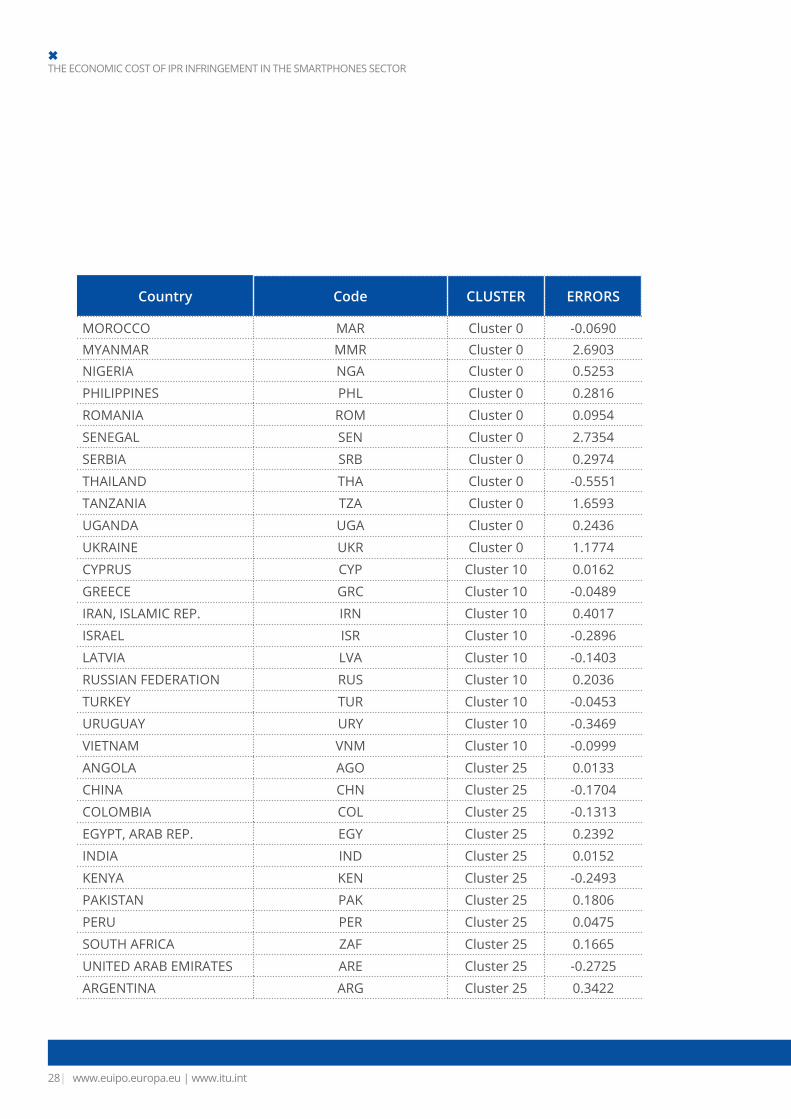
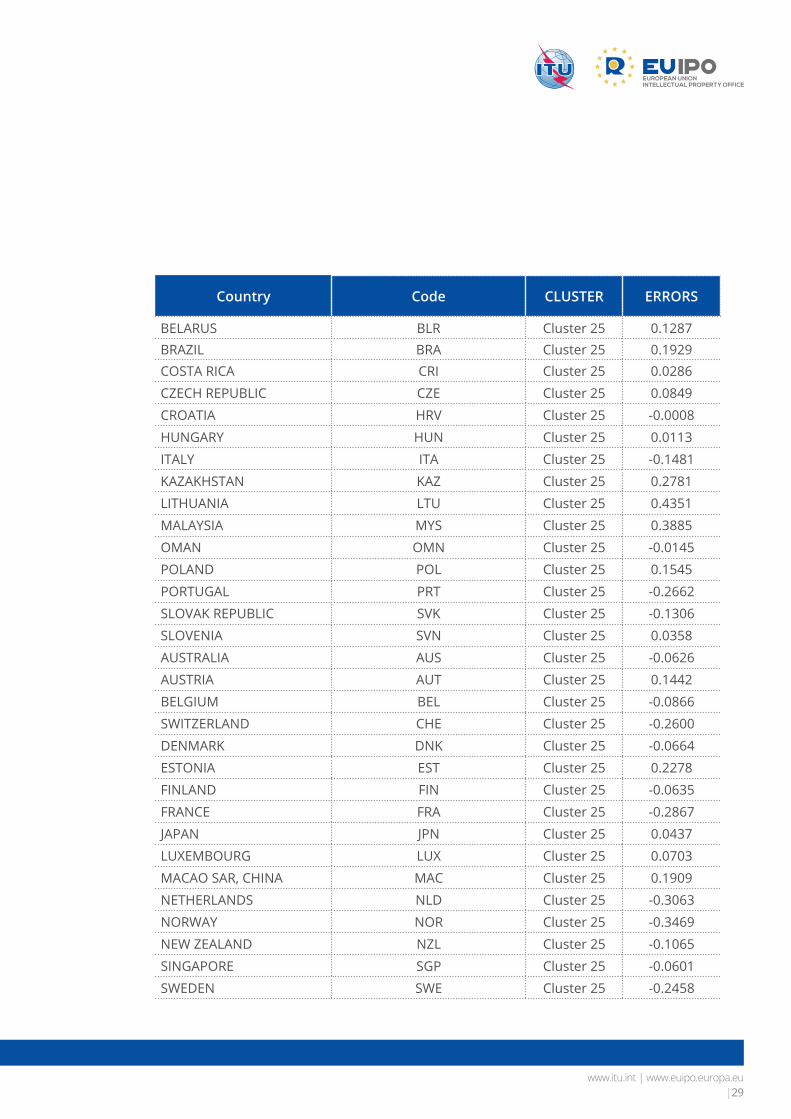
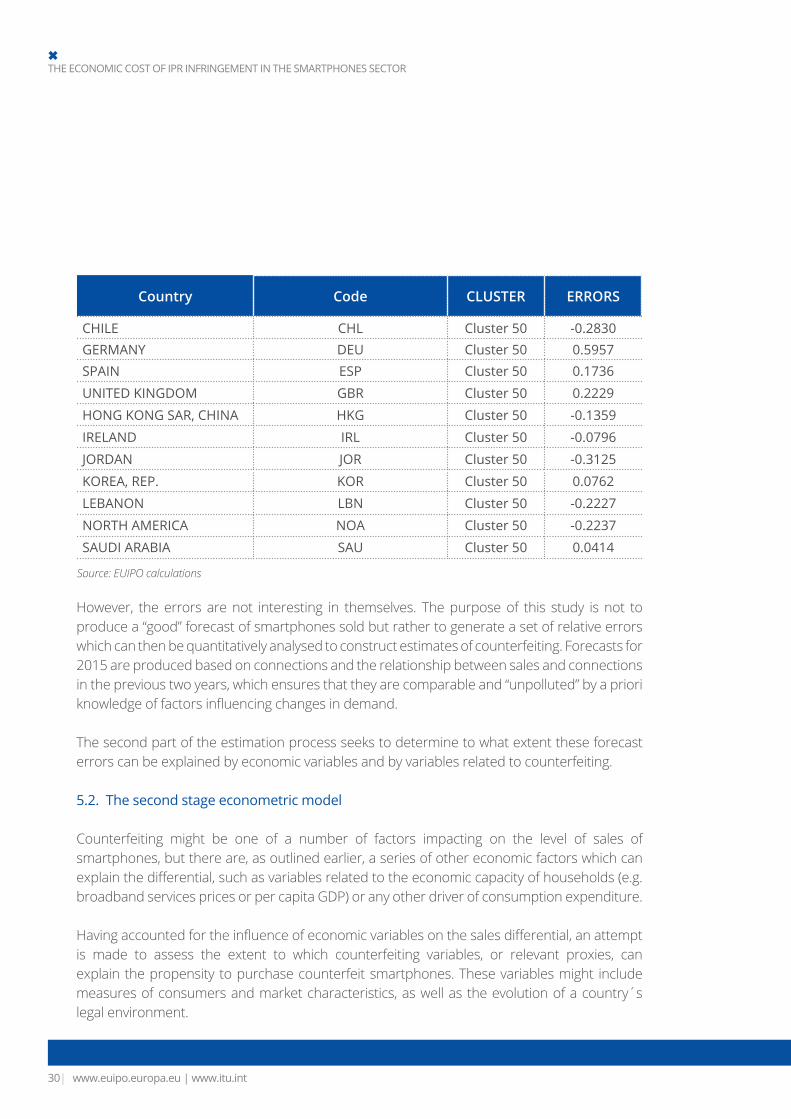
The errors are presented in the table below. It is evident that these errors exhibit a large degree of variability. They are presented ordered by cluster to consider the fact that for each groupofcountriesexpectedsaleswereestimatedapplyingdifferentαcoefficients.Thehighesterrors are registered in thefirst groupof countries (Cluster0),meaning that even thoughsales are estimated based on the increase of smartphones connections without including any replacement for older devices, in those countries expected sales are on average much higher than real sales.
(2)
TABLE 5: RELATIVE FORECAST ERRORS (2015)
Country Code CLUSTER ERRORS
ARMENIA ARM Cluster 0 0.3383BANGLADESH BGD Cluster 0 0.6829CÔTE D'IVOIRE CIV Cluster 0 1.2145
ALGERIA DZA Cluster 0 0.5180
ECUADOR ECU Cluster 0 -1.4372
GHANA GHA Cluster 0 0.6481
GUATEMALA GTM Cluster 0 0.7112
HONDURAS HND Cluster 0 1.2708
INDONESIA IDN Cluster 0 0.1750
CAMBODIA KHM Cluster 0 1.4425
OTHER LATIN AMERICAN LAM Cluster 0 0.3481
SRI LANKA LKA Cluster 0 1.2956
THE ECONOMIC COST OF IPR INFRINGEMENT IN THE SMARTPHONES SECTOR
www.euipo.europa.eu | www.itu.int28|
Country Code CLUSTER ERRORS
MOROCCO MAR Cluster 0 -0.0690MYANMAR MMR Cluster 0 2.6903NIGERIA NGA Cluster 0 0.5253
PHILIPPINES PHL Cluster 0 0.2816
ROMANIA ROM Cluster 0 0.0954
SENEGAL SEN Cluster 0 2.7354
SERBIA SRB Cluster 0 0.2974
THAILAND THA Cluster 0 -0.5551
TANZANIA TZA Cluster 0 1.6593
UGANDA UGA Cluster 0 0.2436
UKRAINE UKR Cluster 0 1.1774
CYPRUS CYP Cluster 10 0.0162
GREECE GRC Cluster 10 -0.0489
IRAN, ISLAMIC REP. IRN Cluster 10 0.4017
ISRAEL ISR Cluster 10 -0.2896
LATVIA LVA Cluster 10 -0.1403
RUSSIAN FEDERATION RUS Cluster 10 0.2036
TURKEY TUR Cluster 10 -0.0453
URUGUAY URY Cluster 10 -0.3469
VIETNAM VNM Cluster 10 -0.0999
ANGOLA AGO Cluster 25 0.0133
CHINA CHN Cluster 25 -0.1704
COLOMBIA COL Cluster 25 -0.1313
EGYPT, ARAB REP. EGY Cluster 25 0.2392
INDIA IND Cluster 25 0.0152
KENYA KEN Cluster 25 -0.2493
PAKISTAN PAK Cluster 25 0.1806
PERU PER Cluster 25 0.0475
SOUTH AFRICA ZAF Cluster 25 0.1665
UNITED ARAB EMIRATES ARE Cluster 25 -0.2725
ARGENTINA ARG Cluster 25 0.3422
www.itu.int | www.euipo.europa.eu |29
Country Code CLUSTER ERRORS
BELARUS BLR Cluster 25 0.1287BRAZIL BRA Cluster 25 0.1929COSTA RICA CRI Cluster 25 0.0286
CZECH REPUBLIC CZE Cluster 25 0.0849
CROATIA HRV Cluster 25 -0.0008
HUNGARY HUN Cluster 25 0.0113
ITALY ITA Cluster 25 -0.1481
KAZAKHSTAN KAZ Cluster 25 0.2781
LITHUANIA LTU Cluster 25 0.4351
MALAYSIA MYS Cluster 25 0.3885
OMAN OMN Cluster 25 -0.0145
POLAND POL Cluster 25 0.1545
PORTUGAL PRT Cluster 25 -0.2662
SLOVAK REPUBLIC SVK Cluster 25 -0.1306
SLOVENIA SVN Cluster 25 0.0358
AUSTRALIA AUS Cluster 25 -0.0626
AUSTRIA AUT Cluster 25 0.1442
BELGIUM BEL Cluster 25 -0.0866
SWITZERLAND CHE Cluster 25 -0.2600
DENMARK DNK Cluster 25 -0.0664
ESTONIA EST Cluster 25 0.2278
FINLAND FIN Cluster 25 -0.0635
FRANCE FRA Cluster 25 -0.2867
JAPAN JPN Cluster 25 0.0437
LUXEMBOURG LUX Cluster 25 0.0703
MACAO SAR, CHINA MAC Cluster 25 0.1909
NETHERLANDS NLD Cluster 25 -0.3063
NORWAY NOR Cluster 25 -0.3469
NEW ZEALAND NZL Cluster 25 -0.1065
SINGAPORE SGP Cluster 25 -0.0601
SWEDEN SWE Cluster 25 -0.2458
THE ECONOMIC COST OF IPR INFRINGEMENT IN THE SMARTPHONES SECTOR
www.euipo.europa.eu | www.itu.int30|
Country Code CLUSTER ERRORS
CHILE CHL Cluster 50 -0.2830GERMANY DEU Cluster 50 0.5957SPAIN ESP Cluster 50 0.1736
UNITED KINGDOM GBR Cluster 50 0.2229
HONG KONG SAR, CHINA HKG Cluster 50 -0.1359
IRELAND IRL Cluster 50 -0.0796
JORDAN JOR Cluster 50 -0.3125
KOREA, REP. KOR Cluster 50 0.0762
LEBANON LBN Cluster 50 -0.2227
NORTH AMERICA NOA Cluster 50 -0.2237
SAUDI ARABIA SAU Cluster 50 0.0414
Source: EUIPO calculations
However, the errors are not interesting in themselves. The purpose of this study is not to produce a “good” forecast of smartphones sold but rather to generate a set of relative errors which can then be quantitatively analysed to construct estimates of counterfeiting. Forecasts for 2015 are produced based on connections and the relationship between sales and connections in the previous two years, which ensures that they are comparable and “unpolluted” by a priori knowledgeoffactorsinfluencingchangesindemand.
The second part of the estimation process seeks to determine to what extent these forecast errors can be explained by economic variables and by variables related to counterfeiting.
5.2. The second stage econometric model
Counterfeiting might be one of a number of factors impacting on the level of sales of smartphones, but there are, as outlined earlier, a series of other economic factors which can explainthedifferential,suchasvariablesrelatedtotheeconomiccapacityofhouseholds(e.g.broadband services prices or per capita GDP) or any other driver of consumption expenditure.
Havingaccountedfortheinfluenceofeconomicvariablesonthesalesdifferential,anattemptis made to assess the extent to which counterfeiting variables, or relevant proxies, can explain the propensity to purchase counterfeit smartphones. These variables might include measures of consumers and market characteristics, as well as the evolution of a country´s legal environment.

www.itu.int | www.euipo.europa.eu |31
Combining the economic and counterfeiting variables allows for the specification of aneconometricmodelwhoseaimistoexplaintheaggregateddifferentialbetweenexpectedandrealsales.Themodelisspecifiedinthefollowingformat:
where Xi is a matrix of explanatory variables unrelated to counterfeiting and Zi a matrix of variables related to counterfeiting. Finally, εi is the remaining error.
Socio-economic variables considered to have explanatory power, unrelated to counterfeiting, include:
1. GDP per capita and GDP growth expressed in Purchased Power Parity (PPP); 2. Exchange rate of the US dollar vs. local currencies;3. Mobile broadband services prices (ITU) expressed in PPP as well as a share of per capita
Gross National Income (GNI).
Variables thought to be related to counterfeiting include:
1. Corruption Perception Index (CPI);2. Intellectual Property Right Index;3. Worldwide Governance Indicators (World Bank) covering Government Effectiveness,
Regulatory Quality, Rule of Law and Control of Corruption (level and growth); 4. World Development Indicators (WB) related to ICT imports, customs and tourism.
Variables considered to be drivers of counterfeiting are related to the market and institutional characteristics of each country.
The Corruption Perception Index (CPI) is published by Transparency International and measures how corrupt public sectors are seen to be by the public in each country. In this study the updated index is used with reference year 2015.
The Intellectual Property (IP) Rights Index used is published by Property Rights Alliance and measures the strength of protection accorded to IP. The 2016 index is used in this study.
TheWorldwideGovernance Indicators reflect the perception of government effectiveness,regulatory quality, rule of law and corruption. They are published annually and range from 2.5
(3)
THE ECONOMIC COST OF IPR INFRINGEMENT IN THE SMARTPHONES SECTOR
www.euipo.europa.eu | www.itu.int32|
for favourable aspects of governance to -2.5 for poor performance. For computational reasons, the indicators have been re-scaled to avoid negative values so that 0 correspond to better performance and higher values indicate a worse situation. These indicators are considered as potential proxies for the perceived risk of buying or selling counterfeit goods.
The rationale behind these variables is that in countries where governance and rule of law are perceived to be weak there is a higher likelihood of consumption of a product to be illicit than in countries with good governance, strong rule of law and low corruption.
World Development Indicators include besides ICT imports and tourism indicators, the burden of customs procedures and logistics performance indexes including the ability to track and traceconsignmentsandtheefficiencyofthecustomsclearanceprocessandquality.
For the aggregated regions of North America and the rest of Latin America the indicators are obtained as a weighted average using population as weight with the exception of the GDP variables which use the GDP values by country as weights.
Altogether, 24 different explanatory variables were tested and different econometrictechniques were applied in order to select a model with robust econometric results and a clear interpretation.
Some of the variables considered in the modelling process are correlated with each other. High correlationcoefficientsbetweenexplanatoryvariables(referredtoasmulticollinearity)areacommon problem in econometric analysis. If correlated explanatory variables are included in themodel,theestimatedcoefficientsforthesevariablescouldbemistakenlyconsideredasinsignificant(smallt-statistics),althoughpossessingahighoverallsignificanceforthemodelasmeasured by the F-test. This situation can pose problems when trying to interpret the meaning andsignificanceofparameterestimatesandwhentestingthesignificanceofothervariablesinthemodelspecification.
For instance, Worldwide Governance Indicators and CPI are highly correlated. Therefore only those variables with the greatest explanatory power are included in the model in order to avoid the problems described above.
The final model is estimated using Two Steps Least Squares (2SLS) to solve problems ofheteroscedasticity (confirmedwithBreusch-Pagan test)asstabilityof varianceofestimatedresidualsisarequirementforanacceptableaccuracyinthecoefficientsestimation.VariationInflationFactor(VIF)test,residualsplotsandInformationCriteriasuchasAkaikeandBayesianwere also used to select the preferred model22.
22 - All results of the diagnostic tests are available on request.

www.itu.int | www.euipo.europa.eu |33
Basedon residuals analysis, two countrieswereexcluded in thefinalmodel (EcuadorandSenegal)astheyareconsideredoutliers.Thefinalmodelwasestimatedusing80observationsdue to lack of explanatory variables for Argentina, Iran and Myanmar.
The econometric model explains 85% of total variance of the stage 1 forecast errors. The model uses a combination of two economic variables and one counterfeiting related variable besides threedummyvariables.Foreachvariablethefirstcolumnshowstheestimatedcoefficient,the second column shows the standard error, while the third column indicates the statistical significanceoftheparameterestimates.
The model estimated includes two explanatory variables not related to counterfeiting (mobile broadband services prices as a share of per capita GNI and per capita GDP expressed in PPP) and one explanatory variable related to counterfeiting: the WB index on Government Effectiveness23.
Thecoefficientestimatedfor thecounterfeitingrelatedvariable ispositive,sothatahighervalue of the index in a particular country (which corresponds to poorer regulation) is related to bigger forecast errors.
23 - This indicator captures perceptions
of the quality of public services, the quality
of the civil service and the degree of its independence from
political pressures, the quality of policy
formulation and implementation,
and the credibility ofthegovernment’s
commitment to such policies.
R-square = 84.85%
F statistic = 122.85 ***
***significantat99%confidencelevel
Variable Coefficient Standard Error t Statistic 95% Confidence interval
Lower Upper
Constant -0.2451 0.0188 -13.03 *** -0.2826 -0.2076
Cluster0 0.3505 0.0475 7.39 *** 0.2559 0.4450
Cluster10 -0.0840 0.0147 -5.72 *** -0.1132 -0.0547
Cluster50 -0.0155 0.0335 -0.46 -0.0822 0.0512
Prices pc GNI 0.0728 0.0122 5.95 *** 0.0484 0.0972
GDP pc PPP 0.0017 0.0004 4.14 *** 0.0009 0.0026
WB Index: Government Effectiveness 0.0753 0.0117 6.42 *** 0.0519 0.0986
THE ECONOMIC COST OF IPR INFRINGEMENT IN THE SMARTPHONES SECTOR
www.euipo.europa.eu | www.itu.int34|
Threedummyvariablesareincludedtoallowfordifferentaverageerrorsintheclustersbuiltin the 1st step,withCluster25as thebase.Theestimatedcoefficientscapture theeffectofomitted variables that are common to each group of countries. The positive sign of the Cluster0 coefficientreflectsahighervalueoferrorsinthe23countriesofthisgroupforwhichexpectedsales are estimated to be equal to new connections and are on average above real sales. It is notclearwhichfactorsexplainthepositivesignofCluster0coefficientbutoneofthemcouldbe sales not included in the GfK data, such as second-hand and refurbished devices and the presence of shared devices prevalent in some developing countries24.
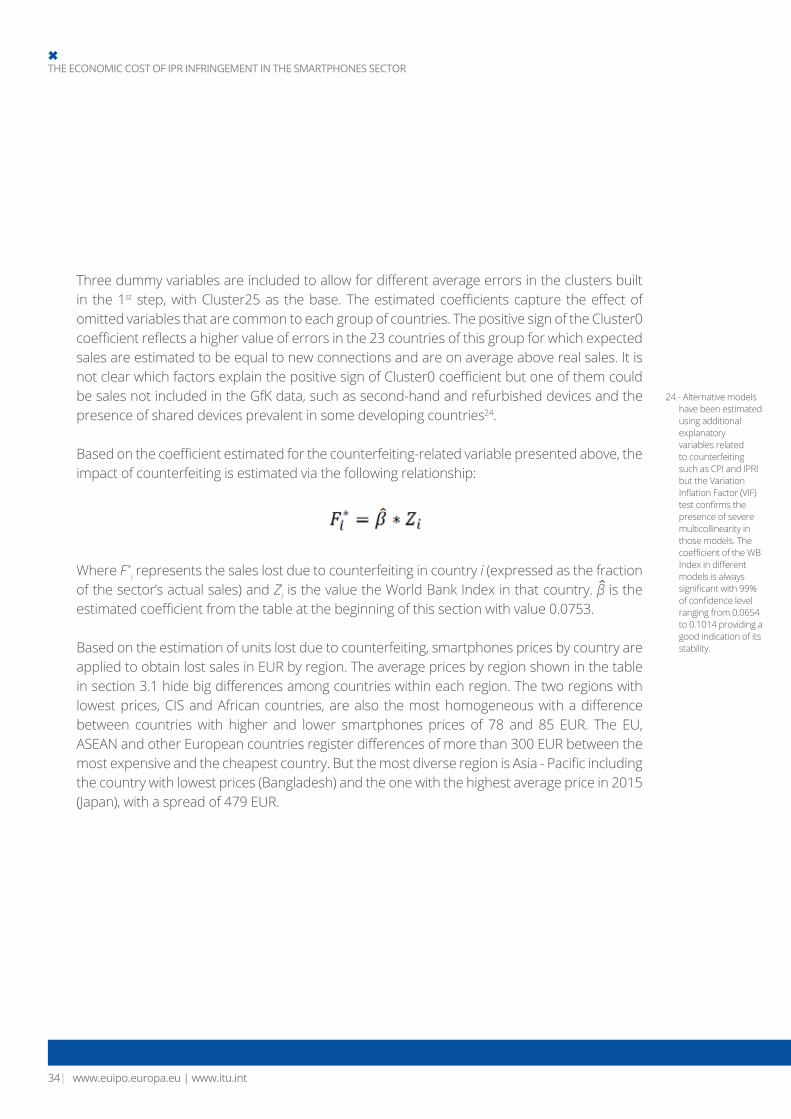
Basedonthecoefficientestimatedforthecounterfeiting-relatedvariablepresentedabove,theimpact of counterfeiting is estimated via the following relationship:
Where F*i represents the sales lost due to counterfeiting in country i (expressed as the fraction
ofthesector’sactualsales)andZi is the value the World Bank Index in that country. β is the estimatedcoefficientfromthetableatthebeginningofthissectionwithvalue0.0753.
Based on the estimation of units lost due to counterfeiting, smartphones prices by country are applied to obtain lost sales in EUR by region. The average prices by region shown in the table insection3.1hidebigdifferencesamongcountrieswithineachregion.Thetworegionswithlowestprices,CISandAfricancountries,arealsothemosthomogeneouswithadifferencebetween countries with higher and lower smartphones prices of 78 and 85 EUR. The EU, ASEANandotherEuropeancountriesregisterdifferencesofmorethan300EURbetweenthemostexpensiveandthecheapestcountry.ButthemostdiverseregionisAsia-Pacificincludingthe country with lowest prices (Bangladesh) and the one with the highest average price in 2015 (Japan), with a spread of 479 EUR.
24 - Alternative models have been estimated using additional explanatory variables related to counterfeiting such as CPI and IPRI but the Variation InflationFactor(VIF)testconfirmsthepresence of severe multicollinearity in those models. The coefficientoftheWBIndexindifferentmodels is always significantwith99%ofconfidencelevelranging from 0.0654 to 0.1014 providing a good indication of its stability.

www.itu.int | www.euipo.europa.eu |35
THE ECONOMIC COST OF IPR INFRINGEMENT IN THE SMARTPHONES SECTOR
6. CONCLUSIONS AND PERSPECTIVES
The studies aiming to quantify the scale and impact of IPR infringements in cosmetics and perfumes, clothing and footwear, sports goods, toys and games, jewellery and watches, handbags and luggage, recorded music, spirits and wine, pharmaceuticals, pesticides and now smartphoneshaveprovidedcoherentestimatesofthesizeoftheproblemofcounterfeitingforlegitimate businesses. These studies have used a common methodology and demonstrated thebenefitsofworkingincooperationwithstakeholderstotakeadvantageoftheirknowledgeofmarketconditions,whilerelyingonofficial,reputablesourcesfortheanalysis.
The eleven sectorial studies published to date will be followed in the coming months by other similar studies covering additional sectors, applying the same methodology and combining it with knowledge from industry, depending on availability of data.
Inparallel,theObservatoryhascarriedoutajointstudywiththeOrganizationforEconomicCooperation and Development (OECD) to estimate the value of counterfeit and pirated goods in international trade. That study, published in April 2016, estimated the value of international trade of counterfeit goods in 2013 at 338 billion EUR (USD 461 billion) globally, corresponding to2.5%ofworldtrade.ThecorrespondingfiguresfortheEUwere85billionEUR(USD116billion),representing5%ofEU’simportsfromtherestoftheworld.
Taken together, these studies complement each other and provide a complete and objective picture of the impact of IPR infringements in Europe and beyond, in order to help policy makers developeffectiveenforcementpolicies.
ITU is addressing the growing problem of counterfeited telecommunication/ICT equipment anddevices,whichisadverselyaffectingallstakeholdersintheICTfield(vendors,governments,operators and consumers)25. The ITU-T Study Group 11 (Q8/11) on Guidelines for implementations of signalling and protocols, and for addressing counterfeited ICT devices is working on this issue together with other ITU study groups as well as with regional and international bodies concerned with counterfeiting. A Technical Report on Counterfeit ICT Equipment was published in December 2015 addressing the nature of the issues related to the counterfeiting of ICT equipment and devices, a review of the international conventions covering this type of infringement of IPR and theactivitiesoforganizations in theenforcementof these rights.This reportalsoprovidesa description of a variety of means to combat the trade in ICT counterfeit products, and a description of national and regional initiatives to combat the counterfeiting of mobile devices.
25 - ITU Activities to combat counterfeit ICT Equipment - http://www.itu.int/en/ITU-T/
studygroups/2013-2016/11/Pages/counterfeit.aspx
THE ECONOMIC COST OF IPR INFRINGEMENT IN THE SMARTPHONES SECTOR
www.euipo.europa.eu | www.itu.int36|
ITU has also initiated the development of a normative Recommendation on “Framework for solution to combat counterfeit ICT Devices” to describe a reference framework and requirements to be considered when deploying anti-counterfeiting solutions.
Finally, ITU is working with OECD on a case study on trade in counterfeit ICT goods, building on the joint EUIPO-OECD 2016 study on trade in counterfeit goods. The aim of the case study is toimprovedecision-makers’understandingofthenatureandscaleofthetradeincounterfeitgoodsintheICTsector.Thestudywillbepublishedinthefirsthalfof2017.

www.itu.int | www.euipo.europa.eu |37
Until 23 March 2016, the name of the Office was Office for Harmonization in the Internal Market (OHIM). The name was changed to EUIPO as part of the trade mark reform legislation which came into force on that date. In order to maintain the integrity of the bibliographical references, the name of the Office at the time of the publication of each report is used.
EUIPO (2017, forthcoming) The European Citizens and intellectual property: perception,awareness and behaviour, edition 2016.
EUIPO/OECD (2016) Trade in counterfeiting and pirated goods: mapping the economic impact. https://euipo.europa.eu/ohimportal/en/web/observatory/mapping-the-economic-impact
EUIPO (2016) The economic cost of IPR infringement in the recorded music sector.https://euipo.europa.eu/ohimportal/en/web/observatory/ipr_infringement_music
EUIPO (2016) The economic cost of IPR infringement in the spirits and wine sector.https://euipo.europa.eu/ohimportal/en/web/observatory/ipr_infringement_wines_and_spirits
EUIPO (2016) The economic cost of IPR infringement in the pharmaceutical industry.https://euipo.europa.eu/ohimportal/en/web/observatory/ipr-infringement-pharmaceutical-sector
EUIPO (2017) The economic cost of IPR infringement in the pesticides sector.https://euipo.europa.eu/ohimportal/en/web/observatory/ipr-infringement-pesticides-sector
EUIPO/EPO (2016) Intellectual property rights intensive industries and economic performance in the EU. https://euipo.europa.eu/ohimportal/en/web/observatory/ip-contribution#ip-contribution_1 ITU (2016) Measuring the Information Society report.http://www.itu.int/en/ITU-D/Statistics/Documents/publications/misr2016/MISR2016-w4.pdf
ITU (2015) Counterfeit ICT equipment. Technical Report of the Telecommunication StandardizationSectorofITU.
OECD (2008) The economic impact of counterfeiting and piracy. http:/ /www.oecd- i l ibrary.org/trade/the-economic- impact-of-counterfe i t ing-and-piracy_9789264045521-en
7. ReferencesTHE ECONOMIC COST OF IPR INFRINGEMENT IN THE SMARTPHONES SECTOR
THE ECONOMIC COST OF IPR INFRINGEMENT IN THE SMARTPHONES SECTOR
www.euipo.europa.eu | www.itu.int38|
OHIM (2013) The European Citizens and intellectual property: perception, awareness andbehaviour.https://euipo.europa.eu/ohimportal/en/web/observatory/ip_perception
OHIM/EPO (2013) Intellectual Property Rights intensive industries: contribution to economic performance and employment in the European Union.https://euipo.europa.eu/ohimportal/en/web/observatory/ip-contribution#1study
OHIM (2015) Intellectual Property Rights and firm performance in Europe: an economicanalysis.https://euipo.europa.eu/ohimportal/en/web/observatory/ip-contribution#2study
OHIM (2015) The economic cost of IPR infringement in the cosmetics and personal care sector.https://euipo.europa.eu/ohimportal/en/web/observatory/ip-infringements_cosmetics-personal_care
OHIM (2015) The economic cost of IPR infringement in the clothing, footwear and accessories sector.https://euipo.europa.eu/ohimportal/en/web/observatory/ip-infringements_clothing-accessories-footwear
OHIM (2015) The economic cost of IPR infringement in sports goods.https://euipo.europa.eu/ohimportal/en/web/observatory/ip-infringements_sports-goods
OHIM (2015) The economic cost of IPR infringement in the toys and games sector.https://euipo.europa.eu/ohimportal/en/web/observatory/ipr_infringement_toys_and_games
OHIM (2016) The economic cost of IPR infringement in the jewellery and watches sector.https://euipo.europa.eu/ohimportal/en/web/observatory/ipr_infringement_jewellery_and_watches
OHIM (2016) The economic cost of IPR infringement in the handbags and luggage sector.https://euipo.europa.eu/ohimportal/en/web/observatory/ipr_infringement_handbags_and_luggage
RAND (2012) Measuring IPR infringements in the internal market. Development of a new approach to estimating the impact of infringement on sales. http://ec.europa.eu/internal_market/iprenforcement/docs/ipr_infringment-report_en.pdf
WCO (2012) Informal trade practices. http://www.wcoomd.org/en/topics/research/activit ies-and-programmes/~/media/CE615C7CC64746688498F807A0F032A3.ashx
www.itu.int | www.euipo.europa.eu |39
WEFA (1998) The Economic Impact of Trademark Counterfeiting and Infringement. Report prepared for the International Trademark Association.
WIPO (2010) Theeconomiceffectsofcounterfeitingandpiracy:aliteraturereview. http://www.wipo.int/edocs/mdocs/enforcement/en/wipo_ace_6/wipo_ace_6_7.pdf
THE ECONOMIC COST OF IPR INFRINGEMENT IN THE SMARTPHONES SECTOR
www.euipo.europa.eu | www.itu.int


