
Master Thesis - Z. Yang; McMaster University - Materials Science and Engineering
THE EFFECT OF POROSITY ON FATIGUE CRACK INITIATION AND
PROPAGATION IN AM60 DIE-CAST MAGNESIUM ALLOY

Master Thesis - Z. Yang; McMaster University - Materials Science and Engineering
THE EFFECT OF POROSITY ON FATIGUE CRACK INITIATION AND
PROPAGATION IN AM60 DIE-CAST MAGNESIUM ALLOY
By ZHUOFEI YANG, B.Eng.
A Thesis Submitted to the School of Graduate Studies in Partial Fulfilment of the
Requirements for the Degree Master of Applied Science
McMaster University © Copyright by Zhuofei Yang, August 2015

Master Thesis - Z. Yang; McMaster University - Materials Science and Engineering
ii
MASTER OF APPLIED SCIENCE (2015) McMaster University
Materials Science and Engineering Hamilton, Ontario, Canada
TITLE: The Effect of Porosity on Fatigue Crack Initiation and
Propagation in AM60 Die-Cast Magnesium Alloy
AUTHORS: Zhuofei Yang, B.Eng.
SUPERVISOR: Dr. David S. Wilkinson; Dr. Jidong Kang
NUMBER OF PAGES: ii – xv, 1 – 92

Master Thesis - Z. Yang; McMaster University - Materials Science and Engineering
iii
Abstract
The AM60 Mg alloy has been used in the automotive industry to help achieve
higher fuel efficiency. However, its products, mostly fabricated via high pressure
die casting process, are inherently plagued with porosity issues. The presence of
porosity impairs mechanical properties, especially fatigue properties, and thus
affects the product reliability. We have therefore studied the effect of porosity on
the fatigue behavior of samples drawn from a prototype AM60 shock tower by
conducting strain-controlled fatigue test along with X-ray computed tomography
(XCT). The 3D analysis of porosity by XCT showed discrepancies from 2D
metallographic characterization. Fatigue testing results showed the machined
surface is the preferential site for crack initiation to occur, on which pores are
revealed after specimen extraction. A large scatter in fatigue life was observed as
crack initiating at a large pore situated on the surface will result in a significantly
shorter fatigue life. SEM fractography showed fracture surfaces are generally flat
and full of randomly orientated serration patterns but without fatigue striations. The
observations and measurements of porosity and fatigue cracks made by XCT were
confirmed by SEM, supporting it as a reliable characterization tool for 3D objects
and has value in assisting the failure analysis by SEM. Fatigue life was found to
decrease with the increase of fatigue-crack-initiating pore size. The same trend
was also found between the fatigue life and the volume fraction of porosity. The
pore shape and pore orientation should be taken into account when determining

Master Thesis - Z. Yang; McMaster University - Materials Science and Engineering
iv
the pore size as they can result in the difference in pore size between 2D and 3D
measurement.

Master Thesis - Z. Yang; McMaster University - Materials Science and Engineering
v
Acknowledgements
The financial support from the Federal Inter-developmental Program on
Energy R&D (PERD) is acknowledged. The shock towers used in this study were
provided through the Canada-China-USA Collaborative Research & Development
Project, Magnesium Front End Research and Development (MFERD).
I would like to express my sincere gratitude to my supervisors, Dr. David S.
Wilkinson and Dr. Jidong Kang, for their support, continuous guidance and
meticulous suggestions throughout the master program. The prompt inspirations
and inexhaustible patience have enabled me to complete my thesis.
I must also thank Jie Liang, J.P. Talon, Mark Gesing and Jian Li from
CanmetMATERIALS, for their technical assistance on various aspects of the
experimental work. I would also like to express my thanks to Alexandre Maurey
from Grenoble INP – Phelma, for his collaboration in the work of microstructure
characterization. I am also thankful to Connie Barry and Mike Bruhis and all others
from McMaster University for their encouragement and support.
Finally, I thank my parents for their unceasing encouragement and support.

Master Thesis - Z. Yang; McMaster University - Materials Science and Engineering
vi
Table of Contents
Abstract ............................................................................................................... iii
Acknowledgements .............................................................................................v
Table of Contents ............................................................................................... vi
List of Figures ..................................................................................................... ix
List of Tables ..................................................................................................... xv
1 Introduction ...................................................................................................1
2 Literature Review ..........................................................................................3
2.1 Fatigue in general ..............................................................................3
2.2 Fatigue testing approaches ................................................................4
2.2.1 Stress-controlled fatigue ........................................................5
2.2.2 Strain-controlled fatigue ........................................................8
2.3 The general influence of porosity on fatigue ..................................... 10
2.4 The effect of individual pore features on fatigue ............................... 11
2.4.1 The effect of pore size ......................................................... 11
2.4.2 The effect of pore location ................................................... 12
2.4.3 The effect of pore geometry and orientation ........................ 13
2.5 Idealization of porosity in modelling ................................................. 18
2.6 X-ray computed tomography ............................................................ 20
2.6.1 The principle of X-ray Computed Tomography .................... 21
2.6.2 X-ray tomography in fatigue study ....................................... 23
2.7 Objective of the work ........................................................................ 24
3 Experimental procedure ............................................................................. 26

Master Thesis - Z. Yang; McMaster University - Materials Science and Engineering
vii
3.1 Sample preparation and details ........................................................ 26
3.2 Strain controlled fatigue testing ........................................................ 29
3.2.1 Standard fatigue testing ...................................................... 29
3.2.2 Interrupted fatigue testing coupled with X-ray tomography.. 30
3.3 X-ray computed tomography scan ................................................... 30
3.4 Sample preparation for SEM observation ......................................... 33
4 Results and Discussion .............................................................................. 35
4.1 Microstructure characterization ........................................................ 35
4.1.1 Metallographic characterization of porosity ......................... 35
4.1.2 3D characterization of porosity ............................................ 42
4.1.3 Pore size distribution in 2D and in 3D ................................. 44
4.1.3.1 2D pore size characterization ................................ 44
4.1.3.2 3D pore size characterization ................................ 47
4.1.3.3 Pore size distribution between locations ............... 53
4.1.4 Characterization of grains.................................................... 54
4.2 Fatigue test results ........................................................................... 60
4.2.1 ε – N curve for modified standard dimension ....................... 60
4.2.2 ε – N curve for large-radius dimension ................................ 61
4.3 The evolution of fatigue cracking in 2D and 3D ................................ 65
4.4 The effect of surface roughness on fatigue lives .............................. 70
4.5 Fatigue failure analysis ..................................................................... 75
4.5.1 X-ray tomography on fatigued specimens ........................... 75
4.5.2 SEM observations of fracture surfaces ................................ 77

Master Thesis - Z. Yang; McMaster University - Materials Science and Engineering
viii
4.5.3 The impact of the pore size in the crack initiation site on fatigue life ......................................................................................... 80
5 Summary and conclusions......................................................................... 86
6 References ................................................................................................... 89
Master Thesis - Z. Yang; McMaster University - Materials Science and Engineering
ix
List of Figures
Figure 2-1 A schematic illustration of fatigue damage evolution. (Campbell, 2008)
..............................................................................................................................3
Figure 2-2 An idealized S-N curve (retrieved from http://www.fea-
optimization.com/ETBX/stresslife_help.html) ........................................................6
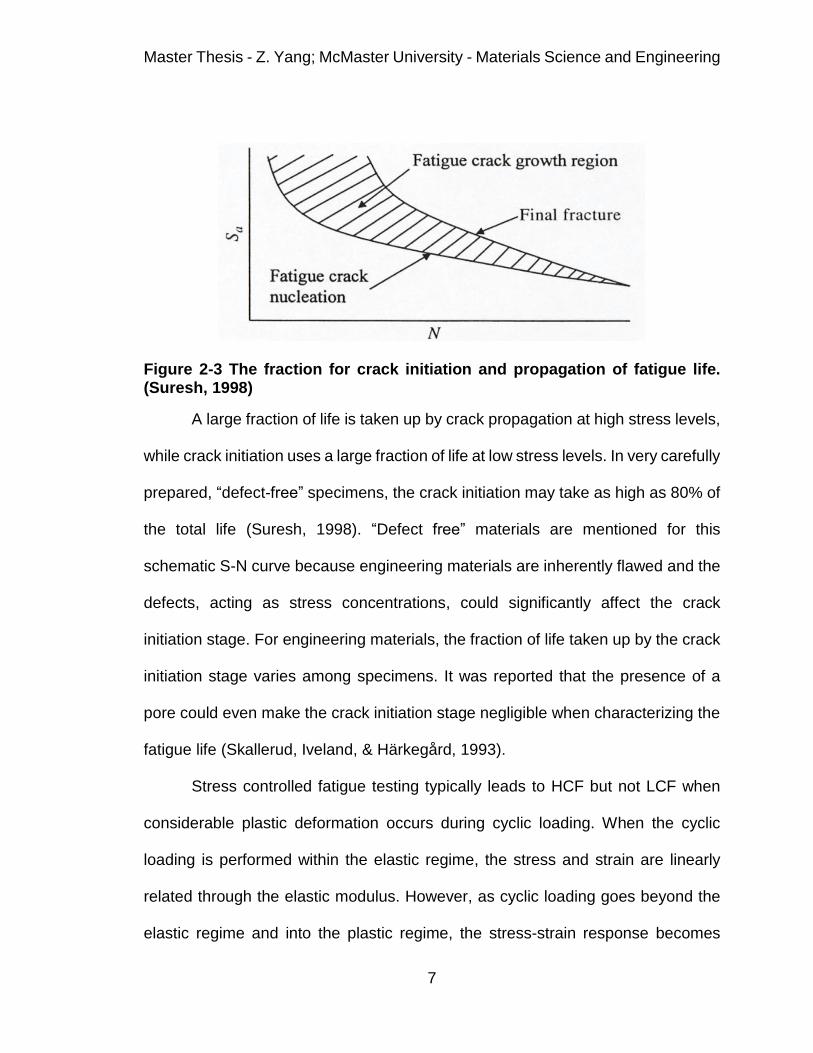
Figure 2-3 The fraction for crack initiation and propagation of fatigue life. (Suresh,
1998) .....................................................................................................................7
Figure 2-4 The cyclic stress-strain response and cyclic softening and hardening.
(Campbell, 2008) ...................................................................................................9
Figure 2-5 Coffin-Manson relationship combined with Basquin's equation.
(Retrieved from http://www.fea-optimization.com/ETBX/strainlife_help.html) ...... 10
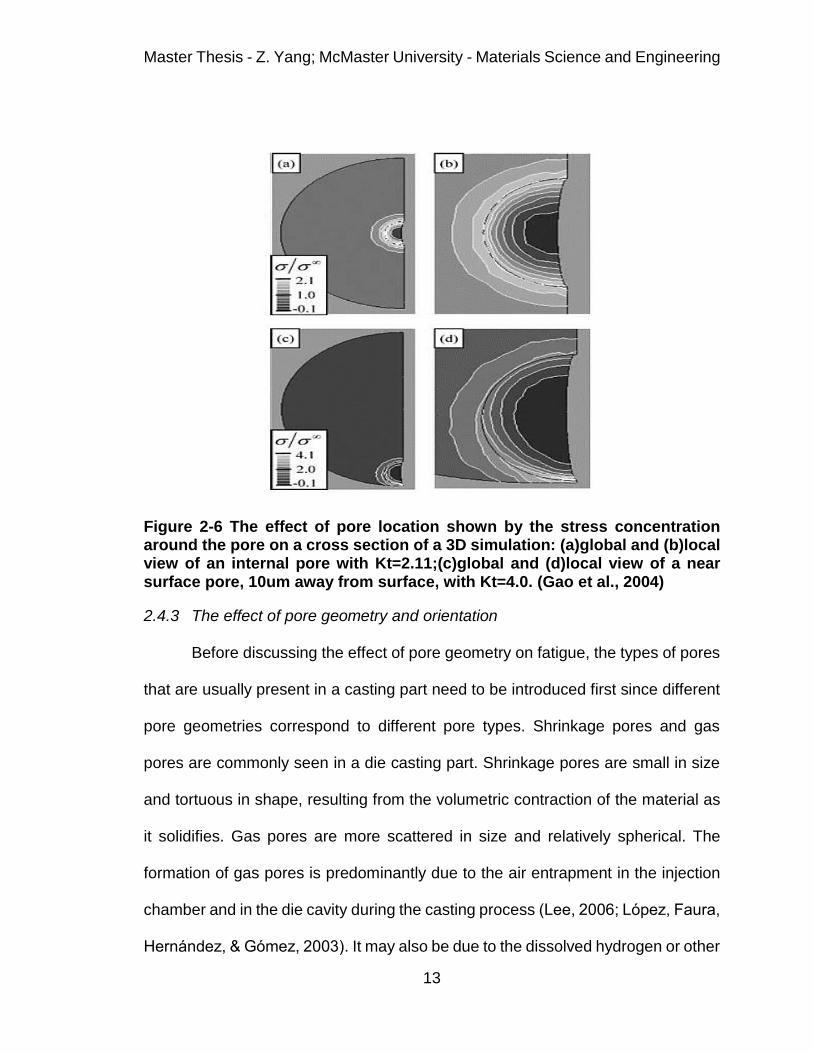
Figure 2-6 The effect of pore location shown by the stress concentration around
the pore on a cross section of a 3D simulation: (a)global and (b)local view of an
internal pore with Kt=2.11;(c)global and (d)local view of a near surface pore, 10um
away from surface, with Kt=4.0. (Gao et al., 2004) .............................................. 13
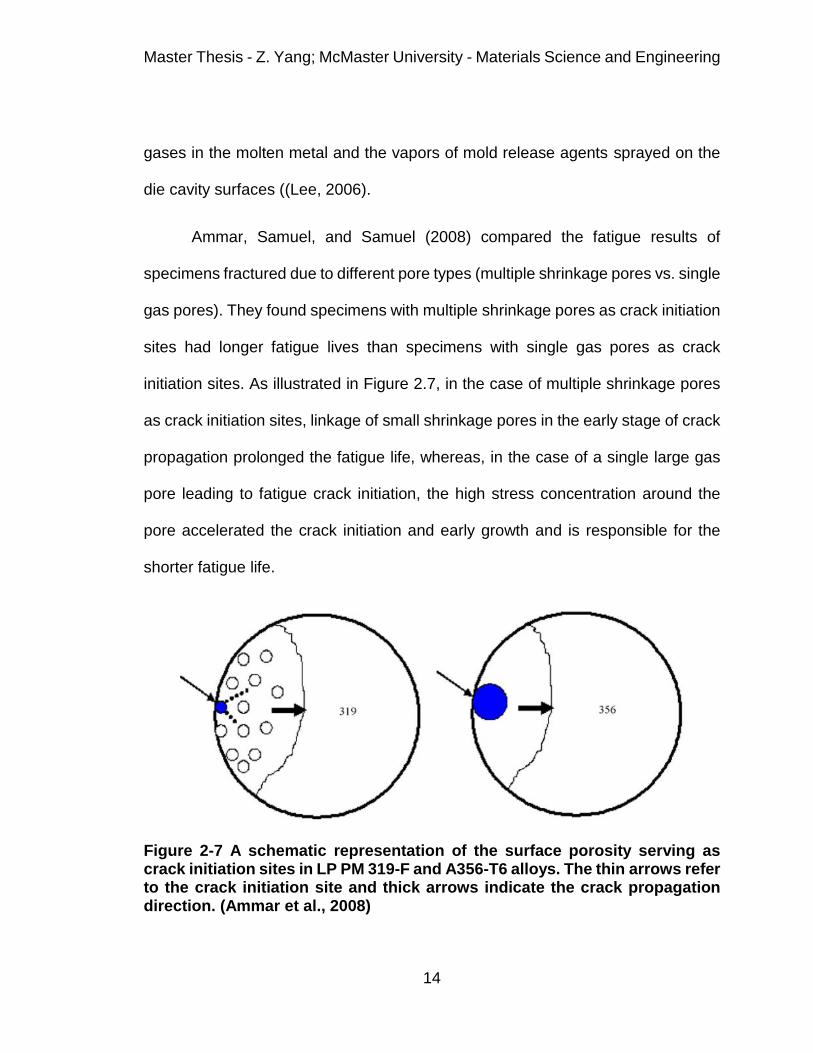
Figure 2-7 A schematic representation of the surface porosity serving as crack
initiation sites in LP PM 319-F and A356-T6 alloys. The thin arrows refer to the
crack initiation site and thick arrows indicate the crack propagation direction.
(Ammar et al., 2008) ............................................................................................ 14
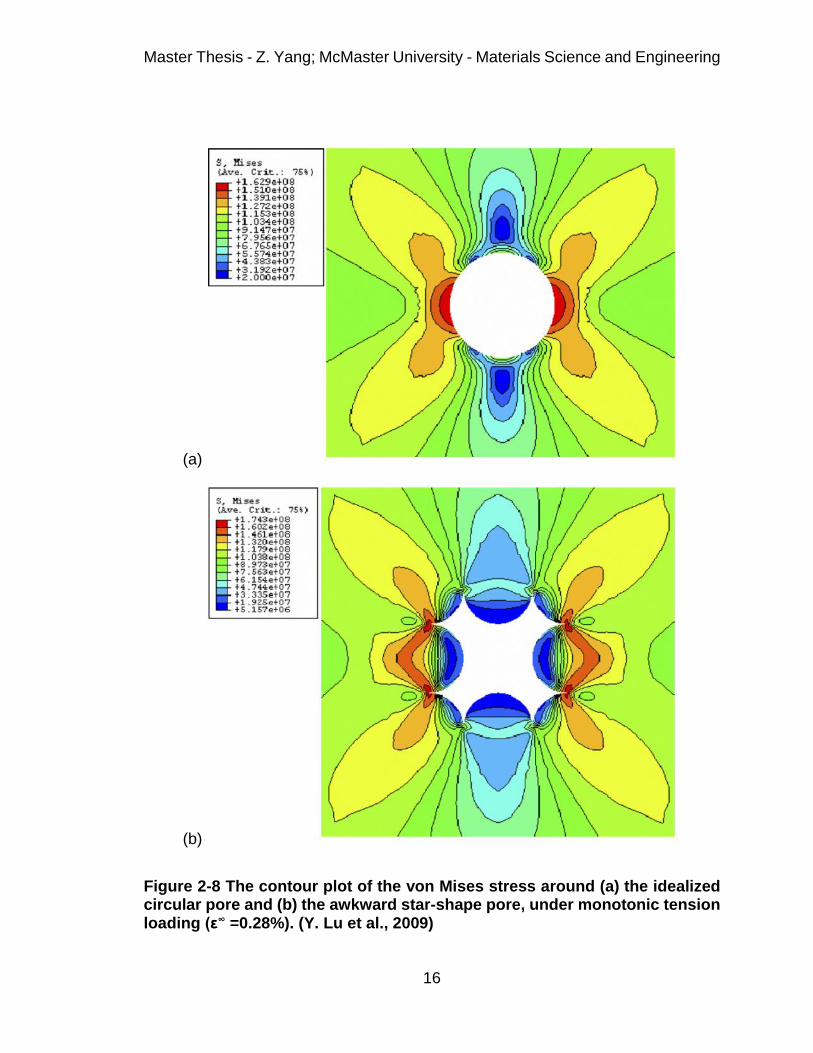
Figure 2-8 The contour plot of the von Mises stress around (a) the idealized circular
pore and (b) the awkward star-shape pore, under monotonic tension loading (ε∞
=0.28%). (Y. Lu et al., 2009) ................................................................................ 16

Master Thesis - Z. Yang; McMaster University - Materials Science and Engineering
x
Figure 2-9 Two casting pores revealed by XCT – (a) gas pore and (b) shrinkage
pore. (c) The coordinate system centered at the pore center of gravity and two
rotation angles defined to investigate the dependence of Kt on combined role of
pore morphology and loading direction. (d) The Kt of pores in tension vs. pore
orientation. (Nicoletto et al., 2012) ....................................................................... 18
Figure 2-10 The average stress-strain concentration around simplified pore
geometries with different pore sizes is similar as having same projected area on x-
y plane normal to loading direction in z direction. (Li et al., 2009). ...................... 20
Figure 2-11 Simulated sectioning of a gas pore (left) and a shrinkage pore (right).
(Nicoletto et al., 2010) ......................................................................................... 21
Figure 2-12 Schematic illustration of the principle of XCT. (Buffiere et al., 2010) 23
Figure 3-1 A shock tower used in present study with 6 locations marked for
specimen preparation. ......................................................................................... 27
Figure 3-2 Specimen geometries used in present study. ..................................... 28
Figure 4-1 The cross section of AM60 Mg alloy. .................................................. 36
Figure 4-2 The internal microstructure of AM60 Mg alloy. ................................... 37
Figure 4-3 (a) A micrograph taken in a defect band showing shrinkage pores and
small gas pores. (b) Color coded pores showing the separation of shrinkage pores
(yellow; form factor less than 0.4) and gas pores (blue; form factor larger than 0.6)
based on the form factor difference. .................................................................... 40
Figure 4-4 The comparison of pore geometry in 2D and 3D for (a) a gas pore and
(b) a shrinkage pore. ........................................................................................... 44
Master Thesis - Z. Yang; McMaster University - Materials Science and Engineering
xi
Figure 4-5 A montage image taken in a defect band for pore size measurement.
............................................................................................................................ 45
Figure 4-6 The distribution of pore size. .............................................................. 46
Figure 4-7 The area histogram plotted as area fraction vs. pore size. ................. 46
Figure 4-8 The same shrinkage pore 3D modelled with 1.5µm pixel size (left) and
6.05µm pixel size (right). ..................................................................................... 47
Figure 4-9 A tomography image showing the strong contrast between shrinkage
pores and the material matrix in a defect band region. ........................................ 49
Figure 4-10 The distribution of pore size in a defect band measured in 3D. A red
line positioned at 4µm highlights the cut off value of which on the left is regarded
as noise. .............................................................................................................. 50
Figure 4-11 The volume histogram plotted as volume fraction vs. pore size, which
is characterized in 3D. A red line positioned at 4µm highlights the cut off value of
which on the left is regarded as noise. ................................................................ 50
Figure 4-12 The comparison of pore size distribution between 2D and 3D. ........ 52
Figure 4-13 The pore size distribution compared at six locations. ....................... 54
Figure 4-14 The microstructure of AM60 Mg alloy in (a) in the skin region and (b)
in the interior. ....................................................................................................... 55
Figure 4-15 The microstructure of AM60 Mg alloy in the interior region (a) before
binarizing and (b) after binarizing and (c) color coded to distinguish pore sizes. Two
histograms showing (d) the number density and (e) the area density of the grain
size distribution. ................................................................................................... 58
Master Thesis - Z. Yang; McMaster University - Materials Science and Engineering
xii
Figure 4-16 (a) Color-coded surface microstructure and (b) the area histogram
showing a unimodal distribution........................................................................... 59
Figure 4-17 The ε – N curve of modified standard dimension showing a large
fraction of specimens failed outside the gauge length (labeled as “invalid data
points”). ............................................................................................................... 61
Figure 4-18 ε – N curve of specimens with a large radius at shoulders. .............. 62
Figure 4-19 The ε – N curve produced by Rettberg et al. (2012) ......................... 63
Figure 4-20 The local strain amplitude in the centre of the specimen for two sets of
dimensions simulated by ABAQUS. .................................................................... 64
Figure 4-21 The ε – N curve from study of Rettberg et al. (2012) and current study.
............................................................................................................................ 65
Figure 4-22 A 3D model of fatigue cracked specimen with the material matrix set
as transparent to reveal internal cracks and porosity .......................................... 66
Figure 4-23 Top view of the 3D models made at (a) initial state, (b) 4,000 cycles,
(c) 5,784 cycles and (d) 6,000 cycles. Three pores served as crack initiation site,
marked in (a). ...................................................................................................... 67
Figure 4-24 The appearance of a tomography image during fatigue test at (a) initial
state, (b) 4,000 cycles, (c) 5,784 cycles and (d) 6,000 cycles. ............................ 69
Figure 4-25 The appearance of one resliced tomography image and overall image;
(a) initial state, (b) 4,000 cycles, (c) 5,784 cycles, (d) 6,000 cycles and (e) overall
view of initial state. .............................................................................................. 70
Figure 4-26 The surface roughness measurements in each surface condition. .. 71
Master Thesis - Z. Yang; McMaster University - Materials Science and Engineering
xiii
Figure 4-27 The live display and the plotted surface in different surface conditions.
............................................................................................................................ 73
Figure 4-28 The microstructure on a polished machined surface: (a) live display
and (b) plotted surface; the height difference between two phases in microstructure.
............................................................................................................................ 74
Figure 4-29 A 3D model of fatigue cracks and associated pores. The inset figure
shows a detailed image of the casting pores serving as the crack initiation site,
taken from the specimen prior to fatigue. ............................................................ 76
Figure 4-30 (a)The overall fracture surface of the specimen of which the 3D model
is shown in Figure 4.30, and (b) the detailed casting pores serving as crack
initiation site. ........................................................................................................ 78
Figure 4-31 The fracture surface in a region (a) near crack initiation site; (b) a
distance from crack initiation site; (c) close to ductile fracture region. ................. 80
Figure 4-32 The ε – N curve for only specimens fractured from porosity with a fitted
trend line equation. .............................................................................................. 81
Figure 4-33 A function of fatigue life and strain level versus the size of the pore
serving as crack initiation site. The circled data point exhibits the effect of pore
shape and pore orientation, which results in the pore size measurement differs
between 2D (open circle) and 3D (solid circle) characterization. ......................... 82
Figure 4-34 A SEM image showing a casting pore leading to the fatigue fracture
and the 3D model of the casting pore prior to test. .............................................. 83

Master Thesis - Z. Yang; McMaster University - Materials Science and Engineering
xiv
Figure 4-35 A function of fatigue life and strain level versus the volume fraction of
porosity. The circled data point at about y=0.015 represents the effect of a single
large pore which resulted in the local volume fraction of porosity around the pore
higher than the global value. The circled data point at about y=0.03 corresponds to
the pore shown in Figure 4.34. ............................................................................ 85

Master Thesis - Z. Yang; McMaster University - Materials Science and Engineering
xv
List of Tables
Table 3.1 Chemical composition of AM60 Mg alloy in wt%. ................................ 26
Table 3.2 The settings of XCT scan for specimens in different conditions. ......... 33
Table 4.1 The list of shape parameters calculated for individual pores. .............. 40
Master Thesis - Z. Yang; McMaster University - Materials Science and Engineering
1
1 Introduction
Magnesium alloys are attractive to the automotive industry as they are lighter
than aluminum and have good castability. The use of magnesium alloy
components in new generation light weight vehicles will improve fuel economy.
Most of the magnesium applications in automotive industries are fabricated using
a high pressure die casting (HPDC) process because it is cost effective and able
to produce large volume magnesium casting components in net shape and with
complex geometry (Luo, 2013). However, the inherent porosity of the casting
process retards their wider use. The presence of porosity impairs the mechanical
performance, especially fatigue properties.
Being 3D objects, the impact of porosity on fatigue properties comes from
different features. Pore size, pore geometry, pore location as well as its spatial
distribution all make contributions to the effect. 2D characterization is inaccurate
when dealing with 3D objects and thus less than ideal for a fatigue properties study
of alloys with the porosity issue. The use of X-ray computed tomography (XCT)
technique, being a 3D non-destructive characterization tool, has been increasingly
used in fatigue studies in recent years. However, due to the low availability of this
technique, studies coupled with XCT are often limited to a small number of
specimens to solely track the damage evolution or collect data about porosity for
simulation. Therefore, no quantitative conclusions about the effect of porosity on
fatigue properties have been drawn. A further in-depth study on the effect of

Master Thesis - Z. Yang; McMaster University - Materials Science and Engineering
2
porosity on fatigue properties of AM60 HPDC Mg alloy with the extensive use of
XCT throughout experiments will better reveal the role of porosity in fatigue
behavior and benefit the fatigue modelling work.
In this study, XCT was used in microstructure characterization to quantify
porosity in 3D so that the 3D porosity analysis can be compared with the 2D
metallographic characterization results. It was also incorporated into fatigue testing
to capture the development of fatigue cracks in such a way that the fatigue testing
is interrupted every 2,000 cycles and the specimen is removed for XCT scan in
unloaded condition. The primary goal of this study is three-fold: (1) to understand
the discrepancy between 2D characterization and 3D characterization about
porosity; (2) to visualize the fatigue crack growth process in 3D and make 3D
measurements on fatigue cracks and associated pores, thus providing SEM
fractography with both qualitative and quantitative information to achieve an easier
and more accurate failure analysis; (3) to investigate the impact of individual pore
features on fatigue life.

Master Thesis - Z. Yang; McMaster University - Materials Science and Engineering
3
2 Literature Review
2.1 Fatigue in general
In materials science, fatigue is defined as the damage and failure of materials
under cyclic loads. Damage in fatigue is localized and cumulative, and it occurs in
three stages — crack initiation, crack propagation and final fracture. Figure 2.1
schematically illustrates the process of fatigue. A fatigue crack is first initiated
under cyclic loading, then slowly propagates through the material in a direction
usually perpendicular to the loading direction. As the cross section bearing the load
is reduced, the material reaches a point at which the remaining cross sectional
area fails to support the load and finally fractures.
Figure 2-1 A schematic illustration of fatigue damage evolution. (Campbell, 2008)
The danger of fatigue failure lies in the fact that progressive damage will
result from the cyclic loading in which the peak value is considerably smaller than
the “safe” load estimated on the basis of static fracture analysis, and the only

Master Thesis - Z. Yang; McMaster University - Materials Science and Engineering
4
warning sign is a crack that is hard to see. Research on the fatigue of materials
can be traced back to the first half of the nineteenth century when a German mining
engineer, W.A.J. Albert, performed repeated load proof tests on iron mine-hoist
chains (as cited in Suresh, 1998). The interest of studying fatigue expanded with
the increasing use of ferrous structures and the Versailles train crash in 1842 with
a loss of 1500-1800 human lives invoked the first detailed research effort into metal
fatigue (as cited in Suresh, 1998).
Regarding how fatigue failure occurs, stress concentrations always play a
major role in the crack initiation stage. For nominally defect-free pure metals and
alloys, the dislocations in materials accumulate near the surface and form
persistent slip bands (PSB) on the surface grains. The PSBs consisting of
extrusions and intrusions serve as stress concentrators that lead to the crack
initiation. Studies report that a dramatic enhancement in total fatigue life could be
achieved by removing the surface roughness that results from the formation of
PSBs. For commercial alloys, which contain flaws, the principal fatigue crack
initiation sites are always at defects such as voids, inclusions and oxides due to
high stress concentrations. Near surface and interior locations are both feasible to
form fatigue cracks for commercial alloys. (Suresh, 1998)
2.2 Fatigue testing approaches
Fatigue could be classified into different forms such as mechanical fatigue,
creep-fatigue, thermomechanical fatigue and corrosion-fatigue, depending on what
factors are included (Suresh, 1998). Regarding mechanical fatigue, high cycle

Master Thesis - Z. Yang; McMaster University - Materials Science and Engineering
5
fatigue (HCF) and low cycle fatigue (LCF) are two common forms. The
classification into HCF and LCF was initially based on the fatigue life: HCF is
usually with a fatigue life more than 104 cycles and LCF is less than 104 cycles.
However, the fundamental distinction between HCF and LCF is at which strain level
the repetitive application of load is taking place. If the material is cyclically loaded
with only elastic strain occurring, it is characterized as HCF; otherwise, in the case
of cyclic loading leading to plastic strain, it is characterized as LCF. Therefore,
classifying the mechanical fatigue into stress-controlled fatigue and strain-
controlled fatigue is more appropriate. In the following, these two fatigue forms are
introduced and compared.
2.2.1 Stress-controlled fatigue
The stress-life approach to fatigue was first introduced by Wohler in 1860s
and is the classical method for fatigue analysis (as cited in Suresh, 1998). The
fatigue data are usually presented as a stress-life plot, also known as an S-N curve
and from which the fatigue strength (also referred to as endurance limit) could be
determined, defined as the stress below which the specimen can support at least
107 fatigue cycles. If the S-N curve is plotted on a log-log scale, a linear relationship
between stress amplitude and fatigue life is commonly observed, indicating the
stress amplitude actually varies as a power of fatigue life. An idealized S-N curve
plotted on log-log scale is shown in Figure 2.2 (retrieved from http://www.fea-
optimization.com/ETBX/stresslife_help.html). This relationship could be expressed

Master Thesis - Z. Yang; McMaster University - Materials Science and Engineering
6
as Basquin’s equation in below when fatigue life is counted by the reversals of
stress, 2Nf, rather than cycles, Nf.
∆σ
2= σ
f
′(2N
f)b
Where σf
′ is the fatigue strength coefficient and b is known as the fatigue
strength or Basquin exponent.
Figure 2-2 An idealized S-N curve (retrieved from http://www.fea-optimization.com/ETBX/stresslife_help.html)
The S-N curve does not separate the cycles for crack initiation from crack
propagation, but just gives the total life. A schematic S-N curve in Figure 2.3
(Suresh, 1998) strictly regarding “defect free” materials shows the contributions of
crack initiation and propagation to total fatigue life.
Master Thesis - Z. Yang; McMaster University - Materials Science and Engineering
7
Figure 2-3 The fraction for crack initiation and propagation of fatigue life. (Suresh, 1998)
A large fraction of life is taken up by crack propagation at high stress levels,
while crack initiation uses a large fraction of life at low stress levels. In very carefully
prepared, “defect-free” specimens, the crack initiation may take as high as 80% of
the total life (Suresh, 1998). “Defect free” materials are mentioned for this
schematic S-N curve because engineering materials are inherently flawed and the
defects, acting as stress concentrations, could significantly affect the crack
initiation stage. For engineering materials, the fraction of life taken up by the crack
initiation stage varies among specimens. It was reported that the presence of a
pore could even make the crack initiation stage negligible when characterizing the
fatigue life (Skallerud, Iveland, & Härkegård, 1993).
Stress controlled fatigue testing typically leads to HCF but not LCF when
considerable plastic deformation occurs during cyclic loading. When the cyclic
loading is performed within the elastic regime, the stress and strain are linearly
related through the elastic modulus. However, as cyclic loading goes beyond the
elastic regime and into the plastic regime, the stress-strain response becomes
Master Thesis - Z. Yang; McMaster University - Materials Science and Engineering
8
more complex. Even though most engineering structures or components are
designed for the nominal stress level to remain within the elastic region, local stress
concentrations may cause plastic strain. Therefore, it is more appropriate to
consider the fatigue life under strain-controlled conditions when the plastic strain
around stress concentrations is of concern.
2.2.2 Strain-controlled fatigue
The strain-based characterization approach, proposed by Coffin and
Manson in 1954 (as cited in Suresh, 1998), is commonly used as a basis for
structural design in components where cyclic crack initiation ahead of stress
concentration is of primary concern. It is expressed as:
∆ε𝑃
2= ε
f
′(2N
f)c
Here, εf
′ is the fatigue ductility coefficient and c is the fatigue ductility exponent.
In strain-controlled fatigue, the strain amplitude, either plastic strain
amplitude or total strain amplitude, is held constant and the stress-strain response
forms a hysteresis loop. Since the plastic deformation cannot be completely
reversed during cyclic loading, the stress-strain response may change with
successive cycles. The material could either undergo cyclic hardening or cyclic
softening or stay stable. As illustrated in schematic Figure 2.4, with the increase of
cycles, the cyclic strain hardening leads to the increase of peak stress, whereas in
cyclic strain softening the peak stress decreases. (Campbell, 2008)

Master Thesis - Z. Yang; McMaster University - Materials Science and Engineering
9
Figure 2-4 The cyclic stress-strain response and cyclic softening and hardening. (Campbell, 2008)
Since the total strain amplitude could be written as a sum of elastic and
plastic strain amplitude, the Coffin-Manson relationship combined with Basquin's
equation provides an expression for characterizing the total fatigue life.
∆𝜀
2=𝜎𝑓
′
𝐸(2𝑁
𝑓)𝑏 + 𝜀
𝑓
′(2𝑁
𝑓)𝑐

Master Thesis - Z. Yang; McMaster University - Materials Science and Engineering
10
Figure 2-5 Coffin-Manson relationship combined with Basquin's equation. (Retrieved from http://www.fea-optimization.com/ETBX/strainlife_help.html)
The expression of total fatigue life is plotted as a whole along with the two
terms on the right hand side in Figure 2.5 (retrieved from http://www.fea-
optimization.com/ETBX/strainlife_help.html). The intersection of two straight lines
corresponds to a transition lifetime. When the fatigue life is shorter than the
transition life, plastic strain amplitude is the dominant factor in fatigue and the
fatigue life of materials is controlled by ductility; when fatigue life is longer than the
transition life, the elastic strain amplitude dominates fatigue life and the fracture
strength of materials controls the fatigue life. Therefore, it is a trade-off between
ductility and strength to optimize the overall fatigue properties.
2.3 The general influence of porosity on fatigue
As previously mentioned, commercial alloys are always crack-initiated due to
the presence of defects acting as stress concentration sites. In the case of cast

Master Thesis - Z. Yang; McMaster University - Materials Science and Engineering
11
alloys, porosity has been shown to be more dangerous than others such as
inclusions and oxide films (Cao et al., 2014). They serve as preferential crack
initiation sites and can significantly reduce the fatigue life due to high stress
concentration (Gao, Yi, Lee, & Lindley, 2004; Haitham, Horstemeyer, Jordon, &
Xue, 2008; Kim, Park, Yim, & Lee, 2011; Skallerud et al., 1993). The presence of
porosity is more severe than PSBs in forming fatigue cracks and leading to failure
(Couper, Neeson, & Griffiths, 1990). This dominant affecting role of porosity makes
the fatigue behavior insensitive to microstructure and heat treatment (Couper et al.,
1990; Kim et al., 2011; Rettberg, Jordon, Horstemeyer, & Jones, 2012), and also
introduces a large scatter in fatigue life due to different size of defects being
involved as crack initiation sites (Cao et al., 2014; Horstemeyer et al., 2002; Lu,
Taheri, Gharghouri, & Han, 2009; Mayer, Papakyriacou, Zettl, & Stanzl-Tschegg,
2003; Mohd et al., 2012).
2.4 The effect of individual pore features on fatigue
2.4.1 The effect of pore size
In general, when pores serve as crack initiation sites, the larger the pore
size, the shorter the fatigue life. However, it was also reported that only when pores
are larger than a critical size, usually similar to the grain size, will the fatigue life be
significantly reduced (Mu et al., 2014; Skallerud et al., 1993). The large scatter
behavior of fatigue life for specimens containing porosity is also believed to be
related to the scatter of pore size involved in fatigue behavior. In Mohd et al.’s work

Master Thesis - Z. Yang; McMaster University - Materials Science and Engineering
12
(2012), the scatter behavior of fatigue life is shown to be comparable to the scatter
of pore size on fracture surfaces as well as to the scatter of pore size observed on
the cross section. It is worth pointing out that the pore size mentioned above is
measured in 2D, either by metallography or by SEM, so the conclusion drawn on
the basis of 2D characterization may not be necessarily true for the pore size in
3D.
2.4.2 The effect of pore location
Pores at surface or subsurface are believed to be more likely to initiate
fatigue cracks than internal pores (Gao et al., 2004; You Lu, Taheri, & Gharghouri,
2008; Nadot, Mendez, & Ranganathan, 2004; Nadot, Mendez, Ranganathan, &
Beranger, 1999). Nadot et al. (1999) found that an internal pore serving as crack
initiation site needs to be 10 times larger in size to achieve a similar fatigue life as
a specimen fractured from a surface pore. FEM simulation (Gao et al., 2004)
explained this phenomenon in terms of stress concentration factor (Kt). As shown
in Figure 2.6, two pores of the same size were located in the interior and near
surface, respectively, to measure the maximum Kt around them. The Kt of the
internal pore is 2.1 while the Kt of the surface pore is 4.1, which indicates a surface
pore is preferred due to a high stress concentration. In addition, when increasing
the pore size, the stress concentration factor of internal pores is negligibly affected,
but in contrast, the Kt is significantly increased with the increase in size of a surface
or subsurface pore.
Master Thesis - Z. Yang; McMaster University - Materials Science and Engineering
13
Figure 2-6 The effect of pore location shown by the stress concentration around the pore on a cross section of a 3D simulation: (a)global and (b)local view of an internal pore with Kt=2.11;(c)global and (d)local view of a near surface pore, 10um away from surface, with Kt=4.0. (Gao et al., 2004)
2.4.3 The effect of pore geometry and orientation
Before discussing the effect of pore geometry on fatigue, the types of pores
that are usually present in a casting part need to be introduced first since different
pore geometries correspond to different pore types. Shrinkage pores and gas
pores are commonly seen in a die casting part. Shrinkage pores are small in size
and tortuous in shape, resulting from the volumetric contraction of the material as
it solidifies. Gas pores are more scattered in size and relatively spherical. The
formation of gas pores is predominantly due to the air entrapment in the injection
chamber and in the die cavity during the casting process (Lee, 2006; Lopez, Faura,
Hernandez, & Gomez, 2003). It may also be due to the dissolved hydrogen or other
Master Thesis - Z. Yang; McMaster University - Materials Science and Engineering
14
gases in the molten metal and the vapors of mold release agents sprayed on the
die cavity surfaces ((Lee, 2006).
Ammar, Samuel, and Samuel (2008) compared the fatigue results of
specimens fractured due to different pore types (multiple shrinkage pores vs. single
gas pores). They found specimens with multiple shrinkage pores as crack initiation
sites had longer fatigue lives than specimens with single gas pores as crack
initiation sites. As illustrated in Figure 2.7, in the case of multiple shrinkage pores
as crack initiation sites, linkage of small shrinkage pores in the early stage of crack
propagation prolonged the fatigue life, whereas, in the case of a single large gas
pore leading to fatigue crack initiation, the high stress concentration around the
pore accelerated the crack initiation and early growth and is responsible for the
shorter fatigue life.
Figure 2-7 A schematic representation of the surface porosity serving as crack initiation sites in LP PM 319-F and A356-T6 alloys. The thin arrows refer to the crack initiation site and thick arrows indicate the crack propagation direction. (Ammar et al., 2008)
Master Thesis - Z. Yang; McMaster University - Materials Science and Engineering
15
Researchers studied the effect of pore geometry and orientation in fatigue
in terms of local stress or strain concentration. The stress/strain concentration
around two pore geometries (idealized circular shape and awkward star shape)
were studied in 2D in finite element analysis (FEM) (Lu et al., 2009). As shown in
Figure 2.8, the distribution of the von Mises stresses around the pores varies with
the pore geometry, but the difference of maximum Kt between the two cases
agrees within 10%, indicating the insignificance of the effect of pore geometry. The
pore geometry effect was further studied in 3D, utilizing XCT and FEM meshing of
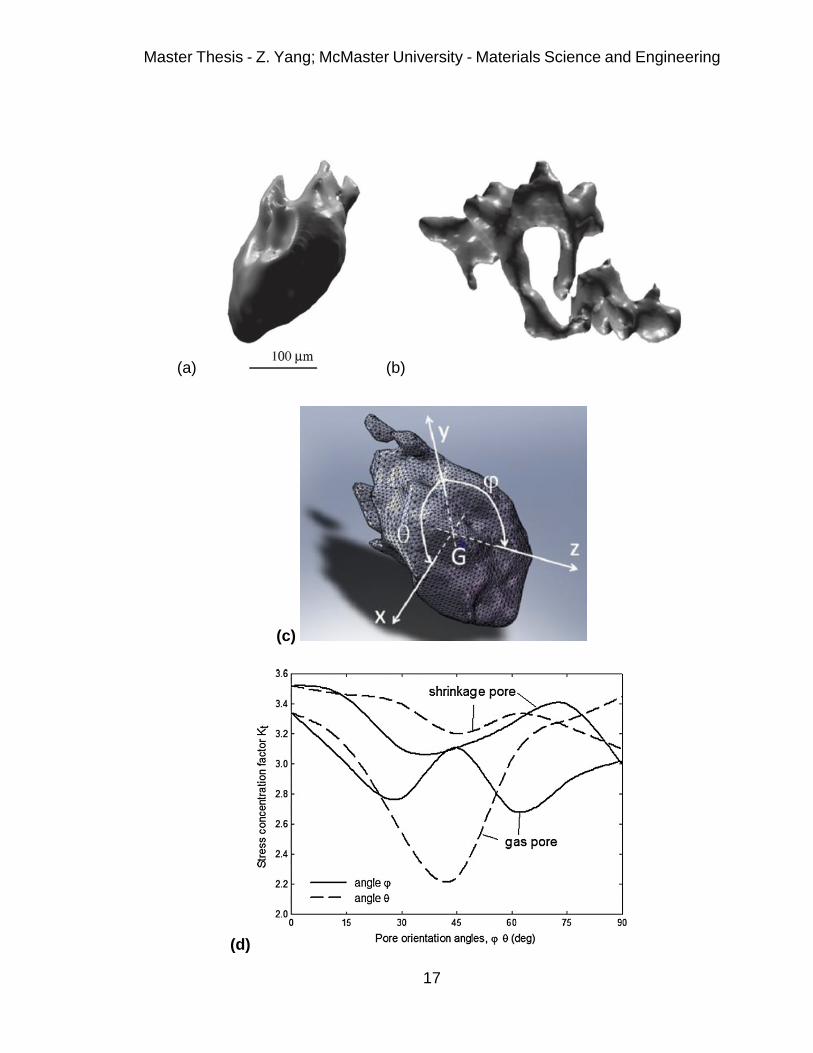
real pore morphology (Nicoletto, Konečna, & Fintova, 2012). The complexity of the
3D geometry results in the stress concentration dependent on both the geometry
and the far field loading direction. Therefore, the stress concentration from two
casting pores, as shown in Figure 2.9 (a) and (b), corresponding to a gas pore and
a shrinkage pore respectively, is plotted versus the pore orientation angle in Figure
2.9 (d). The gas pore and the shrinkage pore are much different in geometry, but
have a similar average maximum Kt, thus sharing same conclusion as studied in
2D. This is rationalized by the fact that the stress concentration is primarily
influenced by the local minimum radius of pore surface, which is similar for the two
geometries.
The Kt of the gas pore is observed to be more deviated than that of the
shrinkage pore, indicating gas pores are more sensitive to loading direction. That
is to say, the effect of pore orientation presents more on specimens failed from gas
pores.
Master Thesis - Z. Yang; McMaster University - Materials Science and Engineering
16
(a)
(b)
Figure 2-8 The contour plot of the von Mises stress around (a) the idealized circular pore and (b) the awkward star-shape pore, under monotonic tension loading (ε∞ =0.28%). (Y. Lu et al., 2009)
Master Thesis - Z. Yang; McMaster University - Materials Science and Engineering
17
(a) (b)
(c)
(d)
Master Thesis - Z. Yang; McMaster University - Materials Science and Engineering
18
Figure 2-9 Two casting pores revealed by XCT – (a) gas pore and (b) shrinkage pore. (c) The coordinate system centered at the pore center of gravity and two rotation angles defined to investigate the dependence of Kt on combined role of pore morphology and loading direction. (d) The Kt of pores in tension vs. pore orientation. (Nicoletto et al., 2012)
2.5 Idealization of porosity in modelling
In most of the previous studies, pores which are 3D in nature are always
simplified as pre-existing 2D cracks when assessing the fatigue life. However, the
simplification of pores often leads to conservative predictions. The prediction being
conservative is due to not considering the crack initiation around defects and the
early stage of crack propagation being microstructurally small, which must be taken
into account for high cycle fatigue. While in low cycle fatigue, the prediction can be
less conservative than that of high cycle fatigue as the macroscopic crack
propagation is the dominant controlling factor, as previously illustrated in Figure
2.3. Some researchers (Nadot et al., 1999; Skallerud et al., 1993) believe that when
fatigue life is short (e.g., less than 106 cycles), the fraction of total life for crack
initiation could be negligible when pores are the crack initiation sites. In the study
of Nadot et al. (2004), a better agreement between experimental data and
prediction was achieved when regarding pores as notches, indicating it is more
appropariate to consider pores as 3D objects.
Being regarded as 3D objects, the porosity is often idealized as spheres to
simplify the complex pore geometry in modelling. To the best of authors’
knowledge, the idealization of porosity proposed by Li et al. (Li, Lee, Maijer, &
Lindley, 2009) gives the smallest deviation (less than 10%) from the stress – strain

Master Thesis - Z. Yang; McMaster University - Materials Science and Engineering
19
state around a realistic pore. The pore was idealized as a sphere with equivalent
projected area on the plane normal to the loading direction. Other idealization
strategies such as an equivalent – diameter sphere and equivalent – maximum –
length sphere give 18% and 30% deviation, respectively (as cited in Li et al., 2009).
In their study, the effect of pore geometry and orientation on stress/strain
concentration was studied individually and both can be explained by the change of
the projected area on a plane normal to the loading direction. But it was also
pointed out that the local stress/strain concentration is compared based on the
average rather than the maximum. Therefore, none of those assumptions are able
to simulate the maximum stress/strain concentration at the minimum radius of pore
surface. These assumptions inevitably lose information about the pore geometry,
but the success of obtaining a small deviation laterally implied the importance of
pore geometry and orientation. It may be interesting to reconsider the effect of pore
size on fatigue since the pores in various size could have similar stress-strain state
due to geometry and orientation difference, as shown in Figure 2.10 (Li et al.,
2009).

Master Thesis - Z. Yang; McMaster University - Materials Science and Engineering
20
Figure 2-10 The average stress-strain concentration around simplified pore geometries with different pore sizes is similar as having same projected area on x-y plane normal to loading direction in z direction. (Li et al., 2009).
2.6 X-ray computed tomography
Porosity could be visualized and measured in 2D by conventional optical or
electron microscopy, but a conclusion about porosity is not reliable by only using
2D metallography techniques. An example is given in Figure 2.11 to show the
difference of porosity appearance in 2D and 3D (Nicoletto, Anzelotti, & Konečna,
2010). The realistic 3D pore extracted from XCT were FE meshed and randomly
sectioned to show the pore geometry in 2D, modelling the microstructure
observation from metallography. Two casting pores that are typical to represent
gas pores and shrinkage pores both show an underestimation in pore size from
metallographic characterization. Besides, because of the complexity of the 3D pore
morphology, a single pore in 3D may be mistaken as a number of isolated
neighboring pores in metallographic characterization. Casting pores, as stress

Master Thesis - Z. Yang; McMaster University - Materials Science and Engineering
21
concentrators, impair fatigue life, therefore a calculation of the stress intensity
factor based on 2D pore geometry will also have errors. The Kt calculated for the
casting pore in Figure 2.11, based on 2D geometry, is found to be twice the value
calculated in 3D. Therefore, a more reliable technique to extract parameters of
porosity in 3D is of significance for a study focusing on the effect of porosity.
Figure 2-11 Simulated sectioning of a gas pore (left) and a shrinkage pore (right). (Nicoletto et al., 2010)
2.6.1 The principle of X-ray Computed Tomography
X-ray computed tomography is a technology that characterizes the internal
structure of an opaque bulky object in a non-destructive way. By using computer-
processed X-ray images, tomographic images are produced and quantitative
characterization can be conducted on the images. Among different methods able
to deliver images quantitatively describing the internal structure of a bulky object
(e.g. ultrasonics, magnetic field, X and gamma rays and electric field), XCT is
widely used in industries and materials characterization field (Baruchel, Buffiere,
Maire, Merle, & Peix, 2000). In materials science, the interest in XCT arises from
the fact that it is important to know what occurs inside the materials when subjected
Master Thesis - Z. Yang; McMaster University - Materials Science and Engineering
22
to mechanical loading. It has been transformed from simply qualitative observation
to quantitative analysis. Key materials science parameters are now able to be
extracted using 3D analysis software.
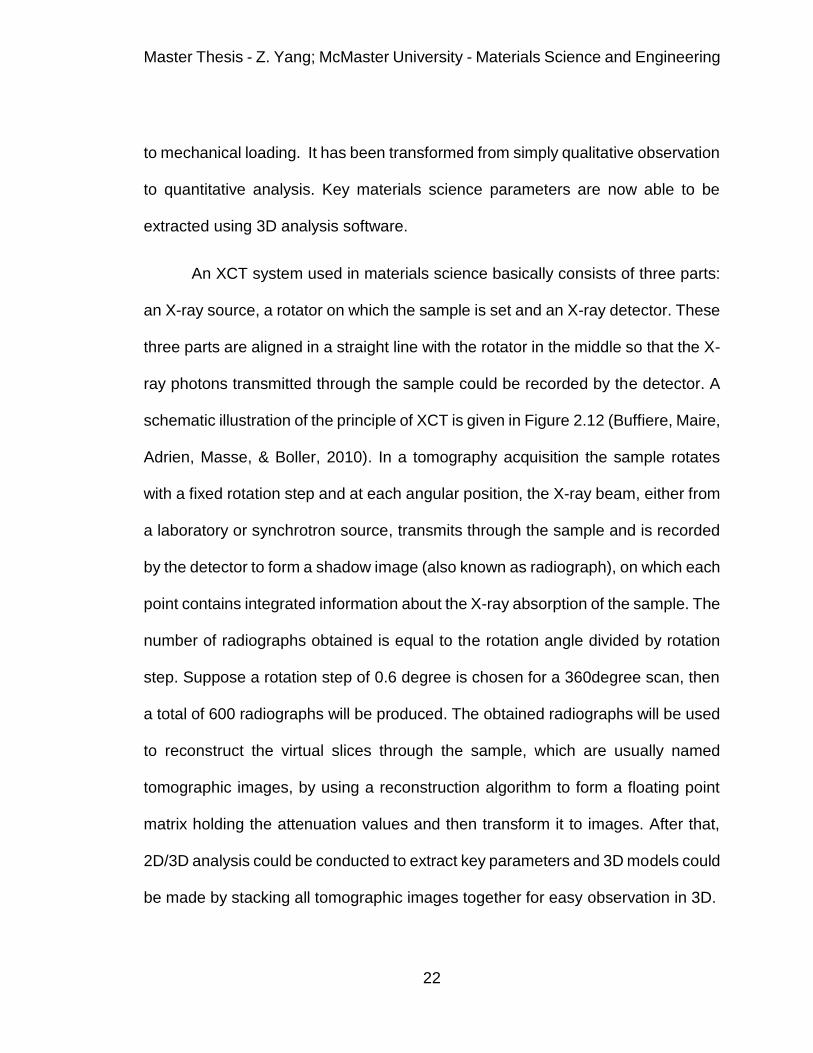
An XCT system used in materials science basically consists of three parts:
an X-ray source, a rotator on which the sample is set and an X-ray detector. These
three parts are aligned in a straight line with the rotator in the middle so that the X-
ray photons transmitted through the sample could be recorded by the detector. A
schematic illustration of the principle of XCT is given in Figure 2.12 (Buffiere, Maire,
Adrien, Masse, & Boller, 2010). In a tomography acquisition the sample rotates
with a fixed rotation step and at each angular position, the X-ray beam, either from
a laboratory or synchrotron source, transmits through the sample and is recorded
by the detector to form a shadow image (also known as radiograph), on which each
point contains integrated information about the X-ray absorption of the sample. The
number of radiographs obtained is equal to the rotation angle divided by rotation
step. Suppose a rotation step of 0.6 degree is chosen for a 360degree scan, then
a total of 600 radiographs will be produced. The obtained radiographs will be used
to reconstruct the virtual slices through the sample, which are usually named
tomographic images, by using a reconstruction algorithm to form a floating point
matrix holding the attenuation values and then transform it to images. After that,
2D/3D analysis could be conducted to extract key parameters and 3D models could
be made by stacking all tomographic images together for easy observation in 3D.
Master Thesis - Z. Yang; McMaster University - Materials Science and Engineering
23
Figure 2-12 Schematic illustration of the principle of XCT. (Buffiere et al., 2010)
2.6.2 X-ray tomography in fatigue study
XCT was initially used to acquire 3D images so the diagnosis could be made
by visual judgment. Recently, the trend has become quantitative characterization
based on a single 3D volume or quantifying the structure evolution by comparing
time-lapse 3D volumes. XCT has been used in fatigue study primarily in 2 aspects,
1. Porosity characterization:
The use of XCT in fatigue is mostly for cast alloys which contain casting
porosity. From tomographic images, quantitative characterization about porosity
can be made in 3D (Buffière, Savelli, Jouneau, Maire, & Fougères, 2001);
parameters such as pore size, sphericity and the proximity with respect to the free
surface are able to be extracted. The parameters about porosity as well as the
tomographic images can also be used in simulation and model development. The
Master Thesis - Z. Yang; McMaster University - Materials Science and Engineering
24
realistic pore morphology could be meshed in FE and fracture mechanics factors
could be determined.
2. Fatigue crack initiation from defects and propagation:
Different from pores, which are easy to detect by X-ray due to adequate
dimensions in 3D, cracks were initially not able to be detected, being limited by the
resolution (Buffière et al., 2001). But, with the development of the new synchrotron
X-ray source and new detection capabilities, high resolution XCT was used to study
the short fatigue crack. In situ experiments were conducted on miniature
specimens to study the fatigue crack initiation and early propagation from a surface
pore and the development of the crack shape and the crack path in 3D were
obtained (Marrow, 2004). XCT also found its value to correlate microstructurally
small crack propagation with local crystallographic orientation (Ludwig, Buffière,
Savelli, & Cloetens, 2003) by using gallium infiltration technique to visualize grain
boundaries in tomographic images.
2.7 Objective of the work
The use of AM60 die-cast Mg alloy in the automotive industry to achieve high
fuel efficiency requires the effect of the inherent porosity on fatigue properties to
be fully understood so that the casting component could provide reliable
performance. Many studies have been conducted to characterize the effect of
porosity on fatigue, as introduced in the literature review section, and some
qualitative conclusions have been drawn, such as, a pore on the surface is more
detrimental than an internal pore; and a larger pore on the surface has a stronger

Master Thesis - Z. Yang; McMaster University - Materials Science and Engineering
25
stress concentration effect. However, most of the conclusions are drawn using 2D
characterization, which is against the 3D nature of the porosity. It has been shown
that 3D characterization of porosity can provide more reliable parameters for
fatigue modelling and simulation. Therefore, in this study, fatigue testing is coupled
with XCT to 3D characterize the effect of porosity on fatigue. This is believed to be
more ideal than previous studies.
Studies investigating the microstructure-properties relationship need the
microstructure to be understood. Solely using 2D metallography to characterize the
microstructure is inaccurate. Therefore, in the present study, the difference
between 2D characterization results and 3D characterization results is also
investigated, expecting this to help other researchers understand the difference.
The effect of surface condition is less mentioned in studies on the effect of
porosity on fatigue due to the high stress concentration of porosity. However, it has
been known for decades the important role of surface condition in fatigue. In this
study, the effect of surface condition on fatigue is also addressed.
Master Thesis - Z. Yang; McMaster University - Materials Science and Engineering
26
3 Experimental procedure
3.1 Sample preparation and details
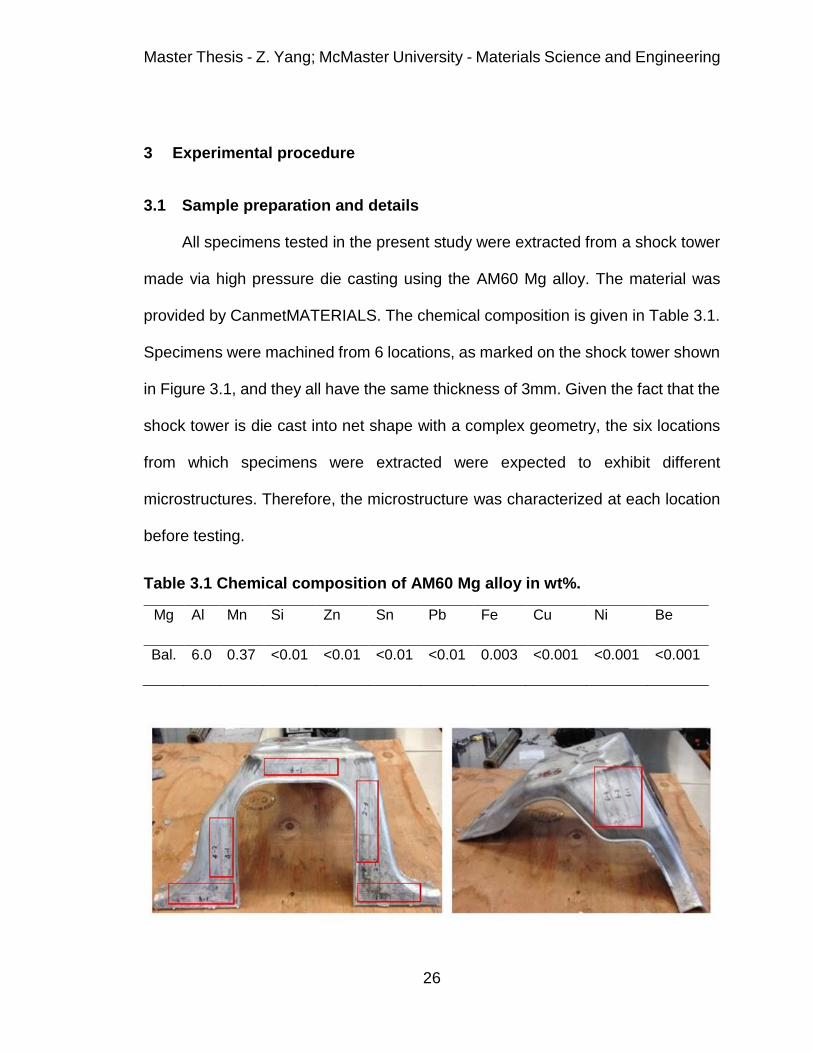
All specimens tested in the present study were extracted from a shock tower
made via high pressure die casting using the AM60 Mg alloy. The material was
provided by CanmetMATERIALS. The chemical composition is given in Table 3.1.
Specimens were machined from 6 locations, as marked on the shock tower shown
in Figure 3.1, and they all have the same thickness of 3mm. Given the fact that the
shock tower is die cast into net shape with a complex geometry, the six locations
from which specimens were extracted were expected to exhibit different
microstructures. Therefore, the microstructure was characterized at each location
before testing.
Table 3.1 Chemical composition of AM60 Mg alloy in wt%.
Mg Al Mn Si Zn Sn Pb Fe Cu Ni Be
Bal. 6.0 0.37 <0.01 <0.01 <0.01 <0.01 0.003 <0.001 <0.001 <0.001

Master Thesis - Z. Yang; McMaster University - Materials Science and Engineering
27
Figure 3-1 A shock tower used in present study with 6 locations marked for specimen preparation.
Fatigue specimens were prepared by electrical discharge machining (EDM),
into a flat dog bone shape. The flat surface on the specimen was reserved as the
original casting surface to preserve the surface microstructure. Initially, a modified
specimen geometry based on ASTM E606 was used for testing. With this specimen
geometry, the strong stress concentration at the shoulder/gauge interaction led to
a large fraction of specimens failing at that region. This was therefore replaced in
later tests by a specimen geometry with a shorter gauge length and a larger radius
at the shoulders. Another specimen geometry with a further reduced cross section
was also used in the present study, to enable the full specimen to be observed
while performing high resolution X-ray computed tomography. All three specimen
geometries are shown in Figure 3.2.
(a)
(b)

Master Thesis - Z. Yang; McMaster University - Materials Science and Engineering
28
(c)
Figure 3-2 Specimen geometries used in present study.
After EDM machining, the machined surfaces in the cross-section-reduced
region were manually ground with SiC papers up to 600 grit. This grinding was
performed only in longitudinal direction so that there was no scratch in the
transverse direction, acting as a stress concentrator. Machining specimens from a
fabricated part, in this case a casting, inevitably introduces a new surface condition.
With an interest in the impact of surface condition on fatigue properties, a number
of specimens were further polished on the machined surfaces to make
comparisons. This improvement of the surface condition on machined surfaces
was achieved using a similar procedure as that used in preparing metallographic
samples — a sample surface is ground down to 1200 grit and then polished with
diamond suspensions down to 1µm and finally polished with a 0.05µm colloidal
silica suspension. The microstructure on the machined surface is observable under
a microscope. An optical surface profiler performed surface roughness
measurements for each surface condition present on a fatigue specimen — casting
surface; EDM machined surface; ground machined surface; and polished
machined surface.
Metallographic samples were prepared for each location to study and
compare the microstructures. As-polished and as-etched sample surfaces were
Master Thesis - Z. Yang; McMaster University - Materials Science and Engineering
29
both characterized under a light microscope. Samples were cold mounted and
followed the preparing procedure specified in the previous paragraph.
3.2 Strain controlled fatigue testing
3.2.1 Standard fatigue testing
Strain controlled fatigue tests were conducted at six strain levels, the strain
amplitude being 0.2%, 0.25%, 0.3%, 0.4%, 0.6% and 0.8%, respectively. All tests
were performed at room temperature with a strain ratio R= -1 and frequency 0.5Hz.
A fatigue test was stopped when the peak load dropped by 10%, which was defined
as failure, to prevent the fracture surfaces from being damaged due to cyclical
contacts. A 6mm extensometer was attached to the specimen to measure the
longitudinal strain. The extensometer was mounted using dental elastics; care was
taken while mounting the extensometer, as the fall-off of the extensometer during
fatigue could result in a catastrophe to the testing machine. This kind of non-stop-
until-fracture fatigue tests aimed to plot the strain amplitude – life (ε –N) curve.
From this data one can choose a strain level to conduct interrupted fatigue tests
accompanied by X-ray tomography scanning at periodic intervals.
During fatigue testing the program automatically records the axial force,
axial strain, running time and the number of completed cycles. However, a fatigue
test at low strain levels could go through millions of cycles; therefore, to effectively
reduce the data size, only a fraction of the representative cycles were saved, every
tens or hundreds of cycles, depending on the fatigue life.

Master Thesis - Z. Yang; McMaster University - Materials Science and Engineering
30
3.2.2 Interrupted fatigue testing coupled with X-ray tomography
Interrupted fatigue tests were conducted at 0.3% strain amplitude with a
3mm extensometer measuring the longitudinal strain. Testing was still conducted
at room temperature with same strain ratio and frequency — the only difference is
that the testing was interrupted every 2,000 cycles and the specimen was removed
for an XCT scan. Incorporating XCT scans in a fatigue test enables us to capture
the fatigue crack development during testing. This is an in-situ study on the effect
of porosity in the fatigue behavior of the AM60 die casting alloy.
3.3 X-ray computed tomography scan
X-ray tomography scan was performed using a Skyscan 1172 high-resolution
micro-CT scanner. By performing X-ray tomography scan on fatigue specimens,
the internal structure (i.e. porosity) could be quantitatively characterized in 3D —
parameters related to each pore such as volume, surface area, sphericity and the
centroid coordinates, are all measurable. In addition, fatigue cracks initiated during
tests could also be detected. Cracks are just a kind of void except that they are
very thin in one direction. Thus cracks can only be detected as long as the pixel
size is significantly smaller than the thickness of the cracks. Therefore, XCT scan
was combined with fatigue testing to not only visualize pores and fatigue cracks in
3D but also make quantitative measurements on them.
All specimens tested in fatigue, either until fracture or interrupted, were XCT
scanned prior to testing and after testing. The initial scan recorded the internal

Master Thesis - Z. Yang; McMaster University - Materials Science and Engineering
31
porosity so that the porosity characterization could be made. Specimens were
grouped into several sets based on the porosity level (i.e. Maximum pore size;
volume percentage of porosity) and at each strain level in fatigue testing,
specimens covering similar scatter of pore sizes were arranged. A final scan
following testing on specimens was used to understand the interaction between
porosity and fatigue cracks in 3D and to make measurements on cracks. It also
helps to locate the pores which initiated each fatigue crack from the initial XCT
scan. The information obtained from post-test scans was expected to assist the
failure analysis by SEM observations. Specimens were only partially fractured
when the final XCT scanned was made since fatigue tests were stopped at 10%
drop below peak load. This is intended because it is easier to understand the
interaction between fatigue cracks and pores in 3D than performed on a fully
fractured specimen, on which a fatigue crack becomes two fracture surfaces.
Specimens tested until fracture were only XCT scanned twice — before and
after — but specimens tested with interruptions were also XCT scanned at intervals
with the intention of recording the evolution of fatigue cracking. This helps to
understand the role of porosity in fatigue and to locate the crack initiation sites
more convincingly. Because the crack initiation site in a fatigue tested specimen is
the earliest to present, the fracture surfaces in that region are the most worn, as a
consequence, leaving nearly no analyzable microstructural features. Usually, from
SEM observations on fracture surfaces, one needs to use some interpretation to
make failure analysis, which can be prone to errors. Therefore, conducting failure

Master Thesis - Z. Yang; McMaster University - Materials Science and Engineering
32
analysis in a non-destructive way during testing has significant advantages in a
fatigue properties study. Every 2,000 cycles, the specimen was taken out of the
testing machine and X-ray scanned to record the inside fatigue cracking. The
specimen is obviously unloaded once removed from the testing machine and due
to the crack closure phenomenon, the crack tip will be partially closed, leading to
an underestimation in crack length. Therefore, to overcome the crack closure effect,
a tensile fixture made of a plastic tube was used to apply a small tensile force on
the specimen so that the crack surfaces are open. This tensile fixture was only
used for final scans. The presence of the plastic tube during XCT scan, because it
absorbs very little in comparison with a metal, will not affect the scanning results.
The fatigue specimen was rotated through 360˚ during an XCT scan while
the camera recorded the projection images at each angle. Actually rotating by 180˚
is sufficient to complete a scan, but a 360˚ rotation scan was chosen to more
accurately capture the geometry of the pores. After each XCT scans, the projection
images taken at different angles were reconstructed using “NRecon” software to
obtain tomography images showing the cross sections of the specimen.
Subsequently, the “CT-Analyser” and “CT-Volume” programs (supplied by
Skyscan) were used for 2D/3D quantitative analysis and 3D visualization,
respectively.
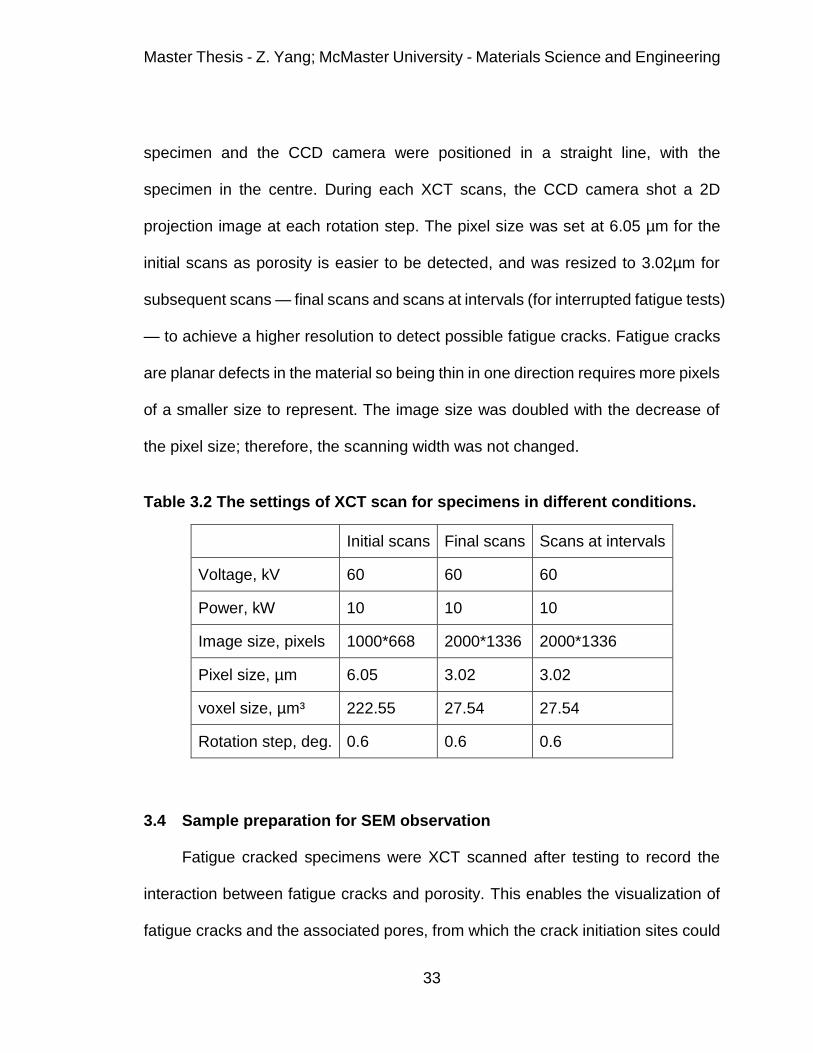
The settings of the XCT scan parameters are listed in Table 3.2. The X-ray
source operates at a voltage of 60 kV for all XCT scans. The scanning volume
covers a 6mm length in the centre of the specimen. The X-ray source, the fatigue
Master Thesis - Z. Yang; McMaster University - Materials Science and Engineering
33
specimen and the CCD camera were positioned in a straight line, with the
specimen in the centre. During each XCT scans, the CCD camera shot a 2D
projection image at each rotation step. The pixel size was set at 6.05 µm for the
initial scans as porosity is easier to be detected, and was resized to 3.02µm for
subsequent scans — final scans and scans at intervals (for interrupted fatigue tests)
— to achieve a higher resolution to detect possible fatigue cracks. Fatigue cracks
are planar defects in the material so being thin in one direction requires more pixels
of a smaller size to represent. The image size was doubled with the decrease of
the pixel size; therefore, the scanning width was not changed.
Table 3.2 The settings of XCT scan for specimens in different conditions.
Initial scans Final scans Scans at intervals
Voltage, kV 60 60 60
Power, kW 10 10 10
Image size, pixels 1000*668 2000*1336 2000*1336
Pixel size, µm 6.05 3.02 3.02
voxel size, µm³ 222.55 27.54 27.54
Rotation step, deg. 0.6 0.6 0.6
3.4 Sample preparation for SEM observation
Fatigue cracked specimens were XCT scanned after testing to record the
interaction between fatigue cracks and porosity. This enables the visualization of
fatigue cracks and the associated pores, from which the crack initiation sites could
Master Thesis - Z. Yang; McMaster University - Materials Science and Engineering
34
be determined by considering the fatigue crack shape. However, limited by the
resolution, the XCT scans performed in the present study could not provide more
detailed microstructural features on fracture surfaces, such as striation pattern.
SEM observations on fracture surfaces were conducted after the collection of
information by XCT scans. The purpose of SEM observations is twofold: to collect
microstructural features on fracture and to verify the observations and conclusions
from XCT scans. The characterization made by XCT scans on fatigue crack and
porosity needs to be verified with a higher resolution technique.
Tested specimens were fractured in tension to reveal the fracture surfaces
and were immediately observed inside SEM for a fresh fracture surface
observation. Both fracture surfaces of a specimen were observed. Before being
mounted to a pin stub with carbon tape, the gripping parts of a specimen on both
ends were cut off. The fracture surface observation was performed using a Philips
XL 30 SEM at CanmetMATERIALS.

Master Thesis - Z. Yang; McMaster University - Materials Science and Engineering
35
4 Results and Discussion
4.1 Microstructure characterization
The microstructure of the AM60 Mg alloy which had been die cast into a
shock tower was characterized at six locations using both optical microscopy and
XCT. The micrographs taken for as-polished and as-etched sample surfaces
provide information about pore defects and grains, respectively. XCT primarily
contributes a quantitative characterization about internal pore defects. This is a
combination of 2D and 3D characterizations to understand the material tested in
the present study.
4.1.1 Metallographic characterization of porosity
The as-polished microstructure of this AM60 die-cast Mg alloy, as shown in
Figure 4.1, reveals two types of pore distribution. A defect band is observed to
follow the contour of the casting, which is made of tiny, irregular-shaped pores,
corresponding to shrinkage pores. In the internal region, a number of large pores,
known as gas pores, are located while the region close to the casting surface is
almost pore free.

Master Thesis - Z. Yang; McMaster University - Materials Science and Engineering
36
Figure 4-1 The cross section of AM60 Mg alloy.
Shrinkage pores and gas pores show different features on the cross section.
In Figure 4.2, a gas pore in a quite large size is observed to be surrounded by tiny
shrinkage pores. Gas pores are isolated, large and with a relatively round geometry.
As noted already in section 2.4.3, both air entrapment and the release of dissolved
hydrogen can lead to the formation of gas pores, so the pore sizes are quite
scattered. In contrast, shrinkage pores are non-equiaxed in shape and with arms
that have grown interdendritically during solidification. The mechanism of
shrinkage pore formation results in the small size of shrinkage pores and the shape
highly dependent on surrounding grains. Therefore, both pore geometry and pore
size can be distinguishing features for gas pores and shrinkage pores.
Master Thesis - Z. Yang; McMaster University - Materials Science and Engineering
37
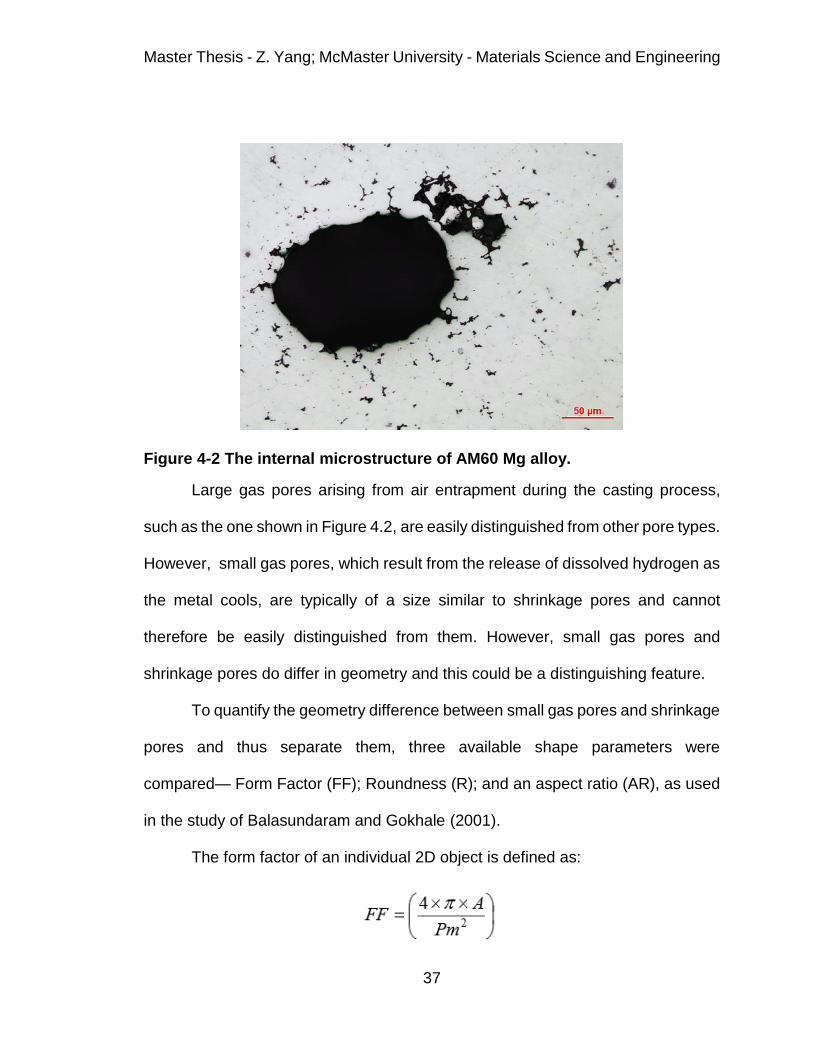
Figure 4-2 The internal microstructure of AM60 Mg alloy.
Large gas pores arising from air entrapment during the casting process,
such as the one shown in Figure 4.2, are easily distinguished from other pore types.
However, small gas pores, which result from the release of dissolved hydrogen as
the metal cools, are typically of a size similar to shrinkage pores and cannot
therefore be easily distinguished from them. However, small gas pores and
shrinkage pores do differ in geometry and this could be a distinguishing feature.
To quantify the geometry difference between small gas pores and shrinkage
pores and thus separate them, three available shape parameters were
compared— Form Factor (FF); Roundness (R); and an aspect ratio (AR), as used
in the study of Balasundaram and Gokhale (2001).
The form factor of an individual 2D object is defined as:
Master Thesis - Z. Yang; McMaster University - Materials Science and Engineering
38
where the A and the Pm are the object area and the perimeter, respectively. The
form factor is an indicator of the geometry complexity. Assuming a pore has a
constant area in 2D but varies in perimeter, the FF would become smaller when
the perimeter increases; i.e., the pore becomes more irregular in shape. Shrinkage
pores have thin arms, therefore adding more in perimeter for a small increase in
area; on the contrary, gas pores do not have arms in the perimeter so a larger
value of FF is expected.
The roundness of an individual 2D object is defined as
in which the A is the object area and the dmax is the major diameter. The major
diameter is defined as the distance between the two most distant points in that
object. The roundness is a measure of the elongation of an object — the more
elongated the object is, the smaller the roundness would be. This could be
particularly useful when the arms of a shrinkage pore are quite long.
The aspect ratio is defined as,
AR=𝑃𝑚
𝜋×𝐷𝑎𝑟𝑒𝑎
where Darea is the area equivalent circle diameter, defined as the diameter of a
circle which has the same area as a pore. Study by Balasundaram and Gokhale
(2001) used the criterion that a pore with a ratio of 1–1.8 is a gas pore to separate
small gas pores from shrinkage pores. Actually, the AR is related to the FF being
the square root of the reciprocal of FF.
Master Thesis - Z. Yang; McMaster University - Materials Science and Engineering
39
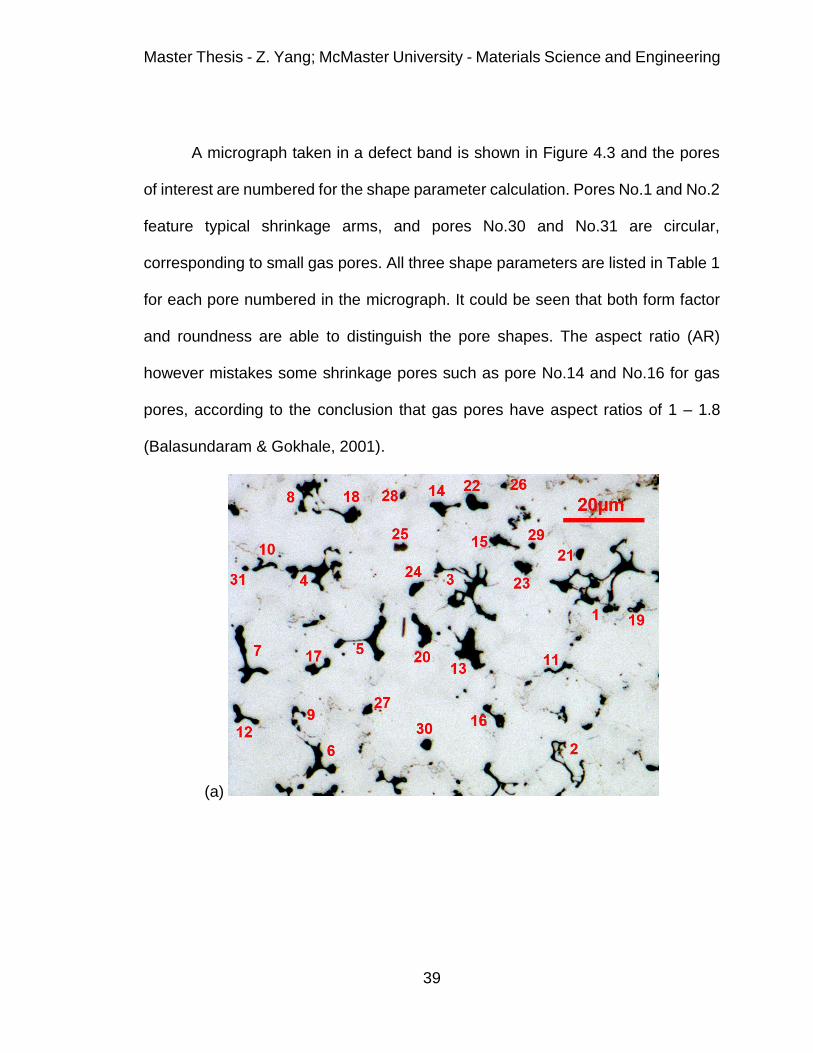
A micrograph taken in a defect band is shown in Figure 4.3 and the pores
of interest are numbered for the shape parameter calculation. Pores No.1 and No.2
feature typical shrinkage arms, and pores No.30 and No.31 are circular,
corresponding to small gas pores. All three shape parameters are listed in Table 1
for each pore numbered in the micrograph. It could be seen that both form factor
and roundness are able to distinguish the pore shapes. The aspect ratio (AR)
however mistakes some shrinkage pores such as pore No.14 and No.16 for gas
pores, according to the conclusion that gas pores have aspect ratios of 1 – 1.8
(Balasundaram & Gokhale, 2001).
(a)

Master Thesis - Z. Yang; McMaster University - Materials Science and Engineering
40
(b)
Figure 4-3 (a) A micrograph taken in a defect band showing shrinkage pores and small gas pores. (b) Color coded pores showing the separation of shrinkage pores (yellow; form factor less than 0.4) and gas pores (blue; form factor larger than 0.6) based on the form factor difference.
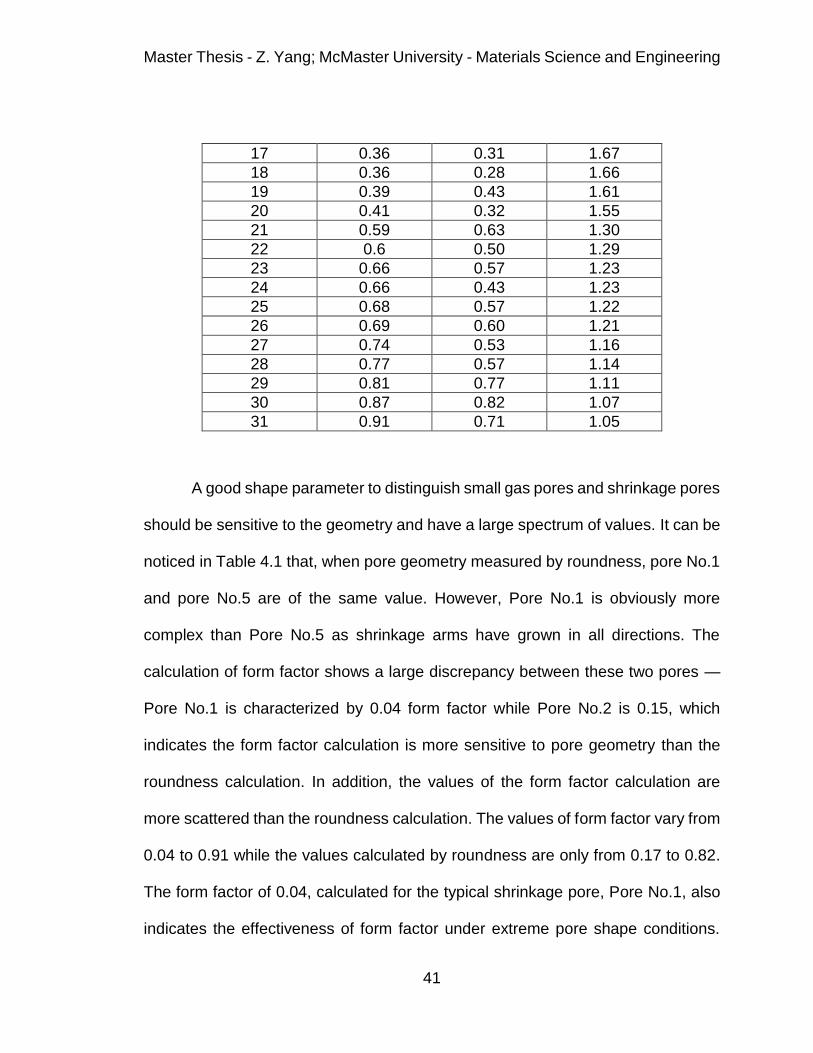
Table 4.1 The list of shape parameters calculated for individual pores.
Pore No. Form factor Roundness Aspect ratio
1 0.04 0.17 4.91
2 0.05 0.13 4.38
3 0.06 0.16 4.13
4 0.13 0.23 2.81
5 0.15 0.17 2.58
6 0.18 0.25 2.37
7 0.18 0.18 2.34
8 0.23 0.34 2.07
9 0.23 0.34 2.06
10 0.26 0.27 1.97
11 0.27 0.18 1.94
12 0.29 0.24 1.85
13 0.3 0.40 1.83
14 0.33 0.27 1.73
15 0.34 0.24 1.71
16 0.36 0.27 1.67
Master Thesis - Z. Yang; McMaster University - Materials Science and Engineering
41
17 0.36 0.31 1.67
18 0.36 0.28 1.66
19 0.39 0.43 1.61
20 0.41 0.32 1.55
21 0.59 0.63 1.30
22 0.6 0.50 1.29
23 0.66 0.57 1.23
24 0.66 0.43 1.23
25 0.68 0.57 1.22
26 0.69 0.60 1.21
27 0.74 0.53 1.16
28 0.77 0.57 1.14
29 0.81 0.77 1.11
30 0.87 0.82 1.07
31 0.91 0.71 1.05
A good shape parameter to distinguish small gas pores and shrinkage pores
should be sensitive to the geometry and have a large spectrum of values. It can be
noticed in Table 4.1 that, when pore geometry measured by roundness, pore No.1
and pore No.5 are of the same value. However, Pore No.1 is obviously more
complex than Pore No.5 as shrinkage arms have grown in all directions. The
calculation of form factor shows a large discrepancy between these two pores —
Pore No.1 is characterized by 0.04 form factor while Pore No.2 is 0.15, which
indicates the form factor calculation is more sensitive to pore geometry than the
roundness calculation. In addition, the values of the form factor calculation are
more scattered than the roundness calculation. The values of form factor vary from
0.04 to 0.91 while the values calculated by roundness are only from 0.17 to 0.82.
The form factor of 0.04, calculated for the typical shrinkage pore, Pore No.1, also
indicates the effectiveness of form factor under extreme pore shape conditions.

Master Thesis - Z. Yang; McMaster University - Materials Science and Engineering
42
Therefore, the form factor is believed to be a parameter capable of distinguishing
two types of pores. A gap in the form factor values is clearly seen between 0.4 and
0.6, so a form factor less than 0.4 seems to be a characteristic of shrinkage pores
and a form factor larger than 0.6 can be the indicator for gas pores. If a pore is
calculated to have a form factor of 0.4 – 0.6, then it is hard to define whether it is a
shrinkage pore or a gas pore. It could either be a shrinkage pore with insignificant
shrinkage arms or an elongated gas pore. Pores in Figure 4.3 (a) were colored
coded in Figure 4.3 (b) based on the form factor criterion to show the separation of
shrinkage pores and gas pores.
It is worth to be noticed that using the form factor difference to separate two
types of pores is conditioned to only small pores. Large gas pores are also
observed to form shrinkage arms on the perimeter, which possibly result in a form
factor less than 0.6. The shrinkage arms of a large gas pore can either be a
consequence of the coalescence between the gas pore and the surrounding
shrinkage pores, or result from the growth of the gas pore being geometrically
hindered by the surrounding solidifying dendrites in the casting process (Buffière
et al., 2001). Therefore, there is not a single distinguishing feature that can totally
separate gas pores and shrinkage pores; both pore size and pore geometry need
to be considered to realize the separation.
4.1.2 3D characterization of porosity
Pores are actually 3D objects in the material; therefore, the 2D
characterization of porosity conducted on a sample surface is less than ideal.
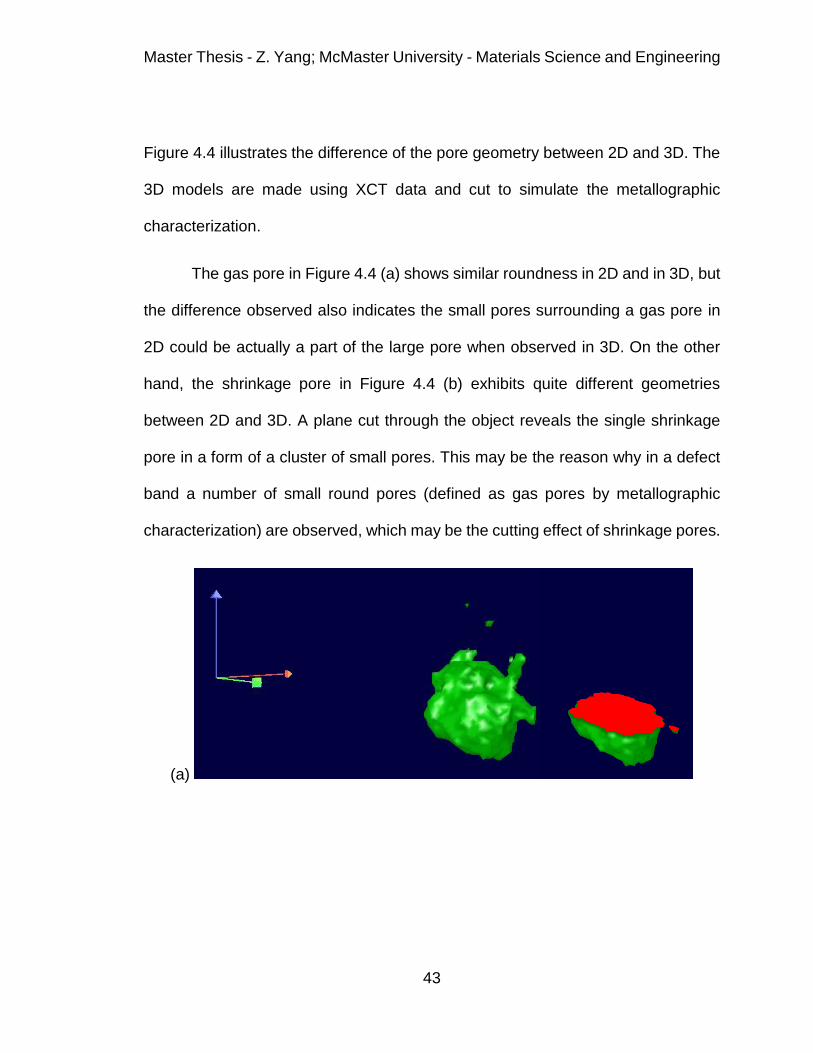
Master Thesis - Z. Yang; McMaster University - Materials Science and Engineering
43
Figure 4.4 illustrates the difference of the pore geometry between 2D and 3D. The
3D models are made using XCT data and cut to simulate the metallographic
characterization.
The gas pore in Figure 4.4 (a) shows similar roundness in 2D and in 3D, but
the difference observed also indicates the small pores surrounding a gas pore in
2D could be actually a part of the large pore when observed in 3D. On the other
hand, the shrinkage pore in Figure 4.4 (b) exhibits quite different geometries
between 2D and 3D. A plane cut through the object reveals the single shrinkage
pore in a form of a cluster of small pores. This may be the reason why in a defect
band a number of small round pores (defined as gas pores by metallographic
characterization) are observed, which may be the cutting effect of shrinkage pores.
(a)

Master Thesis - Z. Yang; McMaster University - Materials Science and Engineering
44
(b)
Figure 4-4 The comparison of pore geometry in 2D and 3D for (a) a gas pore and (b) a shrinkage pore.
4.1.3 Pore size distribution in 2D and in 3D
To quantitatively study the discrepancy in the pore size measurement
between 2D and 3D, pores in a defect band were measured and compared. Gas
pores are relatively spherical and the discrepancy is expected to be small;
therefore, only shrinkage pores, which are densely located in defect bands, were
studied.
4.1.3.1 2D pore size characterization
A high magnification was used when taking micrographs so that the
geometry of a shrinkage pore could be accurately captured. A montage image was
made by stitching individual micrographs to measure sufficient shrinkage pores in
a defect band, as shown in Figure 4.5.

Master Thesis - Z. Yang; McMaster University - Materials Science and Engineering
45
Figure 4-5 A montage image taken in a defect band for pore size measurement.
The image of the defect band was digitally processed to extract the
individual pore size. The pore size is defined as the equivalent area circle diameter
having the same area as the actual pore. Only pores with a complete shape were
measured while the incomplete pores, i.e. those which intersected with the borders
of the image, were excluded.
Histograms for the number density and the area fraction as a function of the
pore size are shown in Figure 4.6 and Figure 4.7 respectively. The results indicate
the majority of the shrinkage pores in the defect band are less than 16µm in
diameter with pores of a few microns in diameter being the most frequent. The
number of pores decreases with an increase of pore size. The histogram plotted in
terms of area fraction reveals pores around 6µm make the largest contribution to
the void space in a defect band. It is also observed that several pores are around
20µm in diameter and each of them takes a fraction of the void space, which are
invisible in the number density histogram.

Master Thesis - Z. Yang; McMaster University - Materials Science and Engineering
46
Figure 4-6 The distribution of pore size.
Figure 4-7 The area histogram plotted as area fraction vs. pore size.
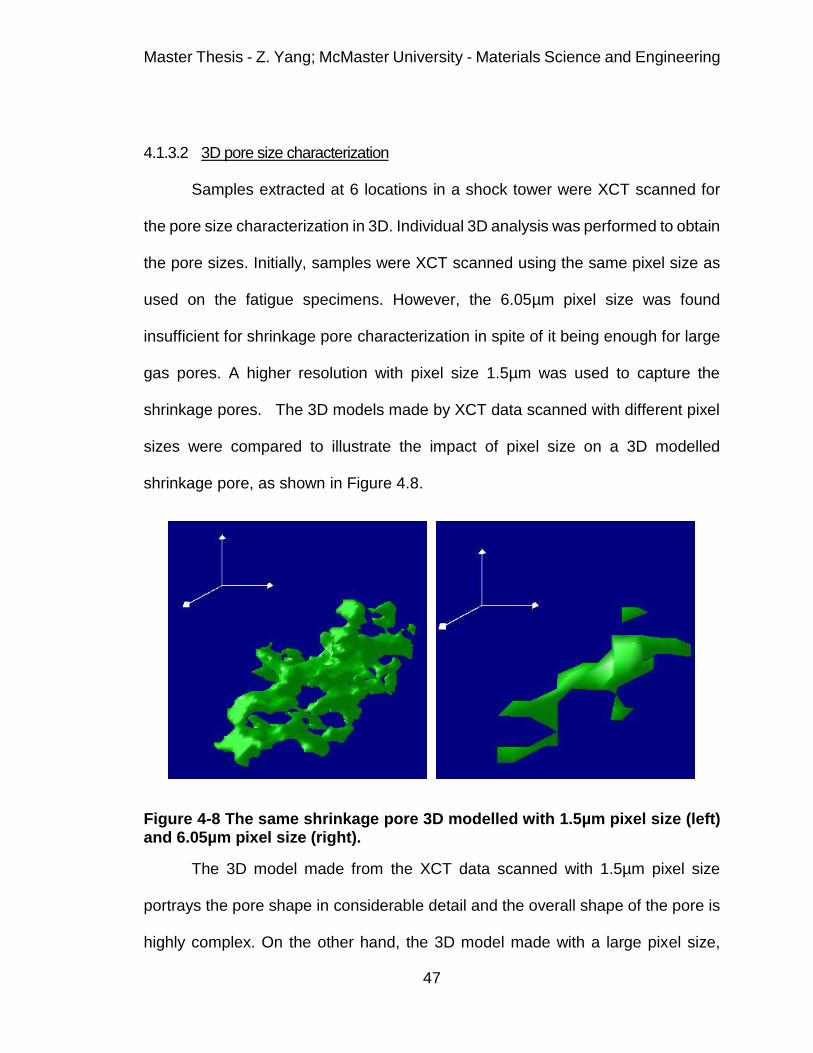
Master Thesis - Z. Yang; McMaster University - Materials Science and Engineering
47
4.1.3.2 3D pore size characterization
Samples extracted at 6 locations in a shock tower were XCT scanned for
the pore size characterization in 3D. Individual 3D analysis was performed to obtain
the pore sizes. Initially, samples were XCT scanned using the same pixel size as
used on the fatigue specimens. However, the 6.05µm pixel size was found
insufficient for shrinkage pore characterization in spite of it being enough for large
gas pores. A higher resolution with pixel size 1.5µm was used to capture the
shrinkage pores. The 3D models made by XCT data scanned with different pixel
sizes were compared to illustrate the impact of pixel size on a 3D modelled
shrinkage pore, as shown in Figure 4.8.
Figure 4-8 The same shrinkage pore 3D modelled with 1.5µm pixel size (left) and 6.05µm pixel size (right).
The 3D model made from the XCT data scanned with 1.5µm pixel size
portrays the pore shape in considerable detail and the overall shape of the pore is
highly complex. On the other hand, the 3D model made with a large pixel size,

Master Thesis - Z. Yang; McMaster University - Materials Science and Engineering
48
6.05µm, presents an overly simple geometry with the absence of a large fraction
of void space. In addition, the size of the shrinkage pore in Figure 4.8, was also
measured to be different when XCT scanned using different pixel sizes. The 3D
analysis calculated the pore size as 41.5µm in diameter when pixel size is 6.05µm
while it is 31µm when the pixel size is 1.5µm. Discrepancies in pore geometry and
in pore size measurement will be rationalized in following.
The difference in the pore geometry illustration, as shown in Figure 4.8, is
related to the number of voxels used to represent the shrinkage pore. The equation
to calculate the number of voxels with a given pixel size and a pore size is as
follows:
where the left side of the equation is the real volume of a pore, and the n is the
number of voxels. The size of a pore in 3D, 2R, is defined as the volume equivalent
sphere diameter.
The shrinkage pore in Figure 4.8 will occupy 4622 voxels when the pixel
size is set as 1.5µm; and it will occupy only 169 voxels when the pixel size is
6.05µm. Therefore, a 3D model made with 4622 voxels is certainly more
representative than one consisting of 169 voxels. Using a smaller number of large-
size voxels not only oversimplifies the shape of a shrinkage pore but also
overestimates the size of the pore when the thin parts of the pore, such as the

Master Thesis - Z. Yang; McMaster University - Materials Science and Engineering
49
shrinkage arms, are thinner than one pixel size but have been represented by
voxels.
The overestimation of the pore size in the large pixel size calculation also
comes from the low contrast. In Figure 4.9 a tomography image shows the strong
contrast in a defect band when pixel size is 1.5µm. The black phases are pore
defects and the gray and white phases correspond to the material matrix.
Compared with the pixel size of 6.05µm, the pixel size of 1.5µm captures the outline
of a pore more accurately.
Figure 4-9 A tomography image showing the strong contrast between shrinkage pores and the material matrix in a defect band region.
Shrinkage pores in a defect band were individually 3D analyzed to plot the
histogram of pore size distribution, as shown in Figure 4.10, and to plot the volume
histogram, in Figure 4.11, considering the total volume of pores in each bin.

Master Thesis - Z. Yang; McMaster University - Materials Science and Engineering
50
Figure 4-10 The distribution of pore size in a defect band measured in 3D. A red line positioned at 4µm highlights the cut off value of which on the left is regarded as noise.
Figure 4-11 The volume histogram plotted as volume fraction vs. pore size, which is characterized in 3D. A red line positioned at 4µm highlights the cut off value of which on the left is regarded as noise.
The pore size distribution characterized in 3D follows a similar trend to 2D
characterization — the smaller the pore, the greater the frequency. A right shift of

Master Thesis - Z. Yang; McMaster University - Materials Science and Engineering
51
the peak was observed in the histogram based on volume fraction, showing pores
of 10 – 15µm represent the most of the void space in the material. In addition,
presenting the data in a volume histogram reveals the small number of large gas
pores, each one of which accounts for a significant volume fraction.
Actually, an XCT 3D analysis is inevitably accompanied by the generation
of a certain amount of noise, which may appear as extremely small dark features
that may be mistaken as pores. For example, in Figure 4.9, in addition to the
porosity represented by the black regions, some dots in the matrix are also with a
similar gray intensity. Therefore, the histograms in Figure 4.10 and Figure 4.11 are
subjected to the effect of noise and a cut-off value should be considered to
separate the noise from pores when interpreting the histograms to assure the
reliability of the pore size analysis results. It can be observed that, as highlighted
by red lines, pores located in the first three bins, i.e. with a pore size of 1–4µm,
represent more than 50% of the pore population but only make up about 3% of the
total void space. It is believed to be the effect of noise that the noise is mistaken
as a large amount of pores which only make up a negligible fraction of the void
space. Since the effect of noise is negligible in terms of volume histogram, the
noise is not removed from the data in the following analysis.
In Fig. 4.12, the volume histogram in 3D, as shown in Figure 4.11, is
compared with the area histogram in 2D from Figure 4.7. Bars are replaced by dots
for an easier comparison. The 2D characterization of the pore size shows a peak
at 6µm while in the 3D characterization, the peak is shifted to about 10µm. This

Master Thesis - Z. Yang; McMaster University - Materials Science and Engineering
52
difference has two probable causes. The first is the sectioning effect. For example
if we randomly section a sphere the average intercept length is 2/3rd of the sphere
diameter. This would account for most of the observed difference. In addition, a
complex-shaped pore in 3D can be converted to a cluster of smaller pores in a 2D
cross section. Thus, extra pores with a smaller size present on a cross section
results in the accumulation of additional apparent small pores. As a consequence,
even taking into account the sectioning effect, 2D characterization can
overestimate the pore population. The characterization of pore sizes in 3D is
believed to be more accurate than 2D characterization.
Figure 4-12 The comparison of pore size distribution between 2D and 3D.

Master Thesis - Z. Yang; McMaster University - Materials Science and Engineering
53
4.1.3.3 Pore size distribution between locations
A 3D characterization of the pore size in a defect band was carried out at
each one of the six locations. The volume histograms are plotted in Figure 4.13.
The peaks of the distribution curves are at similar diameters about 10 –15µm. The
tails on the right side depict the presence of a small fraction of relatively large pores,
resulting in the difference of variance among locations. These are believed to be
some large gas pores occasionally present in the vicinity of a defect band. The six
locations at which specimens were extracted are all flat regions in the shock tower,
with a thickness of 3mm.Therefore, the solidification of molten liquid at these
locations may be similar and result in the shrinkage pores in a similar size. In other
regions, where the shape is more complex, the defects band may behave
differently. However, that is not a concern due to other regions being thicker. It
could be concluded that the presence of defect bands is a common feature
throughout a die-cast shock tower and the shrinkage pores in each locations are
similar in size.
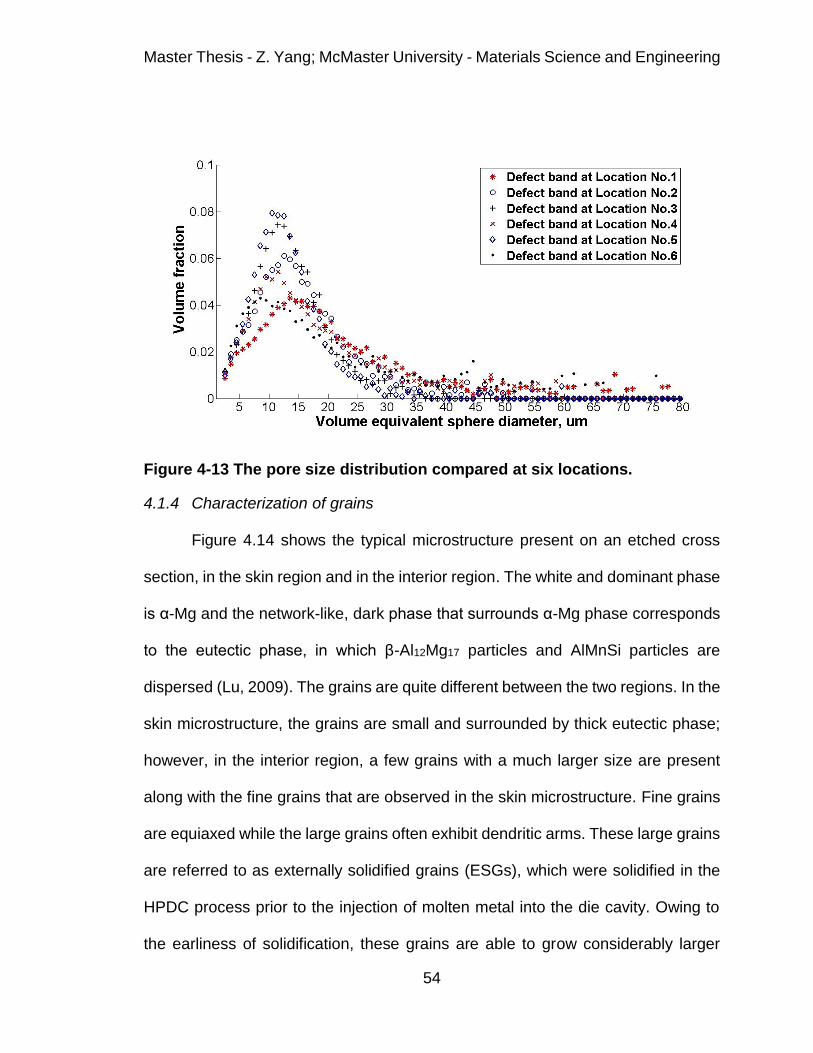
Master Thesis - Z. Yang; McMaster University - Materials Science and Engineering
54
Figure 4-13 The pore size distribution compared at six locations.
4.1.4 Characterization of grains
Figure 4.14 shows the typical microstructure present on an etched cross
section, in the skin region and in the interior region. The white and dominant phase
is α-Mg and the network-like, dark phase that surrounds α-Mg phase corresponds
to the eutectic phase, in which β-Al12Mg17 particles and AlMnSi particles are
dispersed (Lu, 2009). The grains are quite different between the two regions. In the
skin microstructure, the grains are small and surrounded by thick eutectic phase;
however, in the interior region, a few grains with a much larger size are present
along with the fine grains that are observed in the skin microstructure. Fine grains
are equiaxed while the large grains often exhibit dendritic arms. These large grains
are referred to as externally solidified grains (ESGs), which were solidified in the
HPDC process prior to the injection of molten metal into the die cavity. Owing to
the earliness of solidification, these grains are able to grow considerably larger

Master Thesis - Z. Yang; McMaster University - Materials Science and Engineering
55
than other grains which solidified in the die cavity. It was expected for this material
to present a bimodal grain size distribution due to the presence of ESGs.
(a)
(b)
Figure 4-14 The microstructure of AM60 Mg alloy in (a) in the skin region and (b) in the interior.
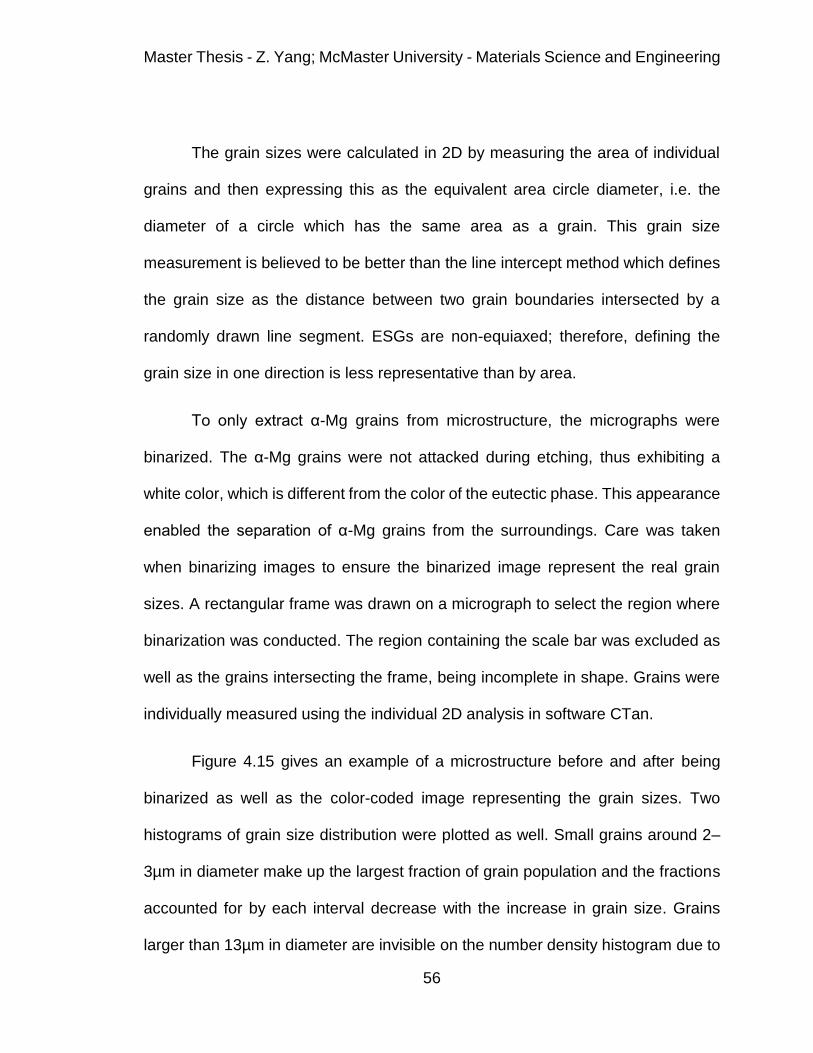
Master Thesis - Z. Yang; McMaster University - Materials Science and Engineering
56
The grain sizes were calculated in 2D by measuring the area of individual
grains and then expressing this as the equivalent area circle diameter, i.e. the
diameter of a circle which has the same area as a grain. This grain size
measurement is believed to be better than the line intercept method which defines
the grain size as the distance between two grain boundaries intersected by a
randomly drawn line segment. ESGs are non-equiaxed; therefore, defining the
grain size in one direction is less representative than by area.
To only extract α-Mg grains from microstructure, the micrographs were
binarized. The α-Mg grains were not attacked during etching, thus exhibiting a
white color, which is different from the color of the eutectic phase. This appearance
enabled the separation of α-Mg grains from the surroundings. Care was taken
when binarizing images to ensure the binarized image represent the real grain
sizes. A rectangular frame was drawn on a micrograph to select the region where
binarization was conducted. The region containing the scale bar was excluded as
well as the grains intersecting the frame, being incomplete in shape. Grains were
individually measured using the individual 2D analysis in software CTan.
Figure 4.15 gives an example of a microstructure before and after being
binarized as well as the color-coded image representing the grain sizes. Two
histograms of grain size distribution were plotted as well. Small grains around 2–
3µm in diameter make up the largest fraction of grain population and the fractions
accounted for by each interval decrease with the increase in grain size. Grains
larger than 13µm in diameter are invisible on the number density histogram due to
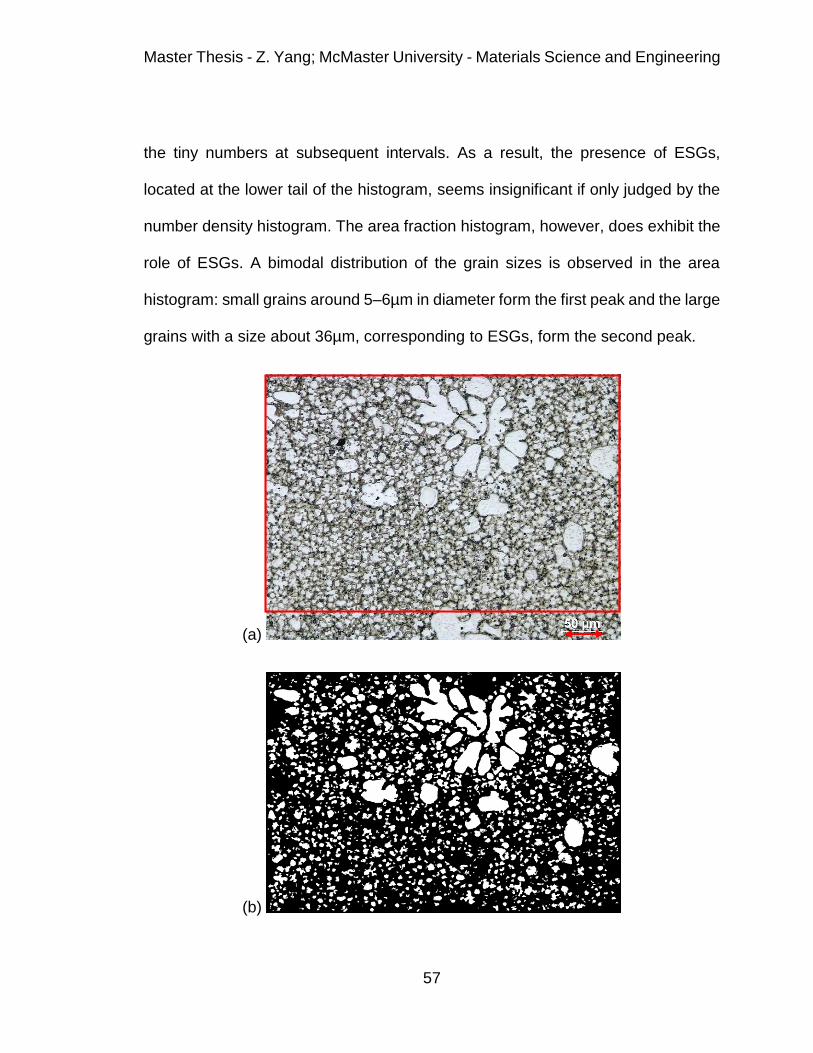
Master Thesis - Z. Yang; McMaster University - Materials Science and Engineering
57
the tiny numbers at subsequent intervals. As a result, the presence of ESGs,
located at the lower tail of the histogram, seems insignificant if only judged by the
number density histogram. The area fraction histogram, however, does exhibit the
role of ESGs. A bimodal distribution of the grain sizes is observed in the area
histogram: small grains around 5–6µm in diameter form the first peak and the large
grains with a size about 36µm, corresponding to ESGs, form the second peak.
(a)
(b)
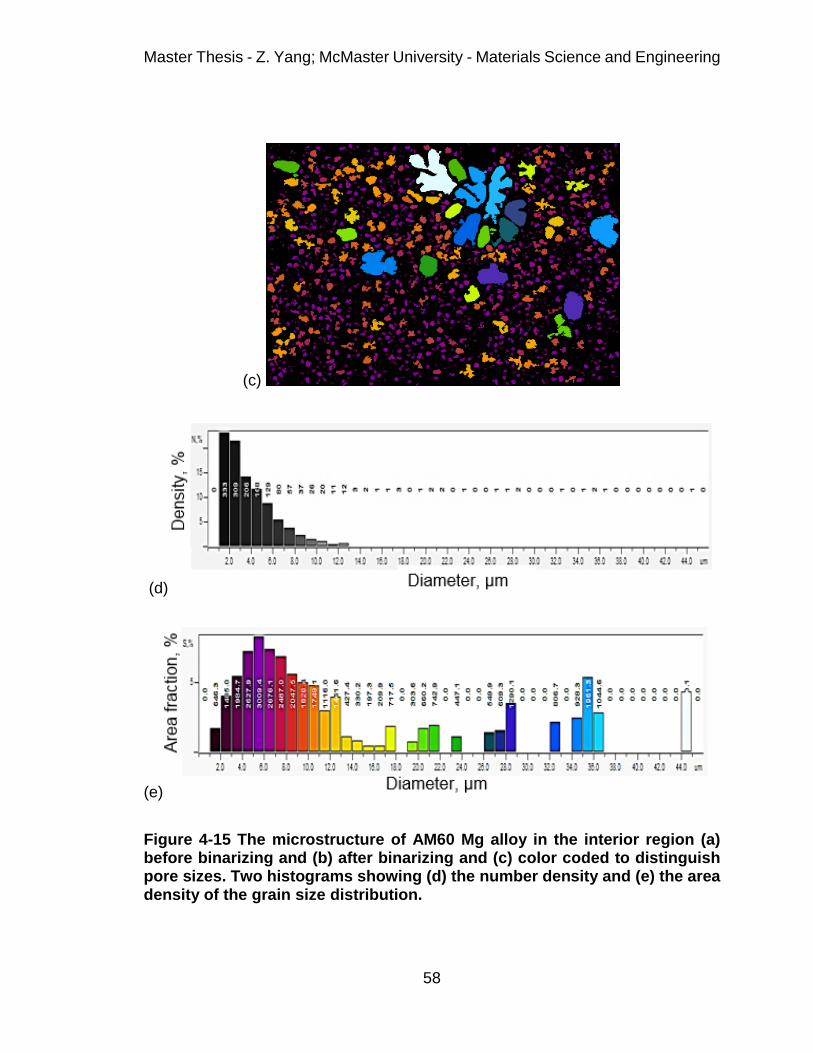
Master Thesis - Z. Yang; McMaster University - Materials Science and Engineering
58
(c)
(d)
(e)
Figure 4-15 The microstructure of AM60 Mg alloy in the interior region (a) before binarizing and (b) after binarizing and (c) color coded to distinguish pore sizes. Two histograms showing (d) the number density and (e) the area density of the grain size distribution.

Master Thesis - Z. Yang; McMaster University - Materials Science and Engineering
59
The area histogram plotted for the skin microstructure, on the contrary,
shows a single peak, as seen in Figure 4.16. Only one ESG was observed on the
microstructure studied, indicating ESGs are primarily located in the interior region.
The absence of ESGs in surface microstructure is also confirmed at other locations.
The peak in the grain size distribution was found again around 6µm; therefore, it is
fair to conclude that the fine grains present in the skin microstructure and in the
interior are similar in size and the main difference between the two types of
microstructures comes from the addition of ESGs in the interior microstructure.
(a)
(b)
Figure 4-16 (a) Color-coded surface microstructure and (b) the area histogram showing a unimodal distribution.
Master Thesis - Z. Yang; McMaster University - Materials Science and Engineering
60
4.2 Fatigue test results
4.2.1 ε – N curve for modified standard dimension
Strain controlled fatigue tests were initially conducted using the modified
standard dimension. However, nearly half of the specimens tested were fatigue
fractured at the gauge/shoulder intersection or in shoulders. Figure 4.17 shows the
ε – N curve for all the specimens tested, whether fractured within the gauge length
(denoted as valid) or fractured outside (denoted as invalid). The failure of
specimens outside of the gauge length was found to be worse at lower strain levels:
specimens fatigue tested at 0.2% strain amplitude all failed outside. It was believed
the sharp radius of the shoulders acted as a stress concentration leading to the
failure of a large fraction of specimens. In later tests, fatigue specimens were
prepared with a larger radius at the shoulders and the fatigue testing results, which
will be presented in the following section, showed all specimens tested were
fractured within the gauge length.

Master Thesis - Z. Yang; McMaster University - Materials Science and Engineering
61
Figure 4-17 The ε – N curve of modified standard dimension showing a large fraction of specimens failed outside the gauge length (labeled as “invalid data points”).
4.2.2 ε – N curve for large-radius dimension
Figure 4.18 shows the ε – N curve produced by testing specimens with a
large radius at six strain levels. At each strain level, 5 specimens with the same
machined surface condition (ground to 600 grit) were tested; some specimens
shared similar fatigue lives so the data points were overlaid. As seen from the figure,
lower strain levels are subject to a larger scatter of fatigue life: the scatter of fatigue
lives at 0.2% strain amplitude is more than one order of magnitude.
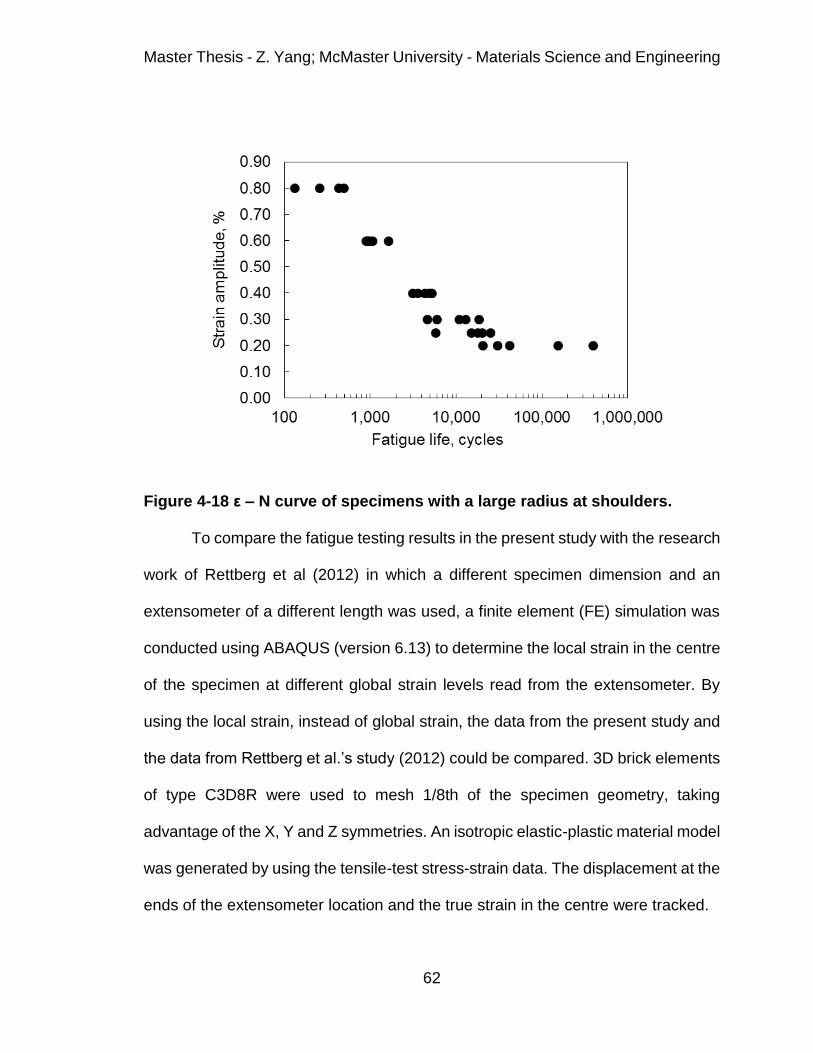
Master Thesis - Z. Yang; McMaster University - Materials Science and Engineering
62
Figure 4-18 ε – N curve of specimens with a large radius at shoulders.
To compare the fatigue testing results in the present study with the research
work of Rettberg et al (2012) in which a different specimen dimension and an
extensometer of a different length was used, a finite element (FE) simulation was
conducted using ABAQUS (version 6.13) to determine the local strain in the centre
of the specimen at different global strain levels read from the extensometer. By
using the local strain, instead of global strain, the data from the present study and
the data from Rettberg et al.’s study (2012) could be compared. 3D brick elements
of type C3D8R were used to mesh 1/8th of the specimen geometry, taking
advantage of the X, Y and Z symmetries. An isotropic elastic-plastic material model
was generated by using the tensile-test stress-strain data. The displacement at the
ends of the extensometer location and the true strain in the centre were tracked.
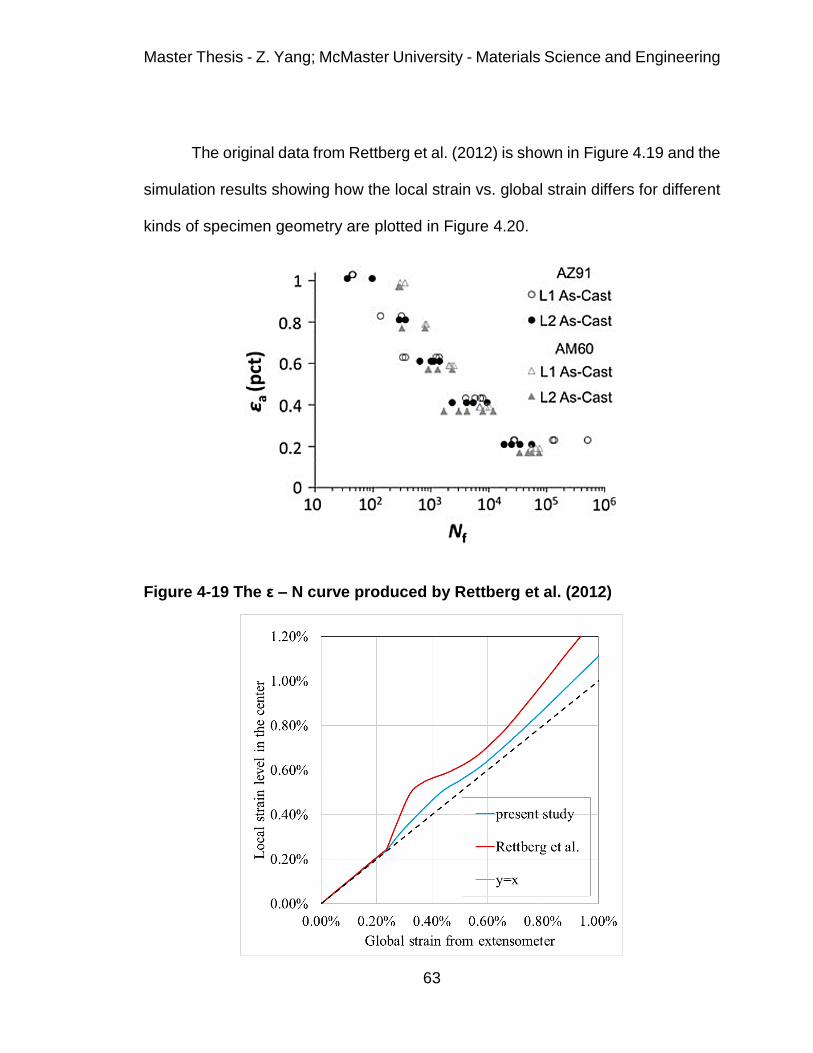
Master Thesis - Z. Yang; McMaster University - Materials Science and Engineering
63
The original data from Rettberg et al. (2012) is shown in Figure 4.19 and the
simulation results showing how the local strain vs. global strain differs for different
kinds of specimen geometry are plotted in Figure 4.20.
Figure 4-19 The ε – N curve produced by Rettberg et al. (2012)

Master Thesis - Z. Yang; McMaster University - Materials Science and Engineering
64
Figure 4-20 The local strain amplitude in the centre of the specimen for two sets of dimensions simulated by ABAQUS.
As shown in Figure 4.20, both specimen geometries show a local strain in
the centre higher than the global strain measured by the extensometer when
loaded beyond the yielding point (global strain = 0.002), especially for the
specimen geometry used in the study of Rettberg et al.(2012). This is expected
because the cross section in the centre is the smallest. A bump is observed in each
curve which reaches the most deviated point at about 0.4% strain. The bumps are
associated with the extensometer-measured gauge length being non-uniform, and
the hardening of the materials during plastic deformation. Below the yielding point
(global strain = 0.002), the material deforms elastically and uniformly; therefore,
the local strain is equal to the global strain. With the material being further loaded,
the centre of the specimen is the first to yield and plastically deform, such that the
local strain starts to diverge from the global strain, thus forming a bump on the
curve. Further loading the specimen makes it strain harden so the region adjacent
to the yielded centre area also yields, thus releasing the strain concentration in the
centre to some extent, upon which the local strain converges to the global strain.
Therefore, instead of using the strain read from an extensometer, the data
from Rettberg et al. was plotted with the testing results in the present study as the
local strain amplitude in the centre versus the fatigue life in Figure 4.21. Compared
with the data of Rettberg et al. (2012), the data of the present study shows shorter
fatigue lives at high strain levels (above 0.4%) while at low strain levels, the fatigue
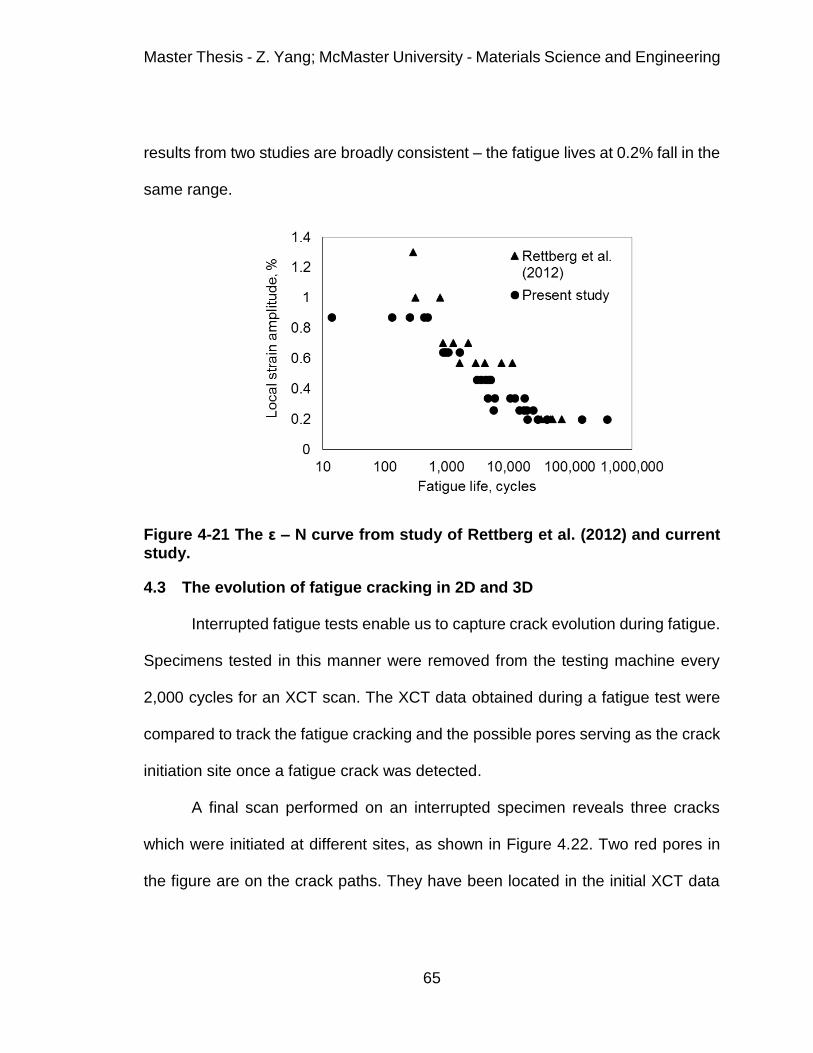
Master Thesis - Z. Yang; McMaster University - Materials Science and Engineering
65
results from two studies are broadly consistent – the fatigue lives at 0.2% fall in the
same range.
Figure 4-21 The ε – N curve from study of Rettberg et al. (2012) and current study.
4.3 The evolution of fatigue cracking in 2D and 3D
Interrupted fatigue tests enable us to capture crack evolution during fatigue.
Specimens tested in this manner were removed from the testing machine every
2,000 cycles for an XCT scan. The XCT data obtained during a fatigue test were
compared to track the fatigue cracking and the possible pores serving as the crack
initiation site once a fatigue crack was detected.
A final scan performed on an interrupted specimen reveals three cracks
which were initiated at different sites, as shown in Figure 4.22. Two red pores in
the figure are on the crack paths. They have been located in the initial XCT data

Master Thesis - Z. Yang; McMaster University - Materials Science and Engineering
66
and found to be the largest two pores in the specimen. Another void defect just
underneath the casting surface was also related to a fatigue crack.
Figure 4-22 A 3D model of fatigue cracked specimen with the material matrix set as transparent to reveal internal cracks and porosity
The evolution of fatigue cracks in this specimen is shown in Figure 4.23,
which are presented as the top view of corresponding 3D models of Figure 4.22.
Each image represents a different number of cycles during testing. Only the corner
where the cracks are located is shown. The two casting pores highlighted in Figure
4.23 are partially overlapped from this perspective, but it is still obvious that cracks
were initiated from the casting pores within 5,784 cycles. Compared with the 3D
models representing the internal pores before 4,000 cycles, the increase in the
density of green dots around those two casting pores indicates that the crack was
initiated from casting pores and then propagated in all directions. The crack
initiated from pore No.1 primarily propagated in the through-thickness direction

Master Thesis - Z. Yang; McMaster University - Materials Science and Engineering
67
while the crack initiated from pore No.2 is observed to propagate in the width
direction through the defect band region. The crack initiated from pore No.3
propagated in a through-thickness direction, which is hardly seen until at 6,000
cycles.
Figure 4-23 Top view of the 3D models made at (a) initial state, (b) 4,000 cycles, (c) 5,784 cycles and (d) 6,000 cycles. Three pores served as crack initiation site, marked in (a).
The observations of fatigue crack evolution in the 3D models make it easy
to understand how a fatigue crack is initiated and propagated. However, one
problem with the 3D model observations is that the fatigue cracks shown in a 3D
model are incomplete in shape. The crack front part is invisible due to a failure to
Master Thesis - Z. Yang; McMaster University - Materials Science and Engineering
68
separate the crack front from the matrix during image binarizing. The binarizing
function only recognizes a crack front when it shows a sufficient difference in
grayscale from the matrix. Specimens for interrupted fatigue test were in unloaded
condition when being XCT scanned at intervals. Therefore, due to the crack closure
phenomenon, the crack front is quite thin and thus does not have enough pixels to
represent itself. In other words, a 3D model is only able to present a part of a crack
that is thick enough to be recognized as a void space. As outlined below two
approaches have been taken to address this concern.
The evolution of a fatigue crack during testing could be viewed both in 3D
and in 2D. A 3D model is made by stacking up all tomography images
reconstructed from projection images. The cracks are generally oriented in a
direction normal to the loading direction; therefore, the tomography images across
the sample (i.e. perpendicular to the crack direction), which are intersected with a
fatigue crack, can show a cross section of the crack on each slice in the form of a
dark gray shadow.
A series of tomography images obtained at different cycles are shown in
Figure 4.24. Before 4,000 cycles the crack is not visible on the tomography images
while at 5,784 cycles, a crack is seen that had initiated from a casting pore; the
shadow surrounding the casting pore is the cross section of the crack on this
tomographic slice. The crack shadow at 6,000 cycles indicates that the crack
initiated from the casting pore has propagated quickly in both the through-thickness
and width direction. The better observation of a crack front in these images is

Master Thesis - Z. Yang; McMaster University - Materials Science and Engineering
69
because the spacing of two adjacent tomography images is only one pixel size.
Technically speaking, any parts of a crack thicker than one pixel size will present
a difference in grayscale between adjacent tomography images. Cracks and
porosity are both void space in the material so they should present the same
grayscale contrast on a tomography image. But considering the size and shape of
a crack, it is understood that the slight difference in grayscales between crack and
porosity, as shown in Figure 4.24, is attributed to being a planar defect, and to the
crack closure effect.
Figure 4-24 The appearance of a tomography image during fatigue test at (a) initial state, (b) 4,000 cycles, (c) 5,784 cycles and (d) 6,000 cycles.
A similar observation of cracks and porosity is shown in Figure 4.25, on the
cross section cut through the longitudinal direction. Fatigue cracks are observed to
be initiated from the casting pores, which confirmed the observations in 3D models.
The crack initiated from the pore closer to the machined surface propagated both
towards the machined surface and towards the interior; later on, it changed path to
connect with the crack initiated from another pore, which only propagated towards
the interior.

Master Thesis - Z. Yang; McMaster University - Materials Science and Engineering
70
Figure 4-25 The appearance of one resliced tomography image and overall image; (a) initial state, (b) 4,000 cycles, (c) 5,784 cycles, (d) 6,000 cycles and (e) overall view of initial state.
4.4 The effect of surface roughness on fatigue lives
Given the fact that the specimen preparation introduces new surfaces to a
specimen, and fatigue properties are sensitive to the surface condition, the effect
of surface conditions on fatigue needs to be studied to distinguish it from the impact
of pores on fatigue. Two types of surfaces are present on a fatigue specimen —
casting surfaces and machined surfaces. In addition, different grinding and
polishing processes were applied to the machined surface. All surface conditions
were measured as surface roughness using an optical surface profiler. Figure 4.26
shows the surface roughness measurements and more detailed information are

Master Thesis - Z. Yang; McMaster University - Materials Science and Engineering
71
provided in Figure 4.27. In Figure 4.27, Sa is the arithmetic mean height,
expressing the average of the absolute values of the height in the measured area,
so it is less affected by a single peak or valley and represents the overall surface
condition. Sz, on the other hand, measures the maximum height present in the
measured area, expressed as the average of 5 sets of the highest peaks plus the
lowest valleys.
Figure 4-26 The surface roughness measurements in each surface condition.
Figure 4.27 shows that the as-cast surface has quite a smooth surface finish,
as evident by the profiler measurements. However, the EDM machining resulted in
a faceted machined surface with extremely high Sa and Sz. Manual grinding
improved the surface condition but still not as good as the casting surface condition,
presenting parallel scratches on the surface. A further polishing similar to

Master Thesis - Z. Yang; McMaster University - Materials Science and Engineering
72
metallography sample preparation produced a surface condition that is comparable
to the casting surface.
(a)
(b)
(c)

Master Thesis - Z. Yang; McMaster University - Materials Science and Engineering
73
(d)
Figure 4-27 The live display and the plotted surface in different surface conditions.
At an even higher magnification, the microstructure on the polished
machined surface is visible under the optical surface profiler, as shown in Figure
4.28. The height difference between the α-Mg phase (blue phase) and the eutectic
phase (green phase), which is dispersed with particles (red phase), was measured
to be more than 1.1um. This explains why the surface roughness after polishing
was not much improved. Preferential material removal during polishing produces a
new form of roughness on the surface.
(a)

Master Thesis - Z. Yang; McMaster University - Materials Science and Engineering
74
(b)
Figure 4-28 The microstructure on a polished machined surface: (a) live display and (b) plotted surface; the height difference between two phases in microstructure.
The fatigue lives of specimens tested in two surface conditions were
compared. Specimens with ground machined surfaces were compared with
specimens with polished machined surface in terms of fatigue life. The comparison
results showed that the improvement of the surface condition on the machined
surface has negligible effect on mean fatigue life but effectively shortens the scatter
of fatigue life by 40%. The XCT analysis and SEM observations also conclude that
the fatigue cracking from a pore on or close to the machined surface is always
preferred, whether or not the casting surface is smoother than the machined
surface.

Master Thesis - Z. Yang; McMaster University - Materials Science and Engineering
75
4.5 Fatigue failure analysis
4.5.1 X-ray tomography on fatigued specimens
X-ray tomography scans were conducted on all fatigue cracked specimens
before being pulled apart for SEM observations of the fracture surfaces. XCT is
able to not only detect porosity but also fatigue cracks when using a high resolution.
The XCT scan on a tested specimen was expected to assist the failure analysis by
SEM observations on fracture surfaces.
A 3D model was made for each specimen to illustrate the interaction
between the fatigue crack and the associated pores. The fatigue cracks and pores
are visualized in 3D, enabling the determination of crack initiation sites by
considering the crack shape. It was found that most of the specimens, expect for a
few fractured from casting surface scratches, were fatigue fractured from a pore or
a cluster of pores on the machined surface or just underneath. This crack initiation
site determination was later verified by SEM observations on fracture surfaces.
An example showing the 3D model of the fatigue cracks in a tested
specimen is given in Figure 4.29. The fatigue cracks present a semi-elliptical shape
with two pores located in the centre of the ellipse, indicating these two pores served
as the crack initiation site. These two pores were found in the initial XCT data
performed before testing, and quantitatively characterized, and 3D modelled, as
shown in the inset on Figure 4.29. These two pores are found adjacent to each
other and positioned at different height levels. The discontinuity of the fatigue crack

Master Thesis - Z. Yang; McMaster University - Materials Science and Engineering
76
around the pore far from the machined surface indicates the fatigue crack initiated
from the pore on the machined surface was partially hindered from further
propagation when it met the pore away from the machined surface, and afterwards,
a second fatigue crack was initiated from that pore and propagated at another
height level. The overlap of fatigue cracks was not found; actually, the new initiated
fatigue crack just continued with the shape of the first crack. This makes sense
since the opening of a fatigue crack releases the strain to be applied on the material
behind the crack front; therefore, the propagation of a second fatigue crack is not
preferred in a cracked region.
Figure 4-29 A 3D model of fatigue cracks and associated pores. The inset figure shows a detailed image of the casting pores serving as the crack initiation site, taken from the specimen prior to fatigue.

Master Thesis - Z. Yang; McMaster University - Materials Science and Engineering
77
4.5.2 SEM observations of fracture surfaces
SEM observations of fracture surface were performed after final XCT scans.
The quantification of fatigue cracks and pores as well as the crack initiation sites
determination made by XCT analysis was verified by SEM.
The same specimen as shown in Figure 4.29 was observed by SEM. The
overall fracture surface was shown in Figure 4.30. The fracture surface exhibits
two distinct fracture features; the fatigued fracture surface was outlined to separate
from the ductile fracture. The fatigue fracture surface was observed to be a semi-
elliptical shape, as concluded in the XCT analysis. The presence of two ratchet
marks, originating from the pore far from the machined surface, also confirmed the
observation in the 3D model. When it met the pore, the fatigue crack initiated from
the pore on the machine surface was stopped in that region and a second fatigue
crack was initiated and continued at another height level. Two casting pores
serving as the crack intuition site are shown at higher magnification in Figure 4.30
(b). A pore on the fracture surface is recognized easily because the appearance of
the intact dendrite cells inside the pore is quite different from the surroundings.

Master Thesis - Z. Yang; McMaster University - Materials Science and Engineering
78
(a)
(b)
Figure 4-30 (a)The overall fracture surface of the specimen of which the 3D model is shown in Figure 4.30, and (b) the detailed casting pores serving as crack initiation site.
The microstructural features near the crack initiation site, away from the
initiation site and close to the fatigue/ductile fracture transition region, are shown
in Figure 4.31. Near the crack initiation site, the fracture surface is characterized
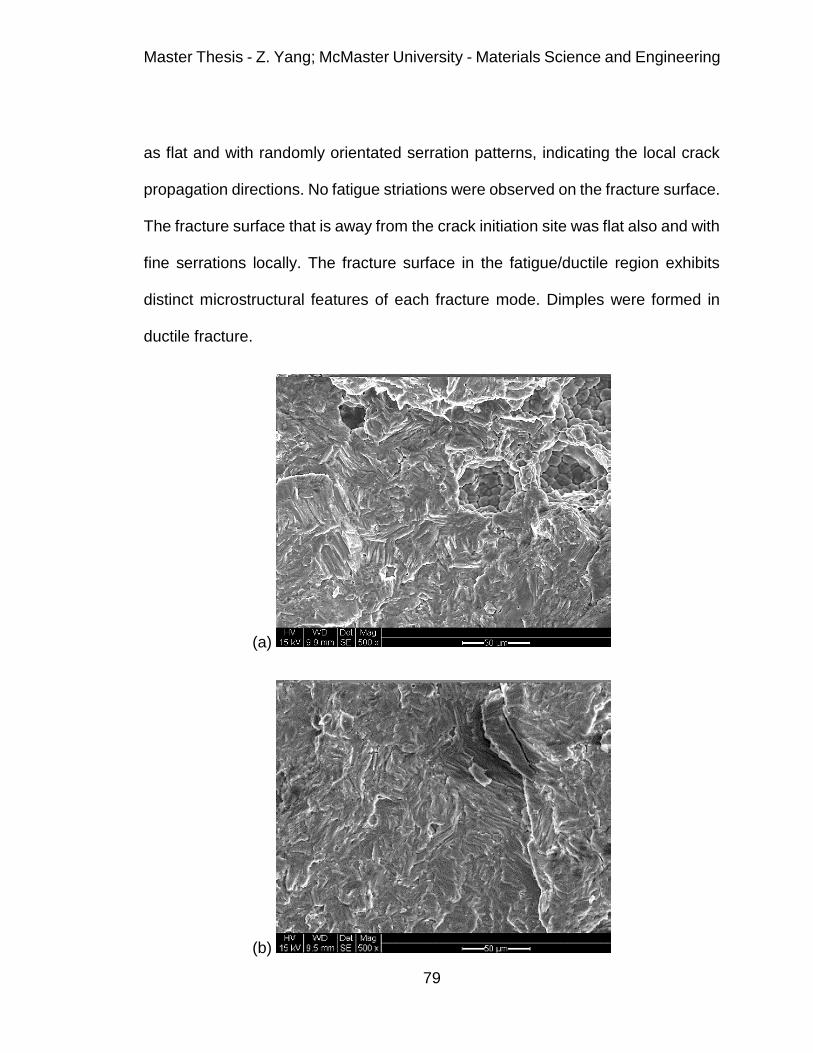
Master Thesis - Z. Yang; McMaster University - Materials Science and Engineering
79
as flat and with randomly orientated serration patterns, indicating the local crack
propagation directions. No fatigue striations were observed on the fracture surface.
The fracture surface that is away from the crack initiation site was flat also and with
fine serrations locally. The fracture surface in the fatigue/ductile region exhibits
distinct microstructural features of each fracture mode. Dimples were formed in
ductile fracture.
(a)
(b)

Master Thesis - Z. Yang; McMaster University - Materials Science and Engineering
80
(c)
Figure 4-31 The fracture surface in a region (a) near crack initiation site; (b) a distance from crack initiation site; (c) close to ductile fracture region.
4.5.3 The impact of the pore size in the crack initiation site on fatigue life
Specimens leading to the results are plotted in Figure 4.18 were both XCT
scanned and SEM observed on fracture surfaces after testing, to determine the
mechanism responsible for the fatigue crack initiation. It was found that, expect for
a number of specimens fractured from a casting surface scratch, the specimens
were all fractured from a pore on or close to the machined surface. Pores present
at the crack initiation sites of all specimens were found in the initial XCT data and
measured to correlate with their fatigue lives. Only the results of specimens
fractured from a pore were plotted in Fig 4.32.

Master Thesis - Z. Yang; McMaster University - Materials Science and Engineering
81
Figure 4-32 The ε – N curve for only specimens fractured from porosity with a fitted trend line equation.
When plotted on a log-log scale, a linear relationship was found between
strain level and fatigue life; therefore, they are related by a power-law relationship:
∆𝜀
2= 0.028 × 𝑁−0.243
Both strain level and the pore size that initiates a fatigue crack have effects
on fatigue life; therefore, the effect of strain level on fatigue life has to be separated
so that the fatigue life could be correlated with the pore size. The effect of strain
levels on fatigue lives is represented by the exponent. If the strain amplitude for
each test is normalized by N-0.243 then the effect of porosity can be revealed. In
this way, the effect of strain level on fatigue life is the same for each specimen so
the fatigue life normalized strain amplitude becomes a function of only fatigue life

Master Thesis - Z. Yang; McMaster University - Materials Science and Engineering
82
and pore size. Figure 4.33 plots the fatigue life normalized strain amplitude versus
the pore size in crack initiation sites.
Figure 4-33 A function of fatigue life and strain level versus the size of the pore serving as crack initiation site. The circled data point exhibits the effect of pore shape and pore orientation, which results in the pore size measurement differs between 2D (open circle) and 3D (solid circle) characterization.
It is observed that most specimens fail from a pore smaller than 400µm,
which is because larger pores rarely exist in the material. The general trend
suggests that at all strain levels, the fatigue life is decreased when the pore size
serving as the crack initiation site becomes larger. It also shows that the fatigue
crack initiated from a smaller-size pore is subjected to a larger scatter of fatigue
life.
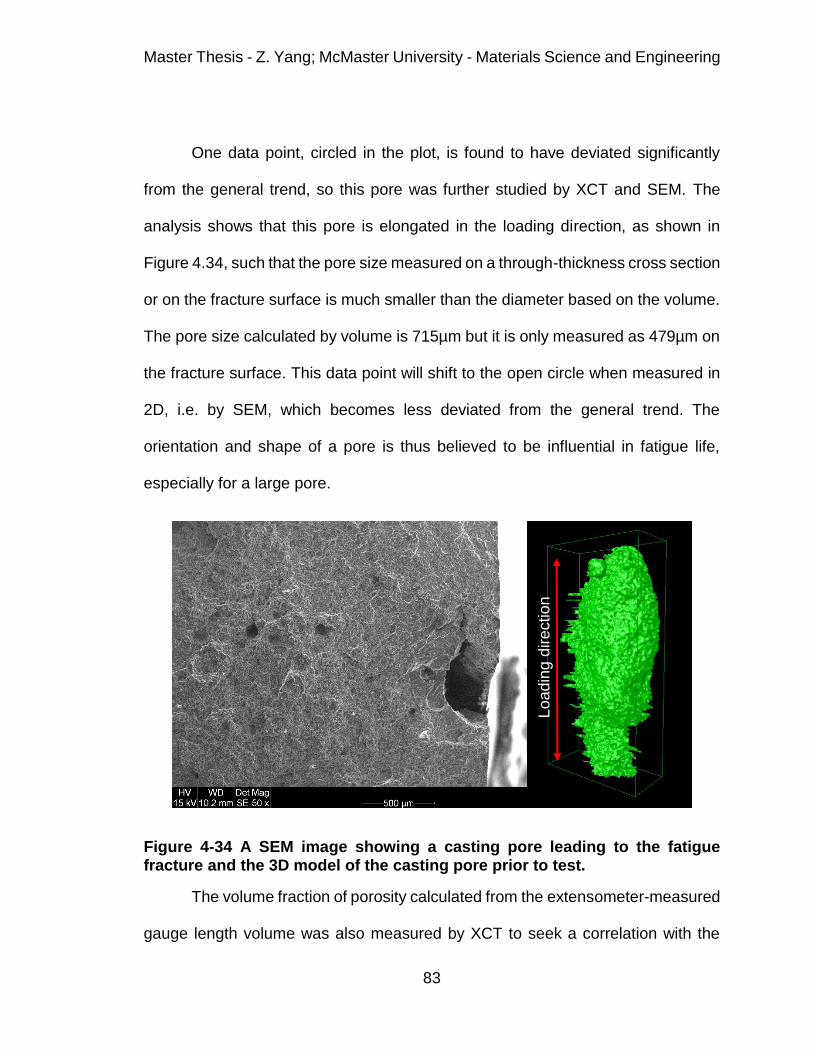
Master Thesis - Z. Yang; McMaster University - Materials Science and Engineering
83
One data point, circled in the plot, is found to have deviated significantly
from the general trend, so this pore was further studied by XCT and SEM. The
analysis shows that this pore is elongated in the loading direction, as shown in
Figure 4.34, such that the pore size measured on a through-thickness cross section
or on the fracture surface is much smaller than the diameter based on the volume.
The pore size calculated by volume is 715µm but it is only measured as 479µm on
the fracture surface. This data point will shift to the open circle when measured in
2D, i.e. by SEM, which becomes less deviated from the general trend. The
orientation and shape of a pore is thus believed to be influential in fatigue life,
especially for a large pore.
Figure 4-34 A SEM image showing a casting pore leading to the fatigue fracture and the 3D model of the casting pore prior to test.
The volume fraction of porosity calculated from the extensometer-measured
gauge length volume was also measured by XCT to seek a correlation with the
Lo
ad
ing
dire
ctio
n

Master Thesis - Z. Yang; McMaster University - Materials Science and Engineering
84
fatigue life, shown in Figure 4.35. It shows a downward trend of fatigue lives with
the increase of the volume fraction of porosity. The two circled data points are
observed to deviate from the general trend, of which the data point at about y=0.03
corresponds to the pore shown in Figure 4.34, and the other data point represents
a specimen failed from a surface pore of 787µm. Even though the pore in Figure
4.34 resulted in a large volume fraction of porosity, the elongation in loading
direction made it less effective in decreasing the fatigue life. The data point will shift
to the corresponding open circle when the pore size is defined by 2D
characterization. On the other hand, the pore at about y=0.015 shows the effect of
a single large pore on volume fraction of porosity. Since the volume fraction of
porosity in Figure 4.35 is calculated based on a large volume, the presence of a
single large pore will definitely lead to a higher local volume fraction of porosity
than the global value. Therefore, the data point will shift to the right side when only
the volume of material containing the pore leading to the failure of fatigue is used
to calculate the volume fraction of porosity. Considering the results of both pore
size and volume fraction, it suggests that increased porosity can reduce the fatigue
life by over a factor of two.
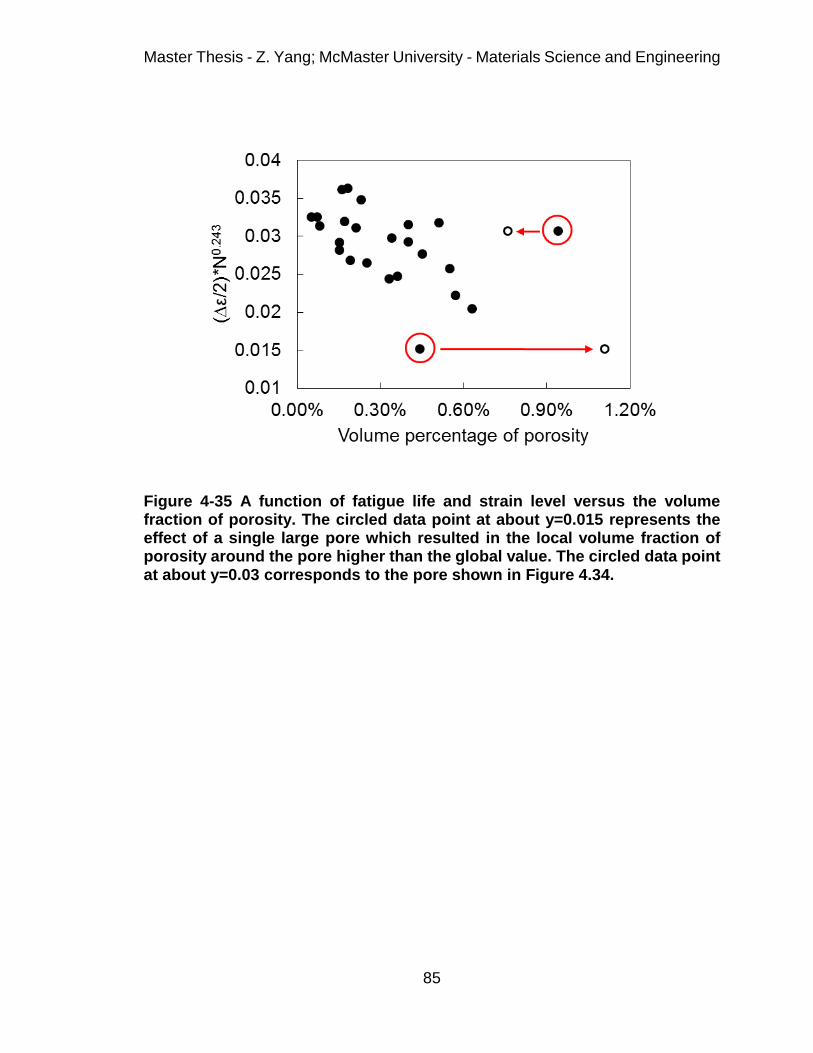
Master Thesis - Z. Yang; McMaster University - Materials Science and Engineering
85
Figure 4-35 A function of fatigue life and strain level versus the volume fraction of porosity. The circled data point at about y=0.015 represents the effect of a single large pore which resulted in the local volume fraction of porosity around the pore higher than the global value. The circled data point at about y=0.03 corresponds to the pore shown in Figure 4.34.
Master Thesis - Z. Yang; McMaster University - Materials Science and Engineering
86
5 Summary and conclusions
Samples extracted from a prototype shock tower which was made of AM60 Mg
alloy via high pressure die casting were characterized using both metallography
and X-ray tomography. The microstructural characterization results show that,
defect bands are commonly observed throughout a die-cast shock tower. These
bands contain a high density of shrinkage pores that are similar in size at each
location. Via 2D characterization of porosity, the difference in pore geometry
between gas pores and shrinkage pores enabled a form factor to separate the two
types of pores. Pores with a form factor less than 0.4 are believed to be shrinkage
pores as the presence of shrinkage arms considerably increase the perimeter of a
pore, thus resulting in a small form factor. Gas pores are observed to be circular in
shape and with a form factor larger than 0.6. 2D characterization results were also
found to underestimate the pore size and overestimate the pore population
because a shrinkage pore with a complex geometry in 3D can be viewed as a
cluster of smaller pores in 2D. 3D characterization showed shrinkage pores in a
size of 10–15µm make up the most of the void space in defect bands. The grain
size measurements made in the skin and in the core regions indicate that skin
microstructure is primarily made up of fine grains with a size of 5-6µm; while the
core microstructure is characterized by a combination of fine grains (in a similar
size to those in skin microstructure) and large externally solidified grains with an
average size of 36µm, thus forming a bimodal grain size distribution.

Master Thesis - Z. Yang; McMaster University - Materials Science and Engineering
87
Strain controlled fatigue tests were performed to obtain the ε-N curve and from
which 0.3% strain amplitude was chosen to perform interrupted fatigue tests with
the specimen being XCT scanned at intervals. Fatigue testing results showed a
large scatter of fatigue life. A large surface pore serving as crack initiation site will
result in a significantly short fatigue life. The pore sizes observed in crack initiation
sites by SEM were measured in 3D by XCT analysis. By normalizing the strain
amplitude by the fatigue life it was possible to extract the dependence of fatigue
life on porosity. A correlation was found between the fatigue-crack-initiating pore
size and the fatigue life, with fatigue life decreasing with the increase of pore size.
The same trend was also found between the volume fraction of porosity and the
fatigue life. The pore shape and pore orientation should be taken into account when
determining the pore size as they can result in the difference of pore size in 2D
measurement and 3D measurement. The SEM observations on fracture surfaces
showed no fatigue striations but the fracture surfaces are generally flat and full of
randomly orientated serration patterns.
XCT data recorded during an interrupted fatigue test were compared with each
other to visualize fatigue crack development in 3D. The measurements of porosity
and fatigue cracks made in XCT 3D analysis were confirmed by SEM observations,
indicating it is a reliable characterization tool for 3D objects. The use of XCT in
fatigue testing also finds its value in assisting the failure analysis by SEM
observations on fracture surface.

Master Thesis - Z. Yang; McMaster University - Materials Science and Engineering
88
Two sets of specimens with different surface conditions were compared in
fatigue lives. A set of specimens with a surface finish of 0.05µm resulted in fatigue
lives that are similar in the mean value but less scattered than those of specimens
ground to 600 grit. Therefore, it suggests future studies could improve the surface
condition to focus on the effect of porosity on fatigue. Improving the machined
surface condition did not change fatigue crack initiation to occur at casting surface,
indicating surface roughness is not responsible for machined surface being
preferential site for crack initiation. When machining specimens from a casting part,
it is inevitable to cut specimens out and reveal the internal microstructure. In the
case of AM60 die-cast Mg alloy, machining specimens will reveal internal pores on
the machined surface, and the high stress concentration of the pores on the
machined surface make fatigue crack initiate on the machined surface. To
eliminate the production of machined surface when preparing specimens, future
works on porosity is suggested to directly die cast specimens into net shape. In
this way, there will be only casting surface present on the specimen and the role
of porosity can be studied without considering the surface roughness issue.

Master Thesis - Z. Yang; McMaster University - Materials Science and Engineering
89
6 References
Ammar, H. R., Samuel, A. M., & Samuel, F. H. (2008). Effect of casting imperfections on the fatigue life of 319-F and A356-T6 Al-Si casting alloys. Materials Science and Engineering A, 473(1-2), 65–75. http://doi.org/10.1016/j.msea.2007.03.112
Balasundaram, A., & Gokhale, A. M. (2001). Quantitative characterization of spatial arrangement of shrinkage and gas (air) pores in cast magnesium alloys. Materials Characterization, 46(5), 419–426. http://doi.org/10.1016/S1044-5803(01)00141-3
Baruchel, J., Buffiere, J. Y., Maire, E., Merle, P., & Peix, G. (2000). X Ray Tomography in Material Science. Paris: HERMES Science Publications.
Buffiere, J. Y., Maire, E., Adrien, J., Masse, J. P., & Boller, E. (2010). In situ experiments with X ray tomography: An attractive tool for experimental mechanics. Proceedings of the Society for Experimental Mechanics, Inc., 50(3), 289–305. http://doi.org/10.1007/s11340-010-9333-7
Buffière, J. Y., Savelli, S., Jouneau, P. H., Maire, E., & Fougères, R. (2001). Experimental study of porosity and its relation to fatigue mechanisms of model Al-Si7-MgO.3 cast Al alloys. Materials Science and Engineering A, 316(1-2), 115–126.
Campbell, F. C. (2008). Elements of Metallurgy and Engineering Alloys. ASM International.
Cao, X. B., Zhao, J., Fan, J. H., Zhang, M. H., Shao, G. J., & Hua, Q. (2014). Influence of casting defects on fatigue behaviour of A356 aluminium alloy. International Journal of Cast Metals Research, 27(6), 362–368. http://doi.org/10.1179/1743133614Y.0000000120
Couper, M. J., Neeson, A. E., & Griffiths, J. R. (1990). Casting defects and the fatigue behaviour of an aluminium casting alloy. Fatigue & Fracture of Engineering Materials & Structures, 13(3), 213–227.
Gao, Y. X., Yi, J. Z., Lee, P. D., & Lindley, T. C. (2004). The effect of porosity on the fatigue life of cast aluminium-silicon alloys. Fatigue & Fracture of Engineering Materials & Structures, 27(7), 559–570.
Haitham, E. K., Horstemeyer, M. F., Jordon, J. B., & Xue, Y. (2008). Fatigue Crack Growth Mechanisms in High-Pressure Die-Cast Magnesium Alloys.

Master Thesis - Z. Yang; McMaster University - Materials Science and Engineering
90
Metallurgical and Materials Transactions A, 39(1), 190–205. http://doi.org/10.1007/s11661-007-9328-x
Horstemeyer, M. F., Yang, N., Gall, K., McDowell, D., Fan, J., & Gullett, P. (2002). High cycle fatigue mechanisms in a cast AM60B magnesium alloy. Fatigue and Fracture of Engineering Materials and Structures, 25(11), 1045–1056.
Kim, K. S., Park, J. C., Yim, C. D., & Lee, K. A. (2011). Effect of Porosity on the High Cycle Fatigue Behavior of Casing AM60B Magnesium Alloy. Procedia Engineering, 10, 165–170. http://doi.org/10.1016/j.proeng.2011.04.030
Lee, S. G. (2006). Quantitative Characterization of Processing- Microstructure-Properties Relationships in Pressure Die-Cast Mg Alloys Copyright 2006 By Soon Gi Lee Quantitative Characterization of Processing- Microstructure-Properties Relationships in Pressure Die-Cast Mg.
Li, P., Lee, P. D., Maijer, D. M., & Lindley, T. C. (2009). Quantification of the interaction within defect populations on fatigue behavior in an aluminum alloy. Acta Materialia, 57(12), 3539–3548. http://doi.org/10.1016/j.actamat.2009.04.008
Lopez, J., Faura, F., Hernandez, J., & Gomez, P. (2003). On the Critical Plunger Speed and Three-Dimensional Effects in High-Pressure Die Casting Injection Chambers. Journal of Manufacturing Science and Engineering, 125(3), 529. http://doi.org/10.1115/1.1580525
Lu, Y., Taheri, F., & Gharghouri, M. (2008). Study of fatigue crack incubation and propagation mechanisms in a HPDC AM60B magnesium alloy. Journal of Alloys and Compounds, 466(1-2), 214–227. http://doi.org/10.1016/j.jallcom.2007.11.115
Lu, Y., Taheri, F., Gharghouri, M. A., & Han, H. P. (2009). Experimental and numerical study of the effects of porosity on fatigue crack initiation of HPDC magnesium AM60B alloy. Journal of Alloys and Compounds, 470(1-2), 202–213. http://doi.org/10.1016/j.jallcom.2008.03.008
Ludwig, W., Buffière, J.-Y., Savelli, S., & Cloetens, P. (2003). Study of the interaction of a short fatigue crack with grain boundaries in a cast Al alloy using X-ray microtomography. Acta Materialia, 51(3), 585–598. http://doi.org/10.1016/S1359-6454(02)00320-8
Luo, A. A. (2013). Magnesium casting technology for structural applications. Journal of Magnesium and Alloys, 1(1), 2–22. http://doi.org/10.1016/j.jma.2013.02.002
Master Thesis - Z. Yang; McMaster University - Materials Science and Engineering
91
Marrow, T. (2004). High resolution X-ray tomography of short fatigue crack nucleation in austempered ductile cast iron. International Journal of Fatigue, 26(7), 717–725. http://doi.org/10.1016/j.ijfatigue.2003.11.001
Mayer, H., Papakyriacou, M., Zettl, B., & Stanzl-Tschegg, S. E. (2003). Influence of porosity on the fatigue limit of die cast magnesium and aluminium alloys. International Journal of Fatigue, 25(3), 245–256. http://doi.org/10.1016/S0142-1123(02)00054-3
Mohd, S., Mutoh, Y., Otsuka, Y., Miyashita, Y., Koike, T., & Suzuki, T. (2012). Scatter analysis of fatigue life and pore size data of die-cast AM60B magnesium alloy. Engineering Failure Analysis, 22, 64–72. http://doi.org/10.1016/j.engfailanal.2012.01.005
Mu, P., Nadot, Y., Nadot-Martin, C., Chabod, a., Serrano-Munoz, I., & Verdu, C. (2014). Influence of casting defects on the fatigue behavior of cast aluminum AS7G06-T6. International Journal of Fatigue, 63, 97–109. http://doi.org/10.1016/j.ijfatigue.2014.01.011
Nadot, Y., Mendez, J., & Ranganathan, N. (2004). Influence of casting defects on the fatigue limit of nodular cast iron. International Journal of Fatigue, 26(3), 311–319. http://doi.org/10.1016/S0142-1123(03)00141-5
Nadot, Y., Mendez, J., Ranganathan, N., & Beranger, A. S. (1999). Fatigue life assessment of nodular cast iron containing casting defects. Fatigue & Fracture of Engineering Materials & Structures, 22(4), 289–300.
Nicoletto, G., Anzelotti, G., & Konečna, R. (2010). X-ray computed tomography vs. metallography for pore sizing and fatigue of cast Al-alloys. Procedia Engineering, 2(1), 547–554. http://doi.org/10.1016/j.proeng.2010.03.059
Nicoletto, G., Konečna, R., & Fintova, S. (2012). Characterization of microshrinkage casting defects of Al–Si alloys by X-ray computed tomography and metallography. International Journal of Fatigue, 41, 39–46. http://doi.org/10.1016/j.ijfatigue.2012.01.006
Rettberg, L. H., Jordon, J. B., Horstemeyer, M. F., & Jones, J. W. (2012). Low-Cycle Fatigue Behavior of Die-Cast Mg Alloys AZ91 and AM60. Metallurgical and Materials Transactions A, 43(7), 2260–2274. http://doi.org/10.1007/s11661-012-1114-8
Skallerud, B., Iveland, T., & Härkegård, G. (1993). Fatigue life assessment of aluminum alloys with casting defects. Engineering Fracture Mechanics, 44(6), 857–874.

Master Thesis - Z. Yang; McMaster University - Materials Science and Engineering
92
Suresh, S. (1998). Fatigue of Materials. Cambridge University Press.


