

THE EFFECT OF POSITIVE CORE SELF AND EXTERNAL EVALUATIONS ON PERFORMANCE APPRAISALS
A THESIS SUBMITTED TO THE GRADUATE SCHOOL OF SOCIAL SCIENCES
OF MIDDLE EAST TECHNICAL UNIVERSITY
BY
LALE GÜVEN
IN PARTIAL FULFILLMENT OF THE REQUIREMENTS FOR
THE DEGREE OF MASTER OF SCIENCE IN
THE DEPARTMENT OF PSYCHOLOGY
NOVEMBER, 2007

Approval of the Graduate School of Social Sciences
Prof. Dr. Sencer Ayata
Director
I certify that this thesis satisfies all the requirements as a thesis for the degree of
Master of Science.
Prof. Dr. Nebi Sümer
Head of the Department
This is to certify that we have read this thesis and that in our opinion it is fully
adequate, in scope and quality, as a thesis for the degree of Master of Science.
Prof. Dr. Hayriye Canan Sümer
Supervisor
Examining Committee Members:
Assist. Prof. Dr. Yeşim Çapa Aydın (METU, EDS) __________________
Prof. Dr. H. Canan Sümer (METU, PSY) __________________
Dr. Türker Özkan (METU, PSY) __________________

iii
I hereby declare that all information in this document has been obtained and presented in accordance with academic rules and ethical conduct. I also declare that, as required by these rules and conduct, I have fully cited and referenced all material and results that are not original to this work. Name, Last name : Lale Güven
Signature :

iv
ABSTRACT
THE EFFECT OF POSITIVE CORE SELF AND EXTERNAL EVALUATIONS
ON PERFORMANCE APPRAISALS
Güven, Lale
M.S., Department of Psychology
Supervisor : Prof. Dr. H. Canan Sümer
November 2007, 117 pages
The purpose of this study was to investigate the effects of core self-evaluations
(CSEs) and core external-evaluations (CEEs) on performance evaluations. It was
hypothesized that people with higher levels of CSEs and CEEs would be more
lenient in their performance ratings, when rating neutral performance. The second
hypothesis of the study was that people with higher and lower CSEs would engage
more in halo when rating neutral performance compared to people with average
levels of CSEs. It was further hypothesized that CEEs would moderate the
relationship between CSEs and performance ratings given.
A total of 129 students from the Middle East Technical University participated in
this study. They were given the core self- and external-evaluations scales, as well as
two distractor scales (PANAS and Rosenberg Self-Esteem Scale). They were later
assigned randomly to either the neutral or the good performance vignette

v
conditions, and asked to rate the performance of a departmental secretary whose
performance was described in the vignette using two different performance rating
forms that included the relevant performance dimensions and behaviors of the
secretary. The first one of these forms is the Behavior Observation Scale (BOS) and
the second one is the Graphic Rating Scale (GRS).
The results showed that CSEs did not have a significant effect on the performance
evaluations given. When the mood of the participants was controlled, however,
people who had higher CSEs gave lower performance ratings to neutral
performance than people who had lower CSEs, with the GRS as the rating form.
Thus, the first hypothesis was not supported and even an opposite effect emerged.
The second hypothesis found no support, as the standard deviations of the
performance ratings given by people with high, low or average CSEs did not differ
significantly from each other for the neutral performance vignette condition, even
when the mood of the participants was controlled. However, the standard deviations
of the ratings given by participants with average CSEs were higher than that of the
participants with low and high CSEs for the good performance vignette condition.
Hypothesis three was not supported either, as CEEs were not found to moderate the
relationship between CSEs and the performance ratings.
Keywords: Core Self-Evaluations, Core External-Evaluations, Performance
Appraisals.
vi
ÖZ
POZİTİF TEMEL ÖZ VE DIŞSAL DEĞERLENDİRMELERİN PERFORMANS
DEĞERLENDİRMELERİ ÜZERİNDEKİ ETKİSİ
Güven, Lale
Yüksek Lisans, Psikoloji Bölümü
Tez Yöneticisi: Prof. Dr. H. Canan Sümer
Kasım 2007, 117 sayfa
Bu çalışmanın amacı, temel öz ve dışsal değerlendirmelerin, yapılan performans
değerlendirmeleri üzerindeki etkilerini araştırmaktı. Çalışmaya göre, yüksek
seviyede temel öz ve dışsal değerlendirmelere sahip olan kişilerin, nötr performansı
değerlendirirken, düşük seviyede temel öz ve dışsal değerlendirmelere sahip olan
kişilere göre daha yüksek ve cömertçe performans değerlendirmeleri yapacakları
hipotez edilmiştir. Çalışmanın ikinci denencesinde/hipotezinde, yüksek ve düşük
seviyede temel öz değerlendirmeye (TÖD) sahip olan kişilerin, nötr performansı
değerlendirirken, ortalama seviyede TÖD sahibi kişilere kıyasla daha çok hale
etkisine maruz kalmaları beklenmiştir. Ayrıca, temel dışsal değerlendirmelerin
(TDD), TÖDler ile performans değerlendirmeleri arasındaki ilişkide düzenleyici
(moderator) olarak rol oynayacakları hipotez edilmiştir.

vii
Bu çalışmaya Orta Doğu Teknik Üniversitesi’nden 129 öğrenci katılmıştır.
Öğrencilere temel öz ve dışsal değerlendirme ölçekleriyle beraber, iki ayrı dikkat
dağıtıcı ölçek uygulanmıştır (Olumlu-Olumsuz Duygu Ölçeği (PANAS) ve
Rosenberg Öz Saygı Ölçeği). İzleyen aşamada katılımcılar nötr veya olumlu
performans örneği hikaye koşullarına rasgele atanmış ve bulundukları koşullara
uygun olarak, performansı olumlu veya olumsuz olarak aktarılan bir bölüm
sekreterinin performansı hakkındaki değerlendirmeyi okumuşlardır.
Katılımcılardan daha sonra hikayede okudukları (performansı hakkında bilgi
edindikleri) bölüm sekreterinin performansını iki farklı ölçek üzerinde
değerlendirmeleri istenmiştir. Performans değerlendirme ölçekleri, sekreterin ilgili
performans boyut ve davranışlarına göre hazırlanmıştır. Bunlardan ilki Grafik
Değerlendirme Ölçeği (GDÖ), ikincisi Davranış Gözlemleme Ölçeği’dir (DGÖ).
Sonuçlara göre, TÖDler’in, performans değerlendirmeleri üzerinde anlamlı bir
etkisi bulunamamıştır. Ancak katılımcıların çalışma esnasındaki duygu durumları
kontrol edildiğinde, yüksek TÖD sahibi kişiler, düşük TÖD sahibi kişilere oranla,
nötr performansı, GDÖ üzerinde daha düşük değerlendirmişlerdir. Böylece, ilk
denence/hipotez desteklenmemiş ve hatta beklenenin tam tersi bir etki tespit
edilmiştir. Çalışmanın ikinci hipotezi de desteklenememiştir; nötr performans
örneğini değerlendiren düşük, yüksek ve ortalama öz değerlendirmelere sahip
kişilerin yaptıkları performans değerlendirmelerinin standart sapmaları,
katılımcıların duygu durumları kontrol edildiğinde bile, birbirinden anlamlı bir
şekilde farklılaşmamıştır. Ancak, olumlu performans örneğini değerlendiren
ortalama TÖD sahibi katılımcıların yaptığı değerlendirmelerin standart sapması,
düşük ve yüksek TÖD sahibi katılımcılarınkilerden daha yüksek olarak
bulunmuştur. Bu bulgu, ikinci hipotez için dolaylı bir destek olarak yorumlanmıştır.
Çalışmanın üçüncü hipotezi de desteklenmemiştir.
Anahtar Kelimeler: Temel Öz Değerlendirmeler, Temel Dışsal Değerlendirmeler,
Performans Değerlendirmeleri.

viii
To...
my family, for bringing me here,
Can, for showing me home,
Azra and Başak, for singing these tears,
finally I found that I belong here.

ix
ACKNOWLEDGMENTS
First of all, I would like to thank my thesis supervisor Prof. Dr. Canan Sümer. She
is not only the best supervisor that a thesis student might ever have; she is also a
great person with great qualities that one wishes to possess. Her hard and careful
work, her encouragement, and her perfectionism have led me through this whole
process. I am very happy to have written this thesis, it is because of this thesis that I
got to know Ms. Sümer better.
I would like to thank my colleagues Can Ünver and Direnç Erşahin for their support
in the data collection phase of this study. Without their help, the study could never
have reached this number of participants. I would also like to thank the students of
Business Administration and Psychology Departments in METU, who participated
in this study by sparing their valuable times.
My dear friends Azra Uslu, Başak Kaya and Can Ünver has always been there for
me, and I would like to express my gratitude to them for being such great friends.
My colleague research assistants Özlem Çıragöz and Ufuk Kara have always been
interested in my study and they showed support for me all the time. I owe my
thanks to them for their support.
Finally, I want to thank my family: My father Alaattin Güven, for always making
me feel so precious, my mother Sevgi Güven, who has the best sense of humor in
the world and can make me smile even at worst times, and my brother Yiğit Güven,
for being such a good friend and for loving me this much.

x
TABLE OF CONTENTS PLAGIARISM ............................................................................................................. iii
ABSTRACT................................................................................................................. iv
ÖZ ................................................................................................................................ vi
DEDICATION ...........................................................................................................viii
ACKNOWLEDGMENTS............................................................................................ ix
TABLE OF CONTENTS.............................................................................................. x
LIST OF TABLES ....................................................................................................xiii
LIST OF FIGURES .................................................................................................... xv
CHAPTER
I. INTRODUCTION ............................................................................................... 1
1.1 Overview of the Study ............................................................................. 1
1.2 Types of Performance Appraisal Tools.................................................... 3
1.3 Psychometric Quality of Performance Ratings ........................................ 4
1.4 Effect of Cognition on Performance Ratings ........................................... 9
1.4.1 Affective States in Cognition: Liking and Mood.......................... 13
1.5. Perception of the Ratee and Performance Ratings ................................. 17
1.6 Rater Personality and Performance Ratings........................................... 18
1.7 Core Self- and Exteral-Evaluations: A Brief Overview......................... 20
1.7.1 Measurement of Core Evaluations ................................................ 28

xi
1.8 The Aim of the Thesis and Hypothesis .................................................. 30
II. METHOD ......................................................................................................... 35
2.1 Participants............................................................................................. 35
2.2 Measures and Tools................................................................................ 35
2.2.1 Core Self- and External-Evaluations Scales ................................. 35
2.2.2 Performance Vignettes .................................................................. 37
2.2.3 Distractor Task/Scales................................................................... 43
2.2.3.1 Positive and Negative Affect Schedule............................. 43
2.2.3.2 Rosenberg Self-Esteem Scale ........................................... 44
2.2.4 Performance Rating Forms ........................................................... 44
2.3 Procedure................................................................................................ 46
III. RESULTS ....................................................................................................... 50
3.1 Overview ................................................................................................ 50
3.2 Reliability Analysis and Factor Analysis ............................................... 51
3.2.1 Reliability Analysis and Factor Analysis of Performance
Rating Forms............................................................................... 51
3.2.2 Reliability Analysis and Factor Analysis of Core Self- and
External-Evaluations Scales........................................................ 57
3.2.2.1 The Turkish Version of the Core Self-Evaluations
Scale: Reliability and Factor Analysis............................ 57
3.2.2.2 Reliability of the Turkish Version of the Core External-
Evaluations Scale............................................................. 58
3.3 Descriptive Statistics .............................................................................. 59
3.3.1 Descriptive Statistics for the Individual Differences Measures
Used............................................................................................. 59
xii
Descriptive Statistics for the Performance Rating Forms ...................... 61
3.4 Hypothesis Testing.................................................................................... 64
IV. DISCUSSION....................................................................................................... 75
4.1 Overview of the Findings........................................................................... 75
4.2 Plausible Explanations for the Failure to Support the Hypotheses of the
Study .......................................................................................................... 76
4.3 Strengths of the Study ................................................................................ 83
4.4 Limitations of the Study and Directions for Future Research.................... 85
REFERENCES............................................................................................................ 88
APPENDICES
A. TURKISH VERSION OF THE CORE SELF-EVALUATIONS SCALE .... 105
B. TURKISH VERSION OF THE CORE EXTERNAL-EVALUATIONS
SCALE ........................................................................................................... 106
C. NEUTRAL PERFORMANCE VIGNETTE .................................................. 107
D. POSITIVE PERFORMANCE VIGNETTE................................................... 110
E. PERFORMANCE RATING FORM FOR THE MANIPULATION CHECK113
F. THE GRS-FORMATTED PERFORMANCE APPRAISAL FORM USED
IN THE STUDY ............................................................................................ 115
G. THE BOS-FORMATTED PERFORMANCE APPRAISAL FORM USED
IN THE STUDY ............................................................................................ 116
xiii
LIST OF TABLES
TABLES
Table 1. The Performance Levels of Each Dimension in the Vignettes Used in the
Manipulation Check ...................................................................................... 40
Table 2. Descriptive Statistics of the Performance Ratings Given in the
Manipulation Check ...................................................................................... 41
Table 3. Steps of the Procedure for Neutral and Good Performance Vignette
Conditions ..................................................................................................... 47
Table 4. Loadings of the Items in the GRS on the Factor “Performance of the
Secretary”...................................................................................................... 52
Table 5.Factor Loadings of the Items in BOS and Percentages of Participants that
Chose “6 = Do not have an idea” for Each Item ........................................... 53
Table 6. Goodness of Fit Statistics of One-Factor and Two-Factor Solutions for the
Behavior Observation Scale......................................................................... 56
Table 7. Factor Loadings of the Items in the CSES.................................................... 58
Table 8. Descriptive Statistics of the Measures Used in the Main Study ................... 60
Table 9. Descriptive Statistics for the Performance Rating Forms Filled Out for the
Good and Neutral Performance Vignettes .................................................... 62
Table 10. Correlations Among Demographic Variables and Study Variables for
Neutral Performance Vignette....................................................................... 62

xiv
Table 11. Correlations Among Demographic Variables and Study Variables for
Good Performance Vignette......................................................................... 63
Table 12. Mean Comparison of Performance Ratings Given by Participants with
High versus Low Core Self-Evaluations...................................................... 65
Table 13. Results of Hierarchical Regression Analysis Conducted on the GRS as the
Dependent Variable, for the Neutral Performance Vignette Condition....... 66
Table 14. Mean Comparison of Performance Ratings Given by Participants with
High versus Low Core External-Evaluations............................................... 68
Table 15. Results of Moderated Regression Analysis Conducted on the Task
Performance Components of BOS as the Dependent Variable.................... 71
Table 16. Results of Moderated Regression Analysis Conducted on the Contextual
Performance Components of BOS as the Dependent Variable.................... 72
Table 17. Results of Moderated Regression Analysis Conducted on the GRS as the
Dependent Variable...................................................................................... 73

xv
LIST OF FIGURES
FIGURE
Figure 1. A schema of the Performance Appraisal Process .......................................... 9

1
CHAPTER I
INTRODUCTION
1.1. Overview of the Study
Performance appraisals are about how our efforts to manage tasks and to get ahead
at work are evaluated. Normally, a positive performance appraisal reflects the
degree to which a person’s efforts advance important organizational goals (Hogan
& Shelton, 1998). Performance appraisals provide information regarding personnel
issues such as salary increases, promotions, transfers, training programs and
employee feedback (Cleveland, Murphy, & Williams, 1989). Organizations base
some of their most important decisions on information they gather from the
performance appraisals that take place within the organization. Research has shown
that performance appraisals could contribute to employee development (McGregor,
1957; Wexley, 1979) and the improvement of future job performance (Bernardin &
Beatty, 1984; Murphy & Cleveland, 1995; Jawahar, 2006). That is why
performance appraisals should be accurate and reliable.
There have been many discussions about whether performance appraisals conducted
are really effective, and whether they are accurate and useful. The performance
evaluation literature has stressed that human judgment of performance tend to be
faulty and thus human ratings are a source of error for performance evaluations
(Woehr, 1992). Previous studies have shown that performance appraisals are
influenced by various rater factors like rater's demographic characteristics (e.g.,
gender, race, age) (Decotiis & Petit, 1978), cognitive variables (e.g., schemata,
behavior salience, categorization) (DeNisi, Cafferty, & Meglino, 1984; Ilgen &
2
Feldman, 1983; Landy & Farr, 1980) and interpersonal affect (e.g., liking,
similarity) (Dipboye, 1985; Park, Sims & Motowidlo, 1986). Although the concepts
of rater dispositions and interpersonal affect have been examined in research
regarding performance appraisals, the dispositional affectivity of raters did not
attract that much attention. This study is thus aimed to analyze the effects of
dispositional affect, namely, the core self-evaluations on performance ratings;
which can be defined as a fundamental appraisal of one’s worthiness, effectiveness
and capability as a person (Judge, Erez, Bono, & Thoresen, 2003); and
subconscious conclusions people hold about themselves, other people and the world
outside.
In the following sections, firstly, a brief review of performance appraisal research
from a historical perspective is presented. More specifically, the most common
types of tools used for performance appraisals and non-psychometric and
psychometric quality of performance ratings are briefly introduced, focusing on the
common types of rater errors and biases. Secondly, the effects of cognition on
performance ratings are examined with an emphasis on the cognitive processes and
affective components of rater decision-making, as well as the personality
characteristics of raters that cause biases in performance ratings. Later, the core
self-evaluations concept is introduced, which can be considered as a dispositional
component of affect. The literature about core self- and external-evaluations is
examined, especially with respect to industrial and organizational psychology
concepts. Then, the basis for this study is presented based on the findings from both
performance appraisal and core-evaluations literatures.
This chapter’s aim is to equip the reader with a historical overview of both
literatures; the literature about performance appraisals and the literature about the
positive self-concept. Moreover, the literature presented is relevant to the scales
used in the study and the hypotheses of the study. The section about the types of
performance rating tools shall give information about the performance rating scales
used in the study, and why they were chosen. The section about the psychometric

3
qualities of the ratings shall present the definitions of halo and leniency, and
previous research on these concepts, which will prepare a basis for our hypotheses.
1.2. Types of Performance Appraisal Tools
Before focusing on the research about performance appraisals, different types of
tools used for performance measurement purposes need to be defined and examined
regarding their psychometric and non-psychometric qualities. The three most
common types of performance appraisal tools are Graphic Rating Scales (GRS),
Behavior Observation Scales (BOS), and Behaviorally Anchored Rating Scales
(BARS) (Tziner & Kopelman, 1988; Tziner, Joanis, & Murphy, 2000).
The GRS format asks the rater to indicate his or her judgment about an aspect of a
ratee’s performance on a scale that can be used to obtain numeric values that
correspond to the rater’s evaluation of the ratee’s performance (Murphy &
Cleveland, 1995). GRS-based rating formats include relatively vague and broad
dimensions of performance in specific areas. The GRS is simple, but the anchors
and dimensions in the GRS are ambiguous (Saal & Knight, 1995). The researchers
tried to improve this scale by defining performance dimensions and performance
levels in behavioral terms (e.g., Ok, 2001).
The BARS format was created in an attempt to overcome the disadvantages of GRS
by Smith and Kendall (1963), as it used behavioral examples of different levels of
performance to define both the dimension being rated and the performance levels in
behavioral terms. However, the development of BARS is time consuming and
expensive. Also, engaging in a behavior that indicates a level of performance does
not guarantee that the ratee shows all the behaviors that come before that behavior
in the BARS response scale (Murphy & Cleveland, 1995). The BARS was found to
be less susceptible to both halo and leniency effects than the GRS (Tziner, 1984).
Finally, BOS asks the raters to indicate the frequency of job-related behaviors over
the period covered by the appraisal. Among these three types, BOS is said to be the

4
least ambiguous one in the sense that it clarifies for both the rater and ratee what
behaviors should specifically be performed on the job, in what ways, and also how
the outcomes are linked to ratings of performance (Latham & Wexley, 1977). BOS
thus appears to minimize barriers in the communication between managers and
subordinates (Tziner & Kopelman, 2002). In their review of rating format research
Tziner and Kopelman concluded that BARS is the least preferred format compared
to both GRS and BOS; and that BOS had clear psychometric advantages over GRS,
as BOS had superior reliability and validity. Furthermore, BOS-based appraisals
were found to increase work satisfaction (Tziner & Latham, as cited in Tziner &
Kopelman, 2002), they yielded higher levels of goal clarity, goal acceptance, and
goal commitment (Tziner & Kopelman, as cited in Tziner & Kopelman, 2002).
As the literature also imply, each type of performance rating tool has its advantages
and disadvantages. The following section presents some important psychometric
qualities of rating measures like halo and leniency, as also mentioned above, in
order to determine the quality of a rating tool.
1.3. Psychometric Quality of Performance Ratings
Performance appraisal is the formal process of observing an employee’s
performance and evaluating it (Erdogan, 2002). Research has shown that
performance appraisals can contribute to the development of an employee
(McGregor, 1957), and improvement in job performance (Bernardin & Beatty,
1984). Also, performance appraisals are expected to promote short-term behavior
change by identifying the ratee’s strengths and weaknesses, by accurate
performance feedback and assisting communication with supervisors (Dorfman,
Stephan, & Loveland, 1986).
For a performance appraisal system to be effective within an organization, it should
accurately reflect the performance of the employees, thus the performance
instrument used should be valid, reliable, accurate and free from rating biases like
halo and leniency (Thornton, 1980; Landy & Farr, 1980). In order to understand

5
whether a performance evaluation is useable in the organizational context;
researchers like Bellows (1941), Thorndike (1920), and Blum and Naylor (1968)
identified criteria that the appraisal systems and measurement scales should meet in
order for them to be valid, reliable, and accurate.
The psychometric characteristics of the instruments, that is, their reliability, validity
and utility were thought to be the most effective components of a sound
performance appraisal system (Bernardin & Beatty, 1984). However, it is critical to
note that a performance appraisal (PA) scale includes dimensions that are not
chosen to represent a single construct of performance. Thus, internal consistency
cannot be used as an effective way to decide whether the PA form is reliable. A
test-retest model to measure reliability is also criticized, as it cannot discriminate
measurement error from a true change in job performance over time. Although
interrater agreement can be used as a criterion for reliability, disagreement between
raters does not always imply an error. Different raters observe different aspects of a
ratee’s performance.
The validity of a PA scale is difficult to establish. It was found that in general, the
correlations between subjective measures of job performance (i.e., performance
ratings) and objective measures (i.e., performance data) were small, which may
suggest a low level of convergent validity (Murphy & Cleveland, 1995). However,
there may be a number of different reasons for the observed low correlations
between subjective and objective measures. For example, as their names imply,
objective and judgmental measures may be tapping into different aspects of
performance, hence a low correlation between them should be no surprise.
Furthermore, empirical research on the construct validity of the performance ratings
is very rare (Murphy & Kroeker, as cited in Murphy & Cleveland, 1995). Some
limited research have revealed that raters at different levels in the organization
showed consistency in their ratings, although ratings from different sources differ in
level (i.e., self-ratings are higher than supervisory ratings) (Thornton, 1980).

6
Accuracy of the ratings was also considered to be very important in establishing a
psychometric quality because if different stakeholders (i.e., managers, subordinates,
peers) using performance appraisals believe that the performance appraisal system
being used is inaccurate and ineffective, they will be unwilling to use the system
(Miller & Thornton, 2006). In the O’Donnell study (1990), accuracy was defined in
two different ways. First, within controlled research contexts, accuracy is defined as
the correlation of the ratings given by the rater with the true scores developed by the
subject matter experts. Second, in applied settings, accuracy includes the raters’
feelings and behaviors towards the accuracy of ratings and whether they are willing
to give accurate ratings. Ideally, in order to measure accuracy, a gold standard with
which to compare the performance ratings should be developed, and the validity of
the accuracy measures depend on the quality of that standard (Becker & Miller,
2002). The true score can be computed according to a procedure that was developed
by Borman (1977) that utilizes multiple raters to evaluate performance under
optimal conditions and then averages the ratings assigned to that performance to
establish a measure of true score (for a discussion on different measures of accuracy
see Murphy & Cleveland, 1995).
Another research area regarding the quality and accuracy of performance ratings is
rater errors/tendencies such as halo (Thorndike, as cited in Saal, Downey, & Lahey,
1980), leniency (Kneeland, as cited in Saal et al., 1980), central tendency (Saal et
al., 1980; Smith, DiTomaso, Farris, & Cordero, 2001) and logical errors (Newcomb,
as cited in Saal et al., 1980). Leniency and severity are terms that are used to
describe a rater’s tendency to give higher (leniency) or lower (severity) ratings to an
individual’s performance than is warranted by that ratee’s behavior (Holzback,
1978; Villanova, Bernardin, Dahmus, & Sims, 1993). Guilford (1954) defined
leniency as a stable tendency of a particular rater to rate others higher than the other
raters do. Leniency is conceptually defined as the rater using ratings that are well
above the midpoint in the evaluation scales used (Kneeland, as cited in Saal et al.,
1980). The operational definitions of leniency are: a) mean dimension ratings that
exceed the midpoint (Bernardin, Alvares, & Cranny, 1976); b) statistically
significant rater main effect in Rater X Ratee X Dimension analysis of variance

7
(ANOVA) (Friedman & Cornelius, 1976); c) significant negative skewness (Landy,
Farr, Saal, & Freytag, 1976). Lenient ratings can harm the fairness perceptions
about the pay system, as it will cause the link between true performance differences
and reward differences to be complicated (Kane, Bernardin, Villanova & Petrefitte,
1995). Kane et al. (1995) also found in their study that the prediction, control, and
understanding of leniency as a disposition of the rater can be useful for future
research and that the elevated ratings may be a function of rater dispositions, an
argument very much in line with the present study. Borman and Hallam (1991) state
that individual differences in the leniency of raters are important components in
inter-rater disagreement, as rating leniency is a relatively stable rater characteristic
over situations.
Another commonly studied index of quality of ratings is halo, which is defined as
the tendency to focus on the global impression of each ratee rather than to carefully
differentiate among levels of different performance dimensions (Borman, 1975;
Goffin, Jelley, & Wagner, 2003; Saal, Downey, & Lahey, 1980). Lance, LaPointe,
and Stewart (1994) found that the general impression of the ratee was the most
important cause of halo error. A halo in ratings conceptually implies that the rater
depends on a general view of the ratee. Halo is identified by four operational
indicators: a) higher correlations among different dimension ratings using ratee
scores for each dimension as a data point (Keaveny & McGann, 1975); b) fewer
factors or principal components in the ratings (Kraut, 1975); c) smaller standard
deviation among ratings for different dimensions (Bernardin & Walter, 1977); d)
emergence of a statistically significant rater x ratee interaction in ANOVA
(Dickinson & Tice, as cited in Saal et al., 1980). Halo can be decomposed into two
parts, true and illusory halo. The ratings on separate dimensions of performance
may really be correlated, although the performance dimensions are intended to be
conceptually distinct from each other. This represents the true halo in ratings. True
halo combines with illusory halo, which is the part of the correlation that results
from the cognitive distortion of the rater, to form the observed correlation among
ratings (Murphy & Cleveland, 1995).
8
Central tendency is the third most frequently discussed form of rating error, besides
halo and leniency (Saal et al., 1980). It is the rater’s unwillingness to give ratings in
either favorable or unfavorable direction. Range restriction is another relevant
concept, which is defined as the unnecessary limitation of ratings to only a part of
the scale (Smith, DiTomaso, Farris, & Cordero, 2001). Central tendency implies
range restriction, but the converse is not necessarily true, as range restriction may
imply leniency, severity or central tendency (Saal et al., 1980).
There are still other rater errors that did not take enough research attention but that
should be mentioned here. A logical error in ratings occurs when strong correlations
between intra-individual behaviors are sourced from the assumptions of raters
(Newcomb, as cited in Saal et al., 1980). Contrast error (Murray, as cited in Saal et
al., 1980) is the tendency of the raters to compare the ratees with themselves.
Another error reported by Stockford and Bissell (as cited in Saal et al., 1980), which
is proximity error, states that the correlation between different traits measured by
the PA varied as a function of the physical distance between those traits on the
rating form.
The level of rater errors and tendencies in a certain performance rating may differ
according to the source of rating. Research for different sources of rating (e.g., self,
peer, supervisor, etc.) revealed that self ratings were more lenient than ratings made
by comparison groups (Holzbach, 1978; Thornton, 1980), and contain less halo
error compared to supervisory and peer ratings (Heneman, 1974; Beehr,
Ivanitskaya, Hansen, Erofeev, & Gudanowski, 2001). Mount (1984) also
investigated the psychometric qualities of subordinate ratings, and found that level
of self ratings were more lenient on most dimensions of performance than other
sources of rating. Finally, convergent validity was found to be highest between
superiors and subordinates (.24) and it was relatively low between self and
subordinate ratings (.19) and superior and self-ratings (.16). This may also be an
indicator of leniency in self-ratings, as the agreement among the other sources of
rating are much higher than agreement between self-ratings and any other source of
rating.

9
In the 1980s, it was discovered that clearly defining the biases and trying to prevent
them were not the wisest thing to do regarding the accuracy of ratings (Landy &
Farr, 1980). It was suggested that there were much more to performance appraisals
than their psychometric qualities, and the errors or deviancies in performance
appraisals were not just results of some measurement or scaling problems but there
were also some underlying cognitive, psychological, social, motivational and
organizational causes that affected how people gave ratings (Feldman, 1981).
Figure 1 shows the effective factors and outcomes in a typical performance
appraisal process. Research regarding these issues was mostly concerned with
cognition, mood, positive/negative affectivity, similarity, liking, emotions, rater
personality and individual differences.
Figure 1. A schema of the performance appraisal process. From: Limits in
generalization from psychological research to performance appraisal process
(p.312) by D. R. Ilgen & J. L. Favero, 1985. Academy of Management Review.
1.4. Effect of Cognition on Performance Ratings
Cognition holds an important place in performance appraisal research. More
contemporary approaches to appraisal are concerned with social and cognitive
10
aspects of appraisal (e.g., Landy & Farr, 1980; Murphy & Cleveland, 1995; Spicer
& Ahmad, 2006; Fletcher, 2001). Cognitive processing can be defined as any
activity that involves the mental manipulation of information storage.
The cognitive processing approach to performance appraisals can be said to occur in
six stages (Ilgen & Feldman, 1983). First of all, the performance of the employee is
observed to obtain accurate information on the performance of the employee.
Second, the information gathered by observing is categorized into dimensions that
simplify the complex behaviors. Thirdly, the performance information is stored in
either short- or long-term memory and then the information is retrieved in times of
need. Later, the present and past performance information is integrated to have an
overall idea about the performance of the employee. Lastly, the information on
performance is evaluated in order to reflect it on the appraisal decision. Spicer and
Ahmad (2006) have found that both experienced and less experienced appraisers
show similar patterns in these six cognitive processing steps. As suggested by many
studies, since memory for past events is biased, judgments based on information
retrieved from the memory will also include some portion of bias (Woehr, 1992).
Woehr also suggests that people make “on-line” evaluations of others, that is, the
judgments about a behavior is formed as soon as the behavior is observed. Thus, it
is not the memories but the evaluations that are stored and updated. Whenever a
rater makes a biased evaluation of a ratee, as the rater stores those evaluations in
memory, the later ratings shall also be prone to those biases because the real
behavior of the ratee cannot be remembered objectively.
McArthur (1980) and Taylor and Fiske (1978) suggested that salience of most
behaviors varies across situations; and Langer, Taylor, Fiske, and Chantowitz
(1976) suggested that distinctive novel features of the ratee or his or her behaviors
will be highly salient, which implies that the context in which the performance
behavior is observed has important implications for the active information
acquisition and the cognitive processes of the rater. As for the encoding stage, it
was stated that raters have prototypes of good and poor workers, which shows that
schema and categorization theories also tend to apply to performance appraisals

11
(Cardy, Bernardin, Abbott, Senderak, & Taylor, 1987). Lance et al. (1994) found
that general impression of the ratee best accounts for the halo rating error, which
shows that raters tend to form a “schematic” view of the ratee and than gives ratings
according to the ratee’s “general impression” on the rater.
DeNisi, Cafferty, Williams, Blencoe, and Meglino (1983) suggested that “raters
approach performance appraisals as exercises in decision making, and so seek
information that produces the greatest reduction in uncertainty” (p. 169). These
authors have searched for the link between Kelley’s (1973) attribution theory and
performance appraisals, and found that raters with unlimited choices tended to seek
distinctiveness type of information, followed by consensus information. Also, when
the number of observation opportunities was limited, raters did not primarily seek
consensus type information (DeNisi et al., 1983a). In another study, DeNisi et al.
(1983b) found that the purpose for which an appraisal is conducted may have a
cognitive function in addition to the motivational function, which makes them
utilize different processing strategies according to the purpose.
Cognitive approaches were criticized because they were seen as a “… disinterested
desire to give an accurate rating of performance against some clear-cut criteria; the
appraiser is neutral and would rate accurately if possessed with the skills to do so-
although accuracy is recognized as an unattainable goal” (Fletcher & Perry, 2002, p.
128). This means that cognitive approaches ignored the fact that performance
ratings may be deliberately distorted, and the people who adopted that approach
acted as if the main purpose of the raters were to be accurate. However, in the real
world, the situations are more complex and the motivations and aims of the raters
may vary. It was pointed out that the raters do not necessarily make “wrong”
decisions, but there may be some underlying purposes of the distortions in their
ratings. O’Donnell (1990) study, showing that “purpose of appraisal” trainings did
not have any significant effects on the accuracy of ratings, is a strong indicator of
this. Research about the deliberate distortion of ratings has shown that people use
performance appraisals to give messages to their subordinates, or sometimes

12
supervisors are reluctant to give negative ratings for the sake of “saving face” (e.g.,
Longenecker, Sims, & Gioia, 1987).
Cleveland and Murphy (1992) suggested that what were traditionally seen as rating
errors were generally not errors, but consciously-adopted, adaptive responses to the
situation of the organization as a whole. It was found that deliberate rating
distortion was more prevalent than unintentional error (Bernardin & Villanova,
1986; Hauenstein, 1992). Especially when the results of performance appraisals are
linked to desired outcomes, raters tend to distort their ratings the most (DeCotiis &
Petit, 1978). Research suggests that the rater's beliefs about the aim of the
performance evaluation information (e.g., counseling or administrative purposes)
may affect how the information about the ratee is collected, combined, and recalled
(Taylor & Wherry, 1951). Jawahar and Williams (1997) also found that
performance appraisal ratings obtained for administrative purposes were one-third
standard deviation larger than the ratings obtained for research or employee
development. Thus, appraisal leniency may be a result of appraisal purposes.
However, the purpose effect varied according to several factors. For example, when
managers (not students) in real organizations (not lab settings) rated real, not paper
people; the purpose effect was much more visible (Jawahar & Williams, 1997).
Research regarding the rating biases show that managers’ attitudes towards
appraisal processes were also predictive of how elevated the ratings of the managers
will be (Villanova, Bernardin, Dahmus, & Sims, 1993). That is, if an accurate and
effective performance appraisal system is desired, it should be made sure that the
managers are comfortable with the system.
In their study about the social context of performance appraisals, Judge and Ferris
(1993) reported that if a supervisor had the opportunity to observe the performance
of an employee, his/her ratings improved significantly. Also, if the supervisor
inferred that the employee had a positive self-rating, the supervisor’s rating of the
employee was positive, too, implying an effort to reduce conflict regarding the
performance level.

13
After it was understood that simply the cognition of the rater about the rating
system could not account for the success of a performance appraisal system,
researchers started to investigate the effects of some underlying concepts like liking
(Brief & Weiss, 2002; Varma, DeNisi, & Peters, 1996) and mood (Nisbett &
Wilson, 1977; Williams & Keating, 1987). Liking and mood are two important
affective states that influence the cognitive processes, thus their effects on
performance appraisals are very important. The following section reviews the
literature about mood, state affect and interpersonal affect regarding the
performance ratings.
1.4.1. Affective States in Cognition: Liking and Mood
Liking is defined as a rater's interpersonal affect toward a ratee (Murphy &
Cleveland, 1995). Liking is an emotional positive, neutral or negative reaction
towards a specific person (Zajonc, 1980). Research about cognition has recognized
the importance of interpersonal affect in cognition (Brief & Weiss, 2002; Strauss,
Barrick, & Connerley, 2001; Varma, DeNisi, & Peters, 1996). Even though
interpersonal affect is not directly related with the evaluation of an individual's
performance on certain tasks, if the rater likes or dislikes a ratee, the performance
ratings given by the rater can be influenced (i.e., intentionally distorted) rather than
the evaluations of performance behaviors (where the evaluations would be biased
without intention), and thus, affect indirectly determines the rater's appraisal of
performance (Cardy & Dobbins, 1986; Decotiis & Petit, 1978; Dipboye, 1985;
Parks, Sims, & Motowidlo, 1986; Antonioni & Park, 2001; Robbins & DeNisi,
1998). Liking may manipulate what raters observe (Isen, Shalker, Clark & Karp,
1978), it may influence the attributions that raters make about the behaviors of
ratees (Feldman, 1981), and it may influence the information that the raters retrieve
from their memories at the time of appraisal (DeNisi et al., 1994).
Interpersonal affect may be the basis for a rater’s attempt to preserve friendship in
situations where appraisals will be used for promotions and rewards (Kingstrom &
Mainstone, 1985; Judge & Ferris, 1993; VanScotter, Moustafa, Burnett, & Michael,

14
2007). Robbins and DeNisi (1994) showed interpersonal affect-consistency effects
during the initial observation of performance. They state that the impact of affect on
ratings in laboratory settings may not be the same in field settings, because
interpersonal affect develops differently in the latter one. More specifically, in
laboratory settings, researchers manipulate interpersonal affect so that it is
independent of the actual performance of the ratee. On the other hand, in field
settings, affect develops over time and may be a response to the actual level of
performance of the ratee, meaning that liking may develop as a result of the good
performance of an employee. In their field study Varma et al. (1996), analyzed the
relationship between affect and the ratings given by raters who keep performance
diaries. The study aimed to integrate the affective responses with the cognitive
processes they are influencing. They found that affect was significantly related to
the ratings and interpersonal affect does not operate primarily by influencing
encoding or recall of performance information. This may be because raters tend to
record performance information that is only consistent with their affect toward
ratees.
Williams and Alliger (1989) suggested that different levels of affect exist in
appraisal situations and each level shows its influence in different situations.
Supporting this suggestion, and even adding on it, Robbins and DeNisi (1998)
found that a mood-congruent affect was not influential in the context of rater
interpersonal affect. That is, when a rater has known the ratee for some time prior to
the appraisal, the effects of interpersonal affect cause the influences of more short
term responses, such as those caused by the mood of the ratee, to diminish. This
finding implies that congruence with interpersonal affect was more effective than
mood on evaluations of performance.
Similarity is an important variable that leads to biased ratings. Demographic
similarity is found to have a significant impact on the performance ratings given.
For example, Tsui and O’Reilly (1989) have found that gender similarity was one of
the best predictors of subordinate performance ratings. The demographic similarity
between the rater and the ratee leads to communication, interpersonal attraction,

15
integration, cohesion (Wagner, Pfeffer, & O’Reilly, 1984), and liking (Judge &
Ferris, 1993; Tsui & O’Reilly, 1989). Another factor, which is affective similarity,
is said to affect a relationship between a supervisor and subordinate. The
similarities between dispositions and moods influence the development of a
relationship between the subordinate and supervisor, and specifically, affective
similarity yields to positive judgments of subordinate performance (Bauer & Green,
1986).
An interesting study conducted by Strauss, Barrick, and Connerley (2001) showed
that perceived personality similarity effects were greater than actual personality
similarity effects on performance ratings, which showed that there was a
complicated interaction between interpersonal similarity (perceived and actual) and
performance ratings. It was reported that raters with positive affect towards ratees
tended to be the most lenient ones, and vice versa. Varma, DeNisi, and Peters
(1996) showed that biases sourced from interpersonal affect played a larger role
when there were less observable, more ambiguous conditions for making
evaluations. However, Varma et al. also found evidence supporting the probability
that interpersonal affect is a function of how well or poorly a person performs his or
her job, and is therefore more likely to represent a valid piece of information rather
than an irrelevant source of bias. Ferris, Judge, Rowland, and Fitzgibbons (1994)
also supported this argument, with the finding that supervisors’ affect towards
subordinates correlated .74 with performance ratings.
The affect literature regarding performance appraisals is concerned with the effects
of mood (undifferentiated affect) (Nisbett & Wilson, 1977; Trost, Kinicki, &
Prussia, 1989; Williams & Alliger, 1989) as well as liking (differentiated affect).
Affective state (i.e., mood) of a person influences cognitive processes, like
selectively attending to information, learning, remembering and using that
information (Sinclair, 1988). Sinclair (1988) also showed that people in depressed
moods formed the most accurate appraisals that were least subject to halo effects.
Negative moods foster systematic and careful information processing (Sinclair,
1988; Sinclair & Mark, 1992, Moylan, 2000). Due to the mood congruency effect,

16
raters displaying negative affect will accord greater weight to unfavorable
information, thereby resulting in lower overall performance ratings, particularly
with respect to negative behaviors (Sears, Prakash, & Chiocchio, 2001).
Affect also increases the salience of some categories (Tajfel, 1982). This means that
some categories in the minds of raters may be conceptually associated with
affective states. This association may result from classical conditioning. If a
category is repeatedly associated with desired outcomes, that category may develop
a strong affective implication (Murphy & Cleveland, 1995). Williams and Keating
(1987) have found that positive affect resulted in higher levels of halo in ratings,
thus implying that psychometric biases can partially be the results of some
underlying affective processes. Other studies also supported these findings, like the
Tsui and Barry (1986) study which reported that affect was positively related to
leniency, such that raters with positive affect tended to show leniency and raters
with negative affect tended to show severity. Another important finding from the
same study is that, raters with positive or negative affect towards the ratee engaged
more in halo than raters who were neutral. Thus, the affect of the rater at the time of
performance ratings is an important source of halo and leniency, where positive
affect causes more lenient ratings as a result of affect congruency, and positive or
negative affect leads to halo in ratings
State affect has also been found to influence performance ratings in a way that
causes the raters to deliberately distort the performance ratings they give. Research
about deliberately inflated ratings revealed that raters with higher NA (negative
affectivity) who had lower documentation of their subordinates’ work behaviors and
were in a context where appraisal visibility is high tend to inflate ratings more
(Fried, Levi, Ben-David, & Tiegs, 1999). High NA supervisors are expected to
recall more negative than positive performance information, which will in turn
cause them to give negatively harsh formal ratings to their subordinates. However,
as the managers are aware that peers, superiors, and subordinates would be
dissatisfied with their low ratings, managers will tend to deliberately inflate formal
written ratings. This finding brings a somehow new insight to the link between

17
dispositions and performance ratings, as a relatively indirect link was found
between ratings and “negative affectivity”. The finding may seem in contradiction
with the other studies which state that the ratings given by high NA raters will be
more severe; however, it may suggest that the ratings given by high NA supervisors
need not always be prone to severity, instead, deliberate rating distortions may lead
them to be more lenient in their ratings, in order not to create dissatisfaction among
employees.
Beyond mood and interpersonal affect, there are some other concepts that may
influence the ratings of raters. An example is the perception of ratees’ personality
characteristics. Research (e.g., Dweck, 1986; Heslin, Latham, & VandeWalle,
2005) has also examined how the rater’s perception of the ratee’s personality
characteristics influences the performance ratings.
1.5. Perception of the Ratee and Performance Ratings
The beliefs that people hold about the person that they rate have also been studies in
performance appraisal literature. Implicit person theory (IPT) can be defined as lay
beliefs about the malleability of personal attributes (Dweck, 1986). It concerns
perceptions about relations between traits, or how traits covary in other people
(Schneider, 1973). IPT can be grouped into two: entity implicit theory, where it is
assumed that personal attributes are largely a fixed entity; and incremental implicit
theory, which assumes that personal attributes are relatively flexible.
According to Dweck (1986), IPT is a strong motivational variable that influences
the extent to which children and students revise their initial impressions of other
people and thus they recognize the increases and decreases in performance. In a
later study, Dweck (1999) argued that incremental implicit theories cause people to
appreciate dynamic personal and situational determinants of behavior and thus
reconsider initial impressions after receiving new information. It was stated that
managers with an entity IPT may appraise people on their initial impressions rather
than their actual performances, because they believe that the personal attributes

18
underlying behavior are stable and will not change over time (Bernardin, Buckley,
Tyler, & Wiese, as cited in Heslin et al., 2005). Heslin et al. showed that IPT affects
acknowledgement of changes in employee performance, by reducing anchoring
effects. This means that managers with an incremental IPT will tend to recognize
the changes in performance behavior of the employees. Its implication for
performance appraisals is that IPT is a motivational variable that predicts the extent
to which raters acknowledge change in ratee behavior; and it not only predicts
appraisal ratings but also provides a theoretical explanation for the raters whose
appraisal ratings contain anchoring and first-impression effects. Thus, research on
IPT shows how to identify and train managers who provide idiosyncratic
performance appraisal ratings. People who hold the belief that personality is
dispositional and is only slightly affected by situations should be trained to make
them see that human behavior is malleable and thus the initial impressions that they
form about employees can later become obsolete and invalid.
In this section, I have examined the literature on how the interpersonal affect and
perceptions of ratees are effective in the performance ratings given. The
dispositional characteristics of the rater, as well as the interpersonal factors, have
also been discussed. In the following sections, the effect of the personality or the
dispositional attributes of the rater on the performance appraisals shall be examined.
Recent research has shown that rating elevation is a stable characteristic of the rater
over rating contexts (Borman & Hallam, 1991; Kane, Bernardin, Villanova, &
Peyrefitte, 1995). Thus, the elevations and tendencies in ratings can be predicted
using certain dispositional characteristics of the ratee. The following section
presents some important research regarding the personality of the ratee and the
effects of different personality components on the accuracy of ratings.
1.6. Rater Personality and Performance Ratings
Rater’s personality characteristics also contribute to the accuracy of performance
ratings; however, this factor has not been explored adequately in the literature. For
example, research suggests that leniency is a stable rater characteristic (Borman &

19
Hallam, 1991). Furthermore, Kane, Bernardin, Villanova, and Peyrefitte (1995)
suggested that raters high on Agreeableness (A) show less accurate ratings (i.e., be
more lenient) when they expect to provide face-to-face feedback to ratees, when
raters are solely responsible for the ratings, or when the ratings will be used for
promotion and salary purposes. Tziner, Murphy and Cleveland (2002) found that
raters high on Conscientiousness (C) are less likely to be influenced by contextual
factors such as attitudes and beliefs. Bernardin, Cooke, and Villanova’s (2000)
study showed that people high on A provided more elevated ratings, whereas people
high on C provided less elevated ratings. Individuals with high A and low C scores
produced the most elevated ratings observed in the study. Based on the findings of
this study, Bernardin et al. suggested “… the use of personality inventories or
assessment for supervisor selection in those instances where supervisory behavior in
the performance appraisal process may be considered an essential and critical
function of the position” (p. 235).
A study by Yun, Donahue, Dudley, and McFarland (2005) explored the interaction
of the social context in which the ratings occur, the rating scale used, and rater’s
personality. They found that social context and the rating scale used moderated the
relationship between personality and rating elevation. Their results suggested that
raters high on A provided more elevated ratings than raters low on A when they
were expected to have a face-to-face feedback meeting. Also, raters high on A
showed less elevated ratings when using a behavioral checklist than a graphic rating
scale.
The literature review presented above suggests that the effects of cognition, liking,
mood, and personality on the performance ratings given have all been of great
concern for the researchers interested in revealing the underlying mechanisms under
performance appraisals. Research has examined the link between performance
ratings and the personality of the rater (e.g., Borman & Hallam, 1991; Tziner et al,
2002; Bernardin et al., 2000), cognition (e.g., Spicer & Ahmad, 2006; Woehr, 1992;
Langer et al., 1976; DeNisi et al., 1983), intentional rating distortions (e.g.,
Cleveland & Murphy, 1992; Bernardin & Villanova, 1986; Jawahar & Williams,
20
1997), state affect (e.g., Williams & Keating, 1987; Murphy & Cleveland, 1995;
Tsui & Barry, 1986), liking (e.g., Decotiis & Petit, 1978; Antonioni & Park, 2001;
DeNisi et al., 1994) and mood (e.g., Sinclair, 1998; Williams & Alliger, 1989;
Moylan, 2000).
Whereas the link between the performance appraisals and dispositional
characteristics (personality); as well as affect (especially state mood and liking) of
the rater were examined, the concept of dispositional affect has been left
unexplored. The effects of dispositional affect (i.e., temperament), and a relatively
new concept called “core self-evaluations” should also be studied regarding
performance appraisals; as Agreeableness (Kane et al., 1995), Conscientiousness
(Tziner et al., 2002), and NA (Fried et al., 1999) had significant effects on the
accuracy of the performance ratings given, other dispositional attributes like the
self-concept of the rater can also be influential in the process of performance rating.
As for the affect side, the effects of positive self concept can be similar to the
effects of positive mood, liking and positive state affect on performance appraisals.
The underlying constructs of state and dispositional affectivity are the same but
only the duration and direction of affect changes, where people with dispositional
positive affectivity tend to experience positive moods over time and towards people
around them, without discriminating (unlike liking). Thus, in the following sections,
after a brief introduction to the concept of core self-evaluations (and its neighboring
concept, core external-evaluations), studies examining the concept of core self-
evaluations are presented.
1.7. Core Self- and External-Evaluations: A Brief Overview
When the current performance appraisal literature is examined, it is seen that
although the effects of concepts like cognition, interpersonal affect, mood, and
personality have been examined quite extensively, a more trait-based approach on
the process of performance appraisal has been left relatively unexplored. The
influence of dispositional affect, which is the tendency to experience positive or
negative mood states over time (Brief & Weiss, 2002), should be studied regarding

21
the performance appraisals. Although cognitive (i.e., information processing)
theories started to explicitly incorporate affect in their models of human thinking
(Bower, 1981; Bower & Forgas, 2001; Forgas, Bower, & Krantz, 1984), the
performance appraisal literature regarding affect is limited to the concepts of liking
and mood, which are not trait-based but depend on the temporary feelings of the
appraiser. However, there is an obvious merit in studying the effects of more
dispositional and affect-related concepts like core self- and other-evaluations on
performance appraisals, the two relatively recently introduced concepts in the field
of “work, industrial and organizational psychology”.
As Woehr (1992) also suggested, people tend to form on-line evaluations of others,
meaning that the judgments about a behavior is formed in the rater’s mind, as soon
as a behavior is observed. This suggestion indicates that the dispositional
characteristics of the rater plays a very important role in the rating process, as the
evaluations are mostly influenced by the personality characteristics (e.g., Kane et
al., 1995; Tziner et al., 2002) and the mood states (Nisbett & Wilson, 1977; Sears et
al., 2001) of the rater; which are two important characteristics of the rater that are
present and in effect, while the rater is making on-line evaluations. A mood
congruency effect was declared for the effects of positive mood in recalling more
positive information (Sinclair, 1988), and positive moods generally result in less
realistic evaluations of the ratee (Sears et al., 2001; Moylan, 2000). Thus, mood and
state affect can be said to distort the perceptions of raters and inflate (or deflate)
their performance ratings while the behavior is being observed and coded. This
information then leads us to the concepts of core self- and external-evaluations,
which are the general and fundamental judgments one holds about himself/herself,
the world and the people around him/her. The core self-evaluations (CSEs) together
with the core external-evaluations (CEEs) can be regarded as the dispositional
affectivity of a person, considering the “dispositional” nature of the beliefs one
holds about himself or herself, and other people, and the “evaluative” part that
includes affect towards oneself and the world in general. Studies have also revealed
that leniency is a stable rater characteristic over time (Borman & Hallam, 1991). If
the rater has a positive self-concept, it is reasonable to expect the rater to behave in

22
an affect-congruent manner, and remember positive information about the ratee
(Sinclair, 1988), as he or she tends to view the people around him or her more
positively (Judge, Locke, Durham, & Kluger, 1998). As leniency is also a
characteristic of a rater, the rater will be more lenient in his or her ratings.
Whereas moods are defined as “low-intensity, diffuse and relatively enduring
affective states without a salient antecedent and therefore little cognitive content”
(Forgas & George, 2001, p. 5), core evaluations are higher order traits that represent
the fundamental evaluations that people make about their worthiness, competence
and capability (Judge, Locke, & Durham, 1997); which are more dispositional and
evaluative in nature. A brief examination of the positive self-concept literature can
make it easier to understand in what ways core self- and other-evaluations can be
linked with performance appraisals.
As it was implied before, the dispositional characteristics of people are found to
have an effect on the performance appraisals that they give and receive. These
dispositional characteristics are somewhat related to each other, and it has always
been a debate whether some frequently researched traits are in fact part of a more
general trait. Judge et al. (1997), in an attempt to combine the closely related traits,
came up with the concept called “core evaluations,” and defined it as fundamental,
subconscious conclusions people come up with about themselves, other people and
the world outside, and “a basic, fundamental appraisal of one’s worthiness,
effectiveness and capability as a person” (Judge, Erez, Bono, & Thoresen, 2003, p.
304). These authors have derived the concept by examining eight literatures:
philosophy, clinical psychology research and practice, job satisfaction, stress, child
development, personality and social psychology.
The meaning of “core evaluations” concept is in fact implied by its name: “Core”
meaning that they are fundamental to other more specific evaluations, and
“Evaluation” meaning that they are not strictly cognitive; they are results of how
people evaluate themselves and the world around them. Judge et al. (1997) stated
that these extensive, underlying, higher-order traits are indicated by four traits that

23
are very well-established and that are used frequently in the personality literature,
namely; self-esteem (the overall value that one places on oneself as a person;
Barter, 1990), generalized self-efficacy (an evaluation of how well one can perform
across a variety of situations; Locke, McClear, & Knight, 1996), neuroticism (the
tendency to have a negativistic cognitive/explanatory style and to focus on negative
aspects of the self; Watson, 2000), and locus of control (beliefs about the causes of
events in one’s life; Rotter, 1966). An individual who scores high on CSEs is
someone who is well-adjusted, positive, self-confident, efficacious, and believes in
his or her own agency (Judge et al., 2003). This type of a CSE is referred to as
“positive self-concept.” Judge et al. (1997) proposed that four criteria are essential
to determine the extent to which dispositional traits were indicative of CSEs:
reference to the self, evaluation (rather than a description) focus, fundamentality of
traits, and breadth or scope.
In the industrial and organizational psychology literature, the four traits that
constitute the CSEs have been studied individually or in pairs, but the relation
between them and the outcomes were studied separately. For example, self-esteem
was found to be related to successful handling of jobs with ambiguous roles (Jex &
Elacqua, 1999), acceptance of change (Wanberg & Banas, 2000), motivation and
organizational commitment (Hui & Lee, 2000), resistance to influence (Brockner,
1988), and restricted information search and policy experimentation (Knight &
Nadel, 1986). The second trait underlying CSEs, which is the generalized self-
efficacy, was found to have relationships with overall job performance and
organizational commitment (Gardner & Pierce, 1998), self-serving bias after failure
(Silver, Mitchell, & Gist, 1995), and coping with career-related events (Stumpf,
Brief, & Hartman, 1987; Hao, Seibert, & Hills, 2005). The effects of locus of
control on certain organizational variables were examined and it was found to be
positively related with skill acquisition, transfer of training, job performance
(Colquitt, Lepine, & Noe, 2000), acceptance of organizational change (Wanberg &
Banas, 2000), job satisfaction (Judge & Bono, 2001), organizational commitment
(Spector, 1986) and positive job attitudes following promotion (Lam &
Schaubroeck, 2000). Finally, emotional stability was found to be correlated with job

24
performance (Ployhart, Lim, & Chan, 2001), extrinsic career success (Judge,
Higgins, Thoresen, & Barrick, 1999), and leadership emergence (Judge, Bono, Ilıes,
& Gerhardt, 2002). Negative affectivity, which can be considered the opposite of
emotional stability, was found to share a high level of common variance with job
satisfaction (Munz et al., as cited in Dormann & Zapf, 2001).
Previous researchers also attempted to combine two or more of these dispositional
constructs. For example; Hunter, Gerbing, and Boster (1982) proposed that self-
esteem and locus of control acted like substitutes for a second-order factor which
can be named self-concept. Also, Hojat (1982) found that self-esteem, locus of
control, and neuroticism loaded very heavily on a common factor. Indeed, when the
four traits are entered into a second order factor model, it was seen that “…there
was a strong convergent validity among the four measures and that self-esteem,
generalized self-efficacy, locus of control, and neuroticism converge to form a
higher order factor that is indicated by and explains the relationships among the
four lower level measures” (Judge et al., 2002, p. 697). It was also examined
whether each trait explained a unique variance in the outcomes (Judge & Bono,
2001a; Judge et al., 2002), and it was found that “…each trait measure separately
contributes little beyond the contribution of their common core” (p. 704), which is a
good implication why the higher-order “core evaluations” factor is better used as a
predictor in the future studies. As the CSE traits exhibit strong associations with
emotional stability, Judge and Bono (2001a) suggest that CSEs might be
representing a broad, inclusive measurement of emotional stability. Still, Hiller and
Hambrick (2005) state that there are aspects of the four components that are
different than, and that do not contribute to CSEs. Thus, although the four concepts
are related enough to be studied together, they are still conceptually distinct enough
to represent dispositional constructs in and of themselves.
After defining the CSEs, Judge and his colleagues tried to tie this concept to some
industrial and organizational psychology outcome variables like job performance
(Judge & Bono, 2001), job satisfaction (Judge, Locke, Durham, & Kluger, 1998;
Judge, Erez, Bono, & Locke, 2005), and managerial coping (Judge, Thoresen,

25
Pucik, & Welbourne, 1999). They found that individuals with positive self-
evaluations not only perceived their jobs as providing more intrinsic characteristics,
they actually attained more challenging jobs (Judge, Bono, & Locke, 2000). In turn,
choosing more complex jobs was associated with increased levels of job
satisfaction. Intrinsic job characteristics, which were found to mediate the
relationship between CSE and job satisfaction, are task identity, skill variety, task
significance, autonomy and feedback, as described by Hackman and Oldham
(1980). CSE can be said to affect job satisfaction through two different processes
(Dormann, Fay, Zapf, & Frese, 2006). First one is that CSE influences what types
of environment people look for and whether they attain that environment (i.e., type
or quality of job). Secondly, CSE shapes how people perceive the world, and
whether they perceive critical events as failures or challenges. Dormann et al.
(2006) found that negative affectivity and locus of control were the best predictors
of job satisfaction among the CSE components. Similarly, it is an important finding
that Judge et al. (2000) found strong relationships between CSE and life
satisfaction.
Tsaousis, Nikolaou, Serdaris, and Judge (2007) found that there was a significant
relationship among CSE, subjective well-being and health functioning, and CSE
acted as a moderator in this relationship. In a meta-analysis, Judge and Bono
(2001b) showed that the relation of the core evaluation traits to job satisfaction and
job performance can be generalized across studies. Rode (2004) also found in his
longitudinal study that job satisfaction was significantly related to CSEs measured
three years earlier, after controlling for a number of work related, non-work related,
and demographic variables. In the Erez and Judge (2001) study, CSEs were found
to be related to motivation and performance. This finding was replicated in both a
laboratory setting and in a field study. Best, Stapleton, and Downey (2005) showed
that employees’ CSEs have both a direct and an indirect effect on job satisfaction,
the indirect effect being through job burnout. In a study where the responses to
multi-source feedback were analyzed, it was found that people with higher CSEs
were most committed to developmental goals when self-ratings exceeded ratings
given by others. This commitment occurred because people high in CSE were
26
motivated to improve themselves when faced with such a negative discrepancy
(Bono & Colbert, 2005). In another study, Sager, Strutton, and Johnson (2006)
found support for the idea of extending the CSE research into the sales management
area, as salespeople with an internal locus of control together with a confidence in
their skills (high self-efficacy), tended to suffer from less role stress.
Judge, Bono, Erez, and Locke (2005) tried to explain the underlying mechanisms
that influence CSEs’ effects on goal attainment, and found that work goal self-
concordance mediates the link between CSEs and job satisfaction. Also, personal
goal self-concordance mediates the relationship between CSEs and life satisfaction.
Self-concordance is defined as choosing goals that are concordant with one’s ideals,
interests, and values rather than pursuing goals for extrinsic and defensive reasons.
If a goal is self-concordant, the goal is pursued for intrinsic reasons rather than
extrinsic controls utilized over it. Individuals who have a positive self-concept will
tend to see themselves as more capable and competent, which causes them not to be
influenced easily by external pressures. In turn, if a goal is attained successfully, it
is viewed as leading to satisfaction with the self (Locke, as cited in Judge et al.,
2005). Rode (2004) states that people who consider themselves to be incompetent
(i.e., who have a negative self-concept) may experience little satisfaction with the
given working conditions because they think that their incompetence will eventually
lead to failure, downgrading, and disgrace as they do not perform up to
expectations, whereas people with high CSEs (i.e., people who believe that they are
competent) will experience greater satisfaction with the same working conditions
because they are confident in their ability to make the best out of those conditions.
In a study by Judge et al. (1999), it was shown that positive self-concept and risk
tolerance both significantly predicted self-report measures and independent
assessments of coping with change. In this study, firstly, the traits were taken
separately but later, using a principal-components analysis, the four dispositional
traits that constituted CSE were grouped into the factor “positive self-concept.” This
study revealed that the four traits that compose positive self-concept could be taken
as a whole and the literatures studying these traits should be integrated.

27
Positive self-concept has also been shown to be a strong predictor of both
satisfaction and happiness not only in individualistic cultures, in which judgments
of the world rely on self-referenced appraisal, but also in collectivistic cultures (in
which attitudes depend in part on the quality of relationships one has with others)
(Piccolo, Judge, Takahashi, Watanabe, & Locke, 2005).
A positive self-concept has been shown to be positively associated with most of the
industrial and organizational psychology concepts, such as job satisfaction (Judge et
al., 1998), job performance (Judge & Bono, 2001), managerial coping (Judge et al.,
1999). However, this association may be true and useful only if “positive self-
concept” is experienced within normal levels. For example, Hiller and Hambrick
(2005), in their attempt to conceptualize hubris (i.e., exaggerated self-confidence)
experienced by executives, have proposed that hyper-core self-evaluations may be a
relevant term in explaining the overconfidence of executives in themselves which
leads them to “take grandiose actions that can easily lead to catastrophic results” (p.
298). This proposition is based on the findings about the concepts of narcissism,
overconfidence and hubris. A normal level of CSE is expected to be correlated with
healthy narcissism which helps successful functioning of a person, and is expected
to be unrelated with the unhealthy reactive narcissism (Hiller & Hambrick, 2005).
As can be seen, CSE is a critical concept as it relates to key variables studied by
work and organizational psychology researchers, and measuring CSEs with a single
scale is a great convenience for researchers who aim to link the level of CSE to
different concepts. The following section describes how the CSEs are measured.
Before moving on with the measurement of CSEs, another concept that shall be
used in this study should be presented. Judge et al. introduced a neighboring
concept to the CSEs called core external-evaluations (CEEs). It is also a
fundamental concept like the self-evaluations. Judge et al. (1997) define it as being
relevant to other people (trust vs. cynicism) and the world in general (belief in a
benevolent and a just world). If one believes that other people are “out to get
him/her” and they cannot be trusted in any way, you have a cynical view of the

28
external world. Also, if one believes that people can be happy in life, they can be
successful and achieve their goals; this means that they believe the world to be a
benevolent place and they positively evaluate the world.
1.7.1. Measurement of Core Evaluations
Although each of the traits that make up the core self-evaluations (CSEs) have their
own measures (e.g. Chen Gully, & Eden, 2001; Gray-Little, Williams, & Hancock,
1997; Levenson, 1981; Rosenberg, 1965; Rotter, 1966), a great need for a single
scale to measure the core self-evaluations emerged, mainly because of practicality
reasons (Judge, Erez, Bono, & Thoresen, 203). First of all, a new CSE measure
would be designed to precisely measure the underlying “core self-evaluations”,
rather than the indicators of the concept. Also, when separate scales are used, the
four scales have a total of 38 items, which limits its usefulness in especially
organizational settings (Judge, Van Vianen, & DePater, 2004). It was expected that
a direct measure would achieve higher levels of validity with less variability. This is
why Judge et al. (2003) developed the 12-item core self-evaluations scale (CSES).
Initially, 65 items were written that covered the issues of self-worth (e.g., “I wish I
could have more self-respect”), one’s evaluation of control over one’s environment
(e.g., “I determine what will happen in my life”), evaluations of one’s capability
and competence to be successful (e.g., “I am capable of coping with most of my
problems”), and one’s evaluation of his/her emotional adjustment (e.g., “There are
times when things look pretty bleak and hopeless to me”). As a result of their
analysis, the final scale included 12 items measuring the construct of interest with
desirable psychometric properties. First of all, the 12 items covered the
commonality among the CSE domains. Secondly, they were significantly correlated
with each other, indicating that the scale is reliable. Thirdly, the items were
correlated with concepts like job satisfaction, life satisfaction, and job performance,
indicating their validity. Finally, 12 items were ideally short enough so that the
scale would be useful (Judge et al., 2003).

29
When the reliability and the factor structure of the scale that included these 12 items
were investigated, it was found that the distribution of the CSE scores was similar
across samples and the means of the samples were not significantly different from
each other. The average reliability across samples was .84, and all of the items were
positively intercorrelated. Also, the alphas, item-total correlations, and inter-item
correlations suggested a high level of internal consistency. The test-retest reliability
was .81 and that indicated good stability. The confirmatory factor analysis
conducted by LISREL 8 (Jöreskog & Sörbom, 1996) showed that the CSES items
indicated a unidimensional structure.
There are also strong convergent and discriminant validity indications for the scale.
The CSES was highly correlated with each domain that it consisted of, thus
showing high levels of convergent validity. The scale was found to diverge from the
big five traits. Empirically, the CSES contributed to the prediction of job and life
satisfaction, and job performance, beyond the contribution of the original four traits
(Judge et al., 2003).
Considering all of these findings, it can be said that the CSES acts as a valid,
reliable, and useful tool for measuring the overlapping parts of the four traits that it
covers. Regarding cross-cultural applicability, Judge et al. (2004) found cross-
cultural evidence for the validity and psychometric properties of the measure in
Spanish and Dutch versions of the scale.
The CSES has been translated and adapted into Turkish by Yasemin Kisbu and
Mahmut Bayazit (Kisbu, 2006). The Turkish version of the scale was found to have
good internal consistency (Cronbach’s alpha = .85). The scale was correlated with
the illusion of control biases of taxi drivers (r = .15) and their need for cognition (r
= .33), implying acceptable convergent validity. Also, the scale was not correlated
with the individual values of people, thus, the scale can be said to have discriminant
validity. The factor analysis for the Turkish CSES did not show a single factor
structure; instead, the exploratory factor analysis showed that the scale consisted of
3 factors: negatively worded items, positively worded items, and items 1 and 9. This

30
finding suggests that the negatively worded items may cause a methodological
artifact in the Turkish sample. Interestingly, similar results emerged in studies that
were conducted using western samples (Kennedy, 2007).
The data collected in the present study may also help in determining whether the
scale is reliable and valid and it will be helpful in analyzing the factor structure of
the Turkish version of the scale.
1.8. The Aim of the Thesis and Hypotheses
As mentioned above, the judgments about a behavior of a ratee are formed in the
rater’s mind as soon as a behavior is observed (Woehr, 1992). Dispositional
characteristics and the state of the rater at the time of evaluation have all been
shown to play an important role in the rating process (e.g., Kane et al., 1995; Tziner
et al., 2002). It was argued that when subjected to the same task attributes,
individuals’ dispositional tendencies affect how they interpret the favorability of
these attitudes (Brief, Butcher, & Roberson, 1995).
Core self and external evaluations are dispositional in nature and provide a lens
through which cognitive or subjective appraisals are regarded (Judge et al., 1997).
The core self-evaluation components (i.e., locus of control, self-esteem, generalized
self-efficacy, emotional stability) all have strong similarities with the concept of
dispositional affectivity and so theoretically it makes sense to assume that core self-
and external-evaluations will affect performance appraisal behaviors in a similar
way that affectivity does. For example self-esteem, a component of positive self-
concept; is an important source for positive affectivity (Watson, Suls, & Haig,
2002). Secondly, people with internal locus of control who choose to stay within a
frustrating situation, will reevaluate the situation more favorably in order to
preserve consistency between their attitudes and behavior, which will in turn lead to
a positive evaluation of the situation (Butterfield, 1964). Negative affectivity (NA)
was found to be relevant with the evaluation of others, where “…subsuming a broad
range of aversive mood states, including anger, disgust, scorn, guilt, fearfulness,

31
and depression… High NA subjects … tend to focus on the negative side of others
and are less satisfied with themselves and their lives” (Watson & Pennabaker, 1989,
pp. 234-235). In some articles, the terms “negative affectivity” and “neuroticism”
are used interchangeably. Thus, the findings for NA can be generalized to
neuroticism, indicating that NA will cause the raters to focus on the negative
behaviors of the ratees. In fact, affectivity and core evaluations both are enduring
states of mood. However, as the core evaluations are much more dispositional than
moods, the research about the core evaluations-performance appraisal link is
expected to add to our knowledge about both the effects of dispositional beliefs and
whether people behave in a disposition-congruent way.
The deep assumptions that people hold about themselves, other people, and the
external world (i.e., CSEs) (Judge et al., 1998) tend to influence appraisals of
external events (Best, Stapleton, & Downey, 2005), which means they can also be
said to affect the perception of other’s performance. CSEs are said to help in “…
shaping subjective interpretations of contextual events” (Best et. al., p.442),
implying a congruency effect. Thus, it can be expected that core evaluations will
cause people to interpret situations in a disposition-congruent way. The examination
of CSEs will be helpful in determining what kind of different evaluations a rater
will engage in while observing performance behaviors of a ratee, which are
expected to be more positive for the raters with a positive self-concept. Thus, the
positive self-concept of a rater may cause the performance ratings given for a
neutral performance to be more lenient, as people with a positive CSE view the
people around them more positively than people with a negative self-concept do;
and viewing the ratee positively will bring about inflated performance ratings (e.g.,
Robbins & DeNisi, 1998), when faced with neutral performance.
As core evaluations are more global and more dispositional than moods, they are
likely to add a new insight in understanding the rating behavior in performance
appraisals. It was stated above that people with a positive self-concept are expected
to observe positive performance behaviors more frequently and remember more
positive information. When studying the effects of CSEs, hence, the way appraisers

32
with a positive self-concept and with a negative one perceive and interpret neutral
performance stimuli may differ substantially from each other, as more disposition-
congruent information will be processed and remembered. Core external-
evaluations are also important regarding their effects on the perceptions and
evaluations of people, as individuals who do not believe in a just world have more
negative perceptions of the punishment they receive than those who have more
positive perceptions of justice in life (Ball, Trevino, & Sims, 1994). This may cause
a congruency effect, too, and people who interpret the world negatively will
perceive and interpret events negatively.
As we have stated that both dispositional affect and core self- and external-
evaluations can be regarded as enduring states of mood (i.e., more dispositional
than state mood), we can integrate the findings about the link between mood, and
leniency and halo into our study. Research has shown that leniency is more of a
dispositional construct, and in this study, we expect leniency to be a result of the
core self-evaluations of the rater, because the performance ratings will follow a
disposition-congruent pattern. That is, people who perceive themselves more
positive will also tend to perceive the ratees with a neutral performance as
performing better than they really do. Thus, it is proposed that:
Hypothesis 1: People who have positive core evaluations (i.e., who are high on
core self- and external-evaluations) are expected to give higher ratings to (i.e., be
lenient towards) neutral performance than people with a negative self-concept.
The other rating bias which has a great effect on the accuracy of performance
ratings is halo. Halo, as defined above, is the inability of the rater to discriminate
between the performance of a ratee on different dimensions of the job (Borman,
1975), and Lance et al. (1994) state that the general impression of the ratee is the
most important cause of halo error. As core self- and external-evaluations are broad
concepts that include seeing the other people as positive or negative, we can predict
that the raters will not be able to discriminate among the different performance
dimensions of a ratee while observing and encoding performance behavior.

33
Previous research has shown that positive affectivity of the rater caused higher
levels of halo in ratings (Williams & Keating, 1989), and that raters with positive or
negative affect engaged more in halo than raters who were neutral (Tsui & Barry,
1986). These studies clearly reveal the effects of positive and negative affectivity on
the ratings. Especially if a rater has a relatively high or low core external-
evaluation, he or she will either believe that people are good in nature or that people
are basically not trustable and bad; showing that the rater will rely on the general
view of the ratees, which suggest a potential halo effect in the ratings. In this study,
we expect that the raters with higher or lower core self-evaluations will show more
affect towards the ratee (as a result of a positive or negative evaluation of the world
and the other people) and thus obtain a general positive or negative view of the
ratee, compared to people with neutral core self evaluations, which will cause them
not to be able to differentiate between different dimensions of performance.
According to these findings, it can be hypothesized that:
Hypothesis 2: People with positive and negative core self-evaluations (i.e., who
score in the highest or the lowest 25th percentile in CSEs) will tend to engage more
in halo compared to people with average CSEs when evaluating neutral
performance.
As core external evaluations are also considered as influencing the evaluative
judgments of people (Best et al., 2005), they are expected to effect how people with
positive or negative self-regard interpret behaviors. A positive external evaluation,
as defined before, is the belief that the world is a benevolent and just place; and a
negative external evaluation is the belief that other people are cynical, no one can
be trusted and the world is not a just place (Judge et al., 1997). This will probably
affect how the person interprets the behaviors of others. A positive external
evaluation is likely to add to the “enduring positive mood”, which is a positive core
self-evaluation, because the definition of mood seems to include one’s view about
the external world. Thus, it is likely that a person with both a positive self- and
external- evaluation will interpret performance behavior in the most lenient way.
Following this assumption, it can be hypothesized that:

34
Hypothesis 3: Core external-evaluations will moderate the link between core self-
evaluations and the performance ratings given.
In order to test these hypotheses, an experimental study was carried out, which
aimed to compare the ratings given to a neutral performance example by people
with different levels of core self-evaluations. In order to ensure the manipulation of
a “neutral performance” (i.e., average performance) example, a “very positive
performance” (i.e., good performance) example was also created. An important
reason for the inclusion of the good performance example was to understand
whether people with different levels of core self-evaluations differed in their ratings
of good performance or whether dispositional affect congruency was applicable
only in relatively vague situations. Thus, the existence of two different performance
conditions leaves room for interpretation of rating behaviors. Participants were
given either the neutral or the positive performance vignette, and they were asked to
rate the performance of the person depicted in the vignettes using the two
performance appraisal forms (i.e., the GRS and the BOS) developed by the
researcher herself. The following section describes the method for the study, with
the relevant tools and measures used and the procedure followed for the
experimentation.
35
CHAPTER II
METHOD
2.1. Participants
One hundred and twenty-nine undergraduate students from the Middle East
Technical University (METU) in Ankara participated in the study. Participation was
completely voluntary and students received extra credit for their participation. Fifty
of the participants were men (38.8%) and 79 of them were women (61.2%). Eighty-
three of those who participated in the study were in the Department of Business
Administration (64.3%), 39 were in the Department of Psychology (30.2%), and 7
of them were from other departments (5.4%). The distribution of 129 undergraduate
participants in terms of the class year is as follows: seventy-three (57%) freshmen,
47 (36%) sophomores, five (4%) juniors, and four (3%) seniors. Participants’ age
ranged between 18 and 27 years, with the median age of 20 ( X = 20.33, SD =
1.44).
2.2. Measures and Tools
2.2.1. Core Self- and External-Evaluations Scales
The Turkish version of “Core Self-Evaluations Scale” (CSES) (Kisbu, 2006),
originally developed by Judge et al. (2003) was used to assess positive/negative
self-concept (See Appendix A). The scale consists of 12 items rated on a 5-point
Likert scale, with responses ranging from 1 = Strongly disagree to 5 = Strongly
agree. Higher scores on this scale indicate having a more positive self-concept.

36
Sample items include “I complete tasks successfully” and “I determine what will
happen in my life.” The original version of the scale has acceptable levels of
internal consistency (r = .84) and test-retest reliability (r = .81). Convergent validity
of the separate measures of the four traits that make up the core self-evaluations
(i.e., self-esteem, generalized self-efficacy, locus of control, and low neuroticism)
has also been well-established (Judge et al., 2003). The scale includes 6 reversed
items (items numbered 2, 4, 6, 8, 10 and 12).
The translated Turkish version of the scale has different levels of reliability ranging
from r = .70 to r = .84; and the item-total correlations are moderately high, ranging
from .35 to .79. The Turkish version of the scale showed good convergent validity,
as it was correlated with some relevant concepts like the illusion of control bias (r =
.15) and the need for cognition (r = .33). Also, the Turkish scale carries good
discriminant validity, as it is not correlated with the individual values of people.
The factor analysis for the Turkish CSES revealed three factors, unlike the original
scale which consisted of a single factor (See Section 1.6.2 for details).
The participants were also given the Turkish version of “Core External Evaluations-
Scale” (CEES) (Judge et al., 2003) to assess how people perceive the world around
them (See Appendix B). The CEES consists of 14 items and the responses to the
scale are anchored on a 5-point Likert scale, with responses ranging from 1
(strongly disagree) to 5 (strongly agree). Higher scores on CEES indicate having a
more positive view of the world. Sample items include “Basically, you can trust
other people” and “The world is just not fair” (reversed). The scale includes 8
reverse items (items numbered 1, 2, 3, 4, 8, 9, 11 and 14). The original scale was
translated and back-translated by three subject matter experts (i.e., graduate students
in Industrial and Organizational Psychology), and the version with the highest
conceptual equivalence was identified by the researcher, regarding the similarity of
the back-translated scale to the original scale.

37
2.2.2. Performance Vignettes
Two different vignettes that were prepared by the researcher were used in the study,
a neutral performance vignette (See Appendix C) and a good performance vignette
(See Appendix D). The participants were given one of these two performance
vignettes that reflected the job evaluation of a secretary by her boss, in a text
format. The secretary, whose name is “Zeynep Özkan”, was said to be working for
the department of Civil Engineering in Middle East Technical University, and her
boss who evaluated her performance is the head of the department. The vignette
described her performance (as written/evaluated by the department head) on the
dimensions relevant to her job (e.g., planning and organization, problem solving,
and communication with the students). The preparation of vignettes is described
below.
The purpose of the neutral vignette was to create a neutral performance impression
for the target person who would later be rated by the participants, and the purpose
of the good vignette was to create a good impression. The Occupational Network
Database (O’NET) and the job description of a secretarial position in a private
university in Ankara, Turkey were used as a basis for the construction of the
vignettes. That is these sources were used to initially identify the dimensions of
secretarial job performance. In order to adopt this information to the job of a
departmental secretary specifically in Middle East Technical University (METU),
an experienced secretary who was working in one of the departments of the
university was consulted. She was asked to indicate the general performance
dimensions of her job and the behavioral indicators of those dimensions. Later, the
dimensions that were thought to be the best indicators of a departmental secretary’s
performance in METU were used performance indicators in the vignettes, as well as
the performance rating forms (see Section 2.2.4 for details on Performance Rating
Forms). Thus, a special attention was paid to make the dimensions of performance
included both in the vignettes and performance rating forms relevant/meaningful for
the secretarial job in the university in which the study was conducted. It was hoped

38
that both vignettes and the performance dimensions would look/sound familiar to
the student participants/raters as they were intended to reflect tasks/dimensions
associated with the departmental secretarial job in the university. In other words a
special attention was paid to make the vignettes and the rating dimensions relevant
for the secretarial job which students ratees were assumed to be quite familiar with.
Seven relevant job dimensions (i.e., Planning and Organization, Written
Communication, Knowledge of Instructions and Regulations, Technical
Competence, Pursuit and Control, Communication with the Students, Problem
Solving, and Professionalism) and one or two relevant behaviors that mainly
defined each dimension (e.g., “Determines the jobs to be done in advance”, as
related with “Planning and Organization” dimension; “Uses the computer programs
necessary for the job effectively” as related with “Technical Competence”
dimension) were extracted from the job descriptions, to be used in the performance
vignettes and also in the performance rating forms (see Section 2.2.4).
In order to make a vignette reflect neutral performance, the secretary was said to
show a just about acceptable performance on most of the dimensions extracted from
the job descriptions. Some key manipulating phrases like “Faces some problems
while carrying out the correspondence within department”, “May cause confusion
because of the mistakes she does”, and “She sometimes does not act
professionally”; which were describing her performance in the important tasks
relevant to her job were used for creating a neutral performance impression. In
order for the vignette to be realistic and for the performance of the secretary not to
be perceived as below average, the performance of the secretary was said to be
good in some of the job dimensions and behaviors.
For the good performance vignette, Zeynep Özkan was said to perform above
average on a few dimensions and very good on the rest. Some key phrases like
“Shows great attention …”, “Can be said to be very successful …”, or “Has not
experienced any problems until now …” were used to manipulate a good
performance impression. The dimensions and behaviors were the same in both the
neutral and good performance vignettes, and both vignettes were at the same length

39
and contained approximately equal number of words (i.e., 554 words in neutral and
548 words in good performance vignette), in order not to manipulate the readers by
any means other than the content of the vignettes.
Prior to the main study, a manipulation check was done to see if the vignettes were
successful in creating the performance impression that they aimed to create.
Originally, two different neutral performance vignettes and one good performance
vignette were developed and presented to a total of 30 participants who were
research assistants and instructors in the Department of Business Administration in
Middle East Technical University, thus ten participants rating each performance
example. These participants were different from the participants of the main study.
Two different neutral performance vignettes were prepared to see which one was
more successful in creating a performance impression closer to the average
performance (See Table 1). The participants of manipulation check were given one
of the vignettes (i.e., first neutral vignette, second neutral vignette or good vignette),
and they were asked to rate the performance of the secretary as they read on the
vignettes. They were given a behavioral observation performance rating scale to
rate the performance. The rating form used for the manipulation check includes
both the general performance dimensions and the behaviors that are indicators of
those dimensions (see Appendix E). This performance rating form developed by the
researcher herself was different from the rating forms used in the main study. The
sample items include, “Planning and Organization” as the performance dimension
and “Predetermines the required work, arranges work effectively through time,
ranks work according to importance and carries out tasks without making them
interrupt each other” as the relevant behaviors. The participants were asked to
indicate the frequency with which the secretary was expected to show each
performance dimension and the relevant behaviors, on a 5-point frequency scale,
ranging from 1 = Never to 5 = Always. The analyses of these ratings revealed that
the participants of the manipulation check rated the good performance vignette as
well above average ( X = 4.5, SD = .31), the first average performance example at
just about average ( X = 3.3, SD = .29), and the second average vignette at slightly
above average ( X = 3.8, SD = .32). The mean ratings for each behavior in the good
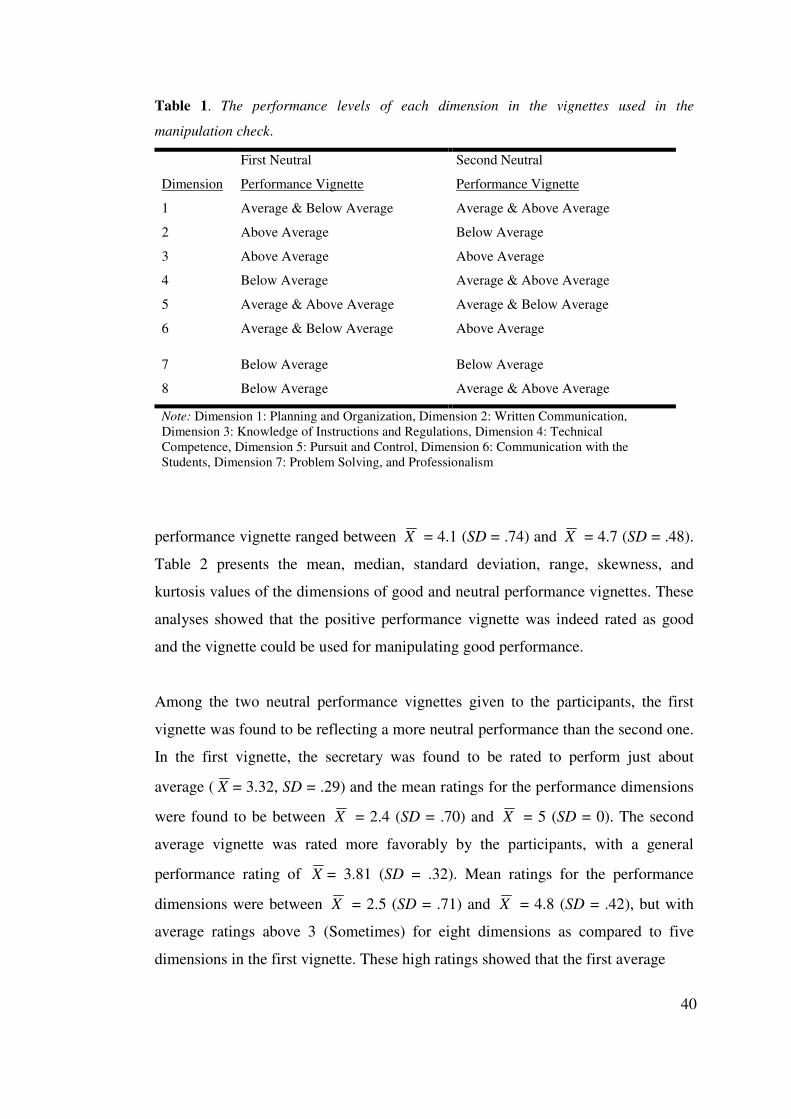
40
Table 1. The performance levels of each dimension in the vignettes used in the
manipulation check.
performance vignette ranged between X = 4.1 (SD = .74) and X = 4.7 (SD = .48).
Table 2 presents the mean, median, standard deviation, range, skewness, and
kurtosis values of the dimensions of good and neutral performance vignettes. These
analyses showed that the positive performance vignette was indeed rated as good
and the vignette could be used for manipulating good performance.
Among the two neutral performance vignettes given to the participants, the first
vignette was found to be reflecting a more neutral performance than the second one.
In the first vignette, the secretary was found to be rated to perform just about
average ( X = 3.32, SD = .29) and the mean ratings for the performance dimensions
were found to be between X = 2.4 (SD = .70) and X = 5 (SD = 0). The second
average vignette was rated more favorably by the participants, with a general
performance rating of X = 3.81 (SD = .32). Mean ratings for the performance
dimensions were between X = 2.5 (SD = .71) and X = 4.8 (SD = .42), but with
average ratings above 3 (Sometimes) for eight dimensions as compared to five
dimensions in the first vignette. These high ratings showed that the first average
Dimension
First Neutral
Performance Vignette
Second Neutral
Performance Vignette
1 Average & Below Average Average & Above Average
2 Above Average Below Average
3 Above Average Above Average
4 Below Average Average & Above Average
5 Average & Above Average Average & Below Average
6 Average & Below Average Above Average
7 Below Average Below Average
8 Below Average Average & Above Average
Note: Dimension 1: Planning and Organization, Dimension 2: Written Communication, Dimension 3: Knowledge of Instructions and Regulations, Dimension 4: Technical Competence, Dimension 5: Pursuit and Control, Dimension 6: Communication with the Students, Dimension 7: Problem Solving, and Professionalism

41

42
Table 2. Descriptive Statistics of the Performance Ratings given in the Manipulation Check (Cont’d)
8. Professionalism 2.40 2.50 .699 2.00 -.78 -.15
9. General Performance 3.10 3.00 .738 2.00 -.17 -.73
Average Performance 2 3.81 3.89 .323 1.22 -.85 2.11
1. Planning and Organization 3.50 3.50 .527 1.00 .00 -2.57
2. Written Communication 3.30 3.00 .483 1.00 1.04 -1.22
3. Knowledge of Instructions and
Regulations
4.70 5.00 .483 1.00 -1.04 -1.22
4. Technical Competence 4.30 4.50 .949 3.00 -1.72 3.53
5. Follow Up and Control 2.50 2.00 .707 2.00 1.18 .57
6. Communication with the Students 4.80 5.00 .422 1.00 -1.78 1.41
7. Problem Solving 3.00 3.00 .667 2.00 .00 .08
8. Professionalism 4.70 5.00 .483 1.00 -1.04 -1.22
9. General Performance 3.50 3.50 .523 1.00 .00 -2.57
Note: Good = Mean performance ratings of Good Performance Vignette, Average 1 = Mean performance ratings of the first Average Performance Vignette, Average 2 = Mean performance ratings of the second Average Performance Vignette. The minimum and maximum scale points for the performance rating form: 1 = Never, 5 = Always.

43
vignette reflected a neutral performance level better than did the second neutral
performance vignette. Thus, a decision was made to use the first average vignette in
manipulating average performance in the main study. However, as the performance
dimension “Knowledge of Instructions and Regulations” had an average rating of 5
(Always) in the first average vignette, to be able to enhance the discrepancy
between the good and the neutral vignettes, the description about that performance
dimension was changed. The behavioral description in the first vignette which
reflected the performance dimension of “Knowledge of Instructions and
Regulations” was then replaced with the behavioral description of the same
dimension from the second vignette, as the participants rated the dimension as more
neutral in the second vignette ( X = 4.7, SD = .48).
2.2.3. Distractor Task/Scales
In order to have a break, and hence not completely reveal the manipulations of the
study between reading the performance vignette and actual ratings, two distractor
scales were administered to the participants in each condition. The distractor scales
were Positive and Negative Affect Schedule (PANAS) and Rosenberg Self-Esteem
Scale (SES).
2.2.3.1. Positive and Negative Affect Schedule
Positive and Negative Affect Schedule (PANAS) was developed by Watson, Clark,
and Tellegen (1988) and consists of 10 positive affective states (i.e., interested,
excited, strong, enthusiastic, proud, alert, inspired, determined, attentive, and
active) and 10 negative affective states (i.e., distressed, upset, guilty, scared, hostile,
irritable, ashamed, nervous, jittery, and afraid). The scale has an internal
consistency of .88 for negative affect (NA) and .85 for positive affect (PA)
components. The test-retest reliability is .47 for the whole scale (Watson et al.,
1988). Participants were asked to indicate the extent to which they experienced each
state over the previous couple of days. The response alternatives range from 1 =
Very slightly or Not at all; to 5 = Extremely.
44
PANAS was adapted into Turkish by Gencoz (2000) and showed a reliability of .83
for the PA and .86 for the NA. The test-retest reliabilities for the Turkish version
were .40 and .54 for the PA and NA, respectively. PANAS is a relevant scale for
this study because the ratings given by the participants may be affected from their
moods at the time of study (Williams & Alliger, 1989), rather than or in addition to
their core self-evaluations. Thus, the responses to PANAS shall be used as a control
variable when analyzing the link between raters’ self-concepts and the performance
ratings they give.
2.2.3.2. Rosenberg Self-Esteem Scale
The second distractor scale, Rosenberg Self-Esteem Scale (RSES) (Rosenberg,
1965), is a 10-item scale that includes items such as “On the whole, I am satisfied
with myself” and “I wish I could have more respect for myself” (reversed). RSES
includes five reversed items (items 3, 5, 8, 9, and 10). The reliabilities reported for
the scale range from .83 (Yarcheski & Mahon, 1989) to .99 (Damji & Noles, 1996).
Fleming and Courtney (1984) reported a test-retest reliability of .82 for the scale.
The items were originally rated on a 4-point Likert scale but for the purposes of this
study and for the ease of later analysis, they were rated on a 5-point scale ranging
from 1 = “Strongly disagree” to 5 = “Strongly agree”. The scale was translated into
Turkish by Çuhadaroğlu (as cited in Öner, 1997). Toker (2003) found the internal
consistency of Turkish version of the scale to be .80.
RSES is also a relevant scale for the purposes of this study, as it measures self-
esteem, which is one of the components of the core self-evaluations. Thus, it may
be used as a control variable to enhance the measurements by CSES.
2.2.4. Performance Rating Forms
Two performance rating forms (PAFs) were developed to be used in performance
evaluation of the secretary by participants (See Appendix F and G). The first PAF

45
was based on the general performance dimensions extracted from the job
descriptions of a departmental secretary job, which were also used in developing the
performance vignettes (See Section 2.2.2.). In the first PAF, the performance
dimensions such as “Planning and Organization,” “Written Communication” etc.;
and the general performance of the secretary were asked to be rated using a graphic
rating scale (GRS) format; in which the participants rated the success of the
secretary in each dimension on a 5-point scale ranging from “Poor” to “Very
Successful”.
The second PAF was based on the behaviors that represent the performance
dimensions given in the first PAF. A behavior observation scale (BOS) format was
adopted in developing the second PAF. That is, the participants were asked to rate
the frequency with which the secretary was expected to engage in the performance-
related behaviors (e.g., “Uses the computer programs relevant to her job
effectively”, “Understands, writes and interprets written information fully and
without any flaws.”) depicted by the items using a 5-point frequency scale, ranging
from 1 = Never to 5 = Always. The participants were required to rate the secretary
on each behavioral item presented. None of the dimensions given in the first PAF
(i.e., GRS) were explicitly mentioned in the vignettes; however, the participants
were required to understand which behaviors implied the performance in each
dimension. One or two behaviors which represent each performance dimension and
which were written in the vignettes were included in the second PAF (i.e., BOS).
Four bogus items were included in the BOS (items 4, 7, 8 and 13) as well, to
understand if the vignettes were understood correctly and to see if the respondents
were subject to response set bias. The bogus items included behaviors such as
“Represents her organization in the best possible way” and “Willing to do
teamwork”, which were not included among the dimensions in the vignettes. A
response option of 6 = “Don’t have an idea” was added to the BOS to see if the
participants were able to discriminate these bogus items from the real behaviors
stated in the vignettes.

46
2.3. Procedure
Participants were recruited during regular class hours and extra credits were assured
to those who participated. An appointment was scheduled with the students who
agreed to participate in the study, such that 2 to 12 participants were gathered in a
meeting room in each session. Following a brief introduction of the study and the
collection of informed consent forms from the participants, the following steps were
followed (also see Table 3).
First, the Core Self-Evaluations Scale (CSES) and the Core External-Evaluations
Scale (CEES) were administered to the participants. Information about the
participants’ age, gender, department and year of education were asked at the
beginning of the CSES. At this point, participants were asked to adopt a pseudonym
or a code for themselves, which they would use when filling out the other scales as
well. This was done to help keep the participants anonymous as well as be able to
match the different scales filled out by the same participants at different time points.
After the collection of CSES and CEES, the participants were presented with the
most recent job evaluation of the secretary by her boss in a text format after they
were given the following instruction:
“You are about to read the written evaluation of the performance of a
person who works as a departmental secretary in the Civil Engineering
Department of Middle East Technical University; as observed by her
boss who is also the head of the relevant department. After you read
these observations, I will want you to answer some questions”
After the instruction, the participants were randomly assigned to the neutral
performance or good performance vignette condition and the relevant vignette was
given to each participant. Sixty-three of the participants were given the neutral
performance vignette, in which the evaluation of the secretary’s performance was
expected to reflect neutral performance. Accordingly, the department head’s
description of Zeynep Özkan’s performance was somewhat slightly above, slightly

47
below or just about average on each dimension. The remaining 66 participants were
given the vignette in which the evaluation of the secretary’s performance was
expected to reflect a good performance. Accordingly, the department head’s
description of Zeynep Özkan’s performance was somewhat slightly above or well
above average on each dimension (as described in Section 2.2.2). The participants
were not told that the vignette was a hypothetical performance example, in order to
make the later ratings more realistic. Also, participants were not told that they were
randomly assigned to two different vignettes. Participants were later debriefed
about the manipulation and conditions of the study. The vignettes were collected
back before moving on to the next step.
Table 3. Steps of the Procedure for Neutral and Good Performance Vignette Conditions
Later, two distractor scales were administered to the participants, so that there was
a break between reading about the secretary’s performance and actual rating of her
performance by the participants. The participants were told that before answering
the questions about the performance vignette that they read, they were required to
fill out two more scales. The first distractor scale was the Positive and Negative
Step
Neutral Performance
Vignette Condition
Good Performance
Vignette Condition
1 Informed Consent Informed Consent
2 Core Self-Evaluations Scale Core Self-Evaluations Scale
3 Core External-Evaluations Scale Core External-Evaluations Scale
4 Neutral Performance Vignette Good Performance Vignette
5 Positive and Negative Affect
Schedule
Positive and Negative Affect
Schedule
6 Rosenberg Self-Esteem Scale Rosenberg Self-Esteem Scale
7 Graphic Rating Scale Graphic Rating Scale
8 Behavior Observation Scale Behavior Observation Scale
9 Debriefing Form Debriefing Form
Note: The 9 steps took a total of 40 minutes to complete.

48
Affect Schedule (PANAS) and the second one was Rosenberg Self-Esteem Scale
(RSES). Finally, the participants were requested to evaluate the performance of
Zeynep Özkan, using the two separate PAFs developed by the researcher, the GRS
and the BOS. The instruction was as follows:
“As a final step, I would like you to rate the performance of Zeynep
Özkan, whose performance has been described by her boss as you have
read, on the two different performance rating forms that I will pass
along”
The GRS formatted PAF was administered first, and the participants were required
to rate the performance of the secretary on the listed 9 performance dimensions.
The BOS formatted PAF was administered later, and it included the specific
behaviors to be rated in terms of frequency. After all of the forms were collected,
the participants were given a debriefing form about the aim of the study and their
questions were answered by the researcher.
In the following section, the results of a series of analyses to measure the reliability
and validity of the scales used in the study will be given. Secondly, the descriptive
statistics of the measures will be presented. Finally, the three hypotheses proposed
will be tested.
To test the first hypothesis, a series of one-way between subjects analysis of
variances (ANOVAs) will be conducted on the performance ratings given in the
neutral and good performance vignette conditions. Later, in order to control for the
effects of mood of the participants, a hierarchical regression analysis will be
conducted, where the positive and negative affect scores will be entered in the first
step and the CSES scores will be entered in the second step, with the GRS (or the
BOS) as the dependent variable. For the second hypothesis, the dimensional ratings
for each rater will be calculated, where the variables (i.e., the nine performance
dimensions in the GRS) are treated as cases and cases (i.e., the participants) are
treated as variables. Later, the ranks of average standard deviations of the ratings of

49
participants with high, low, and average CSEs will be compared with each other,
using the non-parametric Kruskal-Wallis test, by treating these standard deviations
as data points. This analysis will be repeated for the good performance vignette
condition, too. Finally, a moderated regression analysis will be done based on the
procedures specified by Aiken and West (1991) to test the third hypothesis. A
hierarchical regression will be conducted with the CSES and the CEES entered in
the first step and their interaction entered in the second step, with the GRS (or the
BOS) as the dependent variable. The moderated regression analyses will be
repeated with the positive and negative moods of the participants entered in the
first step, in order to control for the effects of mood.

50
CHAPTER III
RESULTS
3.1. Overview
This study aimed to analyze the effects of positive core self- and external-
evaluations on performance ratings. It was hypothesized that people with higher
self-evaluations as measured by the Core Self-Evaluations Scale (CSES) would
give higher ratings (i.e., show leniency) to a neutral performance example than
people with lower self-evaluations. It was also hypothesized that people with a
positive or a negative core self-evaluation would engage more in halo when giving
performance ratings, when compared to people with average CSEs. Furthermore,
core external-evaluations (CEE) were hypothesized to moderate the relationship
between CSE and performance ratings, meaning that people with higher CSE and
CEE are expected to give the most lenient ratings and people with lower CSE and
CEE are expected to give the most severe ratings.
As explained in the procedure section (See Section 2.3), the participants of this
study were firstly given the CSES and CEES, followed by two distractor scales,
namely the Positive and Negative Affect Schedule (PANAS) and the Rosenberg
Self-Esteem Scale. The participants were later assigned randomly to either the
good or the neutral vignette condition, in which they read the behavioral
performance descriptions of a departmental secretary. Finally, they were expected
to fill out two separate performance rating forms regarding the performance
vignette that they had read. This chapter includes the analyses conducted to

51
examine the relationships between core self- and external-evaluations and the
performance ratings given.
In the following sections of this chapter, first of all, analyses on the psychometric
properties of the performance rating forms used to evaluate the performance
vignettes (i.e., reliability and factor analyses) are presented. In this section, the
psychometric qualities of the Turkish versions of the Core Self- and External-
Evaluations Scales are also analyzed. Secondly, the descriptive statistics of the
measures used in the main study are given Finally, the results of the analyses
conducted to test the three hypotheses of the study as well as some additional
analyses, which are expected to help reveal some directions for future research, are
presented. The Statistical Package for Social Sciences version 13.00 was used in
analyzing the data in this study (SPSS Inc., 2004). LISREL 8.30 (Jöreskog &
Sörbom, 1999) was used for confirmatory factor analysis of the performance rating
forms.
3.2. Reliability Analysis and Factor Analysis
3.2.1. Reliability Analysis and Factor Analysis of Performance Rating Forms
In order to examine the psychometric qualities of the two performance rating
forms, a series of analysis were performed. Before the analyses, the data were
screened, and one missing variable in the eighth dimension of the GRS (i.e.,
“Professionalism”) was replaced by its mean. Reliability analysis conducted for the
GRS revealed high internal consistency (Cronbach’s alpha = .94). None of the
items caused a significant increase in alpha when they were omitted. Also, the
results of the factor analysis yielded a single factor solution, explaining 67.8% of
the variance. The factor loadings of the dimensions were high, with the minimum
being .52 (Dimension 3: “Knowledge of Instructions and Regulations”). Results of
this factor analysis are presented in Table 4.

52
Table 4. Loadings of the Items in the GRS on the Factor “Performance of the Secretary”
Items in GRS Factor Loading
9. General Performance .922
1. Planning and Organization .904
8. Professionalism .888
7. Problem Solving .868
2. Written Communication .850
5. Follow Up and Control .831
4. Technical Competence .779
6. Communication with the Students .773
3. Knowledge of Instructions and Regulations .524
As shown in Table 5, the analysis for the BOS yielded similar results. First, data
were screened and one missing item was replaced by its mean. The frequencies of
each item showed that the bogus items (i.e., items 4, 7, 8 and 13) were mostly rated
as 6 (Don’t have an idea), with the percentages of the items with a response of
“Don’t have an idea” ranging from 21.7% (item 4 = Represents her organization in
the best possible way) to 73.6% (item 8 = Willing to do teamwork), as expected.
Also, the frequencies of ratings of 6 given to other items ranged between 2.3% and
28.7%. These findings suggested that participants were successful in discriminating
between the bogus items and the behaviors actually included in the vignettes. The
reliability analysis revealed a good internal consistency (Cronbach’s alpha = .92),
and consistently high item-total correlations. Alpha did not rise with the deletion of
any item. The BOS also yielded one factor, which explained 54% of the total
variance. As seen in Table 8, the factor loadings were high, with a minimum of .54
(Item 6 = Knows the relevant instructions and regulations necessary to carry out
work). These findings show that both PAFs used in the study were highly
internally consistent and were best represented by a single Performance factor.
Although the analyses suggested a single factor solution for both the GRS and the
BOS, Borman and Motowidlo’s (1993) conceptualization shows that performance
on any job can be explained by contextual and task performance components. Task
performance can be defined as the effectiveness with which the employees

53
Table 5. Factor Loadings of the Items in BOS and Percentages of Participants that Chose
“6 = Do not have an idea” for each item.
Items in BOS
Percentage of
Response
Option 6
Factor
Loading
12. Utilizes written communication, according to the needs of
persons concerned. 9.3 .937
3. Determines the problems experienced on the job. 5.4 .934
15. Establishes priorities and carries tasks out without making
them interrupt each other. 28.7 .904
16. Understands, writes and interprets written information fully
and without any flaws. 21.7 .899
5. Does his/her job with strong awareness of his/her professional
responsibilities. 3.9 .895
2. Uses the computer programs relevant to her job effectively. 8.5 .888
10. Seeks, evaluates and implements alternative solutions to the
problems. 13.2 .873
1. Determines the required work in advance. 9.3 .868
14. Keeps the necessary distance with the people he/she interacts
with; does not personalize the problems experienced in work. 22.5 .853
9. Responds to students’ needs, by correctly informing them and
forming constructive relationships with them. 3.1 .835
11. Keeps a list of office supplies and other consumables
necessary for the department, determines the decreasing ones,
replaces them.
15.5 .797
6. Knows the instructions and regulations for executing the
relevant work. 2.3 .544
4. Represents her organization in the best possible way (Bogus
Item) 21.7
-
7. Willing to work extra time. (Bogus Item) 69 -
8. Willing to do teamwork. (Bogus Item) 73.6 -
13. Helps colleagues regarding work. (Bogus Item) 58.9 -
Note: The percentages are the percent of the response 6 = Do not have an idea given to each item. Bogus items were not included in the factor analysis, thus they do not have factor loadings.

54
perform the activities that contribute to the organization’s technical core, either
directly (by implementing its technical process) or indirectly (by providing the
necessary materials or services). Contextual performance, on the other hand,
includes the discretionary behaviors not formally required by any formal job, yet
those that help form the social context of all jobs (Borman & Motowidlo, as cited
in Borman & Motowidlo, 1997). The performance dimensions and behaviors
defined in both the GRS and the BOS may also be differentiated according to this
conceptualization. In order to understand which performance dimensions and
behaviors in the GRS and the BOS could be examined under task performance and
which ones can be considered contextual performance indicators, five subject
matter experts (SMEs) (i.e., five research assistants from the Department of
Business Administration in Middle East Technical University) were given short
definitions of task and conceptual performance (Jawahar & Carr, 2007). After they
read the definitions, they were asked to indicate whether each item in the GRS and
the BOS could be classified as a component of task or contextual performance of a
departmental secretary. The responses of each SME for the items in the GRS and
the BOS were examined, and they were classified as “task” or “contextual”
performance indicators according to whether they were rated as task or contextual
by the majority (i.e., by more than 50%) of the SMEs.
According to the classification of the majority of the SMEs, the first four
performance dimensions in the GRS (i.e., Planning and Organization, Written
Communication, Knowledge of Instructions and Regulations, and Technical
Competence) were categorized as indicators of task performance, and the latter
four dimensions (i.e., Follow Up and Control, Communication with the Students,
Problem Solving, and Professionalism) were categorized as indicating contextual
performance. A confirmatory factor analysis (CFA) was done by using LISREL
8.30 (Jöreskog & Sörbom, 1999) to see whether a two factor model that was
composed of the above defined factors was better than a single factor model that
emerged in the exploratory factor analysis. The analysis was done using the
covariance matrix of the eight performance dimensions that made up the GRS. The
covariance matrix was used instead of a correlation matrix, as it gives the

55
standardized values of the relationships between items. When the two-factor model
is compared to the one-factor model, it was seen that the additional parameter did
not cause a significant increase in the fit of the model (i.e., the change in χ2 for 1
degree of freedom (df) did not exceed the critical χ2 value at p = .05), because the
chi-squared values did not drop significantly with the addition of the second factor.
Thus, the one-factor model that represents the general performance of the secretary
can be used for the GRS, which showed a good fit to the data, χ2(20, N = 129) =
22.302, RMSEA = .031, RMR = .04, CFI = .997, GFI = .958, AGFI = .925, NFI =
.97, NNFI = .995.
The performance behaviors defined in the BOS were also categorized into two
factors by the SMEs. According to their categorization, items 2 (“Uses the
computer programs relevant to her job effectively”), 6 (“Knows the instructions
and regulations for executing the relevant work”), 11 (“Keeps a list of office
supplies and other office supplies necessary for the department, determines the
needed ones, replaces them”), 12 (“Utilizes written communication, according to
the needs of persons concerned”), 15 (“Establishes priorities and carries tasks out
without making them interrupt each other”) and 16 (“Understands, writes and
interprets written information fully and without any flaws”) were considered as
task performance indicators of a secretary’s performance, whereas items 1
(“Determines the required work in advance”), 3 (“Determines the problems
experienced on the job”), 5 (“Does his/her job with strong awareness of his/her
professional responsibilities”), 9 (“Responds to students’ needs, by correctly
informing them and forming constructive relationships with them”), 10 (“Seeks,
evaluates, and implements alternative solutions to the problems”) and 14 (“Keeps
the necessary distance with the people he/she interacts with; does not personalize
the problems experienced in work”) were considered as components of contextual
performance. A CFA was done to analyze whether a two-factor solution was better
than the one-factor solution indicated by the exploratory factor analysis. When the
fit statistics of the one-factor model is compared to the two-factor model, as Table
6 shows, it was seen that the change in the χ2 value for 9 df (i.e., the df of the one-
factor model subtracted from the df of the two-factor model) was greater than the

56
critical value for p = .05, thus the two factor model showed a significantly better fit
to the data over the one-factor model. This meant that the BOS could be used as a
two-factor scale that distinguishes between task and contextual performance. Thus,
a decision was made to treat the BOS as a two-factor scale representing task and
contextual performance in the following analyses.
Table 6. Goodness of fit statistics of one-factor and two-factor solutions for the Behavior
Observation Scale.
df χχχχ2 RMSEA RMR CFI GFI AGFI NFI NNFI
1-factor 44 79.38 .071 .041 .967 .907 .860 .929 .959
2-factor 53 103.47 .083 .043 .959 .885 .831 .919 .948
Note: GRS = Graphic Rating Scale, BOS = Behavior Observation Scale. The minimum and maximum scale points for each variable: GRS: 1 = Poor, 5 = Very successful; BOS: 1 = Never, 5 = Always.
When the two factors of the BOS were analyzed for reliability, it was seen that
both the task and the contextual performance factors showed high internal
consistency. The first factor, task performance, which consisted of the items 2
(“Uses the computer programs relevant to her job effectively”), 6 (“Knows the
instructions and regulations for executing the relevant work”), 11 (“Keeps a list of
office supplies and other office supplies necessary for the department, determines
the needed ones, replaces them”), 12 (“Utilizes written communication, according
to the needs of persons concerned”), 15 (“Establishes priorities and carries tasks
out without making them interrupt each other”) and 16 (“Understands, writes and
interprets written information fully and without any flaws”) had a Cronbach’s
alpha of .89, and the item-total correlations were high. For the second factor,
contextual performance, which consisted of the items 1 (“Determines the required
work in advance”), 3 (“Determines the problems experienced on the job”), 5
(“Does his/her job with strong awareness of his/her professional responsibilities”),
9 (“Responds to students’ needs, by correctly informing them and forming
constructive relationships with them”), 10 (“Seeks, evaluates, and implements
alternative solutions to the problems”) and 14 (“Keeps the necessary distance with
57
the people he/she interacts with; does not personalize the problems experienced in
work”); showed a very high internal consistency, with a Cronbach’s alpha of .92,
and the item-total correlations were consistently high. Thus, both subscales were
reliable enough to be used separately in the analyses.
3.2.2. Reliability Analysis and Factor Analysis of Core Self- and External-
Evaluations Scales
3.2.2.1. The Turkish Version of the Core Self-Evaluations Scale: Reliability
and Factor Analysis
The Turkish version of the Core Self-Evaluations Scale (CSES) was analyzed for
internal consistency and factor structure (See Appendix A). Prior to the analyses,
the normality and the linearity of the variable were tested. The histogram and P-P
plot revealed that the variable was normally distributed and the scatterplot showed
that the linearity assumption was confirmed. Cronbach’s alpha based on
standardized items was found to be .84. Item-total correlations were in general
high, except items 3 (“When I try, I generally succeed) (.34) and 5 (“I complete
tasks successfully”) (.35). Alpha was not increased following the deletion of any
item. These findings are consistent with the results found for the Turkish version of
the CSES in another study (Kisbu, 2006), and the results reported for the original
scale by Judge et al. (2003).
The CSES was factor analyzed using principal components analysis with varimax
rotation. The factor analysis of the CSES yielded 3 factors that explained 57.3% of
the total variance. As seen in Table 7, the rotated component matrix showed four of
the items had cross loadings. However, when the items that loaded on different
factors were examined, it was seen that the resulting solution was difficult to
interpret and did not make sense. Thus, a decision was made to treat the scale as a
unidimensional one. The results of this factor analysis are somehow not consistent
with the other findings from Turkey. For example, Kisbu (2006) found that the
Turkish version of the CSES again yielded 3 factors. However, she was able to

58
differentiate these three factors as negatively worded items, positively worded
items, and items 1 and 9.
Table 7. Factor Loadings of Items in CSES
Items in CSES Factor 1 Factor 2 Factor 3
12. There are times when things look pretty bleak and
hopeless to me (r). .778
2. Sometimes I feel depressed (r). .725
4. Sometimes when I fail I feel worthless (r). .667
9. I determine what will happen in my life. .653 .426
3. When I try, I generally succeed. .787
11. I am capable of coping with most of my problems. .717
7.Overall, I am satisfied with myself. .550 .391
10. I do not feel in control of my success in my career
(r). .537
8. I am filled with doubts about my competence (r). .407 .454
5. I complete tasks successfully. .743
1. I am confident I get the success I deserve in life. .703
6. Sometimes, I do not feel in control of my work (r). .402 .631
Note: CSES = Core Self-Evaluations Scale. Reversed items are indicated with an “r” in parentheses. Only factor loadings above .30 are shown.
3.2.2.2. Reliability of the Turkish Version of the Core External-Evaluations
Scale
To our knowledge, reliability information about the Turkish version of the Core
External-Evaluations Scale (CEES) is not present. Thus, an analysis of reliability
was done on the CEES. Prior to the analyses, normality and linearity were checked.
The P-P plot and the histogram drawn for the reliable revealed that the normality
assumption was met, and the scatterplot indicated linearity. Firstly, the items 1
(“Most people will tell a lie if they gain by it”), 2 (“People claim to have ethical
standards regarding honesty and morality, but few stick to them when money is at
stake”), 3 (“People pretend to care more about one another than they really do”), 4

59
(“Most people are not really honest by nature”), 8 (“Most people suffer through
absolutely no fault of their own”), 9 (“The world is just not fair”), and 11 (“Sooner
or later people will hurt you”) were reversed (See Appendix B). The Cronbach’s
alpha for the scale was at an acceptable level (.76). Item 5 (“By and large, people
deserve what they get”) was found to have a low item-total correlation (.14) and
the alpha was raised to .78 when the item was deleted. However, as the increase
was not dramatic, the scale can be used in its full form in Turkish.
3.3. Descriptive Statistics
The main study included individual differences measures of the Core Self-
Evaluations Scale (CSES), the Core External-Evaluations Scale (CEES), the
Positive and Negative Affect Schedule (PANAS) and the Rosenberg Self-Esteem
Scale (RSES). Two of these measures, the CSES and CEES were used in testing
the main hypotheses and the PANAS was used as a control variable as well as for
exploratory purposes. The RSES was not included in the study as a control
variable, as self-esteem is a component of CSE. Two performance appraisal forms
(PAFs) were used in the study to measure the performance of the secretary
depicted in the vignettes. These measures were used as dependent variables in the
hypotheses testing part. In the following section, the descriptive statistics for all the
measures included in this study are presented.
3.3.1. Descriptive Statistics for the Individual Differences Measures Used
The individual differences variables of core self-evaluations, core external-
evaluations, positive and negative affect, and self-esteem were measured by using
the relevant scales. Later, an average value for each scale were formed by first
recoding the reverse items in each scale (except for the PANAS which included 10
negatively and 10 positively worded items), replacing the missing values with
series mean (as the maximum number of missing values was 2 for each item, which
is a very low percentage), and computing the mean of the items in each scale for
each subject. The analyses were conducted on the data received from 129

60
participants. The descriptive statistics of individual differences variables are
presented in Table 8.
Table 8. Descriptive Statistics of the Measures Used in the Main Study.
Mean Median SD Range Skewness Kurtosis
Neutral Performance Vignette
CSES 3.46 3.50 .522 2.40 -.032 -.031
CEES 3.07 3.00 .443 2.17 .238 .222
PANAS
Positive 3.33 3.44 .655 2.67 .088 -.777
Negative 2.54 2.44 .741 3.56 .705 .510
RSES 4.13 4.20 .598 2.80 -.925 .993
Good Performance Vignette
CSES 3.21 3.20 .595 2.80 -.191 -.070
CEES 2.89 2.92 .506 2.75 -.434 .936
PANAS
Positive 3.16 3.11 .633 2.67 .087 -.727
Negative 2.61 2.56 .656 3.44 .467 .952
RSES 3.84 3.80 .720 3.70 -1.005 2.368
Note: CSES = Core Self-Evaluations Scale, CEES = Core External Evaluations Scale, PANAS = Positive and Negative Affect Schedule, Positive = Positive Affect Items in PANAS, Negative = Negative Affect Items in PANAS, RSES = Rosenberg Self-Esteem Scale. The minimum and maximum scale points for each variable: CSES, CEES, RSES: 1 = Strongly disagree, 5 = Strongly agree; PANAS: 1 = Very slightly or not at all, 5 = Extremely.
As can be inferred from Table 8, the participants had medium levels of self and
external evaluations, and a relatively high level of self-esteem. In the Judge et al.
(2003) study, the mean of responses to CSES was found to be between 3.78 (SD =
.50) and 4.03 (SD = .58) for different samples. Thus, it can be said that the Turkish
sample seemed to have lower CSES than the American sample in general.
Responses to the scales were found to have skewness and kurtosis values that were
within the critical values.

61
3.3.2. Descriptive Statistics for the Performance Rating Forms
After the participants read the performance vignettes (either good or neutral), and
after they completed the two distractor scales, they were required to evaluate the
performance of the secretary using a Graphic Rating Scale (GRS) and a Behavioral
Observation Scale (BOS). The average score for the GRS was found simply by
adding the ratings given to each performance dimension for each respondent and
dividing the total value by the number of performance dimensions. However, the
computation of the average score for the BOS was different, as the BOS included
bogus items (4 = “Represents her organization in the best possible way”, 7 =
“Willing to work extra time”, 8 = “Willing to do teamwork”, and 13 = “Helps
colleagues regarding work”), which should not be included in the general score.
The scale also included a response option of “6 = Do not have an idea.” If any item
that was included in the analysis (i.e., that was not a bogus item) had a value of 6,
the response to that item was assumed to be missing and thus mean replacement
was applied. The descriptive statistics of the two performance appraisal forms in
two different conditions (good performance vignette and neutral performance
vignette conditions) are presented in Table 9. A one-way ANOVA conducted to
see whether the mean performance ratings given on both the GRS and the BOS
were significantly different from each other in the neutral and positive performance
vignette conditions revealed significant mean differences for both the ratings on the
GRS (F (1, 127) = 363.31, p < .001) and the BOS (F (1, 127) = 240.99, p < .001).
Thus, the good and neutral performance vignette conditions can be said to differ
significantly from each other in terms of the performance impression created.
The correlations among the study variables and the demographic variables were
examined to understand which individual difference and demographic variables
were related with performance ratings (See Table 10 and 11). It can be seen that
core self-evaluations were positively and significantly correlated with core
external-evaluations, positive affect, and self-esteem; and negatively and
significantly correlated with negative affectivity in both positive and neutral
performance examples. The CSEs were not significantly correlated with either of

62
Table 9. Descriptive Statistics for the Performance Rating Forms Filled Out for the Good
and Neutral Performance Vignettes.
Mean Median SD Range Skewness Kurtosis
Neutral Performance Vignette
GRS 2.74 2.67 .518 2.44 -.10 .08
BOS 2.95 2.83 .638 3.67 .61 1.93
Good Performance Vignette
GRS 4.37 4.44 .446 2.22 -.86 1.26
BOS 4.35 4.36 .350 1.47 -.15 -.52
Note: GRS = Graphic Rating Scale, BOS = Behavior Observation Scale. The minimum and maximum scale points for each variable: GRS: 1 = Poor, 5 = Very successful; BOS: 1 = Never, 5 = Always.
the two types of PAFs in both neutral and good vignette situations. CEEs were
significantly related with positive affect, negative affect, and self-esteem in the
good performance condition, and again were not related with either type of ratings
in either condition.
Table 10. Correlations among Demographic Variables and Study Variables for Neutral
Performance Vignette
Variables 1 2 3 4 5 6 7 8 9
CSES 1.000
CEES 0.318* 1.000
PA 0.337** 0.127 1.000
NA -0.456** -0.102 -0.428** 1.000
RSES 0.557** -0.015 0.468** -0.448** 1.000
GRS -0.073 -0.109 0.325** 0.174 0.045 1.000
BOS -0.040 -0.067 0.170 -0.018 0.141 0.518** 1.000
AGE -0.227 -0.012 -0.210 0.135 -0.303* 0.032 0.002 1.000
GENDER 0.060 -0.024 0.297* -0.235 0.348** -0.081 0.135 -0.147 1.000
Note: CSES = Core Self-Evaluations Scale, CEES = Core External Evaluations Scale, PA = Positive Affect (From PANAS), NA = Negative Affect (From PANAS), RSES = Rosenberg Self-Esteem Scale. The minimum and maximum scale points for each variable: CSES, CEES, RSES: 1 = Strongly disagree, 5 = Strongly agree; PANAS: 1 = Very slightly or not at all, 5 = Extremely. Gender: 1 = Male, 2 = Female. **p < .01, *p < .05

63
Positive and negative affectivity scores derived from the PANAS were negatively
and significantly correlated with each other in both the good and neutral
performance vignette conditions. Self-esteem was also significantly correlated with
these two constructs, positively with positive affect and negatively with negative
affect. Importantly, positive affectivity was significantly positively correlated with
the GRS ratings in the neutral performance vignette condition, suggesting that
people in a positive mood were more likely to give higher ratings to neutral
performance. The BOS and the GRS were correlated positively and significantly in
both conditions. Finally, gender was found to be significantly and positively related
with self-esteem in the neutral performance vignette condition. The average self-
esteem score of women ( X = 4.31) was indeed higher than that of men ( X =
3.89). Further analyses of one-way ANOVA revealed that these two means were
significantly different from each other in the neutral performance vignette
condition (F (1,61) = .8.38, p < .005).
Table 11. Correlations among Demographic Variables and Study Variables for Good
Performance Vignette
Variables 1 2 3 4 5 6 7 8 9
CSES 1.000
CEES 0.522** 1.000
PA 0.432** 0.302* 1.000
NA -0.463** -0.490** -0.422** 1.000
RSES 0.807** 0.499** 0.565** -0.543** 1.000
GRS -0.036 -0.141 -0.003 -0.035 0.009 1.000
BOS -0.044 -0.114 0.066 -0.092 -0.010 0.632** 1.000
AGE 0.026 0.000 0.098 0.130 -0.025 0.172 0.206 1.000
GENDER 0.020 0.178 0.115 -0.295* -0.019 -0.018 0.100 -0.210 1.000
Note: CSES = Core Self-Evaluations Scale, CEES = Core External Evaluations Scale PA = Positive Affect (From PANAS), NA = Negative Affect (From PANAS), RSES = Rosenberg Self-Esteem Scale. The minimum and maximum scale points for each variable: CSES, CEES, RSES: 1 = Strongly disagree, 5 = Strongly agree; PANAS: 1 = Very slightly or not at all, 5 = Extremely. Gender: 1 = Male, 2 = Female. **p < .01

64
3.4. Hypotheses Testing
As previously presented in Tables 10 and 11, respectively, the bivariate correlations
of the study variables were taken separately for the positive and neutral
performance vignettes. According to the correlations in the neutral performance
vignette condition, the CSES was not significantly correlated with the performance
measures (r GRS = -.073, ns; r BOS = -.040, ns). The CEES was not significantly
correlated with either of the PAFs (r GES = -.109, ns; r BOS = -.067, ns) in the neutral
performance vignette condition. As for the good performance vignette condition,
again none of the correlations between the CSES and the PAFs (r GRS = -.036, ns; r
BOS = -.044, ns) or the CEES and the PAFs (r GRS = -.141, ns; r BOS = -.114, ns) were
significant. According to these findings, contrary to the expectations, ratings people
gave to neutral or good performance were irrespective of the type of their self-
evaluations. However, further analyses are required to see whether the hypotheses
are in fact falsified.
Our first hypothesis in the study was that people with high core self-evaluations
would be more lenient in rating performance than people with low core self-
evaluations. A series of one-way between subjects analysis of variances (ANOVAs)
was conducted on the performance ratings given in the neutral and good
performance vignette conditions, in order to see whether the performance ratings
given by participants with high CSE scores differed significantly from those given
by participants with low CSE scores. In the first analysis, the independent variable
was the CSE scores (low vs. high) of the participants that read the neutral
performance vignette. The scores were divided into two categories, where the first
category was the people with the lowest core self-evaluation scores (i.e., who are in
the 25th percentile) and second category consisted of the ratings of people with the
highest CSE scores (i.e., 75th percentile). The dependent variable was the
performance ratings given (using either the GRS or the BOS, where the BOS was
analyzed separately for “task” and “contextual” performance). When the mean
performance ratings that the two groups gave were compared for the neutral
performance vignette, no significant difference between the means of their ratings

65
on the GRS (F (1, 34) = .34, ns), task performance (F (1, 34) = .96., ns) or
contextual performance (F (1, 34) = .07, ns) were found. The same analysis was
done with the CSE scores of the participants in the good performance condition.
The mean performance ratings that people within the lowest 25th percentile of CSE
scores and people with the highest 25th percentile (i.e., 75th percentile) were also
compared using ANOVA, and as Table 12 shows, their performance ratings did not
significantly differ from each other neither for the GRS (F (1, 32) = .01, ns) nor for
the task or contextual performance components of BOS (F (1, 32) = .83, ns; F (1,
32) = .15, ns).
Table 12. Mean Comparison of Performance Ratings Given by Participants with High
versus Low Core Self-Evaluations
F Sig. Df
Mean
Difference
Neutral
GRS .343 .562 34 .98
BOS
Factor 1 .956 .335 34 .22
Factor 2 .067 .798 34 .58
Good
GRS .014 .908 32 .16
BOS
Factor 1 .828 .370 32 .11
Factor 2 .151 .701 32 .56
Note: GRS = Graphic Rating Scale, BOS = Behavior Observation Scale, Factor 1 = Task Performance, Factor 2 = Contextual Performance.
Although the ANOVAs did not show the expected significant mean differences
between the performance ratings given by people with high and low CSEs in the
good or neutral performance conditions, the effects of the mood of the participants
during the performance rating process should also be controlled, as the literature
suggests substantial mood influence on performance ratings (e.g., Williams &
Keating, 1987). In order to control for the effects of mood (i.e., state affect) of the

66
participants, a hierarchical regression analysis was conducted. For the neutral
performance condition, the positive and negative affect scores of the participants
were entered in the first step, and the CSES scores were entered in the second step,
with the GRS as the dependent variable. As shown in Table 13, the results indicated
that the positive mood of the participants entered in the first step (R2 = .107, F inc (2,
60) = 3.61; p < .05) made a significant contribution to the regression equation (β =
.243, p < .05). The CSEs of the participants, after their moods are controlled (R2
change = .050, F inc (1, 59) = 3.49, p < .07), caused a marginally significant change
in the R2 (β = -.253, p < .07). However, the sign of the relationship between
performance ratings given on the GRS and the CSEs of the participants was
negative, after the effect of mood was controlled for. Thus, contrary to the
expectations, participants with a higher CSE tended to give marginally lower ratings
to neutral performance, when their mood at the time of giving ratings was
controlled.
Table 13. Results of Hierarchical Regression Analysis Conducted on the GRS as the
Dependent Variable, for the Neutral Performance Vignette Condition.
R2 change F change β SE of β t Sig.
F p
Step 1 .107 3.61 .033
PA .243 .107 2.273 .027
NA -.030 .094 -.318 .751
Step 2 .050 3.49 .067
PA .277 .106 2.612 .011
NA -.098 .099 -.956 .328
CSES -.253 .135 -1.868 .067
Note: GRS = Graphic Rating Scale, PA = Positive Affect, NA = Negative Affect, CSES = Core Self-Evaluations Scale.
A hierarchical regression analysis was also conducted for the BOS as the dependent
variable with the positive and negative mood scores of the participants entered in
the first step of the regression. The analysis done for the neutral performance

67
vignette condition showed that neither the task performance nor the contextual
performance components of the BOS caused a significant increment in the
explained variance. The positive and negative moods of the participants (R2 = .020,
F inc (2, 60) = .607; ns) and their CSEs (R2 change = .012, F inc (1, 59) = .744; ns)
failed to make a significant contribution to the regression equation, with the task
performance ratings as the dependent variable. Similar results were found for the
contextual performance, where neither mood (R2 = .043, F inc (2, 63) = .157; ns) nor
the CSEs (R2 change = .012, F inc (1, 62) = .727; ns) of the participants made a
significant contribution to the regression equation.
The same analyses were repeated for the good performance vignette condition with
the GRS and the BOS. With the GRS as the dependent variable, no significant
effect of the mood entered in the first step (R2 = .001, F inc (2, 63) = .043; ns) and
the CSEs entered in the second step (R2 change = .001, F inc (1, 62) = .048; ns) were
found. Again, no significant contributions of the mood and the CSEs of the
participants were found for the regression equations in the good performance
vignette condition, with the task or the contextual performance components of the
BOS as the dependent variables.
To test the first hypothesis, a one-way between subjects ANOVA was also
conducted on the CEES scores of participants, to see whether the performance
ratings given by participants with high versus low core external evaluations differed
significantly from each other, in the good and neutral performance conditions. The
participants were again divided into two categories according to their CEE scores,
the first category being the lowest 25th percentile and the second category being the
75th percentile. The CEES scores of participants in the neutral performance vignette
condition did not have any significant effects on performance ratings given on GRS
(F (1,31) = .07, ns) or the task (F (1,31) = .02, ns) and contextual performance (F
(1,31) = .41, ns) factors of BOS performance rating forms (See Table 12).
When the analyses were repeated for the participants in the positive performance
vignette condition, the ratings given in the GRS (F (1,31) = .26, ns) or for the two

68
factors of BOS (F (1,31) = .40, ns; F (1,31) = .13, ns) did not differ significantly
according to the CEES scores of participants. These results suggested that, the level
of CEE scores of participants did not have a significant effect on the performance
ratings they gave on the GRS or the BOS, in neither the neutral nor the good
performance vignette condition. When the effects of PA and NA were controlled
with the help of a hierarchical regression analysis where the GRS was the
dependent variable, it was seen that although the effect of positive affect entered in
the first step was significant (F (2, 60) = 3.61, p < .05), the CEE scores entered in
the second step did not make any significant contributions to the regression
equation. The other analyses revealed that controlling for the effects of mood did
not cause a significant change in the variance explained, with the BOS as the
dependent variable or in the good performance vignette condition. Mood also did
not have a significant effect on the performance rating forms in either of the cases.
Table 14. Mean Comparison of Performance Ratings Given by Participants with High
versus Low Core External-Evaluations
F Sig. df
Mean
Difference
Neutral
GRS .074 .788 31 .55
BOS
Factor 1 .018 .895 31 -.03
Factor 2 .413 .525 31 -.14
Good
GRS .260 .614 31 .90
BOS
Factor 1 .401 .531 31 .90
Factor 2 .129 .721 31 -.06
Note: Good = Good Performance Vignette Condition, Neutral = Neutral Performance Vignette Condition, GRS = Graphic Rating Scale, BOS = Behavior Observation Scale, Factor 1 = Task Performance, Factor 2 = Contextual Performance

69
According to the analyses above, the first hypothesis of the study, which stated that
people who have a positive self-concept (i.e., score high on the CSES and/or the
CEES) would give higher ratings to (i.e., be lenient for) neutral performance than
people with a negative core self-evaluation, was not supported, and even a negative
association was observed between the CSEs and performance ratings in the neutral
performance vignette condition with the GRS ratings as the dependent variable,
when the effects of mood was controlled.
The second hypothesis of the study was that people with high and low levels of core
self-evaluations would engage in halo more when rating performance than people
with average levels of core self-evaluations. In order to test this hypothesis, the
interdimensional standard deviations for each rater were calculated and these
standard deviations were averaged over raters. For the calculation of the
dimensional ratings for each rater, the variables (i.e., the nine performance
dimensions in the GRS) were treated as cases and cases (i.e., the participants) were
treated as variables. Thus, the relevant variables and cases were transposed in SPSS.
The ranks of average standard deviations of the ratings of participants with high,
low, and average CSEs were compared with each other, using the non-parametric
Kruskal-Wallis test, by treating these standard deviations as data points.
The average standard deviation of the ratings given on the GRS for the participants
with low CSEs was .656, neutral CSEs was .658, and it was .714 for the participants
with high CSEs. When the average standard deviations of the ratings given by
participants with high, low and neutral CSEs were compared using the Kruskal-
Wallis non-parametric test in the neutral condition, no significant difference
emerged among the mean ranks of the standard deviations of three groups (χ2 (2, N
= 63) = .331, ns). When the same analysis was repeated for the CEEs of the
participants, it was seen that the average standard deviation of the ratings given on
the GRS for participants with low CEEs (N= 18) was .711, with average CEEs (N=
27) was .671, and with high CEEs (N = 18) was .649. When these standard
deviations were compared using the Kruskal-Wallis test, the mean ranks of the three
70
groups were not found to be significantly different from each other (χ2 (2, N = 63) =
.887, ns).
Although it was not hypothesized, for exploratory purposes, the average standard
deviations for the good performance vignette condition were also calculated.
Participants with low CSEs (N = 20) had an average standard deviation of ratings of
.585, ratings of participants with high CSEs (N = 21) had an average standard
deviation of .642, and those of participants with average CSEs (N= 25) was .784. A
Kruskal-Wallis non-parametric test conducted on the standard deviations of ratings
given by participants in the good performance vignette condition indicated that the
mean ranks of the standard deviations of the ratings of participants on the
dimensions of GRS were marginally significantly different from each other (χ2 (2,
N = 66) = 5.317, p < .07). The post hoc analysis revealed that standard deviations of
the performance ratings of participants with average CSEs differed from that of
participants with low and high CSEs. Thus, it can be stated that, participants with an
average CSE engaged less in halo (as the standard deviation of ratings is higher)
while rating performance, compared to participants with both high or low levels of
CSEs, for the good performance vignette condition, indirectly supports Hypothesis
2.
To test the third hypothesis, a moderated regression analysis was done based on the
procedures specified by Aiken and West (1991). It was hypothesized that core
external-evaluations would moderate the link between core self-evaluations and the
performance ratings given. To test the hypothesis, first, the independent variable
(i.e., core self-evaluations) and the moderator variable (i.e., core external-
evaluations) were centered, by subtracting their mean values from the variables.
This centering was done separately for each condition (i.e., the positive and the
neutral performance vignette condition), and the mean values of the CSE and the
CEE were computed separately for the positive and neutral performance vignette
conditions. Later, an interaction term was created by multiplying the two centered
variables, again separately for the neutral and positive performance vignette
conditions. A hierarchical regression was conducted, where the centered values of

71
core self-evaluations and core external-evaluations were entered in the first step,
and their interaction term was entered in the second step. Tables 15, 16 and 17
present the findings.
For the neutral performance vignette condition, firstly, the GRS was taken as the
dependent variable. Analyses revealed that neither the centered CSE and CEE
scores entered in the first step (R2 = .01, ns) nor the interaction term entered in the
second step (R2 change = .02, ns) contributed significantly to the regression
equation. Thus, participants’ level of CEE cannot be said to moderate the
relationship between their CSE levels and the performance ratings they give on the
GRS in the neutral performance vignette condition.
Table 15. Results of Moderated Regression Analysis Conducted on the Task Performance
Component of BOS as the Dependent Variable.
R2 change F change β SE of β t Sig.
F p
Neutral
Step 1 .011 .320 .727
CSES -.079 .184 -.431 .668
CEES -.109 .217 -.502 .618
Step 2 .020 1.221 .274
CSES -.088 .184 -.477 .635
CEES -.151 .220 -.686 .496
Interaction -.445 .403 -1.105 .274
Good
Step 1 .027 .866 .426
CSES -.003 .093 -.031 .975
CEES -.121 .109 -1.106 .273
Step 2 .000 .010 .919
CSES -.002 .095 -.018 .986
CEES -.119 .113 -1.047 .299
Interaction .015 .114 .102 .919
Note: BOS = Behavior Observation Scale, CSES = Core Self-Evaluations Scale, CEES = Core External Evaluations Scale, Interaction = Interaction term of CSES and CEES

72
The same analysis was repeated for the two sub-factors of the BOS as the dependent
variables. For the task performance component, the centered CSE and CEE scores
were entered in the first step (R2 = .01, ns) and the interaction term entered in the
second step (R2 change = .02, ns). For the contextual performance factor, neither the
CSE and the CEE scores that were entered in the first step (R2 = .00, ns), nor the
interaction term entered in the second step (R2 change = .02, ns) caused a significant
change in the R2. The interaction of the CSE and CEE did not make a significant
contribution to the regression equation. Thus, CEE cannot be said to moderate the
relationship between CSE and performance ratings in the neutral performance
vignette condition using the BOS as the dependent variable.
Table 16. Results of Moderated Regression Analysis Conducted on the Contextual
Performance Component of BOS as the Dependent Variable.
R2 change F change β SE of β T Sig.
F P
Neutral
Step 1 .002 .053 .948
CSES .027 .168 .162 .872
CEES -.063 .198 -.320 .750
Step 2 .018 1.099 .299
CSES .020 .168 .119 .906
CEES -.100 .201 -.496 .622
Interaction -.386 .368 -1.049 .299
Good
Step 1 .003 .096 .908
CSES .028 .100 .281 .780
CEES -.051 .118 -.434 .666
Step 2 .001 .077 .783
CSES .032 .102 .311 .757
CEES -.044 .122 -.358 .722
Interaction .044 .159 .277 .783
Note: BOS = Behavior Observation Scale, CSES = Core Self-Evaluations Scale, CEES = Core
External Evaluations Scale, Interaction = Interaction term of CSES and CEES.

73
For the positive performance vignette condition, similar results were found. For the
GRS as the dependent variable, the interaction term entered in the second step (R2
change = .061, ns) did not cause a significant change in the regression equation.
When the task and contextual factors of the BOS performance rating form were
taken as the dependent variables, the moderated regression analysis showed no
significant main (R task 2 = .03, ns; R contextual
2 = .00, ns) or interaction effects (R task
2
change = .000, ns; R contextual 2 change = .001, ns).
Table 17. Results of Moderated Regression Analysis Conducted on GRS as the Dependent
Variable.
R2 change F change β SE of β T Sig.
F p
Neutral
Step 1 .014 .412 .664
CSES -.042 .134 -.312 .756
CEES -.112 .158 -.708 .481
Step 2 .019 1.141 .290
CSES -.048 .134 -.356 .723
CEES -.141 .160 -.883 .381
Interaction -.314 .294 -1.068 .290
Good
Step 1 .022 .699 .501
CSES .038 .110 .349 .728
CEES -.148 .129 -1.146 .256
Step 2 .040 2.623 .110
CSES .060 .109 .552 .583
CEES -.100 .130 -.767 .446
Interaction .276 .170 1.620 .110
Note: GRS = Graphic Rating Scale, CSES = Core Self-Evaluations Scale, CEES = Core External
Evaluations Scale, Interaction = Interaction term of CSES and CEES.
In order to understand whether the CEEs moderated the relationship between CSEs
and the performance ratings given after the moods of the participants at the time of

74
the ratings, the moderated regression analyses were repeated with the positive and
negative moods of the participants entered in the first step. For the neutral
performance vignette condition, and with the GRS as the dependent variable, the
results showed that controlling for the moods of the participants did not cause a
significant increase in the variance explained by the interaction term (R2 change
=.020, ns). Controlling the mood of the participants (i.e., entering PA and NA as the
first step) did not cause the centered CSEs, CEEs and the interaction term to make a
significant contribution to the regression equation in the good performance vignette
or with the BOS as the dependent variable. These findings suggest that the CEE did
not have a moderator effect on the relationship between CSE and performance
given, whether the ratings were given for the neutral or positive performance
vignette, whether the GRS or the BOS (task or contextual performance factors) was
used for rating purposes, and whether you control for the effects of mood. Thus, the
study’s third hypothesis was not supported.
To summarize in general, the analyses conducted failed to support the three
hypotheses of the study. Contrary to the expectations, CSEs had a negative
relationship with ratings given using a GRS after the effect of mood (especially PA)
are controlled for.

75
CHAPTER IV
DISCUSSION
4.1. Overview of the Findings
The present study aimed to investigate whether performance ratings for neutral
performance, given by people with higher core self- and external-evaluations were
more lenient and contained more halo than those given by people with lower core
self- and external-evaluations. It was also hypothesized that core external-
evaluations (CEEs) would moderate the link between core self-evaluations (CSEs)
of the participants and the performance ratings they give for neutral performance;
such that, people with higher CSEs who also had a high level of CEEs would be
most likely to give higher performance ratings for neutral performance.
The results showed that the CSEs did not have a significant effect on the
performance evaluations given. When the mood of the participants were controlled,
contrary to the first hypothesis, people with high core self-evaluations tended to
give lower ratings to neutral performance, with the GRS as the performance rating
form. This finding is somehow surprising, as the literature suggested the opposite,
where people with positive affectivity would show more leniency in their ratings
compared to people with negative affectivity (e.g., Robbins & DeNisi, 1998). For
the second hypothesis, the ANOVAs conducted for the standard deviation of the
performance ratings showed that the performance ratings given by people with
higher, lower, and average levels of core self-evaluations did not differ
significantly from each other, in the neutral performance vignette condition.
However, the exploratory analyses done on the good performance vignette showed

76
that the standard deviations of the performance ratings of the participants with
average CSEs were higher than that of the participants with high and low CSEs.
Thus, performance ratings of the raters with average CSEs tended to include a
lower level of halo than participants with low or high CSEs, providing some
support for the hypothesis. This finding is in line with the literature, which suggests
that people with positive and negative affect showed more halo in their ratings,
compared to people who were neutral (Tsui & Barry, 1986). Finally, CEEs were
not found to moderate the relationship between CSEs and the performance ratings
given, even when the mood of the participants were controlled.
In the following sections, first of all, plausible explanations regarding the failure of
the hypotheses of the study shall be discussed. Secondly, the strengths and
limitations of the study are presented. Finally, some suggestions for future research
are made.
4.2. Plausible Explanations for the Failure to Support the Hypotheses of the
Study
The first hypothesis of the study was that people with higher levels of CSEs would
be more lenient in their performance ratings of neutral performance. This
hypothesis was not supported for the GRS or the BOS as the rating forms, for the
neutral performance vignette condition. Furthermore, surprisingly, a marginally
significant but negative effect of CSEs on performance ratings given on the GRS
was found after the mood of the participants was controlled. For the other
conditions (i.e., for the neutral performance condition where the BOS was the
rating form, for the good performance condition with the BOS and the GRS as the
rating forms), no differences were found between the ratings given by high CSE
and low CSE participants.
People with higher CSEs are expected to interpret information positively, which is
congruent with their in-depth thoughts about themselves and the world around
them. Thus, the findings of the first hypothesis of this study are rather surprising,

77
as they revealed negative associations between affectivity and performance ratings,
although only marginally significant. There may be some plausible explanations as
to why these results occurred. First of all, the effects of CSEs might not have been
similar to the effects of dispositional affect. CSE was defined as a broad, latent and
higher-order trait that constituted of four traits (self-esteem, generalized self-
efficacy, internal locus of control and emotional stability) (Judge et al., 1997), and
people high on these traits were considered as well-adjusted, positive, self-
confident, and efficacious (Judge et al., 2003). This description may indicate that
CSE is a more overarching concept than dispositional affectivity. The literature on
performance ratings have shown that dispositional affectivity had an effect on the
performance ratings given, such that the components of positive self-concept are
effective in having a more positive view towards oneself and the people that one
interacts with (Judge, Locke, Durham, & Kluger, 1998), and that people with a
positive dispositional affect tended to give higher ratings to performance, and vice
versa (Tsui & Barry, 1986; Williams & Keating, 1987). However, the CSEs of the
participants as we measured may not act similar to their dispositional affectivity
towards other people, and may contain more than the enduring moods of the
participants.
A person who is high on CSE can be considered as having a relatively high self-
esteem, strong internal locus of control, being emotionally stable, and self-
efficacious. The components of CSE may cause the rater to be more realistic (and
in some cases, harsher), and to make more realistic judgments on the performance
of the ratee. For example, a person with an internal locus of control may believe
that the performance of an employee shall be the results of his or her own behavior.
Assuming no external causes for an average performance might have caused the
participants with high internal locus of control (i.e., high CSEs) to be more realistic
in his/her interpretation of performance, as she/he will feel more responsible for the
ratings he/she gives, and feel the need to reflect the true nature of performance.
Also, the rater with an internal locus of control may evaluate the neutral
performance of a ratee more negatively, as they believe that improving one’s
performance is his or her own responsibility. Another component of CSE is self-

78
esteem, which is described as the overall value an individual places on oneself
(Rosenberg, 1965). As Harris, Harris, and Eplion (2007) also stated, people with a
high level of self-esteem are more capable of handling both positive and negative
feedback. As people tend to make projections regarding their personalities, raters
high on CSEs (thus high on self-esteem) might have provided more realistic
performance ratings for the neutral performance, as they think that any type of
feedback should be received well. When the state mood of the participant is
controlled, the absolute influence of the dispositional affect (i.e., the effects of
having high CSEs) becomes much clearer, revealing a negative association
between the CSEs and the performance ratings given.
Previous studies have shown that there was a positive association between CSEs
and job satisfaction (Judge et al., 1998). This finding has led us to assume a
positive relationship between CSEs and leniency in ratings, as people with high
levels of CSE seemed to have a positive view of themselves and perceive other
things as more positive. However, a person’s evaluations regarding his/her job may
differ from his/her evaluations about an unrelated individual’s job performance.
Satisfaction with one’s job has an emotional/attitudinal component that evolves
partially in response to some job (e.g., task significance and autonomy) and
organizational characteristics (e.g., hierarchical structure and climate). However,
evaluation of performance of a paper-person is not likely to be an emotion-based
task as the person is expected to read and rate the performance of an imaginary job
incumbent. That is, appraising performance of a paper-person is less likely to be
influenced by factors that are likely to cause us to perceive our jobs in more
favorable or unfavorable ways. This may explain the failure to find a significant
relationship between CSEs and performance ratings.
The negative effect of CSEs was found only for the GRS ratings. The failure to
find a similar effect of CSEs on the BOS ratings may have been caused by the
relatively vague and broad nature of the GRS (Murphy & Cleveland, 1995), which
makes it easier to observe biases or errors in ratings. The BOS, on the other hand,
forces the raters to give objective ratings to specific behavioral descriptions

79
(Latham & Wexley, 1977), thus minimizes the effects of moods and dispositions of
the rater on the performance ratings given (Tziner & Kopelman, 2002). Thus, the
GRS form might have revealed any disposition or mood congruent effects more
clearly, owing to its ambiguous and broad structure.
A second explanation to these findings can be the relatively high levels of accuracy
associated with paper-people manipulations and the isolated nature of the lab
environment where the study was performed. Research has shown that paper-
people manipulations resulted in slightly higher effect sizes than studies that
involved direct observations (Murphy et. al., 1986). This difference in effect sizes
may be due to two different factors: Differences in the cognitive demands imposed,
and the differences in the performance signal to background noise ratio.
“Paper-people” manipulations used in the studies include grammatical and textual
cues to communicate performance-related information, and allow the participants
to concentrate on the performance descriptions in an unconstrained manner, as they
can spend as much time as they want on any part of the written descriptions. On the
other hand, direct observations of performance involve the continuous processing
of visual and auditory material (Newston, 1976). Thus, reading performance
vignettes may require a more controlled processing of the written performance
information (Feldman, 1981) and may cause the raters to use memorial strategies
that cause them to imagine the deeper semantic meanings that the text contains.
That is, people tend to evaluate and reevaluate what they read on a vignette and
process the information clearly and in detail, as the text contain words and phrases
that the rater feels he or she needs to consider while evaluating the performance. In
the observation of behavior; however, a more automatic processing of observation
exists. Thus paper-people may lead to more active and deeper processing of
performance-related information and enhanced memory and judgment accuracy
(Ilgen & Feldman, 1981), compared to direct behavioral observation. For this
study, the observed accuracy in rating the paper-people might have caused the
people with higher CSEs to be more focused on the performance dimensions and
thus may have prevented them from relying on disposition-congruent memories.

80
As these explanations also suggest, using paper people for a performance rating
might therefore cause the raters to be more accurate in reading and recalling the
behavior of the ratee, and thus may be more realistic.
Along the same lines, the performance signal to background noise ratio might have
been influential in the ratings of participants. In the paper-people performance
examples, the performance information is conveyed irrespective of the medium of
performance, the recall of ratee behaviors is more accurate, and the performance
cues are stronger than the background noise (i.e., performance irrelevant
information that is often present in real life contexts). The paper-people studies are
more accurate (hence less prone to rating biases and errors) because they convey
less “noise” (error) into performance manipulations. In case of this study’s paper-
people manipulation, the participants might have concentrated on the performance
of the ratee and were not distracted by any other effects like memory, liking, power
and politics that would be present in a real-life organizational setting (Murphy,
Herr, Lockhart, & Maguire, 1986).
Thirdly, conceptual equivalence/inequivalence problems concerning the measures
(i.e., CSE, CEE) may have contributed to the failure to support the first hypothesis.
Conceptual equivalence is not the roles of the constructs used in the research
design, but it is the meaning of concepts, constructs, objects, or phenomena in a
particular culture. Researchers have to reevaluate the descriptions of different
phenomena in different cultures (Sears, as cited in McArthur, 2007). As stated by
Arthur, the constructs tapped by the the original scale and the translated version (in
this case the Turkish version) need to be equivalent before one can safely use the
scale across cultures. The CSES and the CEES items in Turkish might not have the
same meaning with their originals, because of cultural and linguistic differences.
Thus, the scales in Turkish might have failed to capture the conceptual equivalency
with the original scales in English. Indirectly supporting this interpretation, for
example, when the average responses to each of the items in the Core Self-
Evaluations Scale are calculated, it was seen that items 2 (i.e., Sometimes I feel
depressed), 6 (i.e., Sometimes, I do not feel in control of my work) and 12 (i.e.,
81
There are times when things look pretty bleak and hopeless to me) had averages
below midpoint (when reversed), and even participants with higher CSEs scored
lower on these items. This may show that the participants do not perceive “being
depressed from time to time” as a core factor that is part of their dispositions.
Fourthly, somewhat related to the above point, the descriptive statistics about the
CEES showed that the core external-evaluations of the participants were low in
general ( X = 2.98, SD = .48), compared to their CSEs ( X = 3.33, SD = .57) and
their self-esteem levels ( X = 3.97, SD = .68). This may suggest that, unlike their
western counterparts, there was a general tendency among the study’s participants
not to see the people around them and the world in general, in positive terms. Thus,
even if the participants with the CEES scores in the top 25th percentile were taken
for analysis, the CEES scores may still not be high enough for regarding the CEEs
of the participants as “high”. As it was also stated before, people’s appraisals of the
events around them are influenced by their deep assumptions (i.e., core
evaluations) about themselves, other people, and the external world (Judge et al.,
1998), which means they can also be said to affect the perception of others’
performance. In this case, where the average CEEs of the participants are found to
be below mid-point, we can say that the “deep assumptions” that the participants
hold about the world in general and the people around them were not at the positive
extreme that we hoped for. Thus, the participants’ perceptions about the
performance of a ratee are not positive, either. This finding may also explain the
failure of the third hypothesis of the study. The observed tendency of the Turkish
participants to have relatively low levels of CEEs needs to be further investigated.
Finally, although the CSES scores of the participants were not as low as their
CEES scores, the standard deviation value showed that the variance among the
scores were very small ( X = 3.33, SD = .57). This implies range restriction, which
might have resulted in finding no support for the first hypothesis.
The third hypothesis that, the core external-evaluations would moderate the
relationship between the CSES scores and performance ratings, was not supported

82
either, even when the effects of positive and negative mood are controlled. This
finding is not very surprising, as only a marginal relationship was found between
the CSEs and the performance ratings in the neutral performance vignette
condition, and the CEEs were not found to be related with the performance ratings
in any condition. As mentioned above, the average CEEs of the participants were
very low, and this may have led to a possible range restriction for the accurate
analysis of the third hypothesis.
The study’s second hypothesis predicted that people with either higher or lower
levels of CSEs would show more halo when rating performance, compared with
people with average CSEs. Halo is defined as the tendency to focus on the global
impression of each ratee rather than to carefully differentiate among levels of
different performance dimensions (Borman, 1975), and it was found that the
general impression of the ratee was the most important cause of halo error (Lance,
LaPointe, & Stewart, 1994). Williams and Keating (1987) have found that positive
affect resulted in higher levels of halo in ratings.
When the standard deviations of the ratings of a single rater for several ratees were
compared for participants with high, low and average CSEs, a significant
difference was found only for the good performance vignette condition. That is, the
level of halo in the performance ratings given by participants with average CSEs
was lower than those given by participants with high or low CSEs. The findings are
consistent with the literature. According to Judge et al. (1998), people’s subjective
appraisals are influenced by the deep assumptions they hold about themselves (i.e.,
core self-evaluations), other people and the external world (i.e., core external-
evaluations). Best et al. (2005) also stated that core self-evaluations of people
helped shape the subjective interpretations of contextual events around them. Most
importantly, Tsui and Barry (1986) showed that raters with positive or negative
affect tended to engage more in halo than raters who were neutral. However, the
effects of CSEs were observed only on the good performance vignette condition.
The good performance vignette might have caused the participants to assume a
stronger general impression of the ratee, where the departmental secretary seems to

83
perform well in most of the performance dimensions. For the neutral performance
vignette condition, it was clearly visible that the secretary was good in some
performance dimensions and not so good in others. However, in the good
performance vignette, the secretary performs above average or good in each
dimension, which might have made it harder for the participant to distinguish
between dimensions. Thus, the halo effects might have been observed better for the
good performance vignette condition. These findings all make us expect people
with high or low core self-evaluations to create a performance impression in their
minds even when they are faced with neutral performance.
Finally, although the manipulation check revealed that the neutral and good
performance vignettes were successful in differentiating between good and average
performance of a secretary in general, the participants’ different expectations from
a departmental secretary might have caused them to perceive the performance of
the secretary as better (or worse) than it was aimed to be. If the raters think that
some of the dimensions that are described in the vignette are not part of a
departmental secretary’s job, their ratings for the dimensions that they think are
irrelevant to the secretary’s job shall not affect their general ratings. Thus, the
study might have included a job description for a departmental secretary, which
indicates what performance dimensions and specific behaviors are included in a
departmental secretary’s job description at the university. This formal job
description will help to form a uniform impression of a secretary’s job in every
participant’s mind.
4.3. Strengths of the Study
Despite the failure to obtain full support for the hypotheses, this study has some
strengths that are worth mentioning. An important strength of the study was the use
conceptually and psychometrically sound measures of performance. The two
performance rating forms used in the present study included dimensions of
performance that were extracted from the job description of a departmental
secretary, and the performance dimensions and behaviors used in the rating forms

84
were relevant to our measurement purposes. When a series of analyses were
conducted on the two performance rating scales to see if the two scales served their
purposes, it was seen that the GRS and the two subscales of BOS had high levels of
internal consistency. Also, the GRS and the BOS were significantly correlated with
each other in both the positive and the neutral performance vignette conditions,
yielding some evidence for convergent validity of the performance measure used.
Similarly, the mean values for the neutral and positive performance vignette
condition differed from each other significantly for both measures, indicating that
the performance impression was created well for both conditions and the forms
were successful in measuring performance. Hence, the performance rating scales
developed for this study are believed to be well-constructed and can be used for
measuring performance.
A related strength was that two different types of performance measures were used
in the study in order to clearly capture the differences among raters in both
conditions. According to Tziner and Kopelman (2002), the GRS-based measures
consist of relatively vague and broad dimensions of performance in specific
dimensions, whereas in the BOS format, the raters are asked to indicate the
frequency of specific job-related behaviors. The latter form was found to have clear
psychometric advantages over GRS, as it had higher levels of reliability and
validity (Tziner, 1984a). As the BOS includes specific behavioral examples
regarding the performance of the secretary, it clarifies for the rater what behaviors
should specifically be performed on the job, and in what ways (Latham & Wexley,
1977). The GRS is also not without its advantages, considering the little difference
between the two types of rating forms regarding goal observability (Tziner,
Kopelman, & Joanis, 1997), rater satisfaction (Tziner, Kopelman, & Joanis, 1997),
and the ease in the creation. The GRS is also helpful in analyzing the performance
ratings, as the rating form contains general performance dimensions regarding the
performance of the secretary. Thus, both forms were used in the study in order to
fully capture the differences in performance ratings given to the neutral and the
good performance vignettes.

85
Another important characteristic of this study was that it employed reliable
measures. The CSES and the CEES were translated into Turkish prior to research.
When the Turkish versions of the CSES and CEES were analyzed for reliability, it
was seen that the findings in our study were similar to those found in other studies
in the U.S. (Judge et al., 2003).
Finally, this study was a sound and well-structured laboratory study, which
included high levels of control over the participants and has good internal validity.
To the knowledge of the author, this study was the first laboratory study which
utilized the CSES and the CEES, together with the performance rating forms.
4.4. Limitations of the Study and Directions for Future Research
This study has some limitations that need to be acknowledged. First, as also stated
above (see section 4.2.), the paper-people manipulation (i.e., the performance
vignettes) used in the study could have created an over-isolated performance
example which have caused the participants to focus solely on the performance
vignette. This may not seem as a limitation at first, but the real life situation
contains lots of distracters that keep a rater from being as realistic as she/he can be
in case of a paper-people performance rating. Thus, the external validity of paper-
people performance examples is lower than that of direct observations of
performance. The future studies may use direct observation of performance. This
way, the performance rating process shall be automated, and thus create a more
real-life-like situation within the laboratory context, and help the results be more
generalizable.
For the future studies, there may be some changes regarding the procedure of the
study. First of all, as also mentioned before (See Section 4.2), the job description of
a departmental secretary can be included for the participants to read, in order to
create a uniform impression of a secretary’s job in every participant’s mind.
Secondly, in order to prevent the problem of having low CEE participants rate the

86
performance vignettes, the future studies may choose to collect CSES and CEES
data prior to the main study, in the recruitment phase. This way, participants with a
wider range of CSE and CEE scores may rate performance. Thirdly, a more proper
test of leniency can be employed in the future studies. In the present study,
individual raters rated the same target person. This situation in fact prevented the
use of a more appropriate test for leniency. Leniency is a distributional error
(Murphy & Cleveland, 1995), and a good test for leniency would require ratings
given by individual raters to the performance of multiple ratees. Future studies
might include multiple ratees and hence employ more sound measures of leniency
in ratings.
Future studies should also consider using more conceptually equivalent and
culturally fit measures of CSES and CEES. Findings in this study indicated that the
Turkish version of the CSES and CEES showed adequate reliability, but they were
not fully suitable to be used in the Turkish context. For example, the factor analysis
of the scale revealed three factors that could not be meaningfully distinguished
from each other (See Section 3.4.2.1 above). A better scale can be created in
Turkish with a higher reliability and with a sound one-factor structure, which will
reflect the Turkish culture and thus make sure that conceptually equivalent
measures are utilized for the Turkish sample.
This study found only a marginal negative effect of CSEs on the performance
ratings given. The observed negative effects of the CSEs should be further
investigated in future studies. Also, a convenience sample was used to collect data
for the study. All the students were from the Middle East Technical University and
most of them were from the departments of Psychology and Business
Administration. Future studies may consider using a more diverse sample that
represents people from different occupations, ages and cultural backgrounds in
order for the findings to be generalizable.
Finally, the allocation of the BOS performance dimensions/items into task and
contextual performance components was done by a group of SMEs, who rated the

87
extent to which each item was an indicator of task or contextual performance.
Hence, allocation of the items into task and contextual performance factors was
done based on the decision of the majority (i.e., three of the SMEs). This might
have caused some of the behaviors to fall into a false category by mistake. Hence,
instead of the use of the mere majority criterion, future studies may use a more
stringent agreement criterion, such as 75-80 percent agreement, in order to obtain
less error prone categorization of the items.

88
REFERENCES
Aiken, L. S., & West, S. G. (1991). Multiple regression: Testing and interpreting
interactions. Newbury Park, CA: Sage. Antonioni, D., & Park, H. (2001). The relationship between rater affect and three
sources of 360-degree feedback ratings. Journal of Management, 27, 479-495.
Arvey, R. D., & Murphy, K. R. (1998). Performance evaluation in work settings. Annual Reviews Psychology, 49, 141-168.
Ball, G. A., Trevino, L. K., & Sims, Jr. H. P. (1994). Just and unjust punishment:
Influences on subordinate performance and citizenship. The Academy of
Management Journal, 37, 299-322. Bauer, T. N., & Green, S. G. (1996). Development of leader-member exchange: A
longitudinal test. Academy of Management Journal, 39, 1538-1567. Becker, G. A., & Miller, C. E. (2002). Examining contrast effects in performance
appraisals: Using appropriate controls and assessing accuracy. The Journal
of Psychology, 136, 667-683. Beehr, T. A., Ivanitskaya, L., Hansen, C. P., Erofeev, D., & Gudanowski, D. M.
(2001). Evaluation of 360 degree feedback ratings: Relationships with each other and with performance and selection predictors. Journal of
Organizational Behavior, 22, 775-788. Bernardin, H. J., & Villanova, P. (1986). Generalizing from laboratory to field
settings. Lexington: Lexington Books.

89
Bernardin, H. J., & Beatty, R. W. (1984). Performance appraisal: Assessing human
behavior at work. Boston: Kent.
Bernardin, H. J., Buckley, M. R., Tyler, C. L., & Wiese, D. S. (2000). A
reconsideration of strategies in rater training. Research in Personnel and
Human Resource Management, 18, 221-274. Bernardin, H. J., & Cardy, R. L. (1982). Cognitive complexity in performance
appraisal: It makes no nevermind. Academy of Management Proceedings,
41, 306-310. Bernardin, H. J., Cooke, D. K., & Villanova, P. (2000). Conscientiousness and
agreeableness as predictors of rating leniency. Journal of Applied
Psychology, 85, 232-234. Best, R.G., Stapleton, L. M., & Downey, R. G. (2005). Core self-evaluations and
job burnout: The test of alternative models. Journal of Occupational Health
Psychology, 10, 441-451. Blum, M. L., & Naylor, J. C. (1968). Industrial psychology, its theoretical and
social foundations. New York: Harper and Row Inc. Bono, J. E., & Colbert, A. E. (2005). Understanding responses to multi-source
feedback: The role of core self-evaluations. Personnel Psychology, 58, 171-203.
Bono, J. E., & Judge, T.A. (2003). Core self-evaluations: A review of the trait and
its role in job satisfaction and job performance. European Journal of
Personality, 17, 5-18. Borman, W. C. (1975). Effects of instructions to avoid halo error on reliability and
validity of performance ratings. Journal of Applied Psychology, 62, 64-69. Borman, W.C., & Hallam, G.L. (1991).Observation accuracy for assessors of
work-sample performance: Consistency across task and individual-differences correlates. Journal of Applied Psychology, 76, 11-18.

90
Borman, W. C., & Motowidlo, S. J. (1997). Task performance and contextual performance: The meaning for personnel selection research. Human
Performance, 10, 99-109. Bower, G. H. (1981). Mood and memory. American Psychologist, 36, 129-148. Bretz, Jr., R. D., Milkovich, G. T., & Read, W. (1992). The current state of
performance appraisal research and practice: Concerns, directions and implications. Journal of Management, 18, 321-352.
Brief, A. P., Butcher, A. H., & Roberson, L. (1995). Cookies, disposition, and job
attitudes: The effects of positive mood-inducing events and negative affectivity on job satisfaction in a field experiment. Organizational Behavior
and Human Decision Processes, 62, 55-62. Brief, A. P., & Weiss, H. M. (2002). Organizational behavior: Affect in the
workplace. Annual Reviews Psychology, 53, 279-307. Brockner, J. (1988). Self-esteem at work. Boston: Lexintgon Books. Butterfield, E. C. (1964). Locus of control, test anxiety, reactions to frustration, and
achievement attitudes. Journal of Personality, 32, 355-371. Cardy, R. L., Bernardin, H. J., Abbott, J. G., Senderak, M. P., & Taylor, K. (1987).
The effects of individual performance schemata and dimension familiarization on rating accuracy. Journal of Occupational Psychology, 60, 197–205.
Cardy, R. L., & Dobbins, G. H. (1986). Affect and appraisal accuracy: Liking as an
integral dimension in evaluating performance. Journal of Applied
Psychology, 71, 672-678. Chen, G., Gully, S. M., & Eden, D. (2001). Validation of a new generalized self-
efficacy scale. Organizational Research Methods, 4, 62-83.

91
Cleveland, J. N., & Murphy, K. R. (1992). Analyzing performance appraisal as goal-directed behavior. In G. R. Ferris (Ed.), Research in Personnel and
Human Resources Management, (Vol. 10, pp 121–185). Greenwich, CT: JAI Press.
Cleveland, J. N., Murphy, K. R., & Willims, R. E. (1989). Multiple uses of
performance appraisal: Prevalence and correlates. Journal of Applied
Psychology, 74, 130-135. Colquitt, J. A., LePine, J. A., & Noe, R. (2000). Toward an integrative theory of
training motivation: A meta-analytic path analysis of 20 years of research. Journal of Applied Psychology, 85, 678-707.
Decotiis, T., & Petit, A. (1978). The performance appraisal process: A model and
some testable propositions. The Academy of Management Review, 3, 635-646.
DeNisi, A. S., Cafferty, T. P., & Meglino, B. M. (1984). A cognitive view of the
performance appraisal process: A model and research propositions. Organizational Behavior and Human Performance, 33, 360-396.
DeNisi, A. S., Cafferty, T. P., Williams, K. J., Blencoe, A. G.; & Meglino, B. M.
(1983). Rater information acquisition strategies. Academy of Management
Proceedings, 169-172. DeNisi, A. S., Cafferty, T. P., Williams, K. J., Blencoe, A. G., & Meglino, B. M.
(1983). Appraisal purpose and information utilization. Academy of
Management Proceedings, 306-309. Dipboye, R. L. (1985). Some neglected variables in research on discrimination in
appraisals. The Academy of Management Review, 10, 116-127. Dorfman, P. W., Stephan, W. G., & Loveland, J. (1986). Performance appraisal
behaviors: Supervisor perceptions and subordinate reactions. Personnel
Psychology, 39, 579-597.

92
Dormann, C., Fay, D., Zapf, D., & Frese, M. (2006). A state-trait analysis of job satisfaction: On the effect of core self-evaluations. Applied Psychology: An
International Review, 25, 27-51. Dormann, C., & Zapf, D. (2001). Job satisfaction: A meta-analysis of stabilities.
Journal of Organizational Behavior, 22, 483-504. Dweck, C. S. (1986). Motivational processes affecting learning. American
Psychologist, 41, 1040-1048. Erdogan, B. (2002). Antecedents and consequences of justice perceptions in
performance appraisals. Human Resource Management Review, 12, 555-578.
Erez, A., & Judge, T. A. (2001). Relationship of core self-evaluations to goal
setting, motivation, and performance. Journal of Applied Psychology, 86,
1270-1279. Farh, J. L., & Dobbins, G. H. (1989). Effects of self-esteem on leniency bias in
self-reports of performance: A structural equation model analysis. Personnel Psychology, 42, 835-849.
Feldman, J. M. (1981). Beyond attribution theory: Cognitive processes in
performance appraisal. Journal of Applied Psychology, 66, 127-148. Ferris, G. R., Judge, T. A., Rowland, K. M., & Fitzgibbons, D. E. (1994).
Subordinate influence and the performance evaluation process: Test of a model. Organizational Behavior and Human Decision Processes, 58, 101-135.
Fletcher, C. (2001). Performance appraisal and management: The developing
research agenda. Journal of Occupational and Organizational Psychology,
74, 473-487.
93
Fletcher, C. & Perry, E. L. (2002). Performance appraisal and feedback: A consideration of national culture and a review of contemporary research and future trends. In N. Anderson, D. S. Ones, H. Kepir-Sinangil, & C. Viswesvaran. (Eds.). Handbook of industrial, work and organizational
psychology. (Vol. 1, pp. 127-142). London: Sage. Forgas, J. P., Bower, G. H., & Krantz, S. (1984). The influence of mood on
perceptions of social interactions. Journal of Experimental Social
Psychology, 20, 497-513. Forgas, J. P., & George, J. M. (2001). Affective influences on judgments and
behavior in organizations: An information processing perspective. Organizational Behavior and Human Decision Processes, 86, 3-34.
Fried, Y., Levi, A. S., Ben-David, H. A., & Tiegs, R. B. (1999). Inflation of
subordinate’s performance ratings: Main and interactive effects of rater negative affectivity, documentation of work behavior, and appraisal visibility. Journal of Organizational Behavior, 20, 431-444.
Gardner, D. G., & Pierce, J. L. (1998). Self-esteem and self-efficacy within the
organizational context: An empirical examination. Group and
Organizational Management, 23, 48-70. Gencoz, T. (2000). Positive and Negative Affect Schedule: A study of validity and
reliability. Turkish Journal of Psychology, 15, 27-28. Gerhart, B. (2005). The (affective) dispositional approach to job satisfaction:
Sorting out the policy implications. Journal of Organizational Behavior,
26, 79-97. Giola, D. A., Donnellon, A., & Sims Jr, H. P. (1989). Communication and
cognition in appraisal: A tale of two paradigms. Organization Studies, 10,
503-530. Goffin, R. D., Jelleyi R. B., & Wagner, S. H. (2003). Is halo helpful? Effects of
inducing halo on performance rating accuracy. Social Behavior and
Personality, 31, 625-636.

94
Gray-Little, B., Williams, V. S. L., & Hancock, T. D. (1997). An item response theory analysis of the Rosenberg Self-Esteem Scale. Personality and
Social Psychology Bulletin, 23, 443-451. Guilford, J. P. (1954). Psychometric methods. New York: McGraw-Hill. Harris, K. J., Harris, R. B., & Eplion, D. M. (2007). Personality, leader-member
exchanges, and work outcomes. Journal of Behavioral and Applied
Management, 8, 92-107. Hauenstein, N. M. A. (1992). An information processing approach to leniency in
performance judgement. Journal of Applied Psychology, 77, 485-493. Heller, D., Judge, T. A., & Watson, D. (2002). The confounding role of personality
and trait affectivity in the relationship between job and life satisfaction. Journal of Organizational Behavior, 23, 815-835.
Heneman, H. (1974). Comparison of self-report and superior rating of managerial
performance. Journal of Applied Psychology, 59, 638–642. Heslin, P. A., Latham, G. P., & VandeWalle, D. (2005). The effect of implicit
person theory on performance appraisals. Journal of Applied Psychology,
90, 842-856. Hiller, N. J., & Hambrick, D. C. (2005). Conceptualizing executive hubris: The
role of (hyper-)core self-evaluations in strategic decision making. Strategic
Management Journal, 26, 297-319. Hogan, R., & Shelton, D. (1998). A socioanalytic perspective on job performance.
Human Performance, 11, 129-144. Hojat, M. (1982). Loneliness as a function of selected personality variables. Journal
of Clinical Psychology, 38, 137-141.

95
Holzbach, R. L. (1978). Rater bias in performance ratings: Superior, self, and peer ratings. Journal of Applied Psychology, 63, 579–588.
Hui, C., & Lee, C. (2000). Moderating effects of organization-based self-esteem on
organizational uncertainty: Employee response relationships. Journal of
Management, 26, 215-232. Hunter, J. E., Gerbing, D. W., & Boster, F. J. (1982). Machiavellian beliefs
and personality: Construct invalidity of the Machiavellian dimension. Journal of Personality and Social Psychology, 43, 1293–1305.
Ilgen, D. R., & Favero, J. L. (1985). Limits in generalization from psychological
research to performance appraisal process. Academy of Management
Review, 10, 311-321. Ilgen, D. R., & Feldman, J. M. (1983). Performance appraisal: A process focus.
Research in Organizational Behavior, 5, 141-158. Isen, A. M., Shalker, T. E., Clark, M., & Karp, L. (1978). Affect accessibility of
material in memory, and behavior: A cognitive loop? Journal of Personality
and Social Psychology, 36, 1-12. Jacobs, R., Kafry, D., & Zedeck, S. (1980). Expectations of behaviorally anchored
rating scales. Personnel Psychology, 33, 595-640. Jawahar, I. M. (2006). Correlates of satisfaction with performance appraisal
feedback. Journal of Labor Research, 27, 213-236. Jawahar, I. M., & Carr, D. (2007). Conscientiousness and contextual performance:
The compensatory effects of perceived organizational support and leader-member exchange. Journal of Managerial Psychology, 22, 330-349.
Jawahar, I. M., & Williams, C. R. (1997). Where all the children are above average:
The performance appraisal purpose effect. Personnel Psychology, 50, 905-926.
96
Jex, S. M., & Elacqua, T. C. (1999). Self-esteem as a moderator: A comparison of global and organization-based measures. Journal of Occupational and
Organizational Psychology, 72, 71-81. Jöreskog, K. & Sörbom, D. (2005). LISREL 8.72: Student’s Edition. Scientific
Software International, Inc. Judge, T. A., & Bono, J. E. (2001). Relationship of core self-evaluations traits-self-
esteem, generalized self-efficacy, locus of control, and emotional stability-with job satisfaction and job performance: A meta-analysis. Journal of
Applied Psychology, 86, 80-92. Judge, T. A., Bono, J. E., Ilies, R., & Gerhardt, M. W. (2002). Personality and
leadership: A qualitative and quantitative review. Journal of Applied
Psychology, 87, 765-780. Judge, T. A., Bono, J. E., & Locke, E. A. (2000). Personality and job satisfaction:
The mediating role of job characteristics. Journal of Applied Psychology,
85, 237-249. Judge, T. A., Erez, A., & Bono, J. E. (1998). The power of being positive: The
relation between positive self-concept and job performance. Human
Performance, 11, 167-187. Judge, T. A., Erez, A., Bono, J. E., & Locke, E. A. (2005). Core self-evaluations
and job and life satisfaction: The role of self-concordance and goal attainment. Journal of Applied Psychology, 90, 257-268.
Judge, T. A., Erez, A., Bono, J. E., & Thoresen, C. J. (2002). Are measures of self-
esteem, neuroticism, locus of control, and generalized self-efficacy indicators of a common core construct? Journal of Personality and Social
Psychology, 83, 693-710. Judge, T. A., Erez, A., Bono, J. E., & Thoresen, C. J. (2003). The core self-
evaluations scale: Development of a measure. Personnel Psychology, 56,
303-331.
97
Judge, T. A., & Ferris, G. R. (1993). Social Context of Performance Evaluation Decisions. The Academy of Management Journal, 36, 80-105.
Judge, T. A., Higgins, C., Thoresen, C. J., & Barrick, M. R. (1999). The big-five
personality traits, general mental ability, and career success across life span. Personnel Psychology, 52, 621-652.
Judge, T. A., Locke, E. A., & Durham, C. C. (1997). The dispositional causes of
job satisfaction: A core evaluations approach. Research in Organizational
Behavior, 19, 151-188. Judge, T. A., Locke, E. A., Durham, C. C., & Kluger, A. N. (1998). Dispositional
effects on job and life satisfaction: The role of core evaluations. Journal of
Applied Psychology, 83, 17-34. Judge, T. A., Thoresen, C. J., Pucik, V., & Welbourne, T. M. (1999). Managerial
coping with organizational change: A dispositional perspective. Journal of
Applied Psychology, 84, 107-122. Judge, T. A., VanVianen, A. E. M., & DePater, I. E. (2004). Emotional stability,
core self-evaluations, and job outcomes: A review of the evidence and an agenda for future research. Human Performance, 17, 325-346.
Kane, J. S., Bernardin, H. J., Villanova, P., & Peyrefitte, J. (1995). Stability of rater
leniency: Three studies. Academy of Management Journal, 38, 1036-1051. Kelley, H. H. (1973). The process of causal attribution. American Psychologist, 28,
107-128. Kelloway, E. K. (1998). Using LISREL for structural equation modeling: A
researcher’s guide. Thousand Oaks, CA: Sage. Kennedy, J. C. (2007). Wording effects in the core self-evaluations scale.
Unpublished poster, Annual SIOP Conference, New York.

98
Kingstrom, P. O., & Mainstone, L. E. (1985). An investigation of the rater-ratee acquaintance and rater bias. The Academy of Management Journal, 28, 641-653.
Kisbu, Y. (2006). Influences of regulatory focus, core self-evaluations and age on
biases in perception and choice. Unpublished master’s thesis, Koc University.
Knight, P. A., & Nadel, J. I. (1986). Humility revisited: Self-esteem, information
search, and policy consistency. Organizational Behavior and Human
Decision Processes, 38, 196-206. Kozlowski, S. W. J., Chao, G. T., & Morrison, R. F. (1998). Games raters play:
Politics, strategies, and impression management in performance appraisal. In J. W. Smither (Ed.). Performance Appraisal: State-of-the-Art in Practice
(pp. 163-205). San Francisco: Jossey-Bass. Lam, S. S. K., Yik, M. S. M. & Schaubroeck, J. (2002). Responses to formal
performance appraisal feedback: The role of negative affectivity. Journal of
Applied Psychology, 87, 192-201. Lance, C. E., LaPointe, J. A., & Stewart, A. M. (1994). A test of the context
dependency of three causal models of halo rater error. Journal of Applied
Psychology, 79, 332-340. Landy, F. J., & Farr, J. L. (1980). Performance ratings. Psychological Bulletin, 87,
72-197. Latham, G. P., & Wexley, K. N. (1977). Behavioral observation scales for
performance appraisal purposes. Personnel Psychology, 30, 255-268. Levenson, H. (1981). Differentiating among internality, powerful others, and
chance. In H. M. Lefcourt (Ed.). Research with the locus of control construct (pp. 15-63). New York: Academic Press.
Longenecker, C. O., Sims, H. P., & Gioia, D. A. (1987). Behind the mask: The
politics of employee appraisal. The Academy of Management Executive, 1,
183-193.
99
McArthur, D. N. (2007). Construct equivalence in international business research: The first and the last of it. Journal of Business Inquiry, 6, 28-38.
McGregor, D. (1957). An uneasy look at performance appraisal. Harvard Business
Review, 35, 123-129. Miller, C. E., & Thornton, C. L. (2006). How accurate are your performance
appraisals? Public Personnel Management, 35, 153-162. Mount, M. K. ( 1984). Psychometric properties of subordinate ratings of
managerial performance. Personnel Psychology, 37, 687-702. Murphy, K. R., & Cleveland, J. N. (1991). Understanding performance appraisal.
Sage, Thousand Oaks, CA. Murphy, K. R., & Cleveland, J. N. (1995). Understanding performance appraisal:
Social, organizational and goal-based perspective. Thousand Oaks, California: Sage.
Murphy, K. R., Herr, B. M., Lockhart, M. C., & Maguire, E. (1986). Evaluating the
performance of paper people. Journal of Applied Psychology, 71, 654-661. Nisbett, R. E., & Wilson, T. D. (1977). The halo effect: Evidence for unconscious
alteration of judgments. Journal of Personality and Social Psychology, 35,
250-256. O’Donnell, J. M. (1990). The effect of performance appraisal purpose training on
rating errors and accuracy. Human Resource Development Quarterly, 1,
167-177. Ok, B. (2002). Comparisons of behaviorally anchored rating scales, graphic rating
scales, and modified graphic rating scales in student evaluation of instructors.. Unpublished master’s thesis, Middle East Technical University.
Parks, O. S., Sims, H. P., & Motowildo, S. J. (1986). Affect in organizations. In D.
A. Gioia, & H. P. Sims (Eds.) The Thinking Organization: Dynamics of
Organizational Social Cognition.(pp. 215-237). San Francisco: Jossey Bass.

100
Piccolo, R. F., Judge, T. A., Takahashi, K., Watanabe, N., & Locke, E. A. (2005). Core self-evaluations in Japan: Relative effects on job satisfaction, life satisfaction, and happiness. Journal of Organizational Behavior, 26, 965-984.
Ployhart, R. E., Lim, B. C., & Chan, K. Y. (2001). Exploring relations between
typical and maximum performance ratings and the five factor model of personality. Personnel Psychology, 54, 809-843.
Robbins, T. L., & DeNisi, A. S. (1994). A closer look at interpersonal affect as a
distinct influence of cognitive processing in performance evaluations. Journal of Applied Psychology, 79, 341-353.
Robbins, T. L., & DeNisi, A. S. (1998). Mood vs. interpersonal affect: Identifying
process and rating distortions in performance appraisal. Journal of Business
and Psychology, 12, 313-325. Rode, J. C. (2004). Job satisfaction and life satisfaction revisited: A longitudinal
test of an integrated model. Human Relations, 57, 1205-1230. Rosenberg, M. (1965). Society and adolescent self-image. New Jersey: Princeton
University Press. Saal, F. E., Downey, R. G., & Lahey, M. A. (1980). Rating the ratings: Assessing
the psychometric quality of rating data. Psychological Bulletin, 88, 413-428.
Saal, F.E., & Knight, P.A. (1988). Industrial/Organizational Psychology. Pacific
Grove: Brooks/Cole. Saari, L. M., & Judge, T. A. (2004). Employee attitudes and job satisfaction.
Human Resource Management, 43, 395-407.
Sager, J. K., Strutton, H. D., & Johnson, D. A. (2006). Core self-evaluations and salespeople. Psychology & Marketing, 23, 95-113.
Schneider, D. J. (1973). Implicit personality theory: A review. Psychological
Bulletin, 79, 294-309.

101
Schraeder, M., & Simpson, J. (2006). How similarity and liking affect performance appraisals. The Journal for Quality and Participation, 34-40.
Silver, W. S., Mitchell, T. R., & Gist, M. E. (1995). Responses to successful and
unsuccessful performance: The moderating effect of self-efficacy on the relationship between performance and attributions, Organizational Behavior
and Human Decision Processes , 62, 286-299. Sinclair, R. C. (1988). Mood, categorization breadth, and performance appraisal:
The effects of order of information acquisition and affective state on halo, accuracy, information retrieval, and evaluations. Organizational Behavior
and Human Decision Processes, 42, 22-46. Smith, D. R., DiTomaso, N., Farris, G. F., & Cordero, R. (2001). Favoritism, bias
and error in performance ratings of scientists and engineers: The effects of power, status and numbers. Sex Roles, 45, 337-358.
Smith, P. C., & Kendall, L. M. (1963). Retranslation of expectations: An approach
to the construction of unambiguous anchors for rating scales. Journal of
Applied Psychology, 47, 149-155. Spicer, D. P., & Ahmad, R. (2006). Cognitive processing models in performance
appraisal: Evidence from the Malaysian education system. Human
Resource Management Journal, 16, 214-230. Strauss, J. P., Barrick, M. R., & Connerley, M. L. (2001). An investigation of
personality similarity effects (relational and perceived) on peer and supervisor ratings and the role of familiarity and liking. Journal of
Occupational and Organizational Psychology, 74, 637-657. Stumpf, S. A., Brief, A. P., & Hartman, K. (1987). Self-efficacy expectations and
coping with career related events. Journal of Vocational Behavior, 31, 91-108.
Summary report for secretaries, except legal, medical and executive. Retrieved
September 30, 2006, from http://online.onetcenter.org/link/summary/43-6014.00.
102
Swann, W. B., Griffin, J. J., Predmore, S. C., & Gaines, B. (1987). The cognitive-affective crossfire: When self-consistency confronts self-enhancement. Journal of Personality and Social Psychology, 52, 881-889.
Tajfel, H. (1982). Social psychology of intergroup relations. Annual Review of
Psychology, 33, 1-39. Taylor, S. E. & Fiske, S. T. (1979). Salience, attention and attribution: Top of the
head phenomena. In L. Berkowitz (Ed.). Advances in Experimental Social Psychology. (Vol. 12). New York/London: Academic press.
Taylor E. K., & Wherry, R. J. (1951). A study of leniency in two rating systems.
Personnel Psychology, 4, 39-47. Thornton, G. (1980). Psychometric properties of self-appraisals of job
performance. Personnel Psychology, 33, 263-271. Toker, Y. (2003). Individual differences factors affecting workplace sexual
harassment perceptions. Unpublished master’s thesis, Middle East Technical University.
Tsaousis, I., Nikolaou, I., Serdaris, N., & Judge, T. A. (2007). Do the core self-
evaluations moderate the relationship between subjective well-being and physical and psychological health? Personality and Individual Differences,
42, 1441-1452. Tsui, A. S., & Barry, B. (1986). Interpersonal affect and rating errors. Academy of
Management Journal, 29, 586-599. Tsui, A. S., & O’Reilly, C. A. (1989). Beyond simple demographic effects: The
importance of relational demography in superior subordinate dyads. Academy of Management Journal, 32, 402-423.
Tziner, A. (1984). A fairer examination of rating scales when used for performance
appraisal in a real organizational setting. Journal of Occupational
Behaviour, 5, 103–112.

103
Tziner, A., Joanis, C., & Murphy, K. R. (2000). A comparison of three methods of performance appraisal with regard to goal properties, goal perception, and ratee satisfaction. Group Organization Management, 25, 175-190.
Tziner, A., & Kopelman, R. (1988). Effects of rating format on goal setting
dimensions: A field experiment. Journal of Applied Psychology, 73, 323-326.
Tziner, A., & Kopelman, R. E. (2002). Is there a preferred performance rating
format? A non-psychometric perspective. Applied Psychology: An
international review, 51, 479-503. VanScotter, J. R., Moustafa, K., Burnett, J. R., & Michael, P. G. (2007). Influence
of prior acquaintance with the ratee on rater accuracy and halo. Journal of
Management Development, 26, 790-803. Varma A., DeNisi, A. S. & Peters, L. (1996). Interpersonal affect and performance
appraisal: A field study. Personnel Psychology, 49, 341-360. Villanova, P., Bernardin, H. J., Dahmus, S. & Sims, R. (1993). Rater leniency and
performance appraisal discomfort. Educational and Psychological
Measurement, 53, 789-799. Viswesvaran, C. (2002). Assessment of individual job performance: A review of
the past century and a look ahead. In N. Anderson, D. S. Ones, H. Kepir-Sinangil, & C. Viswesvaran. (Eds.). Handbook of industrial, work and
organizational psychology. (Vol. 1, pp. 110-127). London: Sage. Wagner, W. G., Pfeffer, J., & O’Reilly, C. A. (1984). Organizational demography
and turnover in top management groups. Administrative Science Quarterly,
29, 74-92. Wanberg, C. R., & Banas, J. T. (2000). Predictors and outcomes of openness to
changes in a reorganizing workplace. Journal of Applied Psychology, 85,
132-142. Watson, D., Clark, L. A., & Tellegen, A. (1988). Development and validation of
brief measures of positive and negative affect-The PANAS scales. Journal
of Personality and Social Psychology, 54, 1063-1070.
104
Watson, D., & Pennebaker, J. W. (1989). Health complaints, stress, and distress:
Exploring the central role of negative affectivity. Psychological Review, 96, 234-254.
Watson, D., Suls, J., & Haig, J. (2002). Global self-esteem in relation to structural
models of personality and affectivity. Journal of Personality and Social
Psychology, 83, 185-197. Wexley, K. N. (1979). Performance appraisal and feedback. In S. Kerr (Ed.),
Organizational Behavior. (pp. 241-259). Columbus, Ohio: Grid Pub. Co. Woehr, D. J. (1992). Performance dimension accessibility: Implications for rating
accuracy. Journal of Organizational Behavior, 13, 357-367. Woehr, D. J., & Lance, C. E. (1991). Paper people versus direct observation: An
empirical examination of laboratory methodologies. Journal of
Organizational Behavior, 12, 387-397. Wright, R. P. (2004). Mapping cognitions to better understand attitudinal and
behavioral responses in appraisal research. Journal of Organizational
Behavior, 25, 339-374. Yun, G. J., Donahue, L. M., Dudley, N. M. & McFarland, L. A. (2005). Rater
personality, rating format and social context: Implications for performance appraisal ratings. International Journal of Selection and Assessment, 13, 97-107.
Zajonc, R. B. (1980). Feeling and thinking: Preferences need no inferences.
American Psychologist, 35, 151-175. Zhao, H., Seibert, S. E., & Hills, G. E. (2005). The mediating role of self-efficacy in
the development of entrepreneural intentions. Journal of Applied
Psychology, 90, 1265-1272.

105
APPENDICES
APPENDIX A
TURKISH VERSION OF THE CORE SELF-EVALUATIONS SCALE RUMUZ: YAŞINIZ: CİNSİYETİNİZ: BÖLÜMÜNÜZ: SINIFINIZ: Lütfen her maddeyi dikkatlice okuduktan sonra o maddede yazanın size göre ne derece doğru veya yanlış olduğunu aşağıda verilen ölçeği kullanarak değerlendiriniz.
1 2 3 4 5 Tamamen
Yanlış Yanlış Ne doğru
Ne Yanlış Doğru Tamamen
Doğru 1.Hayatta hak ettiğim başarıyı yakaladığıma eminim.
2.Bazen kendimi depresyonda hissederim.
3.Uğraştığım zaman genelde başarırım.
4.Bazen başarısız olduğumda kendimi değersiz hissederim.
5.İşleri başarıyla tamamlarım.
6.Bazen kendimi işime hakim hissetmiyorum.
7.Genel olarak, kendimden memnunum.
8.Yeteneklerimle ilgili şüphe duyuyorum.
9.Hayatımda ne olacağını ben belirlerim.
10.Meslek yaşamımdaki başarımın kontrolünün elimde olmadığını hissediyorum.
11.Sorunlarımın çoğuyla başa çıkabilirim.
12.Bazı zamanlar var ki her şey bana karamsar ve ümitsiz gözükür.

106
APPENDIX B
TURKISH VERSION OF THE CORE EXTERNAL-EVALUATIONS SCALE
RUMUZ: Lütfen aşağıda verilen 14 maddeyi dikkatlice okuduktan sonra o maddede yazanın size göre ne derece doğru veya yanlış olduğunu aşağıda verilen ölçeği kullanarak değerlendiriniz.
1 2 3 4 5 Tamamen
Yanlış Yanlış Ne doğru
Ne Yanlış Doğru Tamamen
Doğru 1.Çoğu insan, eğer karşılığında bir kazanç sağlayacaksa, yalan söyler.
2.İnsanlar dürüstlük ve ahlakla ilgili etik ilkeleri olduğunu iddia eder, fakat para söz konusu olduğunda çok azı bu ilkelere bağlı kalır.
3.İnsanlar birbirlerini gerçekte olduğundan daha fazla önemsiyormuş gibi davranır.
4.Çoğu insan özünde gerçekten dürüst değildir.
5.İnsanlar çoğunlukla, başlarına gelen şeyi hak ederler.
6.Talihsizlik yaşayan insanlar çoğunlukla buna kendileri sebep olmuştur.
7.Dünya temelde adil bir yerdir.
8.Çoğu insan, kesinlikle kendi hatası olmayan şeylerin acısını çeker.
9.Dünya adil değildir.
10.Temelde, insanlara güvenilebilir.
11.Er ya da geç, insanlar seni incitecektir.
12.Çoğu insan iyidir.
13.Bu dünyada mutluluğu yakalamak mümkündür.
14.İnsan hayatta trajedi ve umutsuzluğa mahkumdur.

107
APPENDIX C
NEUTRAL PERFORMANCE VIGNETTE
Orta Doğu Teknik Üniversitesi
Performans Ödülü İçin Personel Değerlendirmesi
Değerlendiren: Deniz Günay, İnşaat Mühendisliği Bölüm Başkanı
Değerlendirilen : Zeynep Özkan, İnşaat Mühendisliği Bölüm Sekreteri
Değerlendirme dönemi: 2005 -2006
Son üç yıldır amiri olarak görev yaptığım Zeynep Özkan, 10 yıldır İnşaat
Mühendisliği Bölümünde bölüm sekreteri olarak çalışmaktadır. Beraber
çalıştığımız bu süre içinde Zeynep Hanım’ın performansını yakından gözleme
şansım oldu. Zeynep Hanım’ın son 1 yıllık dönem içerisindeki performansına
yönelik değerlendirmemi şu şekilde özetlemem mümkün:
İnşaat Mühendisliği Bölümü, öğrenci sayısı, verilen dersler, zorunlu staj ve
öğretim elemanları tarafından yürütülen projeler vb. işler nedeniyle çalışmaların
koordineli ve planlı bir şekilde yürütülmesini zorunlu kılmaktadır. Tüm bu işlerin
aksamadan yürütülmesinde Zeynep Hanım’a önemli görevler düşmektedir. Zeynep
Hanım bu görevleri çoğunlukla beklendiği şekilde yapabilmek için çaba
harcamaktadır. Örneğin, ders programlarını, bölüm duyurularını ve sınav
programını öğrencilere ve öğretim elemanlarına duyurmak gibi rutin işleri
yürütmekte bir sorun yaşamamaktadır. Bununla beraber, sıklıkla olmasa da bazen,
işlerin planlanmasında ve zamanında bitirilmesinde problem yaşayabilmektedir.
Örneğin, geçtiğimiz dönem, aynı toplantı odasına iki ayrı tez jürisi için randevu
vermesi ve bu olayın birkaç kez tekrarlanması nedeniyle bazı sıkıntılar yaşandı.

108
Aynı şekilde, ek ders çizelgelerini iş yoğunluğu nedeni ile zamanında
tamamlayamaması sebebiyle, birkaç kez öğretim elemanlarına yapılması gereken
ödemelerde aksaklıklar yaşandı.
Zeynep Özkan, üniversite içinde birimler arasındaki işleyişe ve de lisans ve
lisans sonrası programlara ilişkin yönerge, yönetmelik, kural ve düzenlemeleri bilir.
Örneğin, tezler için jüri oluşturulmasından, tez savunması sonunda hazırlanan
raporun enstitüye iletilmesine dek geçen sürede izlenmesi gereken prosedürlere
hakimdir; bu konuda hem hocalar hem de öğrenciler, Zeynep Hanım’ın bilgisine
başvurmaktadır. Buna karşılık Zeynep Hanım, bölüm içi ve bölüm dışı yazışmaların
yürütülmesinde zaman zaman sorunlar da yaşayabilmektedir. Örneğin; bölümden
Fakülteye, Enstitüye ve Rektörlüğe yapılan yazışmalarda bazı hatalar olmakta ve bu
hatalar da karışıklıklara yol açabilmektedir.
Zeynep Özkan’ın işle ilgili teknik yetkinlikler konusunda geliştirilmesi
gereken bazı yönlerinin olduğunu söylemek mümkündür. Üniversite içinde
kullanılan programları ve Ofis programları konusunda eğitim almış olmasına
rağmen, ders kayıtlarının yapılması, geçici ders listelerinin hazırlanması, ders onay
ve ekle-sil gibi işlemleri etkin bir şekilde yürütememekte ve zaman zaman hatalar
yapmaktadır. Araştırma görevlilerinden aldığı yardımla, bilgisayar üzerinden
yürütülmesi gereken işler konusunda kendini geliştirmeye çalışmaktadır.
Zeynep Özkan, işini yaparken zaman zaman profesyonellikten uzaklaşan
davranışlar sergilemektedir. Örneğin, ofis telefonlarını sıklıkla özel görüşmeleri için
kullanabilmektedir. Zeynep Hanım’ın ayrıca, öğretim görevlileriyle ve öğrencilerle
ilişkilerinde de profesyonel olmadığı durumlar olabilmektedir. Örneğin, öğretim
elemanlarıyla konuşmalarında kimi zaman saygı çerçevesinin dışına çıkabilmekte;
isteklerini dinlerken dikkati dağılabilmekte ve bu yüzden bu istekleri uygulamakta
sorunlar yaşayabilmektedir. Aynı şekilde, öğrencilerle olan ilişkisinde de gereken
mesafeyi korumakta da zaman zaman güçlük çekmektedir.
Zeynep Özkan, bölüm içerisinde meydana gelen problemlere zamanında
müdahale etmekte sorunlar yaşamaktadır. Örneğin, bölümdeki projektör sayısının
kısıtlı olması nedeniyle geçtiğimiz dönem başında bazı derslerde sorunlar
yaşanmıştı. Zeynep Hanım, bu problemin tekrar yaşanmaması için önlem almakta
gecikmiştir. Diğer bölümlerden ve enstitüden projektörlerin sınıflara zamanında

109
getirilmesini ancak dönem sonuna doğru sağlayabilmiş, öğretim elemanlarının
sıkıntı yaşamasına yol açmıştır.
Zeynep Hanım’ın sorumluluk alanlarından birisi de, bölüm içerisindeki
malzemelerin ve yazışmaların takip ve kontrolünü yapmaktır. Bu işlerin
yapılmasında genel olarak bir problem yaşanmamaktadır. Bölüm personelinin
kullandığı büro malzemeleri, bilgisayar ve laboratuvarların demirbaş kayıtlarını
yapmakta ve düzenli olarak bu demirbaşlarda eksiklikler olup olmadığını kontrol
etmektedir.
Zeynep Hanım, öğrencilerle ilişkilerinde çoğunlukla yapıcı bir tutum
izlemektedir. Ancak, zaman zaman bazı öğrencilere karşı sabırsız ve asabi bir
tutum sergilediğini de gözlemledim. Örneğin, öğretim elemanlarına ulaşamayan
öğrencilerin tekrarlanan soruları karşısında kısa ve bilgilendirici olmayan cevaplar
verebildiği ve ses tonunu kontrol edemediğini gözlediğim zamanlar olmuştur.

110
APPENDIX D
POSITIVE PERFORMANCE VIGNETTE
Orta Doğu Teknik Üniversitesi
Performans Ödülü İçin Personel Değerlendirmesi
Değerlendiren: Deniz Günay, İnşaat Mühendisliği Bölüm Başkanı
Değerlendirilen : Zeynep Özkan, İnşaat Mühendisliği Bölüm Sekreteri
Değerlendirme dönemi: 2005 -2006
Son üç yıldır amiri olarak görev yaptığım Zeynep Özkan, 10 yıldır İnşaat
Mühendisliği Bölümünde bölüm sekreteri olarak çalışmaktadır. Beraber çalıştığımız
bu süre içinde Zeynep Hanım’ın performansını yakından gözleme şansım oldu.
Zeynep Hanım’ın son 1 yıllık dönem içerisindeki performansına yönelik
değerlendirmemi şu şekilde özetlemem mümkün:
İnşaat Mühendisliği Bölümü, öğrenci sayısı, verilen dersler, zorunlu staj ve
öğretim elemanları tarafından yürütülen projeler vb. işler nedeniyle çalışmaların
koordineli ve planlı bir şekilde yürütülmesini zorunlu kılmaktadır. Tüm bu işlerin
aksamadan yürütülmesinde Zeynep Hanım’a önemli görevler düşmektedir. Zeynep
Hanım bu görevleri en iyi şekilde yapmak için üstün bir gayret göstermektedir.
Örneğin, ders programlarını, bölüm duyurularını ve sınav programını öğrencilere ve
öğretim elemanlarına duyurmak gibi rutin işleri yürütmekte hiçbir sorun
yaşamamaktadır. Ayrıca, işlerin planlanmasında ve zamanında bitirilmesinde
şimdiye kadar herhangi bir problem yaşanmamıştır. Örneğin, toplantı odalarının tez
jürileri için ayrılması konusunda oldukça titizdir ve aynı toplantı odasına birden
fazla randevu vermemeye büyük özen göstermektedir. Ek ders çizelgelerini de,

111
böylesine büyük bir bölümde gün içerisinde yaşanan yoğunluğa rağmen zamanında
tamamlayabilmekte ve böylece öğretim elemanlarına yapılması gereken ödemelerde
hiç bir aksaklık yaşanmamaktadır.
Zeynep Özkan, üniversite içinde birimler arasındaki işleyişe ve de lisans ve
lisans sonrası programlara ilişkin yönerge, yönetmelik, kural ve düzenlemelere son
derece hakimdir. Örneğin, tezler için jüri oluşturulmasından, tez savunması sonunda
hazırlanan raporun enstitüye iletilmesine dek geçen sürede izlenmesi gereken
prosedürleri ayrıntılarıyla bilir; bu konuda hem hocalar hem de öğrenciler, Zeynep
Hanım’ın bilgisine başvurmaktadır. Aynı zamanda, Zeynep Hanım, bölüm içi ve
bölüm dışı yazışmaları sorunsuz bir şekilde yürütmekte, örneğin, bölümden
Fakülteye, Enstitüye ve Rektörlüğe yapılan yazışmaları aksatmadan ve hatasız bir
şekilde yapmaktadır.
Zeynep Özkan’ın işle ilgili teknik yetkinlikler konusunda da oldukça başarılı
olduğunu ve kendini daha da geliştirmeye çalıştığını söylemek mümkündür.
Üniversite içinde kullanılan programlar ve Ofis programları konusunda aldığı
eğitim sayesinde ders kayıtlarının yapılması, geçici ders listelerinin hazırlanması,
ders onay ve ekle-sil gibi işlemleri etkin bir şekilde yürütebilmekte ve ufak tefek
aksamalar dışında işini en iyi şekilde yapmaktadır. Araştırma görevlilerinden aldığı
yardımla, yaptığı ufak tefek hatalar konusunda da kendini geliştirmeye
çalışmaktadır.
Zeynep Özkan, işini yaparken profesyonel bir tutum izlemektedir. Örneğin,
ofis telefonlarını acil durumlar dışında özel görüşmeleri için kullanmaktan
kaçınmaktadır. Zeynep Hanımın profesyonel tutumu ayrıca, öğretim görevlileriyle
ve öğrencilerle olan ilişkilerine de yansımaktadır. Örneğin, öğretim elemanlarıyla
daima saygı çerçevesinde konuşmakta, isteklerini dikkatle dinleyerek uygulamak
için büyük özen göstermektedir. Aynı şekilde, öğrencilerle olan ilişkisinde gereken
mesafeyi her zaman korumaktadır.
Zeynep Özkan, bölüm içerisinde meydana gelen problemlere tam zamanında
müdahale etmektedir. Örneğin, bölümdeki projektör sayısının kısıtlı olması
nedeniyle geçtiğimiz dönem başında bazı derslerde sorunlar yaşanmıştı. Zeynep
Hanım, dönem başından itibaren bu problemin tekrar yaşanmaması için önceden
önlem almış, diğer bölümlerden ve enstitüden projektörlerin sınıflara getirilmesini

112
sağlayarak öğretim elemanlarının sıkıntı yaşamasını önlemiştir.
Zeynep Hanım’ın sorumluluk alanlarından birisi de, bölüm içerisindeki
malzemelerin ve yazışmaların takip ve kontrolünü yapmaktır. Bu işlerin
yapılmasında şimdiye kadar bir problem yaşanmamıştır. Bölüm personelinin
kullandığı büro malzemeleri, bilgisayar ve laboratuvarların demirbaş kayıtlarını
yapmakta ve düzenli olarak bu demirbaşlarda eksiklikler olup olmadığını kontrol
etmektedir.
Zeynep Hanım, öğrencilerle ilişkilerinde yapıcı bir tutum izlemektedir.
Öğrencilere karşı çoğunlukla sabırlı olduğunu ve sakin bir tutum sergilediğini
gözlemledim. Örneğin, öğretim elemanlarına ulaşamayan öğrencilerin tekrarlanan
soruları karşısında, anlayışlı davranmakta, gerekli açıklamaları uygun bir dille
yapmakta ve ses tonuna her zaman için dikkat etmektedir.

113
APPENDIX E
PERFORMANCE RATING FORM FOR THE MANIPULATION CHECK
ORTA DOĞU TEKNİK ÜNİVERSİTESİ
PERFORMANS DEĞERLENDİRME FORMU
Çalışanın ismi: Zeynep Özkan Görevi: İnşaat Mühendisliği Bölüm Sekreteri
Değerlendirme tarihi: 20.06.2006 Değerlendirici: Deniz Günay (Bölüm Başkanı)
Aşağıda Orta Doğu Teknik Üniversitesi’nde Bölüm Sekreteri olarak çalışan elemanların performanslarını kapsayacak şekilde bir dizi örnek davranış sunulmuştur. Her bir davranış örneğinden önce ilgili performans boyutu tanımlanmıştır. Her boyutun altındaki davranış için, çalışan elemanınızın son bir yıl içindeki performansını göz önünde bulundurarak, aşağıda sunulan beş basamaklı ölçek üzerinde bir değerlendirme yapınız.
1 2 3 4 5
Hiçbir zaman Nadiren Zaman zaman Sıklıkla Her zaman
1. Planlama ve organizayon: Yapılacak işleri önceden belirler,
zamanı etkili bir şekilde işlere böler, işleri önem sırasına dizer ve
işleri birbirlerini aksatmayacak bir şekilde yürütür.
1 2 3 4 5
2. Yazılı İletişim: İlgililerin ihtiyaçlarına uygun şekilde, yazılı
olarak etkili iletişim kurar; yazılı bilgileri hatasız ve eksikiz bir
biçimde anlar, yazar ve yorumlar.
1 2 3 4 5
3. Yönerge ve Yönetmeliklere Hakimiyet: İlgili işleri yürütmek
için gerekli olan yönetmelik ve mevzuat konusunda bilgilidir.
1 2 3 4 5
4. Teknik Yetkinlik: İşi için gerekli olan bilgisayar programlarını
etkin bir şekilde kullanır.
1 2 3 4 5
5. Takip ve Kontrol: Ofis malzemelerinin ve bölüm için gerekli 1 2 3 4 5

114
Genel olarak performansı:
olan diğer sarf malzemelerinin listesini tutar, eksilenleri belirler,
yerine koyar.
6. Öğrencilerle İletişim: Öğrencilerin ihtiyaçlarına onları doğru
şekilde bilgilendirerek ve onlarla yapıcı ilişkiler kurarak karşılık
verir.
1 2 3 4 5
7. Problem Çözme: İş başında yaşanan teknik problemleri tespit
eder, alternatif çözüm yolları arar, değerlendirir ve uygular.
1 2 3 4 5
8. Profesyonellik: Mesleki sorumluluklarının bilincinde olarak
işini yapar; ilişkide bulunulan kişilerle gerekli olan mesafeyi
korur; işle ilgili sorunları kişiselleştirmez.
1 2 3 4 5
1 2 3 4 5
Zayıftır Geliştirilmesi
gerekir
Orta seviyededir Başarılıdır Çok
başarılıdır

115
APPENDIX F
THE GRS-FORMATTED PERFORMANCE APPRAISAL FORM USED IN THE STUDY
PERFORMANS DEĞERLENDİRME FORMU
Çalışanın ismi: Zeynep Özkan
Değerlendiren (RUMUZ): _________________
Değerlendirme Tarihi: ______________
Aşağıda, Orta Doğu Teknik Üniversitesi’nde Bölüm Sekreteri olarak çalışan elemanların performansını kapsayacak şekilde temel performans boyutları sunulmuştur. Amiri tarafından performansı tanımlanan Zeynep Özkan'ın her bir boyuttaki performansını, aşağıda sunulan beş basamaklı ölçeği kullanarak değerlendiriniz. Her bir boyutta, Zeynep Hanım’ın performansını en iyi yansıtan rakamı işaretleyiniz.
1 2 3 4 5
Zayıftır Geliştirilmesi
gerekir
Orta seviyededir Başarılıdır Çok
başarılıdır
1. Planlama ve organizayon 1 2 3 4 5
2. Yazılı İletişim 1 2 3 4 5
3. Yönerge ve Yönetmeliklere Hakimiyet 1 2 3 4 5
4. Teknik Yetkinlik 1 2 3 4 5
5. Takip ve Kontrol 1 2 3 4 5
6. Öğrencilerle İletişim 1 2 3 4 5
7. Problem Çözme 1 2 3 4 5
8. Profesyonellik 1 2 3 4 5
9. Genel olarak performansı 1 2 3 4 5

116
APPENDIX G
THE BOS-FORMATTED PERFORMANCE APPRAISAL FORM USED IN THE STUDY
PERFORMANS DEĞERLENDİRME FORMU
Çalışanın ismi: Zeynep Özkan
Değerlendiren (RUMUZ): _____________________
Değerlendirme Tarihi: _______________
Aşağıda Orta Doğu Teknik Üniversitesi’nde Bölüm Sekreteri olarak çalışan elemanların performanslarını değerlendirmek üzere hazırlanmış; bir değerlendirme formu yer almaktadır. Sizden bu formu kullanarak, amiri tarafından performansı tanımlanan Zeynep Özkan'ın performansını değerlendirmeniz istenmektedir. Formda yer alan her bir davarnışın Zeynep Hanım tarafından ne sıklıkla yapılmasını beklediğinizi, sunulan 5-basamaklı ölçeği kullanarak belirtiniz. Eğer verilen davranışın yapılma sıklığı hakkında bir beklentiniz yoksa, 6 (Fikrim yok) şıkkını işaretleyiniz.
1 2 3 4 5 6
Hiçbir
zaman
Nadiren Zaman
zaman
Sıklıkla Her zaman Fikrim yok
1. Yapılacak işleri önceden belirler. 1 2 3 4 5 6
2. İşi için gerekli olan bilgisayar programlarını etkin bir şekilde kullanır.
1 2 3 4 5 6
3. İş başında yaşanan problemleri tespit eder. 1 2 3 4 5 6
4. Kurumunu en iyi şekilde temsil eder. 1 2 3 4 5 6
5. Mesleki sorumluluklarının bilincinde olarak işini yapar. 1 2 3 4 5 6
6. İlgili işleri yürütmek için gerekli olan yönetmelik ve
mevzuat konusunda bilgilidir.
1 2 3 4 5 6
7. Mesai saatleri dışında çalışmaya isteklidir. 1 2 3 4 5 6

117
8. Takım çalışmasına yatkındır. 1 2 3 4 5 6
9. Öğrencilerin ihtiyaçlarına, onları doğru şekilde
bilgilendirerek ve onlarla yapıcı ilişkiler kurarak karşılık
verir.
1 2 3 4 5 6
10. Meydana gelen problemler için alternatif çözüm yolları
arar, değerlendirir ve uygular.
1 2 3 4 5 6
11. Ofis malzemelerinin ve bölüm için gerekli olan diğer sarf
malzemelerinin listesini tutar, eksilenleri belirler, yerine
koyar.
1 2 3 4 5 6
12. İlgililerin ihtiyaçlarına uygun şekilde, yazılı olarak etkili
iletişim kurar.
1 2 3 4 5 6
13. İş arkadaşlarına iş konusunda yardımcı olur. 1 2 3 4 5 6
14. İlişkide bulunulan kişilerle gerekli olan mesafeyi korur;
işle ilgili sorunları kişiselleştirmez.
1 2 3 4 5 6
15. İşleri önem sırasına dizer ve işleri birbirlerini
aksatmayacak bir şekilde yürütür.
1 2 3 4 5 6
16. Yazılı bilgileri hatasız ve eksiksiz bir biçimde anlar,
yazar ve yorumlar.
1 2 3 4 5 6


