
Accounting and Business Research. Vol. 40. No. 4, pp. 333-352,2010 333
The effect of takeovers on the fundamentalvalue of acquirersPaul M. Guest, Magnus Bild, and Mikael Runsten*
Abstract - This paper develops a new methodology to examine the financial impact of acquisitions, designed to addresswhether takeovers yield a positive net present value for the acquiring company. Specifically, we employ the residual incomevaluation metfiod to compare the fundamental value of the acquiring company before acquisition with the fundamental valueafter acquisition. We apply this methodology to 303 UK acquisitions completed during 1985-1996, and compare the resultswith the effects of takeover on profitability and short- and long-run share returns. We find that the impact of acquisition onfundamental value is slightly negative but statistically insignificant. This result differs from tlie effect of takeover onprofitability, which is significantly positive, and the effect of takeover on share returns, which is significantly negative.
Keywords: acquisitions; fundamental value; residual income; profitability; share returns
1. IntroductionFrom the perspective of acquiring firms, a questionof paramount importance is whether the presentvalue of the financial benefits from an acquisition isgreater than the present value of the costs. In otherwords, is the acquisition a positive net present valueinvestment? If it is, then the fundamental value ofthe acquiring firm should increase following acqui-sition, hence creating value for acquirer sharehold-ers. According to financial theory, this is a keycriterion that acquirers should apply and, appar-ently, a method that many finance executives ofacquiring companies do apply (Graham andHarvey, 2001).
There is a vast research literature on the financialeffects of takeover, which has primarily employedtwo distinct methodologies. Profitability studiescompare the post-acquisition performance of theacquiring firm with the pre-acquisition performanceof the acquiring and acquired firm. Share returnevent studies examine the share price impact of theacquisition on the acquired and acquiring firms. Inaddressing the specific question of whether theacquisition is a positive net present value invest-ment and increases the fijndamental value of theacquirer, both methods have drawbacks.
*Tfie first author is from Birkbeck College, London and thesecond and third authors are from the Stockholm School ofEconomics Research Institute, Stockholm, Sweden.
They are grateful to two anonymous referees, the editor(Pauline Weetman), Robin Chatterjee, Robert Conn, AndyCosh, Alan Hughes and Sudi Sudarsanam for insightfiil andhelpful comments.
Correspondence should be addressed to: Paul Guest,Birkbeck College, Malet Street, London WCIE 7HX. E-mail:[email protected].
This paper was accepted for publication in September 2009.
Profitability studies are not designed to addressthis question and hence do not account for crucialaspects such as the timing of profits earned, or theamount paid for the target company. Share returnstudies examine the impact of an acquisition on theacquirer's share price at announcement, but theimpact on share price may be very different from theimpact on fiindamental value. For example, anacquisition may be a positive net present valueinvestment but not to the extent that the marketexpected, and hence share price may fall despite theacquirer's fundamental value increasing.
In this paper we develop an alternative method-ology to address the impact of acquisitions on thefiindamental value of acquirers, and test it on asample of acquiring firms. Our approach is based onthe residual income approach to fiandamental valu-ation. In recent years accounting research has re-explored fundamental approaches to corporatevaluation and models based on residual incomehave attained a widespread use (e.g. Lee, 1999). Weuse the residual income approach to estimate thefiindamental value of acquirers before acquisitionand compare this valuation with their fiindamentalvalue following the acquisition. If takeovers createfundamental value for acquiring firms, then thelatter should be greater than the former. Ourapproach provides an alternative methodology thatavoids some of the weaknesses of profit and sharereturn studies in addressing this specific issue.However, it is important to note that it shares someweaknesses and has its own separate weaknesses,which we discuss below.
We apply the residual income methodology to asample of 303 domestic UK acquisitions involvingpublic companies. We compare the results of this
334 ACCOUNTING AND BUSINESS RESEARCH
approach with the effects of takeover on profitabil-ity and short-and long-run share returns. We findthat the impact of acquisition on fiindamental valueis insignificantly negative. This result differs mark-edly fi-om the effect of takeover on profitability,which is significantly positive, and the effect oftakeover on share returns, which is significantlynegative. Although acquirers improve their profit-ability, this does not result in a significant increasein fundamental value. The main contribution of thisstudy is to use an established valuation technique todevelop a new methodology for measuring theperformance of acquiring firms.
The paper is organised as follows: The nextsection reviews the empirical literature on acquisi-tion performance, and discusses why existingmethods may not adequately measure the impacton fiandamental value. Section 3 describes thesample. Section 4 describes the methodology.Section 5 reports the results from the empiricalanalysis and Section 6 concludes.
2. Literature reviewIn this section we consider what the existingempirical literature on acquisitions tells us aboutthe effect of takeovers on fundamental value. InSection 2.1 we examine profitability studies and inSection 2.2 we consider the event study literature.
2.1. Profitability studiesThe objective of profitability studies is to examinewhether an acquisition improves the profitability ofthe combined assets of the acquirer and acquiree.The approach examines the difference between thepost-acquisition performance of the acquirer (whichincludes the acquiree post-acquisition) and the pre-acquisition combined (weighted average) perform-ance of the acquirer and acquiree. It then comparesthis difference with a benchmark based on, forexample, control firms matched by industry andsize. The evidence for the UK appears to depend onthe sample period. For studies covering the 1960sand 1970s, some studies (Meeks, 1977; Chatteijeeand Meeks, 1996) find little evidence of improvedprofitability, whilst others (Cosh et al., 1980) findevidence of significant improvements. However,studies for the 1980s and 1990s consistently findevidence of significant improvements in perform-ance (Chatterjee and Meeks, 1996; Manson et al.,1994; Manson et al., 2000; Powell and Stark, 2005and Cosh et al., 2006).'
The methodology of profitability studies is not
'For reviews, see Hughes (1989), Tuch and O'Sullivan(2007) and Martynova and Renneboog (2008).
designed to address how takeovers impact thefiindamental value of the acquirer, and thus it isdifficult to infer this particular impact. There areseveral reasons for this.
First, in estimating the impact on fiindamentalvalue, the appropriate comparison is the fiindamen-tal value of the acquirer with the acquisitioncompared with the fiindamental value of theacquirer without the acquisition. Profitability stud-ies compare the acquirer's post-acquisition per-formance with the pre-acquisition weighted averageperformance of the acquirer and acquired com-panies. However, the pre-acquisition weightedaverage measure is not an appropriate benchmarkfor the acquirer's performance in the absence of theacquisition.
Second, the change in the acquirer's profitsfollowing an acquisition needs to be considered inrelation to the acquirer's cost of capital. Forfundamental value to be created, any marginalprofit return must be greater than the marginal costof capital. For example, the profitability of theacquirer could be lower following acquisition, but ifthe marginal profitability is higher than the marginalcost of capital, then the acquisition may createfiindamental value.
Third, profitability studies give equal weight toeach post-takeover year. However, the timing ofprofits is important in establishing whether acqui-sitions increase fiandamental value, and fiitureprofits should be discounted by an appropriatecost of capital.
Finally, by explicitly excluding goodwill onacquisition fi-om the acquirer's post-acquisitionbalance sheet and employing a pre-amortisationprofit measure, profitability studies do not accountfor the price paid for the target company. The reasonfor this is that the objective of these studies is tocompare the pre-acquisition combined performancewith the post-acquisition combined performance,and including purchased goodwill would induce adownward bias to the profitability change.^However, to examine the impact of takeover onfiindamental value, this goodwill, which representspart of the cost of acquisition, must be taken intoaccount. Alberts and Varaiya (1989) argue thatgiven the large premiums that are typically paid, it isunlikely that the average acquisition creates fiinda-mental value for the acquirer.
A rare exception would be where the acquisition is paid forfrom the acquirer's cash reserves. In this case, removinggoodwill would result in the combined assets being lowerfollowing acquisition, and therefore removal of goodwill willcause a positive bias to the impact of takeover on profitability.
Vol. 40, No. 4. 2010 335
2.2. Share return studiesThe majority of takeover event studies or sharereturn studies examine share returns to the acquirerand acquiree over a short-run period surroundingthe announcement. Since these studies measurereturns over very short time periods, compared toprofitability studies they have the advantage ofbeing less subject to problems of noise andbenchmark error. The results show significantgains for target shareholders, zero to negativereturns for acquiring shareholders, and significantgains overall.^ Two recent UK studies for the periodunder consideration in this paper report signifi-cantly negative abnormal returns to acquirers(Sudarsanam and Mahate, 2003 and Conn et al,,2005). The announcement returns have been inter-preted as directly showing the impact on ñinda-mental value of the acquisition, and hence showingthat acquisitions are a zero or negative net presentvalue investment for acquirers (see Bruner, 2002).A number of event studies also examine sharereturns over a long-run post-acquistion period andfind evidence of significant negative returns.'* Theseinclude UK studies that overlap our sample timeperiod such as Gregory (1997), Sudarsanam andMahate (2003) and Conn et al. (2005). Oneinterpretation of long-run negative returns is thatthey are evidence of initial market misvaluations oftakeover gains, which reverse over the long run.
However, the share price reaction of the acquireraround the announcement and over the long runmay not reflect the impact on the acquirer'sfixndamental value. The problem is that theannouncement (and long-run) returns reveal infor-mation not just about the potential synergies arisingfi-om the combination and how the value is splitbetween the target and the bidder, but also thebidder's standalone value. It is seldom possible todisentangle the impact on stock prices of theseeffects and thereby evaluate whether the marginalbenefit of the acquisition to the acquirer is greaterthan the cost.
One problem is anticipatory market prices. Forexample, when an acquirer makes a positive netpresent value acquisition, the market value of thefirm will be affected, depending on whether the netpresent value meets expectations. If the marketexpects a firm to make high positive net presentvalue acquisitions, market prices will build in thisexpectation, and even if the new acquisition has apositive net present value, share price may decline
^For reviews, see Tuch and O'SuUivan (2007) andMartynova and Renneboog (2008).
"For reviews, see Hughes (1989), Tuch and O'Sullivan(2007) and Martynova and Renneboog (2008).
if the acquisition does not meet market expect-ations.^
Another problem is stock market mispricing.Acquisitions (especially those made with equity)may reveal to the market that acquirers areovervalued, and part of the announcement (andlong-run) return may reflect a negative reaction toperceived overvaluation rather than fundamentalvalue destruction (Shleifer and Vishny, 2003). Angand Cheng (2006) and Dong et al. (2006) provideevidence consistent with this.^
In summary, because of market expectations andstock market mispricing, event studies may notmeasure the impact of acquisitions on the fianda-mental value of the acquirer. Similarly, it is difficultto infer the impact of a takeover on fundamentalvalue from profitability studies, since they do notmeasure the total discounted value effect of atakeover. For these reasons, we adopt a residualincome valuation method as an alternative means ofassessing the impact of an acquisition on theacquirer's fundamental value.
3. The sampleWe examine a comprehensive sample of acquisi-tions of UK public companies by UK publiccompanies, completed between January 1985 andDecember 1996. The acquisitions are drawn fi-omthe Thomson Financial publication AcquisitionsMonthly. Takeovers are defined as occurring whenthe acquirer owns less than 50% of the target'sshares before the takeover, and increases its own-ership to at least 50% as a result of the takeover. Weinclude takeovers for which Datastream holds bothbidder and target accounting data for a minimumperiod of two years before and two years after thetakeover. This results in an initial sample of 358acquisitions. We exclude acquisitions in whicheither the acquirer, target or control firms have anegative equity book value in any of the four yearsbefore or following the acquisition, since ourperformance measures are nonsensical for such
' Jensen and Rubaek (1983) report that returns tend to bemuch larger for acquisition programme announcements than forsubsequent acquisition announcements, and argue that theimpact of an acquisition on fundamental value may have beenincorporated at the time of an acquisition programme announce-ment.
* Bhagat et al. (2005) point to other 'revelation biases' thatresult in both accounting and event study returns providing abiased estimate of the fimdamental gains fi-om takeovers. Forexample, the fact of a bid may reveal prospeets for futureaecounting improvements that would have occurred evenwithout a takeover. Bhagat et al. (2005) and Hietala et al.(2003) use an interventionist approaeh to avoid sueh effects, andshow that takeovers have a positive impact on acquirer returns.However, sueh approaches ean only be applied to specificsamples of acquisitions.
336 ACCOUNTING AND BUSINESS RESEARCH
Table 1Transaction descriptives for the acquisition sample
% of acquisitions by method of payment
CashEquityMixedOther
Average bid premium (%)Average relative size (%)% of horizontal acquisitions
21.4557.1012.878.58
36.8035.7234.98
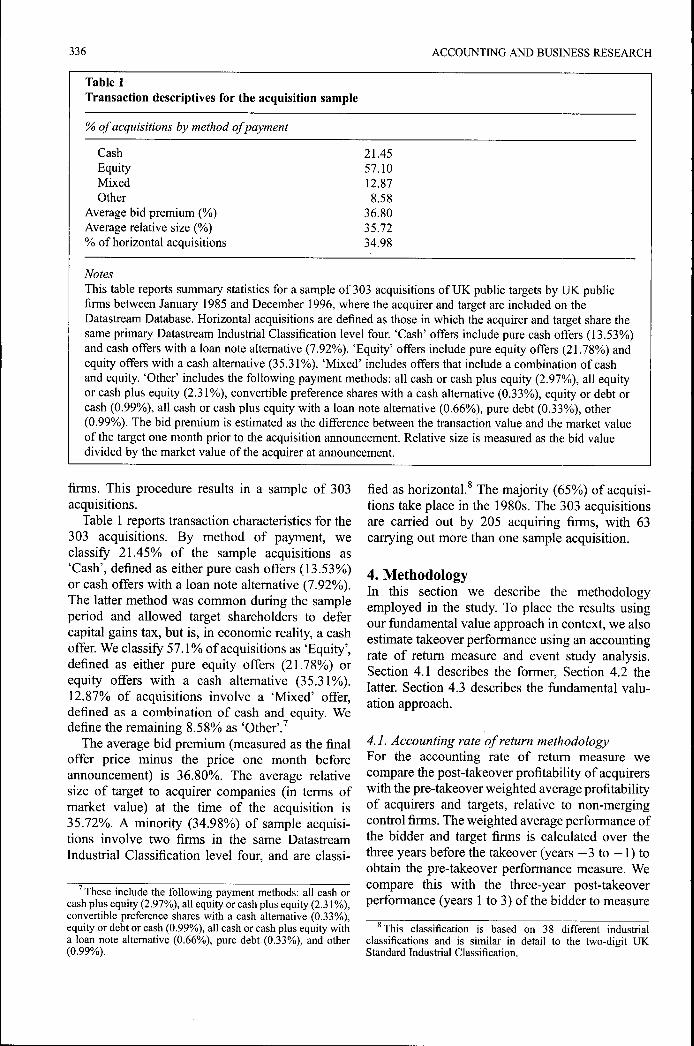
NotesThis table reports summary statistics for a sample of 303 acquisitions of UK public targets by UK publicfirms between January 1985 and December 1996, where the acquirer and target are included on theDatastream Database. Horizontal acquisitiotis are defined as those in which the acquirer and target share thesame primary Datastream Industrial Classification level four. 'Cash' offers include pure cash offers (13.53%)and cash offers with a loan note alternative (7.92%). 'Equity' offers include pure equity offers (21.78%) andequity offers with a cash alternative (35.31%). 'Mixed' includes offers that include a combination of cashand equity. 'Other' includes the following payment methods: all cash or cash plus equity (2.97%), all equityor cash plus equity (2.31%), convertible preference shares with a cash alternative (0.33%), equity or debt orcash (0.99%), all cash or cash plus equity with a loan note alternative (0.66%), pure debt (0.33%), other(0.99%). The bid premium is estimated as the difference between the transaction value and the market valueof the target one month prior to the acquisition announcement. Relative size is measured as the bid valuedivided by the market value of the acquirer at announcement.
firms. This procedure results in a sample of 303acquisitions.
Table 1 reports transaction characteristics for the303 acquisitions. By method of payment, weclassify 21.45% of the sample acquisitions as'Cash', defined as either pure cash offers (13.53%)or cash offers with a loan note ahemative (7.92%).The latter method was common during the sampleperiod and allowed target shareholders to defercapital gains tax, but is, in economic reality, a cashoffer. We classify 57.1% of acquisitions as 'Equity',defined as either pure equity offers (21.78%) orequity offers with a cash alternative (35.31%).12.87% of acquisitions involve a 'Mixed' offer,defined as a combination of cash and equity. Wedefine the remaining 8.58% as 'Other'.'
The average bid premium (measured as the finaloffer price minus the price one month beforeannouncement) is 36.80%. The average relativesize of target to acquirer companies (in terms ofmarket value) at the time of the acquisition is35.72%. A minority (34.98%) of sample acquisi-tions involve two firms in the same DatastreamIndustrial Classification level four, and are classi-
^ These include the following payment methods: all cash orcash plus equity (2.97%), all equity or cash plus equity (2.31%),convertible preference shares with a cash alternative (0.33%),equity or debt or eash (0.99%), all cash or cash plus equity witha loan note alternative (0.66%), pure debt (0.33%), and other(0.99%).
fied as horizontal.^ The majority (65%) of acquisi-tions take place in the 1980s. The 303 acquisitionsare carried out by 205 acquiring firms, with 63carrying out more than one sample acquisition.
4. MethodologyIn this section we describe the methodologyemployed in the study. To place the results usingour fundamental value approach in context, we alsoestimate takeover performance using an accountingrate of return measure and event study analysis.Section 4.1 describes the former. Section 4.2 thelatter. Section 4.3 describes the fundamental valu-ation approach.
4.1. Accounting rate of return methodologyFor the accounting rate of return measure wecompare the post-takeover profitability of acquirerswith the pre-takeover weighted average profitabilityof acquirers and targets, relative to non-mergingcontrol firms. The weighted average performance ofthe bidder and target firms is calculated over thethree years before the takeover (years - 3 to - 1 ) toobtain the pre-takeover performance measure. Wecompare this with the three-year post-takeoverperformance (years 1 to 3) of the bidder to measure
^This classification is based on 38 different industrialclassifications and is similar in detail to the two-digit UKStandard Industrial Classification.
Vol. 40, No. 4. 2010 337
the performance change caused by the merger. Theabnormal profit return is the difference between thischange for the combined firm and the change for theweighted-average control firms. The weights for thecontrol firms are the relative equity book values ofbidders and targets in year —1. Consistent withprevious studies, we exclude year 0, the year ofconsolidation, from the analysis. This is becausewith acquisition accounting, the consolidated profitand loss account of the acquirer in year 0 onlyshows the proportion of the target's profits earnedsince the date of acquisition.^ If acquirers die withinthe four post-takeover years, the year of deathbecomes the final year of analysis.
As the specific measure of profitability, we use areturn on equity (ROE) measure, consisting of netincome, scaled by the opening period book value ofordinary shareholders fiinds.'° We select thismeasure because it is most closely linked to themeasure used in the residual income methoddescribed in Section 4.3 below.
To benchmark the change in profitability, we usenon-merging control firms matched by industry andsize. Previous acquisition studies show thatacquirers tend to have above average size(Hughes, 1989), while acquisitions tend to clusterin specific industries that are undergoing fianda-mental shocks (for the US see Mitchell andMulherin, 1996 and Andrade and Stafford, 2004,whilst for the UK see Powell and Yawson, 2005).Previous performance studies show that both fac-tors can determine future profitability (Barber andLyon, 1996). We select the control firms fi'om allfirms listed on Datastream that neither made, norreceived, a takeover offer for a public companyduring the three years before and after the acqui-sition year and that have accounting data onDatastream over this period. We first match eachsample firm to all non-merging firms in the sameDatastream Industrial Classification level four,which is equivalent to Standard IndustrialClassification Level 2. Second, we select the firmwithin this industrial code with book value of totalassets closest to the sample firm's book value in theyear prior to takeover. ' '
' In separate tests, we include year 0 and therefore examinefour years of post-acquisition data. The results are very similarand our conclusions unchanged.
'" In separate tests, we use an average of opening and closingbook equity as the denominator. The results using thisalternative method are very similar and our conclusionsunchanged.
' ' The average (median) total asset size in the year prior totakeover for sample firms and their controls are as follows;acquirers, £1,346.1 m (£194.Im); acquirer control firms,£l,700.1m (£144.4m); target firms, £182.2m (£29.4m); targetcontrol firms, £323.0m (£34.0m).
To measure takeover performance, we use asimple change model that compares pre- and post-acquisition performance as follows:
Takeover performance = ROEpo« - ROEpre ( 1 )
where ROE^o^, is the mean abnormal profit rate forthe three post-takeover years, ROE^^^ is the meanabnormal profit rate for the three pre-takeover years,and by abnormal, we mean the sample firm's ROEminus the control firm's ROE.
A potential problem with the change model inEquation (1) is that if acquirers have above averagepre-acquisition profitability, then profitability maydecline following takeover because of mean rever-sion in profitability, regardless of any takeoverimpact. The studies referred to above showacquirers have above average pre-acquisition prof-itability. Rather than match on this additional factor,which would mean compromising on either theindustry match or the size match, we employ theregression model employed by previous studies(Manson et al., 2000), regressing the post-takeoverabnormal profit rate for each acquisition on anequivalent pre-takeover abnormal profit rate asfollows:
= a -f iSROE + e (2)
The coefficient ß allows for mean reversion inprofitability and the intercept a gives an estimate ofthe average improvement in performance. Bycontrolling for pre-takeover performance in thisway, the mean unexplained post-takeover perform-ance (the intercept a) is attributable to the take-over.'^
As noted in Section 2.1 above, if goodwill ariseson acquisition and is capitalised on the acquirer'sbalance sheet, this may impose a downward bias onthe profitability measure compared to the pre-takeover combined performance benchmark.Hence, previous studies have removed goodwillon acquisition from the acquirer's post-acquisitionassets. Over our sample period, UK acquirers couldaccount for an acquisition using either 'acquisition'or 'merger' accounting. Acquisition accountinginvolves consolidating the acquiree's assets at fairvalues, capitalising goodwill on the acquirer'sbalance sheet with amortisation. Merger accounting
'^Although Equation (2) controls for pre-bid profitability, itmay produce biased results when acquirers differ fi'om controlfirms on unmatched permanent characteristics that determinefi.iture profitability (Ghosh, 2001). In such cases, the interceptpicks up the effect of these factors on profitability and a simplechange model as in Equation (1) is more appropriate. However,if the matching method does not control for a temporary (ratherthan permanent) driver of profitability, then both models areequally biased (Ghosh, 2001).
338 ACCOUNTING AND BUSINESS RESEARCH
involves adding the acquirer's and acquiree's assetsand liabilities together at book values without anygoodwill. From the start of our sample period to1998, most UK acquirers used the acquisitionmethod but then immediately wrote off the pur-chased goodwill as they were allowed to do(Higson, 1998; Gregory, 2000).'^ Capitalised good-will (and hence any expected bias) is thereforeexpected to be negligible for the acquirers in oursample.'"^
For our 303 sample acquisitions, of the 182sample acquisitions for which the ThomsonFinancial SDC Database reports the accountingmethod, in only one case does the acquirer usemerger accounting. The vast majority of our sampleacquirers also appear to write off goodwill imme-diately against reserves. Of the 303 acquirers,269 have zero goodwill and intangible assets ontheir balance sheet at year 0, and a further fourreport no change fi^om year — 1 to year 0. Thus, atmost 34 sample acquirers capitalise goodwillfollowing the acquisition, though the figure maybe less since the change could reflect other changessuch as incorporated target goodwill, or the pur-chase or revaluation of other intangible assets. Inwhat follows, for robustness, we report results forboth the entire sample and for the reduced sample of269 acquirers that do not capitalise goodwill onacquisition. We consider the robustness of ourresults in Section 5.1 below.
4.2. Event study methodologyWe estimate abnormal share returns for both theannouncement month, and the 36-month post-takeover period beginning the month followingcompletion. In measuring post-takeover returns, weemploy two measures, paying careful attention tothe potential problem of cross-sectional dependencein returns. This is a potential problem for our samplebecause acquisitions tend to cluster by both timeand industry (Mitchell and Mulherin, 1996), caus-ing standard errors to be biased downwards and/-statistics to be biased upwards (Barber and Lyon,1997; Fama, 1998; Lyon et al., 1999; Mitchell andStafford, 2000).
First, we estimate buy-and-hold abnormal returns(BHARs) and calculate i-statistics which are
'•̂ Following FRS 10 in 1998, UK acquirers using acquisitionaccounting were no longer allowed to immediately write offgoodwill to reserves.
'''Higson (1998) shows that acquirers tended to write downthe values of acquired assets below book values. The effect ofthis is to innate goodwill on acquisition, and writing off thisgoodwill reduces equity book values, hence improving post-acquisition return on equity. This would cause an upward bias tothe profitability results.
adjusted for cross-sectional dependence using thefollowing approximation for the standard deviation(Mitchell and Stafford, 2000): oBHAR (independ-ence) / oBHAR (dependence) ~\Ñ\+ {N-l)p i,jwhere o BHAR = standard deviation of individualBHARs, N = number of sample acquisitions andpi,f = average correlation of individual BHARs. Asan estimate for pif, we use the estimate of 0.002calculated by Conn et al. (2005) for a larger sampleof acquisitions over our sample period.'^
Second, we use the Jaffe (1974) - Mandelker(1974) calendar time portfolio technique. In eachcalendar month we form a portfolio of event firms,and take the average cross-sectional abnormalreturn for that month. The average abnormal returnfor the entire sample is the time series average andthe i-test is calculated using the time series standarddeviation, which is not biased in the presence ofcross-sectional dependence (Lyon et al., 1999).
The abnormal returns are estimated relative to theacquirer industry and size matched control firmsdescribed in Section 4.1 above. The control firmapproach is preferred to a reference portfolioapproach because it avoids both the skewness andrebalancing biases (see, e.g. Barber and Lyon,1997). The skewness bias occurs if the distributionof long-run abnormal stock returns is skewedpositively. The rebalancing bias occurs becausethe compound returns of a reference portfolio, suchas a market index, are calculated assuming periodicrebalancing. As with the accounting rate of returnmethodology, where acquirers die within the36 post-takeover months, the month of death isthe final month of evaluation.'^
4.3. Fundamental valuation methodologyTo measure the effect of takeover on fundamentalvalue, we examine the difference between the pre-acquisition expected fiandamental value of acquir-ing firms and the realised post-acquisition funda-mental value. If acquisitions create fiindamentalvalue, then the difference should be positive. Thevaluation method we use to measure fundamentalvalue is the residual income valuation (RTV)method (Preinreich, 1938; Edwards and Bell,1961; Peasnell, 1982; Stark, 1986; Feltham and
'^Conn et al. (2005) calculate average pairwise correlationsof annual BHARs for all acquirers that complete acquisitions inthe same month, the grand average for which is 0.008. They thenassume that the average correlation for overlapping observa-tions is linear in the number of months of calendar time overlap,ranging fi-om zero for non-overlapping observations to theestimated average correlation of 0.008 for acquirers withcornplete overlap.
' In additional tests we instead replace the remainingacquirer missing months with the return for the control firm.The results using this alternative method are very similar.
Vol. 40, No. 4. 2010 339
Ohlson, 1995; Ohlson, 1995). In this section, wepresent the basic RTV model and adapt it for ourparticular study.
4.3.1. The RfV modelThe RTV model rests on three basic assumptions.First, fundamental value equals the present value ofexpected dividends:
(3)
where V, is the stock's fundamental valuation attime t, £,[•] = expectation based on informationavailable at time t, D,+i = dividends for period t+i,and re = cost of equity capital.
Second, the clean surplus accounting relationstates that all changes in the book value of equitypass through the income statement:
B, = B,., + NI, - D, (4)
where B¡ = book value of equity at time t and NI, =net income for period /. This assumption allowsdividends to be expressed in terms of fiitureearnings and book values. Combining the cleansurplus relation in Equation (4) with Equation (3)and rearranging yields:
í=i (1(5)
The final term in Equation (5) is assumed to be zero.The second term is the present value of ñitureresidual income. Hence fiindamental value equalsthe sum of book value and the present value offiiture residual income.
(6)
Practical application of Equation (6) necessitates atruncated forecast horizon with an assumptionregarding the terminal value at the horizon. Over afinite horizon, the model can be modified to includea terminal value estimate as follows:
(7)\(+7'-l
The second term on the right hand side ofEquation (7) represents abnormal earnings in thefirst T periods and the third term represents the'terminal value', measured as the abnormal earningsof period t+T, discounted in perpetuity assuming nofiirther growth in B after year T.
4.3.2. Adopting the RfV model to measure theimpact of acquisition on the fiindamental values ofacquirersTo measure the impact of an acquisition on thefundamental value of the acquiring firm, we calcu-late the realised fiindamental value of the acquirerfollowing the acquisition and compare this with theexpected fiindamental value of the acquirer prior toacquisition.
Equation (7) is our starting point for estimatingthe former. We choose a forecast horizon of fouryears of accounting performance following acqui-sition, in order to ensure consistency with theprofitability and event study methodologiesdescribed above. Equation (7) is hence first modi-fied as follows for the realised post-acquisitionvalue of the acquirer:
Vpost = 5 _, NIo-r,.B_i ,
. H 7-;— ^ h -
NI2 - NI3 -(8)
The first term is book value in year —1, the lastaccounting year before completion of the acquisi-tion. Year 0 is the year of consolidation, theaccounting year following the completion date ofthe acquisition. The second, third and fourth termsdescribe residual income in years 0, 1 and 2. Thefifth term describes the terminal value, which is theabnormal earnings of year 3 discounted in perpetu-ity.
Acquisitions often involve issuing shares to theacquired firm's shareholders as a method ofpayment. Issuing new shares can increase totalfundamental value whilst reducing value per share,and therefore we must focus on the impact of anacquisition on the per share fiindamental valuerather than the overall fiindamental value (Penman,2007: 94). We therefore divide each term inEquation (8) by the number of shares to get pershare values as follows:
„ = BPS_,EPSo - r^.BPS-i
EPS+i - re.BFSp EPS2 - r,.BPSi
EPS3 - i(9)
where BPS is book equity per share, and EPS is netincome (earnings) per share.'^
In the absence of any violations of clean surplus
'^ Other residual income studies also calculate fundamentalvalue on a per share basis (e.g. Penman and Sougiannis, 1998).
340 ACCOUNTING AND BUSINESS RESEARCH
accounting, we can use Equation (9) to estimate therealised fundamental value of the acquirer follow-ing the acquisition. However, in the case ofacquisitions, there are potential violations of cleansurplus accounting (discussed below) in year 0,which impact book value in year 0 but do not passthrough the income statement in year 0. In order toavoid these dirty surplus effects in our estimate ofpost-acquisition fundamental value, rather thaninclude book value from year —1 and residualincome from year 0 (as in Equation (9)), we replacethese terms with book value and dividends fromyear 0 as follows:'*
DPSo BPSo EPS 1 - i-,.BPSo
-I-EPS2 - r,.BPS| EPS3 - r,.BPS 2
(10)
The first two terms are dividends per share (DPS)and book value per share (BPS) in year 0. The lastthree terms are the same as in Equation (9).Equation (10) avoids dirty surplus effects becauseby year 0, the dirty surplus effect on book value hasalready occurred. Therefore, any change in futureresidual income caused by the altered book value(i.e. cost of equity multiplied by book value, terms3, 4 and 5 in Equation (9)) is offset by the alteredbook value in year 0 (term 2 in Equation (10)). Notethat Equations (9) and (10) give identical valuationsif there is no violation of clean surplus accounting in
'^Let us first assume that cash, rather than shares, is
used to pay for the acquisition. The first reason fordirty surplus accounting effects in acquisitions isthe method of accounting used. While the acquisi-tion method with goodwill capitalisation, with orwithout amortisation, creates no dirty surplus effect,immediate goodwill write-off (or merger account-ing) violates clean surplus accounting in year 0.However, neither method affects Equation (10)because any change in book value in year 0 exactlyoffsets the corresponding change in discountedfuture earnings (Penman, 2004: 577-578).^° Thus,with Equation (10), whether merger or acquisitionaccounting is used, goodwill is immediately writtenoff or capitalised, or if capitalised, held with or
'^See Penman (2007: 570) for a broad description of thisapproach.
'This and the subsequent assertions in this section areshown numerically in a seperate document which is availablefrom the first author on request.
^'' In contrast, applying Equation (9) to sueh eases results inan upwardly biased value (assuming goodwill is positive)because the lower book value results in a lower capital charge,increasing residual income.
without amortisation, leaves post-acquisition valueunaffected.^' However, it should be noted that ifgoodwill is amortised. Equation (10) is affected bywhether the earnings per share (EPS) figure used inthe terminal value calculation includes the amort-isation charge or not, because this calculationshould be based on steady state EPS (i.e. with noamortisation). In practice. Equation (10) can beadjusted by adding amortisation back to EPS andbook value per share (Penman, 2001: 653-654).^^
The second reason for dirty surplus accountingeffects is the issue of shares to pay for theacquisition. So far we have assumed that theacquisition is paid for with cash and in this caseonly if goodwill is written off is there a dirty surpluseffect. However, if instead the acquisition is fundedby shares, there is always an increase in the bookvalue of the acquirer that bypasses the incomestatement, and hence, irrespective of the accountingmethod used, there is always a dirty surplusaccounting effect in year 0. Compared to year — 1,from year 0 onwards the acquiring firm's share-holders now additionally own the book value of thetarget company and its future residual income. Inexchange, the acquiring firm's shareholders give theacquired firm's shareholders a share in the post-acquisition fundamental value of the acquirer. Thesize of this share, determined by the number ofshares given to the acquired firm's shareholders,determines whether or not the acquisition createsvalue for the acquirer's pre-acquisition sharehold-ers. Equation (10) incorporates both these impactsof the acquisition, because it measures fundamentalvalue from year 0 onwards and does so on a pershare basis. The number of shares issued to targetshareholders can be a source of fundamental valuecreation or destruction for pre-acquisition share-holders. For example, the acquirer can createfundamental value by using an artificially low
^' For UK listed firms, violations of clean surplus accountingdue to the accounting method used for acquisitions are no longera eoneem since 2004. IFRS3 (LASB, 2004) banned the use ofmerger accounting for all EU listed firms, banning the use forany firms applying IFRS 3 who must instead use purchaseaeeounting and hold goodwill with impairment. (AlthoughFRS 10 (ASB, 1998) banned the dirty-surplus immediate writeoff of goodwill with purchase aeeounting for UK firms, mergeraeeounting was still allowed in the UK until 1FRS3 and hencedirty surplus violations continued to some extent for UK listedfirms between 1998 and 2004).
•̂ ^ Because only a small number of our sample aequirerscapitalise goodwill, and henee potentially amortise, we addressthis potential bias by excluding such acquirers in our robustnesstests in Section 5 below.
^^ Another problem is that in the year of the share issue, thecapital charge is estimated based on the previous year's bookvalue, when in faet it should be estimated relative to the previousyear's book value plus the share issue value. Equation (10) alsoavoids this problem.
Vol. 40, No. 4. 2010 341
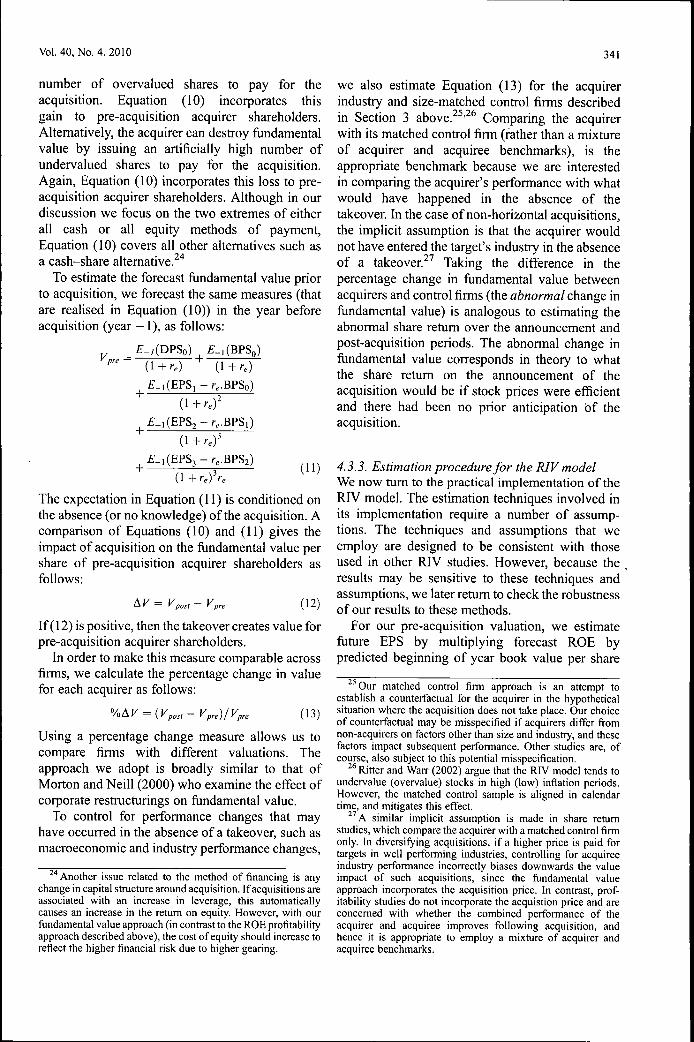
number of overvalued shares to pay for theacquisition. Equation (10) incorporates thisgain to pre-acquisition acquirer shareholders.Alternatively, the acquirer can destroy fundamentalvalue by issuing an artificially high number ofundervalued shares to pay for the acquisition.Again, Equation (10) incorporates this loss to pre-acquisition acquirer shareholders. Although in ourdiscussion we focus on the two extremes of eitherall cash or all equity methods of payment.Equation (10) covers all other alternatives such asa cash-share alternative.'^''
To estimate the forecast fundamental value priorto acquisition, we forecast the same measures (thatare realised in Equation (10)) in the year beforeacquisition (year —1), as follows:
_£-i(BPSo)
-f£-i(EPS,-
we also estimate Equation (13) for the acquirerindustry and size-matched control firms describedin Section 3 above.^^'^^ Comparing the acquirerwith its matched control firm (rather than a mixtureof acquirer and acquiree benchmarks), is theappropriate benchmark because we are interestedin comparing the acquirer's performance with whatwould have happened in the absence of thetakeover. In the case of non-horizontal acquisitions,the implicit assumption is that the acquirer wouldnot have entered the target's industry in the absenceof a takeover. ̂ ^ Taking the difference in thepercentage change in fiindamental value betweenacquirers and control firms (the abnormal change infiindamental value) is analogous to estimating theabnormal share return over the announcement andpost-acquisition periods. The abnormal change infundamental value corresponds in theory to whatthe share return on the announcement of theacquisition would be if stock prices were efficientand there had been no prior anticipation of theacquisition.
-I-- (11)
The expectation in Equation (11) is conditioned onthe absence (or no knowledge) of the acquisition. Acomparison of Equations (10) and (11) gives theimpact of acquisition on the fundamental value pershare of pre-acquisition acquirer shareholders asfollows:
Ay — y _ [/'-* ' ' post ' pre
(12)
If (12) is positive, then the takeover creates value forpre-acquisition acquirer shareholders.
In order to make this measure comparable acrossfirms, we calculate the percentage change in valuefor each acquirer as follows:
Using a percentage change measure allows us tocompare firms with different valuations. Theapproach we adopt is broadly similar to that ofMorton and Neill (2000) who examine the effect ofcorporate restructurings on fundamental value.
To control for performance changes that mayhave occurred in the absence of a takeover, such asmacroeconomic and industry performance changes,
•̂ '' Another issue related to the method of financing is anychange in capital structure around acquisition. If acquisitions areassociated with an increase in leverage, this automaticallycauses an increase in the return on equity. However, with ourfundamental value approach (in contrast to the ROE profitabilityapproach described above), the cost of equity should increase toreflect the higher financial risk due to higher gearing.
4.3.3. Estimation procedure for the RIV modelWe now turn to the practical implementation of theRIV model. The estimation techniques involved inits implementation require a number of assump-tions. The techniques and assumptions that weemploy are designed to be consistent with thoseused in other RIV studies. However, because theresults may be sensitive to these techniques andassumptions, we later return to check the robustnessof our results to these methods.
For our pre-acquisition valuation, we estimatefiiture EPS by multiplying forecast ROE bypredicted beginning of year book value per share
^'Our matched control firm approach is an attempt toestablish a counterfactual for the acquirer in the hypotheticalsituation where the acquisition does not take place. Our choiceof counterfactual may be misspecified if acquirers differ fromnon-acquirers on factors other than size and industry, and thesefactors impact subsequent performance. Other studies are, ofeourse, also subject to this potential misspecification.
^* Ritter and Warr (2002) argue that the RIV model tends toundervalue (overvalue) stocks in high (low) inflation periods.However, the matched control sample is aligned in calendartime, and mitigates this effect.
^ ' A similar implicit assumption is made in share returnstudies, which compare the acquirer with a matched control firmonly. In diversifying acquisitions, if a higher price is paid fortargets in well performing industries, controlling for acquireeindustry performance incorrectly biases downwards the valueimpact of such acquisitions, since the fiindamental valueapproach incorporates the acquisition price. In contrast, prof-itability studies do not incorporate the acquistion priée and areconcerned with whether the combined performance of theacquirer and acquiree improves following acquisition, andhence it is appropriate to employ a mixture of acquirer andacquiree benchmarks.
342 ACCOUNTING AND BUSINESS RESEARCH
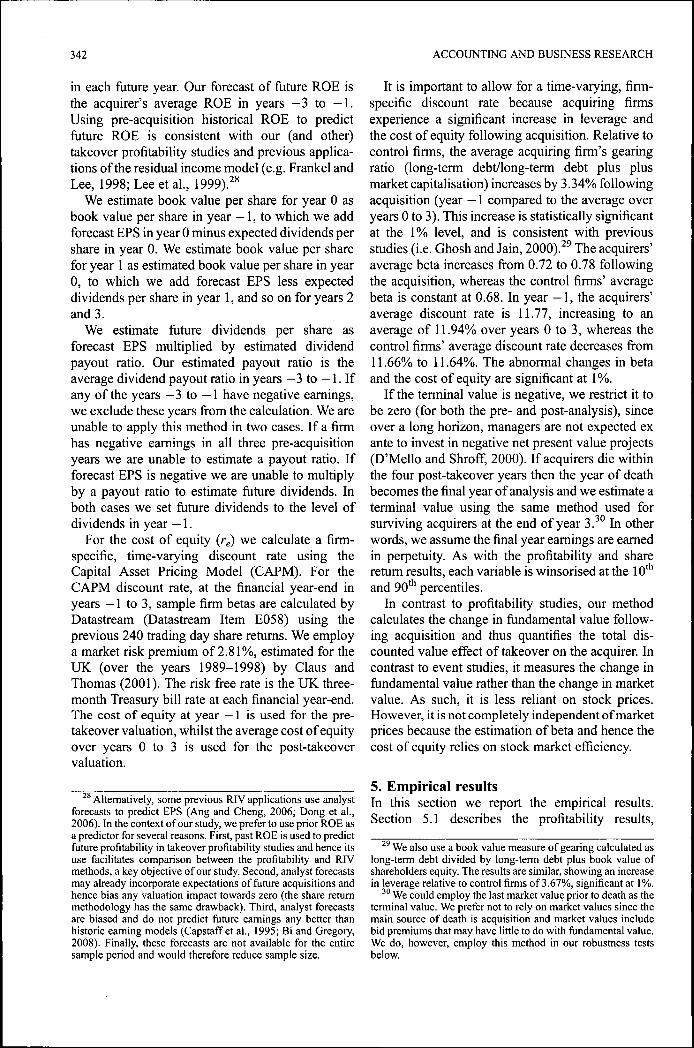
in each ftiture year. Our forecast of future ROE isthe acquirer's average ROE in years —3 to —I.Using pre-acquisition historical ROE to predictfuture ROE is consistent with our (and other)takeover profitability studies and previous applica-tions of the residual income model (e.g. Frankel andLee, 1998; Lee et al., 1999).^*
We estimate book value per share for year 0 asbook value per share in year — 1, to which we addforecast EPS in year 0 minus expected dividends pershare in year 0. We estimate book value per sharefor year 1 as estimated book value per share in year0, to which we add forecast EPS less expecteddividends per share in year 1, and so on for years 2and 3.
We estimate ftiture dividends per share asforecast EPS multiplied by estimated dividendpayout ratio. Our estimated payout ratio is theaverage dividend payout ratio in years —3 to —I. Ifany of the years —3 to —1 have negative earnings,we exclude these years from the calculation. We areunable to apply this method in two cases. If a firmhas negative earnings in all three pre-acquisitionyears we are unable to estimate a payout ratio. Ifforecast EPS is negative we are unable to multiplyby a payout ratio to estimate fiiture dividends. Inboth cases we set ftiture dividends to the level ofdividends in year — 1.
For the cost of equity (re) we calculate a firm-specific, time-varying discount rate using theCapital Asset Pricing Model (CAPM). For theCAPM discount rate, at the financial year-end inyears —1 to 3, sample firm betas are calculated byDatastream (Datastream Item E058) using theprevious 240 trading day share returns. We employa market risk premium of 2.81%, estimated for theUK (over the years 1989-1998) by Claus andThomas (2001). The risk free rate is the UK three-month Treasury bill rate at each financial year-end.The cost of equity at year — 1 is used for the pre-takeover valuation, whilst the average cost of equityover years 0 to 3 is used for the post-takeovervaluation.
Altematively, some previous RIV applications use analystforecasts to predict EPS (Ang and Cheng, 2006; Dong et al.,2006). In the context of our study, we prefer to use prior ROE asa predictor for several reasons. First, past ROE is used to predictfuture profitability in takeover profitability studies and hence itsuse facilitates comparison between the profitability and RTVmethods, a key objective of our study. Second, analyst forecastsmay already incorporate expectations of future acquisitions andhence bias any valuation impact towards zero (the share returnmethodology has the same drawback). Third, analyst forecastsare biased and do not predict fijture eamings any better thanhistoric eaming models (Capstaff et al., 1995; Bi and Gregory,2008). Finally, these forecasts are not available for the entiresample period and would therefore reduce sample size.
It is important to allow for a time-varying, firm-specific discount rate because acquiring firmsexperience a significant increase in leverage andthe cost of equity following acquisition. Relative tocontrol firms, the average acquiring firm's gearingratio (long-term debt/long-term debt plus plusmarket capitalisation) increases by 3.34% followingacquisition (year — 1 compared to the average overyears 0 to 3). This increase is statistically significantat the 1% level, and is consistent with previousstudies (i.e. Ghosh and Jain, 2000).^' The acquirers'average beta increases from 0.72 to 0.78 followingthe acquisition, whereas the control firms' averagebeta is constant at 0.68. In year —1, the acquirers'average discount rate is 11.77, increasing to anaverage of 11.94% over years 0 to 3, whereas thecontrol firms' average discount rate decreases from11.66% to 11.64%. The abnormal changes in betaand the cost of equity are significant at 1%.
If the terminal value is negative, we restrict it tobe zero (for both the pre- and post-analysis), sinceover a long horizon, managers are not expected exante to invest in negative net present value projects(D'Mello and Shroff, 2000). If acquirers die withinthe four post-takeover years then the year of deathbecomes the final year of analysis and we estimate aterminal value using the same method used forsurviving acquirers at the end of year 3.̂ *̂ In otherwords, we assume the final year eamings are earnedin perpetuity. As with the profitability and sharereturn results, each variable is winsorised at the lO*and 90* percentiles.
In contrast to profitability studies, our methodcalculates the change in fiindamental value follow-ing acquisition and thus quantifies the total dis-counted value effect of takeover on the acquirer. Incontrast to event studies, it measures the change infundamental value rather than the change in marketvalue. As such, it is less reliant on stock prices.However, it is not completely independent of marketprices because the estimation of beta and hence thecost of equity relies on stock market efficiency.
5. Empirical resultsIn this section we report the empirical results.Section 5.1 describes the profitability results,
^' We also use a book value measure of gearing calculated aslong-term debt divided by long-term debt plus book value ofshareholders equity. The results are similar, showing an increasein leverage relative to control firms of 3.67%, significant at 1%.
^° We could employ the last market value prior to death as theterminal value. We prefer not to rely on market values sinee themain source of death is acquisition and market values includebid premiums that may have little to do with fijndamental value.We do, however, employ this method in our robustness testsbelow.
Vol. 40, No. 4. 2010 343
Section 5.2 the share return results, and Section 5.3the fundamental value results.
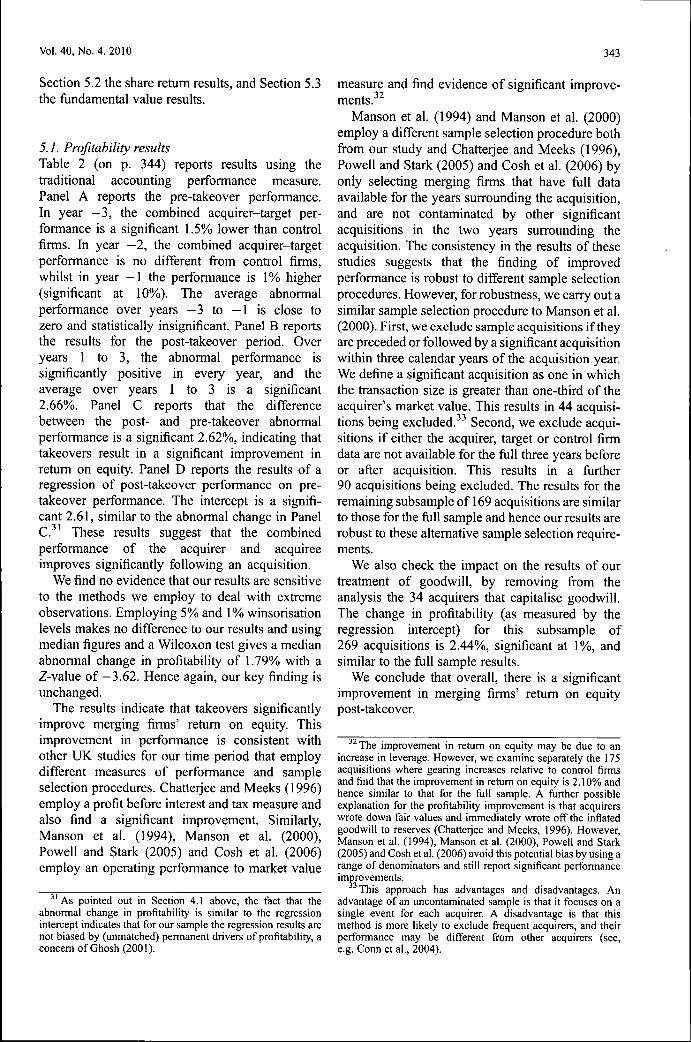
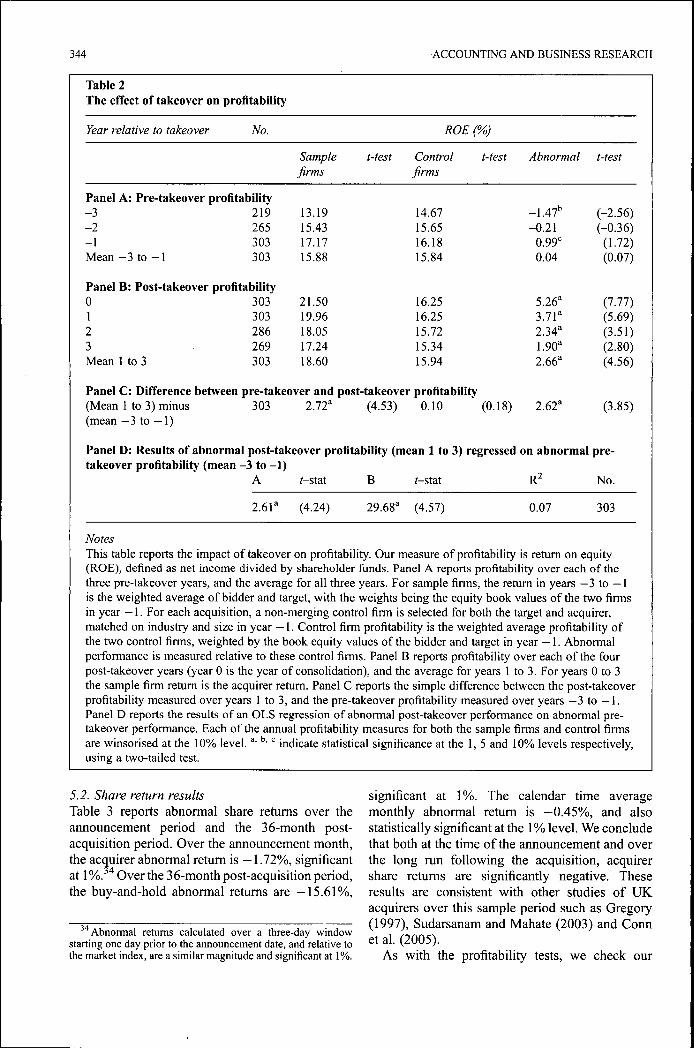
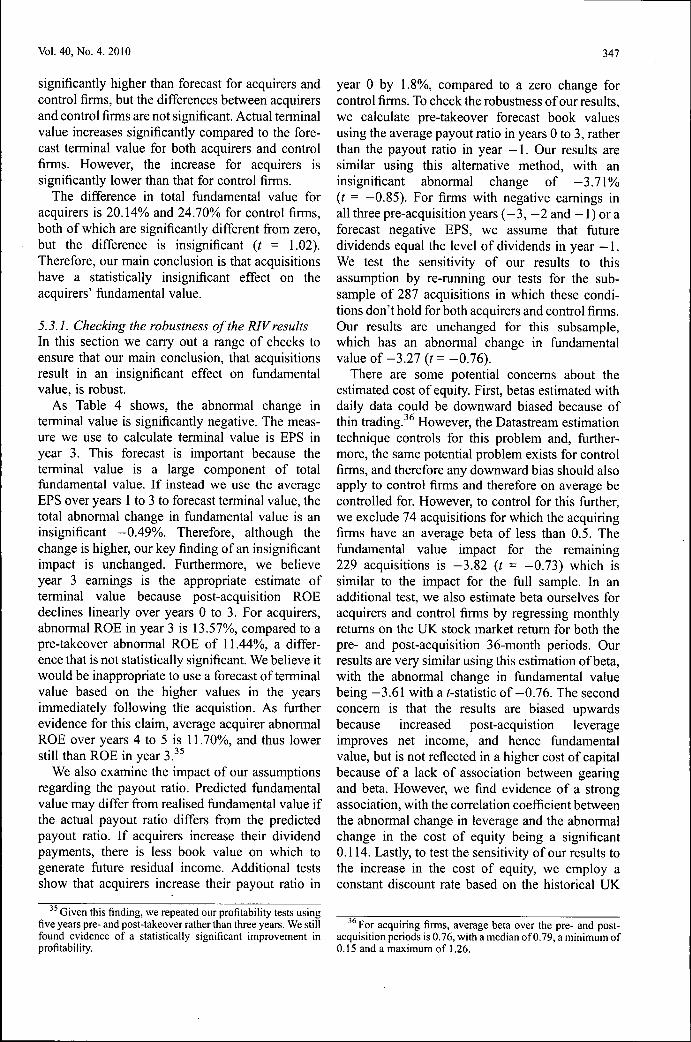
5.7. Profitability resultsTable 2 (on p. 344) reports results using thetraditional accounting performance measure.Panel A reports the pre-takeover performance.In year —3, the combined acquirer-target per-formance is a significant 1.5% lower than controlfirms. In year —2, the combined acquirer-targetperformance is no different from control firms,whilst in year - 1 the perfonnance is 1% higher(significant at 10%). The average abnormalperformance over years —3 to —1 is close tozero and statistically insignificant. Panel B reportsthe results for the post-takeover period. Overyears 1 to 3, the abnormal performance issignificantly positive in every year, and theaverage over years 1 to 3 is a significant2.66%. Panel C reports that the differencebetween the post- and pre-takeover abnormalperformance is a significant 2.62%, indicating thattakeovers result in a significant improvement inreturn on equity. Panel D reports the results of aregression of post-takeover performance on pre-takeover performance. The intercept is a signifi-cant 2.61, similar to the abnormal change in PanelC.^' These results suggest that the combinedperformance of the acquirer and acquireeimproves significantly following an acquisition.
We find no evidence that our results are sensitiveto the methods we employ to deal with extremeobservations. Employing 5% and 1% winsorisationlevels makes no difference to our results and usingmedian figures and a Wilcoxon test gives a medianabnormal change in profitability of 1.79% with aZ-value of —3.62. Hence again, our key finding isunchanged.
The results indicate that takeovers significantlyimprove merging firms' return on equity. Thisimprovement in performance is consistent withother UK studies for our time period that employdifferent measures of performance and sampleselection procedures. Chattetjee and Meeks (1996)employ a profit before interest and tax measure andalso find a significant improvement. Similarly,Manson et al. (1994), Manson et al. (2000),Powell and Stark (2005) and Cosh et al. (2006)employ an operating performance to market value
As pointed out in Section 4.1 above, the fact that theabnormal change in profitability is similar to the regressionintercept indicates that for our sample the regression results arenot biased by (unmatched) permanent drivers of profitability, aconcern of Ghosh (2001).
measure and find evidence of significant improve-ments.''^
Manson et al. (1994) and Manson et al. (2000)employ a different sample selection procedure bothfi-om our study and Chatterjee and Meeks (1996),Powell and Stark (2005) and Cosh et al. (2006) byonly selecting merging firms that have fiill dataavailable for the years surrounding the acquisition,and are not contaminated by other significantacquisitions in the two years surrounding theacquisition. The consistency in the results of thesestudies suggests that the finding of improvedperformance is robust to different sample selectionprocedures. However, for robustness, we carry out asimilar sample selection procedure to Manson et al.(2000). First, we exclude sample acquisitions if theyare preceded or followed by a significant acquisitionwithin three calendar years of the acquisition year.We define a significant acquisition as one in whichthe transaction size is greater than one-third of theacquirer's market value. This results in 44 acquisi-tions being excluded.^^ Second, we exclude acqui-sitions if either the acquirer, target or control firmdata are not available for the full three years beforeor after acquisition. This results in a further90 acquisitions being excluded. The results for theremaining subsample of 169 acquisitions are similarto those for the full sample and hence our results arerobust to these alternative sample selection require-ments.
We also check the impact on the results of ourtreatment of goodwill, by removing from theanalysis the 34 acquirers that capitalise goodwill.The change in profitability (as measured by theregression intercept) for this subsample of269 acquisitions is 2.44%, significant at 1%, andsimilar to the fiiU sample results.
We conclude that overall, there is a significantimprovement in merging firms' return on equitypost-takeover.
^^The improvement in return on equity may be due to anincrease in leverage. However, we examine separately the 175acquisitions where gearing increases relative to control firmsand find that the improvement in return on equity is 2.10% andhence similar to that for the fiiil sample. A further possibleexplanation for the profitability improvement is that acquirerswrote down fair values and immediately wrote off the infiatedgoodwill to reserves (Chatterjee and Meeks, 1996). However,Manson et al. (1994), Manson et al. (2000), Powell and Stark(2005) and Cosh et al. (2006) avoid this potential bias by using arange of denominators and still report significant perfonnanceimprovements.
'This approach has advantages and disadvantages. Anadvantage of an uncontaminated sample is that it focuses on asingle event for each acquirer. A disadvantage is that thismethod is more likely to exclude frequent acquirers, and theirperformance may be different fi'om other acquirers (see,e.g. Conn et al., 2004).
344 ACCOUNTING AND BUSINESS RESEARCH
Table 2The effect of takeover on profitability
Year relative to takeover No. ROE (%)
Samplefirms
13.1915.4317.1715.88
21.5019.9618.0517.2418.60
t-test Controlfirms
14.6715.6516.1815.84
16.2516.2515.7215.3415.94
t-test Abnormal
-1.47''-0.21
0.99'0.04
5.26"̂3.7P2.34"1.90"2.66"
t-test
(-2.56)(-0.36)
(1.72)(0.07)
(7.77)(5.69)(3.51)(2.80)(4.56)
Panel A: Pre-takeover profitability-3 219-2 265-1 303M e a n - 3 t o - 1 303
Panel B: Post-takeover profitability0 3031 3032 2863 269Mean 1 to 3 303
Panel C: Difference between pre-takeover and post-takeover profitability(Mean 1 to 3) tninus 303 2.72" (4.53) 0.10 (0.18)(mean —3 to —1)
2.62" (3.85)
Panel D: Results of abnormal post-takeover profitability (mean 1 to 3) regressed on abnormal pre-takeover profitability (mean -3 to -1)
A i-stat B i-stat R^ No.
2.61" (4.24) 29.68" (4.57) 0.07 303
NotesThis table reports the impact of takeover on profitability. Our measure of profitability is return on equity(ROB), defined as net income divided by shareholder funds. Panel A reports profitability over each of thethree pre-takeover years, and the average for all three years. For sample firms, the return in years —3 to — 1is the weighted average of bidder and target, with the weights being the equity book values of the two firmsin year — 1. For each acquisition, a non-merging control firm is selected for both the target and acquirer,matched on industry and size in year — 1. Control firm profitability is the weighted average profitability ofthe two control firms, weighted by the book equity values of the bidder and target in year — 1. Abnormalperformance is measured relative to these control firms. Panel B reports profitability over each of the fourpost-takeover years (year 0 is the year of consolidation), and the average for years 1 to 3. For years 0 to 3the sample firm return is the acquirer return. Panel C reports the simple difference between the post-takeoverprofitability measured over years 1 to 3, and the pre-takeover profitability measured over years —3 to —1.Panel D reports the results of an OLS regression of abnormal post-takeover performance on abnormal pre-takeover performance. Each of the annual profitability measures for both the sample firms and control firmsare winsorised at the 10% level. "• ''' '^ indicate statistical significance at the 1, 5 and 10% levels respectively,using a two-tailed test.
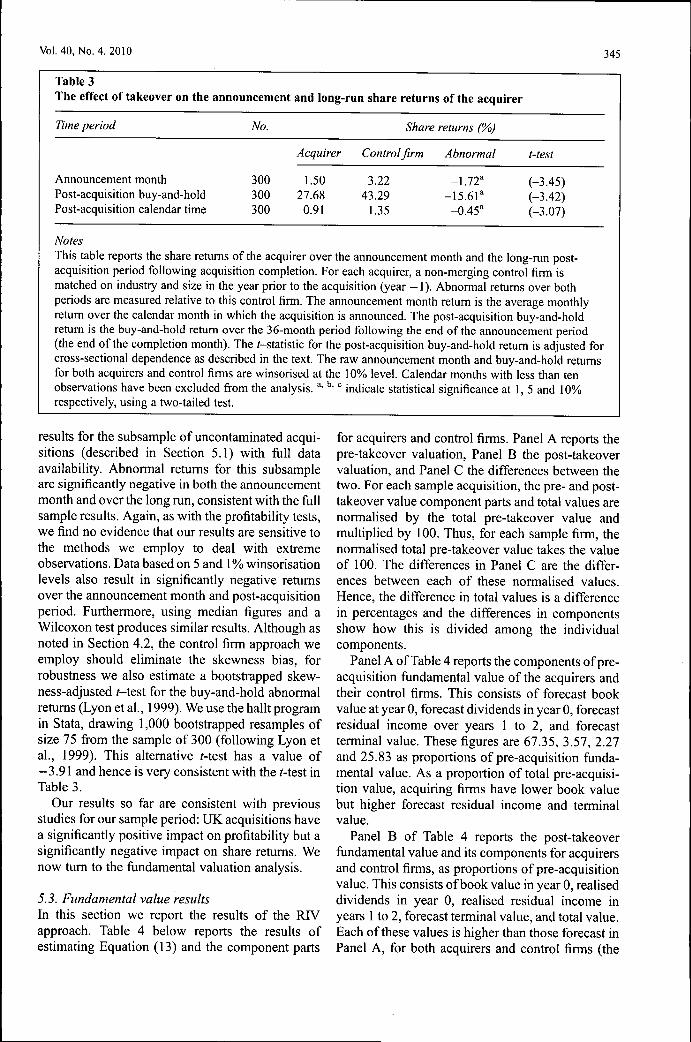
5.2. Share return resultsTable 3 reports abnormal share returns over theannouncement period and the 36-month post-acquisition period. Over the announcement month,the acquirer abnormal return is — 1.72%, significantat 1%.̂ "* Over the 36-month post-acquisition period,the buy-and-hold abnormal returns are —15.61%,
Abnormal returns calculated over a three-day windowstarting one day prior to the announcement date, and relative tothe market index, are a similar magnitude and significant at 1%.
significant at 1%. The calendar time averagemonthly abnormal return is —0.45%, and alsostatistically significant at the 1% level. We concludethat both at the time of the announcement and overthe long run following the acquisition, acquirershare returns are significantly negative. Theseresults are consistent with other studies of UKacquirers over this sample period such as Gregory(1997), Sudarsanam and Mahate (2003) and Connet al. (2005).
As with the profitability tests, we check our
Vol. 40, No. 4. 2010 345
Table 3The effect of takeover on the announcement and long-run share returns of the acquirer
Time period No.
300300300
Acquirer
1.5027.680.91
Share returns (%)
Control firm
3.2243.29
1.35
Abnormal
-1.72'- i5 .6 r-0.45"
t-test
(-3.45)(-3.42)(-3.07)
Announcement monthPost-acquisition buy-and-holdPost-acquisition calendar time
NotesThis table reports the share returns of the acquirer over the announcement month and the long-run post-acquisition period following acquisitioti completion. For each acquirer, a tion-merging control firm ismatched on industry and size in the year prior to the acquisition (year - 1 ) . Abnormal retums over bothperiods are measured relative to this control firm. The announcement month retum is the average monthlyretum over the calendar motith in which the acquisition is announced. The post-acquisition buy-and-holdretum is the buy-and-hold retum over the 36-month period following the end of the announcement period(the end of the completion month). The i-statistic for the post-acquisition buy-and-hold retum is adjusted forcross-sectional dependence as described in the text. The raw announcement month and buy-and-hold retumsfor both acquirers and control firms are winsorised at the 10% level. Calendar months with less than tenobservations have been excluded from the analysis. "' ''' "̂ indicate statistical significance at 1, 5 and 10%respectively, using a two-tailed test.
results for the subsample of uneontaminated acqui-sitions (described in Section 5.1) with full dataavailability. Abnormal retums for this subsampleare significantly negative in both the announcementmonth and over the long run, consistent with the fullsample results. Again, as with the profitability tests,we find no evidence that our results are sensitive tothe methods we employ to deal with extremeobservations. Data based on 5 and 1% winsorisationlevels also result in significantly negative retumsover the announcement month and post-acquisitionperiod. Furthermore, using median figures and aWilcoxon test produces similar results. Although asnoted in Section 4.2, the control firm approach weemploy should eliminate the skewness bias, forrobustness we also estimate a bootstrapped skew-ness-adjusted i-test for the buy-and-hold abnormalretums (Lyon et al., 1999). We use the hallt programin Stata, drawing 1,000 bootstrapped resamples ofsize 75 fi-om the sample of 300 (following Lyon etal., 1999). This altemative i-test has a value of—3.91 and hence is very consistent with the /-test inTable 3.
Our results so far are consistent with previousstudies for our sample period: UK acquisitions havea significantly positive impact on profitability but asignificantly negative impact on share retums. Wenow tum to the fundamental valuation analysis.
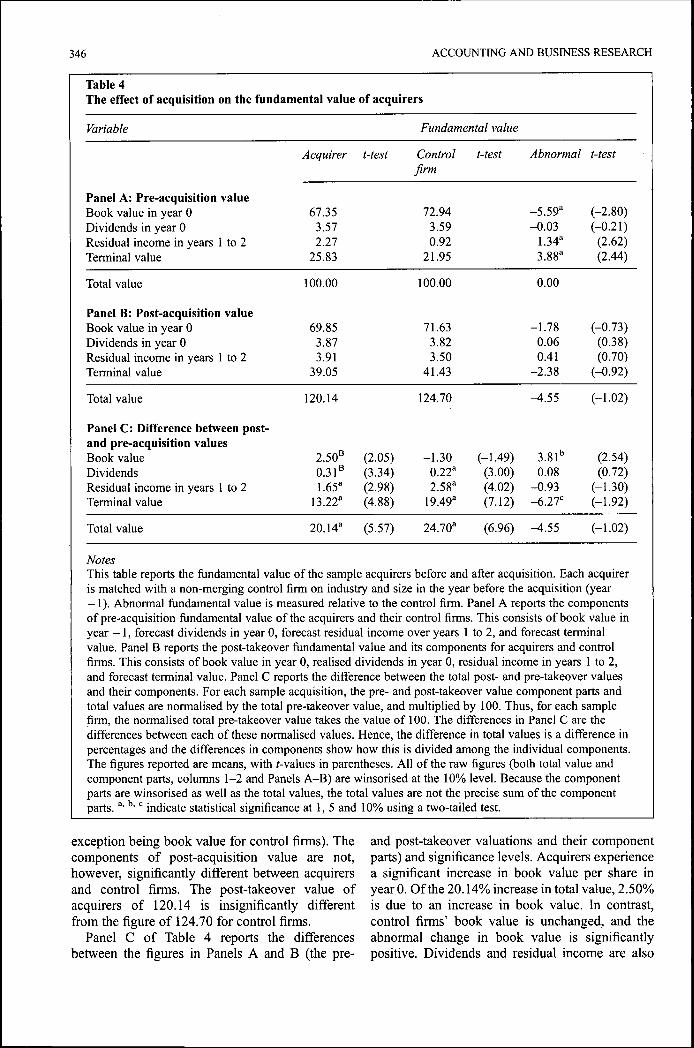
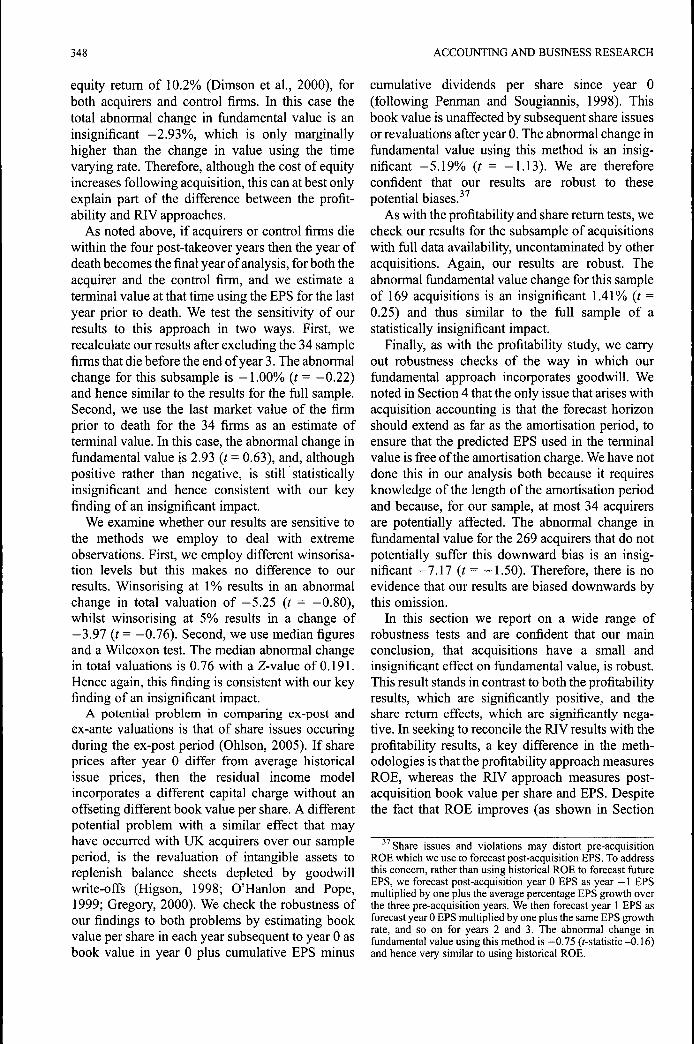
5.5. Fundamental value resultsIn this section we report the results of the RIVapproach. Table 4 below reports the results ofestimating Equation (13) and the component parts
for acquirers and control firms. Panel A reports thepre-takeover valuation. Panel B the post-takeovervaluation, and Panel C the differences between thetwo. For each sample acquisition, the pre- and post-takeover value component parts and total values arenormalised by the total pre-takeover value andmultiplied by 100. Thus, for each sample firm, thenormalised total pre-takeover value takes the valueof 100. The differences in Panel C are the differ-ences between each of these normalised values.Hence, the difference in total values is a differencein percentages and the differences in componentsshow how this is divided among the individualcomponents.
Panel A of Table 4 reports the components of pre-acquisition fundamental value of the acquirers andtheir control firms. This consists of forecast bookvalue at year 0, forecast dividends in year 0, forecastresidual income over years 1 to 2, and forecastterminal value. These figures are 67.35, 3.57, 2.27and 25.83 as proportions of pre-acquisition funda-mental value. As a proportion of total pre-acquisi-tion value, acquiring firms have lower book valuebut higher forecast residual income and terminalvalue.
Panel B of Table 4 reports the post-takeoverfundamental value and its components for acquirersand control firms, as proportions of pre-acquisitionvalue. This consists of book value in year 0, realiseddividends in year 0, realised residual income inyears 1 to 2, forecast terminal value, and total value.Each of these values is higher than those forecast inPanel A, for both acquirers and control firms (the
346 ACCOUNTING AND BUSINESS RESEARCH
Table 4The effect of acquisition on the fundamental value of acquirers
Variable
Panel A: Pre-acquisition valueBook value in year 0Dividends in year 0Residual income in years 1 to 2Terminal value
Total value
Panel B: Post-acquisition valueBook value in year 0Dividends in year 0Residual income in years 1 to 2Terminal value
Acquirer
67.353.572.27
25.83
100.00
69.853.873.91
39.05
t-test
Fundamental value
Control t-test
firm
72.943.590.92
21.95
100.00
71.633.823.50
41.43
Abnormal
-5.59"-0.03
1.34"3.88"
0.00
-1.780.060.41
-2.38
t-test
(-2.80)(-0.21)
(2.62)(2.44)
(-0.73)(0.38)(0.70)
(-0.92)
Total value
Panel C: Difference betweenand pre-acquisition valuesBook valueDividendsResidual income in years 1 toTerminal value
Total value
post-
2
120.14
2.50^0.31^1.65"
13.22"
20.14"
(2.05)(3.34)(2.98)(4.88)
(5.57)
124.70
-1.300.22"2.58"
19.49"
24.70"
(-1.49)(3.00)(4.02)(7.12)
(6.96)
^ . 5 5
3.81*'0.08
-0.93-6.27'
^ . 5 5
(-1.02)
(2.54)(0.72)
(-1.30)(-1.92)
(-1.02)
NotesThis table reports the fundamental value of the sample acquirers before and after acquisition. Each acquireris matched with a non-merging control firm on industry and size in the year before the acquisition (year— 1). Abnonnal fundamental value is measured relative to the control firm. Panel A reports the componentsof pre-acquisition fundamental value of the acquirers and their control firms. This consists of book value inyear — 1, forecast dividends in year 0, forecast residual income over years 1 to 2, and forecast terminalvalue. Panel B reports the post-takeover fundamental value and its components for acquirers and controlfirms. This consists of book value in year 0, realised dividends in year 0, residual income in years 1 to 2,and forecast terminal value. Panel C reports the difference between the total post- and pre-takeover valuesand their components. For each sample acquisition, the pre- and post-takeover value component parts andtotal values are normalised by the total pre-takeover value, and multiplied by 100. Thus, for each samplefirm, the normalised total pre-takeover value takes the value of 100. The differences in Panel C are thedifferences between each of these normalised values. Hence, the difference in total values is a difference inpercentages and the differences in components show how this is divided among the individual components.The figures reported are means, with /-values in parentheses. All of the raw figures (both total value andcomponent parts, columns 1-2 and Panels A-B) are winsorised at the 10% level. Because the componentparts are winsorised as well as the total values, the total values are not the precise sum of the componentparts. "• ''• " indicate statistical significance at 1, 5 and 10% using a two-tailed test.
exception being book value for control firms). Thecomponents of post-acquisition value are not,however, significantly different between acquirersand control firms. The post-takeover value ofacquirers of 120.14 is insignificantly differentfrom the figure of 124.70 for control firms.
Panel C of Table 4 reports the differencesbetween the figures in Panels A and B (the pre-
and post-takeover valuations and their componentparts) and significance levels. Acquirers experiencea significant increase in book value per share inyear 0. Of the 20.14% increase in total value, 2.50%is due to an increase in book value. In contrast,control firms' book value is unchanged, and theabnormal change in book value is significantlypositive. Dividends and residual income are also
Vol. 40, No. 4. 2010 347
significantly higher than forecast for acquirers andcontrol firms, but the differences between acquirersand control firms are not significant. Actual terminalvalue increases significantly compared to the fore-cast terminal value for both acquirers and controlfirms. However, the increase for acquirers issignificantly lower than that for control firms.
The difference in total fundamental value foracquirers is 20.14% and 24.70% for control firms,both of which are significantly different from zero,but the difference is insignificant (t = 1.02).Therefore, our main conclusion is that acquisitionshave a statistically insignificant effect on theacquirers' fundamental value.
5.3.7. Checking the robustness of the RIV resultsIn this section we carry out a range of checks toensure that our main conclusion, that acquisitionsresult in an insignificant effect on fundamentalvalue, is robust.
As Table 4 shows, the abnormal change interminal value is significantly negative. The meas-ure we use to calculate terminal value is EPS inyear 3. This forecast is important because theterminal value is a large component of totalfundamental value. If instead we use the averageEPS over years 1 to 3 to forecast terminal value, thetotal abnormal change in fundamental value is aninsignificant -0.49%. Therefore, although thechange is higher, our key finding of an insignificantimpact is unchanged. Furthermore, we believeyear 3 eamings is the appropriate estimate ofterminal value because post-acquisition ROEdeclines linearly over years 0 to 3. For acquirers,abnormal ROE in year 3 is 13.57%, compared to apre-takeover abnormal ROE of 11.44%, a differ-ence that is not statistically significant. We believe itwould be inappropriate to use a forecast of terminalvalue based on the higher values in the yearsimmediately following the acquistion. As furtherevidence for this claim, average acquirer abnormalROE over years 4 to 5 is 11.70%, and thus lowerstill than ROE in year 3.^^
We also examine the impact of our assumptionsregarding the payout ratio. Predicted fundamentalvalue may differ from realised fiindamental value ifthe actual payout ratio differs from the predictedpayout ratio. If acquirers increase their dividendpayments, there is less book value on which togenerate future residual income. Additional testsshow that acquirers increase their payout ratio in
•" Given this finding, we repeated our profitability tests usingfive years pre- and post-takeover rather than three years. We stillfound evidence of a statistically significant improvement inprofitability.
year 0 by 1.8%, compared to a zero change forcontrol firms. To check the robustness of our results,we calculate pre-takeover forecast book valuesusing the average payout ratio in years 0 to 3, ratherthan the payout ratio in year —1. Our results aresimilar using this alternative method, with aninsignificant abnormal change of —3.71%{t = —0.85). For firms with negative eamings inall three pre-acquisition years ( - 3 , - 2 and - 1 ) or aforecast negative EPS, we assume that fixturedividends equal the level of dividends in year — 1.We test the sensitivity of our results to thisassumption by re-running our tests for the sub-sample of 287 acquisitions in which these condi-tions don't hold for both acquirers and control firms.Our results are unchanged for this subsample,which has an abnormal change in fundamentalvalue of -3 .27 ( i= -0 .76 ) .
There are some potential concems about theestimated cost of equity. First, betas estimated withdaily data could be downward biased because ofthin trading.''^ However, the Datastream estimationtechnique controls for this problem and, ftirther-more, the same potential problem exists for controlfirms, and therefore any downward bias should alsoapply to control firms and therefore on average becontrolled for. However, to control for this further,we exclude 74 acquisitions for which the acquiringfirms have an average beta of less than 0.5. Thefiindamental value impact for the remaining229 acquisitions is -3.82 (i = -0.73) which issimilar to the impact for the full sample. In anadditional test, we also estimate beta ourselves foracquirers and control firms by regressing monthlyretums on the UK stock market retum for both thepre- and post-acquisition 36-month periods. Ourresults are very similar using this estimation of beta,with the abnormal change in fiindamental valuebeing —3.61 with a /-statistic of—0.76. The secondconcem is that the results are biased upwardsbecause increased post-acquistion leverageimproves net income, and hence fiindamentalvalue, but is not reflected in a higher cost of capitalbecause of a lack of association between gearingand beta. However, we find evidence of a strongassociation, with the correlation coefficient betweenthe abnormal change in leverage and the abnormalchange in the cost of equity being a significant0.114. Lastly, to test the sensitivity of our results tothe increase in the cost of equity, we employ aconstant discount rate based on the historical UK
^* For acquiring firms, average beta over the pre- and post-acquisition periods is 0.76, with a median of 0.79, a minimum of0.15 and a maximum of 1.26.
348 ACCOUNTING AND BUSINESS RESEARCH
equity return of 10.2% (Dimson et al , 2000), forboth acquirers and control firms. In this case thetotal abnormal change in fiindamental value is aninsignificant —2.93%, which is only marginallyhigher than the change in value using the timevarying rate. Therefore, although the cost of equityincreases following acquisition, this can at best onlyexplain part of the difference between the profit-ability and RTV approaches.
As noted above, if acquirers or control firms diewithin the four post-takeover years then the year ofdeath becomes the final year of analysis, for both theacquirer and the control firm, and we estimate aterminal value at that time using the EPS for the lastyear prior to death. We test the sensitivity of ourresults to this approach in two ways. First, werecalculate our results after excluding the 34 samplefirms that die before the end of year 3. The abnormalchange for this subsample is —1.00% (i = —0.22)and hence similar to the results for the full sample.Second, we use the last market value of the firmprior to death for the 34 firms as an estimate ofterminal value. In this case, the abnormal change infundamental value is 2.93 (t = 0.63), and, althoughpositive rather than negative, is still statisticallyinsignificant and hence consistent with our keyfinding of an insignificant impact.
We examine whether our results are sensitive tothe methods we employ to deal with extremeobservations. First, we employ different winsorisa-tion levels but this makes no difference to ourresults. Winsorising at 1% results in an abnormalchange in total valuation of —5.25 (t = —0.80),whilst winsorising at 5% results in a change of—3.97 (i = —0.76). Second, we use median figuresand a Wilcoxon test. The median abnormal changein total valuations is 0.76 with a Z-value of 0.191.Hence again, this finding is consistent with our keyfinding of an insignificant impact.
A potential problem in comparing ex-post andex-ante valuations is that of share issues occuringduring the ex-post period (Ohlson, 2005). If shareprices after year 0 differ from average historicalissue prices, then the residual income modelincorporates a different capital charge without anoffseting different book value per share. A differentpotential problem with a similar effect that mayhave occurred with UK acquirers over our sampleperiod, is the revaluation of intangible assets toreplenish balance sheets depleted by goodwillwrite-offs (Higson, 1998; O'Hanlon and Pope,1999; Gregory, 2000). We check the robustness ofour findings to both problems by estimating bookvalue per share in each year subsequent to year 0 asbook value in year 0 plus cumulative EPS minus
cumulative dividends per share since year 0(following Penman and Sougiannis, 1998). Thisbook value is unaffected by subsequent share issuesor revaluations after year 0. The abnormal change infundamental value using this method is an insig-nificant -5 .19% (t = -1.13). We are thereforeconfident that our results are robust to thesepotential biases.^^
As with the profitability and share return tests, wecheck our results for the subsample of acquisitionswith full data availability, uncontaminated by otheracquisitions. Again, our results are robust. Theabnormal fiindamental value change for this sampleof 169 acquisitions is an insignificant 1.41% (t =0.25) and thus similar to the fiall sample of astatistically insignificant impact.
Finally, as with the profitability study, we carryout robustness checks of the way in which ourfundamental approach incorporates goodwill. Wenoted in Section 4 that the only issue that arises withacquisition accounting is that the forecast horizonshould extend as far as the amortisation period, toensure that the predicted EPS used in the terminalvalue is fi-ee of the amortisation charge. We have notdone this in our analysis both because it requiresknowledge of the length of the amortisation periodand because, for our sample, at most 34 acquirersare potentially affected. The abnormal change infiandamental value for the 269 acquirers that do notpotentially suffer this downward bias is an insig-nificant —7.17 (t = —1.50). Therefore, there is noevidence that our results are biased downwards bythis omission.
In this section we report on a wide range ofrobustness tests and are confident that our mainconclusion, that acquisitions have a small andinsignificant effect on fundamental value, is robust.This result stands in contrast to both the profitabilityresults, which are significantly positive, and theshare return effects, which are significantly nega-tive. In seeking to reconcile the RIV results with theprofitability results, a key difference in the meth-odologies is that the profitability approach measuresROE, whereas the RIV approach measures post-acquisition book value per share and EPS. Despitethe fact that ROE improves (as shown in Section
•"share issues and violations may distort pre-acquisitionROE which we use to forecast post-acquisition EPS. To addressthis concern, rather than using historical ROE to forecast futureEPS, we forecast post-acquisition year 0 EPS as year — 1 EPSmultiplied by one plus the average percentage EPS growth overthe three pre-acquisition years. We then forecast year 1 EPS asforecast year 0 EPS multiplied by one plus the same EPS growthrate, and so on for years 2 and 3. The abnormal change infiindamental value using this method is —0.75 (i-statistic -0.16)and hence very similar to using historical ROE.
Vol. 40, No. 4. 2010 349
5.1), we find (in additional tests) that acquirers' EPSdecreases relative to control firms. The percentagechange in pre- and post-acquisition EPS foracquiring firms relative to control firms is -9.00%(i = -1.40). This appears to be an important reasonwhy the profitability results differ fi-om the RTVresults. In trying to reconcile the RIV results withthe return results, we note above that one problemwith the share return methodology is that acquirersmay be overvalued at the time of acquisition, andthat the share price could fall following acquisitionbecause of this over-valuation regardless of theimpact on fundamental value. To consider thisfurther, we now examine the performance impactsof a subset of acquisitions for which such over-valuation appears likely.
5.3.2. The impact of acquirer overvaluation andequity bidsOur RIV methodology incorporates the benefitderived by acquirer shareholders from using over-valued shares for the acquisition, and hence allowsus to examine whether cash bids and equity bidshave different impacts on fundamental value.Shleifer and Vishny (2003) argue that this is animportant motivation for acquisitions and recentevidence for both the US (Ang and Cheng, 2006and Dong et a l , 2006) and the UK (Bi and Gregory,2008) suggests that acquirers using equity areovervalued at the time of acquisition.
To examine whether there is any evidence ofacquirer overvaluation in our sample, we divide thefiindamental pre-takeover valuation by the shareprice at announcement for both acquirers andcontrol firms. The value for acquirers is 0.95, whilstfor control firms it is 0.97 and the difference is notsignificant. Since any equity overvaluation effect ispresumably limited to cases where the firm issuesequity, we restrict the same analysis to 'equity' bids,as defined in Table 1. In this case the value foracquirers is 0.90 whilst that for control firms is 0.97.The difference is insignificant using a parametrictest (i = — 1.50), but is significant using a WilcoxonTest (z = —2.23). Hence we find some evidence thatacquirers using equity are overvalued.''*
Next, we examine whether the impact on funda-mental value differs by method of payment and
'* Previous studies for the US (Ang and Cheng, 2005; Donget al., 2006) and the UK (Bi and Gregory, 2008), find strongerevidence of acquirer overvaluation. However, the differenceappears to be driven by the difference in sample time periods.For example, Dong et al. (2006) report an average V/P (RIVvalue/share price) of 0.77 over 1978-2000. However, theaverage V/P of Dong et al. over our sample fime period (1985-1996) (estimated fi-om their Table 2) is much higher at 0.89 andvery close to our value of 0.95.
overvaluation. The impact of cash acquisitions (65)on fiindamental value is insignificantly positive(11.01%), whilst the impact of equity acquisitions(173) is insignificantly negative (-2.40%). Thedifference in the abnormal returns between the twotypes of acquisition is insignificant.^^ We fiirtherexamine the impact on the subsample of equitybidders that are overvalued prior to acquisition(101) relative to control firms. In this case theimpact on fiindamental value is a significant 39.50(t = 5.37). Therefore, we find strong evidence thatacquirers that are overvalued and use equity to payfor the acquisition create significant fiindamentalvalue for their shareholders. In stark contrast, theshare returns for this subsample of 101 firms isworse than for the sample as a whole, withannouncement returns of —2.52% and long-runbuy-and-hold returns of -28.02%. Therefore, theequity overvaluation effect may go some way toexplaining the negative impact of takeover on sharereturns and the difference between the impact ofacquisitions on share returns and on fiindamentalvalue.
6. ConciusionsIn this paper we develop a methodology forevaluating takeover success by measuring whetherthe fundamental value of acquirers is greater after anacquisition. Our methodology employs the residualincome approach to fundamental valuation, anddiffers significantly fi-om profitability and sharereturn studies. Profitability studies do not quantifythe total discounted value effect of takeoversbecause they do not account for the cost of capital,the timing of profits earned, or the amount paid forthe target company. Share return studies on the otherhand, refiect many factors, such as anticipation ofthe acquisition or initial market mispricing atannouncement, and not necessarily the fundamentalimpact of acquisitions. The fundamental valueapproach that we develop quantifies the totaldiscounted value effect of takeovers and is lessreliant upon stock market prices. As such, it hasadvantages over both the profitability and sharereturn approaches in measuring the impact ofacquisition on fiindamental value. However, ourapproach shares some of the same weaknesses andrequires a number of important assumptions.
We test all three methodologies on a comprehen-sive sample of 303 takeovers involving UK publiccompanies. These takeovers result in a significant
^' The impact of mixed (equity plus cash) acquisitions onfundamental value is —17.15 (t= —1.43) whilst the impact ofother payment methods on fundamental value is -38.91 (/ =-2.48).
350 ACCOUNTING AND BUSINESS RESEARCH
improvement in the profitability of the mergingcompanies. However, acquirer share retums overboth the announcement and long-mn post-takeoverperiods are significantly negative. Both sets offindings are consistent with other UK studies for oursample time period. Using our fiindamental valu-ation approach, we find that acquisitions have asmall and insignificant effect on fundamental value,relative to control firms. Therefore, the results foundusing a fundamental value approach differ signifi-cantly from the profitability and share retumapproaches.
Our fundamental value results are subject to anumber of qualifications and potential weaknessesas pointed out above. However, if we neverthelessaccept them as accurately estimating an insignifi-cant effect on fundamental value, then what do theresults imply about the proper interpretation of theprofitability and retum studies?
First, with regard to profitability, although thisimproves for the combined assets post-acquisition,a combination of factors would appear to result inthis improvement not being reflected in an increasein fiindamental value; although retum on equityincreases after acquisition, EPS does not; theimproved profitability declines over the post-acqui-sition period, resulting in a relatively low terminalvalue; acquirer leverage increases following acqui-sition causing an increase in the cost of equity,hence reducing the present value of the increasedprofits; and the cost of the acquisition is fullyincorporated, unlike with the profitability measuredue to acquirers writing off goodwill over oursample period.
Second, with regard to the retum studies, ourfindings clearly refute the argument that the nega-tive share retums experienced by acquirer firmsreflect the stock market belatedly reacting to theimpact of acquisitions on acquirers' fiindamentalvalues. Furthermore, we find that acquirers aresomewhat overvalued by the stock market atatinouncement, and that share retums are evenmore negative for overvalued acquirers, despite thefact that these acquirers experience a significantincrease in fundamental value. Therefore, the equityovervaluation effect may go some way to explain-ing the negative impact of takeover on share retumsand the difference between the impact of acquisi-tions on share retums and on fiindamental value.
Overall, we conclude that it is potentiallymisleading to draw conclusions on the fundamentalvalue impact of takeover from either profitability orshare retum studies. However, empirical applicationof the residual income model employed hererequires a number of important assumptions. We
have carried out a number of additional tests tocheck the robustness of our key findings. However,further research could examine whether our meth-odology stands the test of further exploration of thisor more recent data. One worthwhile approachwould be to use analyst forecasts (rather thanhistorical eamings) to predict future (post-acquisi-tion) EPS, which would avoid any problems of dirtysurplus accounting in the pre-acquisition period.Additionally, future research could extend theanalysis to a more recent sample of acquisitions,to ensure that our results are robust across differenttime periods.
ReferencesAlberts, W.W. and Varaiya, N.P. (1989). 'Assessing theprofitability of growth by acquisition: a 'premium recap-ture' approach'. International Journal of IndustrialOrganisation, 7: 133-149.
Andrade, G. and Stafford, E. (2004). 'Investigating theeconomic role of mergers'. Journal of Corporate Finance,10: 1-36.
Ang, J.S. and Cheng, Y. (2006). 'Direct evidence on themarket-driven acquisitions theory'. Journal of FinancialResearch, 29: 199-216.
Barber, B. and Lyon, D. (1996). 'Detecting abnormaloperating performance: the empirical power and specifica-tion of test statistics'. Journal of Financial Economics, 41 :359-399.
Barber, B.M. and Lyon J.D. (1997). 'Detecting long-runabnormal stock retums: the empirical power and specifi-cation of test statistics'. Journal of Financial Economics,43: 341-372.
Bhagat, S., Dong, M,. Hirshleifer, D. and Noah, R. (2005).'Do tender offers create value? New methods and evi-dence'. Journal of Financial Economics, 76: 3-60.
Bi, X.G. and Gregory, A. (2008). 'Stock market drivenacquisitions versus the q theory of takeovers - the UKevidence'. Working paper. University of Exeter.
Bruner, R.F. (2002). 'Does M&A pay? A survey of evidencefor the decision-maker'./oMr«a/q/Vípp/;WF!>7aí!ce, 2:48-68.
Capstaff, J., Paudyal, K. and Rees, W. (1995). 'The accuracyand rationality of eamings forecasts by UK analysts'.Journal of Business Finance and Accounting, 22: 67—86.
Chattetjee, R. and Meeks, G. (1996). 'The financial effectsof takeover: accounting rates of retum and accountingregulation'. Journal of Business Finance & Accounting,ly. 851-868.
Claus, J. and Thomas, J. K. (2001). 'Equity premia as low asthree percent? Evidence from analysts' eamings forecastsfor domestic and intemational stock markets'. Journal ofFinance, 56: 1629-1666.
Conn, R.L., Cosh, A., Guest, P.M. and Hughes, A. (2004).'Why must all good things come to an end? Theperformance of multiple acquirers'. In D.H. Nagao (ed.).Proceedings of the Sixty-third Annual Meeting of theAcademy of Management.
Conn, R.L., Cosh, A., Guest, P.M. and Hughes, A. (2005).'The impact on UK acquirers of domestic, cross-border,public and private acquisitions'. Journal of BusinessFinance & Accounting, 32: 815-870.
Cosh, A., Guest, P.M. and Hughes, A. (2006). 'Board
Vol. 40, No. 4. 2010 351
shareownership and takeover performance'. Journal ofBusiness Finance & Accounting, 33: 459-510.
Cosh, A., Hughes, A. and Singh, A. (1980). 'The causes andeffect of takeovers in the United Kingdom: an empiricalinvestigation for the late 1960s at the microeconomiclevel'. In D.C. Mueller (ed.). The Determinants and Effectsof Merger: An International Comparison (Gunn & Hain).
Dimson, E., Marsh, P. and Staunton, M. (2000). 'Risk andretum in the 20"" and 2P ' centuries'. Business StrategyReview, 11: 1-18.
D'Mello, R. and Shroff, P.K. (2000). 'Equity undervaluationand decisions related to repurchase tender offers: anempirical investigation'. Journal of Finance, 55: 2399-2424.
Dong, M., Hirshleifer, D., Richardson, S. and Teoh, S.H.(2006). 'Does investor misvaluation drive the takeovermarket?'. Journal of Finance, 61: 725-762.
Edwards, E.O. and Bell, P.W. (1961). The Theory andMeasurement of Business Income (Berkeley, CA:University of Califomia Press).
Fama, E.F. (1998). 'Market efficiency, long-run retums, andbehavioral finance'. Journal of Financial Economics, 49:283-306.
Feltham, G. and Ohlson, J.A. (1995). 'Valuation and cleansurplus accounting for operating and financial activities'.Contemporary Accounting Research, 11: 689-731.
Frankel, R. and Lee, CM. (1998). 'Accounting valuation,market expectation, and cross-sectional stock returns'.Journal of Accounting and Economics, 25: 283-319.
Ghosh, A. and Jain, P.C. (2000). 'Financial leverage changesassociated with corporate mergers'. Journal of CorporateFinance, 6: 377-402.
Ghosh, A. (2001). 'Does operating performances reallyimprove following corporate acquisitions?'. Journal ofCorporate Finance, 1: 151-178.
Graham, J.R. and Harvey, C.R. (2001). 'The theory andpractice of corporate finance: evidence from the field'.Journal of Financial Economics, 60: 187-243.
Gregory, A. (1997). 'An examination of the long runperformance of UK acquiring firms'. Journal of BusinessFinance and Accounting, 24: 971-1002.
Gregory, A. (2000). 'Motives underlying the method ofpayment by UK acquirers: the influence of goodwill'.Accounting and Business Research, 30: 227-240.
Hietala, P., Kaplan, S.N. and Robinson, D.T. (2003). 'Whatis the price of Hubris? Using takeover battles to inferoverpayments and synergies'. Financial Management, "il:5-31.
Higson, C. (1998). 'Goodwill'. British Accounting Review,30: 141-158.
Hughes, A. (1989). 'Mergers and economic performance inthe UK: a survey of the empirical evidence 1950-1990'. InM. Bishop and J. Kay (eds.), European Mergers andMerger Policy (Oxford: Oxford University Press).
Jafïe, J.F. (1974). 'Special information and insider trading'.Journal of Business, 47: 305-360.
Jensen, M. and Ruback, R. (1983). 'The market for corporatecontrol: the scientific evidence'. Journal of FinancialEconomics, 11: 5-50.
Lee, CM. (1999). 'Accounting-based valuation: impact onbusiness practices and research'. Accounting Horizons, 13:413-425.
Lee, CM., Myers, J. and Swaminathan, B. (1999). 'What isthe intrinsic value of the Dow?'. Journal of Finance, 54:1693-1741.
Lyon J.D., Barber, B.M. and Tsai, C (1999). 'Improvedmethods for tests of long-run abnormal stock retums'.Journal of Finance, 5 A\ 165-201.
Mandelker, G. (1974). 'Risk and retum: the case ofmergingfirms'. Journal of Financial Economics, 1: 303-335.
Manson, S., Stark, A.W. and Thomas, H.M. (1994). A CashFlow Analysis of the Operational Gains from Take-overs,Certified Research Report 35 (London: CertifiedAccountants Education Trust).
Manson, S., Powell, R., Stark, A.W. and Thomas, H.M.(2000). 'Identifying the sources of gains ñ'om takeovers'.Accounting Forum, 24: 319-343.
Martynova, M. and Renneboog, L. (2008). 'A century ofcorporate takeovers: what have we teamed and where dowe stand?'. Journal of Banking and Finance, 32: 2148-2177.
Meeks, G. (1977). Disappointing Marriage: A Study of theGains from Merger (Cambridge: Cambridge UniversityPress).
Mitchell, M.L. and Mulherin, J. (1996). 'The impact ofindustry shocks on takeover and restructuring activity'.Journal of Financial Economics, 41: 193-229.
Mitchell, M.L. and Stafford, E. (2000). 'Managerial deci-sions and long-term stock price performance'. Journal ofBusiness, 73: 287-329.
Morton, R.M. and Neill, J.D. (2000). 'The relation betweenmarket prices and an analyst-based fundamental valuesurrounding a corporate restructuring'. Journal ofAccounting and Finance Research, 8.
Ohlson, J.A. (1995). 'Earnings, book values, and dividendsin security valuations'. Contemporary AccountingResearch, 11:661-687.
Ohlson, J.A. (2005). 'On accounting-based valuation for-mulae'. Review of Accounting Studies, 10: 323-347.
O'Hanlon, J.F. and Pope, RF. (1999). 'The value-relevanceof UK dirty surplus accounting flows'. British AccountingReview, 32: 459^82.
Peasnell, K. (1982). 'Some formal connections betweeneconomic values and yields and accounting numbers'.Journal of Business Finance and Accounting, 9: 361-381.
Penman, S.H. and Sougiannis, T. (1998). 'A comparison ofdividend, cash flow, and eamings approaches to equityvaluation'. Contemporary Accounting Research, 15: 343-383.
Penman, S.H. (2001, 2004, 2007). Financial StatementAnalysis & Security Valuation (New York, NY: McGrawHill). First, Second, and Third Editions respectively.
Powell, R. and Stark, A. (2005). 'Does operating perform-ance increase post-takeover for UK takeovers? A compari-son of performance measures and benchmarks'. Journal ofCorporate Finance, 11: 293-317.
Powell, R. and Yawson, A. (2005). 'Industry aspects oftakeovers and divestitures: evidence from the UK'. Journalof Banking and Finance, 29: 3015-3040.
Preinreich, G.A.D. (1938). 'Annual survey of economictheory: the theory of depreciation'. Econometrica, 6: 219-241.
Ritter, R.J. and Warr, R.S. (2002). 'The decline of inflationand the Bull Market of 1982 to 1997'. Journal of Financialand Quantitative Analysis, 37: 29-61.
Shleifer, A. and Vishny, R. (2003). 'Stock market drivenacquisitions'. Journal of Financial Economics, 70: 295-311.
Stark, A.W. (1986). 'More on the discounting of residualincome streams'. Abacus, 22: 52-67.

352 ACCOUNTING AND BUSINESS RESEARCH
Sudarsanam, S. and Mahate, A.A. (2003). 'Glamour Tuch, C. and O'Sullivan, N. (2007). 'The impact ofacquirers, method of payment and post-acquisition per- acquisitions on firm performance: a review of the evi-formance: the UK evidence'. Journal of Business Finance dence'. International Journal of Management Reviews, 9:& Accounting, 30: 299-341. 141- 170.

Copyright of Accounting & Business Research is the property of Croner.CCH Group Limited and its content
may not be copied or emailed to multiple sites or posted to a listserv without the copyright holder's express
written permission. However, users may print, download, or email articles for individual use.


