
The Effects of Calorie Information on Food selection and Intake
by
Laura Parker Girz
A thesis submitted in conformity with the requirements
for the degree of Master of Arts
Graduate Department of Psychology
University of Toronto
© Copyright by Laura Parker Girz (2009)

ii
The Effects of Calorie Information on Food selection and Intake
Master of Arts, 2009
Laura Parker Girz
Department of Psychology
University of Toronto
Abstract
Proposed legislation in the United States and Canada would require calorie information to
be presented on the menus/menu boards of restaurants. To test the possible impacts of
such legislation, the present study examined the effects of calorie information on the food
selection and intake of restrained and unrestrained eaters. Female students were presented
with a menu containing two items, a salad and a pasta dish, for which calorie information
was either present or absent. Results of the present study indicate that the provision of
calorie information does not alter food choice but does influence the amount people eat.
Although the salad and pasta contained the same number of calories, calorie information
decreased consumption of pasta, but increased consumption of salad.

iii
Table of Contents
Introduction ……………………………………………………………………………… 1
Method …………………………………………………………………………………. 13
Results ………………………………………………………………………………….. 15
Discussion ……………………………………………………………………………… 16
Tables…………………………………………………………………………………… 19
References ……………………………………………………………………………… 21
1
The Effects of Calorie Information on Food Selection and Intake
The United States and much of the rest of the developed world is currently in the
midst of an obesity epidemic. According to the 2003-2004 National Health and Nutrition
Examination Survey, 32.9% of Americans are obese and another 33.3% are overweight.
While the percentage of overweight Americans has remained relatively constant in the last
thirty years, rates of obesity have increased dramatically. For example, between 1976 and
1980, 32% of Americans were overweight, but only 15% were obese. This increase in
obesity is a public-health concern owing to the link between obesity and serious medical
conditions such as Type-2 diabetes, heart disease, and certain types of cancer (Office of the
Surgeon General, 2008).
Despite a great deal of discussion about the obesity epidemic, there does not seem to
be a clear consensus on what is actually causing obesity rates to increase. The two most
popular explanations are that physical activity levels have dropped and that marketing
practices are leading people to eat more, although other possible explanations also exist
(Keith et al., 2006). Even if reduced physical activity and marketing practices are entirely
responsible for the obesity epidemic, we still don’t understand why people are less active or
how exactly marketing practices are encouraging people to overeat. A more specific theory is
that eating frequently in restaurants is contributing to the obesity problem (FDA, 2004). The
number of meals eaten outside the home has increased dramatically over the same time
period during which obesity rates have risen (Lin, Guthrie, & Frazao, 1999). For example
spending on food prepared outside the home almost doubled between 1970 and 2005 (NRA,
2005). There is evidence that eating often in restaurants, particularly fast-food restaurants,
leads to weight gain (Binkley, Eales, & Jekanowski, 2000; Duffey, Gordon-Larsen, Jacobs,
2
Williams, & Popkin, 2007; Thompson et al., 2004). This is probably due to that fact that, on
average, people eat more calories when they eat out than when they eat at home (Guthrie,
Lin, & Frazao, 2002).
A few different factors may explain why individuals consume more calories in
restaurants than they do at home. First, the portion sizes have increased since the 1970s so
that typical restaurant portions now contain much more food than the average person needs in
one meal (1100-2300 calories) (Nielsen & Popkin, 2003; Wootan, Osborn, & Malloy, 2006).
There is strong evidence that serving larger portions increases intake. For example, Wansink
and Kim (2005) presented participants attending a movie with either medium or large
buckets of popcorn. Those given large buckets ate 45.3% more than those given medium
buckets. Diliberti, Bordi, Conklin, Roe, and Rolls (2004) found similar results when
participants were presented with either a standard or a large portion of pasta. The participants
given the large portion of pasta ate approximately 43% more than those given the standard
portion.
Second, people generally have a very difficult time estimating the caloric value of
foods that they are served while eating out. It seems that people can estimate the calories in
small portions of lower calorie foods fairly accurately, but their estimates of the calories in
both large portions and high calorie foods are usually far too low. For example, Burton,
Creyer, Kees, and Huggins (2006) asked participants to estimate the number of calories in
typical restaurant meals. Seventy-three percent of participants underestimated the calories in
the lower-calorie meals, such as a turkey sandwich or pot roast. The calorie estimates for
these meals were only slightly low, however (500 estimated calories compared to 543 actual
calories per meal). Ninety percent of participants underestimated the calories in the higher-

3
calorie items, such as a chef salad or hamburger and French fries. The calorie estimates for
these items were much too low (694 estimated calories compared to 1336 mean calories per
meal). In addition, the researchers included a very-high-calorie item, cheese fries with ranch
dressing, and found that 99% of participants underestimated its caloric value. The average
estimate was off by over 2000 calories (869 estimated calories compared to 3010 actual
calories).
Even individuals who are knowledgeable about nutrition have trouble estimating
calories. Chandon and Wansink (2007a) asked participants to estimate calories in a number
of meals ranging in size from small to large. Participants who reported paying attention to
nutrition information were no better at this task than were participants who reported ignoring
nutrition information. Likewise, a study of professional nutritionists showed that they
underestimated the calories in large portions of high-calorie foods by 200 to 600 calories
(Backstrand, Wootan, Young, & Hurley, 1997).
These findings are significant in that the underestimation of calories in large portions
of food may represent a more general lack of awareness about how excessively large these
portions actually are. If so, then it is plausible that an accurate knowledge of the calories in
restaurant servings could lead people to eat less when portions are large.
Third, there is evidence that people are overly influenced by health claims when
nutrition information is absent. Chandon and Wansink (2007b) asked participants to estimate
the number of calories in meals from Subway and McDonald’s. Although the meals were
equivalent in calories, estimates for Subway meals were consistently lower than were those
for McDonald’s meals. For a large meal averaging 1327 calories, mean estimates were 843
calories for food from McDonald’s, but only 646 calories for food from Subway. The authors
4
speculate that underestimates for Subway food may represent a halo effect – since Subway is
seen as healthy, everything from Subway must be low in calories. In separate study, Wansink
and Chandon (2006) found a similar pattern when participants were given granola to eat and
told that it was either low-fat or regular. Participants who were told the granola was low-fat
ate 50.1% more than did participants told that the granola was regular. Although actual low-
fat granola is somewhat lower in calories than is regular granola, had the participants actually
been given low-fat granola they would have still consumed 33% more calories than those
who were correctly told they were eating regular granola. Likewise, Provencher, Polivy, and
Herman (2009) found that participants who were asked to taste and rate oatmeal-raisin
cookies ate approximately 35% more when the cookies were described as “healthy” as when
they were described as “gourmet”.
Despite the large portion sizes served in the United States and the evidence that
people have trouble estimating calories in the food that they are served, most restaurants do
not provide nutrition information for their menu items (Wootan, Osborn, & Malloy, 2006).
As of 2004, only 44% of the top 300 chain restaurants in the United States made nutrition
information available to their customers. In addition, 86% of the time, the nutrition
information was available to customers only on the company website.
To remedy this problem, there is now proposed legislation in the United States called
the Menu Education and Labeling Act. In addition, a similar bill has recently been introduced
in Ontario. This legislation would require all chain restaurants with more than twenty outlets
to provide information about calories, saturated fat, trans fat, and sodium next to each item
on the menu. Restaurants with a menu board rather than a menu would provide calorie
information next to each item on the board. The United States legislation also mandates the
5
provision of “information, specified by the Secretary by regulation, designed to enable the
public to understand, in the context of a total daily diet, the significance of the nutrition
information that is provided” (H.R. 3895). The assumption behind this legislation seems to
be that providing individuals with calorie information will lead them to make healthier
selections. However, there are actually a few different outcomes possible. Some people may
not care about the calorie information and may ignore it. Those who do care about calorie
information could respond in two different ways if they find the food they were planning to
eat is high in calories. They could choose a lower-calorie meal or they could choose to eat
less of the original higher-calorie meal.
The first option, choosing a “healthier” meal when nutrition information is provided,
has been explored in both the nutrition and marketing literature. Several studies have
examined the effects of nutrition information on reported purchase intentions. Yamamoto,
Yamamoto, Yamamoto, and Yamamoto (2005) presented adolescents with menus from
McDonald’s, Panda Express, and Denny’s and asked them to choose the item that they would
order for dinner from each menu. After making their selections, the participants were again
given menus from the same three restaurants, but calorie and fat information was now
presented next to each item on the menu. Participants were once again asked to indicate
which item they would order for dinner at each restaurant. Only 31 of the 106 participants
changed orders for at least one of their three meals after viewing the nutrition information.
For the orders that were changed, 80% contained fewer calories than did the original order
and 20% contained more calories than did the original order. Overall, the addition of calorie-
and-fat information to the menu significantly reduced the calories and fat in selections at
McDonald’s and Panda Express, but not at Denny’s. Despite the significant reductions in fat

6
and calories at these restaurants, however, the differences were the result of order changes by
only 20% of participants.
Gerend (2009) also examined the effects of calorie information on reported purchase
intentions. Undergraduate students were presented with either a regular fast-food menu or a
menu with added calorie information and were asked to select the items they would order.
Women who received menus with calorie information ordered fewer calories per meal and
ordered lower-calorie items, but did not order fewer items. The calorie information had no
effect on men. It is difficult to draw any conclusions based on the findings of this or the
Yamamoto et al. study, however, because the data in both studies were based on reports of
predicted behavior rather than on actual behavior. It is unclear whether these self-reports
would actually match orders in a restaurant setting.
Several other studies have addressed this problem by tracking orders in restaurants
and cafeterias before and after the presentation of nutrition information.
Cranage, Conklin, and Lambert (2004) looked at the impact of displaying nutrition
information, including calorie counts, on sales in an on-campus café. Sales of the higher fat,
higher calorie entrees dropped from 67% to 47% after nutrition information was displayed on
a card next to each item. In addition, sales of vegetables, fruits, and side salads increased
while sales of French fries and desserts decreased.
In a similar study, Cinciripini (1984) examined the effects of calorie information on
sales in a university cafeteria. The display of calorie information on large signs at the
entrance of the cafeteria reduced the selection of carbohydrates and red meat for all
participants. Normal weight males and females also selected fewer regular dairy products
after calorie information was provided. In addition, calorie information led obese females to

7
increase their selection of salads, vegetables, soups, fruits, and low-fat dairy and to decrease
their selection of high-fat foods, desserts, and sauces.
Balfour, Moody, and Wise (1996) examined the effects of nutrition information on
food choices in a cafeteria. Men and women entering a workplace cafeteria were invited to
use a computer system to analyze the composition of the meal they were about to order. The
computer program provided participants with an analysis of the calorie and nutrient
information for their chosen meal as a percentage of suggested daily intake. Of the
approximately 45% of the participants who chose to use the computer program, 17% of
females and 15% of males decided to change their first choice after receiving feedback.
Among those who changed their first choice, 69% of females and 54% of males chose meals
with fewer calories. In addition, the initial meals chosen by participants who decided to
change their first choice were significantly higher in calories than were the meals chosen by
those who did not change their first choice, but the second choice meals were not
significantly higher in calories.
Many studies looking at the effects of nutrition information on food selection provide
participants with some indication that given foods were low in calories, heart healthy, or
“nutritious” rather than providing calorie information. For example, Dubbert, Johnson,
Schlundt, and Montague (1984) tracked food purchases in a cafeteria before and after low-
calorie entrées, vegetables, and salads were identified with a sign reading “lower calorie
selection”. Vegetables and salads labeled “low calorie” were significantly more likely to be
selected during the intervention than during the baseline. In contrast, the “low calorie” labels
did not increase selection of entrées. In addition, the mean calories ordered per meal did not

8
change, so it seems that choosing lower-calorie vegetables and salads lead participants to
select higher-calorie entrées.
Levin (1996) conducted a similar study, but focused on fat content rather than
calories. Purchases were tracked before and after three entrées were labeled with a heart-
shaped sign reading, “Look for the heart for your low-fat entrée selection”. The purchases in
the experimental cafeteria were compared to those at a control cafeteria. Purchases of
targeted items did not increase at the control cafeteria over the course of the study, but
increased significantly in the experimental cafeteria after the signs were posted. Further, sales
of the labeled items increased over the course of the intervention, with the number of entrées
sold in weeks 28 and 29 (14.1% of total sales) significantly greater than the number sold in
weeks one and two (9.5% of total sales) or in weeks three and four (11.9 percent of total
sales).
Albright, Flora, and Fortmann (1990) explored the effects of nutrition information in
a restaurant setting rather than in a cafeteria. Foods low in fat and cholesterol were labeled
with signs reading “good for health” at four family-style restaurants with very similar menus.
The same entrees were labeled at each restaurant, but only two of the restaurants experienced
a significant increase in sales of the labeled items. For these two restaurants, sales of labeled
items increased by 18-40% as compared to baseline levels. The authors were unable to
explain why the intervention was effective in only two of the restaurants, but commented that
it was difficult for restaurant managers to comply with all experimental procedures.
The preceding studies show mixed findings with regard to whether providing
nutrition information increases selection of “healthy” items. One problem is that many
different types of nutrition information are used. Given the evidence discussed earlier that
9
people underestimate the calories in foods thought of as healthy, it is possible that when
interventions lead people to order “healthier” items they actually end up eating more than
they normally would. Specific calorie information may, therefore, have a different impact
than labeling items as “low calorie” or “low fat”. In addition, there is some evidence that
calorie information does not affect everyone to the same extent, but who is affected by such
information and how this information changes behavior for different groups remains unclear.
Furthermore, these studies address only one of the two options available to restaurant patrons
interested in lowering their caloric intake. Such individuals not only have the option of
switching to a “healthier” order, but also the option of eating less of their original order.
Surprisingly, few studies have addressed this second option.
Kirschenbaum and Tomarken (1982) looked at effects of calorie information on food
intake by preloading restrained and unrestrained eaters with a milkshake and then presenting
them with ice cream in nine small bowls or three large bowls. In one condition the bowls
were labeled with accurate calorie information, while in the other condition no calorie
information was provided. Overall, the subjects who received calorie information ate less,
but there were differences between restrained and unrestrained eaters. Participants high in
restraint ate more than did unrestrained participants in the small-bowl-unlabeled condition
and the large-bowl-labeled condition, but the two groups ate the same amount in the small-
bowl-labeled (166.7g) and large-bowl-unlabeled conditions (256.8g).
Kral, Roe, and Rolls (2002) also examined the effects of calorie information on intake
by having normal-weight undergraduate students eat all meals in the laboratory on three
separate days. The energy density of foods served was kept consistent within each day but
was varied between days. In addition, one group of participants was provided with calorie
10
information while the other group received no calorie information. Participants ate
approximately 22% more on the high energy density day than on the low energy density day,
but no overall differences were found between the participants who received calorie
information and those who did not. Calorie information did seem to have different impacts
on restrained and unrestrained eaters, however. Among the participants who did not receive
calorie information, restrained participants ate less than unrestrained participants when
served low energy-density food. However, among the participants who did receive calorie
information, restraint was not related to food intake.
These two studies suggest that calorie information has different effects on restrained
and unrestrained eaters, but the nature of these effects remains unclear. The findings of the
Kral et al. study indicate that calorie information may affect restrained eaters when foods are
low in energy density, but it is hard to interpret the findings of the Kirschenbaum and
Tomarken study since the addition of a preload and the manipulation of bowl size obscure
the results.
In addition, participants in both studies were given no choice of which foods they
were served. As stated earlier, in an actual restaurant setting people could respond to calorie
information by changing their selections or by reducing their intake, but the studies reviewed
so far have only examined one of these two options. Only two studies to data have examined
both food choices and intake simultaneously.
Aaron, Evans, and Mela (1995) examined the effects of calorie information on food
intake in a cafeteria setting. Individuals who ate lunch regularly in a campus cafeteria were
asked to participate in the study as an experimental group. The amount that each individual
ate was measured both during a baseline week and during a week in which calorie
11
information, including the percentage of calories from fat, was posted next to each food. A
control group, consisting of individuals who did not eat regularly in the campus cafeteria,
was asked to eat in a separate cafeteria for the two weeks during which the study took place.
The only measure that increased significantly for the control group between weeks one and
two was the percent of energy from carbohydrate (46.1% to 48.4%). In the experimental
group, intake did not differ between weeks one and two for restrained eaters or for females.
Unrestrained eaters and males, however, consumed significantly more calories, fat, and
carbohydrate and significantly less protein after the calorie information was posted. Men tend
to report lower restraint scores than do women, so it is unclear whether unrestrained men and
unrestrained women both altered their intake or whether this restraint effect was driven
primarily by the male participants.
In a recent study, Harnack et al. (2008) examined the impact of calorie information on
the selection and intake of fast-food. Adolescents and adults who frequented fast-food
restaurants were presented with a menu describing fast-food items on which calorie
information was either present or absent. All participants were asked to select items from the
menu and the amount eaten by each participant was recorded. The provision of calorie
information did not alter intake or nutrient composition for females but was found to increase
intake in males.
As these studies were conducted to examine cafeteria and fast-food choices, it is not
clear that we could extrapolate from the results of either study to predict the effects of calorie
information on food intake or selection in a restaurant setting. However, these two studies do
provide a preliminary indication that calorie information may have little effect on the intake
of females but may actually increase intake in males. The results with respect to food
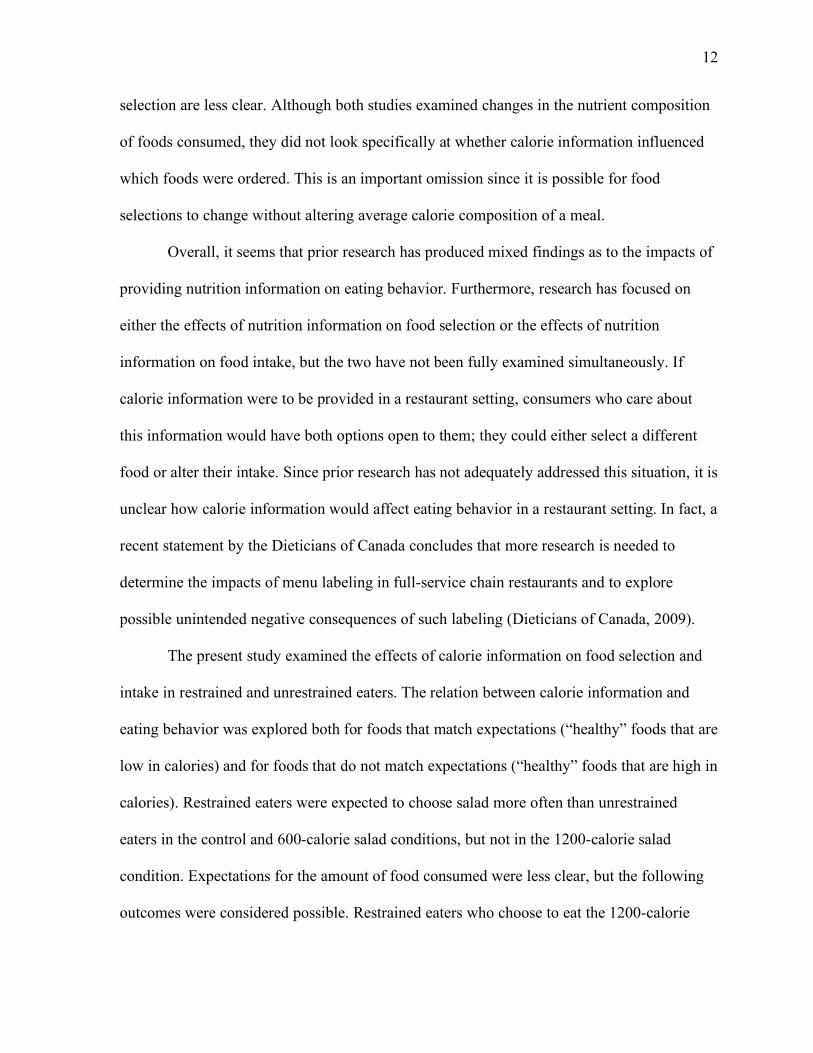
12
selection are less clear. Although both studies examined changes in the nutrient composition
of foods consumed, they did not look specifically at whether calorie information influenced
which foods were ordered. This is an important omission since it is possible for food
selections to change without altering average calorie composition of a meal.
Overall, it seems that prior research has produced mixed findings as to the impacts of
providing nutrition information on eating behavior. Furthermore, research has focused on
either the effects of nutrition information on food selection or the effects of nutrition
information on food intake, but the two have not been fully examined simultaneously. If
calorie information were to be provided in a restaurant setting, consumers who care about
this information would have both options open to them; they could either select a different
food or alter their intake. Since prior research has not adequately addressed this situation, it is
unclear how calorie information would affect eating behavior in a restaurant setting. In fact, a
recent statement by the Dieticians of Canada concludes that more research is needed to
determine the impacts of menu labeling in full-service chain restaurants and to explore
possible unintended negative consequences of such labeling (Dieticians of Canada, 2009).
The present study examined the effects of calorie information on food selection and
intake in restrained and unrestrained eaters. The relation between calorie information and
eating behavior was explored both for foods that match expectations (“healthy” foods that are
low in calories) and for foods that do not match expectations (“healthy” foods that are high in
calories). Restrained eaters were expected to choose salad more often than unrestrained
eaters in the control and 600-calorie salad conditions, but not in the 1200-calorie salad
condition. Expectations for the amount of food consumed were less clear, but the following
outcomes were considered possible. Restrained eaters who choose to eat the 1200-calorie

13
pasta may reduce the amount they eat in order to maintain their diets. Alternately, the 1200-
calorie label may disinhibit restrained eaters who choose pasta and thus increase their intake.
It is also possible that restrained eaters in the control condition assume that the pasta is high
in calories. In this case restrained eaters who choose to eat pasta may eat an equivalent
amount in the control and 1200-calorie conditions. Unrestrained eaters who choose the 1200-
calorie pasta condition may reduce their intake in response to the high calorie value of the
pasta. However, if unrestrained eaters do not care about calorie information then their intake
may not change. Restrained and unrestrained eaters who choose 600-calorie pasta may not
alter the amount they eat if this calorie amount does not differ from their expectations.
However, if this calorie amount is lower than expected, then they may increase their intake.
Both restrained and unrestrained eaters who choose the 1200-calorie salad may
reduce the amount they eat in response to this high calorie value. If participants in the control
condition assume that salad has less than 600 calories, then both restrained and unrestrained
eaters may also eat less in the 600-calorie salad condition as compared to the control
condition. However, if salad is assumed to have approximately 600 calories then intake may
not differ from the control condition. It is also possible that salad is seen as healthy
regardless of the calories it contains and, therefore, calorie labels may have no impact on
salad intake.
Method
Participants were 147 female students from the introductory psychology subject pool
at the University of Toronto Mississauga. The Restraint Scale (Herman & Polivy, 1980) was
used to categorize participants as restrained eaters (scoring 15 or higher) or unrestrained
eaters (scoring below 15).

14
All participants were first asked to fill out several questionnaires including a form
assessing liking of various foods, the Janis-Field Self-Esteem Scale as modified by Pliner
(Pliner, Chaiken, & Flett, 1990), and a visual analog scale measuring desire to eat, hunger,
fullness, and the amount participants felt they could eat at that time.
The participants were then told they would be rating potential new menu items for a
local restaurant. They were presented with a menu containing two items, a salad and a pasta
dish, each with a short description. The salad consisted of cucumber, carrot, tomato, avocado,
and cheddar cheese mixed with an oil and vinegar dressing. The pasta dish consisted of rotini
mixed with Prego pasta sauce and mozzarella cheese. The two dishes contained the same
number of calories (approximately 1250 per serving) and the same energy density (1.6
calories per gram), but the information provided to participants about the content of each dish
was varied across conditions.
In the control condition, there was no additional information on the menu beyond the
following descriptions: House salad – Crunchy cucumbers, shredded carrots, and diced
tomato tossed with fresh cheddar and avocado in our signature house dressing; Pasta
Marinara - Rotini tossed with our signature marinara and topped with fresh mozzarella. In the
first experimental condition, the same information was presented as in the control condition,
but the salad was described as having 600 calories and the pasta dish was described as having
1200 calories. In the second experimental condition the salad was described as having 1200
calories, while the pasta dish was described as having 600 calories. Participants selected
either the salad or the pasta dish from the menu and were given 15 minutes to complete their
meal.

15
After eating, participants were asked to fill out a series of questionnaires including the
same visual analog scale that was presented before eating, a meal evaluation form, a
shortened version of the Food Healthfulness Questionnaire (Carels, Harper, & Konrad,
2006), the Restraint Scale (Herman & Polivy, 1980), a measure of Dieter-Identity (Polivy),
the Three-Factor Eating Questionnaire (Stunkard & Messick, 1985), and the Dutch Eating
Behavior Questionnaire (Van Strien, Frijters, Bergers, & Defares, 1986).
Results
Although participants were instructed to eat as they would during a normal meal and
not merely to taste-test the food, four participants ate minimally (less than 50 grams) and
were dropped from the analyses. Two of these participants were restrained and two were
unrestrained. Three were in the control condition and one was in the 600 calorie salad/1200
calorie pasta condition. Two chose salad and two chose pasta.
Independent samples t-tests showed no difference in taste-ratings for the salad and the
pasta, t (88.42) = -0.91, p = 0.365.
Means and standard deviations for food chosen are presented in Table 1. The food
selected (pasta vs. salad) was submitted to a Condition x Restraint ANOVA. A main effect
was found for Restraint, with restrained eaters being more likely to chose salad than were
unrestrained eaters, F (1, 137) = 3.949, p < 0.05, but no Condition main effect or Condition x
Restraint interaction was found.
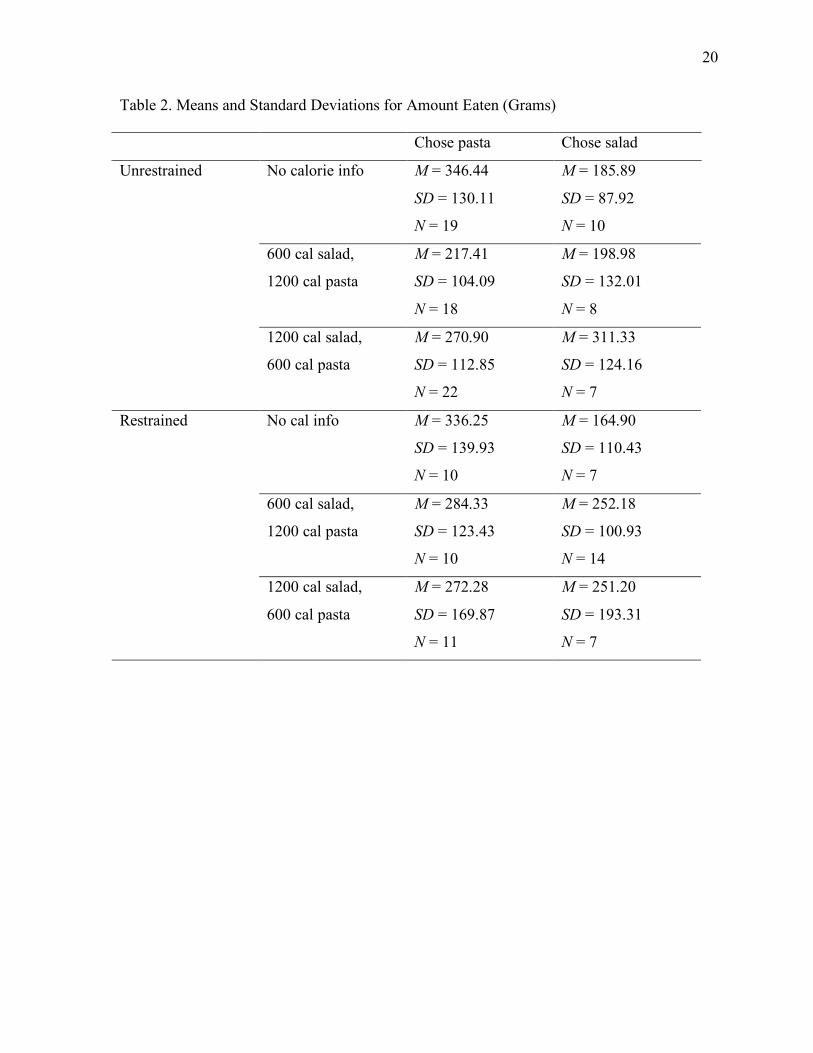
Means and standard deviations for grams eaten are presented in Table 2. Separate
Condition x Restraint ANOVAs were then conducted for the participants who chose pasta
and for those who chose salad. Main effects of Condition were found for both pasta, F (2, 84)
= 3.646, p < 0.05, and salad, F (2, 47) = 3.679, p < 0.05, but no Restraint main effects or
16
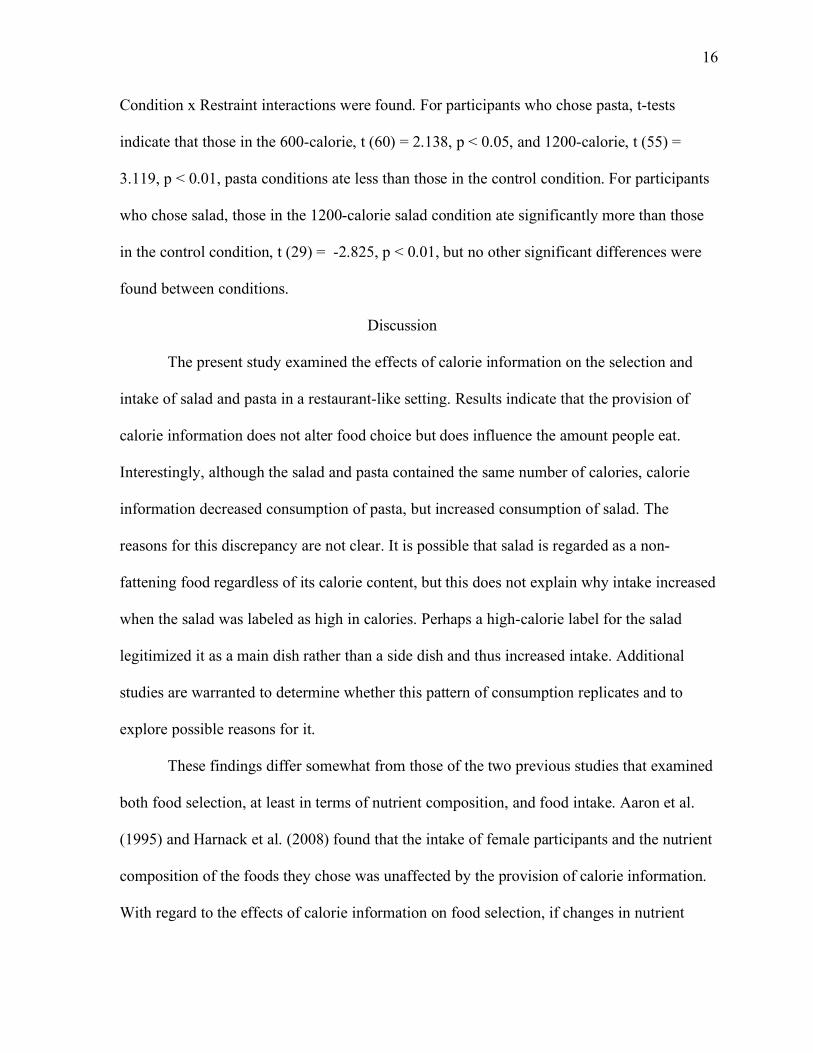
Condition x Restraint interactions were found. For participants who chose pasta, t-tests
indicate that those in the 600-calorie, t (60) = 2.138, p < 0.05, and 1200-calorie, t (55) =
3.119, p < 0.01, pasta conditions ate less than those in the control condition. For participants
who chose salad, those in the 1200-calorie salad condition ate significantly more than those
in the control condition, t (29) = -2.825, p < 0.01, but no other significant differences were
found between conditions.
Discussion
The present study examined the effects of calorie information on the selection and
intake of salad and pasta in a restaurant-like setting. Results indicate that the provision of
calorie information does not alter food choice but does influence the amount people eat.
Interestingly, although the salad and pasta contained the same number of calories, calorie
information decreased consumption of pasta, but increased consumption of salad. The
reasons for this discrepancy are not clear. It is possible that salad is regarded as a non-
fattening food regardless of its calorie content, but this does not explain why intake increased
when the salad was labeled as high in calories. Perhaps a high-calorie label for the salad
legitimized it as a main dish rather than a side dish and thus increased intake. Additional
studies are warranted to determine whether this pattern of consumption replicates and to
explore possible reasons for it.
These findings differ somewhat from those of the two previous studies that examined
both food selection, at least in terms of nutrient composition, and food intake. Aaron et al.
(1995) and Harnack et al. (2008) found that the intake of female participants and the nutrient
composition of the foods they chose was unaffected by the provision of calorie information.
With regard to the effects of calorie information on food selection, if changes in nutrient

17
composition are taken to mean differences in food selection then these findings are similar to
those of the present study. However, it is important to note that other studies (e.g., Balfour, et
al., 1996; Cinciripini, 1984) have found that calorie information does alter food selection.
One reason for these disparate findings may be the settings in which each study took place.
The majority of previous studies have examined the effects of nutrition information on food
selection in either cafeterias or fast-food restaurants, but chain-style restaurants have largely
been neglected. It is possible that the provision of calorie information has a different effect in
chain-style restaurants than it does in cafeterias or fast-food restaurants. Preliminary support
for this idea comes from Yamamoto et al. (2005), which showed that calorie information
influenced reported purchase intentions at Panda Express and McDonald’s but not at
Denny’s. These results suggest that our findings may apply only to chain-style restaurants,
not to fast-food restaurants or cafeterias.
With regard to the effects of calorie information on the amount of food consumed,
neither Aaron et al. (1995) nor Harnack et al. (2008) showed the pattern of increased
consumption of some foods and decreased consumption of others found in the present study
study. As previous studies have not examined intake across different types of foods, it is
possible that decreased intake of certain foods has been offset by increased intake of other
foods, thus producing what appear to be null findings. Rather than measuring consumption as
an aggregate of all foods eaten, future studies should explore how calorie information affects
the intake of specific types of food.
Overall, these results tentatively suggest that posting calorie information on menus
may have the unintended consequence of increasing the consumption of certain foods,
possibly those that are regarded as “non-fattening”. However, several limitations of the

18
present study should be noted. First, although the study setting was designed to simulate a
restaurant, it was conducted in a laboratory and the menu was limited to two options. Future
studies should be conducted in actual restaurants with the full range of menu items. Second,
only female university students were examined so it is unclear how demographic variables
such as gender, age, and education level influence responses to calorie information in
restaurants. Third, because participants ate alone, it was not possible to explore whether the
effects of calorie information are different when people eat in the company of others. People
may be driven by self-presentation motives, for example to appear “healthy”, which could
lead them to alter both the foods they select and how much they eat.

19
Table 1. Means and Standard Deviations for Food Chosen (Pasta = 1, Salad = 2).
Menu Condition Unrestrained Restrained
No cal info M = 1.34
SD = 0.48
N = 29
M = 1.41
SD = 0.51
N = 17
600 cal salad, 1200 cal pasta M = 1.31
SD = 0.47
N = 26
M = 1.58
SD = 0.50
N = 24
1200 cal salad, 600 cal pasta M = 1.24
SD = 0.44
N = 29
M = 1.39
SD = 0.50
N = 18
Total M = 1.30
SD = 0.46
N = 84
M = 1.47
SD = 0.50
N = 59
20
Table 2. Means and Standard Deviations for Amount Eaten (Grams)
Chose pasta Chose salad
No calorie info M = 346.44
SD = 130.11
N = 19
M = 185.89
SD = 87.92
N = 10
600 cal salad,
1200 cal pasta
M = 217.41
SD = 104.09
N = 18
M = 198.98
SD = 132.01
N = 8
Unrestrained
1200 cal salad,
600 cal pasta
M = 270.90
SD = 112.85
N = 22
M = 311.33
SD = 124.16
N = 7
No cal info M = 336.25
SD = 139.93
N = 10
M = 164.90
SD = 110.43
N = 7
600 cal salad,
1200 cal pasta
M = 284.33
SD = 123.43
N = 10
M = 252.18
SD = 100.93
N = 14
Restrained
1200 cal salad,
600 cal pasta
M = 272.28
SD = 169.87
N = 11
M = 251.20
SD = 193.31
N = 7

21
References
Aaron, J. I., Evans, R. E., & Mela, D. J. (1995). Paradoxical effects of a nutrition
labelling scheme in a student cafeteria. Nutrition Research, 15(9), 1251-1261.
Albright, C. L., Flora, J. A., & Fortmann, S. P. (1990). Restaurant menu labeling: Impact
of nutrition information on entrée sales and patron attitudes. Health Education
and Behavior, 17, 157-167.
Backstrand, J., Wootan, M.G., Young, R., & Hurley, J. Fat Chance. Washington, DD:
Center for Science in the Public Interest; 1997.
Balfour, D., Moody, R., Wise, A., & Brown, K. (1996). Food choice in response to
computer-generated nutrition information provided about meal selections in
workplace restaurants. Journal of Human Nutrition and Dietetics, 9, 231-237.
Binkley, J. K., Eales, J., & Jekanowski, M. (2000). The relation between dietary change
and rising US obesity. International Journal of Obesity, 24, 1032-1039.
Burton, S., Creyer, E. H., Kees, J., & Huggins, K. (2006). Attacking the obesity
epidemic: The potential health benefits of providing nutrition information in
restaurants. American Journal of Public Health, 96(9), 1669-1675.
Carels, R. A., Harper, J., & Konrad, K. (2006). Qualitative perceptions and caloric
estimations of healthy and unhealthy foods by behavioral weight loss participants.
Appetite, 46,199-206.
Chandon, P., & Wansink, B. (2007a). Is obesity caused by calorie underestimation? A
psychophysical model of meal size estimation. Journal of Marketing Research,
44(1), 84-99.
22
Chandon, P., & Wansink, B. (2007b). The biasing health halos of fast-food restaurant
claims: Lower calorie estimates and higher side-dish consumption intentions.
Journal of Consumer Research, 43, 301-314.
Cinciripini, P. M. (1984). Changing food selections in a public cafeteria: An applied
behavior analysis. Behavior Modification, 8, 4, 520-539.
Cranage, D. A., Conklin, M. T., & Lambert, C. U. (2004). Effect of nutrition information
in perceptions of food quality, consumption behavior and purchase intentions.
Journal of Foodservice Business Research, 7, 1, 43-61.
Dietitians of Canada. (2009). Does menu labeling make a difference to consumers’
choices? Current Issues: The Inside Story.
Diliberti, N., Bordi, P. L., Conklin, M. T., Roe, L. S., & Rolls, B. J. (2004). Increased
portion size leads to increased energy intake in a restaurant meal. Obesity
Research, 12(3), 562-568.
Dubbert, P. M., Johnson, W. G., Schlundt, D. G., & Montague, N. W. (1984). The
influence of caloric information on cafeteria food choices. Journal of Applied
Behavior Analysis, 17, 85-92.
Duffey, K. J., Gordon-Larsen, P., Jacobs, D. R., Williams, O. D., & Popkin, B. M.
(2007). Differential association of fast food and restaurant food consumption with
3-y change in body mass index: The Coronary Artery Risk Development in
Young Adults Study. The American Journal of Clinical Nutrition, 85, 201-208.
Eck Clemens, L. H., Slawson, D. L., & Klesges, R. C. (1999). The effect of eating out on
quality of diet in premenopausal women. Journal of the American Dietetic
Association, 99(4), 442-444.
23
FDA/CFSAN (Food and Drug Administration/Center for Food Safety & Applied
Nutrition). (2004). Counting calories: Report of the working group on obesity.
Available at: http://www.cfsan.fda.gov/~dms/owg-rpt.html#v.
Gerend, M. A. (2009). Does calorie information promote lower calorie fast food choices
among college students? Journal of Adolescent Health, 44, 84-86.
Guthrie, J. F., Lin, B., & Frazao, E. (2002). Role of food prepared away from home in the
American diet, 1977-78 versus 1994-96: Changes and consequences. Journal of
Nutrition Education and Behavior, 34(3), 140-150.
Harnack, L. J., French, S. A., Oakes, J. M., Story, M. T., Jeffrey, R. W., & Rydell, S. A.
(2008). Effects of calorie labeling and value size pricing on fast food meal
choices: Results from an experimental trial. International Journal of Behavioral
Nutrition and Physical Activity, 5, 63.
Herman, C. P., & Polivy, J. (1980). Restrained eating. In A. Stunkard (Ed.), Obesity (pp.
208–225). Philadelphia:W.B. Saunders.
H.R. 3895. (2008). Menu Education and Labeling Act. Available at:
http://www.govtrack.us/congress/billtext.xpd?bill=h110-3895
Keith, S. W., Redden, D. T., Katzmarzyk, P. T., Boggiano, M. M., Hanlon, E. C., Benca,
R. M., et al. (2006). Putative contributors to the secular increase in obesity:
Exploring the road less traveled. International Journal of Obesity, 30, 1585-1594.
Kirschenbaum, D. S., & Tomarken, A. J. (1982). Some antecedents of regulatory eating
by restrained and unrestrained eaters. Journal of Abnormal Psychology, 91, 326-
336.
Kral, T. V. E., Roe, L. S., & Rolls, B. J. (2002). Does nutrition information about the
24
energy density of meals affect food intake in normal-weight women? Appetite, 39,
137-145.
Levin, S. (1996). Pilot study of a cafeteria program relying primarily on symbols to
promote healthy choices. Journal of Nutrition Education, 28(5), 282-285.
Lin, B., Guthrie, J., Frazao, E. (1999). Away-from-home foods increasingly important to
quality of American diet. USDA, Economic Research Service, Washington, D.C.
Agriculture Information Bulletin, 749.
McCrory, M. A., Fuss, P. J., Hays, N. P., Vinken, A. G., Greenberg, A. S., & Roberts, S.
B (1999). Overeating in America: Associations between restaurant food
consumption and body fatness in healthy adult men and women ages 19 to 80.
Obesity Research, 7(6), 564-571.
National Restaurant Association (2005). Industry at a Glance. Available at
http://www.restaurant.org/research/ind_glance.cfm.
Nielsen, S. J., & Popkin, B. M. (2003). Patterns and trends in food portion sizes, 1977-
1998. Journal of the American Medical Association, 289, 4, 450-453.
Pliner, P., Chaiken, S., & Flett, G. L. (1990). Gender differences in concern with body
weight and physical appearance over the life span. Personality and Social
Psychology Bulletin, 16, 2, 263-273.
Stunkard, A. J., & Messick, S. (1985). The Three-Factor Eating Questionnaire to measure
restraint, disinhibition, and hunger. Journal of Psychosomatic Research, 29, 1, 71-
83.
Thompson, O. M., Ballew, C., Resnicow, K., Must, A., Bandini, L. G., Cyr, H., & Dietz,
W. H. (2004). Food purchased away from home as a predictor of change in BMI

25
z-score among girls. International Journal of Obesity, 28, 282-289.
U.S. Department of Health and Human Services: Office of the Surgeon General. (2008).
Overweight and obesity: Health consequences. Available at
http://www.surgeongeneral.gov/topics/obesity/calltoaction/fact_consequences.ht
ml
Van Strien, T., Frijters, J. E., Bergers, G. P., & Defares, P. B. (1986). The Dutch Eating
Behavior Questionnaire (DEBQ) for assessment of restrained, emotional, and
external eating behavior. International Journal of Eating Disorders, 5, 2, 295-
315.
Wansink, B., & Chandon, P. (2006). Can “low-fat” nutrition labels lead to obesity?
Journal of Marketing Research, 43(4), 605-617.
Wansink, B., & Kim, J. (2005). Bad popcorn in big buckets: Portion size can influence
intake as much as taste. Journal of Nutrition Education and Behavior, 37(5), 1-4.
Wootan, M. G., Osborn, M., & Malloy, C. J. (2006). Availability of point-of-purchase
nutrition information at a fast-food restaurant. Preventative Medicine, 43, 458-
459.
Yamamoto, J. A., Yamamoto, J. B., Yamamoto, B. E., & Yamamoto, L. G. (2005).
Adolescent fast food and restaurant ordering behavior with and without calorie
and fat content menu information. Journal of Adolescent Health, 37, 397-402.

![Effects of Popular Diets without Specific Calorie Targets on ......weight loss induced by calorie-restricted diets [1], alternative dietary approaches to achieve short-and long-term](https://static.documents.pub/doc/80x56/6039e66269d7655eb0436a25/effects-of-popular-diets-without-specific-calorie-targets-on-weight-loss.jpg)


