
9/28/2016
1
The Great Plunge in Oil Prices:Causes, Consequences and Policy Responses
September 28, 2016
M. Ayhan [email protected]
Disclaimer! The views presented in this presentation are those of the authors and do not necessarily reflect the views of the World Bank Group or World Bank Policy.
• Global Economic Prospects – January 2017 (January and June)
• Commodity Markets Outlook – October 2016(January, April, July, and October)
• Global Monthly, Global Weekly, and Global Daily
• Negative Interest Rate Policies: Sources and Implications Arteta, Kose, Stocker and Taskin, Policy Research Working Paper – August 2016
Select Publications on Global Economy
2
9/28/2016
2
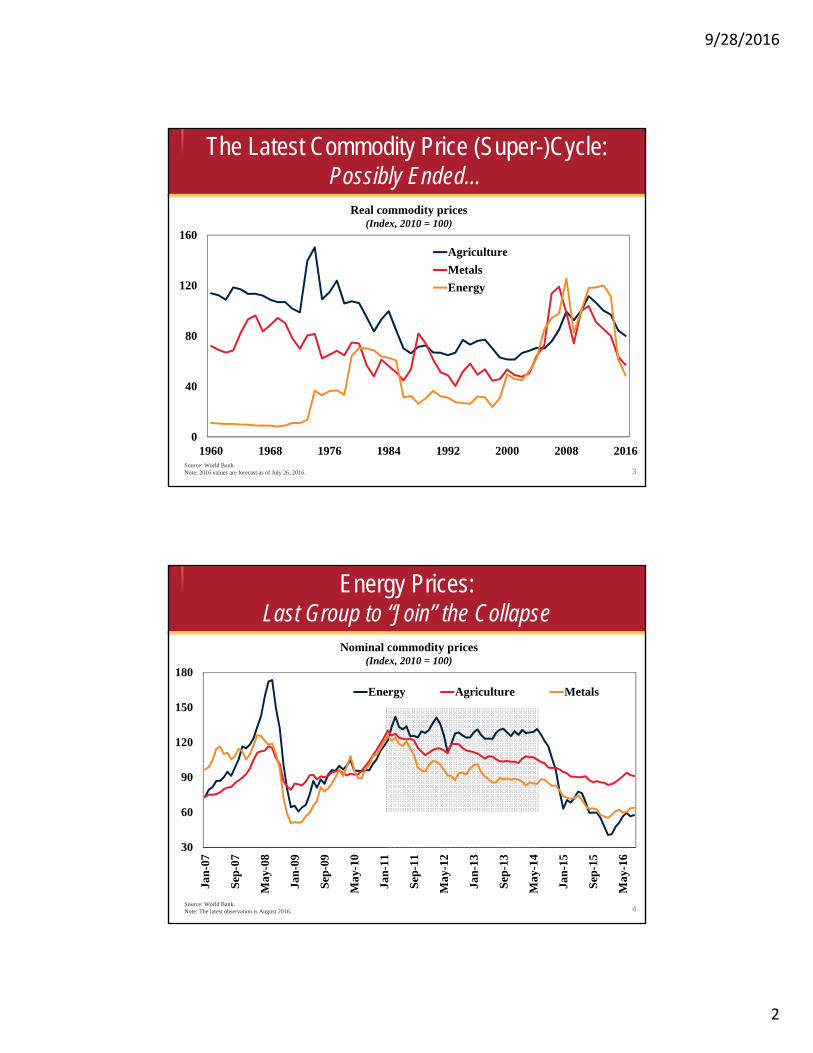
Real commodity prices(Index, 2010 = 100)
Source: World Bank.Note: 2016 values are forecast as of July 26, 2016.
The Latest Commodity Price (Super-)Cycle:Possibly Ended…
3
0
40
80
120
160
1960 1968 1976 1984 1992 2000 2008 2016
Agriculture
Metals
Energy
Nominal commodity prices(Index, 2010 = 100)
Source: World Bank.Note: The latest observation is August 2016.
Energy Prices:Last Group to “Join” the Collapse
4
30
60
90
120
150
180
Jan
-07
Sep
-07
May
-08
Jan
-09
Sep
-09
May
-10
Jan
-11
Sep
-11
May
-12
Jan
-13
Sep
-13
May
-14
Jan
-15
Sep
-15
May
-16
Energy Agriculture Metals

9/28/2016
3
Commodity price changes(Percent, change from 2011Q1 to 2014Q2)
Source: World Bank.Right Panel. Fraction of commodities (out of a total of almost 50 commodities) for which prices declined from the previous year.
Commodity Prices:Resilient Oil Prior to 2014:2; But Then..
5
-60-50-40-30-20-10010
CottonCoal
SilverNickel
CopperAluminum
RiceTin
LeadPlatinum
ZincCocoa
GoldTea
WheatCrude oil
Commodities with lower prices from previous years
(Percent, share of commodities)
0
20
40
60
80
100
2009 2010 2011 2012 2013 2014 2015
Maximum 1980-2008
Minimum 1980-2008
Four Questions
1 What has been the role of supply?Looks like played a major role
2
3
What has been the role of demand?Somewhat smaller role but..
6
What has been the driving force behind the collapse in oil prices?Mostly supply…
4 What are the implications for commodity-exporters?Weak growth in commodity-exporters; stronger policy support needed…
9/28/2016
4
20
50
80
110
140
Jan-11 Jul-11 Jan-12 Jul-12 Jan-13 Jul-13 Jan-14 Jul-14 Jan-15 Jul-15 Jan-16 Jul-16
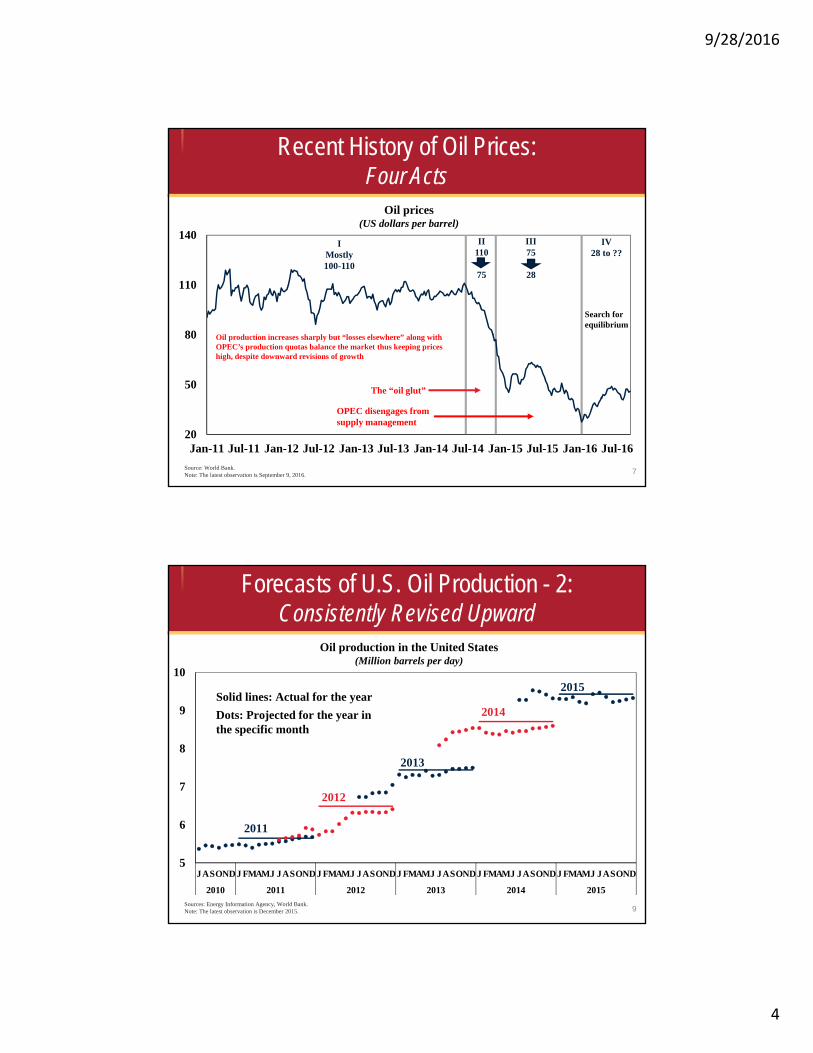
IMostly 100-110
Oil prices(US dollars per barrel)
Source: World Bank.Note: The latest observation is September 9, 2016.
Recent History of Oil Prices:Four Acts
7
II110
75
Oil production increases sharply but “losses elsewhere” along with OPEC’s production quotas balance the market thus keeping prices high, despite downward revisions of growth
The “oil glut”
OPEC disengages from supply management
Search for equilibrium
III75
28
IV28 to ??
Oil production in the United States(Million barrels per day)
Sources: Energy Information Agency, World Bank.Note: The latest observation is December 2015.
Forecasts of U.S. Oil Production - 2:Consistently Revised Upward
9
5
6
7
8
9
10
JASONDJ FMAMJ JASONDJ FMAMJ JASONDJ FMAMJ JASONDJ FMAMJ JASONDJ FMAMJ JASOND
2010 2011 2012 2013 2014 2015
2011
2012
2014
2013
2015Solid lines: Actual for the year
Dots: Projected for the year in the specific month
9/28/2016
5
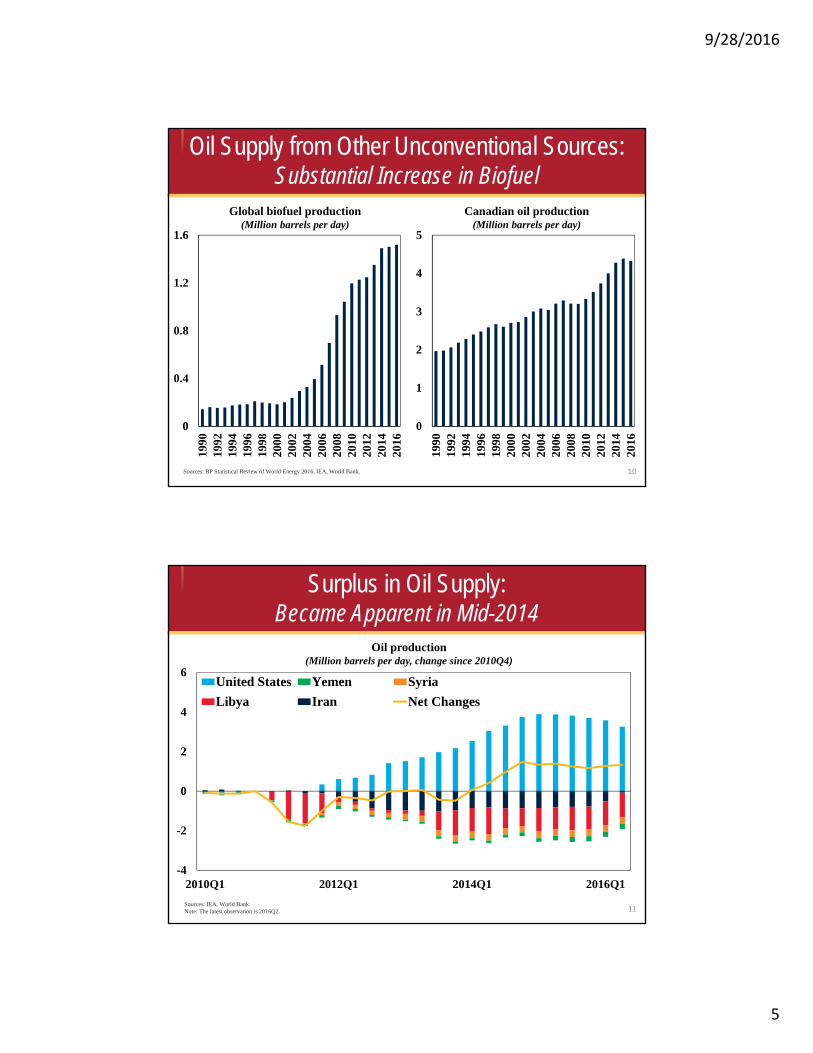
Global biofuel production(Million barrels per day)
Oil Supply from Other Unconventional Sources:Substantial Increase in Biofuel
Sources: BP Statistical Review of World Energy 2016, IEA, World Bank. 10
Canadian oil production(Million barrels per day)
0
0.4
0.8
1.2
1.6
1990
1992
1994
1996
1998
2000
2002
2004
2006
2008
2010
2012
2014
2016
0
1
2
3
4
5
1990
1992
1994
1996
1998
2000
2002
2004
2006
2008
2010
2012
2014
2016
Oil production(Million barrels per day, change since 2010Q4)
Sources: IEA, World Bank.Note: The latest observation is 2016Q2.
Surplus in Oil Supply:Became Apparent in Mid-2014
11
-4
-2
0
2
4
6
2010Q1 2012Q1 2014Q1 2016Q1
United States Yemen Syria
Libya Iran Net Changes
9/28/2016
6
OPEC’s Objective:Changing with the Market…
12
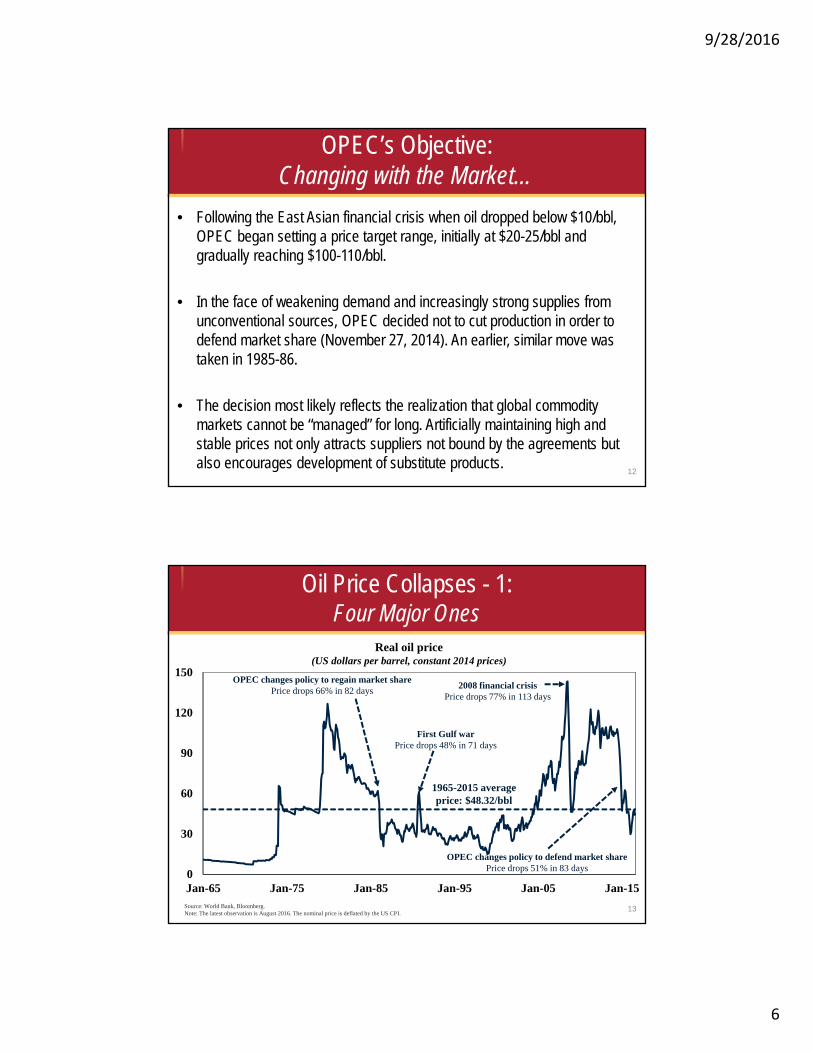
• Following the East Asian financial crisis when oil dropped below $10/bbl, OPEC began setting a price target range, initially at $20-25/bbl and gradually reaching $100-110/bbl.
• In the face of weakening demand and increasingly strong supplies from unconventional sources, OPEC decided not to cut production in order to defend market share (November 27, 2014). An earlier, similar move was taken in 1985-86.
• The decision most likely reflects the realization that global commodity markets cannot be “managed” for long. Artificially maintaining high and stable prices not only attracts suppliers not bound by the agreements but also encourages development of substitute products.
Real oil price(US dollars per barrel, constant 2014 prices)
Source: World Bank, Bloomberg.Note: The latest observation is August 2016. The nominal price is deflated by the US CPI.
Oil Price Collapses - 1:Four Major Ones
13
0
30
60
90
120
150
Jan-65 Jan-75 Jan-85 Jan-95 Jan-05 Jan-15
1965-2015 average price: $48.32/bbl
2008 financial crisisPrice drops 77% in 113 days
OPEC changes policy to regain market sharePrice drops 66% in 82 days
First Gulf warPrice drops 48% in 71 days
OPEC changes policy to defend market sharePrice drops 51% in 83 days
9/28/2016
7
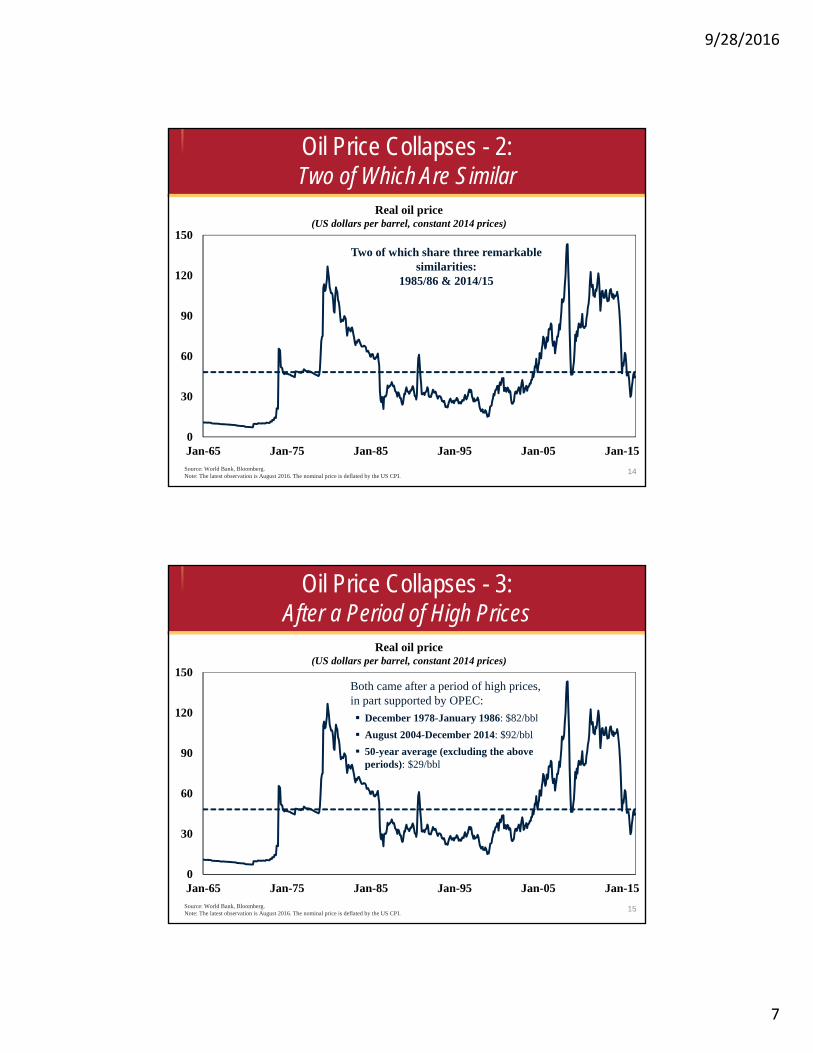
Real oil price(US dollars per barrel, constant 2014 prices)
Source: World Bank, Bloomberg.Note: The latest observation is August 2016. The nominal price is deflated by the US CPI.
Oil Price Collapses - 2:Two of Which Are Similar
14
0
30
60
90
120
150
Jan-65 Jan-75 Jan-85 Jan-95 Jan-05 Jan-15
Two of which share three remarkable similarities:
1985/86 & 2014/15
Real oil price(US dollars per barrel, constant 2014 prices)
Source: World Bank, Bloomberg.Note: The latest observation is August 2016. The nominal price is deflated by the US CPI.
Oil Price Collapses - 3:After a Period of High Prices
15
0
30
60
90
120
150
Jan-65 Jan-75 Jan-85 Jan-95 Jan-05 Jan-15
Both came after a period of high prices, in part supported by OPEC:
December 1978-January 1986: $82/bbl
August 2004-December 2014: $92/bbl
50-year average (excluding the above periods): $29/bbl

9/28/2016
8
Real oil price(US dollars per barrel, constant 2014 prices)
Source: World Bank, Bloomberg.Note: The latest observation is August 2016. The nominal price is deflated by the US CPI.
Oil Price Collapses - 4:New Supplies Brought by High Prices
16
0
30
60
90
120
150
Jan-65 Jan-75 Jan-85 Jan-95 Jan-05 Jan-15
In both periods, high oil prices brought new oil supplies:
Prior to 1985/86: (i) Alaska, (ii) North Sea, and (iii) Gulf of Mexico (brought 5 mb/d in the 8 years prior to the collapse, 9% of world total)
Prior to 2014/15: (i) Biofuels, (ii) Canadian oil sands, and (iii) U.S. shale oil (brought 7 mb/d in the decade prior to the collapse, 8% of world total)
Real oil price(US dollars per barrel, constant 2014 prices)
Source: World Bank, Bloomberg.Note: The latest observation is August 2016. The nominal price is deflated by the US CPI.
Oil Price Collapses - 5:…and OPEC Responses
17
0
30
60
90
120
150
Jan-65 Jan-75 Jan-85 Jan-95 Jan-05 Jan-15
In both cases, OPEC disengaged from managing supplies exacerbating the price collapse--delayed response in 1985, quick action in 2014.
9/28/2016
9
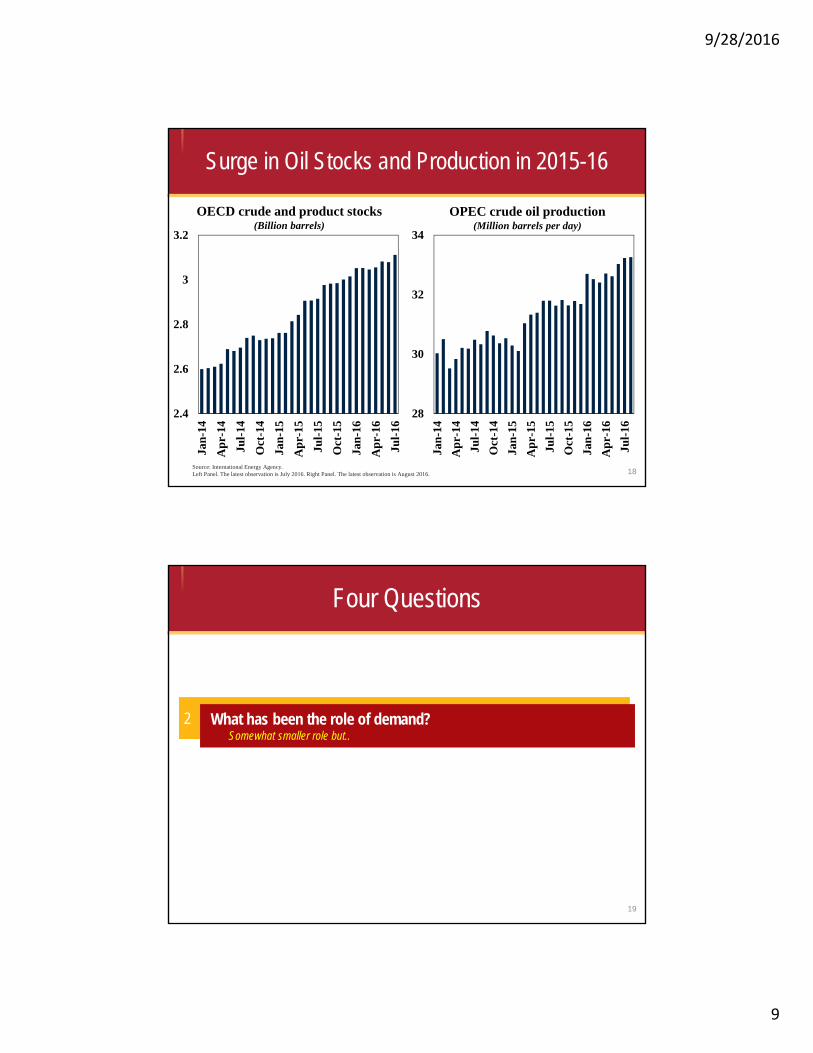
Source: International Energy Agency.Left Panel. The latest observation is July 2016. Right Panel. The latest observation is August 2016.
Surge in Oil Stocks and Production in 2015-16
OECD crude and product stocks(Billion barrels)
18
OPEC crude oil production(Million barrels per day)
2.4
2.6
2.8
3
3.2
Jan
-14
Ap
r-14
Jul-
14
Oct
-14
Jan
-15
Ap
r-15
Jul-
15
Oct
-15
Jan
-16
Ap
r-16
Jul-
16
28
30
32
34
Jan
-14
Ap
r-14
Jul-
14
Oct
-14
Jan
-15
Ap
r-15
Jul-
15
Oct
-15
Jan
-16
Ap
r-16
Jul-
16
Four Questions
2 What has been the role of demand?Somewhat smaller role but..
19

9/28/2016
10
20
GDP Growth (Percent)
Source: World Bank.Note: The shared area indicates forecasts. EMDEs refer to emerging market and developing economies.
Global Economy:A Mediocre Expansion with Repeated Disappointments…
-4
-2
0
2
4
6
8
10
2007 2008 2009 2010 2011 2012 2013 2014 2015 2016 2017 2018
World Advanced economies EMDEs
GDP growth(Percent)
Source: World Bank.Note: Weighted average growth.
Advanced Economies and EMDEs:Slow Growth All Around
21
0
2
4
6
8
2011
2012
2013
2014
2015
2016
2017
2011
2012
2013
2014
2015
2016
2017
2011
2012
2013
2014
2015
2016
2017
World Advanced economies EMDEs
1990-2008 Average 2003-08 Average
9/28/2016
11
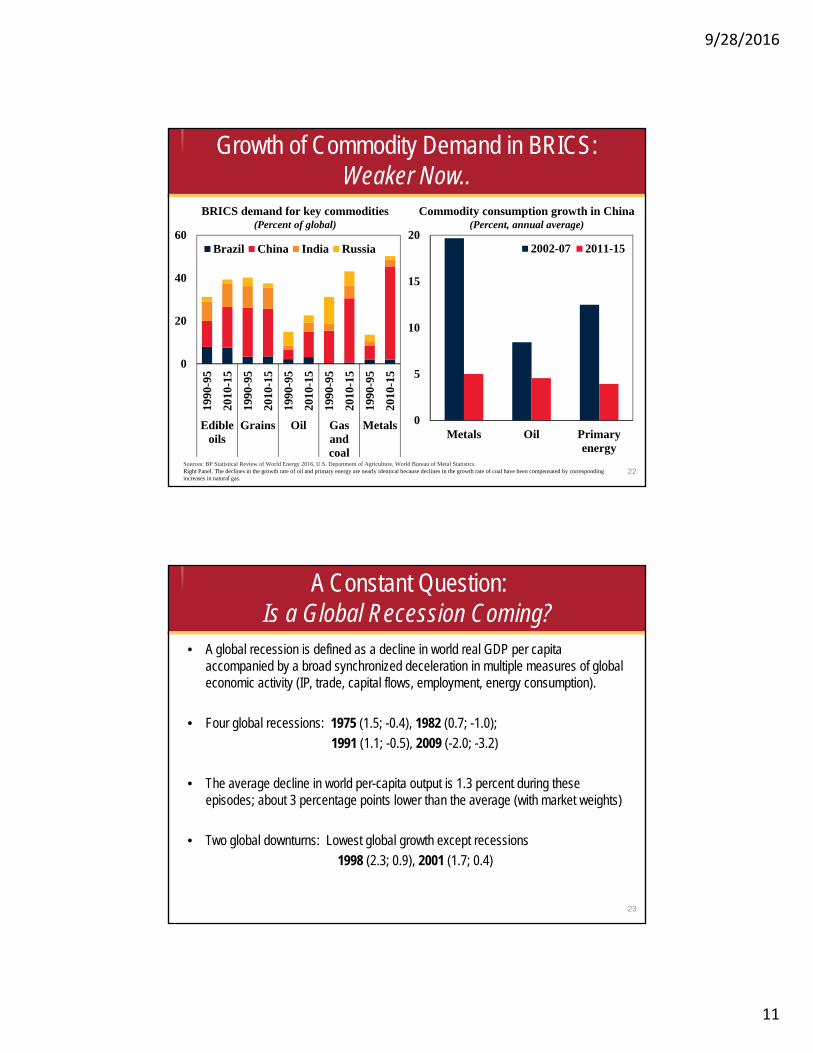
BRICS demand for key commodities(Percent of global)
Growth of Commodity Demand in BRICS:Weaker Now..
Sources: BP Statistical Review of World Energy 2016, U.S. Department of Agriculture, World Bureau of Metal Statistics.Right Panel. The declines in the growth rate of oil and primary energy are nearly identical because declines in the growth rate of coal have been compensated by corresponding increases in natural gas.
22
Commodity consumption growth in China(Percent, annual average)
0
20
40
60
1990
-95
2010
-15
1990
-95
2010
-15
1990
-95
2010
-15
1990
-95
2010
-15
1990
-95
2010
-15
Edibleoils
Grains Oil Gasandcoal
Metals
Brazil China India Russia
0
5
10
15
20
Metals Oil Primaryenergy
2002-07 2011-15
A Constant Question:Is a Global Recession Coming?
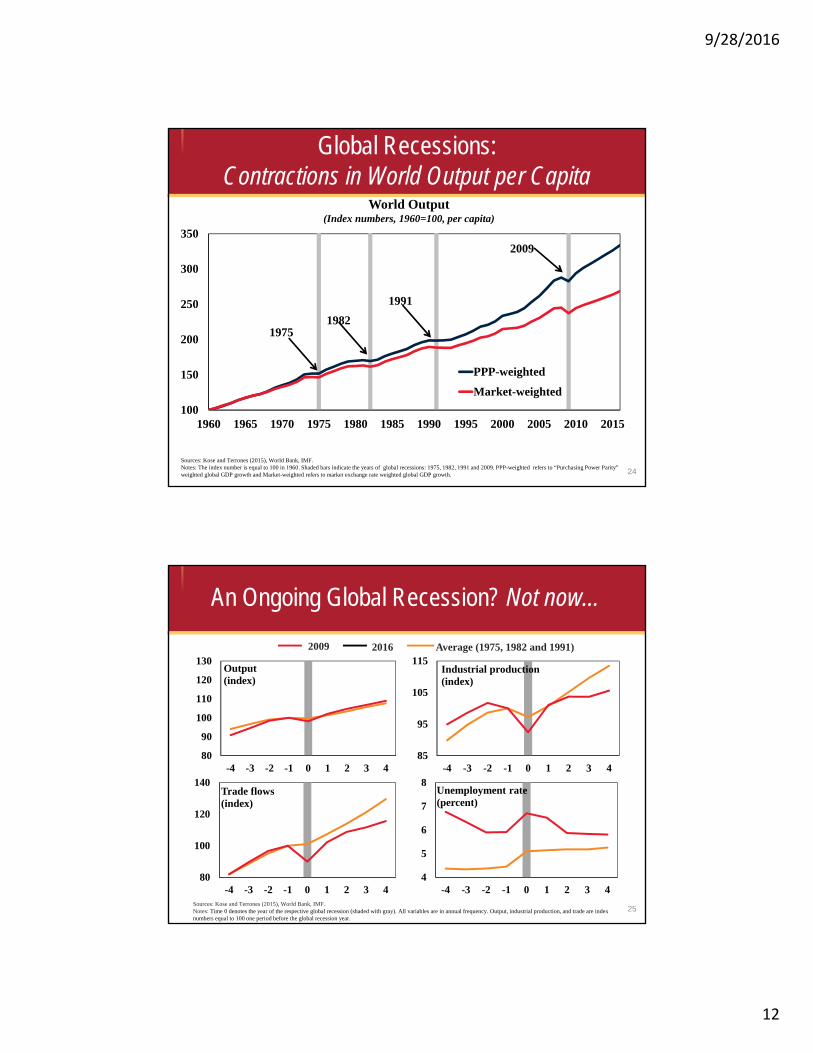
• A global recession is defined as a decline in world real GDP per capita accompanied by a broad synchronized deceleration in multiple measures of global economic activity (IP, trade, capital flows, employment, energy consumption).
• Four global recessions: 1975 (1.5; -0.4), 1982 (0.7; -1.0);
1991 (1.1; -0.5), 2009 (-2.0; -3.2)
• The average decline in world per-capita output is 1.3 percent during these episodes; about 3 percentage points lower than the average (with market weights)
• Two global downturns: Lowest global growth except recessions
1998 (2.3; 0.9), 2001 (1.7; 0.4)
23
9/28/2016
12
24
World Output(Index numbers, 1960=100, per capita)
Sources: Kose and Terrones (2015), World Bank, IMF. Notes: The index number is equal to 100 in 1960. Shaded bars indicate the years of global recessions: 1975, 1982, 1991 and 2009. PPP-weighted refers to “Purchasing Power Parity” weighted global GDP growth and Market-weighted refers to market exchange rate weighted global GDP growth.
100
150
200
250
300
350
1960 1965 1970 1975 1980 1985 1990 1995 2000 2005 2010 2015
PPP-weighted
Market-weighted
19751982
1991
2009
Global Recessions: Contractions in World Output per Capita
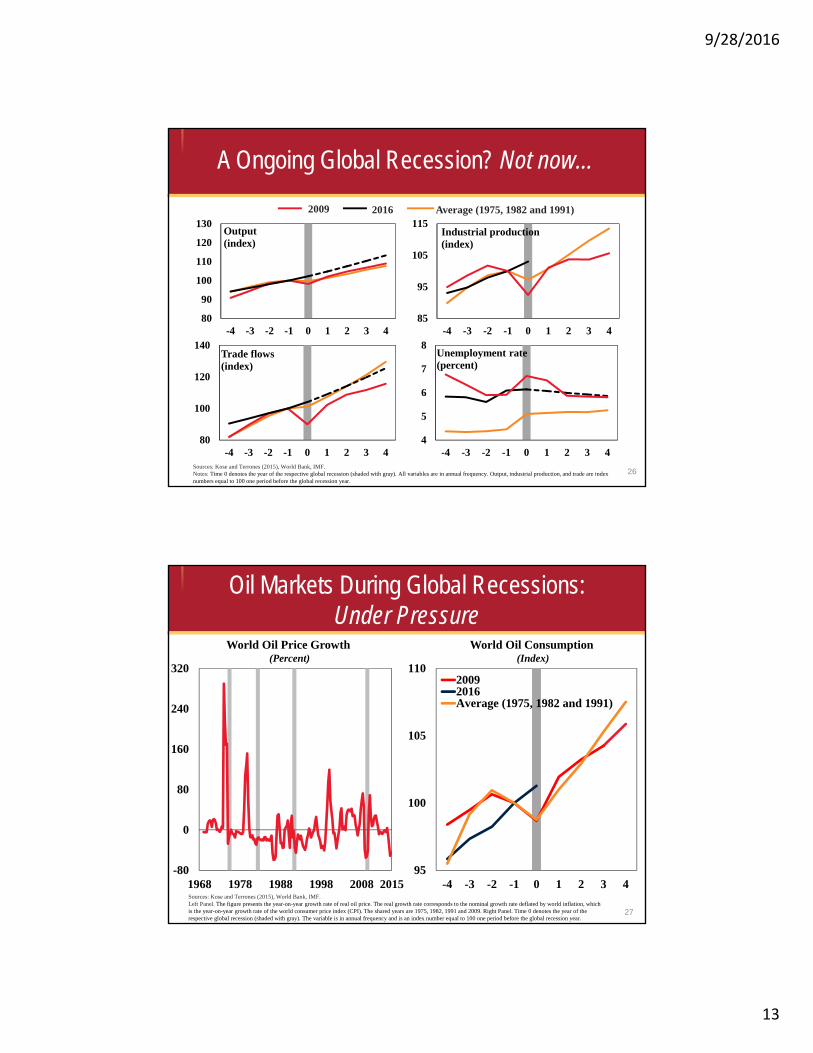
25Sources: Kose and Terrones (2015), World Bank, IMF. Notes: Time 0 denotes the year of the respective global recession (shaded with gray). All variables are in annual frequency. Output, industrial production, and trade are index numbers equal to 100 one period before the global recession year.
80
90
100
110
120
130
-4 -3 -2 -1 0 1 2 3 4
Output(index)
80
100
120
140
-4 -3 -2 -1 0 1 2 3 4
Trade flows(index)
85
95
105
115
-4 -3 -2 -1 0 1 2 3 4
Industrial production(index)
4
5
6
7
8
-4 -3 -2 -1 0 1 2 3 4
Unemployment rate(percent)
2009 2016 Average (1975, 1982 and 1991)
An Ongoing Global Recession? Not now…
9/28/2016
13
26Sources: Kose and Terrones (2015), World Bank, IMF. Notes: Time 0 denotes the year of the respective global recession (shaded with gray). All variables are in annual frequency. Output, industrial production, and trade are index numbers equal to 100 one period before the global recession year.
80
90
100
110
120
130
-4 -3 -2 -1 0 1 2 3 4
Output(index)
80
100
120
140
-4 -3 -2 -1 0 1 2 3 4
Trade flows(index)
85
95
105
115
-4 -3 -2 -1 0 1 2 3 4
Industrial production(index)
4
5
6
7
8
-4 -3 -2 -1 0 1 2 3 4
Unemployment rate(percent)
2009 2016 Average (1975, 1982 and 1991)
A Ongoing Global Recession? Not now…
27
Oil Markets During Global Recessions:Under Pressure
Sources: Kose and Terrones (2015), World Bank, IMF. Left Panel. The figure presents the year-on-year growth rate of real oil price. The real growth rate corresponds to the nominal growth rate deflated by world inflation, which is the year-on-year growth rate of the world consumer price index (CPI). The shared years are 1975, 1982, 1991 and 2009. Right Panel. Time 0 denotes the year of the respective global recession (shaded with gray). The variable is in annual frequency and is an index number equal to 100 one period before the global recession year.
World Oil Price Growth(Percent)
-80
0
80
160
240
320
1968 1978 1988 1998 2008 201595
100
105
110
-4 -3 -2 -1 0 1 2 3 4
20092016Average (1975, 1982 and 1991)
World Oil Consumption(Index)

9/28/2016
14
28Sources: Kose and Terrones (2015), World Bank, IMF. Notes: Each bar represents the average growth of the respective variable during the years of the global expansions (excluding the first year).
0
2
4
6
1977-81 1984-90 1993-2008 2011-16
Output(percent)
0
2
4
6
8
1977-81 1984-90 1993-2008 2011-16
Investment(percent)
Advanced Economies Emerging Market Economies
0
2
4
6
1977-81 1984-90 1993-2008 2011-16
Output(percent)
0
2
4
6
8
1977-81 1984-90 1993-2008 2011-16
Investment(percent)
But Risks Rising…Recovery: Weakest for Advanced, Weakening for Emerging
Growth in 2020: Forecasts in 2010 and 2016(Percent)
Sources: World Bank, Consensus Economics.Note: Weighted average growth. October forecasts for 46 countries for which long-term consensus forecasts are available.
Persistent Growth Pessimism:Long-Term Forecast Downgrades
29
0
2
4
6
8
World Advanced economies EMDEs
Forecast in 2010
Forecast in July 2016

9/28/2016
15
Four Questions
3
30
What has been the driving force behind the collapse in oil prices?Mostly supply…
Methodology:A Simple VAR Model
31
• The reduced-form VAR model is:y = a +A y +A y +⋯+A y + u • The variables included in the model are: oil prices, equity
prices, and U.S. exchange rates.

9/28/2016
16
Methodology:Shock Identification
32
• Supply and demand shocks are identified using sign restrictions
• Two orthogonal shocks with impulse responses that satisfy certain signs are estimated using the model
• Adverse demand shock: Oil and equity prices decline reflecting a weak economy
• Favorable supply shock: Oil prices decline but equity prices increase
• The differing movement of equity prices allows one to discriminate between supply and demand shocks
Contributions of supply and demand shocks to the oil price decline(Percentage points)
Sources: Baffes (2015), Bloomberg, FRED, Haver Analytics, World Bank.Note: Based on estimates from the model, identifying the demand and supply shocks using sign restrictions. All shocks except the shock of interest are shut off by setting them to zeros and the model is used to trace out the counterfactual oil price. This exercise is performed separately for supply and demand shocks. The red (blue) counterfactual shows how much oil prices would have declined since the second half of 2014 only with the estimated supply (demand) shocks. Numbers shown are in cumulative percentages.
Oil Price Collapse:Mostly (60 - 40) Due to Supply Shocks
33
-50
-40
-30
-20
-10
0
10
-90
-60
-30
0
Jul 14
Sep
14
Nov 14
Jan 15
Mar 15
May 15
Jul 15
Sep
15
Nov 15
Jan 16
Mar 16
May 16
Jul 16
Au
g 16
Supply (RHS)Demand (RHS)Actual

9/28/2016
17
Four Questions
34
4 What are the implications for commodity-exporters?Weak growth in commodity-exporters; stronger policy support needed…
GDP growth(Percent)
Source: World Bank.Note: Weighted average growth
Commodity Exporting EMDEs:After a Sharp Slowdown, Pick Up in 2017?
35
0
2
4
6
8
10
2011
2012
2013
2014
2015
2016
2017
2011
2012
2013
2014
2015
2016
2017
2011
2012
2013
2014
2015
2016
2017
2011
2012
2013
2014
2015
2016
2017
EMDEs EMDE commodityimporters
EMDE commodityexporters
Advanced economies
1990-2008 Average 2003-08 Average
9/28/2016
18
36
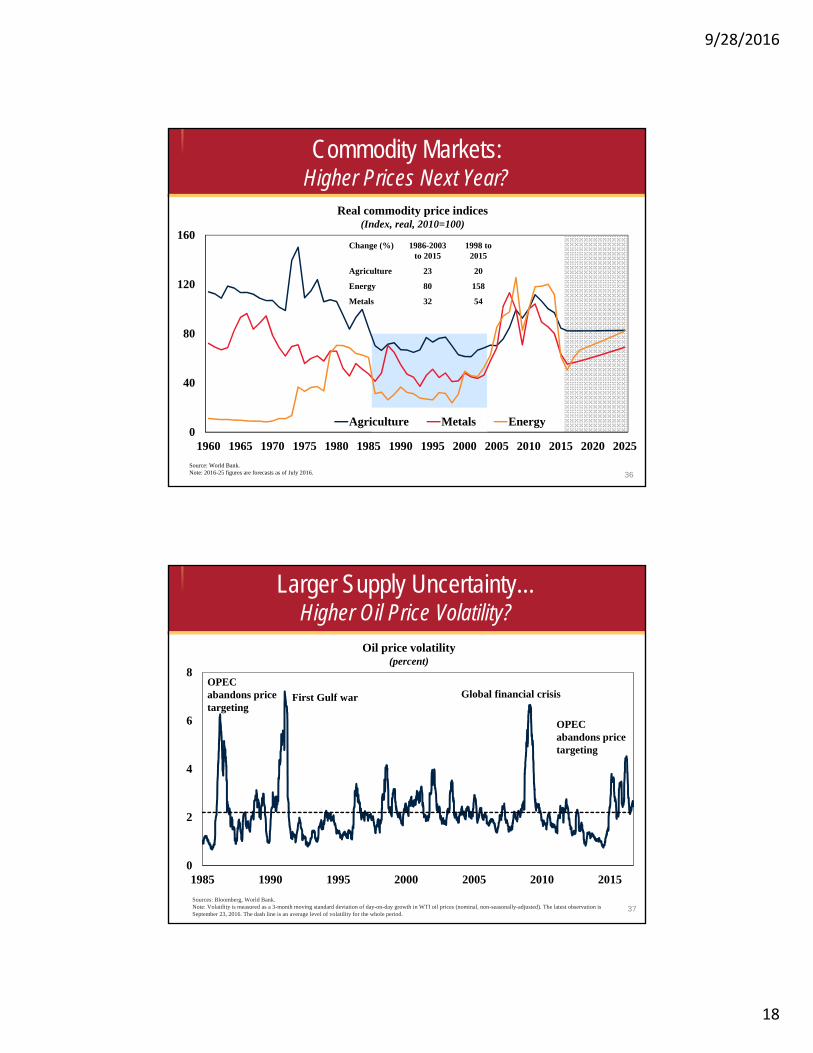
Commodity Markets: Higher Prices Next Year?
Source: World Bank.Note: 2016-25 figures are forecasts as of July 2016.
Real commodity price indices(Index, real, 2010=100)
0
40
80
120
160
1960 1965 1970 1975 1980 1985 1990 1995 2000 2005 2010 2015 2020 2025
Agriculture Metals Energy
Change (%) 1986-2003to 2015
1998 to 2015
Agriculture 23 20
Energy 80 158
Metals 32 54
Sources: Bloomberg, World Bank.Note: Volatility is measured as a 3-month moving standard deviation of day-on-day growth in WTI oil prices (nominal, non-seasonally-adjusted). The latest observation is September 23, 2016. The dash line is an average level of volatility for the whole period.
Larger Supply Uncertainty…Higher Oil Price Volatility?
Oil price volatility(percent)
37
0
2
4
6
8
1985 1990 1995 2000 2005 2010 2015
OPEC abandons price targeting
OPEC abandons price targeting
First Gulf war Global financial crisis
9/28/2016
19
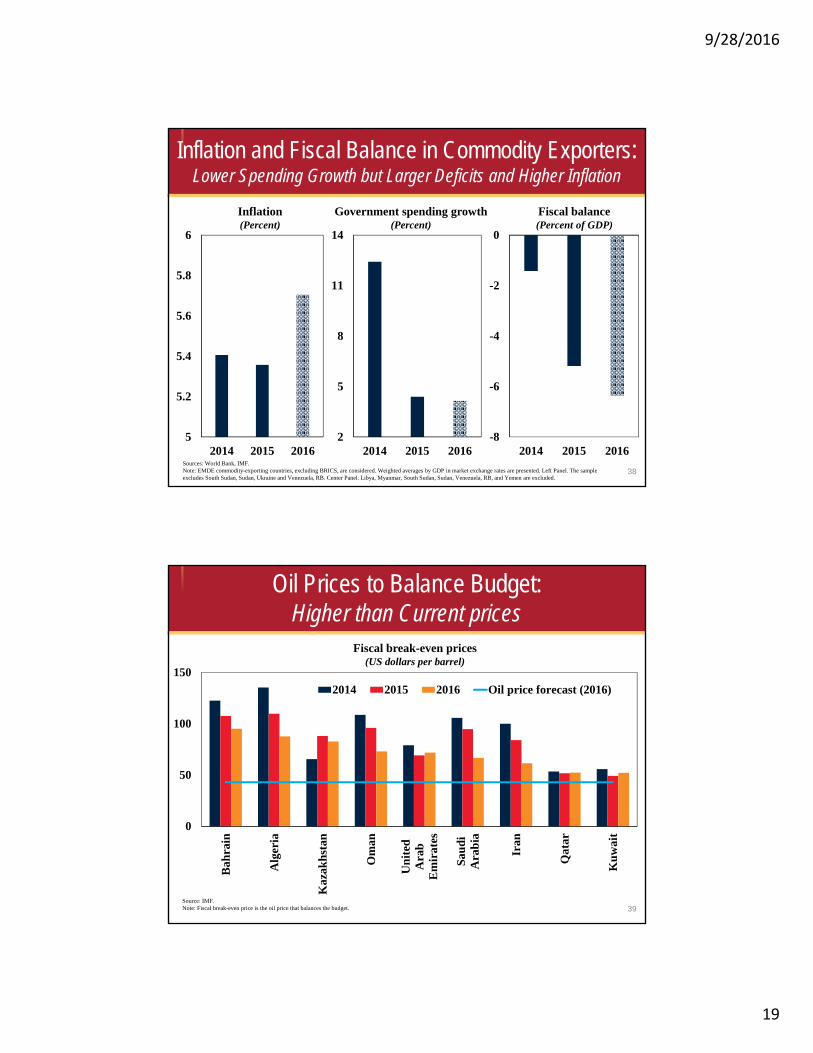
Sources: World Bank, IMF.Note: EMDE commodity-exporting countries, excluding BRICS, are considered. Weighted averages by GDP in market exchange rates are presented. Left Panel. The sample excludes South Sudan, Sudan, Ukraine and Venezuela, RB. Center Panel. Libya, Myanmar, South Sudan, Sudan, Venezuela, RB, and Yemen are excluded.
38
Inflation and Fiscal Balance in Commodity Exporters:Lower Spending Growth but Larger Deficits and Higher Inflation
Inflation(Percent)
Government spending growth(Percent)
Fiscal balance(Percent of GDP)
5
5.2
5.4
5.6
5.8
6
2014 2015 20162
5
8
11
14
2014 2015 2016-8
-6
-4
-2
0
2014 2015 2016
Oil Prices to Balance Budget:Higher than Current prices
39
Fiscal break-even prices(US dollars per barrel)
Source: IMF.Note: Fiscal break-even price is the oil price that balances the budget.
0
50
100
150
Bah
rain
Alg
eria
Kaz
akh
stan
Om
an
Un
ited
Ara
bE
mir
ates
Sau
diA
rab
ia
Iran
Qat
ar
Ku
wai
t
2014 2015 2016 Oil price forecast (2016)

9/28/2016
20
An Umbrella of Growth Enhancing Policies: To Address Cyclical and Structural Challenges
What types of policies needed?
Effective; Efficient; Medium-Term fiscal plan
Credible; Price stability; Financial stability
Effective; Demand side implications; Supportive measures
Promotion of trade and financial integration; Supportive measures; Pooling resources for investment
Fiscal
Monetary
Structural
Global
40
Four Questions
1 What has been the role of supply?Looks like played a major role
2
3
What has been the role of demand?Somewhat smaller role but..
41
What has been the driving force behind the collapse in oil prices?Mostly supply…
4 What are the implications for commodity-exporters?Weak growth in commodity-exporters; stronger policy support needed…

9/28/2016
21
Questions & CommentsThanks!
M. Ayhan [email protected]
Development Prospects GroupWorld Bank Group
43


