
Korea Energy Economics Institute 1
The impact of oil price increase The impact of oil price increase
on the global economyon the global economy
Hyunjoon Chang

Korea Energy Economics Institute 2
The third oil shock?The third oil shock?

Korea Energy Economics Institute 3
Previous oil shocks’ featuresPrevious oil shocks’ features
Common features
1. When the world economy was expanding at a rapid rate
2. When the world’s crude oil capacity was being stretched to
the limit
3. When investment in oil and gas exploration had tapered off,
making it impossible to achieve a speedy increase in non-
OPEC output
Korea Energy Economics Institute 4
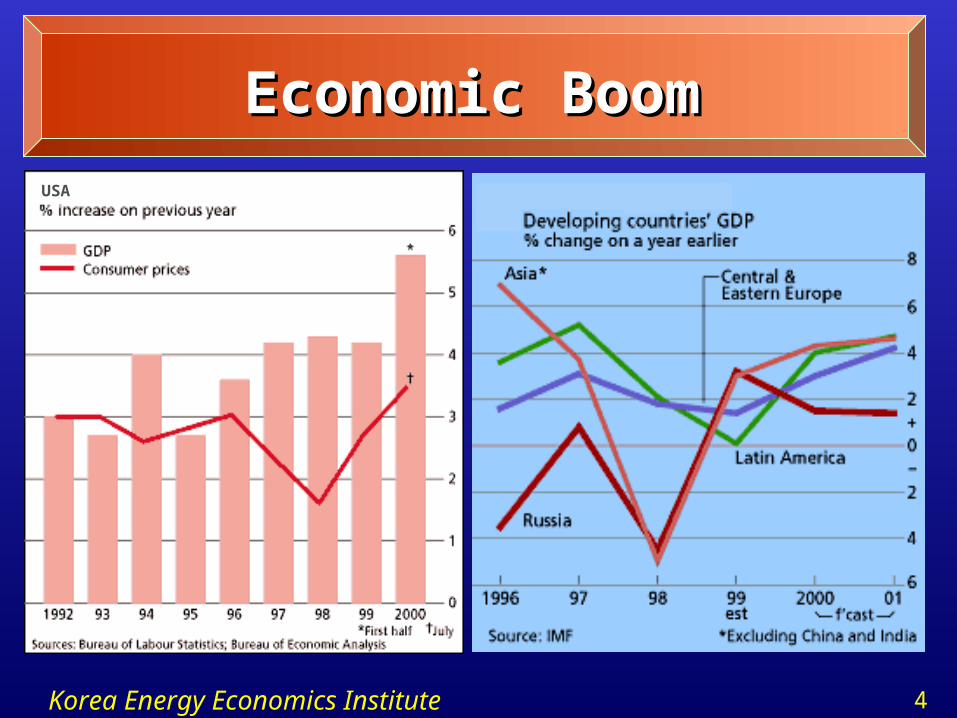
Economic BoomEconomic Boom
USA

Korea Energy Economics Institute 5
Commercial stock in OECDCommercial stock in OECD

Korea Energy Economics Institute 6
Investment expenditureInvestment expenditure
Korea Energy Economics Institute 7
Different impactDifferent impact
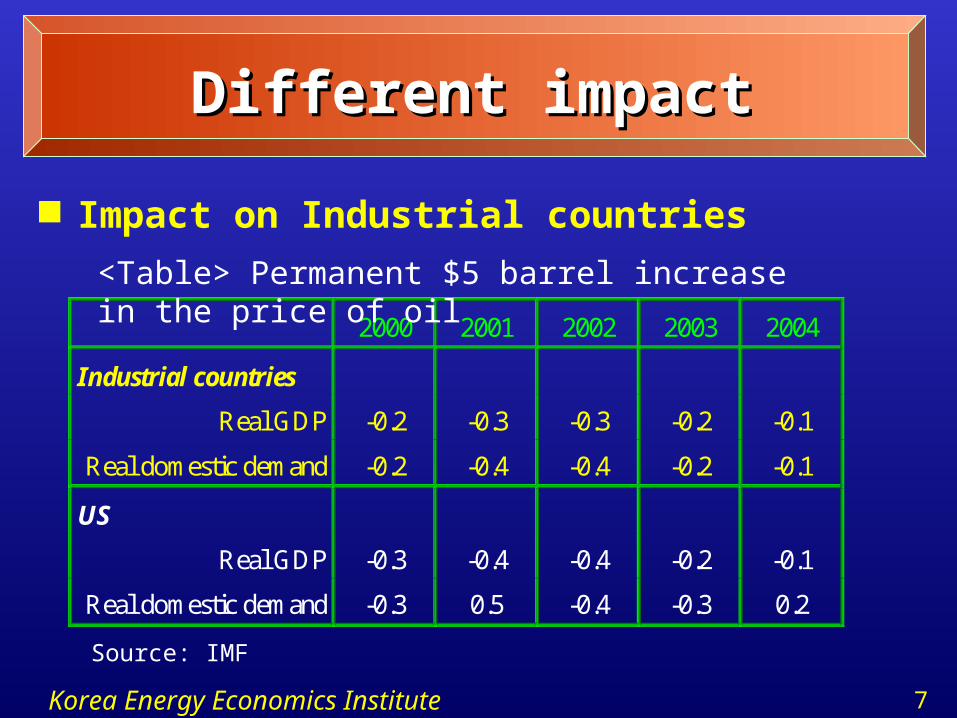
Impact on Industrial countries
2000 2001 2002 2003 2004
Industrial countries
Real GDP -0.2 -0.3 -0.3 -0.2 -0.1
Real domestic demand -0.2 -0.4 -0.4 -0.2 -0.1
US
Real GDP -0.3 -0.4 -0.4 -0.2 -0.1
Real domestic demand -0.3 0.5 -0.4 -0.3 0.2
<Table> Permanent $5 barrel increase in the price of oil
Source: IMF
Korea Energy Economics Institute 8
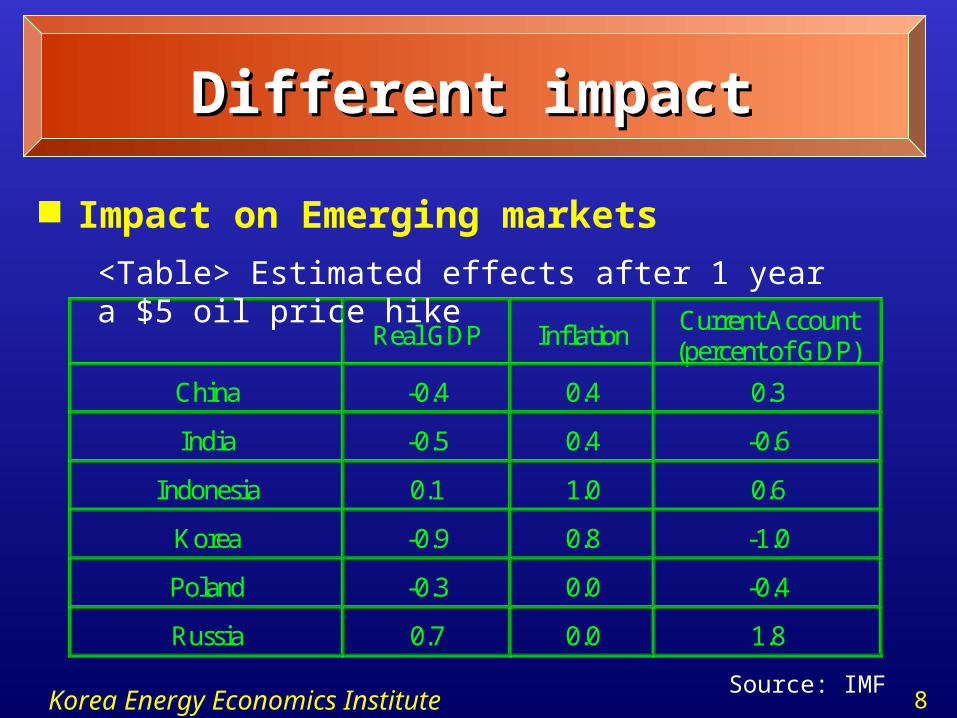
Different impactDifferent impact
Impact on Emerging markets
Real GDP InflationCurrent Account(percent of GDP)
China -0.4 0.4 0.3
India -0.5 0.4 -0.6
Indonesia 0.1 1.0 0.6
Korea -0.9 0.8 -1.0
Poland -0.3 0.0 -0.4
Russia 0.7 0.0 1.8
<Table> Estimated effects after 1 year a $5 oil price hike
Source: IMF

Korea Energy Economics Institute 9
Why different?Why different?
Energy Intensity
Source: OECD, Economic Outlook, no 68, Dec 2000

Korea Energy Economics Institute 10
Why different?Why different?
“New” Economy
High economic growth
Low growthin energy use
IT industries contributed 1/3 of real U.S. economic growth
(1995~1999)
Energy consumptionper dollar of GDP
fell by 4%(1997~1998)
New Economy

Korea Energy Economics Institute 11
Higher PriceHigher Price
Less higher PriceLess higher Price
Why different?Why different?
Competition– Rotemburg and Woodford(1996)
Under perfectUnder perfectCompetitionCompetition
Under imperfectUnder imperfectCompetitionCompetition
Oil price hike
cost
cost
margin
margin
PricePrice
cost marginNormal times

Korea Energy Economics Institute 12
Why different?Why different?
Oil to natural gas
Oil Gas
1980 1997 1980 1997
Low income 25.8 8.8 1.8 5.6
Excluding China & India 43.7 24.5 5.8 24.3
East Asia & Pacific 35.9 11.6 0.3 8.9
High Income 17.7 6.9 11.3 13.8
Europe EMU 22.9 8.8 10.0 11.9
Source: The World Bank(2000)
Korea Energy Economics Institute 13
Concluding remarksConcluding remarks
Developing countries’ limitation in impact mitigation
– Policy measures against oil price volatility
• Strategic oil stock
• Improve energy efficiency
– Developing countries’ constraint
• Difficulties in financial access
• Technological limitation
Need to cooperate with developed countries
Korea Energy Economics Institute 14
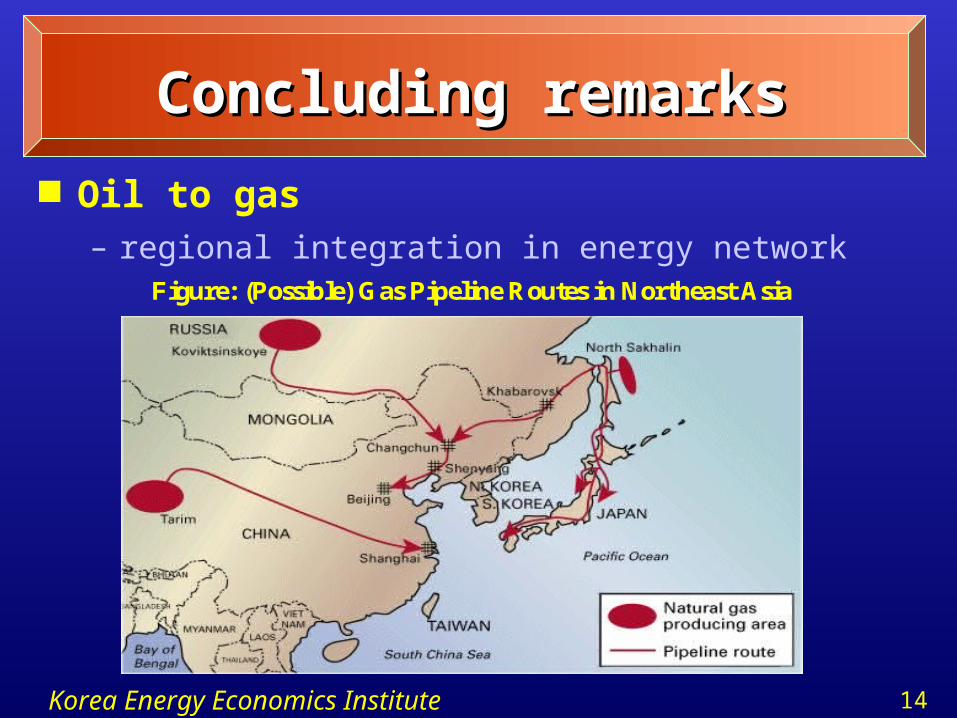
Concluding remarksConcluding remarks
Oil to gas– regional integration in energy network
Figure: (Possible) Gas Pipeline Routes in Northeast Asia


