
1
The Impact of Strengthened Basel III Banking Regulation on Lending Spreads:
Comparisons across Countries and Business Models
Sun Eae Chun*
Hoon Kim**
Wonhong Ko***
March 2012
Abstract: We estimate required increase in banks’ lending spreads assuming that
banks would raise lending spreads among the measures they could take to prevent ROE
from falling when the capital regulation is tightened following the estimation methodology
employed by King (2010) or Elliott (2010). Major factors affecting the lending spreads are
the ratio of RWA to total assets, the relative size of loan to total assets or the long term
interest rate on debt, ceteris paribus. The estimation results show that required lending
spreads vary greatly across the banks of various business models or country by country.
We find that the required lending spreads to keep ROE from falling vary from 0.1 basis
points for real estate & mortgage banks to 9.1 basis points for commercial banks over the
sample periods of 2005~2010 while it decreases after the 2007~2008 global financial
crisis. Countries such as Brazil, China, India, and Mexico require the banks to have large
lending spreads ranging from 13.2 basis points to 29.7 basis points. On the other hand,
countries such as Australia, Switzerland, Germany, Italy, and Netherland require them to
increase smaller lending spreads for the increase in the regulatory capital. Apart from the
capital regulation, we find that liquidity regulation (NSFR) increases lending rates by 20.0
basis points for the commercial banks of the sample countries.
Keywords: Basel Ⅲ, capital regulation, liquidity regulation, lending spreads
JEL Classification: G21; G28; E51
* Associate Professor, Graduate School of International Studies, Chung-Ang University, Seoul.
Email: [email protected]
** Head, Financial System Research Team, Bank of Korea. Email: [email protected]
*** Senior Economist, Bank of Korea. Email: [email protected]

2
I. Introduction
Since the excessive financial liberalization and the failures in financial regulation and supervision
have been cited as the root causes of the global financial crisis triggered by the U.S. subprime
mortgage crisis in 2007~2008, both scholars and practitioners have discussed consistently on the
necessity of financial regulatory reform. Against the backdrop the Basel Committee on Banking
Supervision (hereinafter referred to as BCBS) finally unveiled ‘Basel Ⅲ: A global regulatory
framework for more resilient banks and banking systems’ and ‘Basel Ⅲ: International framework for
liquidity risk measurement, standards and monitoring’ (hereinafter referred to as Basel Ⅲ) in
December 2010 in response to the requests of the G20.
Basel Ⅲ broadly consists of two parts; a micro-prudential and a macro-prudential regulatory
framework. The micro-prudential regulatory framework includes following measures; raising the
quality and quantity of the regulatory capital base, enhancing the risk coverage of the regulatory
capital base, introducing global liquidity standards and a leverage ratio regulation, and strengthening
supervision, risk management and disclosure. On the other hand, the macro-prudential regulatory
framework includes introducing countercyclical buffers and a leverage ratio regulation and
strengthening the regulation on systemically important banks.
They expect Basel Ⅲ would enhance the stability of the global banking system in the medium to
long term by providing banks incentives to build up of capital and liquidity base. At the same time
Basel Ⅲ would curb banks’ practices of taking excessive risk in various ways. Firstly it gives
incentive for banks to move from a business model of high risk and high return to a new one of low
risk and low return. Secondly investors and shareholders should bear a heavy burden of responsibility
before the injection of public funds by dint of the arrangements such as the write-off of regulatory
capital and the conversion into common stock.
The liquidity regulation would force banks to change the business behavior of borrowing low-cost
short-term funds and investing in long-term risky assets with high returns. The leverage ratio
regulation and countercyclical buffers would rein in banks’ excessive expansion and following
reduction in the asset size, and thereby moderate the fluctuation in the credit supply cycle.
The BCBS’s Quantitative Impact Study (hereinafter referred to as QIS, 2010) and macroeconomic
assessment results suggest that various measures proposed by Basel III could make both negative and
positive effects on the banking industry and macro economy. When banks would fulfill the Basel Ⅲ
requirements, they have to secure a huge stock of capital and liquidity in order to meet new
requirements. It could threaten the profitability of the banking industry by increasing the funding costs
in the short term. It may also hamper the financial intermediation function by raising lending rates and
reducing lending volumes, which could ultimately lead to slower economic growth. However, over

3
the medium to long term it could promote economic growth by lowering the costs of funding capital
and liquidity by reducing the chance of financial crises and enhancing the stability of banking industry
overall.
Strengthened capital requirements are usually expected to reduce the bank's ROE. To prevent ROE
from falling, banks can respond by taking various measures. Those measures include i) increase
lending spreads, ii) reduce operating expenses, iii) increase non-interest profit sources, iv) shift to
highly profitable business sector and v) cut the costs or vi) combination of multiple measures
simultaneously. Which method is favorable depends on the competitive environment surrounding
banks. If they recoup losses by increasing efficiency and cutting operating expenses, the negative
impacts from the strengthened capital requirements would be eased. On the other hand, banks might
have incentive to increase the riskiness of assets or to increase the risk exposures by expanding the
maturity mismatches.
In this paper we focus on the impact on the lending spreads when capital regulation is tightened. We
use the data of bank's balance sheet and income statement and follow the estimation methodology
employed by King (2010) and Elliott (2010). We conduct the analyses over different business models
and different countries separately, taking into account the fact that banks' response may differ by
business models and countries.
We assume that when capital regulation is strengthened by 1pp, the increase in equity is offset by
reduction in the long term liabilities since they are regarded as the most expensive form of funding
after equity. Even though the reduction in the long term debt leads to reduce the interest expenses and
thereby to increase net income, ROE in general would fall. It is because the relative increase in the
quantity of equity in the denominator is greater than the rise in net income in the numerator. The
required lending spreads to keep ROE from falling vary from by 0.1bp for real estate & mortgage
banks to 9.1bp for commercial banks over the entire sample periods.
As capital regulation is strengthened by 1pp incrementally, the lending spreads increases linearly. If
the reduction in the ROE is tolerated, the required increase of lending spread falls. In general, it is
found that required lending spreads decreases after the financial crisis. The magnitude of required
increase in lending spreads is comparable to those in King (2010), Elliott (2010) or Kashyap et. al.
(2010) even though estimation methodology employed by Kashyap et. al. is quite different from those
of King, Elliott or this study.
The increase in lending spreads is sensitive to the ratio of risk-weighted assets and loans to total
assets. The ratio of risk-weight assets to the total assets determines the amount of equity to be raised
in order to satisfy the capital regulation, thereby determining the amount of long term debt reduced
which affects the net income of the banks. If the loans to total assets ratio is bigger, the required
4
lending spreads would be smaller since the slight increase in the lending spreads would compensate
the decline in the net income. Since reduction in the interest expenses resulting from increased capital
depends on the funding costs, long term rate of the debt also affects the magnitude of the lending
spreads. Countries and banks engaged in the different business models exhibit quite different ratio of
these variables and this contributes to the different effect of capital regulation on the lending rates.
The impact of liquidity requirements on lending spreads reveals to be around 20.03 bp when the
analysis is conducted on the aggregate data of commercial banks in the sample countries.
The paper is organized as follows. After this introduction, Chapter Ⅱ describes the details of Basel
Ⅲ. Chapter Ⅲ reviews the literature on the impact of Basel III on lending spreads. Chapter Ⅳ
presents the results of empirical analysis, and Chapter V concludes.
Ⅱ. Basel Ⅲ
1. Tightening of capital regulation
BCBS released ‘Basel Ⅲ : A global regulatory framework for more resilient banks and banking
systems’ and ‘Basel Ⅲ : International framework for liquidity risk measurement, standards and
monitoring’ in December 2010. The major objective of the Basel Ⅲ capital framework is to raise the
quantity and quality of the regulatory capital. To improve market discipline it requires to heighten the
transparency of the capital base by disclosing all elements of capital along with a detailed
reconciliation to the reported accounts.
It requires to simplify the capital structure by changing the capital classification from the current six
levels to three levels and by eliminating Tier 3 capital. Total regulatory capital is divided into Tier 1
capital showing loss absorbency on a going concern basis, and Tier 2 capital showing loss absorbency
on a gone concern basis. In order to improve the quality of capital, bank’s own capital (Tier 1+Tier 2)
has to exceed 8.0% of its risk-weighted assets, while its Tier 1 capital must exceed 6% of its risk-
weighted assets. In addition, it requires banks have to hold at least 4.5% of Common Equity Tier 1 to
their risk-weighted assets.1
1 The current minimum capital ratios are that Common Equity Tier 1 ratio is 2%, Tier1 ratio is 4%, and total capital ratio is
8%. Although the total capital ratio remains unchanged, it is actually a tighter standard taking into account the tightened
Basel Ⅲ capital requirements.

5
<Table 1> BCBS capital requirements
(current) 6 notches (revised) 3 notches
Tier 1
Common equity capital
non-innovative hybrid bonds1)
innovative hybrid bonds
Tier 1
Common equity capital
(core Tier 1 capital) 4.5%
Additional
going concern capital 6.0%
Tier 2 Non-innovative subordinate bonds
2)
innovative subordinate bonds2)
Tier 2
8.0%
Tier 3 Short-term subordinate debt
Notes:
1) Hybrid bonds: no step-up clauses for non-innovative bonds; step-up clauses for innovative bonds
2) Innovative subordinate bonds: 10-year maturity or longer for non-innovative bonds; 5-year maturity or
longer for innovative bonds
2. Reducing procyclicality of regulatory capital requirements
The recent global financial crisis highlighted the issue of procyclicality inherent in the financial
system. Banks are caught in a vicious cycle where, with risk weights adjusted in accordance with
borrowers’ credit ratings under Basel II, banks’ asset size accelerates to grow driven by banks’
improved asset soundness in upturn of the business cycle, while banks sell their assets competitively
to deleverage in downturn. Capital buffer and dynamic provisioning have been proposed to resolve
the procyclicality problems. The measures propose to build up capital buffers and to prepare dynamic
provisions in boom times, and to use them in times of recession.
Capital buffers consist of capital conservation buffer and countercyclical buffer. For capital
conservation buffer, 2.5% of risk-weighted assets is reserved in Common Equity Tier 1 in normal
times and drawn down in the periods of stress when losses occur. If the reserved capital fails to reach
the target level (2.5%), constraints on distribution get triggered. Apart from capital conservation
buffer, countercyclical buffer is introduced to protect the banking sector from future potential losses
in periods when excessively expanded credit is measured likely to cause systemic risk.2 The amount
to be accumulated for countercyclical capital buffer is determined within the range of 0%~2.5%.3 As
2 Since counter-cyclical buffers are accumulated in times of excessive credit expansion, such times are expected to occur
less often. Meanwhile, banks with credit exposures to various countries are highly likely to have to save capital buffers more
often, although in less sizeable amounts, since international credit cycles do not always have strong correlations.
3 Banks are given 12 months to accumulate their counter-cyclical buffers, and during this period constraints on distribution
are not triggered. If the regulatory authorities ease regulations within these 12 months, however, the constraints are
immediately triggered. This is to prevent the risk of restriction of credit supply through the capital subject to regulation.

6
a result, the capital requirement ratios are accordingly strengthened; banks’ common equity Tier 1
ratio is set at 7~9.5%, their Tier 1 ratio at 8.5~11%, and their total equity capital ratio at 10.5~13%.
<Table 2> Regulatory capital requirement ratios
Common Equity Tier 1 Tier 1 Total capital
Minimum requirements (A) 4.5% 6.0% 8.0%
Capital conservation
buffer (B) 2.5%
A+B 7.0% 8.5% 10.5%
Countercyclical buffer 0.0~2.5%
Total 7.0~9.5% 8.5~11% 10.5~13.0%
3. Introduction of leverage ratio and liquidity standard
The BCBS has introduced leverage ratio, which limits the volume of bank’s total exposure to
regulatory capital. The leverage ratio is adopted in an effort to complement the existing risk-based
capital regulations and to prevent excessive leverage accumulation. The ratio is set at 3% or higher of
Tier 1 capital. Unlike the regulatory capital ratio, which applies different risk weights depending upon
borrower’s credit rating, the leverage ratio is the ratio of capital to total nominal assets including off-
balance sheet exposure.
The BCBS has also introduced global liquidity standard for the purpose of enhancing the
international consistency of liquidity risk management and raising the resilience of banks in times of
liquidity crisis. The standard includes Liquidity Coverage Ratio (LCR)4, a short-term indicator, and
Net Stable Funding Ratio (NSFR)5, a long-term one. The LCR requires banks to set aside substantial
high-quality liquid assets that can be easily converted into cash to cover total net cash outflows over
the next 30 calendar days, the minimum period during which banks and supervisory authorities can
take appropriate measures or banks can be resolved in times of serious crisis. The NSFR copes with a
situation in which an individual bank faces a crisis for a year and comes to have difficulty in raising
funds. It requires banks to set aside ample amounts of stable funds to overcome such a situation.
4 The formula is “LCR = (stock of high-quality liquid assets/total net cash outflows over 30 calendar days)≥ 100%".
5 The formula is "NSFR = (available amount of stable funding/required amount of stable funding)≥ 100%".
7
Ⅲ. Literature review
1. QIS results
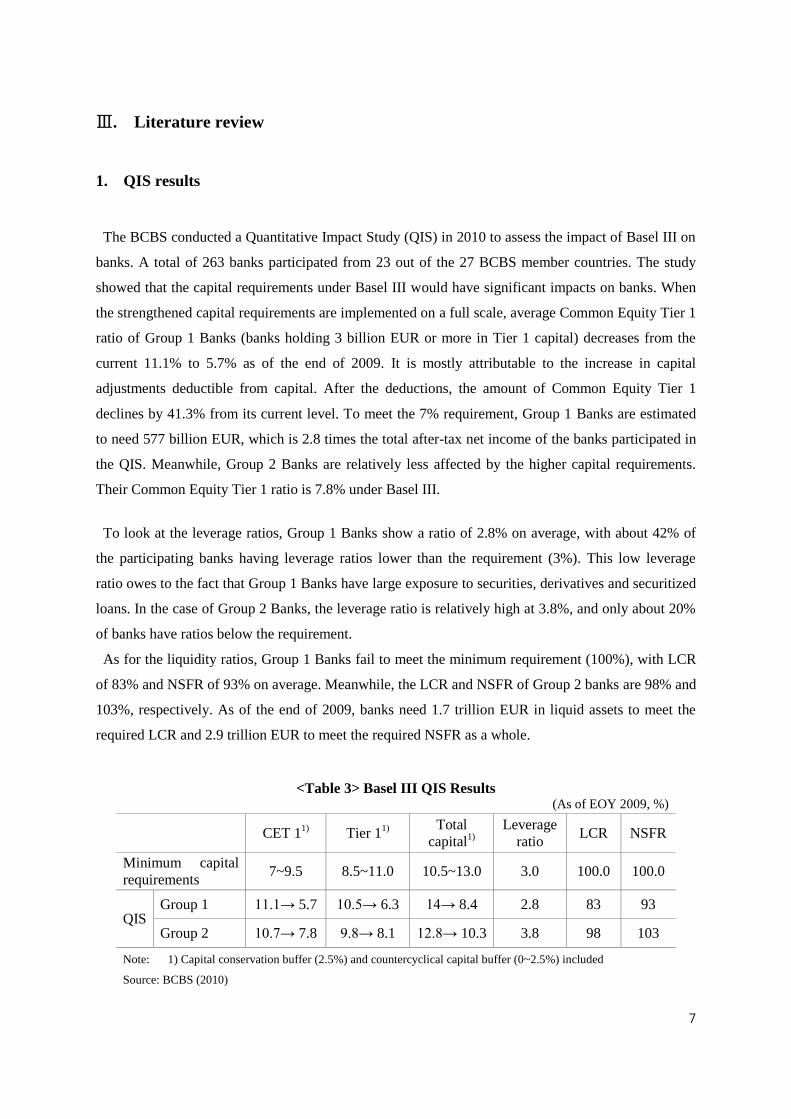
The BCBS conducted a Quantitative Impact Study (QIS) in 2010 to assess the impact of Basel III on
banks. A total of 263 banks participated from 23 out of the 27 BCBS member countries. The study
showed that the capital requirements under Basel III would have significant impacts on banks. When
the strengthened capital requirements are implemented on a full scale, average Common Equity Tier 1
ratio of Group 1 Banks (banks holding 3 billion EUR or more in Tier 1 capital) decreases from the
current 11.1% to 5.7% as of the end of 2009. It is mostly attributable to the increase in capital
adjustments deductible from capital. After the deductions, the amount of Common Equity Tier 1
declines by 41.3% from its current level. To meet the 7% requirement, Group 1 Banks are estimated
to need 577 billion EUR, which is 2.8 times the total after-tax net income of the banks participated in
the QIS. Meanwhile, Group 2 Banks are relatively less affected by the higher capital requirements.
Their Common Equity Tier 1 ratio is 7.8% under Basel III.
To look at the leverage ratios, Group 1 Banks show a ratio of 2.8% on average, with about 42% of
the participating banks having leverage ratios lower than the requirement (3%). This low leverage
ratio owes to the fact that Group 1 Banks have large exposure to securities, derivatives and securitized
loans. In the case of Group 2 Banks, the leverage ratio is relatively high at 3.8%, and only about 20%
of banks have ratios below the requirement.
As for the liquidity ratios, Group 1 Banks fail to meet the minimum requirement (100%), with LCR
of 83% and NSFR of 93% on average. Meanwhile, the LCR and NSFR of Group 2 banks are 98% and
103%, respectively. As of the end of 2009, banks need 1.7 trillion EUR in liquid assets to meet the
required LCR and 2.9 trillion EUR to meet the required NSFR as a whole.
<Table 3> Basel III QIS Results
(As of EOY 2009, %)
CET 1
1) Tier 1
1)
Total
capital1)
Leverage
ratio LCR NSFR
Minimum capital
requirements 7~9.5 8.5~11.0 10.5~13.0 3.0 100.0 100.0
QIS Group 1 11.1→ 5.7 10.5→ 6.3 14→ 8.4 2.8 83 93
Group 2 10.7→ 7.8 9.8→ 8.1 12.8→ 10.3 3.8 98 103
Note: 1) Capital conservation buffer (2.5%) and countercyclical capital buffer (0~2.5%) included
Source: BCBS (2010)

8
2. Literature review
Strengthened regulation on banks may increase funding costs in the private sector, and reduces credit
availability, affecting the real economy. If regulation is tightened, the profitability of banks decreases
in response to the increasing cost of funding and the expansion of investment in low yielding assets.
Banks would pass on these costs to the private sector through an increase in lending interest rate,
worsening funding condition in the private sector. <Figure 1> shows the channels through which
regulatory reform may influence the real sector through the change of banks’ behavior and strategies.
<Figure 1> Channels through which regulatory reform influences the real sector
Bank
funding cost
and behavior
Regulatory
reform
Asset
allocation
Private sector
funding
conditions and
credit availability
Real sector
Business
model
Studies on the effects of tightened regulation of the banking sector have focused on microeconomic
aspects including banks’ operational behaviors and changes in lending spreads. First of all,
strengthening of regulation directly brings about changes in banks’ operational behavior. Barrel et al.
(2011) demonstrated in their study of 713 banks in OECD countries (from 1993 to 2007) that when
the equity capital ratio is adjusted upward, banks’ tendency to avoid risks increases not only before
the change but also after it takes place. Cosimano and Dalia (2011) showed in their analysis of 100
international large banks using the GMM methodology that the impact of stricter capital regulation
varies greatly across countries, depending upon the increase in capital cost and the resilience of credit
demand to the change in lending rates.
Three recent papers have looked at the loan pricing implications of the proposed higher capital
requirements under Basel III. Elliott (2010) provides an accounting-based analysis of how much the
interest rate charged on loans will likely increase if US banks are required to hold more equity. Elliott
calculates that if the ratio of common equity required for a given loan is raised by 2% and no other
adjustments are made, banks would need to raise lending spreads by 39 basis point to maintain a
target ROE of 15%. Elliott claims that the effects of strengthened regulation differs depending upon
9
asset size, region and business models, but that the impacts in terms of lending rate increase and credit
supply capacity reduction are not great since banks progressively expand their capital and internal
reserves to meet the requirements.
Kashyap et al. (2011) considers the question of the phasing-in of “substantially heightened” capital
requirements. They also highlight the unintended consequences if the regulation is only applied to
banks and not to the shadow-banking sector. Assuming the cost of long-term debt is 7% and the
corporate tax rate is 35%, their baseline estimate is that an increase in capital-to-total assets by 1pp
would raise the weighted average cost of capital by 2.5bp(=75×35%). King (2010) calculates that the
higher cost associated with a one percentage point increase in the capital ratio can be recovered by
increasing lending spreads by 15bp for a representative bank. This calculation assumes the return on
equity (ROE) and the cost of debt are unchanged, with no change in other sources of income and no
reduction in operating expenses. King also conducts calibration in order to conclude that bank would
need to increase lending spreads by 24bp in order to meet the target Net Stable Funding Ratio (NSFR).
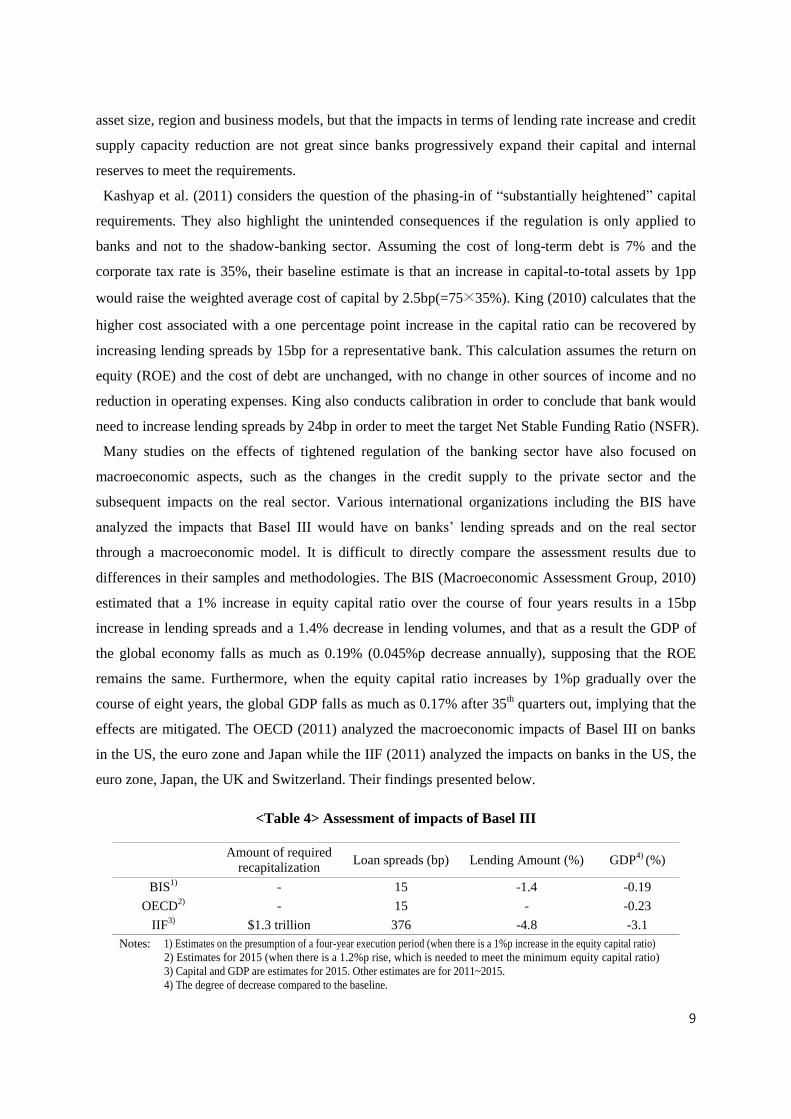
Many studies on the effects of tightened regulation of the banking sector have also focused on
macroeconomic aspects, such as the changes in the credit supply to the private sector and the
subsequent impacts on the real sector. Various international organizations including the BIS have
analyzed the impacts that Basel III would have on banks’ lending spreads and on the real sector
through a macroeconomic model. It is difficult to directly compare the assessment results due to
differences in their samples and methodologies. The BIS (Macroeconomic Assessment Group, 2010)
estimated that a 1% increase in equity capital ratio over the course of four years results in a 15bp
increase in lending spreads and a 1.4% decrease in lending volumes, and that as a result the GDP of
the global economy falls as much as 0.19% (0.045%p decrease annually), supposing that the ROE
remains the same. Furthermore, when the equity capital ratio increases by 1%p gradually over the
course of eight years, the global GDP falls as much as 0.17% after 35th quarters out, implying that the
effects are mitigated. The OECD (2011) analyzed the macroeconomic impacts of Basel III on banks
in the US, the euro zone and Japan while the IIF (2011) analyzed the impacts on banks in the US, the
euro zone, Japan, the UK and Switzerland. Their findings presented below.
<Table 4> Assessment of impacts of Basel III
Amount of required
recapitalization Loan spreads (bp) Lending Amount (%) GDP
4) (%)
BIS1)
- 15 -1.4 -0.19
OECD2)
- 15 - -0.23
IIF3)
$1.3 trillion 376 -4.8 -3.1
Notes: 1) Estimates on the presumption of a four-year execution period (when there is a 1%p increase in the equity capital ratio)
2) Estimates for 2015 (when there is a 1.2%p rise, which is needed to meet the minimum equity capital ratio)
3) Capital and GDP are estimates for 2015. Other estimates are for 2011~2015.
4) The degree of decrease compared to the baseline.
10
IV. Empirical Estimation Results
1. Data and descriptive statistics
In order to analyze the impact of the tightened capital regulation on lending spreads, we select banks
from 16 countries of developed and emerging economies and use their consolidated income statement
and balance sheet data over the sample period of 2005~2010 . Data are downloaded from Bankscope
data base. When we choose the banks of asset size bigger than $10 billion with no missing values in
the period, total of 670 banks are selected.
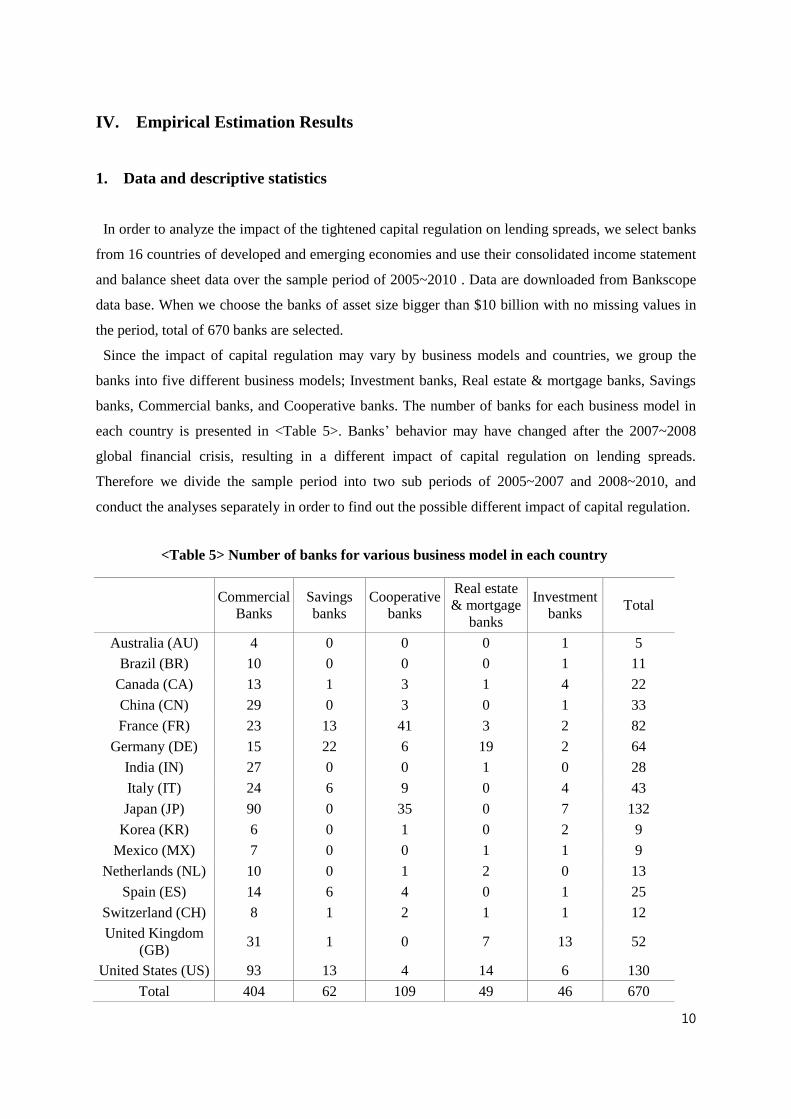
Since the impact of capital regulation may vary by business models and countries, we group the
banks into five different business models; Investment banks, Real estate & mortgage banks, Savings
banks, Commercial banks, and Cooperative banks. The number of banks for each business model in
each country is presented in <Table 5>. Banks’ behavior may have changed after the 2007~2008
global financial crisis, resulting in a different impact of capital regulation on lending spreads.
Therefore we divide the sample period into two sub periods of 2005~2007 and 2008~2010, and
conduct the analyses separately in order to find out the possible different impact of capital regulation.
<Table 5> Number of banks for various business model in each country
Commercial
Banks
Savings
banks
Cooperative
banks
Real estate
& mortgage
banks
Investment
banks Total
Australia (AU) 4 0 0 0 1 5
Brazil (BR) 10 0 0 0 1 11
Canada (CA) 13 1 3 1 4 22
China (CN) 29 0 3 0 1 33
France (FR) 23 13 41 3 2 82
Germany (DE) 15 22 6 19 2 64
India (IN) 27 0 0 1 0 28
Italy (IT) 24 6 9 0 4 43
Japan (JP) 90 0 35 0 7 132
Korea (KR) 6 0 1 0 2 9
Mexico (MX) 7 0 0 1 1 9
Netherlands (NL) 10 0 1 2 0 13
Spain (ES) 14 6 4 0 1 25
Switzerland (CH) 8 1 2 1 1 12
United Kingdom
(GB) 31 1 0 7 13 52
United States (US) 93 13 4 14 6 130
Total 404 62 109 49 46 670
11
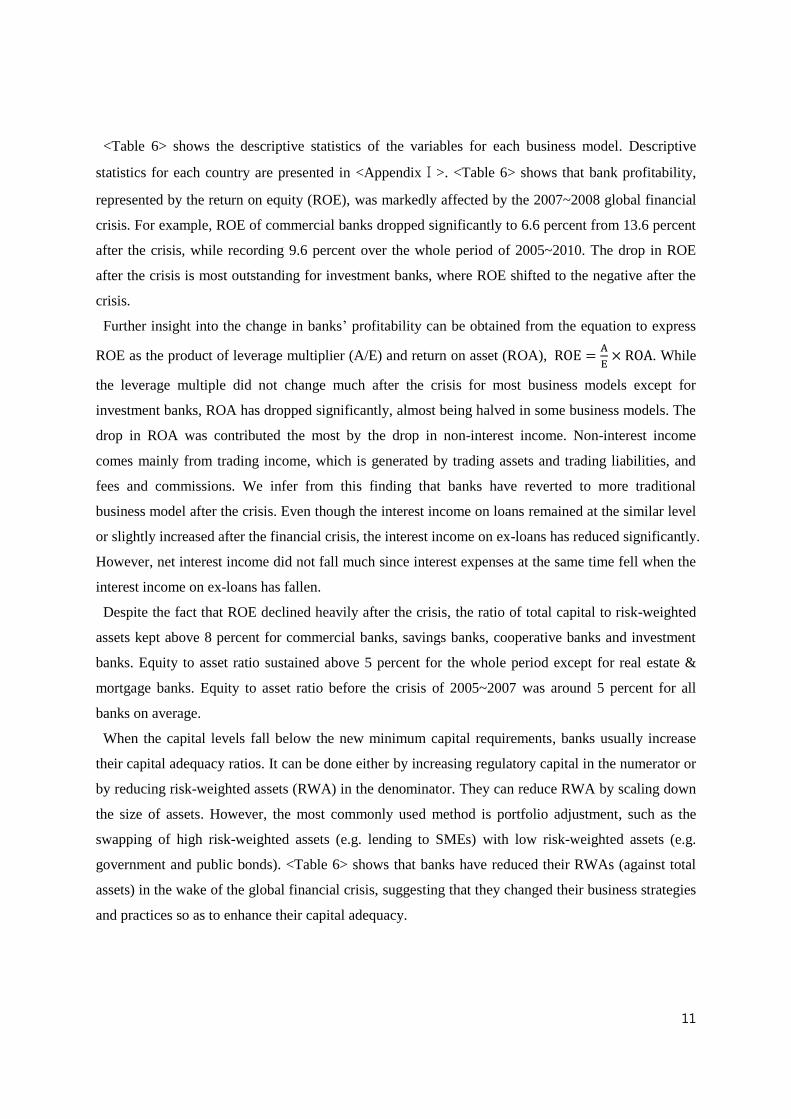
<Table 6> shows the descriptive statistics of the variables for each business model. Descriptive
statistics for each country are presented in <AppendixⅠ>. <Table 6> shows that bank profitability,
represented by the return on equity (ROE), was markedly affected by the 2007~2008 global financial
crisis. For example, ROE of commercial banks dropped significantly to 6.6 percent from 13.6 percent
after the crisis, while recording 9.6 percent over the whole period of 2005~2010. The drop in ROE
after the crisis is most outstanding for investment banks, where ROE shifted to the negative after the
crisis.
Further insight into the change in banks’ profitability can be obtained from the equation to express
ROE as the product of leverage multiplier (A/E) and return on asset (ROA),
. While
the leverage multiple did not change much after the crisis for most business models except for
investment banks, ROA has dropped significantly, almost being halved in some business models. The
drop in ROA was contributed the most by the drop in non-interest income. Non-interest income
comes mainly from trading income, which is generated by trading assets and trading liabilities, and
fees and commissions. We infer from this finding that banks have reverted to more traditional
business model after the crisis. Even though the interest income on loans remained at the similar level
or slightly increased after the financial crisis, the interest income on ex-loans has reduced significantly.
However, net interest income did not fall much since interest expenses at the same time fell when the
interest income on ex-loans has fallen.
Despite the fact that ROE declined heavily after the crisis, the ratio of total capital to risk-weighted
assets kept above 8 percent for commercial banks, savings banks, cooperative banks and investment
banks. Equity to asset ratio sustained above 5 percent for the whole period except for real estate &
mortgage banks. Equity to asset ratio before the crisis of 2005~2007 was around 5 percent for all
banks on average.
When the capital levels fall below the new minimum capital requirements, banks usually increase
their capital adequacy ratios. It can be done either by increasing regulatory capital in the numerator or
by reducing risk-weighted assets (RWA) in the denominator. They can reduce RWA by scaling down
the size of assets. However, the most commonly used method is portfolio adjustment, such as the
swapping of high risk-weighted assets (e.g. lending to SMEs) with low risk-weighted assets (e.g.
government and public bonds). <Table 6> shows that banks have reduced their RWAs (against total
assets) in the wake of the global financial crisis, suggesting that they changed their business strategies
and practices so as to enhance their capital adequacy.

12
<Table 6> Descriptive statistics (As percentage of total assets, %)
2005∼2010 2005∼2007 2008∼2010
All banks
Interest income on loans 1.8 1.6 1.9
Interest income on ex loans 1.6 2.1 1.2
Interest expenses 2.0 2.4 1.7
Net interest income 1.4 1.3 1.4
Non interest income 0.6 1.0 0.4
ROA 0.4 0.6 0.3
ROE 8.5 12.3 5.7
Leverage multiple 19.7 20.1 19.3
Equity-asset ratio 5.1 5.0 5.2
Total capital/RWA 12.0 10.7 13.3
RWA/total assets 47.2 48.4 46.1
Net loans, leases and mortgages 46.0 46.0 46.1
Commercial banks
Interest income on loans 1.8 1.6 2.0
Interest income on ex loans 1.5 2.0 1.2
Interest expenses 1.9 2.2 1.7
Net interest income 1.5 1.4 1.5
Non interest income 0.6 1.0 0.3
ROA 0.5 0.7 0.3
ROE 9.6 13.6 6.6
Leverage multiple 20.0 20.5 19.6
Equity-asset ratio 5.0 4.9 5.1
Total capital/RWA 12.1 10.8 13.4
RWA/total assets 47.5 48.3 46.8
Net loans, leases and mortgages 46.5 46.5 46.5
Savings banks
Interest income on loans 2.7 2.4 2.9
Interest income on ex loans 1.5 1.9 1.2
Interest expenses 2.3 2.4 2.2
Net interest income 1.9 1.9 1.9
Non interest income 0.7 0.9 0.5
ROA 0.5 0.7 0.4
ROE 7.1 10.2 4.8
Leverage multiple 13.5 13.7 13.4
Equity-asset ratio 7.4 7.3 7.5
Total capital/RWA 14.1 13.5 14.6
RWA/total assets 62.6 68.4 56.8
Net loans, leases and mortgages 60.9 61.0 60.8
Cooperative banks
Interest income on loans 1.8 1.6 1.9
Interest income on ex loans 1.4 1.9 1.0
Interest expenses 2.1 2.5 1.7
Net interest income 1.1 1.1 1.2
Non interest income 0.4 0.6 0.2
ROA 0.3 0.5 0.2
ROE 6.8 9.4 4.7
Leverage multiple 19.9 19.2 20.5
Equity-asset ratio 5.0 5.2 4.9
Total capital/RWA 11.7 10.6 12.9
RWA/total assets 44.6 48.7 40.5
Net loans, leases and mortgages 44.2 42.9 45.2

13
2005∼2010 2005∼2007 2008∼2010
Real estate &
mortgage banks
Interest income on loans 2.0 2.0 2.0
Interest income on ex loans 2.2 2.9 1.5
Interest expenses 3.6 4.3 3.0
Net interest income 0.5 0.5 0.5
Non interest income 0.1 0.1 0.0
ROA 0.2 0.2 0.1
ROE 4.8 6.5 3.1
Leverage multiple 27.9 27.2 28.6
Equity-asset ratio 3.6 3.7 3.5
Total capital/RWA 8.1 7.4 8.7
RWA/total assets 33.8 37.7 29.9
Net loans, leases and mortgages 65.5 68.8 62.3
Investment banks
Interest income on loans 0.3 0.3 0.3
Interest income on ex loans 2.4 2.8 2.0
Interest expenses 2.1 2.6 1.6
Net interest income 0.6 0.6 0.7
Non interest income 1.6 2.1 1.1
ROA 0.2 0.5 -0.1
ROE 2.9 8.1 -1.1
Leverage multiple 13.9 15.5 12.7
Equity-asset ratio 7.2 6.5 7.9
Total capital/RWA 9.7 8.8 10.6
RWA/total assets 46.4 49.8 42.9
Net loans, leases and mortgages 18.4 17.0 19.8
Source: Bankscope, authors’ calculations
14
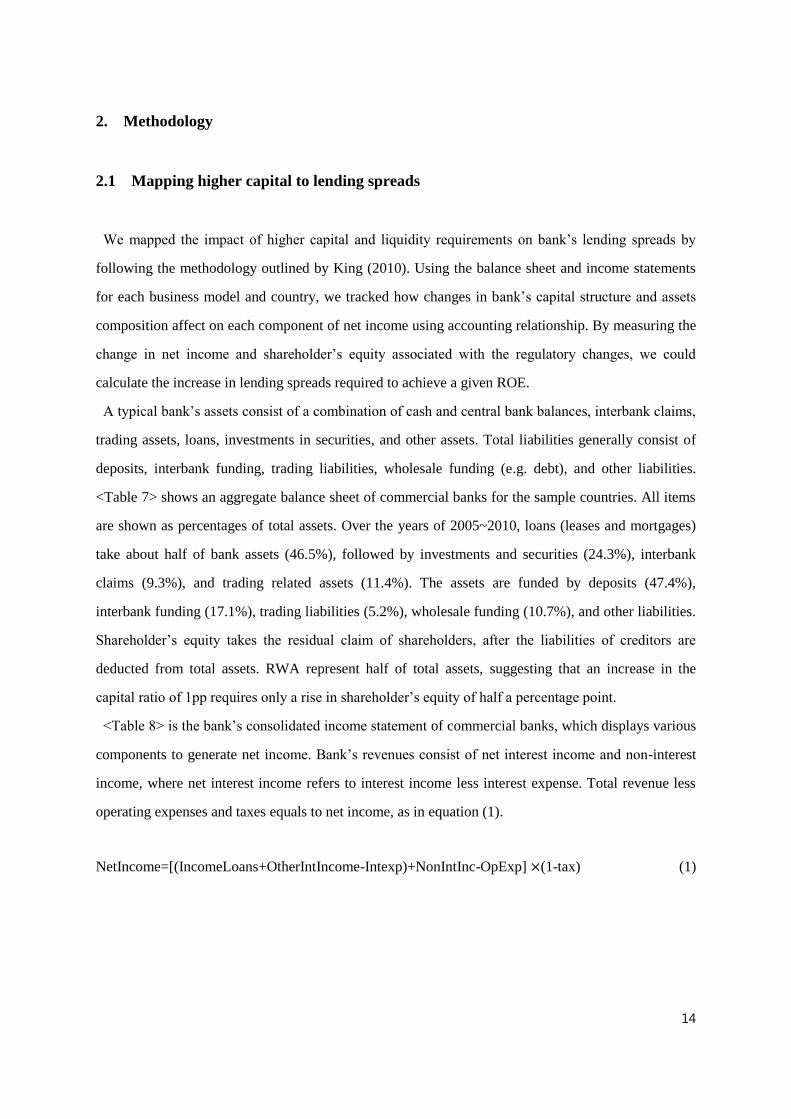
2. Methodology
2.1 Mapping higher capital to lending spreads
We mapped the impact of higher capital and liquidity requirements on bank’s lending spreads by
following the methodology outlined by King (2010). Using the balance sheet and income statements
for each business model and country, we tracked how changes in bank’s capital structure and assets
composition affect on each component of net income using accounting relationship. By measuring the
change in net income and shareholder’s equity associated with the regulatory changes, we could
calculate the increase in lending spreads required to achieve a given ROE.
A typical bank’s assets consist of a combination of cash and central bank balances, interbank claims,
trading assets, loans, investments in securities, and other assets. Total liabilities generally consist of
deposits, interbank funding, trading liabilities, wholesale funding (e.g. debt), and other liabilities.
<Table 7> shows an aggregate balance sheet of commercial banks for the sample countries. All items
are shown as percentages of total assets. Over the years of 2005~2010, loans (leases and mortgages)
take about half of bank assets (46.5%), followed by investments and securities (24.3%), interbank
claims (9.3%), and trading related assets (11.4%). The assets are funded by deposits (47.4%),
interbank funding (17.1%), trading liabilities (5.2%), wholesale funding (10.7%), and other liabilities.
Shareholder’s equity takes the residual claim of shareholders, after the liabilities of creditors are
deducted from total assets. RWA represent half of total assets, suggesting that an increase in the
capital ratio of 1pp requires only a rise in shareholder’s equity of half a percentage point.
<Table 8> is the bank’s consolidated income statement of commercial banks, which displays various
components to generate net income. Bank’s revenues consist of net interest income and non-interest
income, where net interest income refers to interest income less interest expense. Total revenue less
operating expenses and taxes equals to net income, as in equation (1).
NetIncome=[(IncomeLoans+OtherIntIncome-Intexp)+NonIntInc-OpExp] (1-tax) (1)

15
<Table 7> Aggregated balance sheet of commercial banks (As percentage of total assets)
2005∼2010 2005∼2007 2008∼2010
Cash and balance at CB 2.3 1.8 2.7
Interbank claims 9.3 10.4 8.5
Trading-related assets 11.4 13.8 9.6
Net loans, leases and mortgages 46.5 46.5 46.5
Investments and securities 24.3 21.1 26.7
Other assets 6.2 6.4 6.0
Total assets 100.0 100.0 100.0
Deposits (retail, corporate) 47.4 46.5 48.0
Interbank funding 17.1 17.9 16.4
Trading-related liabilities 5.2 5.4 5.1
Wholesale funding 10.7 12.2 9.6
Other liabilities 14.7 13.1 15.9
Total liabilities 95.0 95.1 94.9
Total shareholders' equity 5.0 4.9 5.1
Total liab. & stockholders' equity 100.0 100.0 100.0
Leverage multiple 20.0 20.5 19.6
RWA/total assets 47.5 48.3 46.8
Total capital/RWA 12.1 10.8 13.4
Source: Bankscope, authors’ calculations
<Table 8> Aggregated income statement of commercial banks (As percentage of total assets)
2005∼2010 2005∼2007 2008∼2010
Interest income on loans 1.8 1.6 2.0
Interest income ex loans 1.6 2.0 1.2
Interest income 3.4 3.6 3.2
Interest expense 1.9 2.2 1.7
A. Net interest income 1.5 1.4 1.6
Trading income 0.1 0.2 0.1
non-interest income ex trad. 0.5 0.8 0.3
B. Non-interest income 0.6 1.0 0.4
C. Total revenues 2.1 2.4 1.9
Personnel expenses 0.7 0.7 0.7
Other adm. expenses 0.8 0.8 0.8
D. Total operating expenses 1.5 1.5 1.5
E. Operating profit 0.6 0.9 0.4
F. Income tax provision 0.2 0.3 0.1
G. Net income (return on assets) 0.5 0.7 0.3
Return on equity (ROE, %) 9.6 13.6 6.6
Average effective tax rate (%) 29.9 30.4 29.0
Source: Bankscope, authors’ calculations
16
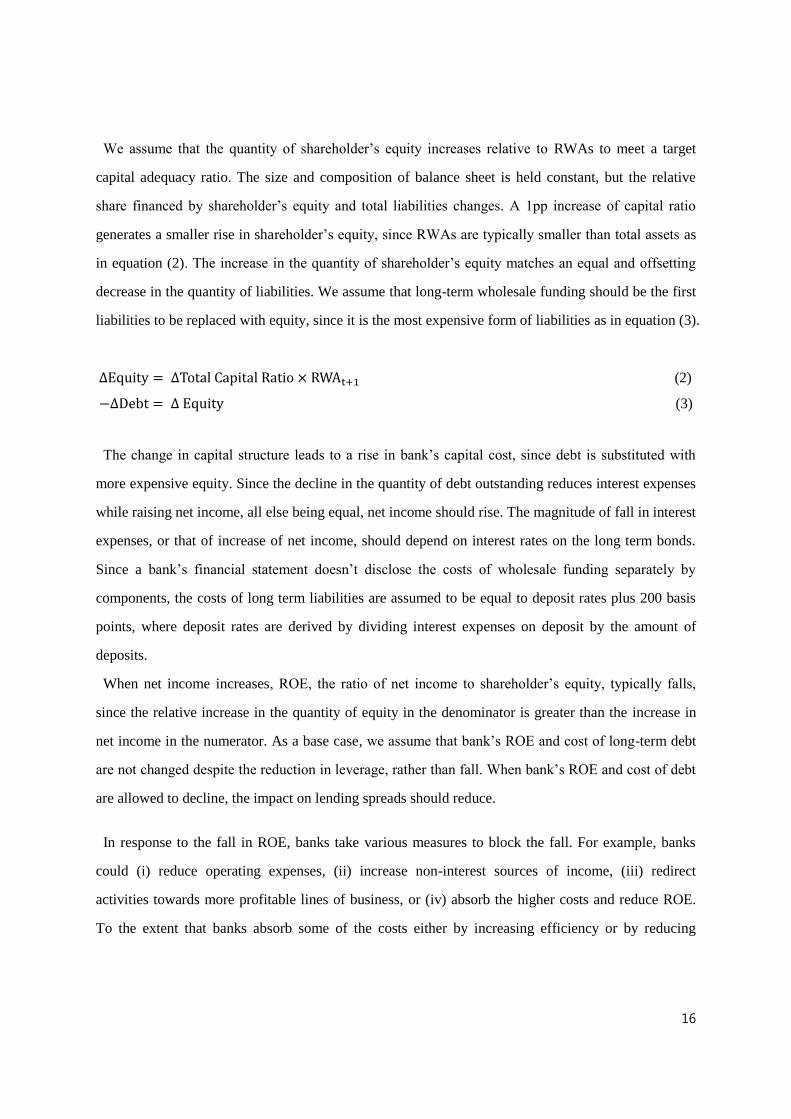
We assume that the quantity of shareholder’s equity increases relative to RWAs to meet a target
capital adequacy ratio. The size and composition of balance sheet is held constant, but the relative
share financed by shareholder’s equity and total liabilities changes. A 1pp increase of capital ratio
generates a smaller rise in shareholder’s equity, since RWAs are typically smaller than total assets as
in equation (2). The increase in the quantity of shareholder’s equity matches an equal and offsetting
decrease in the quantity of liabilities. We assume that long-term wholesale funding should be the first
liabilities to be replaced with equity, since it is the most expensive form of liabilities as in equation (3).
∆ quity ∆Total Capital atio W t+1 (2)
−∆Debt ∆ quity (3)
The change in capital structure leads to a rise in bank’s capital cost, since debt is substituted with
more expensive equity. Since the decline in the quantity of debt outstanding reduces interest expenses
while raising net income, all else being equal, net income should rise. The magnitude of fall in interest
expenses, or that of increase of net income, should depend on interest rates on the long term bonds.
Since a bank’s financial statement doesn’t disclose the costs of wholesale funding separately by
components, the costs of long term liabilities are assumed to be equal to deposit rates plus 200 basis
points, where deposit rates are derived by dividing interest expenses on deposit by the amount of
deposits.
When net income increases, ROE, the ratio of net income to shareholder’s equity, typically falls,
since the relative increase in the quantity of equity in the denominator is greater than the increase in
net income in the numerator. As a base case, we assume that bank’s ROE and cost of long-term debt
are not changed despite the reduction in leverage, rather than fall. When bank’s ROE and cost of debt
are allowed to decline, the impact on lending spreads should reduce.
In response to the fall in ROE, banks take various measures to block the fall. For example, banks
could (i) reduce operating expenses, (ii) increase non-interest sources of income, (iii) redirect
activities towards more profitable lines of business, or (iv) absorb the higher costs and reduce ROE.
To the extent that banks absorb some of the costs either by increasing efficiency or by reducing

17
operating expenses, the costs of new regulatory reforms would be lowered. However, in this study, we
assume that banks respond to the fall in ROE by raising the lending spreads (α) charged on loans.6
The magnitude of increase in lending spreads α is determined such that the increase in net income
exactly offsets the increase in capital cost, allowing ROE to be unchanged at its previous value.
Equation (4) provides a measure of the rise in lending spreads needed to offset the fall in ROE
associated with 1pp increase in capital ratio. As long as long-term debt is replaced by equity and the
costs of debt and equity are unchanged, the increase in lending spreads rises linearly with the increase
in capital ratio. If cheaper forms of liabilities are replaced with more expensive equity, the rise in
lending spreads should be higher.
α (IncomeLoanst+1 − IncomeLoanst)/Loanst+1 (4)
where, IncomeLoanst+1=(RO t+1 t+1)
1−tax− ( therIntIncomet+1 − Int xpt+1 + NonIntIncomet+1 − p xpt+1)
2.2 Mapping NSFR to lending spreads
Estimating the cost for meeting the NSFR is more challenging than estimating the cost for meeting
higher capital requirements, since the inputs to the NSFR are not disclosed in banks’ financial
statements. The December 2010 BCBS document finalized the definition and calibration of the NSFR.
A simplified version is shown in equation (5). The numerator measures the source of available stable
funding (ASF), with greater weight given to funding sources that are more stable and least likely to
disappear under stressed market conditions. The denominator shows assets that require funding, with
a factor applied on the base of their expected liquidation value under stressed circumstances.
N (a ailable amount o stable un in )/(require amount o stable un in ) (5)
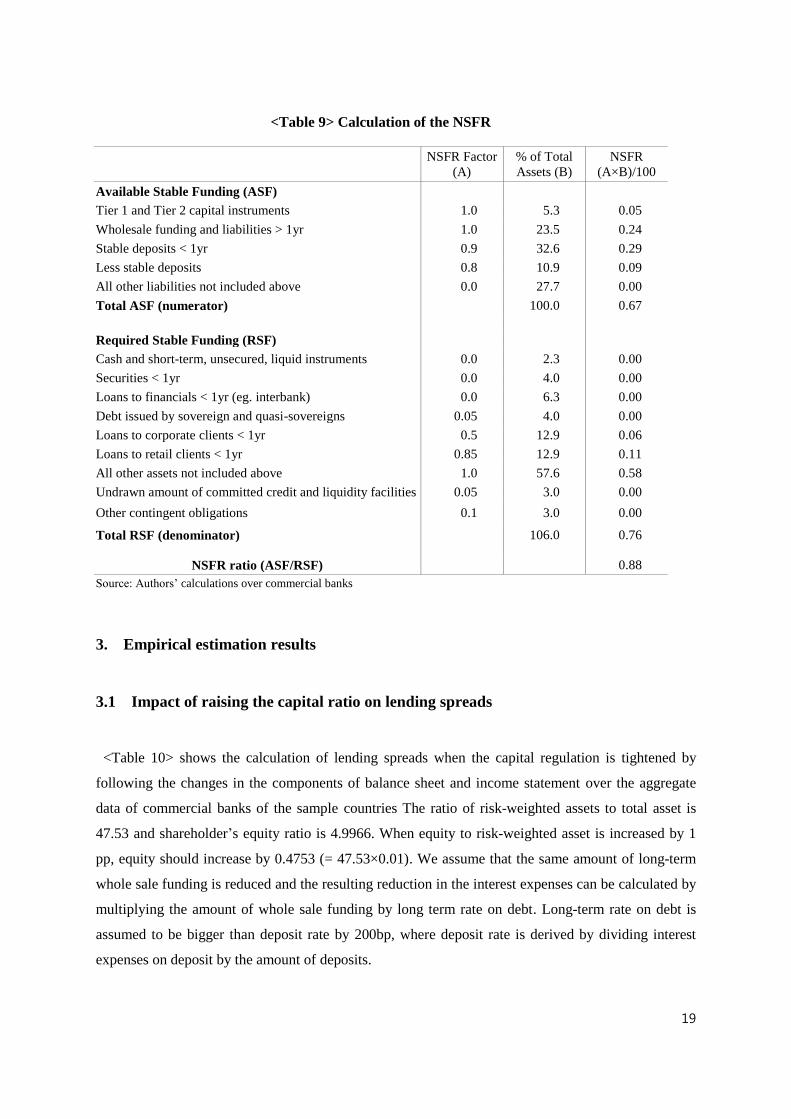
<Table 9> provides details on the calculation of NSFR based on the balance sheet data of
commercial banks. Column A in <Table 9> shows the NSFR factors applied to different balance sheet
6 Banks are likely to increase lending spreads reflecting the increased cost burdens from the higher capital requirements by
raising lending rates rather than lowering deposit rates. It is because the increase in lending rates, which will in turn reduce
lending, is more favorable to banks for meeting both their capital and liquidity requirements rather than lowering their
deposit rates which would lead to a reduction in deposits.

18
items. Column B shows the relative weights of various items on the representative bank’s balance
sheet as percentage of total assets.
The calculation of the cost for meeting the NSFR is sensitive to the definition of the ratio,
assumptions about the composition of bank’s assets and liabilities, and estimates of the returns on
various assets and of the costs of various liabilities. In our calculation of NSFR we assumed as
follows.
- 75% of deposits are stable
- Government debt initially takes 25% of investments
- 25% of investments are less than 1 year in maturity
- Committed but undrawn credit lines and other contingent liabilities are each assumed to be 3% of
total assets.
As far as the ASF goes, funding sources viewed as stable are given higher weights. They are
shareholders equity of 5.3%, longer-term debt and liabilities of 23.5%, and deposits of 43.5% (divided
between stable and less stable deposits). After deducting the stable sources of funding, all remaining
liabilities are given a 0% weight in the ASF, implying that they are not viewed as stable. It takes 27.7%
of the representative bank’s balance sheet. They include debt and liabilities due within one year, since
they are expected to roll off during stressed market conditions.
Concerning the RSF, assets viewed as less liquid bear a higher factor, implying a greater need for
stable funding. Cash, short-term securities, and interbank loans maturing within one year do not
require funding. Investment in government bonds with maturity longer than one year represents 4.0%
of total assets, of which 5% of the par value should be funded. Loans to corporate and retail clients
with maturity longer than one year should be funded at 50% and 85%, respectively. When the assets
indicated above are deduced, the remaining on-balance sheet assets that should be fully funded takes
57.6% of the representative bank’s balance sheet. Off-balance and contingent liabilities should be
funded at 10% of their value. Column C, which is a product of columns A and B, shows the
contribution of each category to the NSFR. To achieve a target NSFR, banks should have an ASF
greater than their RSF, leading to a NSFR of 1 or greater.
19
<Table 9> Calculation of the NSFR
NSFR Factor
(A)
% of Total
Assets (B)
NSFR
(A×B)/100
Available Stable Funding (ASF)
Tier 1 and Tier 2 capital instruments 1.0 5.3 0.05
Wholesale funding and liabilities > 1yr 1.0 23.5 0.24
Stable deposits < 1yr 0.9 32.6 0.29
Less stable deposits 0.8 10.9 0.09
All other liabilities not included above 0.0 27.7 0.00
Total ASF (numerator)
100.0 0.67
Required Stable Funding (RSF)
Cash and short-term, unsecured, liquid instruments 0.0 2.3 0.00
Securities < 1yr 0.0 4.0 0.00
Loans to financials < 1yr (eg. interbank) 0.0 6.3 0.00
Debt issued by sovereign and quasi-sovereigns 0.05 4.0 0.00
Loans to corporate clients < 1yr 0.5 12.9 0.06
Loans to retail clients < 1yr 0.85 12.9 0.11
All other assets not included above 1.0 57.6 0.58
Undrawn amount of committed credit and liquidity facilities 0.05 3.0 0.00
Other contingent obligations 0.1 3.0 0.00
Total RSF (denominator)
106.0 0.76
NSFR ratio (ASF/RSF)
0.88
Source: Authors’ calculations over commercial banks
3. Empirical estimation results
3.1 Impact of raising the capital ratio on lending spreads
<Table 10> shows the calculation of lending spreads when the capital regulation is tightened by
following the changes in the components of balance sheet and income statement over the aggregate
data of commercial banks of the sample countries The ratio of risk-weighted assets to total asset is
47.53 and shareholder’s equity ratio is 4.9966. When equity to risk-weighted asset is increased by 1
pp, equity should increase by 0.4753 (= 47.53×0.01). We assume that the same amount of long-term
whole sale funding is reduced and the resulting reduction in the interest expenses can be calculated by
multiplying the amount of whole sale funding by long term rate on debt. Long-term rate on debt is
assumed to be bigger than deposit rate by 200bp, where deposit rate is derived by dividing interest
expenses on deposit by the amount of deposits.

20
Reduction on long-term debt reduces the interest expenses by 0.0168pp to 1.8909% from the 1.9077%
of total assets. It raises the pretax income by 0.0168pp and net income by 0.0118pp. Since change in
income is usually smaller than change in equity, ROE decline by 54 bp. If banks intend to keep the
ROE at the pre-regulation level, they should increase lending spreads by 9.08bp.
<Table 10> Calculation of rise in lending spreads for 1pp increase in capital ratio
No change in
lending spreads
Increase in
lending spreads
Before After Change After Change
Total capital/RWA 12.0600 12.0700 0.0100 12.070 0.0100
RWA/Total assets 47.5300 47.5300 0.0000 47.5300 0.0000
Shareholder's equity 4.9966 5.4719 0.4753 5.4719 0.4753
Wholesale funding 10.7009 10.2256 -0.4753 10.2256 -0.4753
Increase in lending spreads
0bp
9.08bp
Interest income on loans 1.8420 1.8420 0.0000 1.8842 0.0422
+ Interest income on ex loans 1.5451 1.5451 0.0000 1.5451 0.0000
= Interest income 3.3871 3.3871 0.0000 3.4293 0.0422
- Interest expense 1.9077 1.8909 -0.0168 1.8909 -0.0168
= Net interest income 1.4794 1.4961 0.0168 1.5383 0.0590
+ Non interest income 0.6270 0.6270 0.0000 0.6270 0.0000
= Revenue 2.1064 2.1232 0.0168 2.1654 0.0590
- Operating expenses 1.4864 1.4864 0.0000 1.4864 0.0000
= Pretax income 0.6200 0.6368 0.0168 0.6790 0.0590
Net income 0.4349 0.4467 0.0118 0.4763 0.0414
ROE 0.0870 0.0816 -0.0054 0.0870 0.0000
Source: Authors’ calculations
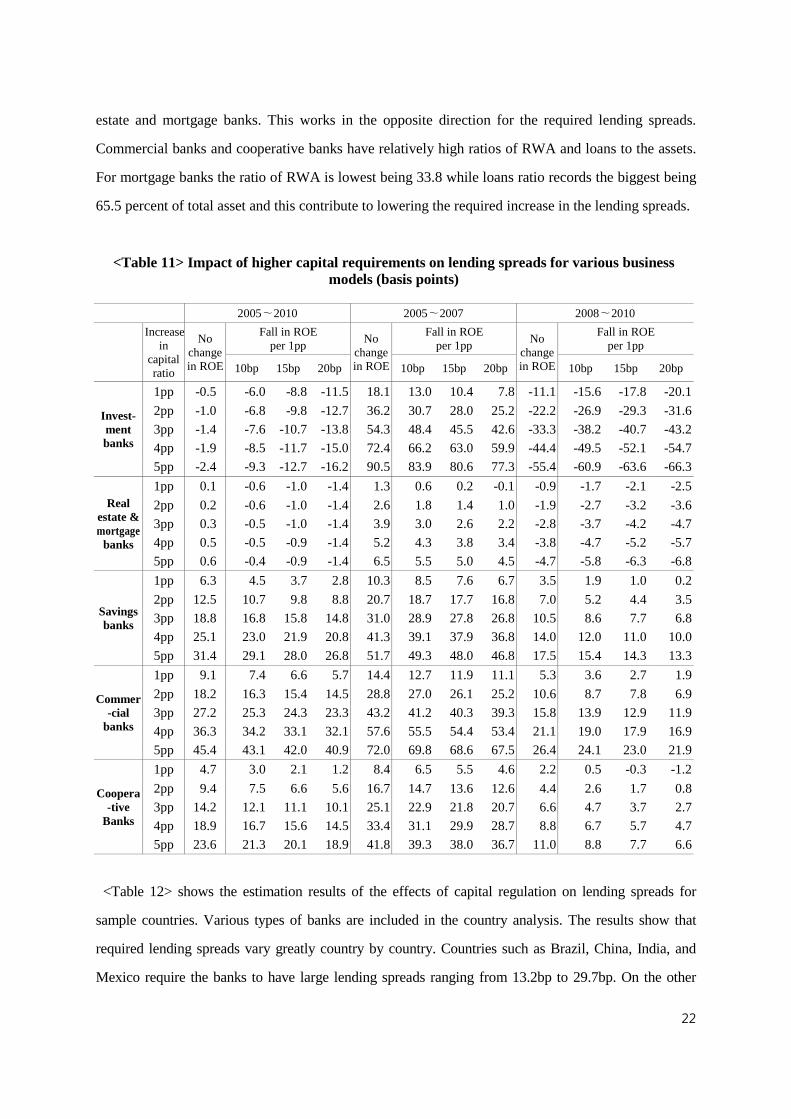
Above estimation is applied to the banks of different business models allowing the fall in ROE to the
different degree and increasing the magnitude of capital regulation incrementally. The results are
presented in <Table 11>. Over the entire sample period, lending spreads required to keep ROE
constant is greatest for commercial banks recording 9.1bp, followed by savings banks and cooperative
banks. When the two periods of before and after the crisis are compared, required lending spreads
became smaller after the crisis. One of the reasons for this is due to the significant decrease in the
ratio of RWA to total asset after the crisis. Required lending spreads decreases from 14.4bp to 5.3bp
for commercial banks after the crisis. It decreases from 10.3bp to 3.5bp, and 8.4bp to 2.2 bp for
savings banks and cooperative banks respectively.
21
When the ROE is allowed to fall, the required lending spreads also fall. If required capital ratio is
increases incrementally by 1pp, the required lending spreads increases linearly. The required lending
spreads become 45.4bp for commercial banks when the capital regulation requires banks to increase
equity by 5pp and if banks want to keep ROE at the original level. Lending spreads increases up to
31.4bp and 23.6bp for savings banks and cooperative banks respectively when the capital regulation
requires 5pp increase in the capital ratio with no change in ROE.
In the case of investment banks and real estate and mortgage banks, required lending spreads
become negative over the whole sample periods of 2005~2010. Negative lending spreads means that
lending spreads should decrease rather than increase when capital regulation is tightened. Splitting the
sample periods into before and after the crisis era provides the answer to the seemingly unintuitive
results. ROE after the financial crisis recorded negative value for these banks because operating
expenses were greater than revenue. When interest expenses are reduced after the capital regulation,
ROE increases rather than decreases. Banks’ effort to prevent ROE from rising lenders lending
spreads to decline rather than to increase.
Major factors affecting lending spreads are the ratio of RWA to total assets, the relative size of loan
to total assets or the long term interest rate on debt, ceteris paribus. When capital regulation is
tightened, the higher ratio of RWA to total assets requires bigger amount of equity to be raised
thereby requiring bigger reduction in the whole sale funding. This usually has the effect of increasing
lending spreads since the increase in the capital become bigger than increase in the net income. Level
of interest rates will affect the magnitude of reduction in the interest expense and net profit. We can
expect the reduction in the interest expense bigger leading to bigger increase in net income, higher the
level of interest rates, which would result in the smaller increase in the required lending spreads to
maintain ROE at the given level.
The relative size of loans to total assets is another factor which affects required lending spreads. In
response to an increase in capital requirements, a given quantity of net income should be recovered by
raising pre-tax income on the existing loan portfolio. When the loan portfolio has a larger share of
total assets, a smaller increase in lending rates per loan can increase interest income on loans enough
to keep ROE at a pre-level.
<Table 6> shows that the ratios of RWA and loans to total assets vary across business models, which
makes it hard to identify the factors which affects the magnitude of lending spreads. Savings banks
recorded the highest ratio of RWA to the assets and second highest ratio of loans to asset after real
22
estate and mortgage banks. This works in the opposite direction for the required lending spreads.
Commercial banks and cooperative banks have relatively high ratios of RWA and loans to the assets.
For mortgage banks the ratio of RWA is lowest being 33.8 while loans ratio records the biggest being
65.5 percent of total asset and this contribute to lowering the required increase in the lending spreads.
<Table 11> Impact of higher capital requirements on lending spreads for various business
models (basis points)
2005∼2010 2005∼2007 2008∼2010
Increase in
capital ratio
No change in ROE
Fall in ROE per 1pp
No change in ROE
Fall in ROE per 1pp
No change in ROE
Fall in ROE per 1pp
10bp 15bp 20bp 10bp 15bp 20bp 10bp 15bp 20bp
Invest-
ment banks
1pp -0.5 -6.0 -8.8 -11.5 18.1 13.0 10.4 7.8 -11.1 -15.6 -17.8 -20.1
2pp -1.0 -6.8 -9.8 -12.7 36.2 30.7 28.0 25.2 -22.2 -26.9 -29.3 -31.6
3pp -1.4 -7.6 -10.7 -13.8 54.3 48.4 45.5 42.6 -33.3 -38.2 -40.7 -43.2
4pp -1.9 -8.5 -11.7 -15.0 72.4 66.2 63.0 59.9 -44.4 -49.5 -52.1 -54.7
5pp -2.4 -9.3 -12.7 -16.2 90.5 83.9 80.6 77.3 -55.4 -60.9 -63.6 -66.3
Real estate & mortgage
banks
1pp 0.1 -0.6 -1.0 -1.4 1.3 0.6 0.2 -0.1 -0.9 -1.7 -2.1 -2.5
2pp 0.2 -0.6 -1.0 -1.4 2.6 1.8 1.4 1.0 -1.9 -2.7 -3.2 -3.6
3pp 0.3 -0.5 -1.0 -1.4 3.9 3.0 2.6 2.2 -2.8 -3.7 -4.2 -4.7
4pp 0.5 -0.5 -0.9 -1.4 5.2 4.3 3.8 3.4 -3.8 -4.7 -5.2 -5.7
5pp 0.6 -0.4 -0.9 -1.4 6.5 5.5 5.0 4.5 -4.7 -5.8 -6.3 -6.8
Savings banks
1pp 6.3 4.5 3.7 2.8 10.3 8.5 7.6 6.7 3.5 1.9 1.0 0.2
2pp 12.5 10.7 9.8 8.8 20.7 18.7 17.7 16.8 7.0 5.2 4.4 3.5
3pp 18.8 16.8 15.8 14.8 31.0 28.9 27.8 26.8 10.5 8.6 7.7 6.8
4pp 25.1 23.0 21.9 20.8 41.3 39.1 37.9 36.8 14.0 12.0 11.0 10.0
5pp 31.4 29.1 28.0 26.8 51.7 49.3 48.0 46.8 17.5 15.4 14.3 13.3
Commer
-cial banks
1pp 9.1 7.4 6.6 5.7 14.4 12.7 11.9 11.1 5.3 3.6 2.7 1.9
2pp 18.2 16.3 15.4 14.5 28.8 27.0 26.1 25.2 10.6 8.7 7.8 6.9
3pp 27.2 25.3 24.3 23.3 43.2 41.2 40.3 39.3 15.8 13.9 12.9 11.9
4pp 36.3 34.2 33.1 32.1 57.6 55.5 54.4 53.4 21.1 19.0 17.9 16.9
5pp 45.4 43.1 42.0 40.9 72.0 69.8 68.6 67.5 26.4 24.1 23.0 21.9
Coopera
-tive Banks
1pp 4.7 3.0 2.1 1.2 8.4 6.5 5.5 4.6 2.2 0.5 -0.3 -1.2
2pp 9.4 7.5 6.6 5.6 16.7 14.7 13.6 12.6 4.4 2.6 1.7 0.8
3pp 14.2 12.1 11.1 10.1 25.1 22.9 21.8 20.7 6.6 4.7 3.7 2.7
4pp 18.9 16.7 15.6 14.5 33.4 31.1 29.9 28.7 8.8 6.7 5.7 4.7
5pp 23.6 21.3 20.1 18.9 41.8 39.3 38.0 36.7 11.0 8.8 7.7 6.6
<Table 12> shows the estimation results of the effects of capital regulation on lending spreads for
sample countries. Various types of banks are included in the country analysis. The results show that
required lending spreads vary greatly country by country. Countries such as Brazil, China, India, and
Mexico require the banks to have large lending spreads ranging from 13.2bp to 29.7bp. On the other

23
hand, countries such as Australia, Switzerland, Germany, Italy and Netherland require them to increase
smaller lending spreads for the 1pp increase in regulatory capital ratio during the period of 2005~2007.
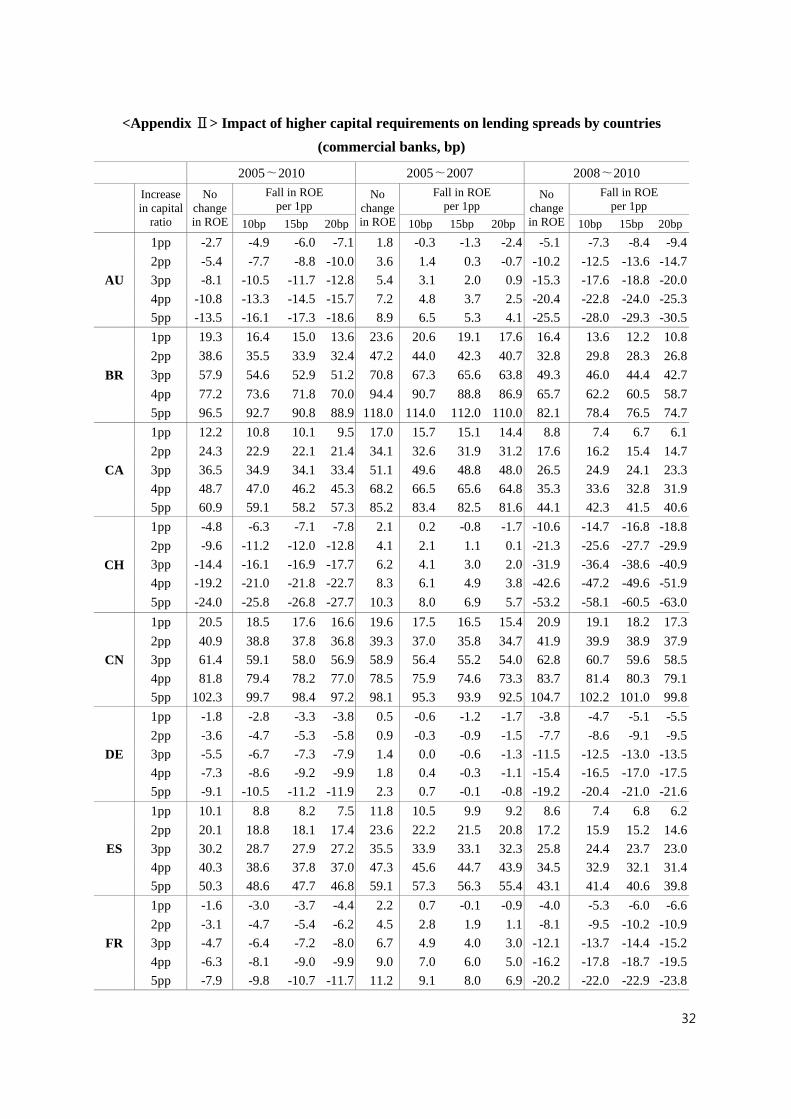
Since the effects of capital regulation may vary by a composition of business models in each country,
we only include the commercial banks in each country. They are presented in <Appendix Ⅱ>, which
doesn’t seem to make any qualitative difference with the calibration results when all the business
models are included in the analysis.
<Table 12> Impact of higher capital requirements on lending spreads for countries (bp)
2005∼2010 2005∼2007 2008∼2010
Increase
in capital
ratio
No
change
in ROE
Fall in ROE per 1pp
No
change
in ROE
Fall in ROE per 1pp
No
change
in ROE
Fall in ROE per 1pp
10bp 15bp 20bp 10bp 15bp 20bp 10bp 15bp 20bp
AU
1pp 3.2 1.1 0.0 -1.0 7.9 5.9 5.0 4.0 0.7 -1.4 -2.5 -3.5
2pp 6.3 4.1 3.1 2.0 15.8 13.7 12.7 11.7 1.4 -0.8 -1.9 -3.0
3pp 9.5 7.2 6.1 5.0 23.7 21.5 20.5 19.4 2.1 -0.2 -1.3 -2.5
4pp 12.7 10.3 9.1 8.0 31.6 29.3 28.2 27.1 2.8 0.4 -0.8 -1.9
5pp 15.8 13.4 12.2 10.9 39.5 37.2 36.0 34.9 3.5 1.0 -0.2 -1.4
BR
1pp 23.1 20.1 18.7 17.2 29.7 26.6 25.1 23.5 19.0 16.2 14.7 13.3
2pp 46.2 43.0 41.4 39.8 59.4 56.0 54.4 52.7 38.1 35.0 33.4 31.9
3pp 69.2 65.8 64.1 62.4 89.0 85.5 83.7 81.9 57.1 53.8 52.1 50.4
4pp 92.3 88.7 86.8 85.0 118.7 114.9 113.0 111.0 76.2 72.6 70.8 69.0
5pp 115.4 111.5 109.6 107.6 148.4 144.3 142.3 140.2 95.2 91.4 89.5 87.6
CA
1pp 8.3 5.7 4.4 3.1 15.2 12.7 11.5 10.3 3.6 0.8 -0.5 -1.9
2pp 16.6 13.9 12.5 11.2 30.5 27.8 26.5 25.2 7.1 4.3 2.9 1.4
3pp 24.9 22.1 20.7 19.3 45.7 43.0 41.6 40.2 10.7 7.7 6.3 4.8
4pp 33.2 30.3 28.8 27.3 60.9 58.1 56.6 55.2 14.3 11.2 9.7 8.1
5pp 41.5 38.5 36.9 35.4 76.2 73.2 71.7 70.2 17.9 14.7 13.1 11.5
CH
1pp 1.1 -0.3 -1.0 -1.7 7.5 5.8 5.0 4.1 -4.0 -9.6 -12.5 -15.3
2pp 2.2 0.7 0.0 -0.7 15.1 13.3 12.4 11.5 -8.0 -13.9 -16.8 -19.8
3pp 3.2 1.7 1.0 0.2 22.6 20.7 19.8 18.8 -12.0 -18.1 -21.2 -24.3
4pp 4.3 2.7 1.9 1.1 30.1 28.1 27.1 26.2 -16.0 -22.4 -25.6 -28.8
5pp 5.4 3.7 2.9 2.1 37.7 35.6 34.5 33.5 -20.2 -26.6 -30.0 -33.3
CN
1pp 20.9 19.0 18.0 17.0 20.1 18.0 17.0 15.9 21.4 19.5 18.6 17.6
2pp 41.9 39.8 38.7 37.6 40.3 38.0 36.8 35.7 42.8 40.8 39.8 38.7
3pp 62.8 60.5 59.4 58.3 60.4 57.9 56.7 55.5 64.2 62.0 60.9 59.8
4pp 83.8 81.3 80.1 78.9 80.5 77.9 76.6 75.2 85.6 83.3 82.1 80.9
5pp 104.7 102.1 100.8 99.5 100.7 97.9 96.4 95.0 107.1 104.5 103.3 102.0
DE
1pp 1.4 0.3 -0.2 -0.8 5.1 4.1 3.6 3.1 -1.7 -8.4 -11.7 -15.0
2pp 2.7 1.5 1.0 0.4 10.2 9.0 8.5 7.9 -3.4 -10.7 -14.4 -18.1
3pp 4.1 2.8 2.2 1.5 15.2 14.0 13.4 12.8 -5.1 -13.1 -17.1 -21.1
4pp 5.4 4.0 3.3 2.7 20.3 19.0 18.3 17.7 -6.8 -15.5 -19.8 -24.1
5pp 6.8 5.3 4.5 3.8 25.4 24.0 23.2 22.5 -8.5 -17.8 -22.5 -27.1

24
ES
1pp 11.0 9.7 9.1 8.4 13.2 11.9 11.2 10.5 9.3 8.0 7.4 6.8
2pp 22.1 20.6 19.9 19.2 26.5 24.9 24.2 23.4 18.6 17.2 16.6 15.9
3pp 33.1 31.6 30.8 30.0 39.7 38.0 37.2 36.4 27.9 26.4 25.7 25.0
4pp 44.1 42.5 41.7 40.8 52.9 51.1 50.3 49.4 37.2 35.6 34.8 34.1
5pp 55.2 53.4 52.5 51.6 66.1 64.2 63.3 62.3 46.5 44.8 44.0 43.2
FR
1pp 4.9 3.3 2.5 1.7 8.9 7.2 6.3 5.5 2.1 0.6 -0.1 -0.8
2pp 9.7 8.1 7.2 6.4 17.8 16.0 15.0 14.1 4.2 2.7 1.9 1.1
3pp 14.6 12.8 11.9 11.0 26.7 24.7 23.8 22.8 6.4 4.7 3.8 3.0
4pp 19.5 17.5 16.6 15.6 35.6 33.5 32.5 31.4 8.5 6.7 5.8 4.9
5pp 24.3 22.3 21.3 20.2 44.5 42.3 41.2 40.0 10.6 8.7 7.7 6.8
GB
1pp 3.4 1.9 1.2 0.5 12.3 11.1 10.5 9.9 -3.7 -4.3 -4.6 -4.9
2pp 6.8 5.2 4.4 3.6 24.7 23.4 22.7 22.0 -7.4 -8.1 -8.4 -8.7
3pp 10.2 8.5 7.6 6.8 37.0 35.6 34.9 34.2 -11.1 -11.8 -12.2 -12.5
4pp 13.7 11.8 10.9 9.9 49.4 47.8 47.1 46.3 -14.8 -15.6 -16.0 -16.3
5pp 17.1 15.1 14.1 13.1 61.7 60.1 59.2 58.4 -18.5 -19.3 -19.7 -20.1
IN
1pp 13.2 11.4 10.6 9.7 15.7 14.0 13.1 12.3 11.6 9.8 8.9 8.0
2pp 26.4 24.5 23.5 22.6 31.3 29.5 28.6 27.7 23.2 21.3 20.3 19.3
3pp 39.6 37.5 36.5 35.5 47.0 45.0 44.0 43.0 34.8 32.7 31.7 30.7
4pp 52.8 50.6 49.5 48.4 62.6 60.5 59.4 58.4 46.3 44.2 43.1 42.0
5pp 66.0 63.7 62.5 61.4 78.3 76.0 74.9 73.7 57.9 55.6 54.5 53.3
IT
1pp 4.1 2.2 1.2 0.3 8.8 6.7 5.7 4.7 1.0 -0.7 -1.6 -2.5
2pp 8.1 6.1 5.1 4.1 17.5 15.3 14.2 13.1 2.0 0.1 -0.8 -1.7
3pp 12.2 10.0 9.0 7.9 26.3 23.9 22.7 21.6 2.9 1.0 0.0 -1.0
4pp 16.3 14.0 12.8 11.7 35.0 32.5 31.2 30.0 3.9 1.9 0.8 -0.2
5pp 20.3 17.9 16.7 15.4 43.8 41.1 39.8 38.4 4.9 2.7 1.6 0.5
JP
1pp 7.5 6.0 5.3 4.5 12.5 11.0 10.2 9.4 3.8 2.3 1.6 0.8
2pp 15.1 13.4 12.5 11.7 25.1 23.3 22.4 21.6 7.7 6.0 5.1 4.3
3pp 22.6 20.7 19.8 18.8 37.6 35.7 34.7 33.7 11.5 9.6 8.7 7.8
4pp 30.2 28.1 27.0 26.0 50.2 48.0 46.9 45.8 15.3 13.3 12.3 11.3
5pp 37.7 35.4 34.3 33.2 62.7 60.4 59.2 58.0 19.2 17.0 15.9 14.8
KR
1pp 9.2 7.8 7.1 6.4 17.5 16.1 15.3 14.6 2.5 1.1 0.5 -0.2
2pp 18.4 16.9 16.1 15.4 35.0 33.4 32.6 31.8 4.9 3.5 2.8 2.0
3pp 27.6 26.0 25.1 24.3 52.5 50.8 49.9 49.1 7.4 5.8 5.0 4.3
4pp 36.8 35.0 34.2 33.3 70.0 68.1 67.2 66.3 9.8 8.1 7.3 6.5
5pp 46.0 44.1 43.2 42.2 87.5 85.5 84.5 83.5 12.3 10.5 9.6 8.7
MX
1pp 29.7 25.9 24.0 22.1 36.4 32.6 30.6 28.7 22.5 18.9 17.0 0.0
2pp 59.5 55.4 53.4 51.4 72.9 68.8 66.7 64.6 45.1 41.2 39.2 0.0
3pp 89.2 84.9 82.8 80.6 109.3 104.9 102.7 100.6 67.6 63.5 61.4 0.8
4pp 119.0 114.4 112.2 109.9 145.7 141.1 138.8 136.5 90.2 85.8 83.7 4.3
5pp 148.7 143.9 141.5 139.2 182.2 177.3 174.9 172.4 112.7 108.2 105.9 7.8
NL
1pp -0.6 -1.6 -2.1 -2.6 3.4 2.4 1.9 1.5 -4.0 -4.8 -5.2 -5.6
2pp -1.1 -2.2 -2.8 -3.4 6.8 5.7 5.2 4.7 -7.9 -8.8 -9.2 -9.7
3pp -1.7 -2.9 -3.5 -4.1 10.2 9.1 8.5 7.9 -11.9 -12.8 -13.3 -13.8
4pp -2.3 -3.6 -4.2 -4.9 13.6 12.4 11.7 11.1 -15.8 -16.9 -17.4 -17.9
5pp -2.8 -4.2 -4.9 -5.6 17.0 15.7 15.0 14.3 -19.8 -20.9 -21.4 -22.0
US
1pp 8.3 5.9 4.7 3.5 17.2 14.9 13.8 12.7 1.9 -0.5 -1.6 -2.8
2pp 16.5 13.9 12.6 11.3 34.4 31.9 30.7 29.5 3.8 1.3 0.0 -1.3
3pp 24.8 22.0 20.6 19.2 51.6 48.9 47.6 46.2 5.7 3.0 1.6 0.3
4pp 33.0 30.0 28.6 27.1 68.8 65.9 64.5 63.0 7.5 4.7 3.2 1.8
5pp 41.3 38.1 36.5 34.9 86.0 82.9 81.4 79.8 9.4 6.4 4.9 3.4
25
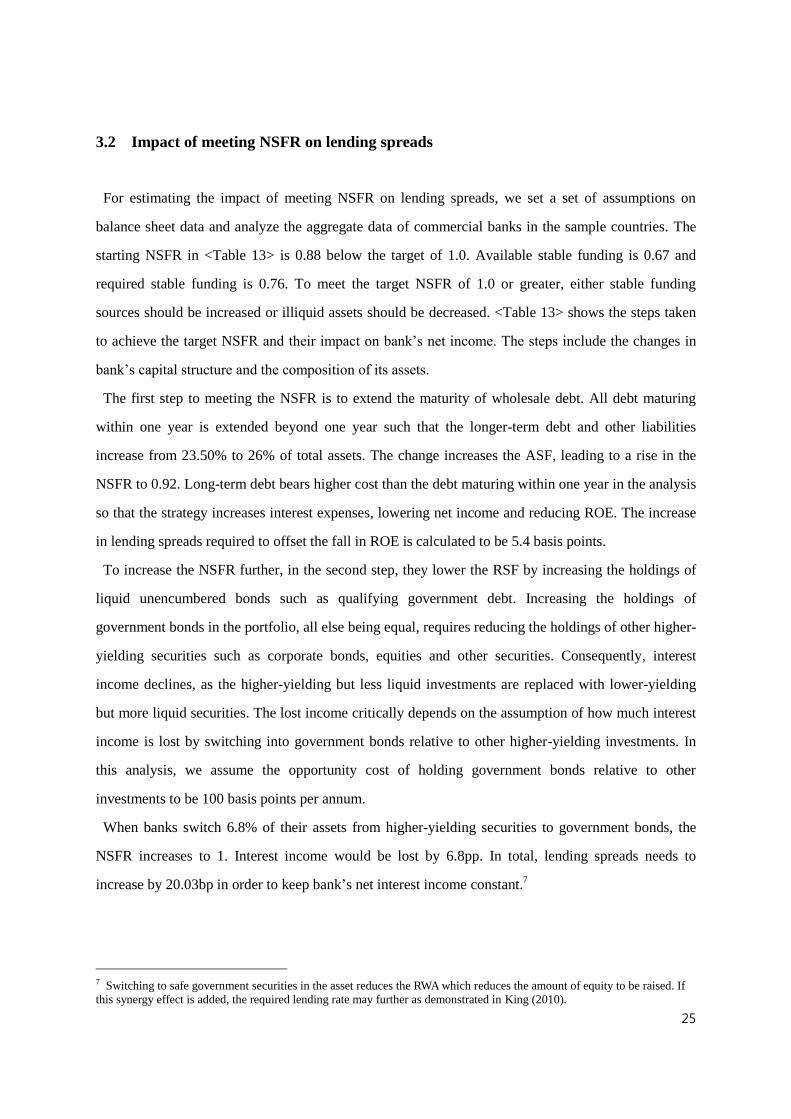
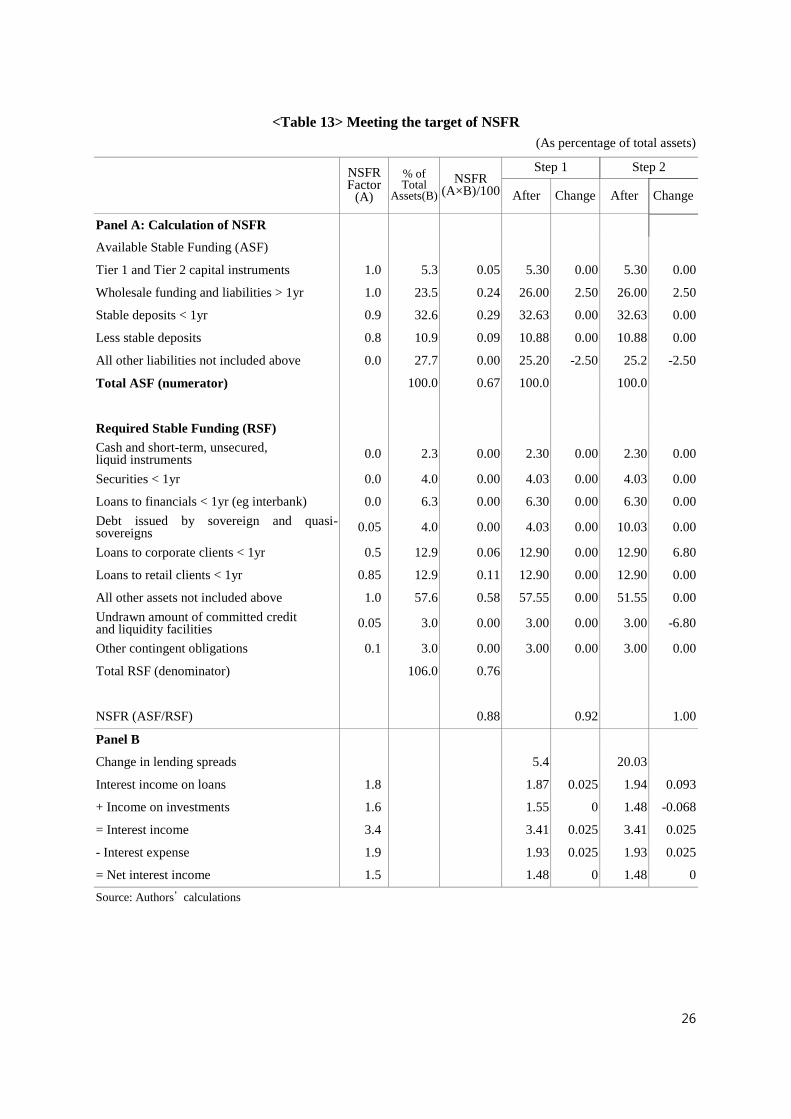
3.2 Impact of meeting NSFR on lending spreads
For estimating the impact of meeting NSFR on lending spreads, we set a set of assumptions on
balance sheet data and analyze the aggregate data of commercial banks in the sample countries. The
starting NSFR in <Table 13> is 0.88 below the target of 1.0. Available stable funding is 0.67 and
required stable funding is 0.76. To meet the target NSFR of 1.0 or greater, either stable funding
sources should be increased or illiquid assets should be decreased. <Table 13> shows the steps taken
to achieve the target NSFR and their impact on bank’s net income. The steps include the changes in
bank’s capital structure and the composition of its assets.
The first step to meeting the NSFR is to extend the maturity of wholesale debt. All debt maturing
within one year is extended beyond one year such that the longer-term debt and other liabilities
increase from 23.50% to 26% of total assets. The change increases the ASF, leading to a rise in the
NSFR to 0.92. Long-term debt bears higher cost than the debt maturing within one year in the analysis
so that the strategy increases interest expenses, lowering net income and reducing ROE. The increase
in lending spreads required to offset the fall in ROE is calculated to be 5.4 basis points.
To increase the NSFR further, in the second step, they lower the RSF by increasing the holdings of
liquid unencumbered bonds such as qualifying government debt. Increasing the holdings of
government bonds in the portfolio, all else being equal, requires reducing the holdings of other higher-
yielding securities such as corporate bonds, equities and other securities. Consequently, interest
income declines, as the higher-yielding but less liquid investments are replaced with lower-yielding
but more liquid securities. The lost income critically depends on the assumption of how much interest
income is lost by switching into government bonds relative to other higher-yielding investments. In
this analysis, we assume the opportunity cost of holding government bonds relative to other
investments to be 100 basis points per annum.
When banks switch 6.8% of their assets from higher-yielding securities to government bonds, the
NSFR increases to 1. Interest income would be lost by 6.8pp. In total, lending spreads needs to
increase by 20.03bp in order to keep bank’s net interest income constant.7
7 Switching to safe government securities in the asset reduces the RWA which reduces the amount of equity to be raised. If
this synergy effect is added, the required lending rate may further as demonstrated in King (2010).
26
<Table 13> Meeting the target of NSFR
(As percentage of total assets)
NSFR Factor
(A)
% of Total
Assets(B)
NSFR (A×B)/100
Step 1 Step 2
After Change After Change
Panel A: Calculation of NSFR
Available Stable Funding (ASF)
Tier 1 and Tier 2 capital instruments 1.0 5.3 0.05 5.30 0.00 5.30 0.00
Wholesale funding and liabilities > 1yr 1.0 23.5 0.24 26.00 2.50 26.00 2.50
Stable deposits < 1yr 0.9 32.6 0.29 32.63 0.00 32.63 0.00
Less stable deposits 0.8 10.9 0.09 10.88 0.00 10.88 0.00
All other liabilities not included above 0.0 27.7 0.00 25.20 -2.50 25.2 -2.50
Total ASF (numerator) 100.0 0.67 100.0
100.0
Required Stable Funding (RSF) Cash and short-term, unsecured, liquid instruments
0.0 2.3 0.00 2.30 0.00 2.30 0.00
Securities < 1yr 0.0 4.0 0.00 4.03 0.00 4.03 0.00
Loans to financials < 1yr (eg interbank) 0.0 6.3 0.00 6.30 0.00 6.30 0.00
Debt issued by sovereign and quasi-sovereigns
0.05 4.0 0.00 4.03 0.00 10.03 0.00
Loans to corporate clients < 1yr 0.5 12.9 0.06 12.90 0.00 12.90 6.80
Loans to retail clients < 1yr 0.85 12.9 0.11 12.90 0.00 12.90 0.00
All other assets not included above 1.0 57.6 0.58 57.55 0.00 51.55 0.00
Undrawn amount of committed credit and liquidity facilities
0.05 3.0 0.00 3.00 0.00 3.00 -6.80
Other contingent obligations 0.1 3.0 0.00 3.00 0.00 3.00 0.00
Total RSF (denominator)
106.0 0.76
NSFR (ASF/RSF)
0.88
0.92
1.00
Panel B
Change in lending spreads
5.4
20.03
Interest income on loans 1.8
1.87 0.025 1.94 0.093
+ Income on investments 1.6
1.55 0 1.48 -0.068
= Interest income 3.4
3.41 0.025 3.41 0.025
- Interest expense 1.9
1.93 0.025 1.93 0.025
= Net interest income 1.5
1.48 0 1.48 0
Source: Authors’ calculations

27
V. Conclusion
Strengthened capital requirement may reduce the bank’s ROE as debt is substituted with more
expensive equity. We assume that banks would raise lending spreads among the measures they could
take to prevent ROE from falling. In order to estimate the required lending spreads when the capital
regulation is tightened, we employ the accounting relationship by using bank’s balance sheet data and
income statement following spirit of King (2010) or Elliott (2010). Since bank’s responses in
increasing lending rates vary by banks’ business models and countries, we conduct the analyses for
various business models in various countries.
Major factors affecting lending spreads are the ratio of RWA to total assets, the relative size of loan
to total assets or the long term interest rate on debt, ceteris paribus. The ratios of RWA and loans to
total assets vary across business models and countries, which makes it hard to identify the factors
which affect the magnitude of lending spreads consistently. We found that the required lending
spreads to keep ROE from falling vary from 0.1bp for real estate and mortgage banks to 9.1bp for
commercial banks over the sample periods of 2005~2010. Required lending rate decreases after the
2007~2008 global financial crisis and one of the main reasons for this is the significantly decreased
ratio of RWA to total assets. The estimation results show that required lending spreads vary greatly
country by country. Countries such as Brazil, China, India, and Mexico require the banks to have
large lending spreads ranging from 13.2bp to 29.7bp during the period of 2005∼2010. On the other
hand, countries such as Australia, Switzerland, Germany, Italy, and Netherland require them to
increase smaller lending spreads for the 1pp increase in capital ratio. Apart from the capital regulation,
we found that liquidity regulation (NSFR) increases lending spreads by 20.0bp for the commercial
banks of the sample countries if they want to keep ROE at the pre-regulation level.
28
<Reference>
Bayoumi, T. and Melander, O., "Credit Matters: Empirical Evidence on U.S. Macro-Financial
Linkage, IMF Working Paper 08/169, 2008
BCBS(Basel Committee on Banking Supervision), Instructions for BaselⅢ Implementation
Monitoring", 20 May 2011
__________________, "Countercyclical Capital Buffer Proposal", July 2010a
___________________, "An Assessment of the Long-Term Economic Impact of Stronger Capital and
Liquidity Requirements", August 2010b
___________________, "Results of the Comprehensive Quantitative Impact Study", December 2010c
__________________. "Strengthening the Resilience of the Banking Sector", December 2009
BIS, "BaselⅢ: Long-term Impact on Economic Performance and Fluctuations", BIS Working Paper
No. 338, February 2011
CEBS, "Results of the Comprehensive Quantitative Impact Study", CEBS, 16 December 2010
Cosimano and Dalia, "Bank Behavior in Response to Basel Ⅲ: A Cross-Country Analysis", IMF
Working Paper, WP/11/119, 2011
Elliott, D., J., "A Further Exploration of Bank Capital Requirements: Effects of Competition from
Other Financial Sectors and Effects of Size of Bank or Borrowers and Loan Type", January 2010
European Commission, Quarterly Report on the Euro Area, Vol. 10. n. 1, April 2011
IIF, "The Cumulative Impact of the Global Economy of Changes in the Financial Regulatory
Framework, September 2011
Jaffe and Johan (2010), "The Impact of Basel Ⅲ and Solvency 2 on Swedish Banks and Insurers: An
Equilibrium Analysis", Financial Market Committee
Kashyap, A.K., J.C. Stein and Sh. Hanson, “An Analysis of the Impact of “Substantially Heightened”
Capital Requirements on Large Financial Institutions,” Journal of Economic Perspective,
forthcoming
King, M., R., "Mapping capital and liquidity requirements to bank lending spreads", BIS Working
Paper No. 324, 2010
Locarno, "The Macroeconomic Impact of BaselⅢ on the Italian Economy", BANCA D'ITALIA,
February 2011
29
Macroeconomic Assessment Group, "Assessing the Macroeconomic Impact of the Transition to
Stronger Capital and Liquidity Requirements", Interim Report, August 2010a
___________________, "Assessing the Macroeconomic Impact of the Transition to Stronger Capital
and Liquidity Requirements", Final Report, December 2010b
Maudos, J., and Juan Fernández de Guevara, "Factors explaining the interest margin in the banking
sectors of the European Union", Journal of Banking & Finance 28, 2004
OECD, "The OECD's New Global Model", OECD Economics Department Working Paper No. 768,
2010
OECD, "Macroeconomic Impact of BaselⅢ," OECD, 2011

30
<Appendix Ⅰ> Descriptive Statistics by countries
(As percentage of total assets, %)
05∼10 05∼07 08∼10 05∼10 05∼07 08∼10 05∼10 05∼07 08∼10
<AU> <BR> <CA>
Interest income on loans 3.1 2.8 3.4 6.4 6.9 6.2 1.6 1.1 2.0
Interest income on ex loans 2.3 2.7 2.1 4.5 5.5 4.0 1.8 2.8 1.0
Interest expenses 3.9 3.9 4.0 5.7 6.3 5.5 1.9 2.4 1.5
Net interest income 1.5 1.7 1.5 5.2 6.1 4.7 1.5 1.4 1.5
Non interest income 1.7 2.4 1.4 1.1 1.3 1.0 1.6 2.3 1.1
ROA 0.8 1.2 0.6 1.7 2.0 1.5 0.9 1.2 0.5
ROE 8.3 13.3 5.7 22.6 25.3 21.1 10.3 15.2 6.6
Leverage multiple 10.4 11.4 9.8 13.7 12.5 14.3 12.1 12.2 12.0
Equity-asset ratio 9.7 8.8 10.2 7.3 8.0 7.0 8.3 8.2 8.3
Total capital/RWA 30.4 32.6 28.2 11.5 11.3 11.6 11.8 9.6 13.9
RWA/total assets 41.3 40.2 42.4 65.5 71.0 59.9 40.1 43.8 36.3
Net loans, leases & mortgages 66.8 67.5 66.4 37.5 36.6 37.9 40.6 40.7 40.6
<CH> <CN> <DE>
Interest income on loans 0.9 0.8 1.0 2.7 2.9 2.6 2.9 3.2 2.7
Interest income on ex loans 2.3 3.0 1.6 1.2 1.1 1.2 1.0 1.0 1.0
Interest expenses 2.7 3.4 2.0 1.6 1.6 1.6 2.9 3.2 2.7
Net interest income 0.5 0.5 0.6 2.3 2.4 2.2 1.0 0.9 1.0
Non interest income 1.3 1.5 1.0 0.2 0.1 0.2 0.2 0.4 0.0
ROA 0.2 0.5 -0.1 1.0 0.8 1.0 0.1 0.3 0.0
ROE 6.7 17.1 -2.8 15.6 13.8 16.4 4.8 10.3 -0.4
Leverage multiple 33.1 35.3 31.1 16.0 16.4 15.8 32.2 31.1 33.2
Equity-asset ratio 3.0 2.8 3.2 6.2 6.1 6.3 3.1 3.2 3.0
Total capital/RWA 16.9 10.4 23.4 11.2 11.5 10.8 8.4 8.3 8.6
RWA/total assets 15.9 16.5 15.3 55.8 55.3 56.2 36.0 39.0 33.0
Net loans, leases & mortgages 24.3 23.4 25.2 53.0 52.1 53.4 47.4 48.1 46.7
<ES> <FR> <GB>
Interest income on loans 3.5 3.4 3.5 1.8 1.8 1.8 1.3 1.2 1.3
Interest income on ex loans 0.9 0.9 0.9 1.5 1.7 1.3 1.1 1.7 0.6
Interest expenses 2.5 2.6 2.4 2.4 2.9 2.1 1.5 2.1 1.1
Net interest income 1.8 1.6 2.0 0.8 0.7 0.9 0.8 0.9 0.8
Non interest income 0.6 0.9 0.3 0.7 1.0 0.4 0.5 0.9 0.2
ROA 0.9 1.0 0.7 0.3 0.5 0.2 0.2 0.4 0.0
ROE 14.5 17.3 12.4 8.2 11.7 5.5 5.6 13.7 -0.8
Leverage multiple 16.7 16.8 16.6 26.5 25.6 27.3 30.7 30.7 30.7
Equity-asset ratio 6.0 5.9 6.0 3.8 3.9 3.7 3.3 3.3 3.3
Total capital/RWA 10.6 9.7 11.6 10.7 9.5 12.0 12.0 9.3 14.7
RWA/total assets 58.4 62.5 54.3 31.9 33.6 30.2 31.6 34.1 29.1
Net loans, leases & mortgages 63.2 63.4 63.1 35.6 33.5 37.2 38.3 42.0 35.4

31
<IN> <IT> <JP>
Interest income on loans 4.8 4.1 5.2 2.7 2.4 2.9 1.0 1.0 1.0
Interest income on ex loans 2.2 2.7 1.9 1.2 1.4 1.0 0.6 0.6 0.6
Interest expenses 4.5 3.9 4.8 2.0 2.1 1.9 0.6 0.5 0.6
Net interest income 2.5 2.8 2.4 1.9 1.8 1.9 1.0 1.1 1.0
Non interest income 1.2 0.9 1.4 0.5 0.9 0.2 0.3 0.4 0.2
ROA 1.0 1.0 1.0 0.5 0.8 0.3 0.2 0.4 0.1
ROE 14.8 15.4 14.5 7.3 10.6 4.7 6.3 10.2 2.8
Leverage multiple 15.2 16.2 14.7 13.9 14.0 13.8 25.1 23.9 26.2
Equity-asset ratio 6.6 6.2 6.8 7.2 7.2 7.2 4.0 4.2 3.8
Total capital/RWA 6.7 6.1 7.3 12.9 11.6 14.3 9.0 8.3 9.7
RWA/total assets 55.3 58.8 51.8 57.4 62.3 52.5 56.2 62.9 49.5
Net loans, leases &mortgages 56.9 54.8 58.1 62.0 59.6 64.0 50.9 50.7 51.0
<KR> <MX> <NL>
Interest income on loans 4.3 4.4 4.2 0.6 0.4 0.7 2.1 1.7 2.5
Interest income on ex loans 1.0 0.9 1.0 9.2 12.0 7.3 1.7 1.8 1.6
Interest expenses 2.9 2.8 3.1 4.6 6.5 3.3 2.8 2.6 3.0
Net interest income 2.3 2.6 2.1 5.2 5.9 4.7 1.0 0.9 1.1
Non interest income 0.3 0.8 -0.1 0.6 1.5 0.0 0.3 0.7 0.0
ROA 0.7 1.1 0.4 1.8 2.5 1.4 0.3 0.4 0.2
ROE 11.4 16.4 6.8 15.6 18.5 13.1 8.7 12.0 5.6
Leverage multiple 15.8 15.4 16.2 8.4 7.5 9.2 28.1 30.3 26.0
Equity-asset ratio 6.3 6.5 6.2 11.9 13.4 10.9 3.6 3.3 3.8
Total capital/RWA 9.5 8.5 10.5 15.7 14.8 16.6 10.4 9.6 11.3
RWA/total assets 65.4 70.7 60.0 81.8 95.2 68.5 36.5 35.7 37.3
Net loans, leases & mortgages 68.5 68.8 68.3 44.9 53.5 39.2 56.1 51.8 60.9
<US>
Interest income on loans 1.0 0.2 1.6
Interest income on ex loans 3.2 4.6 2.0
Interest expenses 2.2 3.0 1.4
Net interest income 2.0 1.8 2.2
Non interest income 1.0 1.6 0.6
ROA 0.5 0.8 0.3
ROE 6.0 9.8 3.2
Leverage multiple 12.1 13.0 11.5
Equity-asset ratio 8.3 7.7 8.7
Total capital/RWA 14.6 12.7 16.5
RWA/total assets 72.6 76.0 69.1
Net loans, leases & mortgages 51.8 53.1 50.6
32
<Appendix Ⅱ> Impact of higher capital requirements on lending spreads by countries
(commercial banks, bp)
2005∼2010 2005∼2007 2008∼2010
Increase
in capital
ratio
No
change
in ROE
Fall in ROE
per 1pp No
change
in ROE
Fall in ROE
per 1pp No
change
in ROE
Fall in ROE
per 1pp
10bp 15bp 20bp 10bp 15bp 20bp 10bp 15bp 20bp
AU
1pp -2.7 -4.9 -6.0 -7.1 1.8 -0.3 -1.3 -2.4 -5.1 -7.3 -8.4 -9.4
2pp -5.4 -7.7 -8.8 -10.0 3.6 1.4 0.3 -0.7 -10.2 -12.5 -13.6 -14.7
3pp -8.1 -10.5 -11.7 -12.8 5.4 3.1 2.0 0.9 -15.3 -17.6 -18.8 -20.0
4pp -10.8 -13.3 -14.5 -15.7 7.2 4.8 3.7 2.5 -20.4 -22.8 -24.0 -25.3
5pp -13.5 -16.1 -17.3 -18.6 8.9 6.5 5.3 4.1 -25.5 -28.0 -29.3 -30.5
BR
1pp 19.3 16.4 15.0 13.6 23.6 20.6 19.1 17.6 16.4 13.6 12.2 10.8
2pp 38.6 35.5 33.9 32.4 47.2 44.0 42.3 40.7 32.8 29.8 28.3 26.8
3pp 57.9 54.6 52.9 51.2 70.8 67.3 65.6 63.8 49.3 46.0 44.4 42.7
4pp 77.2 73.6 71.8 70.0 94.4 90.7 88.8 86.9 65.7 62.2 60.5 58.7
5pp 96.5 92.7 90.8 88.9 118.0 114.0 112.0 110.0 82.1 78.4 76.5 74.7
CA
1pp 12.2 10.8 10.1 9.5 17.0 15.7 15.1 14.4 8.8 7.4 6.7 6.1
2pp 24.3 22.9 22.1 21.4 34.1 32.6 31.9 31.2 17.6 16.2 15.4 14.7
3pp 36.5 34.9 34.1 33.4 51.1 49.6 48.8 48.0 26.5 24.9 24.1 23.3
4pp 48.7 47.0 46.2 45.3 68.2 66.5 65.6 64.8 35.3 33.6 32.8 31.9
5pp 60.9 59.1 58.2 57.3 85.2 83.4 82.5 81.6 44.1 42.3 41.5 40.6
CH
1pp -4.8 -6.3 -7.1 -7.8 2.1 0.2 -0.8 -1.7 -10.6 -14.7 -16.8 -18.8
2pp -9.6 -11.2 -12.0 -12.8 4.1 2.1 1.1 0.1 -21.3 -25.6 -27.7 -29.9
3pp -14.4 -16.1 -16.9 -17.7 6.2 4.1 3.0 2.0 -31.9 -36.4 -38.6 -40.9
4pp -19.2 -21.0 -21.8 -22.7 8.3 6.1 4.9 3.8 -42.6 -47.2 -49.6 -51.9
5pp -24.0 -25.8 -26.8 -27.7 10.3 8.0 6.9 5.7 -53.2 -58.1 -60.5 -63.0
CN
1pp 20.5 18.5 17.6 16.6 19.6 17.5 16.5 15.4 20.9 19.1 18.2 17.3
2pp 40.9 38.8 37.8 36.8 39.3 37.0 35.8 34.7 41.9 39.9 38.9 37.9
3pp 61.4 59.1 58.0 56.9 58.9 56.4 55.2 54.0 62.8 60.7 59.6 58.5
4pp 81.8 79.4 78.2 77.0 78.5 75.9 74.6 73.3 83.7 81.4 80.3 79.1
5pp 102.3 99.7 98.4 97.2 98.1 95.3 93.9 92.5 104.7 102.2 101.0 99.8
DE
1pp -1.8 -2.8 -3.3 -3.8 0.5 -0.6 -1.2 -1.7 -3.8 -4.7 -5.1 -5.5
2pp -3.6 -4.7 -5.3 -5.8 0.9 -0.3 -0.9 -1.5 -7.7 -8.6 -9.1 -9.5
3pp -5.5 -6.7 -7.3 -7.9 1.4 0.0 -0.6 -1.3 -11.5 -12.5 -13.0 -13.5
4pp -7.3 -8.6 -9.2 -9.9 1.8 0.4 -0.3 -1.1 -15.4 -16.5 -17.0 -17.5
5pp -9.1 -10.5 -11.2 -11.9 2.3 0.7 -0.1 -0.8 -19.2 -20.4 -21.0 -21.6
ES
1pp 10.1 8.8 8.2 7.5 11.8 10.5 9.9 9.2 8.6 7.4 6.8 6.2
2pp 20.1 18.8 18.1 17.4 23.6 22.2 21.5 20.8 17.2 15.9 15.2 14.6
3pp 30.2 28.7 27.9 27.2 35.5 33.9 33.1 32.3 25.8 24.4 23.7 23.0
4pp 40.3 38.6 37.8 37.0 47.3 45.6 44.7 43.9 34.5 32.9 32.1 31.4
5pp 50.3 48.6 47.7 46.8 59.1 57.3 56.3 55.4 43.1 41.4 40.6 39.8
FR
1pp -1.6 -3.0 -3.7 -4.4 2.2 0.7 -0.1 -0.9 -4.0 -5.3 -6.0 -6.6
2pp -3.1 -4.7 -5.4 -6.2 4.5 2.8 1.9 1.1 -8.1 -9.5 -10.2 -10.9
3pp -4.7 -6.4 -7.2 -8.0 6.7 4.9 4.0 3.0 -12.1 -13.7 -14.4 -15.2
4pp -6.3 -8.1 -9.0 -9.9 9.0 7.0 6.0 5.0 -16.2 -17.8 -18.7 -19.5
5pp -7.9 -9.8 -10.7 -11.7 11.2 9.1 8.0 6.9 -20.2 -22.0 -22.9 -23.8

33
2005∼2010 2005∼2007 2008∼2010
Increase
in capital
ratio
No
change
inROE
Fall in ROE
per 1pp No
change
inROE
Fall in ROE
per 1pp No
change
inROE
Fall in ROE
per 1pp
10bp 15bp 20bp 10bp 15bp 20bp 10bp 15bp 20bp
GB
1pp 2.3 1.0 0.3 -0.4 10.5 9.3 8.7 8.1 -4.2 -4.0 -3.9 -3.8
2pp 4.6 3.1 2.4 1.7 20.9 19.6 19.0 18.3 -8.4 -8.2 -8.1 -7.9
3pp 6.9 5.3 4.5 3.7 31.4 30.0 29.3 28.6 -12.6 -12.3 -12.2 -12.1
4pp 9.1 7.5 6.6 5.8 41.9 40.3 39.6 38.8 -16.7 -16.5 -16.4 -16.3
5pp 11.4 9.6 8.7 7.8 52.3 50.7 49.9 49.1 -20.9 -20.7 -20.5 -20.4
IN
1pp 12.5 10.7 9.9 9.0 14.8 13.1 12.3 11.4 10.9 9.2 8.3 7.4
2pp 24.9 23.1 22.1 21.2 29.6 27.7 26.8 25.9 21.9 20.0 19.1 18.1
3pp 37.4 35.4 34.4 33.4 44.3 42.3 41.4 40.4 32.8 30.8 29.8 28.8
4pp 49.9 47.7 46.7 45.6 59.1 57.0 55.9 54.9 43.8 41.6 40.6 39.5
5pp 62.4 60.1 58.9 57.8 73.9 71.6 70.5 69.3 54.7 52.5 51.3 50.2
IT
1pp 1.2 -0.7 -1.6 -2.5 5.9 3.9 2.9 1.9 -1.8 -3.5 -4.3 -5.1
2pp 2.3 0.4 -0.6 -1.6 11.7 9.6 8.5 7.4 -3.6 -5.4 -6.3 -7.1
3pp 3.5 1.4 0.4 -0.7 17.6 15.3 14.1 13.0 -5.5 -7.3 -8.2 -9.2
4pp 4.7 2.4 1.3 0.2 23.4 21.0 19.7 18.5 -7.3 -9.2 -10.2 -11.2
5pp 5.9 3.5 2.3 1.1 29.3 26.7 25.4 24.0 -9.1 -11.2 -12.2 -13.3
JP
1pp 8.4 7.1 6.4 5.8 12.6 11.2 10.5 9.8 5.2 4.0 3.4 2.8
2pp 16.7 15.3 14.6 13.8 25.2 23.6 22.8 22.0 10.5 9.1 8.4 7.8
3pp 25.1 23.5 22.7 21.9 37.7 36.0 35.1 34.2 15.7 14.2 13.4 12.7
4pp 33.5 31.7 30.8 29.9 50.3 48.4 47.4 46.4 20.9 19.3 18.5 17.6
5pp 41.9 39.9 38.9 38.0 62.9 60.8 59.7 58.6 26.1 24.4 23.5 22.6
KR
1pp 7.0 5.7 5.0 4.3 15.1 13.7 13.0 12.3 0.5 -0.8 -1.4 -2.1
2pp 14.1 12.6 11.8 11.1 30.3 28.7 28.1 27.2 1.0 -0.4 -1.1 -1.8
3pp 21.1 19.5 18.7 17.9 45.4 43.7 42.9 42.1 1.5 0.0 -0.7 -1.5
4pp 28.1 26.4 25.5 24.7 60.6 58.7 57.8 56.9 2.0 0.4 -0.4 -1.2
5pp 35.1 33.3 32.4 31.4 75.7 73.7 72.8 71.8 2.6 0.8 0.0 -0.9
MX
1pp 16.8 13.0 11.1 9.2 22.3 18.4 16.5 14.6 11.6 8.0 6.2 4.4
2pp 33.5 29.5 27.5 25.5 44.6 40.5 38.4 36.4 23.2 19.3 17.4 15.5
3pp 50.3 46.1 43.9 41.8 66.9 62.5 60.3 58.2 34.8 30.7 28.7 26.7
4pp 67.1 62.6 60.3 58.1 89.2 84.5 82.2 79.9 46.3 42.1 39.9 37.8
5pp 83.9 79.1 76.7 74.4 111.5 106.6 104.1 101.7 57.9 53.4 51.2 48.9
NL
1pp -5.4 -4.8 -4.5 -4.2 1.2 0.2 -0.3 -0.8 -11.6 -12.3 -12.7 -13.1
2pp -10.8 -10.1 -9.8 -9.4 2.3 1.2 0.7 0.1 -23.2 -24.0 -24.4 -24.8
3pp -16.1 -15.4 -15.0 -14.7 3.5 2.3 1.7 1.1 -34.8 -35.7 -36.1 -36.6
4pp -21.5 -20.7 -20.3 -19.9 4.7 3.3 2.7 2.0 -46.4 -47.3 -47.8 -48.3
5pp -26.9 -26.0 -25.6 -25.2 5.8 4.4 3.7 3.0 -58.0 -59.0 -59.5 -60.0
US
1pp 6.2 3.4 1.9 0.5 13.1 10.4 9.0 7.7 1.5 -1.4 -2.9 -4.3
2pp 12.5 9.4 7.9 6.3 26.2 23.3 21.8 20.4 3.0 -0.1 -1.6 -3.2
3pp 18.5 15.5 13.8 12.2 39.3 36.2 34.7 33.1 4.5 1.3 -0.4 -2.0
4pp 25.0 21.5 19.8 18.1 52.4 49.1 47.5 45.8 6.1 2.6 -0.9 -0.9
5pp 31.2 27.6 25.7 23.9 65.5 62.0 60.3 58.5 7.6 3.9 2.1 0.3


