

THE LIMITS OF MARKET DISCIPLINE:PROPRIETARY TRADING AND AGGREGATE RISK†
SYLVAIN CHAMPONNOIS*
PRELIMINARY AND INCOMPLETE DRAFT
December 6, 2010
Abstract. In this paper we study the role of external claim-holders heterogeneity on en-
trepreneurial risk-taking incentives. Market discipline is the idea that entrepreneurs are
deterred from taking too much risk if the cost of capital adjusts to the level of risk. First, we
show how the risk-sensitivity of the capital (and therefore the efficiency of market discipline)
is positively correlated with aggregate risk-aversion. Second, we show that the risk-taking
by entrepreneurs and the demand for risky securities by risk-neutral investors (e.g. fund
managers or proprietary traders) are mutually reinforcing. Larger risk-neutral fund man-
agers (relative to risk-averse investors) not only undermine market discipline and lead to
more risk-taking, but they also benefit more from the upside (than risk-averse investors)
because risky securities represent a larger share of their portfolios. The model explains
documented features of the business cycle: bubble-like asset prices (procyclical run-up in
prices and procyclical underpricing of risk) and countercyclical leverage of the non-financial
sector.
* Rady School of Management, University of California, San Diego and Imperial College Business School,
London. Email: [email protected].
† I am grateful to Thomas Baranga and Konstantin Milbradt for helpful insights.
1

2
“We have also seen the emergence of a whole range of intermediaries, whose
size and appetite for risk may expand over the cycle. Not only can these inter-
mediaries accentuate real fluctuations, they can also leave themselves exposed
to certain small probability risks that their own collective behaviour makes more
likely. As a result, under some conditions, economies may be more exposed to
financial-sector-induced turmoil than in the past.” (Rajan, 2006).
In 2006, the issuance of non-agency mortgage-backed securities reached almost $920 , a
fourfold increase from 2001 in which it was $220 (see Figure 1).1 These securities turned
out ex-post to be very risky and underpriced, and arguably led to an increase in systemic
risk and caused the financial crisis of 2007-2009. Figure 2 shows the increase in the share of
assets by broker and dealer from the Flow of Funds data. While the true proprietary trading
firms – the hedge funds – are merged in the Flow of Funds data with households statistics,
the broker and dealer statistics provide an indication of the overall behavior of proprietary
trading behavior (e.g. Lehman Brothers generated 58% of revenues from proprietary trading
in 2006). 2 Should be we see the issuance of such risky securities as a failure of governance,
that is, a lack of monitoring, a failure to circulate information or a lack of coordination?
What role, if any, did proprietary traders play in fostering risk-taking? What is the role of
market discipline in preventing such run-ups in risk-taking? What can policy do?
In this paper we study the role of external claim-holders heterogeneity on entrepreneurial
risk-taking incentives. Market discipline is the idea that entrepreneurs are deterred from
taking too much risk if the cost of capital adjusts to the level of risk, for instance through
1Other events: in 2000, technology stocks; in 1997, emerging market stocks.2The decrease in the share of assets in 2008 is associated to huge the huge trading losses at investment
banks such Deutsche Bank, UBS, etc. The increase in the share of assets by brokers/dealers during “bubble”
episodes such as the 2005-2007 run-up (e.g. mortgage bonds in late 1980s before the Savings and Loan crisis,
1994 Mexican bubble and crisis). For an overview of the behavior of hedge funds in 2000, see Brunnermeier
and Nagel, 2004

3
Figure 1.
Global issuance of mortgage-related securities. Souces: Sifma.
010
020
030
040
050
0(in
bill
ion
US
$)
2000 2001 2002 2003 2004 2005 2006 2007 2008 2009
High Yield Investment GradeMixed Collateral OtherOther Swaps Structured Finance
Figure 2.
Share of broker/dealer assets in total US assets. The main episodes of variations are: in the mid 1980s, the
deregulation of the Savings and Loans sector allowed the trading of mortgage bonds which benefited broker/dealers until the
Savings and Loans crisis; the Mexican crisis in 1994 handed Goldman Sachs heavy losses; in the end of the 1990s,
broker/dealers were less exposed to the internet bubble than the general public and their share of assets shrunk until the
crash in 2000; in the mid 2000s, the balance-sheet of broker/dealers grew into real estate and credit derivatives until the
financial crisis in 2008. Sources: Flow of Funds (Federal Reserve).
0.0
05.0
1.0
15.0
2sh
are
of b
roke
r/de
aler
ass
ets
in to
tal U
S a
sset
s
01jan1985 01jan1990 01jan1995 01jan2000 01jan2005 01jan2010
4
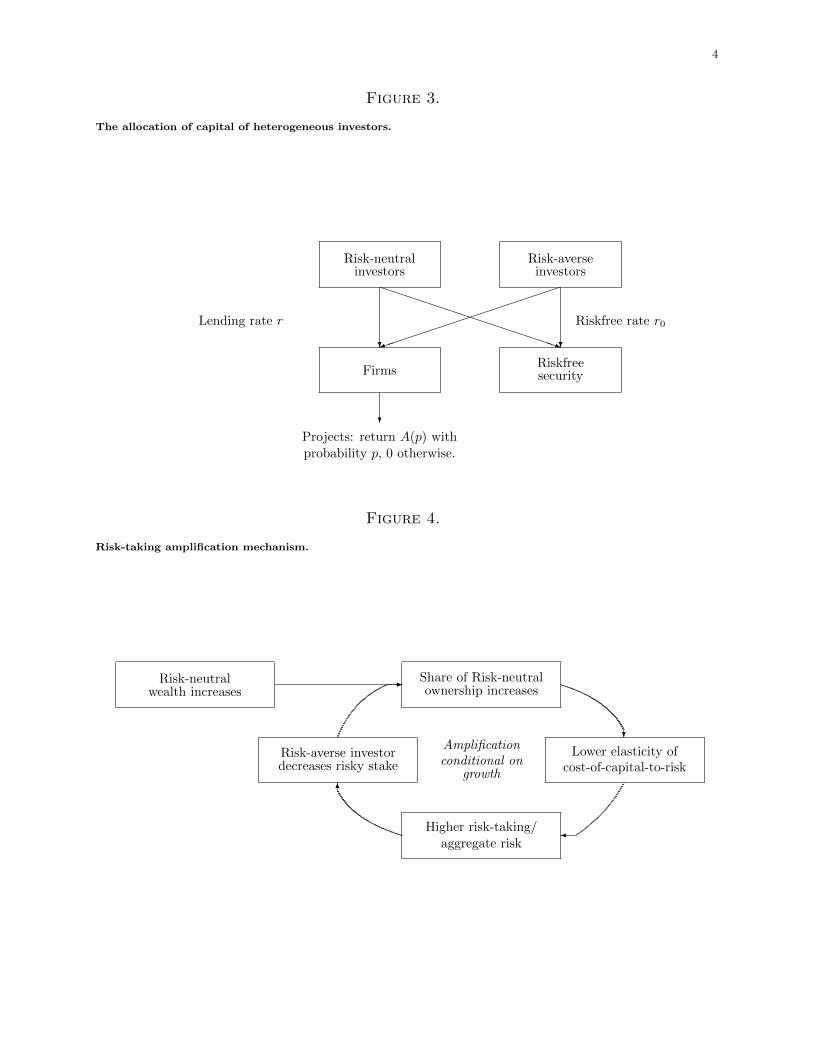
Figure 3.
The allocation of capital of heterogeneous investors.
Risk-neutralinvestors
Risk-averseinvestors
? ?
PPPPPPPPPPPPPPq
��������������)
FirmsRiskfreesecurity
Lending rate r Riskfree rate r0
?
Projects: return A(p) withprobability p, 0 otherwise.
Figure 4.
Risk-taking amplification mechanism.
Share of Risk-neutralownership increases
?
Lower elasticity ofcost-of-capital-to-risk
�Higher risk-taking/aggregate risk
6
Risk-averse investordecreases risky stake
-Risk-neutralwealth increases
-
Amplificationconditional on
growth

5
the regular issuance of risk-sensitive securities, equity or subordinated debt (Flannery, 2001).
First, we show how the risk-sensitivity of the capital (and therefore the efficiency of market
discipline) is positively correlated with aggregate risk-aversion. Second, we show that the
risk-taking by entrepreneurs and the demand for risky securities by risk-neutral investors (e.g.
fund managers or proprietary traders) can become mutually reinforcing. Larger risk-neutral
investors (relative to risk-averse investors) not only undermine market discipline and lead
to more risk-taking, but they also benefit more from the upside (than risk-averse investors)
because risky securities represent a larger share of their portfolios. The model explains
documented features of the business cycle: bubble-like asset prices (procyclical run-up in
prices and procyclical underpricing of risk) and countercyclical leverage of the non-financial
sector.3 Third, we study the effect of policy on risk-taking. In particular, we show that
interest-rate policy can induce (rather than deter) risk-taking.
The setup is as follows. There are an infinitely-lived risk-averse investor and a risk-neutral
fund manager (with a binding capital-ratio constraint) who provide funds to a penniless
entrepreneur who has access to a set of projects with different risk characteristics. The
model endogenize the risk-taking decisions of entrepreneurs as in Allen and Gale (2004);
Boyd and De Nicolo (2005); Martinez-Miera and Repullo (2009). All securities are correctly
risk-adjusted (no mispricing, no behavioral types).4 The main contribution of this paper
is to highlight a risk amplification mechanism in this context (Figure 4). If the wealth of
3Kiyotaki and Moore (1997) describe collateral-driven cycles (see also He and Krishnamurthy (2008) and
Brunnermeier and Pedersen (2009) for the role of varying margins). In this paper we focus on long-only
investors. Abreu and Brunnermeier (2003) study exogenous price divergence from fundamentals. Allen and
Gale (2000); Challe and Ragot (2010) study endogenous bubbles due to the fixed supply of certain securities.
In this paper, the “divergence” from fundatementals is endogenous and the consequence of demand for assets
from risk-averse investors and risk-neutral fund managers in a production economy with an equilibrium
supply of risky security.4In Xiong (2001), arbitrageurs’s wealth matters for the risk premium because arbitrageurs (ie. conver-
gence traders) can absorb some of the fluctuations created by noise traders by trading against them (and

6
risk-neutral investors is small (relative to risk-averse ones), their share of ownership of the
firm is small too, the elasticity of cost of capital to risk is high and the entrepreneur chooses a
projects with a low (but positive) risk yielding a positive return with a high probability. Since
the the risky project represents a higher share of the portfolio of the risk-neutral investor
(than the risk-averse investor), the relative wealth of the risk-neutral investors increase,
leading to a higher ownership of the firm. In this case, the elasticity of the cost of capital
decreases, the entrepreneur chooses a riskier project than before and the risk-averse investor
rebalances his portfolio into the riskfree asset. As long as the project generates positive
returns, the stake of the risk-neutral investors increases and aggregate risk increases.5
I. Related literature
I.1. Corporate governance with heterogeneous claim-holders. There is a large liter-
ature on corporate governance studying how the ownership structure affects the investment
decisions of a firms. The question is how to give incentives to shareholders and investors
to exert control and monitor, for instance through the production of information (Faure-
Grimaud and Gromb, 2004). The higher the stake, the easier it is to provide such incentives,
but there are liquidity cost to having a large stake (Bolton and Von Thadden, 1998). In
this paper, we abstract from informational asymmetries to focus on the relation between the
price of external financing and the risk-taking incentives. If the largest potential shareholder
is very risk-averse, the entrepreneur will have an incentive to chose a safe project to raise
as much capital as possible from him. More generally, the relative size of investors with
different risk-aversion will determine aggregate risk.
occasionally amplifying the fluctuations when the wealth shocks are large enough). In this model, all agents
has long positions, there are no noise traders and there is no mispricing.5To prevent one type to dominate the economy (and a degenerate asymptotic cross-sectional distribution
of wealth), we set the parameters so that the relative wealth of risk-neutral arbitrageurs is a random-walk.

7
I.2. Asset pricing with time-varying risk-aversion in the aggregate. The asset pric-
ing properties of models in which agents have different risk-aversion parameters carries over
to this model (Dumas, 1989; Wang, 1996; Longstaff and Wang, 2008; Weinbaum, 2009). In
particular, the risk-tolerant agent holds a higher proportion of its wealth into the firm, so
that when the entrepreneur cannot repay, it reduces the fraction of aggregate wealth con-
trolled by him and hence reduce its contribution to the aggregate risk aversion. Such logic
explains why there is a negative correlation between risky return and the risk premium. One
contribution of this paper is to endogenous the supply of securities. In particular, when the
risk premium is low, this is precisely when entrepreneurs want to issue risky securities, which
links the issuance of risky securities to the aggregate risk-aversion and risk premia.
I.3. Aggregate risk and policy. This argument in Acemoglu and Zilibotti (1997) is that
growth and wealth accumulation decrease the volatility of the economy. In this paper, we
focus the 2007-2009 financial turmoil that centered on developed economies by showing how
the accumulation of wealth in certain parts of the financial sector might be destabilizing. A
large literature has looked at the consequences of technological waves on the real economy
and the financial sector (Jovanovic and Rousseau, 2003). The uncertainty associated to
the new technology or the financial innovation generates learning which might lead to an
amplification of the business cycle with booms and crashes (Barbarino and Jovanovic, 2007;
Hobijn and Jovanovic, 2001; Biais, Rochet, and Wolley, 2009). Another view is that booms
and bust are not caused primarily by exogenous technology shocks, but by the demand
for risky securities from risk-tolerant intermediaries. The emergence of new entities such
as private equity and hedge funds as very large players on financial markets might have
increased not only the risk-bearing capacity of the economy but also the issuance of risky
securities.6
6See also Philippon (2008) for theory and evidence on the equilibrium between the demand and supply of
financial services.

8
The supply of capital from the risk-averse investor is “risk-sensitive”: it decreases as risk
increases and returns go down, thereby disciplining the entrepreneur into choosing safer
projects and charging a lower markup. As the size of the fund increases, the share of
“risk-averse” capital decreases, undermining the market discipline, leading to riskier projects
(with higher productivity but a lower chance of success) and increasing the probability of a
recession. The markups charged by the entrepreneur also increase over the cycle, leading to
an underpricing of risk. Since the markup increases, the leverage of the non-financial sector
is counter-cyclical (while by assumption, the leverage of the fund is kept constant).
The literature discusses in particular are prudential or monetary policy can supplement
market discipline. In this environment, we study the role of interest-rate policy and of pru-
dential regulation. The channel of monetary policy in this model is due to the portfolio
rebalancing of the risk-averse investors (credit channel). When the monetary policy is tight-
ened and the central bank increases the riskfree rate, it induces the risk-averse investor to
rebalance its portfolio towards the riskfree securty and therefore undermines the market dis-
cipline by increasing the importance of the risk-tolerant fund manager for the decisions of the
entrepreneur. Similar to Adrian and Shin (2010), we show that in fact monetary policy can
induce (and not deter) risk-shifting. As in Bordo and Jeanne (2002), monetary policy can
play a role in smoothing fluctuations. If one thinks that fluctuations generates a large welfare
cost, then the optimal policies are those that keep constant the share of risk-tolerant equity
in the firm. For example, a money-supply neutral policy (with a countercyclical interest-
rate policy) lowers the riskfree rate as the size of the fund manager increases relative to the
risk-averse investor) and incentivizes the risk-averse investor not to rebalance its portfolio
as the size of the risk-neutral fund manager increases. Equivalently, prudential regulation
with procyclical capital requirement could prevent the fund manager from taking over the
ownership of the firm.

9
II. Model
There are two infinitely-lived agents, a risk-averse investor with log-utility and a risk-
neutral fund manager. The risk-averse investor maximizes
U = maxE0
∑βt log ct.
With probability δ, the risk-neutral investor is forced to consume 1− θ of the funds wealth
in a given period. Under this constraint he maximizes
V = maxE0
∑βtc∗t .
The two investors consume a single good and have access to two investment opportunities.
They can invest in a riskfree security return r0 and capital requirements force the fund
manager to put at least a share ω is the riskfree security. The investor and the fund manager
can invest in a risky project project that pays r with probability p or zero otherwise. The
project is chosen and run by a risk-neutral entrepreneur, who lives for one-period. More
specifically, he chooses among constant-return projects in which the productivity a(p) of a
given project is itself a function of the probability p. Projects with a higher probability of
generating revenues have a lower productivity (ie. a(p) is a decreasing function).
The timing is as follows in a given period. The entrepreneur chooses a project with a
probability p and productivity a(p) and proposes a rate r to external investors. Given the
return r and risk p of the project, the risk-averse investor and the fund manager make
their portfolio decisions. The project generates revenues or not and external claimants
are repaid. When the risk-averse investor and the risk-neutral fund manager makes their
portfolio decisions, they take the returns as given, which gives the entrepreneur some market
power in making the investment decision.7
7Since the entrepreneur has market power, the equilibrium allocation is different from the planner’s
allocation (Dumas and Maenhout, 2002; Wang, 1996).

10
An important consequence of the timing is that external claimants cannot condition their
financing on the risk-profile of the project. But ex-post, they decide how much financing to
provide if they think the project is too risky which provides some market discipline.
II.1. Supply of capital. The consumption and portfolio decisions are considerably simpli-
fied by the assumption on risk-preference (log utility and risk-neutral utility).
Lemma 1 (consumption decisions). The risk-averse investor consumes a constant fraction
(1−β) of its wealth at the beginning of the period. The risk-neutral fund manager consumes
the exogenous fraction 1− θ when it is forced to (with probability δ) and otherwise saves all
his wealth.
If 〈pt, rt, yt, xt〉 are the probability of growth, the return of the risky project, the savings
of the risk-averse investor and the capital invested in the project by the risk-neutral fund
manager, we have
Lemma 2 (portfolio decisions). If ptrt ≥ r0, the the risk-averse investors puts K(rt, pt) =
ptyt − r0yt(1−pt)rt−r0 into the risky project and yt −K(rt, pt) into the riskfree security. The risk-
neutral fund manager invests all his savings in the risky project.
Note that K(r, p) is increasing concave in r and increasing in p. The dynamics are
yt+1 =
βptrtyt w.p pt
β yt(1−pt)r0rtrt−r0 w.p 1− pt
; xt+1 =
xt(ωr0 + (1− ω)rt) w.p pt(1− δ)
θxt(ωr0 + (1− ω)rt) w.p ptδ
xtωr0 w.p (1− pt)(1− δ)
θxtωr0 w.p (1− pt)(1− δ)
II.2. Demand for capital. In this section only, we omit the subscript t. The profit of the
entrepreneur is p[a(p)− r][x + K(r, p)] and the first-order conditions of in the return r and

11
the probability of growth p are
a− rr
=1
∂ log(x+K(r,p))∂ log r
−pa′(p)
a− r= 1 +
∂ log[x+K(r, p)]
∂ log p
The first equation is the usual relation between markups and the elasticity of capital supply
in monopolistic models: the markup of the entrepreneur is smaller when the supply of capital
is more elastic in the return r. The second equation relates the elasticity of productivity
and to market discipline and the elasticity of capital supply relative to risk: the productivity
elasticity (relative to risk) is convex and risk is higher if there is less market discipline (that is,
if the supply of capital is more elastic relative to risk). The entrepreneur increases increases
until the decrease in the supply of capital has a higher cost than the benefit of an increase
in productivity. Under the condition a−r0r0≥ y(1−p)
x+py, the condition first equation implies
a−ra−r0 = x+k
x+py= 1−
√r0y(1−p)
(a−r0)(x+py).
The equilibrium depends on one unique state variable z = xy
defined as the ratio of
the wealths of risk-neutral fund manager and risk-averse investor. The following Lemma
characterizes the equilibrium aggregate risk.
Lemma 3. With θ = − pa′
a−r0 , the equilibrium probability of growth p is decreasing in the fund
manager’s relative wealth and in the riskfree rate r0
θ = 1 +p
z + p+
√r0(1− p)
(a− r0)(z + p)
(p
1− p− 1
)
Corollary 1 (Market discipline). The elasticity of the supply of capital ∂ log[x+K(r,p)]∂ log p
and the
elasticity of the cost to risk −∂ log(r−r0)∂ log p
are positive, decreasing in the fund manager’s relative
wealth z and increasing in the probability of growth p.
II.3. Special case: productivity linear in risk.

12
Assumption 1. We assume that productivity is linear in the probability of growth p: p ∈
[1/2, 1], a = 1− p.
Lemma 4. The equilibrium risk P (z) is decreasing in z (and r0) and is determined by
p
1− p− r0
= 1 +p
z + p+ (2p− 1)
√r0
(1− p− r0)(1− p)(z + p)(2.1)
Moreover, P (+∞) = 1−r02
.
Proof. Property: When z = 14r0− 1, then p = 1
2 and r = z+24(z+1) = 1+4r0
4 . �
A direct consequence is that the Sharpe ratio√
p1−p is decreasing in z and in r0.
Corollary 2. Properties of the equilibrium
• the productivity-adjusted return is decreasing in z and increasing in r0
R(z)
a=
(1− P (z))− (1− P (z)− r0)(
1−√r0(1− P (z))(1− P (z)− r0)(z + P (z))
)1− P (z)
• the market price of risk is the marginal utility of the risk-averse investor yr0k0+rk
=
1P (z)R(z)
and is increasing in z and decreasing in r0.
• the leverage of the firm is aa−r and is decreasing in z and increasing in r0.
When the fund relative size increases, risk increases (the probability of growth p decreases),
the return to the investor goes down (r decreases, the sharpe ratio decreases) so that risk is
“underpriced”.
II.4. Dynamics.
Lemma 5. The expectation of next period state variable zt+1 is
E(zt+1) = zt(1− δ) + δθ
β
Assumption 2. We assume ω ≤ 1+r02
13
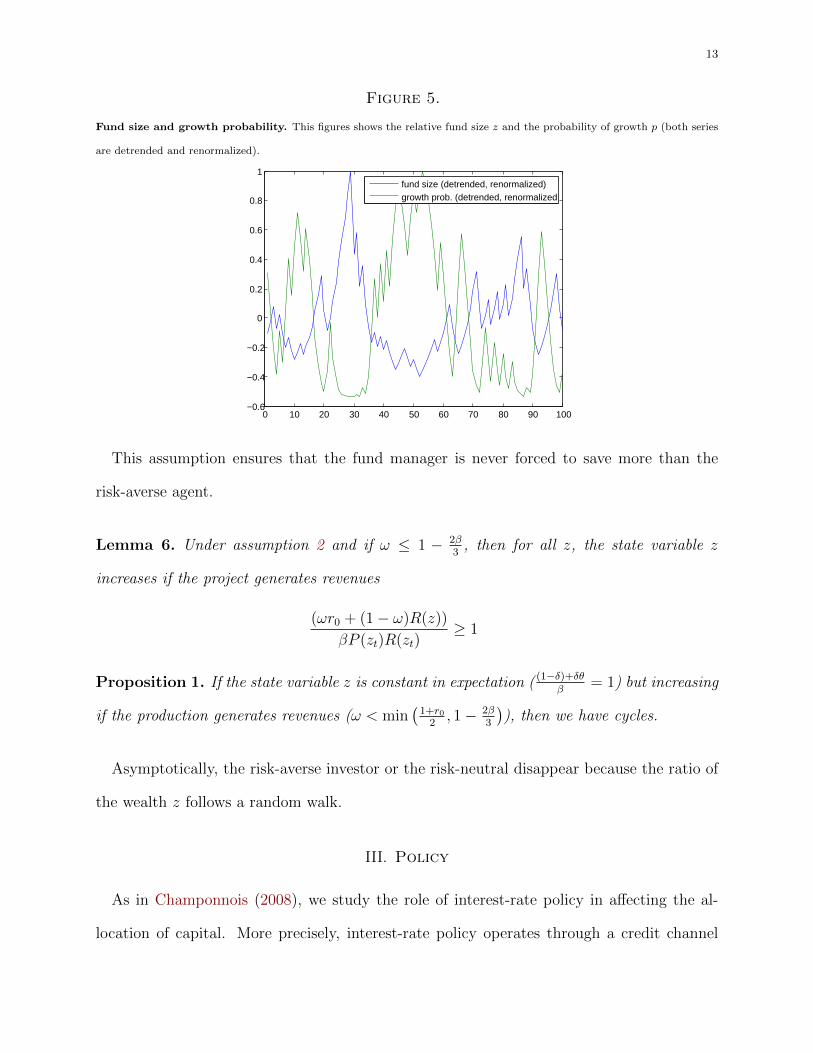
Figure 5.
Fund size and growth probability. This figures shows the relative fund size z and the probability of growth p (both series
are detrended and renormalized).
0 10 20 30 40 50 60 70 80 90 100−0.6
−0.4
−0.2
0
0.2
0.4
0.6
0.8
1
fund size (detrended, renormalized)growth prob. (detrended, renormalized
This assumption ensures that the fund manager is never forced to save more than the
risk-averse agent.
Lemma 6. Under assumption 2 and if ω ≤ 1 − 2β3
, then for all z, the state variable z
increases if the project generates revenues
(ωr0 + (1− ω)R(z))
βP (zt)R(zt)≥ 1
Proposition 1. If the state variable z is constant in expectation ( (1−δ)+δθβ
= 1) but increasing
if the production generates revenues (ω < min(
1+r02, 1− 2β
3
)), then we have cycles.
Asymptotically, the risk-averse investor or the risk-neutral disappear because the ratio of
the wealth z follows a random walk.
III. Policy
As in Champonnois (2008), we study the role of interest-rate policy in affecting the al-
location of capital. More precisely, interest-rate policy operates through a credit channel

14
of monetary policy in which higher interest rates lead to a rebalancing of the portfolio of
agents.
Corollary 3. An increase of riskfree rate r0 by the monetary authority increases aggregate
risk in the economy.
In this model, a higher riskfree rate leads the risk-averse investor to have a lower share of
the ownership of the project which, in turn, undermine market discipline and induces the
entrepreneur to choose riskier projects.
IV. Conclusion
Extensions
• risk-averse hedge fund manager (but still more risk-tolerant than the investors)
• external financing for hedge funds
• several-asset model
V. Appendix: Proofs
Proof of Lemma 2. The value function of an infinitely-lived agent with log utility is V (y) = a+ b log(y).
The first-order condition ∂k is then
p
r0k0 + rk=
1
ry⇔ k = py − r0(y − k)
r
and using k0 = y − k, we find the supply of capital.
Proof of Lemma 3. The first-order conditions are
∂r :(a− r0)r0y(1− p)
(r − r0)2= x+ py
∂p : (a− r)(x+ k) + py
(r
r − r0
)(a− r) = −pa′(x+ k)

15
where k = K(r, p) = py − (1−p)r0yr−r0 . The condition ∂p can be written as
θ = 1−
√r0y(1− p)
(a− r0)(x+ py)+
py
x+ py
1 +r0
(a− r0)√
r0y(1−p)(a−r0)(x+py)
= 1 +
py
x+ py+
√r0y(1− p)
(a− r0)(x+ py)
(p
1− p− 1
)
Two remarks
• When r0 = 0, then π = p(x + py)a. A necessary condition for the risk choice p to be decreasing in
x/y is that the elasticity −pa′(p)a(p) is increasing.
– The first-order condition is −pa′(p)a = 1+ py
py+x . The right-hand side is increasing in p, decreasing
in x. The solution p(x) is decreasing in x if the left-hand side crosses the right-hand side from
below.
• The condition pr ≥ r0 is satisfied if θ ≥ aa−r0 ⇔ −
pa′
a > 1. This last condition imposes that the
expected productivity pa is always decreasing. Rewriting with z = xy , we get
(θ − 1)(z + p)−√z + p(2p− 1)
√r0
(1− p)(a− r0)− p = 0
There exists a positive z solution to this equation if and only if
2 + (2p− 1)
√r0
p(1− p)(a− r0)≥ θ (5.1)
If this condition is satisfied,
√z + p =
(2p− 1)√
r0(1−p)(a−r0) +
√(2p− 1)2 r0y
(1−p)(a−r0) + 4p(θ − 1)
2(θ − 1)√r0y(1− p)
(a− r0)(x+ py)=
√r0(1− p)(a− r0)
√
(2p− 1)2 r0(1−p)(a−r0) + 4p(θ − 1)− (2p− 1)
√r0
(1−p)(a−r0)
2p
pr
r0− 1 =
√
(2p− 1)2 + 4(1−p)p(θ−1)(a−r0)r0
− 1
2

16
Proof of Corollary 1. We have
∂ log(√
r0y(1−p)(a−r0)(x+py)
)∂ log p
=1
2
(−pa
′(p)
a− r0− p
1− p− p
p+ z
)
=1
2
[1 +
p
p+ z+
√r0y(1− p)
(a− r0)(x+ py)
(p
1− p− 1
)− p
1− p− p
p+ z
]
= −1
2
(1−
√r0y(1− p)
(a− r0)(x+ py)
)(p
1− p− 1
)< 0
Since x+kx+py = 1−
√r0y(1−p)
(a−r0)(x+py) , the elasticity of the supply of capital is positive and decreasing in z
∂ log(x+ k)
∂ log p=
p
p+ z+
1
2
√r0(1− p)
(a− r0)(z + p)
(p
1− p− 1
)> 0
and the elasticity of the cost of capital to risk is positive and decreasing in z
−∂ log(r − r0)
∂ log p= −pa
′(p)
a− r0+
1
2
(1−
√r0y(1− p)
(a− r0)(x+ py)
)(p
1− p− 1
)
= 1 +p
z + p+
3
2
√r0(1− p)
(a− r0)(z + p)
(p
1− p− 1
)> 0
Moreover
∂2 log(x+ k)
∂ log p2=
pz
(p+ z)2+
p2
2(1− p)2
√r0(1− p)
(a− r0)(z + p)− ...
...− 1
4
(p
1− p− 1
)2√
r0(1− p)(a− r0)(z + p)
(1−
√r0(1− p)
(a− r0)(z + p)
)
=pz
(p+ z)2+
√r0(1− p)
(a− r0)(z + p)
[p2
2(1− p)2− 1
4
(p
1− p− 1
)2]
︸ ︷︷ ︸>0
+1
4
(p
1− p− 1
)2r0(1− p)
(a− r0)(z + p)
and
−∂2 log(r − r0)
∂ log p2=
pz
(z + p)2+
3
2
√r0(1− p)
(a− r0)(z + p)
[p2
(1− p)2− 1
2
(p
1− p− 1
)2
+1
2
(p
1− p− 1
)2√
r0(1− p)(a− r0)(z + p)
]> 0
Proof of Lemma 5. The expected value of next period state variable is
βE(zt+1)
zt= P (zt)(1− δ)
(ωr0 + (1− ω)R(z))
P (zt)R(zt)+ P (zt)δ
θ(ωr0 + (1− ω)R(z))
P (zt)R(zt)+ ...
...+ (1− P (zt))(1− δ)ωr0
(1− P (zt))R(zt)r0R(zt)−r0
+ (1− P (zt))(1− δ)θωr0
(1− P (zt))R(zt)r0R(zt)−r0
= (1− δ) (ωr0 + (1− ω)R(z))
R(zt)+ δ
θ(ωr0 + (1− ω)R(z))
R(zt)+ (1− δ)ω(R(zt)− r0)
R(zt)+ δ
θω(R(zt)− r0)
R(zt)
= (1− δ) + δθ

17
Proof of Lemma 6. The ratio (ωr0+(1−ω)R(z))βP (zt)R(zt)
is increasing in z. When r0 = 0, this ratio is equal to 1
if and only if w = 1 − 2β3 . So whenever r0 > 0 (the risk-averse investor puts more money in the riskfree
security) and w < 1− 2β3 , the risk-neutral fund manager puts less money in the riskfree security, the rate of
growth of z increases.
References
Abreu, D., and M. Brunnermeier (2003): “Bubbles and Crashes,” Econometrica, 71, 173–2004.
Acemoglu, D., and F. Zilibotti (1997): “Was Prometheus Unbound by Chance? Risk, Diversification,
and Growth,” Journal of Political Economy, 105, 709–751.
Adrian, T., and H. Shin (2010): “Liquidity and Leverage,” Journal of Financial Intermediation, 19,
418–437.
Allen, F., and D. Gale (2000): “Bubbles and Crisis,” Economic Journal, 110, 236–255.
(2004): “Competition and Stability,” Journal of Money, Credit and Banking, 36, 453–480.
Barbarino, A., and B. Jovanovic (2007): “Shakeouts and Market Crashes,” International Economic
Review, 48, 385–420.
Biais, B., J. Rochet, and P. Wolley (2009): “The Lifecycle of the Financial Sector and Other Specu-
lative Industries,” .
Bolton, P., and E.-L. Von Thadden (1998): “Blocks, Liquidity, and Corporate Control,” Journal of
Finance, 53, 1–25.
Bordo, M., and O. Jeanne (2002): “Monetary Policy and Asset Prices: Does Benign Neglect Make
Sense,” International Finance, 5, 139–164.
Boyd, J., and G. De Nicolo (2005): “The Theory of Bank Risk Taking and Competition Revisited,”
Journal of Finance, 60, 1329–1343.
Brunnermeier, M., and S. Nagel (2004): “Hedge Funds and the Technology Bubble,” Journal of
Finance, 59, 2013–2040.
Brunnermeier, M., and L. Pedersen (2009): “Market Liquidity and Funding Liquidity,” Review of
Financial Studies, 22, 2201–2238.
Challe, E., and X. Ragot (2010): “Bubbles and Self-fulfilling Crises,” .
Champonnois, S. (2008): “Comparing Financial Systems: A Structural Analysis,” mimeo, UCSD.

18
Dumas, B. (1989): “Two-Person Dynamic Equilibrium in the Capital Market,” Review of Financial Studies,
2, 157–188.
Dumas, B., and P. Maenhout (2002): “A Central Planning Approach to Incomplete-Market Equilib-
rium,” .
Faure-Grimaud, A., and D. Gromb (2004): “Public Trading and Private Incentives,” Review of Finan-
cial Studies, 17, 985–1014.
Flannery, M. (2001): “The Faces of Market Discipline,” Journal of Financial Services Research, 20, 107–
119.
He, Z., and A. Krishnamurthy (2008): “A Model of Capital and Crisis,” NBER Working Paper No.
14366.
Hobijn, B., and B. Jovanovic (2001): “The Information-Technology Revolution and the Stock Market,”
American Economic Review, 91, 1203–1220.
Jovanovic, B., and P. Rousseau (2003): “Two Technological Revolutions,” EEA Papers and Proceedings.
Kiyotaki, N., and J. Moore (1997): “Credit Cycles,” Journal of Political Economy, 105, 211–248.
Longstaff, F., and J. Wang (2008): “Asset Pricing and the Credit Market,” .
Martinez-Miera, D., and R. Repullo (2009): “Does Competition Reduce the Risk of Bank Failure?,”
mimeo, CEMFI.
Philippon, T. (2008): “The Evolution of the US Financial Industry from 1860 to 2007: Theory and
Evidence,” mimeo, NYU.
Rajan, R. (2006): “Has Financial Development Made the World Riskier?,” European Financial Manage-
ment, 12, 499–533.
Wang, J. (1996): “The Term Structure of Interest Rates in a Pure Exchane Economy with Heterogeneous
Investors,” Journal of Financial Economics, 41, 75–110.
Weinbaum, D. (2009): “Investor Heterogeneity, Asset pricing and Volatility Dynamics,” Journal of Eco-
nomic Dynamics and Control, 33, 1379–1397.
Xiong, W. (2001): “Convergence Trading with Wealth Effects: An Amplification Mechanism in Financial
Markest,” Journal of Financial Economics, pp. 247–292.


