

THE LINKAGE BETWEEN STOCK MARKET
RETURNS OF SINGAPORE AND OTHER ASEAN-5
COUNTRIES.
LAU YEE YONG
LIM WIN LY
NEOH EE TIEN
OOI YEE MING
TEE PEI ROU
BACHELOR OF FINANCE (HONS)
UNIVERSITY TUNKU ABDUL RAHMAN
FACULTY OF BUSINESS AND FINANCE
DEPARTMENT OF FINANCE
AUGUST 2017

LAU, LIM, NEOH, OOI & TEE STOCK MARKET BFN (HONS) AUGUST 2017

The Linkage between Stock Market Returns of Singapore and Other ASEAN-5 Countries
Undergraduate Research Project i Faculty of Business and Finance
THE LINKAGE BETWEEN STOCK MARKET RETURNS
OF SINGAPORE AND OTHER ASEAN-5 COUNTRIES.
BY
LAU YEE YONG
LIM WIN LY
NEOH EE TIEN
OOI YEE MING
TEE PEI ROU
A research project submitted in partially fulfilment of the
requirement for the degree of
BACHELOR OF FINANCE (HONS)
UNIVERSITY TUNKU ABDUL RAHMAN
FACULTY OF BUSINESS AND FINANCE
DEPARTMENT OF FINANCE
AUGUST 2017

The Linkage between Stock Market Returns of Singapore and Other ASEAN-5 Countries
Undergraduate Research Project ii Faculty of Business and Finance
Copyright @ 2017
ALL RIGHTS RESERVED. No part of this paper may be reproduced, stored in a
retrieval system, or transmitted in any form or by any means, graphic, electronic,
mechanical, photocopying, recording, scanning, or otherwise, without the prior consent
of the authors.

The Linkage between Stock Market Returns of Singapore and Other ASEAN-5 Countries
Undergraduate Research Project iii Faculty of Business and Finance
DECLARATION
We hereby declare that:
(1) This undergraduate research project is the end result of our own work and that due
acknowledgement has been given in the references to ALL sources of information be
they printed, electronic, or personal.
(2) No portion of this research project has been submitted in support of any application
for any other degree or qualification of this or any other university, or other institutes of
learning.
(3) Equal contribution has been made by each group member in completing the research
project.
(4) The word count of this research report is 23722 words.
Name of Student: Student ID: Signature:
1. LAU YEE YONG 14ABB06828
2. LIM WIN LY 14ABB04658
3. NEOH EE TIEN 14ABB06243
4. OOI YEE MING 14ABB06244
5. TEE PEI ROU 14ABB06827
Date : ___________

The Linkage between Stock Market Returns of Singapore and Other ASEAN-5 Countries
Undergraduate Research Project iv Faculty of Business and Finance
ACKNOWLEDGEMENT
First and foremost, we would like to express our sincere gratitude to our supervisor, Ms.
Josephine Kuah Yoke Chin for giving us this treasure opportunity and supports in
overseeing our research. We would like to deliver thousands of thanks to her who are
always patient in listening to the problems we encountered while doing this final year
project. She had provided us a clear direction and outline from the beginning until the
end of our research project. We are extremely grateful to have our project done under
her invaluable time, guidance and expertise.
Apart from that, we would like to deliver out appreciation for the infrastructures and
facilities provided by Universiti Tunku Abdul Rahman (UTAR). Without those
facilities, we are unable to acquire the data, journal articles and information required in
conducting our research.
Last but not least, we would like to thank our friends, course mate and parents for their
guidance and encouragement throughout the duration of accomplishment of this final
year project. Their dedications are gratefully acknowledged, together with the sincere
apologies to those we have inadvertently failed to mention.

The Linkage between Stock Market Returns of Singapore and Other ASEAN-5 Countries
Undergraduate Research Project v Faculty of Business and Finance
DEDICATION
Firstly, we would like to dedicate our research project to our beloved supervisor, Ms.
Josephine Kuah Yoke Chin for her sincere guidance, advice, valuable supports
throughout the completion of this research.
Next, we would like to dedicate our research to our respective family members and
friends as an appreciation of their encouragement in completing this research and share
our achievements with them.
Last but not least, this research would also like to dedicate to the potential researchers
in assisting them in their future studies.
The Linkage between Stock Market Returns of Singapore and Other ASEAN-5 Countries
Undergraduate Research Project vi Faculty of Business and Finance
TABLE OF CONTENT
Page
Copyright……………….……………….……………….………………............ ii
Declaration…………….……………….……………….……………….............. iii
Acknowledgement…………….……………….……………….……………….. iv
Dedication…………….……………….……………….………………............... v
Table of Content…………….……………….……………….…………………. vi
List of Tables…………….……………….……………….……………….......... x
List of Figures…………….……………….……………….………………......... xi
List of Abbreviations…………….……………….……………….…………….. xii
List of Appendices…………….……………….……………….……………….. xv
Preface…………….……………….……………….……………….................... xvi
Abstract…………….……………….……………….………………................... xvii
CHAPTER 1 : RESEARCH OVERVIEW……………………………………… 1
1.0 Introduction…………….……………….……………….……………. 1
1.1 Research Background…………….……………….……………….….. 1
1.1.1 Background of Singapore’s Stock Market…………………….. 3
1.1.2 Background of Malaysia’s Stock Market……………………… 5
1.1.3 Background of Indonesia's Stock Market…………….……….. 7
1.1.4 Background of Thailand's Stock Market…………….………… 8
1.1.5 Background of The Philippines' Stock Market………………... 9
1.2 Problem Statement…………….…………………….………………... 11
1.3 Research Questions…………….…………………….……………….. 14
1.4 Research Objectives…………….…………………….………………. 15
1.4.1 General Objectives…………….…………………….………… 15
1.4.2 Specific Objectives…………….…………………….………... 15
1.5 Hypotheses of Study…………….…………………….………………. 16
1.5.1 Malaysian Stock Market Return (Kuala Lumpur Composite
Index, KLCI) …………….…………………….……………… 16
1.5.2 Indonesian Stock Market Return (Jakarta Composite Index,
JCI)….. …………….…………………….…………………….
17
The Linkage between Stock Market Returns of Singapore and Other ASEAN-5 Countries
Undergraduate Research Project vii Faculty of Business and Finance
1.5.3 Thailand Stock Market Return (Stock Exchange of Thailand
Index, SET) …………….…………………….……………….. 17
1.5.4 Philippines Stock Market Return (Philippine Stock Exchange
Index, PSEI) …………….…………………….………………. 18
1.6 Significance of Study…………….…………………….……………… 19
1.6.1 Stock Investors…………….…………………….…………….. 19
1.6.2 Fund Managers…………….…………………….…………….. 19
1.6.3 Government and Policy Makers…………….…………………. 20
1.7 Chapter Layout…………….…………………….……………………. 20
1.8 Conclusion…………….…………………….………………………… 21
CHAPTER 2 : LITERATURE REVIEW…………….…………………….…… 22
2.0 Introduction…………….…………………….……………………….. 22
2.1 Review of the Literature…………….…………………….…………... 22
2.1.1 Singapore Stock Market (DV) …………….………………….. 23
2.1.2 Malaysia Stock Market…………….…………………….……. 24
2.1.3 Indonesia Stock Market……….…………………….………… 25
2.1.4 Thailand Stock Market……….…………………….………….. 27
2.1.5 Philippines Stock Market……….…………………….……….. 28
2.2 Review of Relevant Theoretical Models……….……………………... 29
2.2.1 International Portfolio Diversification……….………………... 29
2.2.2 Modern Portfolio Theory……….…………………….……….. 30
2.2.3 Asset Pricing Models……….…………………….…………… 31
2.2.3.1 International Capital Asset Pricing Model………… 32
2.2.3.2 International Arbitrage Pricing Model……………. 34
2.2.4 Law of One Price……….…………………….………………. 34
2.2.5 Efficient Market Hypothesis……….…………………….……. 35
2.3 Theoretical Framework……….…………………….…………………. 37
2.4 Conclusion……..……….…………………….……………………….. 38
CHAPTER 3 : METHODOLOGY……..……….…………………….………… 39
3.0 Introduction……….…………………….…….…………………......... 39
3.1 Research Design……….…………………….………………………... 39
3.2 Data Collection Methods……….…………………….………………. 40
3.2.1 Secondary Data……….…………………….…………………. 40
The Linkage between Stock Market Returns of Singapore and Other ASEAN-5 Countries
Undergraduate Research Project viii Faculty of Business and Finance
3.3 Sampling Design……….……….……….……….……….…………... 42
3.3.1 Target Population……….……….……….……….…………… 42
3.3.1.1 Singapore……….……….……….……….………... 42
3.3.1.2 Malaysia……….……….……….……….…………. 42
3.3.1.3 Indonesia……….……….……….…………………. 43
3.3.1.4 Thailand.……….……….………………………….. 43
3.3.1.5 Philippines.……….……….……………………….. 44
3.3.2 E-views 8.……….……….…………………..……….………... 45
3.4 Data Processing.……….……….……………………………………… 46
3.5 Data Analysis.……….……….………………….………….…………. 48
3.5.1 Diagnostic Checking.……….……….………………………… 48
3.5.1.1 Multicollinearity.……….……….…………………. 48
3.5.1.2 Heteroscedasticity.……….……….………………… 49
3.5.1.3 Autocorrelation.……….……….…………………… 52
3.5.1.4 Model Specification…………..…………………….. 54
3.5.1.5 Normality Test……….……….…………………….. 55
3.5.2 Multiple Linear Regression Model…….………………………. 56
3.5.3 Ordinary Least Square (OLS).…….…………………………… 57
3.5.3.1 T-test……….……….………………………………. 58
3.5.3.2 F-test……….……….………………………………. 59
3.5.4 Unit Roots Test……….……….……………………………….. 60
3.5.5 Granger Causality Test……….……….……………………….. 62
3.5.6 Johansen Cointegration Test…….……………………………... 63
3.6 Conclusion…….………………………………….……………………. 64
CHAPTER 4 : DATA ANALYSIS…………………..………………………….. 66
4.0 Introduction……………………………………………………………. 66
4.1 Diagnostic Checking…………………………………………………... 66
4.1.1 Multicollinearity……………………………………………….. 66
4.1.2 Heteroscedasticity……………………………………………… 68
4.1.3 Autocorrelation………………………………………………… 69
4.1.4 Model Specification……………………………………………. 70
4.1.5 Normality Test…………………………………………………. 71
4.2 Ordinary Least Square Method………………………………………... 72
The Linkage between Stock Market Returns of Singapore and Other ASEAN-5 Countries
Undergraduate Research Project ix Faculty of Business and Finance
4.2.1 T-test………………………………………………………........ 73
4.2.2 F-test…………………………………………………………… 74
4.3 Unit Root Test…………………………………………………………. 75
4.3.1 Augmented Dickey-Fuller (ADF) Test..………………………. 75
4.3.2 Phillips-Perron (PP) Test Result……………………………….. 76
4.4 Granger Causality Test………………………………………………… 77
4.5 Johansen Cointegration Test…………………………………………... 79
4.6 Conclusion…………………………………………………………….. 80
CHAPTER 5 : DISCUSSION, CONCLUSION AND IMPLICATION………… 81
5.0 Introduction……………………………………………………………. 81
5.1 Summary of Analysis………………………………………………….. 81
5.1.1 Summary of Diagnostic Checking…………………………….. 81
5.1.2 Summary of Ordinary Least Square…………………………… 82
5.1.3 Summary of Unit Roots Test…………………………………... 84
5.1.4 Summary of Granger Causality Test…………………………... 86
5.1.5 Summary of Johansen Cointegration Test……………………... 87
5.2 Discussion of Major Findings…………………………………………. 89
5.3 Implications of Study………………………………………………….. 95
5.3.1 Managerial Implications……………………………………….. 95
5.4 Limitations of Study…………………………………………………… 96
5.5 Recommendations for Future Research……………………………….. 98
5.6 Conclusion…………………………………………………………….. 99
References………………………………………………………….……………. 100
Appendices………………………………………………………………………. 113

The Linkage between Stock Market Returns of Singapore and Other ASEAN-5 Countries
Undergraduate Research Project x Faculty of Business and Finance
LIST OF TABLES
Pages
Table 3.2.1 : Sources of Data 41
Table 4.1.1(a) : The R-squared and t-ratios of the Model 67
Table 4.1.1(b) : Pair-wise Correlation Coefficients 67
Table 4.1.1(c) : VIF and TOL Results 68
Table 4.1.2 : Autoregressive Conditional Heteroscedasticity
(ARCH) Test
69
Table 4.1.3 : Breush-Godfrey Serial Correlation LM test 70
Table 4.1.4 : Ramsey Regression Equation Specification Error Test
(RESET) Test
70
Table 4.2 : E-view Result 73
Table 4.2.1 : Result of t-test 74
Table 4.2.2 : Result of F-test 75
Table 4.3.1 : Augmented Dickey-Fuller Test Result 75 – 76
Table 4.3.2 : Phillips-Perron Test Result 76
Table 4.4 : Results of Granger Causality Test 77 – 78
Table 4.5 : Results for Johansen Cointegration Test 79
Table 5.1.1 : Summary of Diagnostic Checking 81 – 82
Table 5.1.2 : Summary of Ordinary Least Square 82 – 84
Table 5.1.3 : Summary of Unit Roots Test at First Difference and
Without Trend
84 – 85
Table 5.1.4 : Summary of Granger Causality Test 86 – 87
Table 5.1.5 : Summary of Johansen Cointegration Test 87 – 88

The Linkage between Stock Market Returns of Singapore and Other ASEAN-5 Countries
Undergraduate Research Project xi Faculty of Business and Finance
LIST OF FIGURES
Pages
Figure 1.1.1 : Performance of Singapore Stock Market, 2005-2016 5
Figure 1.1.2 : Performance of Malaysia Stock Market, 2005-2016 6
Figure 1.1.3 : Performance of Indonesia Stock Market, 2005-2016 8
Figure 1.1.4 : Performance of Thailand Stock Market, 2005-2016 9
Figure 1.1.5 : Performance of Philippines Stock Market, 2005-2016 11
Figure 2.3 : Theoretical Framework 37
Figure 3.4 : Diagram of Data Processing Flow 47
Figure 3.5.1.2 : Detection of Heteroscedasticity Problem 51
Figure 3.5.1.3 : Detection of Autocorrelation Problem 53
Figure 4.1.5 : Jarque-Bera Test 71
Figure 4.4 : Relationship among ASEAN-5 Stock Markets for
Granger Causality Test
78
Figure 5.2 (a) : Stock of foreign direct equity investment in Singapore
by country
89
Figure 5.2 (b) : Foreign direct investment in Indonesia by country in
2016
92
The Linkage between Stock Market Returns of Singapore and Other ASEAN-5 Countries
Undergraduate Research Project xii Faculty of Business and Finance
LIST OF ABBREVIATIONS
ADF Augmented Dickey-Fuller
ADR American Depository Receipt
AIC Akaike Info Criterion
ANOVA Analysis of Variance
ARCH Autoregressive Conditional Heteroscedasticity
ASEAN Association of Southeast Asian Nations
BLUE Best, Linear, Unbiased and Efficient
BMV Base Market Value
BP Breusch-Pagan
BRICS Brazil, Russia, India, China and South Africa
BSE Bangkok Stock Exchange
CAPM Capital Asset Pricing Model
CIC Capital Issues Committee
CLRM Classic Linear Regression Model
CMV Current Market Value
DV Dependent Variable
EMH Efficient Market Hypothesis
The Linkage between Stock Market Returns of Singapore and Other ASEAN-5 Countries
Undergraduate Research Project xiii Faculty of Business and Finance
FIN Financial Index
FTSE Financial Times Stock Exchange
FTFBMMES Financial Times Stock Exchange Bursa Malaysia ACE
GDP Gross Domestic Products
ICAPM International Capital Asset Pricing Model
IMF International Monetary Fund
IND Indonesia
ISX Indonesia Stock Exchange
IV Independent Variables
JB Jarque-Bera
JCI Jakarta Stock Exchange Composite Index
KLCI Kuala Lumpur Composite Index
KLSE Kuala Lumpur Stock Exchange
MAL Malaysia
MESDAQ Malaysian Exchange of Securities Dealing and Automated
Quotation
MkSE Makati Stock Exchange Incorporation
MSCI Morgan Stanley Capital International
MSE The Manila Stock Exchange Incorporation
OLS Ordinary Least Square
PHI Philippines
PP Phillips-Perron
PSEi Philippines Stock Exchange Composite Index
RESET Regression Specification Error Test

The Linkage between Stock Market Returns of Singapore and Other ASEAN-5 Countries
Undergraduate Research Project xiv Faculty of Business and Finance
SC Schwarz Criterion
SC Securities Commission
SES Singapore Stock Exchange
SET Stock Exchange of Thailand
SETI Stock Exchange of Thailand Index
SGX Singapore Exchange
SING Singapore
SPH Singapore Press Holdings
STI Straits Times Index
THAI Thailand
TOL Tolerance Method
US United States
VIF Variance Inflation Factor

The Linkage between Stock Market Returns of Singapore and Other ASEAN-5 Countries
Undergraduate Research Project xv Faculty of Business and Finance
LIST OF APPENDICES
Page
APPENDIX 1: MULTICOLLINEARITY 113
APPENDIX 2: HETEROSCEDASTICITY 114
APPENDIX 3: AUTOCORRELATION 115
APPENDIX 4: MODEL SPECIFICATION 116 – 117
APPENDIX 5: NORMALITY TEST 118
APPENDIX 6: ORDINARY LEAST SQUARES (OLS) METHOD 119
APPENDIX 7: UNIT ROOT TEST 120 – 130
APPENDIX 8: GRANGER CAUSALITY TEST 131 – 132
APPENDIX 9: JOHANSEN CO-INTEGRATION TEST 133 – 134

The Linkage between Stock Market Returns of Singapore and Other ASEAN-5 Countries
Undergraduate Research Project xvi Faculty of Business and Finance
PREFACE
Nowadays, ASEAN-5 stock markets have provided great opportunities for investors to
trade across the boundaries after the capital market has been liberalized. This allowed
the investors to create more wealth and manage a well-diversified portfolio. Thus, it is
essential to investigate the stock market linkages between the ASEAN-5 which will
provide a better knowledge and strategies in managing the most diversified portfolio of
ASEAN-5 equity. Although past researchers have conducted the research on the stock
market integration between ASEAN countries, yet the overall picture of the relationship
between the ASEAN stock markets still remains uncertain. In order to take advantage
of the accessibility of the capital market, it is important to obtain investment
opportunities from the most recent developments in stock market especially ASEAN-5
countries.
The purpose of this research is to investigate the linkage of stock market return between
Singapore and other ASEAN-5 countries. Singapore is known as developed countries
and successfully transform into a financial hub in ASEAN region. Therefore, the
investors from Singapore may concern to diversify their portfolio risk by investing in
other nations, especially ASEAN-5 which is their neighbouring countries. Furthermore,
this research will broaden the evidence of the linkages of stock markets return between
Singapore and the rest of ASEAN-5 countries.
The Linkage between Stock Market Returns of Singapore and Other ASEAN-5 Countries
Undergraduate Research Project xvii Faculty of Business and Finance
ABSTRACT
This research project aims to evaluate the linkage of stock market return between
Singapore and other ASEAN-5 countries from 2005 to 2016. The secondary data is
acquired at monthly basis sources from Bloomberg Terminal. There are a few empirical
tests had conducted in this research, such as diagnostic checking, Ordinary Least
Squares (OLS) test, Unit Root test, Granger Causality Test and Johansen Cointegration
Test. According to the OLS examined results, the stock market returns of Malaysia,
Indonesia, Thailand and Philippines are positively significant towards the stock market
returns of Singapore. However, the long run relationship between Singapore stock
market and stock markets of all other ASEAN-5 countries is exists. Moreover, the
granger causality test showed that the short run relationship only occurred between
Singapore and Indonesia stock market returns. Although there are some limitations in
this research, the recommendations have been proposed for the future researchers to
widen the evidence of similar research. Furthermore, the evidence from the results will
provide important implications for stock investors, fund managers, government and
policymakers.

The Linkage between Stock Market Returns of Singapore and Other ASEAN-5 Countries
Undergraduate Research Project Page 1 of 134 Faculty of Business and Finance
CHAPTER 1 : RESEARCH OVERVIEW
1.0 Introduction
In this new era of globalisation, the integration of stock market has become crucial and
indispensable in finance since it will affect the decision and potential gain in asset
allocation, portfolio diversification and other decision making. This is the reason why
the study of interrelationship of stock market return between countries received a great
attention in international finance (Tiwari, Bhanja & Shah, 2013).
Chapter one is the introductory chapter that gives the idea and an overview about the
research project. All the research problems, research questions, objectives and
hypotheses of the research project will be discussed in this chapter.
The purpose of this research project is to investigate the interrelationship between the
ASEAN-5countries stock market return. Other than this, the research project also
investigates how these countries’ stock market returns affected Singapore stock market
return. A set of sample data from January 2005 to December 2016 will be used in this
research project including ASEAN-5 countries namely Malaysia, Indonesia, Thailand,
The Philippines and Singapore. Singapore stock market return is dependent variable
while the others country stock market return are independent variables.
1.1 Research Background
The term ‘stocks’ carries the meaning of ownership of a company’s certificates or
securities held by investors (Fontanills & Gentile, 2001). As such the holders of these
securities have claims on the company’s future assets and income. Furgang (2011)
defined stock market as a place which facilitates the activity of buying or selling shares
of publicly-issued companies and enable trades either through exchange markets or
over-the-counter markets. Companies will raise capital through issuance of shares in

The Linkage between Stock Market Returns of Singapore and Other ASEAN-5 Countries
Undergraduate Research Project Page 2 of 134 Faculty of Business and Finance
stock market while the investors who buy certain shares of a corporation will be entitled
as shareholders of the corporation. A better structured and managed stock market could
bring about accelerated financial economies as well as stimulate the economic activities
in a country (Anwar & Raza, 2016). Stock market performance are measured by stock
market indices and stock returns. It acts as a benchmark to evaluate the wealth and
growth potential of the country. In fact, stock markets of different countries have their
own stock indices. Stock indices anticipate the direction of movement of the stock
prices, indicating the economic activity level as well as sense the sentiment of stock
market (Ho, 2009).
The liberalisation process acts as vital policy which have been enforced by countries in
recent decades. Lee and Goh (2016) determined liberalisation as consequences of
government relaxed rules and regulations in financial market, loosen quantity restriction
and home price of goods in a country as well as enhanced the participant of foreign
countries in domestic financial market. Tauchen and Pitt (1983) declared that the
number of traders in financial market and the volatility of stock return were negatively
related to each other.
There will be more and more domestic and foreign investors being attracted to invest in
a stock market due to the relaxation of restriction of financial market. The result to this
is the decline in stock return volatility. Integration of local market with foreign markets
would be boosted up once the liberalisation is being carried out (Yi & Tan, 2009).
When stock market is integrated, a news happen in a country would spread rapidly to
other countries’ stock markets. At the same time, capital movement between countries
would rise while generating fresh ideas and innovation on financial goods and services
in the country. Low barrier of trade and finance deregulation which provide
opportunities and the possible combination of returns and risks. If the correlation
between two different stock markets is low or negative, there will be greater risks being
diversified through international portfolio investment.
ASEAN countries have different period of time in experiencing stock markets
liberalisation. Date of economic openness can be categorised into variety of indicators,
such as the Official Liberalisation Dates, the First ADR (American Depository Receipt)

The Linkage between Stock Market Returns of Singapore and Other ASEAN-5 Countries
Undergraduate Research Project Page 3 of 134 Faculty of Business and Finance
and the date of introduction of Country Fund (Bekaert, 1995; Bekaert & Harvey, 1995).
Definition of the official liberalisation date is the official date which allowed domestic
investors to invest in foreign stock markets on the same time foreign investors also have
the equal rights to fund their money in local stock market (Bekaert & Harvey, 2000).
For the past decades, there are four major crises being assorted, including the Great
Depression 1929, 1987 International Crash of Stock Market, Financial Crisis of 1990s
and the 1997 Asian Financial Crisis (Royfaizal, Lee & Azali, 2009b). Lim (2009)
investigated the correlation of international stock markets and found that United State
(US) financial market acts as leader on other markets. In the 21st century, BRICS
(Brazil, Russia, India, China and South Africa) financial economies rank as most
influential countries and accounted for approximate 40 per cent of the population in
world (Mensi, Hammoudeh, Nguyen, & Kang, 2016). China explained roughly 55% of
the global gross domestic products (GDP) and became largest or second-largest trading
partner to 78 countries’ stock markets by 2011 (Teng, Yen, Chua, & Lean, 2016).
Members of the Association of Southeast Asian Nations (ASEAN) formed by five
countries in Asia, including Singapore, Malaysia, Indonesia, Thailand, and the
Philippines with a market amounted to approximate 568 million people are extended
swiftly since 1970s and being ranked as fourth largest trading region in world (Lim,
2007). After the 1997 Asian Financial Crisis, stock markets of ASEAN-5 become more
interdependence and liberalised. Click and Plummer (2005) declared that ASEAN-5
had overcome barrier of trade and created a free-trade area and investment zone among
themselves over the past few years.
1.1.1 Background of Singapore’s Stock Market
Singapore Stockbrokers Association was established in 1930. Since then, stock
trading was conducted in a more formal form under this association to provide
higher protection to brokers and investors. The association name was changed to
Malayan Stockbrokers Association during 1938, including the brokers from
Peninsular Malaysia to trade more safely through this association (Siklos & Ng,
The Linkage between Stock Market Returns of Singapore and Other ASEAN-5 Countries
Undergraduate Research Project Page 4 of 134 Faculty of Business and Finance
2001). In 1960, a number of firms from Singapore, Kuala Lumpur, Ipoh and
Penang jointly set up the Malayan Stock Exchange. In 1973, Stock Exchange of
Singapore was established after Singapore withdrawn from being a member of
Malaysia. Stock Exchange of Singapore merged with Singapore International
Monetary Exchange to form Singapore Exchange in 1999 (Tan, 2005).
Singapore had officially undergone stock market liberalisation on June 1978
(Phylaktis & Ravazzolo, 2005, as cited in Lee & Goh, 2016).
Straits Times Index (STI) is a capitalisation-weighted stock market index which
indicates the performance of the top 30 public-listed companies on the
Singapore Exchange (Brooks, Faff & Ariff, 1998). STI was also known as the
market barometer and benchmark index of Singapore stock market.
The stock market return performance of Singapore from year 2005 to 2016 was
analysed using the monthly last price. The stock market return of STI shown an
increasing trend beginning from year 2005 and peaked in mid-year of 2007.
From mid-year of 2007, the stock market return experience a huge drop and the
lowest price on February 2009. This trend shown that Singapore stock market
was affected by the global financial crisis happen within these period (Lee &
Goh, 2016). The market started to recover from March 2009. The stock market
return was increased on March 2009 and shown a fluctuating trend until year
2016.

The Linkage between Stock Market Returns of Singapore and Other ASEAN-5 Countries
Undergraduate Research Project Page 5 of 134 Faculty of Business and Finance
Figure 1.1.1: Performance of Singapore Stock Market, 2005 – 2016
Source: Developed for research.
1.1.2 Background of Malaysia’s Stock Market
Abd Karim and Gee (2008) stated that Kuala Lumpur Stock Exchange (KLSE)
and the Malaysian Exchange of Securities Dealing and Automated Quotation
(MESDAQ) played significant duties as the secondary markets in Malaysia.
This allowed investors to trade their securities publicly as well as increase the
liquidity of shares. In March 1960, stock market of Malaysia was established
and named as The Malayan Stock Exchange. In May 1960, investors had begun
to trade stocks and shares in the clearing house of Bank Negara Malaysia. The
Capital Issues Committee (CIC) was built in 1968. As a result of instability of
Malaysian Ringgit and the termination of currency interchangeability with
Singapore, The Malayan Stock Exchange was then divided into the KLSE and
the Singapore Stock Exchange (SES) in 1973. In 1993, Securities Commission
(SC) was implemented to entrust the responsibility of regulating and
comprehensively development of stock market of Malaysia (Abd Karim & Gee,
2008). KLSE was renamed to Bursa Malaysia Berhad in 2004. Lee and Goh
(2016) stated that the Official Liberalisation Date of Malaysia stock market was
allocated on December 1988.
0
500
1000
1500
2000
2500
3000
3500
4000
Jan-0
5
Au
g-0
5
Mar
-06
Oct
-06
May
-07
Dec
-07
Jul-
08
Feb
-09
Sep
-09
Ap
r-1
0
No
v-1
0
Jun
-11
Jan-1
2
Au
g-1
2
Mar
-13
Oct
-13
May
-14
Dec
-14
Jul-
15
Feb
-16
Sep
-16
Performance of Singapore Stock Market, 2005 - 2016
Last Price

The Linkage between Stock Market Returns of Singapore and Other ASEAN-5 Countries
Undergraduate Research Project Page 6 of 134 Faculty of Business and Finance
Kuala Lumpur Composite Index (KLCI) acts as the Malaysia’s benchmark stock
market index to measure the value of stock market. Roshaiza, Sisira and
Svetlana (2009) indicated that Bursa Malaysia collaborated with its partner of
index, FTSE International Limited (FTSE) changed name of stock market index
of Malaysia from KLCI to FTSE Bursa Malaysia KLCI in 2009. Cooperation
between them brought about improvement in the methodology of index
calculation to a more transparently-managed, tradable and investable index.
Moreover, these modifications provide the opportunity to improve the
Malaysian stock market to an extended range of investment and on the same
time facilitate economy growth of country.
From 2005 to 2007, the last price of KLCI, indicator of stock market
performance, were boosted up steadily with a little downfall. In 2007, stock
market Malaysia performance stay almost alike with the previous year before
the Asian financial crisis. when the global financial crisis attacked in 2008, the
stock market return performance declined intensely (Anwar & Raza, 2016).
There was a firm rose with minimal fluctuation of the graph of stock market
performance after year 2008 until August 2015. Then there was a minimal
decline of trend up to the end of year 2016.
Figure 1.1.2: Performance of Malaysia Stock Market, 2005 – 2016
Source: Developed for research.
0
200
400
600
800
1000
1200
1400
1600
1800
2000
Jan-0
5
Sep
-05
May
…
Jan-0
7
Sep
-07
May
…
Jan-0
9
Sep
-09
May
…
Jan-1
1
Sep
-11
May
…
Jan-1
3
Sep
-13
May
…
Jan-1
5
Sep
-15
May
…
Performance of Malaysia Stock Market,
2005 - 2016
Last
Price
The Linkage between Stock Market Returns of Singapore and Other ASEAN-5 Countries
Undergraduate Research Project Page 7 of 134 Faculty of Business and Finance
1.1.3 Background of Indonesia’s Stock Market
Jakarta Stock Exchange was established in 1912 by Dutch colonial government
to provide a place for stock brokers and investors to trade their securities in a
more secured way. Jakarta Stock Exchange is based in Jakarta, Indonesia.
During World War I and World War II, Jakarta Stock Exchange had
experienced several closures and it had been reopened in 1977. Jakarta
Exchange Inc. had privatised the Jakarta Stock Exchange under their ownership
in 1992. In September 2007, Jakarta Stock Exchange was merged with Surabaya
Stock Exchange to form the Indonesian Stock Exchange (Ho, 2009). In
September 1989, Indonesian Stock Exchange officially undergone stock market
liberalisation (Bekaert & Harvey, 1998, as cited in Lee & Goh, 2016).
Jakarta Stock Exchange Composite Index (JCI) is the capitalisation-weighted
index which is modified from stocks of the companies listed on the Indonesia
Stock Exchange (Yang & Pangastuti, 2016). JCI plays the role as the benchmark
index of Indonesia stock market.
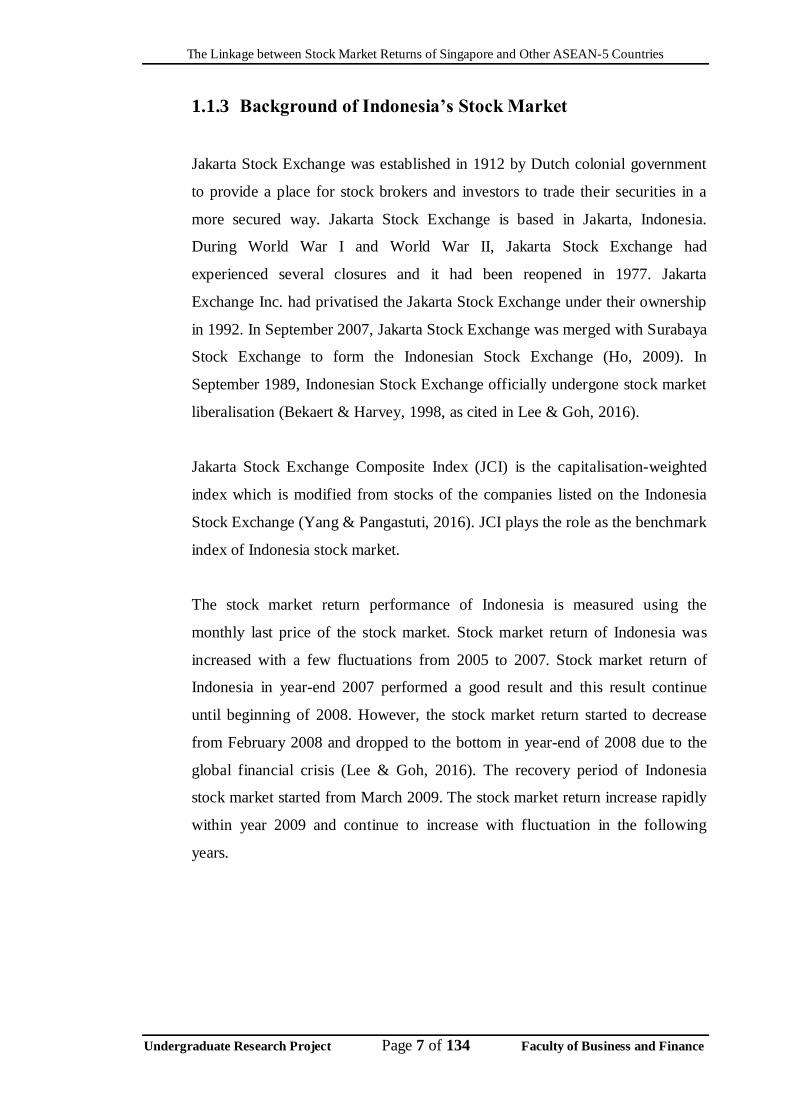
The stock market return performance of Indonesia is measured using the
monthly last price of the stock market. Stock market return of Indonesia was
increased with a few fluctuations from 2005 to 2007. Stock market return of
Indonesia in year-end 2007 performed a good result and this result continue
until beginning of 2008. However, the stock market return started to decrease
from February 2008 and dropped to the bottom in year-end of 2008 due to the
global financial crisis (Lee & Goh, 2016). The recovery period of Indonesia
stock market started from March 2009. The stock market return increase rapidly
within year 2009 and continue to increase with fluctuation in the following
years.
The Linkage between Stock Market Returns of Singapore and Other ASEAN-5 Countries
Undergraduate Research Project Page 8 of 134 Faculty of Business and Finance
Figure 1.1.3: Performance of Indonesia Stock Market, 2005 – 2016
Source: Developed for research
1.1.4 Background of Thailand’s Stock Market
In general terms, there are two stages in the modern Thailand capital market,
which are the Bangkok Stock Exchange (BSE) and the Securities Exchange of
Thailand. BSE, which was a limited partnership with private owners, initiated
the trading of stocks in July 1962. Due to scarcity of investors and shortage of
support from governments, BSE failed to succeed. “The Securities Exchange of
Thailand”, name of the Thailand stock market was recognised publicly and had
started trading on 30 April 1975 (Sutheebanjard & Premchaiswadi, 2010). Thai
stock market was renamed to Thai Stock Exchange of Thailand on 1 January
1991. Furthermore, Thailand began to expose themselves to international stock
markets and the Official Liberalisation Date of Thai was embedded on
September 1987.
Chancharat, Valadkhani and Havie (2008) stated that SET index plays vital role
as the index of the Stock Exchange of Thailand. In fact, the SET Index which
make comparison between all listed common stocks current market value (CMV)
0
1000
2000
3000
4000
5000
6000
Jan-0
5
Jul-
05
Jan-0
6
Jul-
06
Jan-0
7
Jul-
07
Jan-0
8
Jul-
08
Jan-0
9
Jul-
09
Jan-1
0
Jul-
10
Jan-1
1
Jul-
11
Jan-1
2
Jul-
12
Jan-1
3
Jul-
13
Jan-1
4
Jul-
14
Jan-1
5
Jul-
15
Jan-1
6
Jul-
16
Performance of Indonesia Stock Market, 2005 -2016
Last Price
The Linkage between Stock Market Returns of Singapore and Other ASEAN-5 Countries
Undergraduate Research Project Page 9 of 134 Faculty of Business and Finance
and their base market value (BMV). The formula for computing the SET index
is as follows:
SET index=Current Market Value ×100
Base Market Value
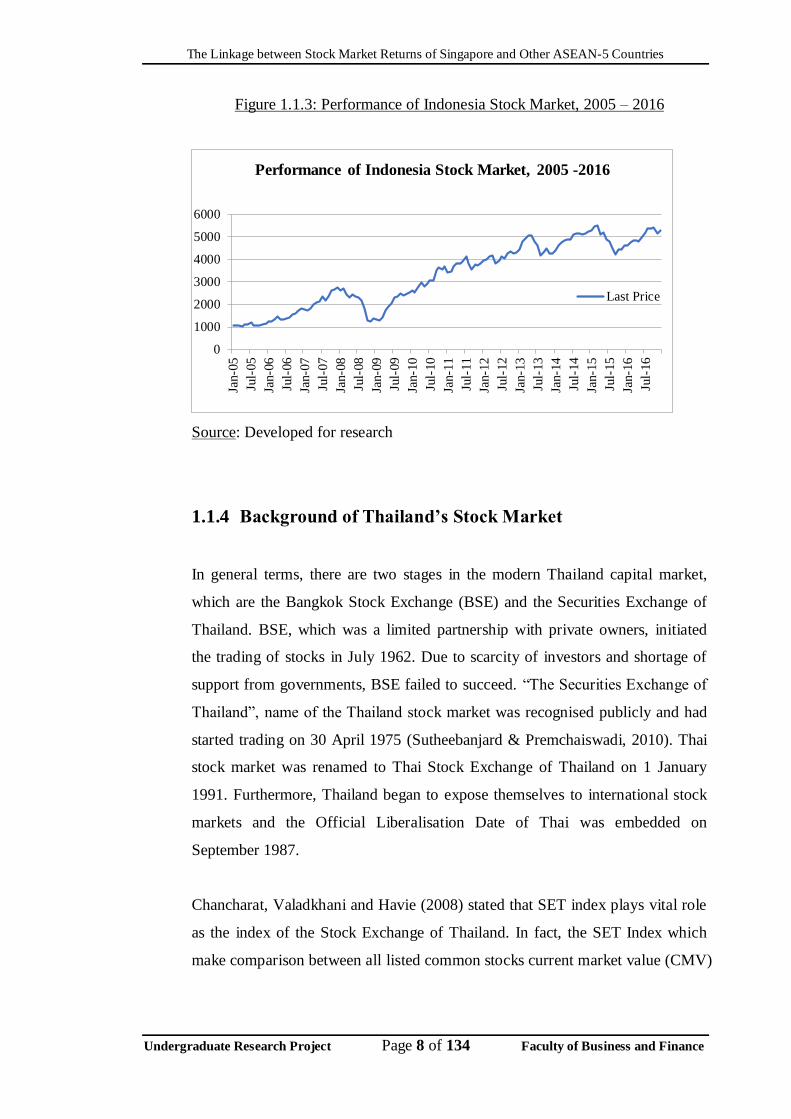
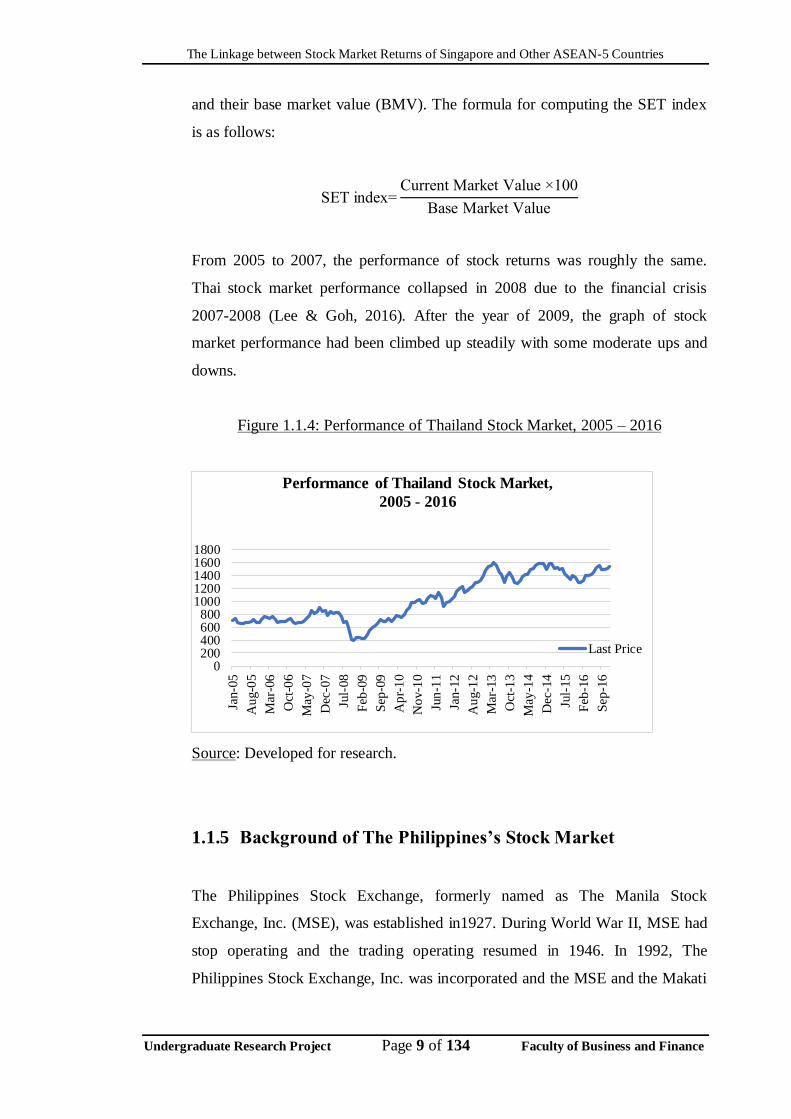
From 2005 to 2007, the performance of stock returns was roughly the same.
Thai stock market performance collapsed in 2008 due to the financial crisis
2007-2008 (Lee & Goh, 2016). After the year of 2009, the graph of stock
market performance had been climbed up steadily with some moderate ups and
downs.
Figure 1.1.4: Performance of Thailand Stock Market, 2005 – 2016
Source: Developed for research.
1.1.5 Background of The Philippines’s Stock Market
The Philippines Stock Exchange, formerly named as The Manila Stock
Exchange, Inc. (MSE), was established in1927. During World War II, MSE had
stop operating and the trading operating resumed in 1946. In 1992, The
Philippines Stock Exchange, Inc. was incorporated and the MSE and the Makati
0200400600800
10001200140016001800
Jan-0
5
Au
g-0
5
Mar
-06
Oct
-06
May
-07
Dec
-07
Jul-
08
Feb
-09
Sep
-09
Ap
r-1
0
No
v-1
0
Jun
-11
Jan-1
2
Au
g-1
2
Mar
-13
Oct
-13
May
-14
Dec
-14
Jul-
15
Feb
-16
Sep
-16
Performance of Thailand Stock Market,
2005 - 2016
Last Price

The Linkage between Stock Market Returns of Singapore and Other ASEAN-5 Countries
Undergraduate Research Project Page 10 of 134 Faculty of Business and Finance
Stock Exchange, Inc. (MkSE) were unified under The Philippines Stock
Exchange, Inc. to strengthen logistics and boost the development of capital
market (Dioquino, 2014). The Philippines Stock Exchange is the first and
longest stock exchange because it started operating since 1927. It also is one of
the major stock exchanges in Southeast Asia (Ho, 2009). The Philippines Stock
Exchange, Inc. officially undergone liberalisation on June 1991 (Bekaert &
Harvey, 1998 as cited in Lee & Goh, 2016).
The Philippines Stock Exchange Composite Index (PSEi) is the capitalisation-
weighted index which calculated using the stock returns of 30 companies listed
on the Philippines Stock Exchange, Inc. from different sectors (Dioquino, 2014).
PSEi is the benchmark of the performance of stock market return of the
Philippines (The Philippines Stock Exchange, Inc, 2012).
Monthly last price of the Philippines was used to measure the performance of
the stock market return from 2005 to 2016. Generally, the stock market return of
the Philippines shown a rising trend from 2005 to October 2007. The stock
market return started to fall during year-end of 2007. This is because the global
financial crisis started to affect the stock market of the Philippines. This
declining trend continue and drop to the valley at the beginning of 2009.
However, the recovery of the stock market also started in 2009. The
performance of stock market in the Philippines after the recovery period, shows
a better result after the global financial crisis compare to that before crisis.

The Linkage between Stock Market Returns of Singapore and Other ASEAN-5 Countries
Undergraduate Research Project Page 11 of 134 Faculty of Business and Finance
Figure 1.1.5: Performance of Philippines Stock Market, 2005 – 2016
Source: Developed for research.
1.2 Problem statement
The capital market liberalisation in ASEAN stock markets had opened opportunities of
cross-border investment for investors (Wong, Penm, Terrell & Ching, 2004). Such
market liberalisation, accompanied by the trend of globalisation brought forth by
technological advances, gave investors opportunities to tap into the global stock
markets in order to create more wealth. The incentive for investors to invest in global
stock markets is the ability to formulate an internationally diversified portfolio that is
capable of attaining greater return at minimal risk.
The integration between stock market is the main determinant of the feasibility of
international portfolio diversification. According to Schmukler (2004), when a
country’s stock market is integrated with international market, it increases investment
alternatives to investors. However, high or perfect integration between stock market
deemed international portfolio diversification ineffective (Wong et al., 2004). This is
due to the fact that highly integrated financial markets are more prone to external
shocks and financial crisis from contagion effects (Schmukler, 2004). On the contrary,
lower integration between stock market enables better prospects for investors to form a
0100020003000400050006000700080009000
Jan-0
5
Au
g-0
5
Mar
-06
Oct
-06
May
-07
Dec
-07
Jul-
08
Feb
-09
Sep
-09
Ap
r-1
0
No
v-1
0
Jun
-11
Jan-1
2
Au
g-1
2
Mar
-13
Oct
-13
May
-14
Dec
-14
Jul-
15
Feb
-16
Sep
-16
Performance of Philippines Stock Market, 2005 -2016
Last Price

The Linkage between Stock Market Returns of Singapore and Other ASEAN-5 Countries
Undergraduate Research Project Page 12 of 134 Faculty of Business and Finance
well-diversified international portfolio (Abd Karim & Gee, 2008; Caporale & Spagnolo,
2012). Therefore, the stock market linkages between ASEAN countries should be
studied for investors that are interested in formulating a portfolio of ASEAN stocks.
In the past decade, a few notable events that may affect the stock market integration
between ASEAN member nations had occurred, rendering past studies irrelevant to
provide a true picture of the interrelationship between ASEAN stock markets. These
events not only impact the prospects of international portfolio diversification, but create
more uncertainties towards recent linkages between stock markets in the ASEAN
region.
Firstly, the 2008 Global Financial Crisis, also known as the subprime loan crisis, had
struck the world stock market into a slump. Singapore stock market, for example, had
suffered a fall by 49.2% following the subprime loan crisis (Record stock market falls
in 2008, 2008). In fact, contagion effect was found to be inevitable during period of this
subprime loan crisis (Celik, 2012). Next, ASEAN member nations have agreed upon
the ASEAN Economic Community as a regional economic integration goal to be
achieved by year 2015 (Thanh, 2015). For example, the ASEAN exchanges
collaboration was initiated as a key initiative under the ASEAN Economic Community
to integrate 7 stock exchanges in the ASEAN member nations, namely Vietnam,
Indonesia, Malaysia, the Philippines, Thailand and Singapore (Sia, Hsu & Teo, 2016).
Besides that, the ASEAN stock trading link, capable of enhancing stock liquidity
between ASEAN countries, was launched in September 2012 by the ASEAN exchanges
had been recognised as an accelerating pace of stock market integration within the
ASEAN region (Hayashi, 2013; Jarungkitkul & Sukcharoensin, 2016). Such advances
in technological components can be a factor of stock market integration (Hyde, Bredin
& Nguyen, 2007; Phylaktis & Ravazzolo, 2005).
In addition, ASEAN member nations demonstrated large diversity in their degree of
economic development (Thanh, 2015). According to Asian Development Bank (2016),
the GDP Growth rate varies from 2.0% to 5.8% in 2015. Singapore GDP growth
recorded 2.0%, while Thailand 2.8%, Indonesia 4.8%, Malaysia 5.0% and Philippines
5.8% (Asian Development Bank, 2016). Moreover, there were political instability that

The Linkage between Stock Market Returns of Singapore and Other ASEAN-5 Countries
Undergraduate Research Project Page 13 of 134 Faculty of Business and Finance
occurred in the ASEAN-5 countries in the past decade. For instance, political unrest in
Thailand since the decease of King Bhumibol Adulyadej; democratic win in Indonesia’s
last presidential election; Malaysia’s general election; retirement of former Singapore
Prime Minister Lee Kuan Yew; and call for resignation of Philippine president Benigno
Aquino (The Economist, 2015). These political events could pose an impact in the
integration between ASEAN-5 stock markets due to policy changes and market
perception.
Regardless the above recent economic and political changes, previous studies have their
limitations in addressing the above issues. First of all, previous studies had mainly
focused on investigating the cointegration between ASEAN collectively, to external
countries, such the United States and other developed countries (Ho, 2009; Loh, 2013;
Wong, et al., 2004). Even though there were studies on the linkage or cointegration
relationships between ASEAN countries, they had yielded mixed results. Most
researchers found cointegration between ASEAN stock markets after the 1997 Asian
Financial Crisis (Karim & Karim, 2012; Lim, 2007). While Narayan and Narayan (2012)
found no cointegration between Malaysia, the Philippines, Thailand and Singapore for
the period during the 2008 Financial Crisis. Most importantly, literatures on ASEAN
stock market cointegration covered the period up to 2010 (Karim & Karim, 2012;
Narayan & Narayan, 2012). As such, the linkage between ASEAN stock market should
be revisited to cater to more recent developments in the stock market.
In this era of globalisation and capital liberalisation, it is crucial to investigate the stock
market in a cross-country context because investors began to expand their investment
horizon to foreign countries due to technological conveniences. It is also important to
obtain more information on the most recent development of the linkage between stock
market so that international investors could take advantage of global stock markets
accessibility to increase their wealth. This is because, given the developments and
events that happened to the stock market in the past decade, there is a need to
reinvestigate the linkage between ASEAN-5 stock market in the most recent context
and fill up the period gap.

The Linkage between Stock Market Returns of Singapore and Other ASEAN-5 Countries
Undergraduate Research Project Page 14 of 134 Faculty of Business and Finance
Although linkages between the stock markets of all ASEAN-5 countries are of interest,
the Singapore stock market was the focus of the research project. Ho (2009) had
referred Singapore as a developed nation. Moreover, in 2013, Singapore was the only
country in ASEAN which by its economy was recognised by the International
Monetary Fund (IMF) as a developed economy (Goh, Annuar & Zariyawati, 2014).
Over the years, Singapore had grown into an established finance hub in the ASEAN
region while engaging extensively in investments throughout the ASEAN region
(Chancharat et al., 2008). Thus, Singapore investors may have concerns on their
portfolio risk and seek for a broader market to diversify away the risk. The issue is that,
given the recent outlook, whether they could target the stock markets of neighbouring
fellow ASEAN-5 countries, all of which are developing nations. It was also rarely
investigated how the Singapore stock market was affected by those of other ASEAN-5
countries. Therefore, this project seeks to cater to the linkage between ASEAN-5 stock
markets from a Singaporean perspective.
In short, this research project mainly focuses on finding the linkages and cointegration
between ASEAN-5 stock markets and how Singapore stock market is affected by stock
markets of its fellow ASEAN-5 countries. To do so, regression analysis, cointegration
analysis and granger causality approach was employed.
1.3 Research Questions
1. What is the relationship between the Malaysian stock market return and
Singapore stock market return?
2. What is the relationship between the Indonesian stock market return and
Singapore stock market return?
3. What is the relationship between the Thailand stock market return and
Singapore stock market return?

The Linkage between Stock Market Returns of Singapore and Other ASEAN-5 Countries
Undergraduate Research Project Page 15 of 134 Faculty of Business and Finance
4. What is the relationship between the Philippines stock market return and
Singapore stock market return?
5. Does granger causality relationship exist between variables?
1.4 Research Objectives
1.4.1 General Objectives
The purpose of this project is to investigate the relationship between stock
market returns of Singapore and other ASEAN-5 countries (Malaysia, Indonesia,
Thailand and Philippine) from the period of January 2005 to December 2016.
1.4.2 Specific Objectives
Objective 1 : To study the effect of Malaysian stock market return on the
Singapore stock market return.
Objective 2 : To explore the effect of Indonesian stock market return on the
Singapore stock market return.
Objective 3 : To observe the effect of Thailand stock market return on the
Singapore stock market return.
Objective 4 : To study the effect of Philippines stock market return on the
Singapore stock market return.
Objective 5 : To examine granger causality relationship between variables.

The Linkage between Stock Market Returns of Singapore and Other ASEAN-5 Countries
Undergraduate Research Project Page 16 of 134 Faculty of Business and Finance
1.5 Hypotheses of the Study
The stock market return of ASEAN-5 countries are chosen as variables for this research
project. The Straits Times Index (STI) is represented as a Singaporean stock market
return which is dependent variable. Moreover, the stock market return of other
ASEAN-5 countries (Malaysia, Indonesia, Thailand and Philippine) will be selected as
independent variable in this research project which are Kuala Lumpur Composite Index
(KLCI), Jakarta Composite Index (JCI), Stock Exchange of Thailand Index (SETI) and
Philippine Stock Exchange Index.
1.5.1 Malaysian stock market return (Kuala Lumpur
Composite Index, KLCI)
H0 : The Malaysian stock market return has an insignificant effect on
Singaporean stock market return.
H1 : The Malaysian stock market return has a significant effect on
Singaporean stock market return.
Kuala Lumpur Composite Index (KLCI) has been selected as proxy for
Malaysian stock market return for this research project. According to Lim
(2009), the changes in stock market returns between domestic countries and
foreign countries will bring significant impact on output growth. During the
year 1997 financial crisis, stock markets are found to be sensitive towards
negative or positive news. Thus, a country who encounter negative shock could
bring negative effect to other neighbouring countries. Furthermore, Roca,
Selvanathan and Shepherd (as cited in Azman-Saini, Azali, Habibullah &
Matthews, 2002) found that the Malaysian stock market is the most influential
market and it showed significant interactions with other stock markets in the
short run. Hyde et al. (2007) claimed that geographically and economically

The Linkage between Stock Market Returns of Singapore and Other ASEAN-5 Countries
Undergraduate Research Project Page 17 of 134 Faculty of Business and Finance
close markets will result in high correlations. As Malaysia and Singapore are in
the region where the geographic and economic are similarly to each other, the
result shows a highest correlation coefficient between them. Hence, it is
expected that H1 statement is supported.
1.5.2 Indonesian stock market return (Jakarta Composite Index,
JCI)
H0 : The Indonesian stock market return has an insignificant effect on
Singaporean stock market return.
H1 : The Indonesian stock market return has a significant effect on
Singaporean stock market return.
Jakarta Composite Index, JCI is selected as Indonesian stock market return.
Karim and Karim (2012) research showed that during the post subprime crisis,
Singapore has the highest correlation with Indonesia among the ASEAN-5
countries. There is another study found that the stock market returns between
Indonesia and Singapore have a closer linkage across the period (Ng, 2002).
Based on the explanation from Kearney and Lucey (2004), the world’s
economic and financial systems are highly integrated due to the expansion of
international trade in commodities, services and financial assets. Therefore, the
Indonesian stock market return is expected to have a significant effect on
Singaporean stock market return.
1.5.3 Thailand stock market return (Stock Exchange of
Thailand Index, SET)
H0 : The Thailand stock market return has an insignificant effect on
Singaporean stock market return.
H1 : The Thailand stock market return has a significant effect on Singaporean
stock market return.

The Linkage between Stock Market Returns of Singapore and Other ASEAN-5 Countries
Undergraduate Research Project Page 18 of 134 Faculty of Business and Finance
In this research project, Stock Exchange of Thailand Index, SETI is referring to
Thailand stock market return. According to Roca, Selvanathan and Shepherd
(1998), the results showed that there is a bidirectional causality between
Singapore stock market return and Thailand stock market return as the result of
contagion. This can be explained by the fact of Financial Crisis in 1997 was
initiated in Thailand with the sharp attack on Thai baht. The crisis leads to the
depreciation of Thai baht, followed by a serious attack on the Indonesian rupiah
and then spread to Singapore. Furthermore, Chancharat et al. (2008) had proved
that there is a relationship between Thailand and one of its close trading partner
Singapore in the long run and short run. Their results also proved that the stock
returns in Thailand and Singapore possess a bidirectional granger causality. The
result should be expected that the Thailand stock market return has a significant
effect on Singaporean stock market return.
1.5.4 Philippines stock market return (Philippine Stock
Exchange Index, PSEI)
H0 : The Philippines stock market return has an insignificant effect on
Singaporean stock market return.
H1 : The Philippines stock market return has a significant effect on
Singaporean stock market return.
The study had investigated that the Singapore stock market will be affected by
the Philippines. In addition, the study also observed that the Philippines are
leading the Singapore markets (Phuan, Lim, & Ooi, 2009). Azman-Saini, et al.
(2002) found that the Philippines would affected the Singapore equity market in
the long run. Tan (2012) had examined that the Philippines is highly correlated
with Singapore. This result explained that the country in the same region will
hold a strong relationship. Furthermore, there is a more substantial relationship
between the economies in the same area. Thus, it should be expected that H1
statement is supported.

The Linkage between Stock Market Returns of Singapore and Other ASEAN-5 Countries
Undergraduate Research Project Page 19 of 134 Faculty of Business and Finance
1.6 Significance of the Study
This research project focused on the interrelationship between the ASEAN-5 countries
stock market return and Singapore stock market return. The countries included
Singapore, Malaysia, Indonesia, Thailand and Philippines from the period of 2005 to
2016. This research project may be useful for academician and provide some indicators
to the policymakers, government and international investors.
1.6.1 Stock investors
According to Click and Plummer (2005), with the implication of co-integration
of stock markets from researchers, investors from various countries were able to
recognise the benefit from the diversification and thus aid their decisions on
investing in different ASEAN countries’ stock market. Hence, by studying the
integration between the stock market return, investors able to identify which of
the foreign securities to choose as part of their portfolio asset in order to achieve
a maximum return with lowest risk. In addition, the study of the research also
helps to link the information of the world stock market and provide the
opportunities for investor to bring more capital from abroad as well as expand
one’s shareholder base.
1.6.2 Fund managers
This research project may also be significant to institutional investors such as
fund managers especially in making their financial decisions. They need the
information of the linkage between markets to recognise the risk existence,
stock return, and finalise financial decisions in relation to investment and risk
management (Lim, 2007). This is such that they could ultimately develop
The Linkage between Stock Market Returns of Singapore and Other ASEAN-5 Countries
Undergraduate Research Project Page 20 of 134 Faculty of Business and Finance
investment portfolio which is well-diversified on behalf of their clients or fund
owners.
1.6.3 Government and policy makers
Besides, understand the interrelationship between stock markets is important for
policy makers. With the knowledge of the influence of stock market return of
the selected country, policy makers able to make a better prediction about the
stock market behaviour. This study will assist them to justify the international
diversification of portfolios.
According to Masoud (2013), the study’s finding stated that there was a positive
relationship between the performance of stock market and economic growth of
country. Hence, it is vital that government need to ensure a vibrant financial
performance to encourage economic growth and stability of a country. Hence,
other than policy makers, this research also useful for governments on
regulating the co-movement among international stock markets. Some
intervention and policies of government may use to apply on local stock market
in order to boost the nation’s economic growth, for instance fiscal and monetary
policies (Chatziantoniou, Duffy & Filis, 2013; Ioannidis & Kontonikas, 2006).
In short, for academic researchers as well as practitioners in the industry, this
research project will be useful to discover the integration between the stock
market of the member nations of the ASEAN-5 and investigate the impact on
the prospects of international portfolio diversification.
1.7 Chapter Layout
Chapter 1 is the introductory chapter to this research project. This chapter covers
research background, problem statement, research questions, research objectives,
hypotheses, significance of the study and chapter layout of the research project.

The Linkage between Stock Market Returns of Singapore and Other ASEAN-5 Countries
Undergraduate Research Project Page 21 of 134 Faculty of Business and Finance
Chapter 2 consists of the review of past studies which are associated with stock market
return and the performances. Besides that, the connection between independent and
dependent variables will also be reviewed in the literature review.
Chapter 3 comprises of the methodology for this research project. All the
methodologies applied such as co-integration analysis, regression analysis and granger
causality approach will be more specifically explained in this chapter. A conclusion is
written so as to connect to the next chapter.
Chapter 4 proceeds with diagnostic checking, statistical tests as well as data analyses.
This chapter outlines the analyses for all outcomes and results related to the highlighted
research questions and hypotheses for this project. Interpretation of the result will be
expressed in this chapter as well.
Chapter 5 summarises the statistical analyses and discusses the major findings and the
implications of this research project. Other than summarising and concluding this paper,
this chapter will identify the limitations for this research and thus provide some
recommendations for future research.
1.8 Conclusion
This chapter had carried out an overview of background of Singapore and other
ASEAN-5 countries’ stock market. This chapter also developed the problem statement
and objectives of the research. Besides that, the importance and contribution for this
research has been discussed in this chapter. A review on other empirical studies related
to the impact on the prospects of international portfolio diversification will discuss in
the following chapter.

The Linkage between Stock Market Returns of Singapore and Other ASEAN-5 Countries
Undergraduate Research Project Page 22 of 134 Faculty of Business and Finance
CHAPTER 2: LITERATURE REVIEW
2.0 Introduction
In the previous chapter, research background, problems statement, research questions,
objectives, hypotheses and significance of the study have been presented. Next, the
review of literature, theoretical models and theoretical conceptual framework will be
discussed. Basically, literature review is about an overview of research project’s topic
based on scholar articles, survey books, different past empirical researches and other
relevant sources. By doing so, it provides description, summarisation, assessment and
critical evaluation in relation to the research project. Furthermore, the literature review
can assist future researchers in deciding the nature of the study topic with a better
understanding and guidelines to strengthen their research, while addressing the
limitations in previous researches. In addition, review of the literature give evidence to
determine whether dependent variables will be affected by independent variable using
various methodologies.
2.1 Review of the Literature
The literature review is a critical analysis and logical presentation by gathering the
related empirical or theoretical researches conducted by previous researchers. It also
shows the limitation or gaps from the previous researches. By comparing previous
researches and summarising the major contributions from the researches, it helps to
ensure that no other relevant or significant variables are omitted. The literature review
contributes the basis for developing a better theoretical framework to proceed with
further exploration and hypothesis testing.

The Linkage between Stock Market Returns of Singapore and Other ASEAN-5 Countries
Undergraduate Research Project Page 23 of 134 Faculty of Business and Finance
2.1.1 Singapore Stock Market (DV)
According to Ibrahim and Musah (2014), stock market refers to a place of the
aggregation of buyers and sellers of shares or stocks. In addition, it acted as a
major role by channelling the excess resources from surplus unit to deficit unit.
Other than that, it allowed trading and issuing of bonds, stocks and other types
of securities for the purpose of raising capital and expansion of businesses.
However, stock returns refer to the rate of return of a stock market.
Singapore Straits Times Index (STI) is calculated by FTSE Russell, Singapore
Press Holdings (SPH) and the Singapore Exchange (SGX). STI is also known as
the main index and stock market indicator in Singapore. It provided general
information and idea of the stock return of Singapore to investors. Other than
this, STI provided a direction as well as tracked the market performance of top
30 and largest companies listed on Singapore Exchange (Bloomberg L.P, 2017).
FTSE Russell also managed to create a wide series of index for the Singapore
market. Those indices are useful for benchmarking and production of financial
products including derivatives contracts (FTSE Russell, 2016).
There are some previous studies carried out by the researchers about the
performance and development of Singapore stock market. For example,
Sukcharoensin and Sukcharoensin (2013), they studied the development of
stock market among ASEAN-5 by considering the four aspect of development.
Those aspects of development included size, stability, access and efficiency. In
overall, Singapore stock market had achieved a higher level of development and
concluded that Singapore stock market is a well-developed equity market.
Singapore is recognised as one of the major and oldest international financial
hub in the world. Their economy is closely related to foreign multinational
investment. Singapore attracted large population investors from different foreign
country due to political stability and good corporate governance. Other than this,
Singapore as a major hub also acted as a price leader and major information
provider in Asian market. It will lead to the fluctuation of Asia region’s equity

The Linkage between Stock Market Returns of Singapore and Other ASEAN-5 Countries
Undergraduate Research Project Page 24 of 134 Faculty of Business and Finance
market. Investors from different countries always put less attention on the
information from Asian Countries except the news from Singapore market
(Kung & Wong, 2009).
2.1.2 Malaysia Stock Market
Kuala Lumpur Composite Index (KLCI) plays role as the proxy of Malaysia’s
stock market index. KLCI is being used as main stock market index especially
for those stock which listed in Bursa Malaysia Stock Exchange. Measurement of
the stock market value is the main function of KLCI. Abd Karim and Gee (2008)
reported that there was a substantial progress and development in the Bursa
Malaysia Stock Exchange in both the market capitalisation and the numbers of
companies listed over the year.
Click and Plummer (2005) declared that during ASEAN-5 countries came to a
fruitfulness decision to constitute the Federation of ASEAN Stock Exchanges in
1978, there had a comfortable and smooth linkages between Singapore and
Malaysia stock market. This statement can be proved as numerous organisations
which were registered under Malaysia were involving international trade on the
Stock Exchange of Singapore (SES).
Azizan and Sulong (2011) stated that Singapore stock market have a vital
impact on variability of stock price in Malaysia. On the same time, Malaysia
stock market quick to respond to the slightly changes of Singapore stock market.
The increasing of stock price and bi-directional relationship being proved in the
post Asian financial crisis, it is probably due to mutuality among neighbouring
countries of member of Asia. Malaysia stock return ranked as the highest
integration with Singapore stock return as comparing among member of
ASEAN-5 (Karim & Karim, 2012). Tse and Tan (2001) pointed out that there
still had a strong correlation relationship being hold by Singapore and Malaysia
stock market. There were few factors that could support such as linkages of
economic between Malaysia and Singapore, structural symmetry and close

The Linkage between Stock Market Returns of Singapore and Other ASEAN-5 Countries
Undergraduate Research Project Page 25 of 134 Faculty of Business and Finance
proximity of geographic. Malaysia stock index (KLCI) which being influenced
positively by Singapore stock index (STI) (Click & Plummer, 2005).
In conversely, Malaysia and Singapore stock market returns influenced each
other weakly was recorded at the period of post-crisis (Lim, 2007). Yi and Tan
(2009) depicted that the correlation between equity markets of Malaysia and
Singapore in a very small portion by using data from MSCI Malaysia, MSCI
Singapore and MSCI AC Far East index.
After taking past researches into account, most researches have the same view
with hypothesis which stated that stock markets of Malaysia and Singapore are
highly correlated. By contrast, there is only a few researches stating that there
the stock markets of Malaysia and Singapore are weakly correlated. Stock
market of Malaysia acts as one of the most influential stock market, facilitate
and influence the Singapore stock market. Due to the close geographical
distance between Singapore and Malaysia, the linkages and integration of stock
market between these two countries will be always linked together.
2.1.3 Indonesia Stock Market
Jakarta Composite Index (JCI) is represented as an Indonesian stock market
return. All stocks traded at Indonesia Stock Exchange (ISX) are included under
the JCI Index. The JCI index act as the important indicator for investors to
decide whether to buy or sell their stocks based on Indonesian stock market
performance. Currently, there are more industries carrying out transactions on
the Indonesia Stock Exchange (ISX) as the Indonesian industries grow rapidly
and the index has reached over 4000 (Adam, Gubu & Cahyono, 2014).
One of the study that attempt to examine the relationship between the JCI and
other selected markets as the researchers believe that Indonesia is a potential
market. However, the result turned out to be that Indonesian stock market do not

The Linkage between Stock Market Returns of Singapore and Other ASEAN-5 Countries
Undergraduate Research Project Page 26 of 134 Faculty of Business and Finance
have relationship between both Malaysia and the US stock markets (Beik &
Wardhana, 2011). According to Roca et al. (1998), Indonesian stock market is
not significantly linked to Singapore stock market in the long run and short run
by using Granger Causality test. The result had explained that the Indonesian
stock market is only significant with its own past price rather than other stock
markets. By using the same method as Roca et al. (1998), the result proved that
Indonesian stock market has no significant influence or long run relationship on
Singapore stock market (Azman-Saini et al., 2002). Another study found that
the Indonesian stock market do not have Granger-causal relationship with the
other ASEAN stock markets in the short-run. The Indonesian stock market is
independent from other ASEAN stock markets since Indonesians had
experienced continuing political and economic uncertainties during the crisis
period, which causes the international investors perceived it as a separate market
from ASEAN (Shabri Abd. Majid, Kameel Mydin Meera, Azmi Omar, & Abdul
Aziz, 2009).
By contrast, there are several empirical studies showing that Indonesian stock
market return has a relationship with the other countries stock markets return.
According to Royfaizal et al. (2009a), the results show that the Indonesian stock
market has a unidirectional causal effect to U.S stock market by using Granger-
causality test. Karim and Karim (2012) found that Singapore stock market has
the highest correlation with the Indonesian stock market, which indicated that
there is a short-term movement among markets. Furthermore, it will benefit
investors to make short-term diversification or speculative activities. Another
researcher had proved that the Indonesia stock market show closer linkages with
Singapore stock market across the period as measured by the co-movement of
the stock market returns (Ng, 2002). According to Janor and Ali (2007), there is
a long-run relationship between Indonesian stock market and Singapore stock
market determined by Cointegration test. Thao and Daly (2012) had examined
the long run relationships between stock markets in the Southeast Asia region
which include Indonesia and Singapore. The results proved that there is a
correlation amongst the market indices. Therefore, the Indonesian stock market
is expected to have positive relationship against Singapore stock market.

The Linkage between Stock Market Returns of Singapore and Other ASEAN-5 Countries
Undergraduate Research Project Page 27 of 134 Faculty of Business and Finance
2.1.4 Thailand Stock Market
Stock Exchange of Thailand (SET) index is denoted as the equity market index
of Thailand. All of the listed companies will use SET index as proxy index
while undergo trading in Thailand stock market. SET index which emphasised
two main components, which are current market value (CMV) and base market
value (BMV), and compare these two components among all of the listed
common stock.
Chancharat et al. (2008) found that in the period of both the pre- 1997 crisis and
post-1997 crisis, relationship between Thailand stock market and Singapore
stock market was positively related. Moreover, the stock market return of
Singapore had influenced in a flash on Thailand stock market. There is a high
correlation between Thai stock market returns and Singapore stock market
returns during the period of post-1997 crisis (Karim & Karim, 2012).
Aumeboonsuke (2012) investigate the hypothesis of weak form efficiency
among six stock market indices of the ASEAN and research demonstrated that
during the period from 2001 to 2012, stock market of Thailand and Singapore
have been enhanced efficiency of stock market, excluding other ASEAN
member countries. After the period of 1997 financial crisis, Singapore and
Thailand stock markets improved to more efficient (Kim & Shamsuddin, 2008).
By contrast, there is unfavourable relationship between Thai and Singapore
stock market which indicate negative relationship between these two countries
stock market. Click and Plummer (2005) examined the feasibility of stock
market returns integration between five countries of ASEAN-5 and stated that
there is negative correlation between Singapore and Thailand stock market. A
one percent raise in stock market returns of Thailand collaborated with one
percent drop in Singapore stock market returns.

The Linkage between Stock Market Returns of Singapore and Other ASEAN-5 Countries
Undergraduate Research Project Page 28 of 134 Faculty of Business and Finance
Bidirectional Granger causality had been discovered between Thailand and
Singapore stock market returns (Chancharat et al., 2008). In short run, the
movement of stock returns of Thailand will be affected by stock returns
performance in Singapore. On the same time, performance of stock returns in
Singapore also will being influenced by Thailand stock returns.
There are more researches holding that there is positive correlation of stock
market returns between Singapore and Thailand than researches which indicate
negative relationship. During the financial crisis 1997, the floating or fluctuation
of Thai baht had a greater impact on neighbour countries, Singapore was also
impacted and resulted in depreciation of currency and posed small damage to
Singapore stock market. In such cases, a positive relationship between Thailand
and Singapore could be discovered.
2.1.5 Philippines Stock Market
The Philippines stock market return (Philippine Stock Exchange Index, PSEI) is
the national stock exchange index in Philippines, which is the product of
merging of the Manila Stock Exchange and Makati Stock Exchange. PSEI is the
most effective indicators to determine Philippines market condition. The high
potential of the Philippines economy is being recognised as the top 16
economies of the world. Thus, the stock market movement in Philippine has
become important prediction or forecast to the international investors (Chen &
Diaz, 2014).
There are a few studies found that the Philippines stock market is less correlated
to the Singapore stock market. According to Karim and Karim (2012), the
Philippines stock market is the lowest correlated market return among ASEAN
markets against the Singapore stock market. The Singapore stock market is
unaffected by the others stock markets, which include the Philippines, whereas
the Singapore stock market is highly influenced to the Philippines (Phuan et al.,
2009).

The Linkage between Stock Market Returns of Singapore and Other ASEAN-5 Countries
Undergraduate Research Project Page 29 of 134 Faculty of Business and Finance
According to Ng (2002), Philippines stock market has a stronger linkage
towards the Singapore stock market. This result is due to the reformation of the
country and foreign investors are confident about investing in Philippines.
Kabigting and Hapitan (2013) also found that the Philippines stock market have
significant relationships with Indonesia, Singapore and Thailand which is
examined by regression and co-integration model. The finding from Roca et al.
(1998) found that there is a unidirectional causality linkage between Philippines
and Singapore stock market, measured by Granger Causality test. These results
occurred could be due to the Singapore has greater investment in the Philippines,
but the Philippines does not do same as Singapore. Hence, the Philippines
market would affect the Singapore stock market (Roca et al., 1998). In the
contrast, Azman-Saini et al. (2002) found that there is a bidirectional causality
between Philippines and Singapore. The Philippines stock markets have
significant influence on the Singapore stock markets in the long run. The
researcher’s result is consistent with Azman-Saini et al. (2002) as there is some
evidence of bidirectional relationship of the stock market between Philippine
and Singapore (Thao & Daly, 2012). From past studies, majority of studies
found that the Philippines stock market has significant relationship towards
Singapore stock market. Hence, the result is expected to be consistent with the
majority researchers.
2.2 Review of relevant theoretical models
2.2.1 International portfolio diversification
International portfolio diversification is one way of management of investment
risk by allocation of investment portfolio which consist of a few types of
international securities in different market. International portfolio diversification
able to minimise the exposure of portfolio risk towards investors and increase
the return. To diversify the portfolio risk efficiently, the changes of international

The Linkage between Stock Market Returns of Singapore and Other ASEAN-5 Countries
Undergraduate Research Project Page 30 of 134 Faculty of Business and Finance
securities in different markets should be less than perfectly correlated.
According to Hakeem, Tsoho and Dogara (2016), international portfolio theory
was derived from the study of Modern Portfolio Theory.
International portfolio diversification works because the international monetary
and capital market had become more integrated (Royfaizal et al., 2009b). The
more integrated international money and capital market shows that the
international financial markets are highly correlated and interdependent.
Therefore, by analysing the integration of international stock market,
international portfolio diversification able to help the investors to hedge the risk
exposed and increase return. When the changes of stock price of securities in
different market are less than perfectly correlated, the stock price will not move
in exactly same direction thus diversification function (Siklos & Ng, 2001). The
loss of investors in a security able to be covered by the gain from investing in
other securities which the changes is move in opposite direction with the
respective security thus the loss of the investor will be minimised or offset by
the gain.
Royfaizal et al. (2009b) stated that the investors will be benefited from their
portfolio investment if they obtain the knowledge of international portfolio
diversification and the equity market linkages across countries. These
knowledges enable the investors to allocate and manage their asset more
intelligently and efficiently.
2.2.2 Modern Portfolio Theory
Modern Portfolio Theory is the theory introduced by Harry Markowitz in 1952.
Modern Portfolio Theory stated that all investors are allowed to diversify their
portfolio internationally to minimise the systematic risk level in portfolio to a
level lower than the systematic risk in their home country (Bashiri & Zadeh,
2014). Markowitz (1952) stated that Modern Portfolio Theory examine the

The Linkage between Stock Market Returns of Singapore and Other ASEAN-5 Countries
Undergraduate Research Project Page 31 of 134 Faculty of Business and Finance
relationship between beliefs and choice of portfolio by investors based on the
"expected returns - variance of returns" rule geometrically.
The choice of portfolio is based on the level of risk and return. The investors
select investment portfolio based on two rules which are maximise the
discounted value of future returns and minimise the investment risk
(Markowitz,1952). However, the maximum expected return portfolio not
necessary comes with the minimum risk. Investors can minimise their portfolio
risk by diversify it.
There are a few fundamental assumptions stated in Modern Portfolio Theory.
First, Markowitz assume that all investors are seeking to formulate portfolio
with maximum return and minimum risk. Second, if the expected returns are
low, investors are not willing to accept portfolio with high level of risk. He also
assumes that investors will receive all relevant and appropriate information
which will affect their investment decision regularly in timely basis. Fourth,
there are unlimited amount of capital allowed for the investors to borrow or lend
at risk free rate of interest. Next, the financial markets also assume to be
perfectly efficient and there are no transaction costs or taxes included in the
market. Lastly, investors are possible to choose the securities whose individual
performance is independent from another portfolio investment (Markowitz,
1952).
2.2.3 Asset pricing models
Asset pricing model is an important theory in the word of finance, given its
significant role in the valuation of a financial asset. The purpose of asset pricing
model is to determine required rate of return of investor on a financial asset,
taking into account the risk-return component.
Asset pricing models can be classified into a few main categories. The first
category assumes perfect integration of world capital markets and that risk of an

The Linkage between Stock Market Returns of Singapore and Other ASEAN-5 Countries
Undergraduate Research Project Page 32 of 134 Faculty of Business and Finance
asset can be purely associated with the covariance of local returns in the world
market portfolio (Chen, 2012). Some models that exemplify this category of
asset pricing theories are the international capital asset pricing model (ICAPM)
and the international arbitrage pricing model. There are also asset pricing
models on another extreme category, which assume perfect segmentation of a
market from the world market. In other words, the market can serve as an
adequate proxy to the world market (Chen, 2012).
2.2.3.1 International capital asset pricing model
The theory of international capital asset pricing model (ICAPM) was an
extension to the capital asset pricing model to include factors that may affect
required rate of return and overcome some unrealistic assumptions of the
original CAPM. The CAPM assumes no exchange risk hedge incentive to
investors because every consumer in a country translates investment return into
consumption like everyone else in the world, meaning that the investor diversity
was ignored (Dumas, 1994).
On the other hand, the ICAPM can account for stochastic inflation of countries
and deviations from the principle of purchasing power parity, assuming a
constant investment opportunity set (Stulz, 1995). This theory acknowledges the
fact that cross-border investment is subjected to the following two exposures,
namely the sensitivity of a nation’s index to a global portfolio and the exchange
rate of the nation’s currency relative to another currency (Fernandez, 2005). The
ICAPM, therefore, can predict the required rate of return by considering both
market risk and exchange rate risk.
Based on generalisations done by Sercu (1980), the ICAPM can be generally
expressed in the following terms, taking into account the foreign currency
exchange rate exposure:
E(Ri) = Rf + β1(Rm – Rf) + β2(RFC),

The Linkage between Stock Market Returns of Singapore and Other ASEAN-5 Countries
Undergraduate Research Project Page 33 of 134 Faculty of Business and Finance
where E(Ri) = Expected rate of return.
Rf = Risk-free rate in domestic market.
β1 = Beta accounting for systematic risk in the market.
Rm-Rf = Risk premium for global market measured in terms of
investor’s local currency.
β1 = Beta accounting for systematic risk in foreign currency
exchange.
RFC = Risk premium for foreign currency exchange.
There were a few assumptions underlying the model, namely joint log-normal
distribution of asset price and exchange rate; presence of single consumption
good or a common basket of consumption goods; continuous and costless
trading of consumption goods; absence of transaction costs, tariffs,
transportation costs, taxes or other barriers to investment trading; risk-averse
investors as price takers (Stulz, 1995).
Past literatures had been testing on the validity of the ICAPM in predicting
international investors’ required rate of return. Engel and Rodrigues (1989) have
rejected the ICAPM. De Santis (2010) found that the ICAPM only partially
correct in predicting the return and that the ICAPM only partially influence the
geography of an international portfolio held by an investor. However, the
ICAPM demonstrated superiority to CAPM in predicting the required return of
international portfolio. In his study, Dumas (1994) found that while classical
CAPM was rejected using business cycle indicators as instrumental variables,
the ICAPM holds.
Given the limitations of the ICAPM, many authors attempted to derive or
improve the original ICAPM (Arouri, Nguyen, & Pukthuanthong, 2012;
Lauterbach & Reisman, 2004).

The Linkage between Stock Market Returns of Singapore and Other ASEAN-5 Countries
Undergraduate Research Project Page 34 of 134 Faculty of Business and Finance
2.2.3.2 International arbitrage pricing model
The international arbitrage pricing model, similar to that of the ICAPM,
accounts for the differences in investor consumption preferences across borders,
however, the international arbitrage pricing theory does not require the portfolio
of the original assets to be a factor of the model (Solnik, 1982). As such, the
technical limitation caused by aggregation and currency exchange will not be
present when an international arbitrage pricing model is applied.
Subsequent literatures recorded effort to improve the applicability of the
international arbitrage pricing model. For example, while the international
arbitrage pricing model proposed by Solnik (1982) assumed fluctuation in
currency had the same factor structure as the return of assets, it can be improved
in a way that it accounts for the exchange rate risks that may affect international
portfolio returns (Ikeda, 1991).
Some literatures had tested the feasibility of the international asset pricing
theory in predicting the international returns. The study carried out by Cho, Eun
and Senbet (1986) had turned out to reject the international arbitrage pricing
model but did not rule out the possibility that the international arbitrage pricing
theory may hold true for a regionally integrated capital market. Bansal, Hsieh
and Viswanathan (1993) made a comparison between linear, conditional linear
and nonlinear international arbitrage pricing models and found that only the
nonlinear arbitrage pricing model can adequately explain the behaviour for
cross-sectional international returns.
2.2.4 Law of One Price
Moffett, Stonehill and Eiteman (2011) stated that Law of One Price refer to the
fact that for similar products, the price should be same even the product was
sold in different markets, different countries and different currencies provided
there were no restrictions existed and transaction cost incurred. Lee and Goh
The Linkage between Stock Market Returns of Singapore and Other ASEAN-5 Countries
Undergraduate Research Project Page 35 of 134 Faculty of Business and Finance
(2016) also define Law of One Price as the valuation of similar securities should
be the same if the securities have the same risk characteristics even they trade in
different markets in different countries.
If Law of One Price holds, the Purchasing Power Parity exchange rate can be
obtained from the relative prices of identical products in different markets and
different currencies and the spot exchange rate when the markets are efficient.
The formula is as follows:
Pa = Pb * S
Where:
Pa = Price of product in country A
Pb = Price of product in country B
S = Spot exchange rate
The principle of Law of One Price is the prices of products in different markets
will move to the equilibrium if no restrictions exists and transaction costs incur
and thus the competitive market exist (Moffett et al., 2011). When the Law of
One Price not holds, arbitrage profits will exist. However, after the arbitrager
taken the arbitrage actions, the price differences will the eliminated then
equilibrium of price achieved provided that the markets are efficient and no
restrictions and transaction costs exist. The stock markets are proved to be
integrated if the prices of shares in different markets show the common
equilibrium path in long run (Lee & Goh, 2016). The investors may make a
better and more efficient investment decision based on the integration of
markets.
2.2.5 Efficient Market Hypothesis
Efficient Market Hypothesis (EMH) stated that a capital market is said to be
liquid and efficient when the participants in the market are exposed to all

The Linkage between Stock Market Returns of Singapore and Other ASEAN-5 Countries
Undergraduate Research Project Page 36 of 134 Faculty of Business and Finance
available information and the stock price responded and fluctuated rapidly when
any new information announced (Reily & Keith, 2012). EMH theory is
developed by Professor Eugene Fama during 1970. Kelikume (2016) further
explain that in an efficient capital market, moral hazard problem such as
asymmetric information will not exist. Every capital market participant should
have equal rights to ensure that they are provided with the latest and most
updated information at the same time.
According to Bisen and Pandey (2013), efficient market provides all available
information to the investors create an efficient way for the investors to analyse
the movement of asset price reflect and thus forecast and make a investment
decision based on the information obtained in efficient capital market. However,
Soon, Baharumshah and Chan (2015) suggested that if market efficiency exists,
the price of an asset is unpredictable since it change rapidly.
According to Reily and Keith (2012), Professor Fama had divided the EMH to
three sub-hypotheses based on the degree of information exposed to the
investors. Three sub-hypotheses include weak form EMH, semi-strong form
EMH and strong form EMH.
Weak form EMH stated that the asset price only reflects the past or historical
information in the capital market. Future movement of an asset price cannot be
predicted in weak form EMH. On the other hand, semi-strong form EMH refer
to the asset price affected by all current and publicly material information in the
capital market. An arbitrage profit will exist in the capital market under the
condition of weak form EMH and semi-strong form EMH (Bisen &
Pandey ,2013). The asset prices are affected rapidly by all public and private
material information under the strong form EMH theory. A capital market under
the condition of strong form EMH is consider as an efficient market which
asymmetric of information will not occur and that arbitrage profit opportunity is
not possible (Bisen & Pandey ,2013).

The Linkage between Stock Market Returns of Singapore and Other ASEAN-5 Countries
Undergraduate Research Project Page 37 of 134 Faculty of Business and Finance
2.3 Theoretical framework
Figure 2.3: Theoretical framework
Independent variables: Dependent variables:
The figure above illustrates the basic framework demonstrating the relationship
between Singaporean stock market returns and the independent variables selected. It
was proposed that the Singapore stock market return (STI) has either unilateral or
bilateral relationship with stock market returns of Malaysia (KLCI), Indonesia (JCI),
Thailand (SET) and Philippines (PSEi).
The dependent variable is expected to be influenced by the independent variables. This
research project determines the relationship by using monthly data for stock market
returns for the time period from January 2005 to December 2016.
Malaysian stock
market return
Philippines stock
market return
Singaporean stock
market return
Thailand stock
market return
Indonesian stock
market return
The Linkage between Stock Market Returns of Singapore and Other ASEAN-5 Countries
Undergraduate Research Project Page 38 of 134 Faculty of Business and Finance
2.4 Conclusion
This chapter has discussed the relationship of the Singapore stock market return and the
stock markets return of other ASEAN-5 countries literally based the previous studies.
Most of the studies stated that the Singapore stock market is integrated with the others
stock markets. Some relevant theoretical models also discussed in this chapter to
support our study. Next, theoretical framework has showed a clearer picture of the
relationship between the dependent variable and independent variables.
The Linkage between Stock Market Returns of Singapore and Other ASEAN-5 Countries
Undergraduate Research Project Page 39 of 134 Faculty of Business and Finance
CHAPTER 3: METHODOLOGY
3.0 Introduction
This chapter discusses the overview of research methodology. Research design, data
collection methods, sampling design, data processing and data analysis will be included
in this chapter. This research project is trying to study the interrelationship between the
ASEAN-5 countries stock market return, including Singapore, Malaysia, Thailand,
Philippines and Indonesia. This research project also studies how the stock markets of
these countries affected Singapore stock market return. Singapore stock market return
act as dependent variable while other countries as independent variables in this research
project. All the data from January 2005 to December 2016 were obtained from
Bloomberg Terminal.
3.1 Research Design
In this research project, quantitative study is carried out in order to conduct the
objective of the research project. According to Muijs (2010), quantitative study is a
social research that is used to identify the problems by collecting data in which the data
can transform into numbers or statistics. In other words, it is a statement which
is expressed in numerical terms. Other than that, it also can generalise results from large
sample population and the method of data collection is more structured. Quantitative
study also focuses in testing a specific hypothesis and make prediction based on the
cause and effect (Sukamolson, 2010). For further investigation, E-views 8 is applied
and needed in this research project to compute the variables data into empirical results.
The variables data is collected from Bloomberg Terminal of University Tunku Abdul
Rahman (UTAR).

The Linkage between Stock Market Returns of Singapore and Other ASEAN-5 Countries
Undergraduate Research Project Page 40 of 134 Faculty of Business and Finance
3.2 Data collection methods
All the variables in this research project were secondary data obtained from Bloomberg
Terminal provided by the main library of Universiti Tunku Abdul Rahman (UTAR)
Kampar campus. The Bloomberg Terminal can provide information about the historical
prices of stock market indices selected as proxies for stock market prices for the
purpose to this project. The stock market indices in which data were retrieved include
Singapore Straits Time Index (STI), Malaysia Kuala Lumpur Composite Index (KLCI),
Indonesia Jakarta Composite Index (JCI), Stock Exchange of Thailand index (SET),
and Philippines Stock Exchange index (PSEi).
3.2.1 Secondary data
As mentioned in the previous section, secondary data was the preferred data
source for this research project. Tasic and Feruh (2012) defined secondary data
as a type of data collected by a party for their own purpose, in which can serve a
useful purpose to other researches as well. Nevertheless, secondary data can also
be collected for no specific research purposes (Sorensen, Sabroe & Olsen, 1996).
For example, governmental agencies could collect certain data to fulfil multiple
objectives like management and planning; controlling; monitoring; and research.
There are advantages in using a secondary data in an analysis. Firstly, it is less
time consuming and less expensive (Rew, Koniak-Griffin, Lewis, Miles &
O'Sullivan, 2000). It is time consuming for a researcher to collect data in which
is difficult to get, especially when there is limited resource to approach a large
random sample. Besides, the secondary data can be advantageous in terms of
sample size and reduced tendency to bias (Sorensen et al., 1996). Nonetheless,
the use of secondary data in a research analysis has its drawback. A researcher
has no control over the selection, quality and the methodology of data collection
(Rew et al., 2000).

The Linkage between Stock Market Returns of Singapore and Other ASEAN-5 Countries
Undergraduate Research Project Page 41 of 134 Faculty of Business and Finance
This research project collects data from for all variables on a monthly basis from
January 2005 to December 2016. The details for the data collected are
summarised in tabular form as below.
Table 3.2.1 Sources of data
Variable Proxy Unit of
measurement
Formula Source
Dependent
variable
Singapor
e stock
market
return
STI
index
return
Index P1 – P0
P0
Bloomberg
Terminal
Independe
nt
variables
Malaysia
stock
market
return
KLCI
index
return
Index P1 – P0
P0
Bloomberg
Terminal
Indonesia
stock
market
return
JCI
index
return
Index P1 – P0
P0
Bloomberg
Terminal
Thailand
stock
market
return
SET
index
return
Index P1 – P0
P0
Bloomberg
Terminal
Philippin
es stock
market
return
PSEi
index
return
Index P1 – P0
P0
Bloomberg
Terminal
Apart from the abovementioned data collection, this research project also
referred to other sources such as journals, articles and textbooks for additional
reference. These additional references can act as a guidance in producing a more
precise analysis of the data.

The Linkage between Stock Market Returns of Singapore and Other ASEAN-5 Countries
Undergraduate Research Project Page 42 of 134 Faculty of Business and Finance
3.3 Sampling Design
3.3.1 Target Population
3.3.1.1 Singapore
Investigation on the integration between stock market return of Singapore with
stock markets return of remaining four ASEAN-5 countries is the objective of
this research project. In other words, this research project target on whether the
dependent variable which is Singapore stock market performance will be
affected by independent variables which included the others four ASEAN-5
countries (Malaysia, Indonesia, Thailand and Philippines) stock markets
performance. This research project using the 12-year time series data which is
from January 2005 to December 2016 and the data used is in monthly basis. The
Straits Times Index (STI) is chosen as proxy to Singapore’s stock market
performance. STI index acts as the market barometer and benchmark index in
Singapore stock market. STI index is capitalisation-weight index which capture
the performance of top 30 most liquid and public listed companies in Singapore
Exchange. Therefore, STI index is the index which is suitable to proxy the
Singapore stock market performance.
3.3.1.2 Malaysia
To determine the integration between the Singapore stock market return and
Malaysia stock market return is one of the goal of this research project.
According to that, this research project focus on how the Singapore stock
market returns (as independent variable) is being influenced by Malaysia stock
market performances (as dependent variable). 12 years monthly time series data
which from January 2005 to December 2016 is used in undergoing this research
project. Kuala Lumpur Stock Exchange (KLCI) as stock market indices of

The Linkage between Stock Market Returns of Singapore and Other ASEAN-5 Countries
Undergraduate Research Project Page 43 of 134 Faculty of Business and Finance
Malaysia is selected to measure the performance of Malaysia stock market while
Straits Time Index (STI) as proxy of Singapore stock market returns. As a major
stock market index, the FTSE Bursa Malaysia KLCI Index (Kuala Lumpur
Composite) traces the 30 of largest companies’ stock market performance with
full market capitalisation recorded on the Bursa Malaysia’s Main Board. Thus,
KLCI index can be ranked as top index which is most appropriate as base index
of Malaysia.
3.3.1.3 Indonesia
This research project targets on the interrelationship between stock market
returns between Singapore and Indonesia. The aim of the research project is to
investigate whether independent variable, Indonesia stock market performance
will affect dependent variable, Singapore stock market and the significance of
the effect from January 2005 to December 2016. A monthly data is used to
conduct this research project. The stock market performance are proxy using the
stock index value. Indonesia stock market performance is proxy using Jakarta
Stock Exchange Composite Index (JCI) and Singapore stock market
performance is proxy using Straits Time Index(STI). JCI index is the
capitalisation-weighted index which capture the performance of all stock of the
company listed in Indonesia Stock Exchange. Therefore, JCI also acts as the
benchmark index and market barometer of the Indonesia stock market and this
index is reliable to use to proxy the stock market performance of Indonesia.
3.3.1.4 Thailand
The aim of this research project is focus on the connection of the stock market
performances between two countries, which are Singapore and Thailand. This
research project is carried out to verify whether the dependent variables,
Singapore stock market returns, will be influenced by Thailand stock market
returns which act as independent variable. A monthly time series data which
The Linkage between Stock Market Returns of Singapore and Other ASEAN-5 Countries
Undergraduate Research Project Page 44 of 134 Faculty of Business and Finance
consists of 12 years from January 2005 to December 2016 is being chose to go
through this research project. The Stock Exchange of Thailand (SET) Index and
Singapore Straits Time Index (STI) are selected as proxies of stock market
returns for Thailand and Singapore respectively. SET acts as vital roles as stock
market index of Thailand as SET index will dispute the comparison between all
listed common stocks current market value (CMV) with their base market value
(BMV). Therefore, the most suitable index to measure stock market
performance of Thailand will belong to SET.
3.3.1.5 Philippines
The research project purpose is to find out whether the Philippines stock market
return will have significant impact to Singapore stock market return from
January 2005 to December 2016. This research project aims to determine the
relationship between dependent variable which is Singapore Straits Time Index
(STI) and the chosen independent variable which is Philippines Stock Exchange
index (PSEi) from the year 2005 to 2016. Philippines Stock Exchange index
(PSEi) act as a benchmark to determine the Philippines market performance. It
is a capitalisation-weight index that make up of stock representative of the
Industrial, Properties, Services, Holding Firms, Financial and Mining & Oil
Sector of Philippine Stock Exchange. In other words, it comprises of 30 listed
company which represent the general movement of stock market in Philippines.
These listed companies must fulfil the standards under the revised policy which
is the minimum free-float level must be 12%, it must be rated among the top 25%
in terms of median daily value, and the ranking of Top 30 qualified companies
from full market capitalisation. Hence, the PSEi has become an essential
indicator for local and international investor to construct a decision or plan in
portfolio (Chen & Diaz, 2014). The data is in monthly basis in order to conduct
this research project.

The Linkage between Stock Market Returns of Singapore and Other ASEAN-5 Countries
Undergraduate Research Project Page 45 of 134 Faculty of Business and Finance
3.3.2 E-views 8
E-views 8 will be used in this research project for the purpose of running all the
hypothesis testing and diagnostic checking. E-Views 8 is a statistical software
package that is useful for researchers to conduct study for data analysis,
regression and forecasting. E-views 8 provides many efficient tools for
researchers such as useful data management, econometric analysis tools, and
high-quality graphical and tabular output. Moreover, it is able to support
Microsoft Excel file. As E-Views 8 was created by economists and most of its
function are in economics, it is used for time series data, cross-section or
longitudinal data. E-Views 8 is a useful software since it is designed with
convenient and consumer-oriented technology and easy-to-use interface (Van
den Bossche, 2011).
On top of that, E-views 8 is the most suitable software as it supports the handing
of time series data and complex date which is important and useful for this
research project. E-views 8 will be used to find out whether there is any
econometric problem such as Multicollinearity, Heteroscedasticity,
Autocorrelation, Model Specification and Normality Test. In addition, the
econometric problem can be solved by using the appropriate remedial test. The
unit root test will be used to determine the stationary of the model. Furthermore,
E-views 8 will be used to run the Johansen Co-integration test and Granger
Causality test as well. Moreover, the Multiple Linear Regression Model will
also be run by using this software to test the relationship between these variables.
E-views 8 is used to test Ordinary Least Square (OLS) model given that the
OLS method is one of its functions. The T-test and F-test from the result of OLS
can be used to examine the significance of the model.

The Linkage between Stock Market Returns of Singapore and Other ASEAN-5 Countries
Undergraduate Research Project Page 46 of 134 Faculty of Business and Finance
3.4 Data processing
Literature review was carried out on a minimum of 40 journals related to the title of this
research project, which is ‘The Linkage between Stock Market Returns of Singapore
and other ASEAN-5 Countries’. A summary was done so that analysis can be
conducted more efficiently on the findings and results of the journals reviewed. The
next step was data collection whereby data was retrieved from the Bloomberg terminal
for monthly closing prices for STI, KLCI, JCI, SET and PSEi from January 2005 to
December 2016.
Then, the raw data underwent processing using Microsoft Excel to calculate the return
and transform the returns into logarithmic form. Quigley and Ramsey (2008) pointed
out that log returns tend to show normal distribution than simple returns. This is
important since normality assumption is required in following empirical deductions.
The transformation undergone by the data are as follows
R = P1 – P0
P0
where R = stock market return
P0 = initial price
P1 = final price
Logarithmic transformation of stock market return is given by:
log return = log(P1) – log(P0)
= log(P1/P0)
= log(1+P1 – P0
P0
)
= log(1+R)
The processed data was then imported to Eviews 8 for further empirical results. Finally,
econometrical analysis can be carried out after the empirical results for hypothesis
testing and diagnostic checking were obtained from Eviews 8.

The Linkage between Stock Market Returns of Singapore and Other ASEAN-5 Countries
Undergraduate Research Project Page 47 of 134 Faculty of Business and Finance
Figure 3.4: Diagram of data processing flow
Review and summary of literatures related to the title of the research project.
Collection of data from Bloomberg Terminal at UTAR Library.
Rearrangement, calculation and log-transformation of stock market returns
Import of data into Eviews 8 so as to perform hypothesis testing and diagnostic checkings
Availability of empirical results for analysis and interpretation

The Linkage between Stock Market Returns of Singapore and Other ASEAN-5 Countries
Undergraduate Research Project Page 48 of 134 Faculty of Business and Finance
3.5 Data Analysis
3.5.1 Diagnostic checking
3.5.1.1 Multicollinearity
Multicollinearity problem exists when there are some independent variables
highly correlated to one another in a multiple regression model (Farrar &
Glauber, 1967). The model that consists of multicollinearity problem will lead
to misleading results and it will be challenging to find out which independent
variables affect the dependent variables (Vatcheva, Lee, McCormick, & Rahbar,
2016).
The high multicollinearity will encounter several problems in this model
(Gujarati & Porter, 2009). Firstly, it will cause a wider confidence interval
which result in likely to accept the “zero null hypothesis”. Secondly, it will have
large variances and covariances of Ordinary Least Square (OLS) estimators
even the OLS estimators are still Best, Linear, Unbiased and Efficient (BLUE).
It will make the precise estimation difficult. Thirdly, as the confident intervals
become wider which lead to the t-ratio of the coefficients tends to be
insignificant. In addition, R-square, the overall measure of goodness of fit in this
model will be high which will lead to invalid hypothesis testing. However, the
OLS estimators will remain (BLUE) because the collinearity will not influence
the OLS property and assumptions.
Unfortunately, there is no standard way to detect multicollinearity problem in a
model. However, there are some rules of thumb to find out the existence of
multicollinearity problems (Farrar & Glauber, 1967). Firstly, the high “R-
squared” but few significant of t-ratios can detect the existence of
multicollinearity in the model. Secondly, another suggested rule of thumb is the
high pair-wise correlation coefficients between independent variable which able

The Linkage between Stock Market Returns of Singapore and Other ASEAN-5 Countries
Undergraduate Research Project Page 49 of 134 Faculty of Business and Finance
to detect multicollinearity problem. Thirdly, multicollinearity can be detected by
the variance inflation factor (VIF) method. Based on the rule of thumb, if the
VIF of the variable is more than 10 or the R-square is more than 0.90, it can be
concluded that the variable is highly collinear. Lastly, the tolerance method
(TOL) is also one of the indicators to detect multicollinearity. The chance of
having multicollinearity problem is high, if the TOL is nearest to the zero.
The following shows the formula for VIF and TOL:
VIFj = 1
1-Rj2 TOLj =
1
VIFj
According to Gujarati and Porter (2009), the most common way to solve
multicollinearity problem in the model is to identify the collinear independent
variables and remove all collinear variables until there is left one remaining.
When the model detected multicollinearity, one of the common ways is to drop
one of the variable from the model. Another method to measure
multicollinearity problem is increasing the sample size of the model.
Furthermore, it is possible to reduce the multicollinearity by adding new data in
a model that consist of the same variable collinearity that may not be so serious
as in the previous model. The transformation of variables able to reduce the
collinearity in the original variable.
3.5.1.2 Heteroscedasticity
The Heteroscedasticity problem can be referred to the non-constant variances of
the error term in the model (William, 2002). Classic Linear Regression Model
assumes that the disturbance should have a constant variance independent of
observations. Nevertheless, the variance of the error is no longer assumed to be
constant when the unequal spread of variance exists. There are a few reasons
why the heteroscedasticity problem occurred such as human behaviour, different
data collecting techniques, outliers, misspecification of models and incorrect
functional form (Gujarati & Porter, 2009).

The Linkage between Stock Market Returns of Singapore and Other ASEAN-5 Countries
Undergraduate Research Project Page 50 of 134 Faculty of Business and Finance
According to Long and Ervin (2000) the heteroscedasticity problem exists in the
model will have three consequences on OLS estimators. First, OLS estimators
still can be considered as unbiased and consistent, even though there is a
heteroscedasticity problem because the independent variables are uncorrelated
with the error terms. Second, the variance of the estimators is higher, therefore it
will lead to inefficiency of OLS estimators. Thirdly, the variances and standard
errors will be underestimated. Hence, confidence intervals and hypothesis test
based on t-statistics and F-statistic are unreliable due to misleading of
conclusion.
There are several methods to detect heteroscedasticity in the model. According
to Michael (2015), the detection of heteroscedasticity problem can be examined
in two approaches, categorised as formal approach and informal approach.
Informal approach refers to the graphical method whereas the formal approach
refers to the ARCH test, White test, Breusch-Pagan-Godfrey test, Glesjer test
and Park test. ARCH test which can only be applied to detect heteroscedasticity
problem in time series data was developed by Engle (1982).

The Linkage between Stock Market Returns of Singapore and Other ASEAN-5 Countries
Undergraduate Research Project Page 51 of 134 Faculty of Business and Finance
Detection of
Heteroscedasticity Problem
ARCH Test
Nature of Problem
Graphical Method
Informal
Formal
Park Test
Glejser Test
Breusch-Pagan
(BP) Test
White Test
Figure 3.5.1.2: Detection of Heteroscedasticity Problem
There are two remedial measures for heteroscedasticity problem in the model
(Long & Ervin, 2000). First, the model can be re-estimated by applying the
Generalised Least Squares method and produce a new set of parameter estimates
which would be more efficient than the OLS ones. The estimators obtain by new
set model become BLUE by dividing standard deviation of error term. Secondly,
the White’s Heteroscedasticity can be used when the error variance for
observations is unknown.
The following is the hypotheses for ARCH test:
H0 : There is no heteroscedasticity problem.
H1 : There is heteroscedasticity problem.
Based on the decision rule, if the value of probability is less than significant
level which is α = 0.01, the H0 can be rejected. Otherwise, H0 cannot be rejected.

The Linkage between Stock Market Returns of Singapore and Other ASEAN-5 Countries
Undergraduate Research Project Page 52 of 134 Faculty of Business and Finance
3.5.1.3 Autocorrelation
Gujarati and Porter (2009) argued that autocorrelation problem can be explained
that the random variable, ordered over time that show nonzero covariance, the
problem may be occurred in the model. It can be explained as there is a
relationship among error terms. Besides, a model that occurs the autocorrelation
problem is the violation of CLRM’s assumption. There are several
consequences if autocorrelation problem happened in a model (Greene, 2003).
a) OLS Estimators are still unbiased and linear. However, minimum variance
property is not satisfied.
b) Confidence intervals and hypothesis test based on t and F distributions are
unreliable. There is a possibility of drawing wrong conclusion which lead to
the hypothesis testing invalid.
c) If the disturbance terms, ui are autocorrelated then the OLS estimate are
non-asymptotic. The variance of random term is may be seriously
underestimated.
d) The presence of autocorrelation in the model may due to dependencies
within the data.
Pure serial correlation and impure serial correlation are the two types of
autocorrelation. The pure autocorrelation exists in the model because of the
underlying distribution of the error term of the true specification of an equation
(passed Model Specification Ramsey Reset Test). The model that suffered for
the impure autocorrelation problem is due to the specification bias like an
incorrect functional form and omitted variables (Gujarati & Porter, 2009).
According to Gujarati and Peter (2009), there are a few ways to detect auto
correlation problems in the model which are Durbin-Watson test, Breusch-
Godfrey LM test Durbin’s h test and Engle’s ARCH test. These tests are listed
below:

The Linkage between Stock Market Returns of Singapore and Other ASEAN-5 Countries
Undergraduate Research Project Page 53 of 134 Faculty of Business and Finance
Figure 3.5.1.3: Detection of Autocorrelation Problem
There are remedies that can be used to overcome the autocorrelation problem.
Firstly, if the model is pure autocorrelation and it is not the result of
misspecification of the model. The most common way is using appropriate
transformation of the original model to eliminate the problem of (pure)
autocorrelation in the transformed mode. Secondly, the Newey-West method
can be applied for large samples in order to obtain autocorrelation-corrected
standard errors of OLS estimators. Thirdly, if the model is incorrectly specified,
the way to solve or minimise the impure autocorrelation problem is adding the
relevant independent variables that play an important role to dependent variable.
This helps the model to become a less serious problem in autocorrelation as well
as heteroscedasticity because it would be better to include more independent
variables than omitted the important independent variables as it will lead to
serious problems (Pollitt, Reece, Mideo, Nussey & Colegrave, 2012).
This following specifies the hypotheses for the test:
H0 : There is no autocorrelation problem.
H1 : There is autocorrelation problem.
According to decision rule, H0 can be rejected if the significant value, α = 0.01
is greater than the probability value. Otherwise, the H0 cannot be rejected.
Durbin Watson Test
Detection of
Autocorrelation Problem
Engle’s ARCH Test
Durbin’s h Test
Breusch-Godfrey Test

The Linkage between Stock Market Returns of Singapore and Other ASEAN-5 Countries
Undergraduate Research Project Page 54 of 134 Faculty of Business and Finance
3.5.1.4 Model Specification
There is various type of model specification errors whereby a model has meet
any of the combination of the conditions such as the omission of a relevant
variable, addition of irrelevant variables, wrong functional form and errors of
measurement bias in the model (Gujarati & Porter, 2009). Sometimes it will be
difficult to collect all important data on variables which is significant to explain
the model. Hence, it will result in model specification bias happened in the
model.
There are a few consequences if existing of autocorrelation problem. Firstly, the
OLS estimators become biased and inconsistent if both of the omitted variable
and included variable is correlated with each other. Secondly, the disturbance
variance of estimators also incorrectly estimated and resulted in the hypothesis
testing and confidence interval become unreliable. Thirdly, the omitted relevant
variables will come after than including of irrelevant variables. However,
another problem will arise if including irrelevant variables such as loss of
efficiency of estimators, loss of degree of freedom and the problem of
multicollinearity.
In order to detect whether there is a model specification problem in the model,
Ramsey Reset Test which designed by Ramsey can be used to examine the
stability of specification error. According to Wooldridge (2013), RESET is
referred as Regression Specification Error Test, and it is used to test whether the
non-linear combinations of the fitted values help to explain the response
variable.
The remedies for model specification problem are often not easy. Theoretically,
the use of instrumental or proxy variables can be attractive. However, it will not
always practical. Therefore, it is important to state the sources of research data,
how the data were collected and what definitions were used.

The Linkage between Stock Market Returns of Singapore and Other ASEAN-5 Countries
Undergraduate Research Project Page 55 of 134 Faculty of Business and Finance
The following are the stated hypotheses for RESET test:
H0 : The model is correctly specified.
H1 : The model is not correctly specified.
Based on the decision rule, if the probability value is less than significant level,
α = 0.01, the H0 can be rejected. Otherwise, do not reject the H0.
3.5.1.5 Normality Test
A normality test is to determine whether a sample data is drawn from a normal
distributed population (Ul-Islam, 2011). Since there are a number of statistical
procedures such as regression, correlation, t test, one-way and two-way
ANOVA test required the assumption of normally distributed of error term in
order to ensure the test is reliable. Thus, the normality test is considered vital
and should be taken seriously.
There are several tests can be used to test for normality, one of the most popular
normality test is Jarque-Bera (JB) test. The JB test also known as goodness-of-
fit test which highlights two derivatives which are skewness and kurtosis
estimates (Jarque & Bera, 1987).
The formula for Jarque-Bera (JB) test-statistic is provided as below:
JB=n [S2
6+
(K-3)2
24]
Where,
n = Sample Size
S = Skewness
K= Kurtosis
The Jarque-Bera (JB) Test hypotheses is shown as below:
H0 : Error terms are normally distributed.
H1 : Error terms are not normally distributed.

The Linkage between Stock Market Returns of Singapore and Other ASEAN-5 Countries
Undergraduate Research Project Page 56 of 134 Faculty of Business and Finance
According to decision rule, if the significant level, α = 0.01 is greater than the
probability value, the H0 will be rejected. Otherwise, H0 cannot be rejected.
3.5.2 Multiple Linear Regression Model
Tranmer and Elliot (2008) stated that Multiple Linear Regression is a statistical
tool to examine or predict a set of independent variables related to a dependent
variable. In order to predict the relationship or impact on dependent variable,
output and informations of a set of estimated independent variables is needed.
Gujarati (2004) stated a few assumptions that need to fulfil.
1. Linear regression model
2. Fixed X values or X values independent of the error term
3. Zero mean value of the disturbance
4. Homoscedasticity
5. No autocorrelation between the disturbances
6. The number of observations (n) must be larger than the number of
parameters (k)
7. The nature of X variables
8. No specification bias
9. No exact co-linearity between the X variables
The model is said to be BLUE if the assumptions above hold where the
estimators in linear form, expected value close or equal to the true value and the
model has minimum variance.
The Economic Function:
logSING = f[Malaysia(MAL), Thailand(THAI), Philipines(PHI),
Indonesia(IND)].

The Linkage between Stock Market Returns of Singapore and Other ASEAN-5 Countries
Undergraduate Research Project Page 57 of 134 Faculty of Business and Finance
Economic Model in Logarithm Form:
Yt = β0 + β1Xt + β2Xt + β3Xt + β4Xt + Ɛt
logSINGt = β0 + β1 logMAL + β2 logTHAI + β3 logPHI + β4 logIND + Ɛt
Where:
logSINGt = the logarithm form of Singapore stock market return (SING) at
year t.
logMALt = the logarithm form of Malaysia stock market return (MAL) at
year t.
logTHAIt = the logarithm form of Thailand stock market return (THAI) at
year t.
logPHIt = the logarithm form of Philippines stock market return (PHI) at
year t.
logINDt = the logarithm form of Indonesia stock market return (IND) at
year t.
Ɛt = Error term
3.5.3 Ordinary Least Square (OLS)
According to Gujarati (2004), the method of ordinary least squares (OLS) or
linear least square is credited by Carl Friedrich Gauss in late 1700’s. It is a
measuring tool that is used for estimate the unknown parameters in linear
regression model. In addition, according to Craven and Islam (2011) the OLS is
one of the simplest and major techniques that used to analyse data and form
Generalised Linear Models, Analysis of Variance (ANOVA) and many other
techniques. OLS also used to analyse data that useful for classification and
hypothesis testing. Other than that, OLS regression is one of the most powerful
regression analysis as it able to traced the model assumptions easily. Those
model assumptions including the constant variance, the effect of outliers using
simple graphical methods and linearity.
The Linkage between Stock Market Returns of Singapore and Other ASEAN-5 Countries
Undergraduate Research Project Page 58 of 134 Faculty of Business and Finance
However according to Gujarati (2004), there are 7 assumptions must be satisfied
in order to compute the OLS estimator.
1. The regression model is linear in the parameters.
2. Fixed X values or X values independent of the error term.
3. Disturbance has a zero mean value.
4. Homoscedasticity
5. There is absence of autocorrelation between disturbances.
6. The nature of X variables.
7. The number of observation (n) have to be greater than the number of
parameter to be measured.
If the OLS meet the above assumptions, it will provide a minimum variation of
unbiased estimation.
3.5.3.1 T-test
In 1908, T-statistic had been introduced by William Sealy Gosset (Box, 1987).
Commonly, T-statistic could be applied appropriately when sample size is small
which less than 30 and the number of parameter is less or equal to 5. A T-test
will show significance of a single variable. Besides, the statistic also needs to
assume that the error term follows the normally distributed but it is unable to
check the overall significant of the model (Massey & Miller, 2006).
This research project used this statistic to examine whether the independent
variables which including Malaysia, Indonesia, Thailand, Philippines stock
market returns have individually significant impact on the dependant variable,
which is Singapore stock market return. In order to conduct the T-test, this
research project will use E-view 8. By using E-view 8, each parameter’s p-
values can be obtained from the output.
The Linkage between Stock Market Returns of Singapore and Other ASEAN-5 Countries
Undergraduate Research Project Page 59 of 134 Faculty of Business and Finance
The following gives the hypotheses for T-test:
H0 : βi = 0, (i = 1,2,3,4) / There is no significant relationship between the
independent and dependent variable.
H1 : βi ≠ 0, (i = 1,2,3,4) / There is a significant relationship between the
independent and dependent variable.
The test statistic for T-test stated:
t=β̂i-βi
se(β̂i)
The decision rules are provided as follows.
H0 is rejected if the t-statistic is lower than critical value or greater than
upper critical value. Otherwise, H0 is not rejected.
H0 is rejected if significant value α = 0.01 is higher than the value of
probability. Otherwise, H0 is not rejected.
3.5.3.2 F-test
R.A. Fisher, an English statistician had developed F-test statistic. According to
Gujarati (2004), the f statistic used to measure the overall significance of the
entire model which is different with the t-test. The F-statistic value and p-value
can be obtained through the E-view 8’s output.
The hypotheses for F-test stated:
H0 : βi = 0 (or βi=βj=0) / The overall model is insignificant.
H1 : βi ≠ 0 (or at least one β is different from 0)
The Linkage between Stock Market Returns of Singapore and Other ASEAN-5 Countries
Undergraduate Research Project Page 60 of 134 Faculty of Business and Finance
3.5.4 Unit Roots Test
Unit root test is an important test to examine the univariate properties or in other
word, stationarity property of the time series data before undergo Johansen-
Juselius cointegration test (Penm, Terrell and Lim, 2004; Royfaizal et al., 2009b;
Wong et al., 2004). Unit root test also known as stationary test. A time series
data with time invariant property means the data is constant on its mean,
variance and autocovariance at various lag which shows a stationary time series
(Gujarati, 2004). Gujarati (2004) suggest that a stationary time series data tends
has constant mean reversion and variance. Therefore, non-stationary time series
data tends to have time varying mean or time varying variance or both. The
property of time invariant of variable can be shown by equation terms as the
following:
Constant mean : E (yt) = μ
Constant Variance : var (yt) = σ2
Time series stationary is important during forecasting time period behaviour for
long term (Gujarati, 2004). This is because each set of non-stationary time series
data only able to forecast the time period behaviour for the particular periods
only. It cannot forecast the behaviour of time period of other period for a time
series non-stationary data. Besides, a non-stationary time series data may come
out misleading and questionable result during estimating the relationship
between variables when applying ordinary least squares regressions (Mahadeva
& Robinson, 2004). The questionable and misleading result in ordinary least
squares regressions will causes the hypothesis testing results in t-test and F-test
invalid thus the model formed will be not accurate. In short, a stationary time
series data is necessary to ensure the accuracy and reliability regression model.
Therefore, a stationary test or unit root test should be carry out before develop
the regression model (Mahadeva & Robinson, 2004).
There are two type of unit root test which are Augmented Dickey-Fuller (ADF) test
introduced by David Dickey and Wayner Fuller in 1979 and Phillips-Perron (PP)
test introduced by Phillips and Perron in 1988 (Abd Karim & Gee, 2008; Click &

The Linkage between Stock Market Returns of Singapore and Other ASEAN-5 Countries
Undergraduate Research Project Page 61 of 134 Faculty of Business and Finance
Plummer, 2005; Siklos & Ng, 2001). The ADF test is the test which use more
commonly by most of the researchers to test the stationary of time series data
(Abd Karim & Gee, 2008; Click & Plummer, 2005; Royfaizal et al., 2009a;
Siklos & Ng, 2001; Wong, et al., 2004).
The hypothesis of unit root test is as follows.
H0 : All variables are not stationary and have unit root.
H1 : All variables are stationary and do not have unit root.
Based on the decision rule, H0 can be rejected when the probability value in the
unit root test is smaller than the significant level (α = 0.01). Otherwise, do not
reject H0.
Gujarati (2004) stated that ADF test is used when the error terms are correlated.
ADF test is carrying out by adding the dependent variable's lagged values.
According to Abd Karim and Gee (2008) and Gujarati (2004), adding the lagged
values of dependent variable able to obtain a pure white noise error term. The
idea of number of lagged difference terms to add is determine by the number of
terms added so that the error terms are serially uncorrelated. The Akaike info
criterion (AIC) and Schwarz criterion (SC) can be used to determine the number
of lags to be included (Abd Karim & Gee, 2008).
Limitation of the ADF test is the ADF test is limited by the number of lagged
difference terms (Gujarati, 2004). The degree of freedom of the regression
model will reduce with the increases of the number of lagged difference terms.
The reduce in the degree of freedom will causes the biased standard error and
test statistic value thus the hypothesis testing results invalid. This limitation of
ADF can be solved by using PP test since the PP test taking into account the
serial correlation of the error term by using the non-parametric statistical
method without included the lagged difference terms (Gujarati, 2004).
The Linkage between Stock Market Returns of Singapore and Other ASEAN-5 Countries
Undergraduate Research Project Page 62 of 134 Faculty of Business and Finance
A time series data which has unit root is consider as non-stationary. If the time
series data is stationary and do not have unit root, then cointegration test can be
proceed.
3.5.5 Granger Causality Test
Granger causality test is a test used to investigate the capability of prediction of
a time series’ future values by applying the past values of another time series
based on linear regression modelling of stochastic processes (Granger, 1969).
Granger and Joyeux (1980) had simplified the definition of Granger causality as
one variable causes another variable, if and only if total probability of two
variables on its own past histories is not exactly same as the probability of the
variable being caused on its own alone past history (Maziarz, 2015). Proper
definitions of information sets are critical significance in the case of Granger
causality test. The model may become biased if neglecting the notion of
information sets (Baumöhl & Výrost, 2010).
In fact, Granger causality test does not support the argument of possible
instantaneous correlation between dependent variable and independent variable.
If both variables are coincidentally correlated with each other, instantaneous
causality presence (Sørensen, 2005). Regarding to Lin (2008), there is exists of
two assumptions of this Granger causality test. First assumption is only the past
can cause the present or future but the future cannot gives any effect towards the
past. Secondly, there is always extraordinary relevant information about an
effect which cannot applies on somewhere else is being consists in a cause.
In generally, Granger causality test can be generated into two main categories,
which are unidirectional causality and bilateral causality. According to that,
unidirectional causality happens when there is only a single way of cause and
effect between independent variable (IV) and dependant variable (DV). There is
either IV causes the DV or DV influences the IV. Bilateral causality refers to

The Linkage between Stock Market Returns of Singapore and Other ASEAN-5 Countries
Undergraduate Research Project Page 63 of 134 Faculty of Business and Finance
two-way relationship between two variables which stated that IV causes the DV
and on the same time DV also has impact on IV.
The hypothesis for the Granger causality test are structured as follows.
H0 : Variable X does not granger causes the variable Y.
H1 : Variable X does granger causes the variable Y.
The Wald F test being uses in test statistic noted as follows.
F=(SSEreduced-SSEfull)/(Kfull-Kreduced)
SSEfull/(n-Kfull-1)
The Granger Causality test decision rule is reject the null hypothesis (H0) if the
probability value is less than the significance level (α) of 0.01 or test statistic
value is greater than the critical value. Otherwise, do not reject H0.
3.5.6 Johansen cointegration test
Cointegration refers to a situation whereby two or more non-stationary time
series, when linearly combined, can result in a stationary combination (Gujarati
& Porter, 2009). According to Gujarati and Porter (2009), two variables are
cointegrated if there is existence of equilibrium, long term relationship between
them.
To investigate the cointegration relationships between variables, the Johansen
cointegration test can be applied. The Johansen cointegration test is a maximum
likelihood method capable of determining the number of cointegrating vectors in
a non-stationary time series model (Skerman & Della Maggiora, 2009). Thus,
for a Johansen cointegration test to be applicable, the variables must not be
stationary at level yet stationary at first difference. As such, unit root test can be
a preceding procedure to the Johansen method. The advantage to the Johansen
cointegration test is that it can determine cointegration relationships on a

The Linkage between Stock Market Returns of Singapore and Other ASEAN-5 Countries
Undergraduate Research Project Page 64 of 134 Faculty of Business and Finance
multivariate level rather that a bivariate level. This is because cointegration
relationship between more than two variables can be investigated using the
Johansen method.
The two tests under the Johansen cointegration test are the Trace test and the
Maximum Eigenvalue Test, all of which are classified as likelihood ratio tests
(Österholm & Hjalmarsson, 2007).
The hypothesis for the Johansen cointegration test for both the Trace test and the
Maximum Eigenvalue test are as follows.
H0 : There is no long-term relationship between the variables.
H1 : There is long-term relationship between the variables.
The decision rule involved is to reject the null hypothesis (H0) if the probability
value of the Trace statistic or the Maximum Eigenvalue statistic is less than the
significant level of 0.01. Otherwise, H0 is not rejected.
In addition, the Eviews 8 application provides the normalised resulting
cointegration relationship between variables. This provide more empirical
support on the inference made respective to the cointegration relationship
(Skerman & Della Maggiora, 2009).
3.6 Conclusion
This chapter has discussed the interrelationship between the dependent variable, stock
market return of Singapore and the independent variables, stock markets return of the
others ASEAN-5 countries. The data are collected from Bloomberg Terminal provided
by University Tunku Abdul Rahman (UTAR). In this research project, a few tests are
conducted to identify the relationship between the dependent and independent variables.
Those tests comprise of Multiple Linear Regression Model, Diagnostic Checking,
Ordinary Least Square (OLS) which include T-test and F-test, Unit root test, Granger

The Linkage between Stock Market Returns of Singapore and Other ASEAN-5 Countries
Undergraduate Research Project Page 65 of 134 Faculty of Business and Finance
causality tests and Johansen Co-integration test. In this research project, all the tests
will be used to solve and detect the multicollinearity, heteroscedasticity, auto
correlation and model specification.

The Linkage between Stock Market Returns of Singapore and Other ASEAN-5 Countries
Undergraduate Research Project Page 66 of 134 Faculty of Business and Finance
CHAPTER 4: DATA ANALYSIS
4.0 Introduction
This chapter will explain the empirical results applied in this research project that
examined by several methodologies. First method will be conduct in this research
project is diagnostic checking which involves multicollinearity, heteroscedasticity,
autocorrelation, model specification and normality tests. Secondly, the Ordinary Least
Squares (OLS) Test will also be used in this research which involves t-Test and F-Test.
Thirdly, the Unit Root Tests, including the Augmented Dickey-Fuller (ADF) Test and
Phillips-Perron (PP) Test will be carried out. Fourthly, the Granger Causality Test will
be one of the methodologies for the test. Lastly, Johansen Cointegration Test is
conducted.
4.1 Diagnostic Checking
4.1.1 Multicollinearity
If there is an existence of significantly correlated between independent variables
in the model, it can be concluded that there is a multicollinearity problem (Sinan
& Alkan, 2015). There are a few methods to identify the multicollinearity
problem.

The Linkage between Stock Market Returns of Singapore and Other ASEAN-5 Countries
Undergraduate Research Project Page 67 of 134 Faculty of Business and Finance
First method: The high “R-squared” but few significant of t-ratios
Table 4.1.1(a): The R-squared and t-ratios of the model
The R2 of the model is 0.670236
logMAL P-value = 0.0003
logTHAI P-value = 0.0053
logPHI P-value = 0.0066
logIND P-value = 0.0010
According to Gujarati and Porter (2009), if R2 is greater than 0.80 and the t-test
of each variable are mostly insignificant, it shows a symptom of
multicollinearity problem in this model. From the Table 4.1.1(a), the R2 of the
model is consider low, which is 0.670236. It can be indicated that the changes in
independent variables (logMAL, logTHAI, logPHI and logIND) could explain
67.02% of the changes in dependent variable (logSING). Moreover, the p-value
of the overall model is significant according to the table 4.1.1(a). The results
indicated that the p-value of logMAL = 0.0003, logTHAI = 0.0053, logPHI =
0.0066 and logIND = 0.0010 which is less than significant level at 0.01. Overall,
the R2 of the model is low and the t-test of each independent variable are
significant to dependent variable. Therefore, the multicollinearity problem in the
model does not exist because the result does not fulfil the high R2 but few
significant of t-ratios.
Second method: High pair-wise correlation coefficients
Table 4.1.1(b): Pair-wise Correlation Coefficients
logIND logMAL logPHI logTHAI
logIND 1.000000 0.689524 0.683194 0.732340
logMAL 0.689524 1.000000 0.584946 0.585973
logPHI 0.683194 0.584946 1.000000 0.593558
logTHAI 0.732340 0.585973 0.593558 1.000000

The Linkage between Stock Market Returns of Singapore and Other ASEAN-5 Countries
Undergraduate Research Project Page 68 of 134 Faculty of Business and Finance
Based on the Table 4.1.1(b) showed that the correlation between each
independent variable is more than 0.50 which is considered as high correlation
coefficients. Hence, the model is suspected to have multicollinearity problem.
Third method: Variance Inflation Factor (VIF) / Tolerance (TOL)
Table 4.1.1(c): VIF and TOL Results
R2 VIF = 1/(1 – R2 ) TOL = 1 – R2
logMAL 0.508103 2.032946 < 10 0.491897 > 0
logIND 0.682036 3.145010 < 10 0.317964 > 0
logTHAI 0.560084 2.273161 < 10 0.439916 > 0
logPHI 0.504154 2.016755 < 10 0.495846 > 0
Based on the rule of thumb, if the VIF of variable is more than 10 and the TOL
is near to zero, the multicollinearity problem is serious (Gujarati & Porter, 2009).
However, the calculations from Table 4.1.1(c) has showed that all the VIFs are
less than 10 and TOLs were not close to zero. Thus, the results showed that the
model does not have a serious multicollinearity problem.
In conclusion, there is no existence of multicollinearity problem in the model.
As the high R2 but few significant t-ratios and both the VIF and TOL indicated
that there is no multicollinearity problem even though the results from pair-wise
correlation coefficient method is suspected that the model is having
multicollinearity problem. As explained by Gujarati and Porter (2009), although
the high pair-wise correlation coefficient shows the existence of
multicollinearity problem, yet it is not considered as a specific condition for the
detection of the serious multicollinearity problem.
4.1.2 Heteroscedasticity
Heteroscedasticity problem is defined as the disturbance variances are not
constant (Mehmet, 2008). The Autoregressive Conditional Heteroskedasticity
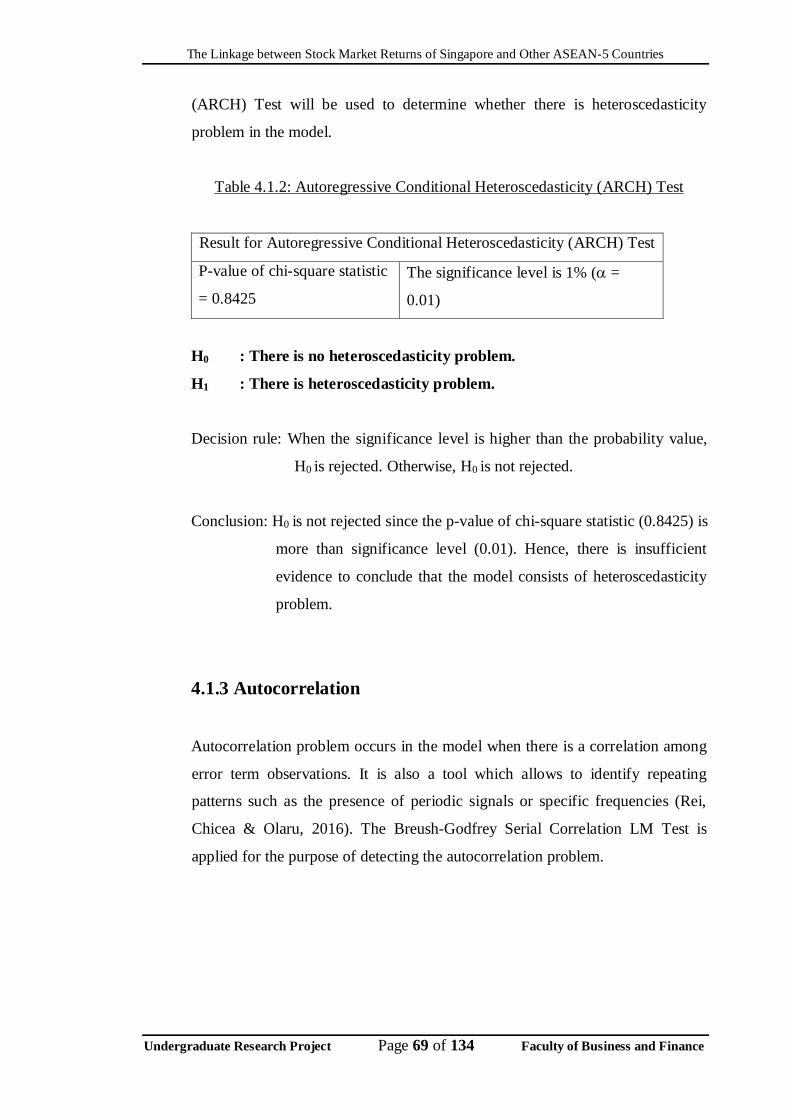
The Linkage between Stock Market Returns of Singapore and Other ASEAN-5 Countries
Undergraduate Research Project Page 69 of 134 Faculty of Business and Finance
(ARCH) Test will be used to determine whether there is heteroscedasticity
problem in the model.
Table 4.1.2: Autoregressive Conditional Heteroscedasticity (ARCH) Test
Result for Autoregressive Conditional Heteroscedasticity (ARCH) Test
P-value of chi-square statistic
= 0.8425
The significance level is 1% ( =
0.01)
H0 : There is no heteroscedasticity problem.
H1 : There is heteroscedasticity problem.
Decision rule: When the significance level is higher than the probability value,
H0 is rejected. Otherwise, H0 is not rejected.
Conclusion: H0 is not rejected since the p-value of chi-square statistic (0.8425) is
more than significance level (0.01). Hence, there is insufficient
evidence to conclude that the model consists of heteroscedasticity
problem.
4.1.3 Autocorrelation
Autocorrelation problem occurs in the model when there is a correlation among
error term observations. It is also a tool which allows to identify repeating
patterns such as the presence of periodic signals or specific frequencies (Rei,
Chicea & Olaru, 2016). The Breush-Godfrey Serial Correlation LM Test is
applied for the purpose of detecting the autocorrelation problem.

The Linkage between Stock Market Returns of Singapore and Other ASEAN-5 Countries
Undergraduate Research Project Page 70 of 134 Faculty of Business and Finance
Table 4.1.3: Breush-Godfrey Serial Correlation LM Test
Result for Breush-Godfrey Serial Correlation LM Test
P-value of chi-square statistic
= 0.1260
The significance level is 1% ( =
0.01)
H0 : There is no autocorrelation problem.
H1 : There is autocorrelation problem.
Decision rule: H0 is rejected if the p-value is less than the level of significance,
α. Otherwise, H0 is not rejected.
Conclusion: H0 is not rejected since the p-value of chi-square statistic (0.1260)
is more than significance level (0.01). Hence, there is insufficient
evidence to conclude that there is autocorrelation problem.
4.1.4 Model Specification
The model is incorrectly specified means that the important variables is omitted,
the nonrelated variables is included, wrong functional form is applied and the
error of measurement bias (Russo, 2012). To detect the existence of model
specification problem in the model, Ramsey Regression Equation Specification
Error Test (RESET) Test is applied.
Table 4.1.4: Ramsey Regression Equation Specification Error Test (RESET)
Test.
Result for Ramsey Regression Equation Specification Error Test
(RESET) Test
P-value of F-statistic = 0.6611 The significance level is 1% ( =
0.01)

The Linkage between Stock Market Returns of Singapore and Other ASEAN-5 Countries
Undergraduate Research Project Page 71 of 134 Faculty of Business and Finance
H0 : The model is correctly specified.
H1 : The model is not correctly specified.
Decision rule: H0 is rejected if the p-value is less than the level of significance, α.
Otherwise H0 is not rejected.
Conclusion: H0 is not rejected since the p-value of F-statistic (0.6611) is more
than significance level (0.01). Thus, there is sufficient evidence to
conclude that the model is correctly specified in this research
project.
4.1.5 Normality Test
To examine whether the sample data is drawn from a normally distributed
population, the normality test is used in this research project (Ning & Ngunkeng,
2013). Thus, the Jarque-Bera Test is conducted to test the normality of the
model.
Figure 4.1.5: Jarque-Bera Test
0
2
4
6
8
10
12
14
16
-0.0375 -0.0250 -0.0125 0.0000 0.0125 0.0250 0.0375
Series: ResidualsSample 2005M02 2016M12Observations 143
Mean -9.70e-20Median -0.000660Maximum 0.044808Minimum -0.036931Std. Dev. 0.013188Skewness 0.231674Kurtosis 3.898410
Jarque-Bera 6.088418Probability 0.047634
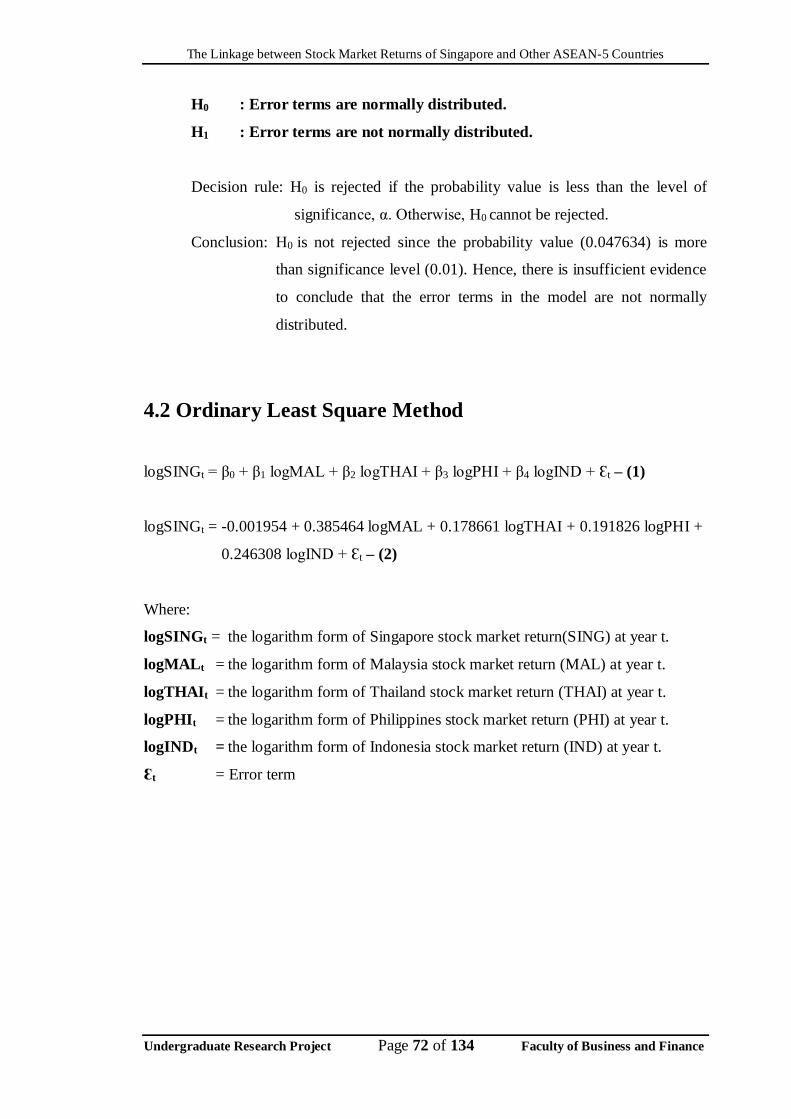
The Linkage between Stock Market Returns of Singapore and Other ASEAN-5 Countries
Undergraduate Research Project Page 72 of 134 Faculty of Business and Finance
H0 : Error terms are normally distributed.
H1 : Error terms are not normally distributed.
Decision rule: H0 is rejected if the probability value is less than the level of
significance, α. Otherwise, H0 cannot be rejected.
Conclusion: H0 is not rejected since the probability value (0.047634) is more
than significance level (0.01). Hence, there is insufficient evidence
to conclude that the error terms in the model are not normally
distributed.
4.2 Ordinary Least Square Method
logSINGt = β0 + β1 logMAL + β2 logTHAI + β3 logPHI + β4 logIND + Ɛt – (1)
logSINGt = -0.001954 + 0.385464 logMAL + 0.178661 logTHAI + 0.191826 logPHI +
0.246308 logIND + Ɛt – (2)
Where:
logSINGt = the logarithm form of Singapore stock market return(SING) at year t.
logMALt = the logarithm form of Malaysia stock market return (MAL) at year t.
logTHAIt = the logarithm form of Thailand stock market return (THAI) at year t.
logPHIt = the logarithm form of Philippines stock market return (PHI) at year t.
logINDt = the logarithm form of Indonesia stock market return (IND) at year t.
Ɛt = Error term

The Linkage between Stock Market Returns of Singapore and Other ASEAN-5 Countries
Undergraduate Research Project Page 73 of 134 Faculty of Business and Finance
Table 4.2 E-view result
Independent
Variable
Expected Sign Actual Sign Coefficient P-value
LOG(MAL) Positive Positive 0.385464 0.0003
LOG(THAI) Positive Positive 0.178661 0.0066
LOG(PHI) Positive Positive 0.191826 0.0053
LOG(IND) Positive Positive 0.246308 0.0010
R2= 0.670236 Adjusted R̅2= 0.660677
R2 is applicable in measuring the variation percentage in dependent variable which is
explained by the total variations of independent variables. In order to measure fitted
regression line, R̅2 is used after taking regressors and sample size into consideration.
According to Table 4.2, the result provided R2 = 0.670236. It showed that 67.02% of
variation in Singaporean stock market return is explained by total variation of stock
market return of Malaysia, Thailand, Philippines and Indonesia. Adjusted R̅2= 0.660677
indicated that 66.07% of the total variations in the stock market return of Singapore is
clarified by the total variation of stock market of Malaysia, Thailand, Philippines and
Indonesia after considering the degree of freedom.
4.2.1 T-test
H0 : There is no significant relationship between the variables (βi = 0,
i=1,2,3,4)
H1 : There is a significant relationship between the variables (βi ≠ 0,
i=1,2,3,4)
Decision Rule: H0 is rejected if the significant level, α is larger than the
probability value. Otherwise, H0 is not rejected.

The Linkage between Stock Market Returns of Singapore and Other ASEAN-5 Countries
Undergraduate Research Project Page 74 of 134 Faculty of Business and Finance
Table 4.2.1: Result of t-test
Based on Table 4.2.1, stock market returns of Malaysia, Thailand, Philippines
and Indonesia are influencing the stock market return in Singapore significantly.
The result of E-views in this research study stated that the stock market return of
Malaysia, Thailand, Philippines and Indonesia is significant and positively
affects the Singapore stock market return. The relationship stated is similar with
the outcome of the previous studies (Abd Karim & Gee, 2006; Chancharat et al.,
2008; Click & Plummer, 2005; Ding, 2010; Karim & Karim, 2012; Narayan &
Narayan, 2012; Royfaizal et al., 2009a; Yi & Tan, 2009). The reason is the
ASEAN 5 stock markets become more integrated with each other due to the
global financial crisis. The financial crisis has contributed volatility and
contagion in the international markets. Financial crisis also pressed some
pressure on the emerging market. In addition, due to the rapid expansion of
international trading, the financial systems and economic of the ASEAN
countries become more integrated.
4.2.2 F-test
H0 : The overall model is insignificant.
H1 : The overall model is significant.
Decision Rule: H0 is rejected if probability value is lower than significant level,
α. Otherwise, H0 is not rejected.
Independent
Variable
Significant
level, α
P-value Decision
Making
Conclusion
Log MAL 0.01 0.0003 Reject H0. Significant
Log THAI 0.01 0.0066 Reject H0. Significant
Log PHI 0.01 0.0053 Reject H0. Significant
Log IND 0.01 0.0010 Reject H0. Significant
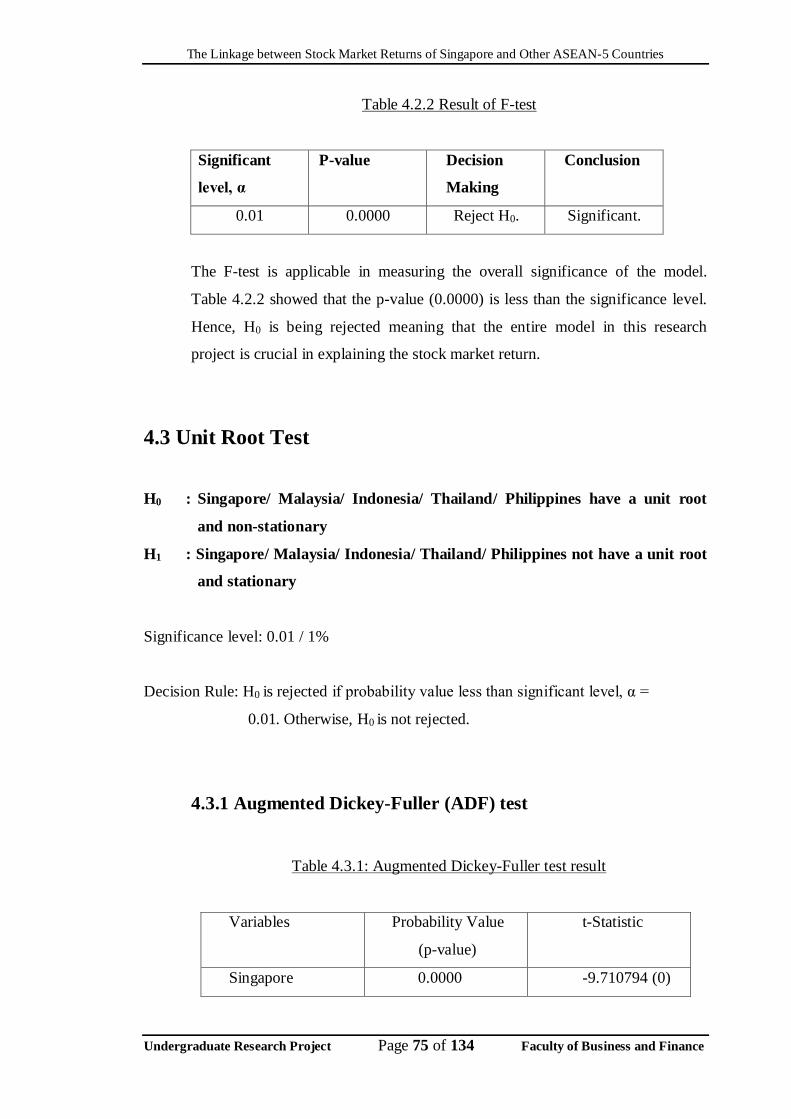
The Linkage between Stock Market Returns of Singapore and Other ASEAN-5 Countries
Undergraduate Research Project Page 75 of 134 Faculty of Business and Finance
Table 4.2.2 Result of F-test
Significant
level, α
P-value Decision
Making
Conclusion
0.01 0.0000 Reject H0. Significant.
The F-test is applicable in measuring the overall significance of the model.
Table 4.2.2 showed that the p-value (0.0000) is less than the significance level.
Hence, H0 is being rejected meaning that the entire model in this research
project is crucial in explaining the stock market return.
4.3 Unit Root Test
H0 : Singapore/ Malaysia/ Indonesia/ Thailand/ Philippines have a unit root
and non-stationary
H1 : Singapore/ Malaysia/ Indonesia/ Thailand/ Philippines not have a unit root
and stationary
Significance level: 0.01 / 1%
Decision Rule: H0 is rejected if probability value less than significant level, α =
0.01. Otherwise, H0 is not rejected.
4.3.1 Augmented Dickey-Fuller (ADF) test
Table 4.3.1: Augmented Dickey-Fuller test result
Variables Probability Value
(p-value)
t-Statistic
Singapore 0.0000 -9.710794 (0)

The Linkage between Stock Market Returns of Singapore and Other ASEAN-5 Countries
Undergraduate Research Project Page 76 of 134 Faculty of Business and Finance
Malaysia 0.0000 -10.17477 (0)
Indonesia 0.0000 -9.379497 (0)
Thailand 0.0000 -5.303441 (2)
Philippines 0.0000 -11.08000 (0)
Note: The figure in parenthesis represents optimal lag length based on Schwarz
criterion (SC) in first difference and without trend phase.
Conclusion: The p-value of Singapore, Malaysia, Indonesia, Thailand and
Philippines are less than 1% significant level, α = 0.01. Therefore,
reject H0. These results indicate that, at 1% significant level, α =
0.01, there are not sufficient evidence to prove that Singapore,
Malaysia, Indonesia, Thailand and Philippines are non-stationary
and have unit root at first difference and without trend using ADF
test.
4.3.2 Phillips-Perron (PP) test result
Table 4.3.2: Phillips-Perron test result
Variables Probability Value (p-value) Adjusted t-Statistic
Singapore 0.0000 -9.864524 (5)
Malaysia 0.0000 -10.52009 (5)
Indonesia 0.0000 -9.470687 (5)
Thailand 0.0000 -9.861669 (6)
Philippines 0.0000 -11.28256 (6)
Note: The figure in parenthesis represents the bandwidth using Bartlett kernel
based on Newey-west bandwidth criterion in first difference and without
trend phase.

The Linkage between Stock Market Returns of Singapore and Other ASEAN-5 Countries
Undergraduate Research Project Page 77 of 134 Faculty of Business and Finance
Conclusion: The p-value of Singapore, Malaysia, Indonesia, Thailand and
Philippines are less than 1% significant level, α = 0.01. Therefore,
reject H0. These results indicate that, at 1% significant level, α =
0.01, there are not sufficient evidence to prove that Singapore,
Malaysia, Indonesia, Thailand and Philippines are non-stationary
and have unit root at first difference and without trend using PP
test.
Based on the results shown using ADF test and PP test, the time series data of
all variables in this research project are stationary and do not have unit root in
first difference phase.
4.4 Granger Causality Test
The relationship between five countries of ASEAN-5 (Singapore, Malaysia, Indonesia,
Thailand and Philippines) stock markets and the orientation of causality among them
could be verified by applying the Granger causality test. The result is responded as table
and figure below.
H0 : Variable X does not granger cause Variable Y.
H1 : Variable X does granger cause Variable Y.
Significance level, α: 0.01
Decision rule: H0 is rejected if the level of significance, α is greater than the probability
value. Otherwise H0 is not rejected.
Table 4.4 : Results for Granger causality test
Variable X Variable Y P-value Decision Making Conclusion
Malaysia Indonesia 0.0505 Do not reject H0 No granger cause
Indonesia Malaysia 0.8087 Do not reject H0 No granger cause

The Linkage between Stock Market Returns of Singapore and Other ASEAN-5 Countries
Undergraduate Research Project Page 78 of 134 Faculty of Business and Finance
Philippines Indonesia 0.0305 Do not reject H0 No granger cause
Indonesia Philippines 0.0016 Reject H0 Granger cause
Singapore Indonesia 0.0016 Reject H0 Granger cause
Indonesia Singapore 0.1119 Do not reject H0 No granger cause
Thailand Indonesia 0.0831 Do not reject H0 No granger cause
Indonesia Thailand 0.4619 Do not reject H0 No granger cause
Philippines Malaysia 0.8430 Do not reject H0 No granger cause
Malaysia Philippines 0.3457 Do not reject H0 No granger cause
Singapore Malaysia 0.1910 Do not reject H0 No granger cause
Malaysia Singapore 0.0050 Reject H0 Granger cause
Thailand Malaysia 0.7590 Do not reject H0 No granger cause
Malaysia Thailand 0.3664 Do not reject H0 No granger cause
Singapore Philippines 0.1363 Do not reject H0 No granger cause
Philippines Singapore 0.1115 Do not reject H0 No granger cause
Thailand Philippines 0.0009 Reject H0 Granger cause
Philippines Thailand 0.2809 Do not reject H0 No granger cause
Thailand Singapore 0.0872 Do not reject H0 No granger cause
Singapore Thailand 0.4437 Do not reject H0 No granger cause
Figure 4.4 : Relationship among ASEAN-5 stock markets for Granger causality test
Indicator:
One way causal relationship
This finding indicates existence of granger causality relationship among all of the
ASEAN-5 stock markets. However, there are only exist of unidirectional causality
Indonesia
Singapore Malaysia
Thailand
Philippines

The Linkage between Stock Market Returns of Singapore and Other ASEAN-5 Countries
Undergraduate Research Project Page 79 of 134 Faculty of Business and Finance
relation and absence of bidirectional causality relation in this research project. The
stock market of Singapore is affected by Malaysia stock market due to the Malaysian
stock market is the most influential markets among ASEAN-5 (Roca et al., 1998).
Purnomo and Rider (n.d.) found that the shock of Singapore stock market index
influences the response of Indonesian stock market index. On the same time, the
Indonesian stock index have great impact on the Philippines stock index also reported
in this research. Phuan et al. (2009) declared that there is unidirectional causality
relation presents in Thailand stock market to Philippines stock market. Other than the
combinations of countries stock markets mention above, there is absence of causality
relationship among them.
4.5 Johansen Cointegration test
The Johansen cointegration test was used to test the long run relationship between the
variables. The result is recorded as follows.
Table 4.5: Results for Johansen cointegration test
Hypothesised
number of
cointegrating
equation(s), r
Trace test Maximum Eigenvalue Test
Statistic Critical
value
(5%)
Probability
value
Statistic Critical
value
(5%)
Probability
value
r = 0 323.6265 69.81889 0.0001* 85.90520 33.87687 0.0000*
r ≤ 1 237.7213 47.85613 0.0001* 77.97313 27.58434 0.0000*
r ≤ 2 159.7481 20.79707 0.0001* 67.25167 21.13162 0.0000*
r ≤ 3 92.49645 15.49471 0.0000* 55.00861 14.26460 0.0000*
r ≤ 4 37.48784 3.841466 0.0000* 37.48784 3.841466 0.0000*
Note: * denotes significant at 1% level of significance.
H0 : There is no long run relationship between the variables.
H1 : There is long run relationship between the variables.
The Linkage between Stock Market Returns of Singapore and Other ASEAN-5 Countries
Undergraduate Research Project Page 80 of 134 Faculty of Business and Finance
Decision rule: H0 is rejected if the probability value is less than the level of significance,
α. Otherwise H0 is not rejected.
Conclusion: The probability value for both Trace statistics (0.0000) and Maximum
Eigenvalue statistics are less than α (0.01). Thus, the H0 is rejected. There
is sufficient evidence to conclude that the variables are cointegrated, hence
exhibits long run relationship.
This finding indicates existence of cointegration between ASEAN-5 stock markets,
which is consistent with several previous researches that examined the cointegration
between stock markets of the ASEAN-5 countries. Lim (2007) found stock market of
Philippines had long run relationship with stock markets of Indonesia, Malaysia and
Singapore. On top of that, there were also researchers who found cointegration between
the stock markets of ASEAN-5 countries (Karim & Karim, 2012; Narayan & Narayan,
2012; Royfaizal et al., 2009a).
4.6 Conclusion
In this chapter, several tests such as diagnostic checking, OLS test, unit root tests,
Granger-causality test, and Johansen co-integration test has been carried out to improve
the accuracy and reliability of the result in this research project. A multiple linear
regression model also has been formed based on the ordinary least square method in
this chapter. All the empirical result of this research project are presented in both table
from and figure form and supported by findings of others researchers.

The Linkage between Stock Market Returns of Singapore and Other ASEAN-5 Countries
Undergraduate Research Project Page 81 of 134 Faculty of Business and Finance
CHAPTER 5: DISSCUSSION, CONCLUSION AND
IMPLICATIONS
5.0 Introduction
In this chapter, the summary of statistical analyses will be presented which included the
detail results that had been examined from the previous chapter. The next section of this
chapter will briefly summarise the major findings of the linkages between Singapore
stock market return and ASEAN-5 stock market return. Moreover, the implication of
study will be discussed in this chapter that will provide some useful practices for policy
makers, governments or investors. Another section will highlight the limitation of this
research project and followed by some detail recommendations and suggestion for this
research as well as future researchers.
5.1 Summary of Analysis
5.1.1 Summary of Diagnostic Checking
Table 5.1.1 Summary of Diagnostic Checking
Test Decision Rules Results
Multicollinearity 1. Suspects multicollinearity
problem exits if R-square
value is high but few t-
ratios are significant.
2. Suspects multicollinearity
problem exits if pair-wise
correlation coefficient value
is high.
No serious
multicollinearity
problem.

The Linkage between Stock Market Returns of Singapore and Other ASEAN-5 Countries
Undergraduate Research Project Page 82 of 134 Faculty of Business and Finance
3. Suspects multicollinearity
problem exits if VIF value
is more than 10 and TOL
value is near to 0.
Heteroscedasticity
- ARCH Test
Heteroscedasticity problem exist
if probability value less than the
significant level.
No
heteroscedasticit
y problem.
Autocorrelation
- Breush-Godfrey
Serial Correlation
LM Test
Autocorrelation problem exist if
probability value less than the
significant level.
No
autocorrelation
problem.
Model
Specification Test
- Ramsey RESET
Test
The model is not specified
correctly if probability value less
than the significant level.
No model
specification
problem.
Normality Test
- Jarque-Bera Test
Error terms are not normally
distributed if probability value
less than the significant level.
No normality
problem.
The summary of diagnostic checking of this research project had been presented
in the table 5.1.1. From the table, a conclusion of no serious multicollinearity
problem exist and there is no heteroscedasticity, autocorrelation, model
specification and normality problem exist in this model at significant level of
1%. Since all the econometrics problems are not exist in this model, this model
is Best Linear Unbiased Estimator. Hence, the hypothesis testing results in this
research project are accurate and valid.
5.1.2 Summary of Ordinary Least Square
Table 5.1.2 Summary of Ordinary Least Square
t-Test

The Linkage between Stock Market Returns of Singapore and Other ASEAN-5 Countries
Undergraduate Research Project Page 83 of 134 Faculty of Business and Finance
Variables Decision Rules Results Consistency
Malaysia Singapore stock
market is
significantly affected
by Malaysia stock
market if probability
value greater than
significant level of
1%.
Malaysia
stock
market is a
significant
variable.
Chancharat, et al.
(2008)
Karim and Karim
(2012)
Narayan and Narayan
(2012)
Royfaizal et al. (2009b)
Indonesia Singapore stock
market is
significantly affected
by Indonesia stock
market if probability
value greater than
significant level of
1%.
Indonesia
stock
market is a
significant
variable.
Chancharat, et al.
(2008)
Karim and Karim
(2012)
Royfaizal et al. (2009b)
Thailand Singapore stock
market is
significantly affected
by Thailand stock
market if probability
value greater than
significant level of
1%.
Thailand
stock
market is a
significant
variable.
Chancharat et al. (2008)
Karim and Karim
(2012)
Narayan and Narayan
(2012)
Royfaizal et al. (2009b)
Philippines Singapore stock
market is
significantly affected
by Philippines stock
market if probability
value greater than
significant level of
1%.
Philippine
s stock
market is a
significant
variable.
Chancharat, et al.
(2008)
Karim and Karim
(2012)
Narayan and Narayan
(2012)
Royfaizal et al. (2009b)

The Linkage between Stock Market Returns of Singapore and Other ASEAN-5 Countries
Undergraduate Research Project Page 84 of 134 Faculty of Business and Finance
F-Test
Significance
of overall
model
The overall model is
significant if
probability value
greater than
significant level of
1%.
The
overall
model is
significant
.
Table 5.1.2 indicates the summary of Ordinary Least Square results which
include the t-test which test the significant of each independent variable
(Malaysia, Indonesia, Thailand and Philippines) individually and F-test which
test the significant of overall OLS model. The results shown that the stock
market of Singapore will be significantly affected by the performance of stock
markets of Malaysia, Indonesia, Thailand and Philippines individually. The
stock market performances of the independent countries are positively affected
the stock market performance of Singapore. These results are consistent with the
findings of Chancharat et al. (2008); Karim and Karim (2012); Narayan and
Narayan (2012) and Royfaizal et al. (2009b). The result from F-test has been
proven that all the stock market returns of ASEAN-5 are significant to affect
stock market return of Singapore in this research project.
5.1.3 Summary of Unit Roots Test
Table 5.1.3 Summary of Unit Roots Test at First Difference and Without Trend
Variables Decision Rules Results Consistency
Singapore Singapore has unit
root problem and
non-stationary if
probability value
more than
significant level of
1%.
Singapore stock
market return does
not have unit root
problem and is
stationary at first
difference and
without trend phase.
Lim (2009)
Royfaizal et
al. (2009b)
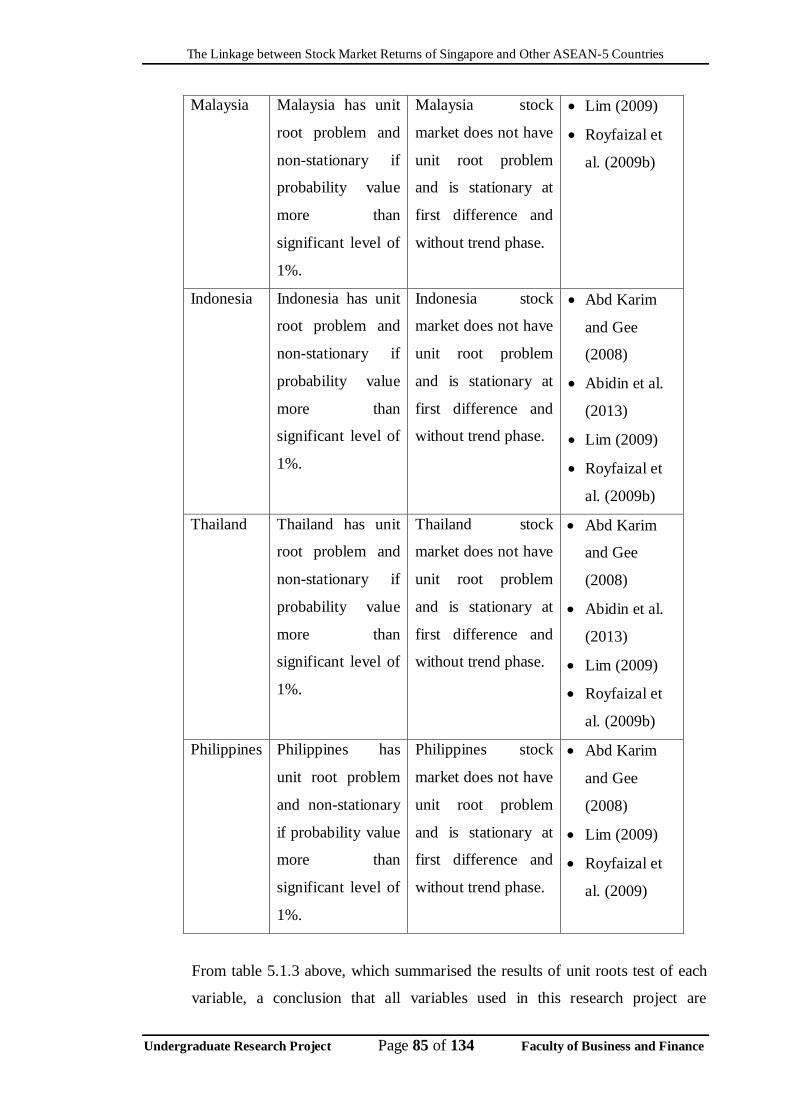
The Linkage between Stock Market Returns of Singapore and Other ASEAN-5 Countries
Undergraduate Research Project Page 85 of 134 Faculty of Business and Finance
Malaysia Malaysia has unit
root problem and
non-stationary if
probability value
more than
significant level of
1%.
Malaysia stock
market does not have
unit root problem
and is stationary at
first difference and
without trend phase.
Lim (2009)
Royfaizal et
al. (2009b)
Indonesia Indonesia has unit
root problem and
non-stationary if
probability value
more than
significant level of
1%.
Indonesia stock
market does not have
unit root problem
and is stationary at
first difference and
without trend phase.
Abd Karim
and Gee
(2008)
Abidin et al.
(2013)
Lim (2009)
Royfaizal et
al. (2009b)
Thailand Thailand has unit
root problem and
non-stationary if
probability value
more than
significant level of
1%.
Thailand stock
market does not have
unit root problem
and is stationary at
first difference and
without trend phase.
Abd Karim
and Gee
(2008)
Abidin et al.
(2013)
Lim (2009)
Royfaizal et
al. (2009b)
Philippines Philippines has
unit root problem
and non-stationary
if probability value
more than
significant level of
1%.
Philippines stock
market does not have
unit root problem
and is stationary at
first difference and
without trend phase.
Abd Karim
and Gee
(2008)
Lim (2009)
Royfaizal et
al. (2009)
From table 5.1.3 above, which summarised the results of unit roots test of each
variable, a conclusion that all variables used in this research project are
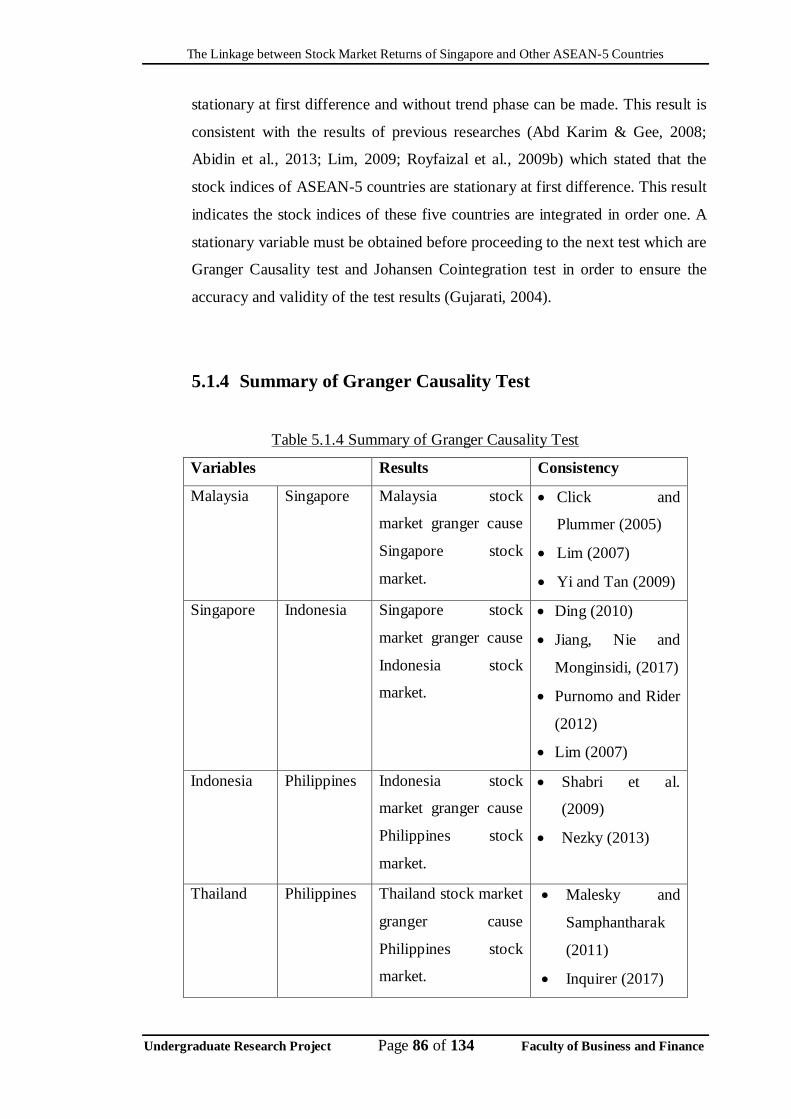
The Linkage between Stock Market Returns of Singapore and Other ASEAN-5 Countries
Undergraduate Research Project Page 86 of 134 Faculty of Business and Finance
stationary at first difference and without trend phase can be made. This result is
consistent with the results of previous researches (Abd Karim & Gee, 2008;
Abidin et al., 2013; Lim, 2009; Royfaizal et al., 2009b) which stated that the
stock indices of ASEAN-5 countries are stationary at first difference. This result
indicates the stock indices of these five countries are integrated in order one. A
stationary variable must be obtained before proceeding to the next test which are
Granger Causality test and Johansen Cointegration test in order to ensure the
accuracy and validity of the test results (Gujarati, 2004).
5.1.4 Summary of Granger Causality Test
Table 5.1.4 Summary of Granger Causality Test
Variables Results Consistency
Malaysia Singapore Malaysia stock
market granger cause
Singapore stock
market.
Click and
Plummer (2005)
Lim (2007)
Yi and Tan (2009)
Singapore Indonesia Singapore stock
market granger cause
Indonesia stock
market.
Ding (2010)
Jiang, Nie and
Monginsidi, (2017)
Purnomo and Rider
(2012)
Lim (2007)
Indonesia Philippines Indonesia stock
market granger cause
Philippines stock
market.
Shabri et al.
(2009)
Nezky (2013)
Thailand Philippines Thailand stock market
granger cause
Philippines stock
market.
Malesky and
Samphantharak
(2011)
Inquirer (2017)
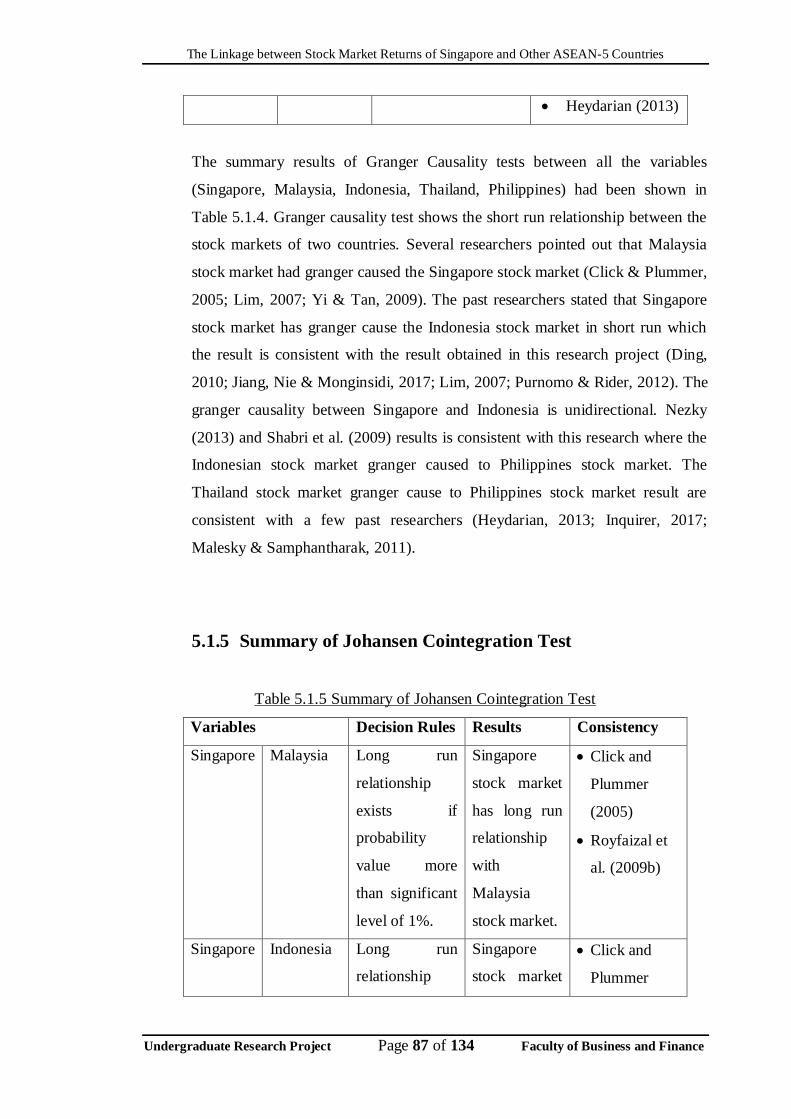
The Linkage between Stock Market Returns of Singapore and Other ASEAN-5 Countries
Undergraduate Research Project Page 87 of 134 Faculty of Business and Finance
Heydarian (2013)
The summary results of Granger Causality tests between all the variables
(Singapore, Malaysia, Indonesia, Thailand, Philippines) had been shown in
Table 5.1.4. Granger causality test shows the short run relationship between the
stock markets of two countries. Several researchers pointed out that Malaysia
stock market had granger caused the Singapore stock market (Click & Plummer,
2005; Lim, 2007; Yi & Tan, 2009). The past researchers stated that Singapore
stock market has granger cause the Indonesia stock market in short run which
the result is consistent with the result obtained in this research project (Ding,
2010; Jiang, Nie & Monginsidi, 2017; Lim, 2007; Purnomo & Rider, 2012). The
granger causality between Singapore and Indonesia is unidirectional. Nezky
(2013) and Shabri et al. (2009) results is consistent with this research where the
Indonesian stock market granger caused to Philippines stock market. The
Thailand stock market granger cause to Philippines stock market result are
consistent with a few past researchers (Heydarian, 2013; Inquirer, 2017;
Malesky & Samphantharak, 2011).
5.1.5 Summary of Johansen Cointegration Test
Table 5.1.5 Summary of Johansen Cointegration Test
Variables Decision Rules Results Consistency
Singapore Malaysia Long run
relationship
exists if
probability
value more
than significant
level of 1%.
Singapore
stock market
has long run
relationship
with
Malaysia
stock market.
Click and
Plummer
(2005)
Royfaizal et
al. (2009b)
Singapore Indonesia Long run
relationship
Singapore
stock market
Click and
Plummer

The Linkage between Stock Market Returns of Singapore and Other ASEAN-5 Countries
Undergraduate Research Project Page 88 of 134 Faculty of Business and Finance
exists if
probability
value more
than significant
level of 1%.
has long run
relationship
with
Indonesia
stock market.
(2005)
Royfaizal et
al. (2009b)
Singapore Thailand Long run
relationship
exists if
probability
value more
than significant
level of 1%.
Singapore
stock market
has long run
relationship
with Thailand
stock market.
Click and
Plummer
(2005)
Royfaizal et
al. (2009b)
Singapore Philippines Long run
relationship
exists if
probability
value more
than significant
level of 1%.
Singapore
stock market
has long run
relationship
with
Philippines
stock market.
Click and
Plummer
(2005)
Lim (2007)
Royfaizal et
al. (2009b)
Summary results of Johansen Cointegration test was presented in Table 5.1.5.
From the table, Singapore stock market has long run relationship with the stock
markets of other countries (Malaysia, Indonesia, Thailand and Philippines)
respectively. Click and Plummer (2005) and Royfaizal et al. (2009b) had found
out that the stock markets of ASEAN-5 countries has long run relationship
between each other which is consistence with the result obtained in this research
project. Lim (2007) had further proved that there is long run relationship exist
between Philippines and Singapore.
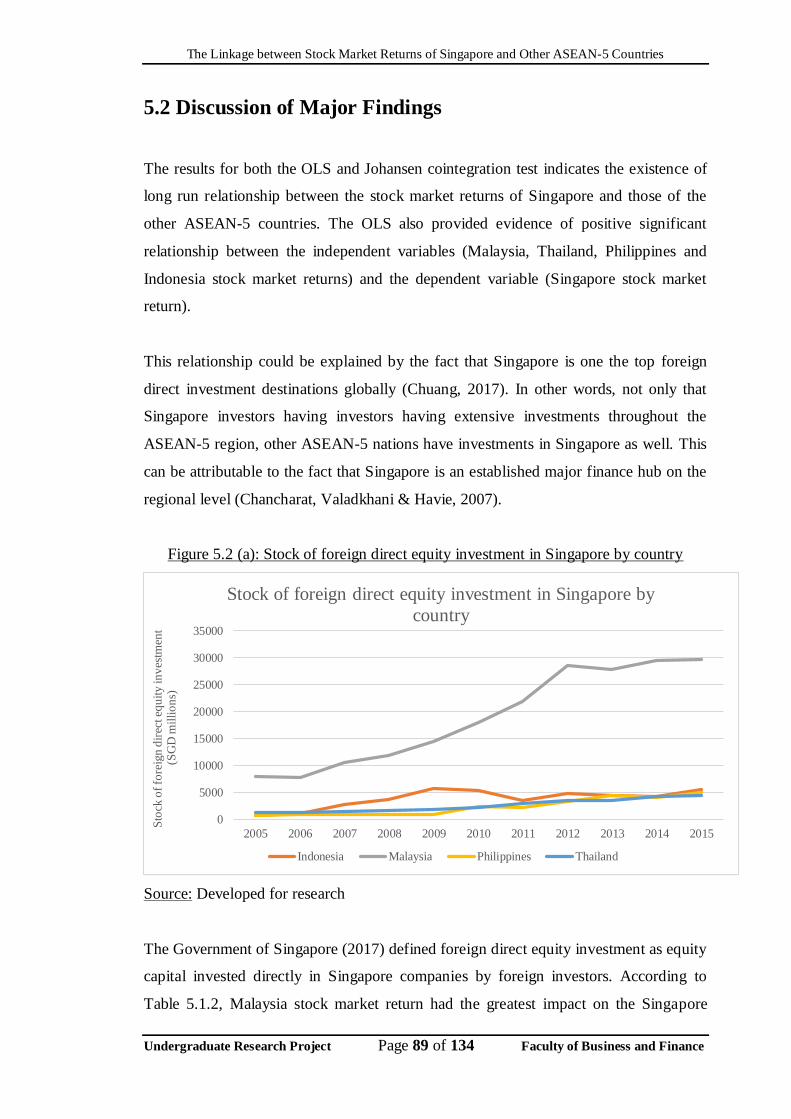
The Linkage between Stock Market Returns of Singapore and Other ASEAN-5 Countries
Undergraduate Research Project Page 89 of 134 Faculty of Business and Finance
5.2 Discussion of Major Findings
The results for both the OLS and Johansen cointegration test indicates the existence of
long run relationship between the stock market returns of Singapore and those of the
other ASEAN-5 countries. The OLS also provided evidence of positive significant
relationship between the independent variables (Malaysia, Thailand, Philippines and
Indonesia stock market returns) and the dependent variable (Singapore stock market
return).
This relationship could be explained by the fact that Singapore is one the top foreign
direct investment destinations globally (Chuang, 2017). In other words, not only that
Singapore investors having investors having extensive investments throughout the
ASEAN-5 region, other ASEAN-5 nations have investments in Singapore as well. This
can be attributable to the fact that Singapore is an established major finance hub on the
regional level (Chancharat, Valadkhani & Havie, 2007).
Figure 5.2 (a): Stock of foreign direct equity investment in Singapore by country
Source: Developed for research
The Government of Singapore (2017) defined foreign direct equity investment as equity
capital invested directly in Singapore companies by foreign investors. According to
Table 5.1.2, Malaysia stock market return had the greatest impact on the Singapore
0
5000
10000
15000
20000
25000
30000
35000
2005 2006 2007 2008 2009 2010 2011 2012 2013 2014 2015
Sto
ck o
f fo
reig
n d
irec
t eq
uit
y in
ves
tmen
t(S
GD
mil
lio
ns)
Stock of foreign direct equity investment in Singapore by
country
Indonesia Malaysia Philippines Thailand
The Linkage between Stock Market Returns of Singapore and Other ASEAN-5 Countries
Undergraduate Research Project Page 90 of 134 Faculty of Business and Finance
stock market return compared to Philippines, Thailand and Indonesia stock market
returns. For every 1% increase in percentage point of Malaysia stock market return, the
percentage point of Singapore stock market return increase by 0.385464%. This can be
justified by the fact that Malaysia had the highest foreign direct equity investment in the
Singapore market compared to Philippines, Thailand and Indonesia, based on the
illustration in Figure 5.2 (a). Indonesia, Philippines and Thailand stock market return
had subsequent effects to the Singapore stock market. This is also consistent with the
data that these countries had lower foreign direct equity investments in Singapore
compared to Malaysia, with Indonesia generally being the highest among them.
As such, it can be deduced that greater the equity investment of a country in Singapore
can be associated with greater tendency that stock market returns of the country could
affect the Singapore stock market in the long term. For example, when Malaysian stock
market return improves, the investor from Malaysia earn more to be able to expand
their stock or equities investment to other countries such as Singapore. Then, Singapore
companies could gain capital from primary equity issues and invest on projects that
increases company returns. Subsequently, the shareholder wealth is increased and
returns on stocks increases (Arčabić, Globan & Raguž, 2013). In the secondary market,
foreign direct equity investments enhance liquidity in the Singapore stock market as
well.
Nevertheless, the effects of trends that are in common that potentially drives stock
market returns to move in the same way should not be neglected (Bashiri & Zadeh,
2014). Click and Plummer (2005) found that stock markets became gradually more
integrated both in post crisis period. Additionally, the effort of the ASEAN Economic
Community could play a role in enhancing the long run relationship between the
ASEAN-5 countries as well.
From the Granger Causality test, a result that stock market return of Malaysia had
granger cause the stock market return of Singapore had obtained. The causal
relationship between stock market returns of Singapore and Malaysia is one way. Yi
and Tan (2009) stated the level of integration of stock markets is affected by many
factors such as liberalisation in financial sectors in the country, the financial control of

The Linkage between Stock Market Returns of Singapore and Other ASEAN-5 Countries
Undergraduate Research Project Page 91 of 134 Faculty of Business and Finance
country and external factor such as financial crisis. Yi and Tan (2009) also point out
that during the crisis, the volatility of Malaysia stock market increases due to several
country-specific factors such as imposition of capital control, abolition of levy on the
repatriation of profit from foreign investment, the scandal of 1 Malaysia Development
Berhad and the poor performance of Malaysia Ringgit (Davies ,2017). These country-
specific factors in Malaysia increased the uncertainty and volatility in the stock market
and thus affected the confidence of both domestic and foreign investors towards
Malaysia's stock market. As a result, the investors would like to invest in Singapore
stock market rather than invest in Malaysia stock market thus Malaysia stock market
granger caused Singapore stock market. Malaysia stock market took longer period to be
integrated back into the major and regional stock market compared to Singapore stock
market.
Furthermore, the reason of stock market return of Singapore granger cause to stock
market return of Indonesia can be due to the Singapore are the largest trade partners
relationship with Indonesia and the data are shown in Figure 5.2 (b). Purnomo and
Rider (2012) found that the Indonesian stock market index is influenced by the
advanced countries such as Singapore stock market which consist of close trade partner
by using granger causality test. The establishment of ASEAN trading would be another
reason of the short run relationship occurred between stock market of Singapore and
Indonesia. According to Jiang et al. (2017), the stock market of Indonesia and
Singapore showed the most significant results and high degree of comovement due to
the effect of ASEAN trading link period.
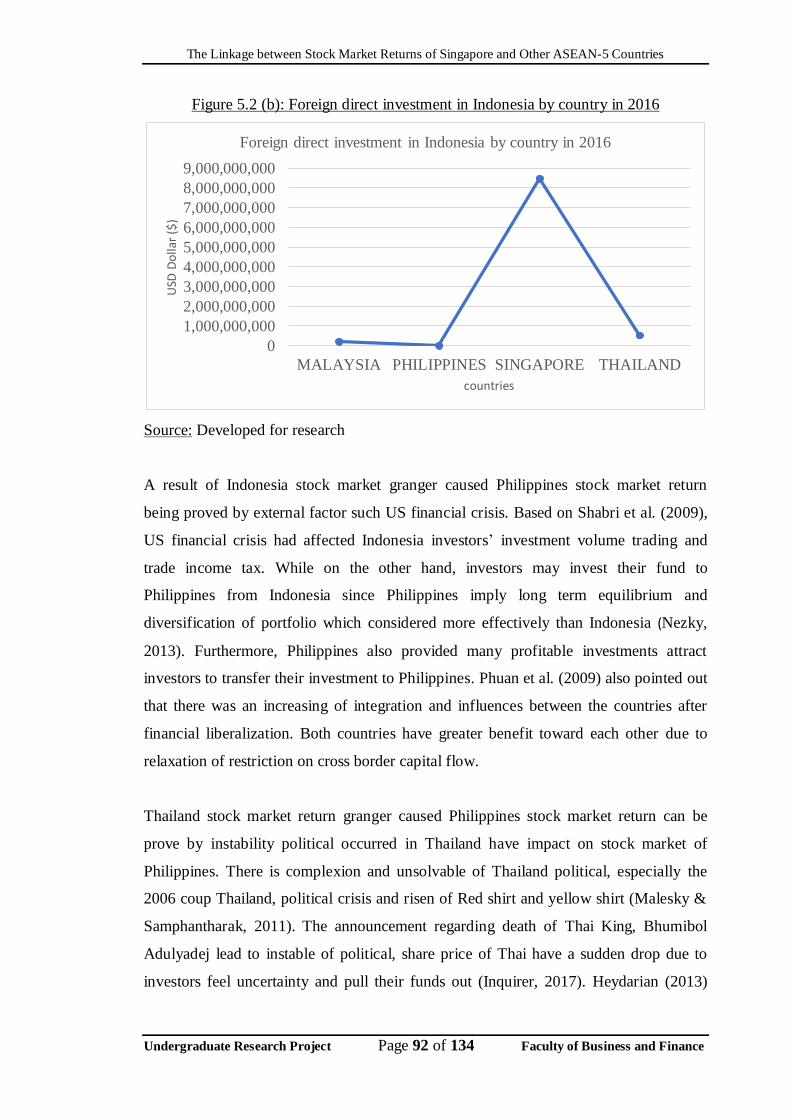
The Linkage between Stock Market Returns of Singapore and Other ASEAN-5 Countries
Undergraduate Research Project Page 92 of 134 Faculty of Business and Finance
Figure 5.2 (b): Foreign direct investment in Indonesia by country in 2016
Source: Developed for research
A result of Indonesia stock market granger caused Philippines stock market return
being proved by external factor such US financial crisis. Based on Shabri et al. (2009),
US financial crisis had affected Indonesia investors’ investment volume trading and
trade income tax. While on the other hand, investors may invest their fund to
Philippines from Indonesia since Philippines imply long term equilibrium and
diversification of portfolio which considered more effectively than Indonesia (Nezky,
2013). Furthermore, Philippines also provided many profitable investments attract
investors to transfer their investment to Philippines. Phuan et al. (2009) also pointed out
that there was an increasing of integration and influences between the countries after
financial liberalization. Both countries have greater benefit toward each other due to
relaxation of restriction on cross border capital flow.
Thailand stock market return granger caused Philippines stock market return can be
prove by instability political occurred in Thailand have impact on stock market of
Philippines. There is complexion and unsolvable of Thailand political, especially the
2006 coup Thailand, political crisis and risen of Red shirt and yellow shirt (Malesky &
Samphantharak, 2011). The announcement regarding death of Thai King, Bhumibol
Adulyadej lead to instable of political, share price of Thai have a sudden drop due to
investors feel uncertainty and pull their funds out (Inquirer, 2017). Heydarian (2013)
0
1,000,000,000
2,000,000,000
3,000,000,000
4,000,000,000
5,000,000,000
6,000,000,000
7,000,000,000
8,000,000,000
9,000,000,000
MALAYSIA PHILIPPINES SINGAPORE THAILAND
USD
Do
llar
($)
countries
Foreign direct investment in Indonesia by country in 2016
The Linkage between Stock Market Returns of Singapore and Other ASEAN-5 Countries
Undergraduate Research Project Page 93 of 134 Faculty of Business and Finance
stated that Thailand is one of the country which bring about external shocks toward
Philippines Stock Exchange and lead to economy imbalances happen.
The formation of ASEAN free trade area and investment zone forming an integrated
regional financial market which without transaction costs and trade barrier among the
ASEAN members. This justifies the finding of positive significant relationships
between Singapore stock market and other ASEAN-5 countries' stock market from the
OLS method.
According to Loh (2012), the linkage between the stock markets of countries will
change based on different time scale. This was demonstrated in the findings of this
research project. The Granger causality test showed that short run relationship only
exists between the stock markets of Singapore and Indonesia while there is no short run
relationship exists between stock markets of Singapore and Malaysia. In addition, the
stock markets of Thailand and Philippines do not have short run relationship with the
stock market return of Singapore based on the result showed. However, there exists
long run relationship between Singapore stock market and stock markets of all other
ASEAN-5 countries.
From the above finding, it can be deduced that it takes time for these 5 markets to
achieve long run relationship. Click and Plummer (2005) pointed out that the stock
markets of ASEAN-5 are integrated but the integration taken long period to adjust to
achieve complete integration. As such, the absence of short run relationship between
Singapore stock market and Malaysia, Thailand and Indonesia stock market reflects the
period of incomplete integration. This incomplete integration can be due to the
difference in the capital market efficiency in each country. By applying EMH theory,
the efficiency of capital markets of Malaysia, Thailand and Philippines can be
categorised into weak or semi-strong form since they it requires longer period for
market adjustments to complete the integration with Singapore stock market.
The absence of short run relationships between Singapore and Malaysia, Thailand and
Philippines stock market imply arbitrage opportunities to occur due to market
inefficiencies. This is because, although a positive and significant long run relationship
The Linkage between Stock Market Returns of Singapore and Other ASEAN-5 Countries
Undergraduate Research Project Page 94 of 134 Faculty of Business and Finance
exists between Singapore stock market and Malaysia, Indonesia, Thailand and
Philippines stock markets, the violations of law of one price may occur in the short term.
The law of one price holds when the prices of the identical securities are the same in the
ASEAN capital markets, assuming no transaction cost and other trade barriers and that
ASEAN capital markets are efficient (Lamont & Thaler, 2003). When the violations of
law of one price occurs, arbitrage opportunity exist to allow the investors to take the
arbitrage profit. However, the violation of law of one price only exists in very short
period and the law will hold again in the long run. Therefore, the investors of Singapore
can have the arbitrage profit by investing in Malaysia, Thailand and Philippines stock
markets when law of one price do not hold in the short run then the price of the
securities will be move to the equilibrium in long run to maintain the market efficiency.
By applying the theory of international portfolio diversification which was derived from
the Modern Portfolio Theory (Hakeem et al., 2016), investors in Singapore can
diversify their short-term portfolio risk in Malaysia, Thailand and Philippines due to the
financial market of Singapore is less related with the financial market of their countries
in short run. The granger causality between Singapore and Indonesia indicates that
Singapore financial market is more correlated with Indonesia financial market in short
run. Therefore, the Singaporean investor does not have the incentive to diversify their
portfolio risk internationally in Indonesian financial market in the short run.
The Johansen cointegration test showed that long run relationships exist between
Singapore stock market and Malaysia, Indonesia, Thailand and Philippines stock
markets. This can be due to the establishment of the ASEAN Economic Community
(Sia, Hsu & Teo, 2016). This establishment is the effort of ASEAN to link all
exchanges in ASEAN countries, and the integration between the 5 markets found in this
research project showed that such efforts began to take effect. However, the existing of
long run effect within Singapore, Malaysia, Indonesia, Thailand and Philippines stock
markets causes the international portfolio diversification benefits within these five
countries to be reduced but not eliminated. From the international portfolio
diversification perspective, the existence of the long run relationship between the stock
markets of ASEAN-5 countries indicates that investors from these 5 nations could not
take advantage of long-run international portfolio diversification. When the markets are
The Linkage between Stock Market Returns of Singapore and Other ASEAN-5 Countries
Undergraduate Research Project Page 95 of 134 Faculty of Business and Finance
cointegrated, risk are less likely to be diversifiable in a portfolio (Royfaizal et al.,
2009b).
According to Karim and Karim (2012), the long run relationship between the markets
implied the fact that the series of common stock prices for each market has information
about the general stochastic movement of the integrated markets, following the
Efficient Market Hypothesis. As such, stock prices of a country can be more easily
predicted by looking into stock prices trend in another country that shared a long run
relationship. However, arbitrage opportunity is possible to exist based on the market
efficiency of each country. Arbitrage profit exists if investors could earn excess returns
on top of the compensation for assuming additional risk (Karim & Karim, 2012). After
all, it was not so clear cut in differentiating actual risk compensation and risk-adjusted
excess return. This argument can be strengthened by the absence of short run
relationship between stock markets of Singapore and Malaysia, Thailand and
Philippines, meaning that market are less efficient in the short run enabling arbitrage
opportunities, while slowly adjusting to achieve long-run equilibrium.
Overall, from this research project the relationship between stock markets returns of
ASEAN-5 countries over long and short terms can be determined. Furthermore, such
linkages are investigated from the perspective of Singapore, the only developed country
among ASEAN-5.
5.3 Implications of the Study
5.3.1 Managerial Implications
Empirical findings above may bring significant implications to domestic
investors as well as the investors from other countries who intend to invest or
formed a diversified portfolio in ASEAN-5 markets. They have been provided a
platform to acquire information of the integration and linkages among these
markets, therefore risks exposure can be minimised. Based on empirical results,
The Linkage between Stock Market Returns of Singapore and Other ASEAN-5 Countries
Undergraduate Research Project Page 96 of 134 Faculty of Business and Finance
investors could not gain benefit from diversifying their international portfolio
within ASEAN-5 countries due to long-run relationship effect. However,
investors may obtain arbitrage opportunities in short-run relationship due to
inefficiencies of stock markets occur in ASEAN-5 countries.
Fund managers may have implication on decisions of company capital
budgeting, investment strategies and consumption of investors. These
businesses decisions being simply influenced by cross-border integration of
stock markets. Fund managers from those multinational companies, mutual and
pension funds, which have desire involve in cross-border investments are able to
acquire deep knowledge to inspect on stock market relationship before making
investments. Fund managers from Singapore companies are advised to involve
international portfolio diversification with other than ASEAN-5 countries due to
high integration among each other.
Policymakers may obtain implication on policy effectiveness from the empirical
findings when making decisions for local policies involving ASEAN-5
countries. Policies will directly affect the development of a country. Therefore,
policymakers are required to closely monitor on it. Those countries can move
even more forward in the next decade of the new millennium, maintain the
liquidity of the counties by design and implement proper policies. Therefore,
linkages and integration of ASEAN-5 stock markets are vital for governments
when implementing or making decision on policies. Government or
policymakers can identify the stock market behavior with the presence of result
from empirical findings. Therefore, empirical findings may give assistance to
policymakers or regulators on financial performance to enhance economy
growth and stability of stock market of a country.
5.4 Limitations of the study
This research project has some unavoidable limitations. Firstly, this research project
limits and focuses in investigating the linkage between stock markets of Singapore and
The Linkage between Stock Market Returns of Singapore and Other ASEAN-5 Countries
Undergraduate Research Project Page 97 of 134 Faculty of Business and Finance
other ASEAN-5 members because of the stock market developments within the region
the past decade. In fact, there are a few financial assets that can be used for further
investigating the true linkage of each ASEAN-5 countries such as bond market and
other commodities. By adopting variety of financial assets to conduct similar research,
it will provide a wider evidence of the linkage and better understanding of portfolio
diversification strategies. For instance, if the volatility of stock market return in
Malaysia is high, the Singapore investors can choose to invest in Malaysia bond market
to diversify their portfolio risk.
On the other hand, the stock markets return of each ASEAN-5 were being measured by
using such as STI, KLCI, JCI, SET and PSEi index return as proxies in this research
project. There are other supplementary stock indexes can be used as proxies to conduct
similar research. For instance, KLCI consist of 30 largest listed companies used as the
benchmark of stock market return in Malaysia but there are other indexes from ace
market such as FTSE Bursa Malaysia ACE (FTFBMMES) that this research does not
discover yet by using the similar test. Furthermore, Indonesian stock market indices
also included Jakarta Islamic Index which involved the listed companies that operate in
line with Syariah business code. Therefore, this research project is unable to provide
overall picture of the stock market return as there are variety of supplementary stock
indexes can be studied. However, this research is conducted by using the main stock
indexes of each ASEAN-5 to fulfil our objectives.
Moreover, this research project does not evaluate the linkage of stock market return
between Singapore and ASEAN-5 according to each industries sector would be another
limitation in this research. There are a few industries index can be used as the
benchmark for similar research. For instance, FTSE ASEAN Sector Indices comprise of
the large, mid and small cap that is evaluate based on industry and sector level from
each ASEAN-5 countries. However, it is difficult to get a standardised industry index
from each ASEAN-5 countries and the source of data is limited. Thus, this research is
carried out by using the general benchmark index in order to meet our objective.

The Linkage between Stock Market Returns of Singapore and Other ASEAN-5 Countries
Undergraduate Research Project Page 98 of 134 Faculty of Business and Finance
5.5 Recommendations for Future Research
Given the recent development in the ASEAN stock market, the stock market is the main
focus of this research project. In the future, instead of using stock market index in the
test, future researchers may focus or use different asset market such as bond market
index or other commodities in order to broaden the evidence of the linkage of financial
markets between Singapore and ASEAN-5. In addition, the foreign exchange market
can also be focused in future researches. This will help investors to manage their
portfolio diversification if the stock market volatility is high, they can invest at other
asset markets.
On the other hand, this research was mainly used STI index return, KLCI index return,
JCI index return, SET index return and PSEi index return as proxies to carry out this
research project. Other than these indexes, there are many other indexes can be replaced
or additionally used for future research. For instance, in Singapore there are FTSE ST
All-Share Index, FTSE ST Mid Cap Index, etc. In Malaysia, the other indexes included
in Bursa Malaysia such as FTSE Bursa Malaysia Large 30 Index, FTSE Bursa Malaysia
100 Index, etc. Asides to JCI index, Jakarta Islamic Index also can be used as Indonesia
stock market index. Furthermore, Thailand stock market index also included SET50
Index and SET100 Index. In Philippines, the stock market consists of PSE All Shares
Index, PSE Financials Index (FIN), etc. Hence, the future researchers can use different
stock market index to enrich the similar research. The future researchers may further
investigate a standard industries index from each country to carry out the test. This
enable to examine which of the specific industries has the greatest influence to the stock
market return between Singapore and ASEAN-5.
The investigation for the linkage of stock market return between Singapore and
ASEAN-5 has been conducted in this research. The future researchers are encouraged
to determine the relationship of stock market return between Singapore and other
countries such as European countries or Latin America. By expanding the different
countries data, the results will improve the understanding of portfolio diversification
strategies and provide more information for future research.

The Linkage between Stock Market Returns of Singapore and Other ASEAN-5 Countries
Undergraduate Research Project Page 99 of 134 Faculty of Business and Finance
5.6 Conclusion
In conclusion, this research project has studied the relationship between ASEAN-5
stock markets and the effect of towards Singapore stock market return. The results held
that all selected independent variables, namely Malaysia, Indonesia, Thailand and
Philippines stock market returns had positive significant effect towards Singaporean
stock market. All in all, the general objective of investigating the relationship between
stock market returns of Singapore and other ASEAN-5 countries (Malaysia, Indonesia,
Thailand and Philippine) from the period of 2005 to 2016 on monthly basis had been
achieved. The results from this project could be a useful reference to stock investors,
fund managers, government and policymakers. Moreover, limitations of the research
project were highlighted in this chapter while some recommendations were laid down
to future researchers for a more improved study.

The Linkage between Stock Market Returns of Singapore and Other ASEAN-5 Countries
Undergraduate Research Project Page 100 of 134 Faculty of Business and Finance
REFERENCES
Abd Karim, M. Z., & Gee, C. S. (2008). Stock market integration between Malaysia and its major trading partners (1994-2002), Applied Econometrics and
International Development, 6(3), 203-224.
Abidin, S. , Walters, C. , Lim, K.L. & Banchit, A. (2013). Cointegration between stock
prices and exchange rates in Asia-Pacific countries. Investment Management and Financial Innovations, 5(2), 142-146.
Adam, P., Gubu, L., & Cahyono, E. (2014). Statistical characteristics of Jakarta Composite Index (JCI) dynamics based on short term data represented in
candles. International Journal of Economics Finance and Management Sciences, 2(2), 138-142.
Anwar, T., & Raza, M. Y. (2016). Economic integration of stock markets: An evidence from Pakistan, China and Malaysia stock exchanges. Management and
Organizational Studies, 3(3), 52-59.
Arčabić, V., Globan, T., & Raguž, I. (2013). The relationship between the stock market
and foreign direct investment in Croatia: evidence from VAR and cointegration
analysis. Financial theory and practice, 37(1), 109-126.
Arouri, M. E. H., Nguyen, D. K., & Pukthuanthong, K. (2012). An international CAPM for partially integrated markets: Theory and empirical evidence. Journal of
Banking & Finance, 36(9), 2473-2493.
Asian Development Bank. (2016). Asian development outlook 2016: Asia’s potential
growth. Mandaluyong City, Philippines: Asian Development Bank.
Aumeboonsuke, V. (2012). Weak form efficiency of six equity exchanges in Asean.
European Journal of Scientific Research, 84(4), 532-538.
Azizan, N. A., & Sulong, H. (2011). The preparation towards Asean exchange link
between Malaysia stock market and Asia countries macroeconomics variables interdependency. International Journal of Business and Social Science, 2(5),
127-134.
The Linkage between Stock Market Returns of Singapore and Other ASEAN-5 Countries
Undergraduate Research Project Page 101 of 134 Faculty of Business and Finance
Azman-Saini, W. N. W., Azali, M., Habibullah, M. S., & Matthews, K. G. (2002). Financial integration and the ASEAN-5 equity markets. Applied
Economics, 34(18), 2283-2288.
Bansal, R., Hsieh, D. A., & Viswanathan, S. (1993). A new approach to international
arbitrage pricing. The Journal of Finance, 48(5), 1719-1747.
Bashiri, N., & Zadeh, A. M. (2014). The study of relationship between Asian stock
exchanges and New York stock exchange. Tehnicki Vjesnik-Technical Gazette, 21(3), 609-615.
Baumöhl, E., & Výrost, T. (2010). Stock market integration: Granger causality testing with respect to nonsynchronous trading effects. Finance a Uver, 60(5), 414-425.
BBC News. (2008, December 31). Record stock market falls in 2008. Retrieved from http://news.bbc.co.uk/2/hi/business/7805644.stm.
Beik, I. S., & Wardhana, W. (2011). The relationship between Jakarta Islamic index and other selected markets: Evidence from impulse response function. Majalah
Ekonomi, 21(2), 100-109.
Bekaert, G. (1995). Market integration and investment barriers in emerging equity
markets. The World Bank Economic Review, 9(1), 75-107.
Bekaert, G., & Harvey, C. R. (1995). Time‐varying world market integration. The
Journal of Finance, 50(2), 403-444.
Bekaert, G., & Harvey, C. R. (2000). Foreign speculators and emerging equity
markets. The Journal of Finance, 55(2), 565-613.
Bisen, V., & Pandey, M. (2013). Testing Efficient Market Hypothesis (EMH) in
Current Indian Stock Market. Journal of Commerce and Management Thought, 4(4), 792-799.
Bloomberg L.P. (2017). Straits Times Index STI. Retrieved April 3, 2017 from Bloomberg database.
The Linkage between Stock Market Returns of Singapore and Other ASEAN-5 Countries
Undergraduate Research Project Page 102 of 134 Faculty of Business and Finance
Box, J. F. (1987). Guinness, Gosset, Fisher, and small samples. Statistical science, 2(1), 45-52.
Brooks, R. D., Faff, R. W., & Ariff, M. (1998). An investigation into the extent of beta instability in the Singapore stock market. Pacific-Basin Finance Journal, 6(1),
87-101.
Caporale, G. M., & Spagnolo, N. (2012). Stock market integration between three
CEECs. Journal of Economic Integration, 27(1), 115-122.
Celık, S. (2012). The more contagion effect on emerging markets: The evidence of
DCC-GARCH model. Economic Modelling, 29(5), 1946-1959.
Chancharat, S., Valadkhani, A., & Havie, C. (2008). The influence of international
stock markets and macroeconomic variables on the Thai stock market. Applied Econometrics and International Development, 7(1), 221-238.
Chatziantoniou, I., Duffy, D., & Filis, G. (2013). Stock market response to monetary and fiscal policy shocks: Multi-country evidence. Economic Modelling, 30, 754-
769.
Chen, J. H., & Diaz, J. F. (2014). Predictability and efficiency of the Philippine stock exchange index. Journal of Business and Economics, 5(4), 535-539.
Chen, X. (2012). Empirical investigations into stock market integration and risk
monitoring of the emerging Chinese stock markets (Doctoral dissertation, University of St Andrews).
Cho, D. C., Eun, C. S., & Senbet, L. W. (1986). International arbitrage pricing theory:
An empirical investigation. The Journal of Finance, 41(2), 313-329.
Chuang, P. M. (2017). Singapore remains a top FDI destination globally. The Business
Times. Retrieved from http://www.businesstimes.com.sg/government-
economy/singapore-remains-a-top-fdi-destination-globally
Click, R. W., & Plummer, M. G. (2005). Stock market integration in ASEAN after the Asian financial crisis. Journal of Asian Economics, 16(1), 5-28.

The Linkage between Stock Market Returns of Singapore and Other ASEAN-5 Countries
Undergraduate Research Project Page 103 of 134 Faculty of Business and Finance
Craven, B. D., & Islam, S. M. (2011). Ordinary least-squares regression (pp. 224-228). Sage Publications.
Davies, W. (2017). Things will get worse for the Malaysian Ringgit : BMI research.
Retrieved from https://www.bloomberg.com/news/articles/2017-01-04/things-will-get-worse-for-the-malaysian-ringgit-bmi-research.
De Santis, R. A. (2010). The geography of international portfolio flows, international
CAPM, and the role of monetary policy frameworks. International Journal of Central Banking, 6(2), 147-197.
Ding, L. (2010). US and Asia Pacific equity markets causality test. International
Journal of Business and Management, 5(9), 38-45.
Dioquino, M. C. (2014). Hans Sicat and the transformation at the Philippine Stock Exchange. Asian Case Research Journal, 18(02), 429-454.
Dumas, B. (1994). A test of the international CAPM using business cycles indicators as
instrumental variables. In The internationalization of equity markets (pp. 23-58). University of Chicago Press.
Engel, C., & Rodrigues, A. P. (1989). Tests of international CAPM with time‐varying
covariances. Journal of Applied Econometrics, 4(2), 119-138.
Engle, R. F. (1982). Autoregressive conditional heteroscedasticity with estimates of the variance of United Kingdom inflation. Econometrica: Journal of the
Econometric Society, 50(4), 987-1007.
Farrar, D. E., & Glauber, R. R. (1967). Multicollinearity in regression analysis: The problem revisited. The Review of Economic and Statistics, 49(1), 92-107.
Fernandez, V. P. (2005). The international CAPM and a wavelet-based decomposition
of value at risk. Studies in Nonlinear Dynamics & Econometrics, 9(4), 1-26.
Fontanills, G. A., & Gentile, T. (2001). The stock market course. (1st ed.). New York: John Wiley & Sons, Inc.
FTSE Russell. (2016). FTSE ST Index series. Retrieved from
http://www.ftse.com/products/indices/sgx-st.

The Linkage between Stock Market Returns of Singapore and Other ASEAN-5 Countries
Undergraduate Research Project Page 104 of 134 Faculty of Business and Finance
Furgang, K. (2011). How the stock market works?. (1st ed.). New York: The Rosen Publishing Group, Inc.
Goh, Q. R., Annuar, M. N., & Zariyawati, M. A. (2014). The benefits of diversification
in Asean stock market to Malaysia investors. Asian Social Science, 10(4), 78-92.
Government of Singapore. (2017). Foreign Direct Equity Investment In Singapore By
Country/Region (Stock As At Year-End), Annual. Retrieved from
https://data.gov.sg/dataset/foreign-direct-equity-investment-in-singapore-by-
country-region-stock-as-at-year-end-annual
Granger, C. W. (1969). Investigating causal relations by econometric models and cross-
spectral methods. Econometrica: Journal of the Econometric Society, 37(3), 424-438.
Granger, C. W., & Joyeux, R. (1980). An introduction to long‐memory time series
models and fractional differencing. Journal of time series analysis, 1(1), 15-29.
Greene, W. H. (2003). Econometric analysis. New Jersey, United States: Pearson Education LTD.
Gujarati, D. (2004). Basic Econometrics. (4th ed.). Boston, United States: McGraw-Hill
International Edition.
Gujarati, D. N., & Porter, D. C. (2009). Basic Econometrics. (5th ed.). New York, United States: McGraw-Hill International Edition.
Hakeem, S. A., Tsoho, H. S., & Dogara, I. A. M. (2016). International portfolio theory
and diversification: An overview. Business and Management Research Journal, 6(10), 100-108.
Hayashi, H. (2013). Korea Exchange's global strategy: Opportunities and challenges.
Nomura Journal of Capital Markets, 4(4), 1-12.
Heydarian, R.J. (2013). Philippine Stocks Crash: Symptom of Growing Economic Imbalances. Huffpost. Retrieved from
http://www.huffingtonpost.com/richard-javad-heydarian/philippine-stocks-crash-s_b_2900518.html.
The Linkage between Stock Market Returns of Singapore and Other ASEAN-5 Countries
Undergraduate Research Project Page 105 of 134 Faculty of Business and Finance
Ho, C. S. (2009). Domestic macroeconomic fundamentals and world stock market effects on ASEAN emerging markets. 22nd Australasian Finance and Banking
Conference 2009, 5(1), 1-18.
Hyde, S. J., Bredin, D. P., & Nguyen, N. (2007). Correlation dynamics between Asia-Pacific. EU and US stock returns, Munich Personal RePEc Archive, (9681).
Ibrahim, M., & Musah, A. (2014). An econometric analysis of the impact of
macroeconomic fundamentals on stock market returns in Ghana. Research in Applied Economics, 6(2), 47.
Ikeda, S. (1991). Arbitrage asset pricing under exchange risk. The Journal of
Finance, 46(1), 447-455.
Inquirer. (2017). Likely impact of Thai king’s death on economy unclear. Inquirer Net. Retrieved from http://newsinfo.inquirer.net/825268/likely-impact-of-thai-
kings-death-on-economy-unclear.
Ioannidis, C., & Kontonikas, A. (2006). Monetary policy and the stock market: Some international evidence. United Kingdom: University of Bath and University of
Glasgow.
Janor, H., & Ali, R. (2007). Financial integration of the ASEAN-5 markets: financial crisis effects based on bivariate and multivariate cointegration
approach. Investment Management and Financial Innovations, 4(4), 144-158.
Jarque, C. M., & Bera, A. K. (1987). A test for normality of observations and regression residuals. International Statistical Review, 55(2), 163–172.
Jarungkitkul, W., & Sukcharoensin, S. (2016). Benchmarking the competitiveness of
the ASEAN 5 equity markets: An application of Porter’s diamond model. Benchmarking: An International Journal, 23(5), 1312-1340.
Jiang, Y., Nie, H., & Monginsidi, J. Y. (2017). Co-movement of ASEAN stock markets:
New evidence from wavelet and VMD-based copula tests. Economic Modelling, 64, 384-398.
Kabigting, L. C., & Hapitan, R. B. (2013). Financial integration among the ASEAN 5+
3 stock markets: A preliminary look at the first 10 years of the new millenium. Chinese Business Review, 12(5), 305-314.

The Linkage between Stock Market Returns of Singapore and Other ASEAN-5 Countries
Undergraduate Research Project Page 106 of 134 Faculty of Business and Finance
Karim, B. A., & Karim, Z. A. (2012). Integration of ASEAN-5 stock markets: A revisit.
Asian Academy of Management Journal of Accounting and Finance, 8(2), 21-41.
Kearney, C., & Lucey, B. M. (2004). International equity market integration: Theory, evidence and implications. International Review of Financial Analysis, 13(5),
571-583.
Kelikume, I. (2016). New evidence from the efficient market hypothesis for the Nigerian stock index using the wavelet unit root test approach. The Journal of
Developing Areas, 50(5), 185-197.
Kim, J. H., & Shamsuddin, A. (2008). Are Asian stock markets efficient? Evidence from new multiple variance ratio tests. Journal of Empirical Finance, 15(3),
518–532
Kung, J. J., & Wong, W. K. (2009). Profitability of technical analysis in the Singapore stock market: Before and after the Asian financial crisis. Journal of
economic integration, 135-150.
Lauterbach, B., & Reisman, H. (2004). Keeping up with the Joneses and the home bias. European Financial Management, 10(2), 225-234.
Lee, S. S. P., & Goh, K. L. (2016). Regional and international linkages of the ASEAN-
5 stock markets: a multivariate GARCH approach. Asian Academy of Management Journal of Accounting & Finance, 12(1), 49-71.
Lim, L. K. (2007). Linkages between ASEAN stock markets: A cointegration approach.
In MODSIM 2007 International Congress on Modelling and Simulation. Modelling and Simulation Society of Australia and New Zealand (pp. 1818-
1824).
Lim, L. K. (2009). Convergence and interdependence between ASEAN-5 stock markets. Mathematics and Computers in Simulation, 79(9), 2957-2966.
Lin, J. (2008). Notes on testing causality. Institute of Economics, Academia Sinica,
Department of Economics, National Chengchi University.
Loh, L. (2013). Co-movement of Asia-Pacific with European and US stock market returns: A cross-time-frequency analysis. Research in International Business
The Linkage between Stock Market Returns of Singapore and Other ASEAN-5 Countries
Undergraduate Research Project Page 107 of 134 Faculty of Business and Finance
and Finance, 29, 1-13.
Long, J. S., & Ervin, L. H. (2000). Using heteroscedasticity consistent standard errors in the linear regression model. The American Statistician, 54(3), 217-224.
Mahadeva, L., & Robinson, P. (2004). Unit root testing to help model building. Centre
for Central Banking Studies, Bank of England.
Malesky, E., & Samphantharak, K. (2011). Understanding Thailand’s ongoing political crisis: Wider implications for Southeast Asia and the west. Democratic Asia
and The West Paper Series. The German Marshall Fund of the United States.
Markowitz, H. (1952). Portfolio selection. The journal of finance, 7(1), 77-91.
Masoud, N. M. (2013). The impact of stock market performance upon economic growth. International Journal of Economics and Financial Issues, 3(4), 788.
Massey, A., & Miller, S. J. (2006). Tests of hypotheses using statistics. Mathematics
Department, Brown University, Providence, RI, 2912.
Maziarz, M. (2015). A review of the Granger-causality fallacy. The Journal of Philosophical Economics: Reflections on Economic and social issues, 8(2), 86-
105.
Mehmet, Y. Ü. C. E. (2008). An asymptotic test for the detection of heteroskedasticity. Ekonometri ve İstatistik e-Dergisi, 8(1), 33-44.
Mensi, W., Hammoudeh, S., Nguyen, D. K., & Kang, S. H. (2016). Global financial
crisis and spillover effects among the US and BRICS stock markets. International Review of Economics & Finance, 42, 257-276.
Michael, C. (2015). Econometrics. Retrieved from
http://pareto.uab.es/mcreel/Econometrics/econometrics.pdf
Moffett, M. H., Stonehill, A. I., & Eiteman, D. K. (2014). Fundamentals of multinational finance. (5th ed.). Boston, United States: Pearson Prentice Hall.
Muijs, D. (2010). Doing quantitative research in education with SPSS. Sage.
The Linkage between Stock Market Returns of Singapore and Other ASEAN-5 Countries
Undergraduate Research Project Page 108 of 134 Faculty of Business and Finance
Narayan, S., & Narayan, P. K. (2012). Do US macroeconomic conditions affect Asian
stock markets?. Journal of Asian Economics, 23(6), 669-679.
Nezky, M. (2013). The Impact of US Crisis on Trade and Stock Market in Indonesia. Bulletin of Monetary Economics and Banking (Buletin Ekonomi Moneter dan
Perbankan), 15(3), 83-96.
Ng, T. H. (2002). Stock market linkages in South–East Asia. Asian Economic Journal, 16(4), 353-377.
Ning, W., & Ngunkeng, G. (2013). An empirical likelihood ratio based goodness-of-fit
test for skew normality. Statistical Methods & Applications, 22(2), 209-226.
Österholm, P., & Hjalmarsson, E. (2007). Testing for cointegration using the Johansen methodology when variables are near-integrated (No. 7-141). International
Monetary Fund.
Phuan, S. M., Lim, K. P., & Ooi, A. Y. (2009). Financial liberalization and stock markets integration for Asean-5 countries. International business research, 2(1),
100.
Phylaktis, K., & Ravazzolo, F. (2005). Stock market linkages in emerging markets: Implications for international portfolio diversification. Journal of International
Financial Markets, Institutions and Money, 15(2), 91-106.
Pollitt, L. C., Reece, S. E., Mideo, N., Nussey, D. H., & Colegrave, N. (2012). The problem of auto-correlation in parasitology. PLoS Pathog, 8(4), 1-5.
Purnomo, B., & Rider, M. W. (2012). Domestic and foreign shocks and the Indonesian
stock market: Time series evidence. 1-28.
Quigley, L., & Ramsey, D. (2008). Statistical analysis of the log returns of financial assets. Financial mathematic, University of Limerick.
Rei, S., Chicea, D., & Olaru, S. (2016). Autocorrelation function analysis in processing
stochastic time series. Annals of the University Dunarea de Jos of Galati: Fascicle II, Mathematics, Physics, Theoretical Mechanics, 39(1), 57-60.

The Linkage between Stock Market Returns of Singapore and Other ASEAN-5 Countries
Undergraduate Research Project Page 109 of 134 Faculty of Business and Finance
Reilly, F. K., and Keith, C. B. (2012). Investment analysis and portfolio management. (10th ed.). Boston, United States: South-Western/Cengage Learning.
Rew, L., Koniak-Griffin, D., Lewis, M. A., Miles, M., & O'Sullivan, A. (2000).
Secondary data analysis: New perspective for adolescent research. Nursing Outlook, 48(5), 223-229.
Roca, E. D., Selvanathan, E. A., & Shepherd, W. F. (1998). Are the ASEAN equity
markets interdependent?. ASEAN Economic Bulletin, 15(2), 109-120.
Roshaiza, T., Sisira, R. N. C., & Svetlana, M. (2009). Financial development and economic growth in Malaysia: Cointegration and co-feature analysis. Business
and Economics, 31(9), 1441-5429.
Royfaizal, R. C., Lee, C., & Azali, M. (2009a). ASEAN-5+ 3 and US stock markets interdependence before, during and after Asian financial crisis. International
Journal of Economics and Finance, 1(2), 45-54.
Royfaizal, R. C., Lee, C., & Azali, M. (2009b). The linkages of Asian and the US stock
markets. The Iefai University Journal of Financial Economics, 7(2), 74-90.
Russo, C. (2012). Estimating market power with weak a priori information: An
exploratory approach to the model-specification problem. Review of Industrial
Organization, 40(4), 339-354.
Schmukler, S. L. (2004). Benefits and risks of financial globalization: Challenges for developing countries. Globalization, Growth, and Poverty, World Bank Policy
Research Report.
Sercu, P. (1980). A generalization of the international asset pricing model. Revue de l’Association française de Finance, 1(1), 91-135.
Shabri Abd. Majid, M., Kameel Mydin Meera, A., Azmi Omar, M., & Abdul Aziz, H.
(2009). Dynamic linkages among ASEAN-5 emerging stock markets. International Journal of Emerging Markets, 4(2), 160-184.
Sia, S. K., Hsu, C., & Teo, W. J. (2016). Implementing ASEAN stock trading links:
tackling the institutional challenges. 20th Pacific Asia Conference on Information Systems, (PACIS) 2016. Chiayi, Taiwan: PACIS.

The Linkage between Stock Market Returns of Singapore and Other ASEAN-5 Countries
Undergraduate Research Project Page 110 of 134 Faculty of Business and Finance
Siklos, P. L., & Ng, P. (2001). Integration among Asia-Pacific and international stock
markets: common stochastic trends and regime shifts. Pacific Economic Review, 6(1), 89-110.
Sinan, A., & Alkan, B. B. (2015). A useful approach to identify the multicollinearity in
the presence of outliers. Journal of Applied Statistics, 42(5), 986-993.
Skerman, R., & Della Maggiora, D. (2009). Johansen cointegration analysis of American and European stock market indices: An empirical study. (Unpublished
master’s thesis). Lund University, Lund, Sweden.
Solnik, B. (1982). International arbitrage pricing theory. The Journal of Finance, 38(2), 449-457.
Soon, V. S., Baharumshah, A. Z. & Chan, T. H. (2015). Efficiency market hypothesis in
an emerging market: Does it really hold for Malaysia. JurnalPengurusan, 42. 31-42.
Sørensen, B. E. (2005). Granger causality. Economics, 7395.
Sorensen, H. T., Sabroe, S., & Olsen, J. (1996). A framework for evaluation of
secondary data sources for epidemiological research. International Journal of Epidemiology, 25(2), 435-442.
Stulz, R. M. (1995). International portfolio choice and asset pricing: An integrative
survey. Handbooks in Operations Research and Management Science, 9, 201-223.
Sukamolson, S. (2010). Fundamentals of quantitative research. Language Institute,
Chulalongkorn University.
Sukcharoensin, P., & Sukcharoensin, S. (2013). The analysis of stock market development indicators: Evidence from the ASEAN-5 equity markets.
International Journal of Trade, Economics and Finance, 4(6), 343-346.
Sutheebanjard, P., & Premchaiswadi, W. (2010). Forecasting the Thailand stock market using evolution strategies. Asian Academy of Management Journal of
Accounting and Finance, 6(2), 85-114.
The Linkage between Stock Market Returns of Singapore and Other ASEAN-5 Countries
Undergraduate Research Project Page 111 of 134 Faculty of Business and Finance
Tan, C. H. (2005). Financial markets and institutions in Singapore. (11th ed.). Singapore: Nus Press.
Tan, T. A. (2012). Stock market integration: Case of the Philippines. Philippine
Management Review, 19, 75-90.
Tasic, S., & Feruh, M. B. (2012). Errors and issues in secondary data used in marketing research. Socioeconomica, 1(2), 326-335.
Tauchen, G. E., & Pitts, M. (1983). The price variability-volume relationship on
speculative markets. Econometrica: Journal of the Econometric Society, 51(2), 485-505.
Teng, K. T., Yen, S. H., Chua, S. Y., & Lean, H. H. (2016). Time-varying linkages of
economic activities in China and the stock markets in ASEAN-5. Contemporary Economics, 10(2), 137-152.
Thanh, S. D. (2015). Threshold effects of inflation on growth in the ASEAN-5
countries: A panel smooth transition regression approach. Journal of Economics, Finance and Administrative Science, 20(38), 41-48.
Thao, T. P., & Daly, K. (2012). The impacts of the global financial crisis on Southeast
Asian equity markets integration. International Journal of Trade, Economics and Finance, 3(4), 299-304.
The Economist. (2015, March 12). Trouble at home: Political instability returns to
South-East Asia. The Economist. Retrieved from http://www.economist.com/news/asia/21646249-political-instability-returns-
south-east-asia-trouble-home.
The Philippines Stock Exchange, Inc. (n.d.). Trading System. Retrieved from http://www.pse.com.ph/corporate/home.html?tab=3.
Tiwari, A. K., Dar, A. B., Bhanja, N., & Shah, A. (2013). Stock market integration in
Asian countries: Evidence from wavelet multiple correlations. Journal of Economic Integration, 28(3), 441-456.
Tranmer, M., & Elliot, M. (2008). Multiple linear regression. The Cathie Marsh Centre
for Census and Survey Research (CCSR).

The Linkage between Stock Market Returns of Singapore and Other ASEAN-5 Countries
Undergraduate Research Project Page 112 of 134 Faculty of Business and Finance
Tse, Y. K., & Tan, K. (2001). The integration of the east and south-east Asian equity markets. Research Collection School of Economics.
Ul-Islam, T. (2011). Normality testing-a new direction. International Journal of
Business and Social Science, 2(3),115.
Van den Bossche, F. A. (2011). Fitting state space models with EViews. Journal of Statistical Software, 41(8), 1-16.
Vatcheva, K. P., Lee, M., McCormick, J. B., & Rahbar, M. H. (2016). Multicollinearity
in regression analyses conducted in epidemiologic studies. Epidemiology (Sunnyvale, Calif.), 6(2), 1-20.
William, H. G. (2002). Econometric analysis. (5th ed.). New Jersey, United States:
Pearson Prentice Hall.
Wong, W. K., Penm, J., Terrell, R. D., & Ching, K. Y. (2004). The relationship between stock markets of major developed countries and Asian emerging
markets. Journal of Applied Mathematics & Decision Sciences, 8(4), 201-218.
Wooldridge, J. M. (2013). Introductory econometrics: A modern approach (5th ed.). Manson, OH: South-Western/Cengage Learning.
Yang, A. S., & Pangastuti, A. (2016). Stock market efficiency and liquidity: the
Indonesia Stock Exchange merger. Research in International Business and Finance, 36, 28-40.
Yi, Z., & Tan, S. L. (2009). An empirical analysis of stock market integration:
Comparison study of Singapore and Malaysia. The Singapore Economic Review, 54(2), 217-232.

The Linkage between Stock Market Returns of Singapore and Other ASEAN-5 Countries
Undergraduate Research Project Page 113 of 134 Faculty of Business and Finance
APPENDICES
APPENDIX 1: MULTICOLLINEARITY
Pair-wise Correlation Matrix
Variance Inflation Factor (VIF) / Tolerance (TOL)
R2 VIF = 1/(1 – R2 ) TOL = 1 – R2
logMAL 0.508103 2.032946 < 10 0.491897 > 0
logIND 0.682036 3.145010 < 10 0.317964 > 0
logTHAI 0.560084 2.273161 < 10 0.439916 > 0
logPHI 0.504154 2.016755 < 10 0.495846 > 0
logIND logMAL logPHI logTHAI
logIND 1.000000 0.689524 0.683194 0.732340
logMAL 0.689524 1.000000 0.584946 0.585973
logPHI 0.683194 0.584946 1.000000 0.593558
logTHAI 0.732340 0.585973 0.593558 1.000000

The Linkage between Stock Market Returns of Singapore and Other ASEAN-5 Countries
Undergraduate Research Project Page 114 of 134 Faculty of Business and Finance
APPENDIX 2: HETEROSCEDASTICITY
Autoregressive Conditional Heteroskedasticity (ARCH) Test
Heteroskedasticity Test: ARCH
F-statistic 0.038939 Prob. F(1,140) 0.8439
Obs*R-squared 0.039485 Prob. Chi-Square(1) 0.8425
Test Equation:
Dependent Variable: RESID^2
Method: Least Squares
Date: 03/23/17 Time: 15:04
Sample (adjusted): 2005M03 2016M12
Included observations: 142 after adjustments
Variable Coefficient Std. Error t-Statistic Prob.
C 0.000171 2.89E-05 5.919478 0.0000
RESID^2(-1) 0.016661 0.084433 0.197331 0.8439
R-squared 0.000278 Mean dependent var 0.000174
Adjusted R-squared -0.006863 S.D. dependent var 0.000296
S.E. of regression 0.000297 Akaike info criterion -13.39326
Sum squared resid 1.23E-05 Schwarz criterion -13.35163
Log likelihood 952.9218 Hannan-Quinn criter. -13.37635
F-statistic 0.038939 Durbin-Watson stat 1.974867
Prob(F-statistic) 0.843855

The Linkage between Stock Market Returns of Singapore and Other ASEAN-5 Countries
Undergraduate Research Project Page 115 of 134 Faculty of Business and Finance
APPENDIX 3: AUTOCORRELATION
Breush-Godfrey Serial Correlation LM Test
F-statistic 2.280561 Prob. F(1,137) 0.1333
Obs*R-squared 2.341462 Prob. Chi-Square(1) 0.1260
Test Equation:
Dependent Variable: RESID
Method: Least Squares
Date: 03/23/17 Time: 15:06
Sample: 2005M02 2016M12
Included observations: 143
Presample missing value lagged residuals set to zero.
Variable Coefficient Std. Error t-Statistic Prob.
C 5.91E-06 0.001136 0.005200 0.9959
LOGMAL 0.029798 0.105152 0.283383 0.7773
LOGIND -0.014868 0.073501 -0.202284 0.8400
LOGPHI -0.000931 0.067389 -0.013822 0.9890
LOGTHAI 0.011193 0.064950 0.172328 0.8634
RESID(-1) -0.132214 0.087550 -1.510153 0.1333
R-squared 0.016374 Mean dependent var 1.23E-18
Adjusted R-squared -0.019525 S.D. dependent var 0.013188
S.E. of regression 0.013316 Akaike info criterion -5.758699
Sum squared resid 0.024291 Schwarz criterion -5.634384
Log likelihood 417.7470 Hannan-Quinn criter. -5.708183
F-statistic 0.456112 Durbin-Watson stat 1.995643
Prob(F-statistic) 0.808260

The Linkage between Stock Market Returns of Singapore and Other ASEAN-5 Countries
Undergraduate Research Project Page 116 of 134 Faculty of Business and Finance
APPENDIX 4: MODEL SPECIFICATION
Ramsey Regression Equation Specification Error Test (RESET) Test
Ramsey RESET Test
Equation: UNTITLED
Specification: LOGSING C LOGMAL LOGPHI LOGTHAI LOGIND
Omitted Variables: Squares of fitted values
Value df Probability
t-statistic 0.439378 137 0.6611
F-statistic 0.193053 (1, 137) 0.6611
Likelihood ratio 0.201366 1 0.6536
F-test summary:
Sum of Sq. df Mean Squares
Test SSR 3.48E-05 1 3.48E-05
Restricted SSR 0.024695 138 0.000179
Unrestricted SSR 0.024661 137 0.000180
Unrestricted SSR 0.024661 137 0.000180
LR test summary:
Value df
Restricted LogL 416.5665 138
Unrestricted LogL 416.6672 137

The Linkage between Stock Market Returns of Singapore and Other ASEAN-5 Countries
Undergraduate Research Project Page 117 of 134 Faculty of Business and Finance
Unrestricted Test Equation:
Dependent Variable: SING
Method: Least Squares
Date: 03/09/17 Time: 00:49
Sample: 2005M02 2016M12
Included observations: 143
Variable Coefficient Std. Error t-Statistic Prob.
C -0.002163 0.001240 -1.744771 0.0833
LOGMAL 0.384343 0.104098 3.692126 0.0003
LOGPHI 0.194713 0.068214 2.854434 0.0050
LOGTHAI 0.185026 0.066609 2.777803 0.0062
LOGIND 0.251071 0.074187 3.384306 0.0009
FITTED^2 0.460899 1.048982 0.439378 0.6611
R-squared 0.670700 Mean dependent var 0.001081
Adjusted R-squared 0.658681 S.D. dependent var 0.022965
S.E. of regression 0.013417 Akaike info criterion -5.743597
Sum squared resid 0.024661 Schwarz criterion -5.619282
Log likelihood 416.6672 Hannan-Quinn criter. -5.693082
F-statistic 55.80674 Durbin-Watson stat 2.236647
Prob(F-statistic) 0.000000
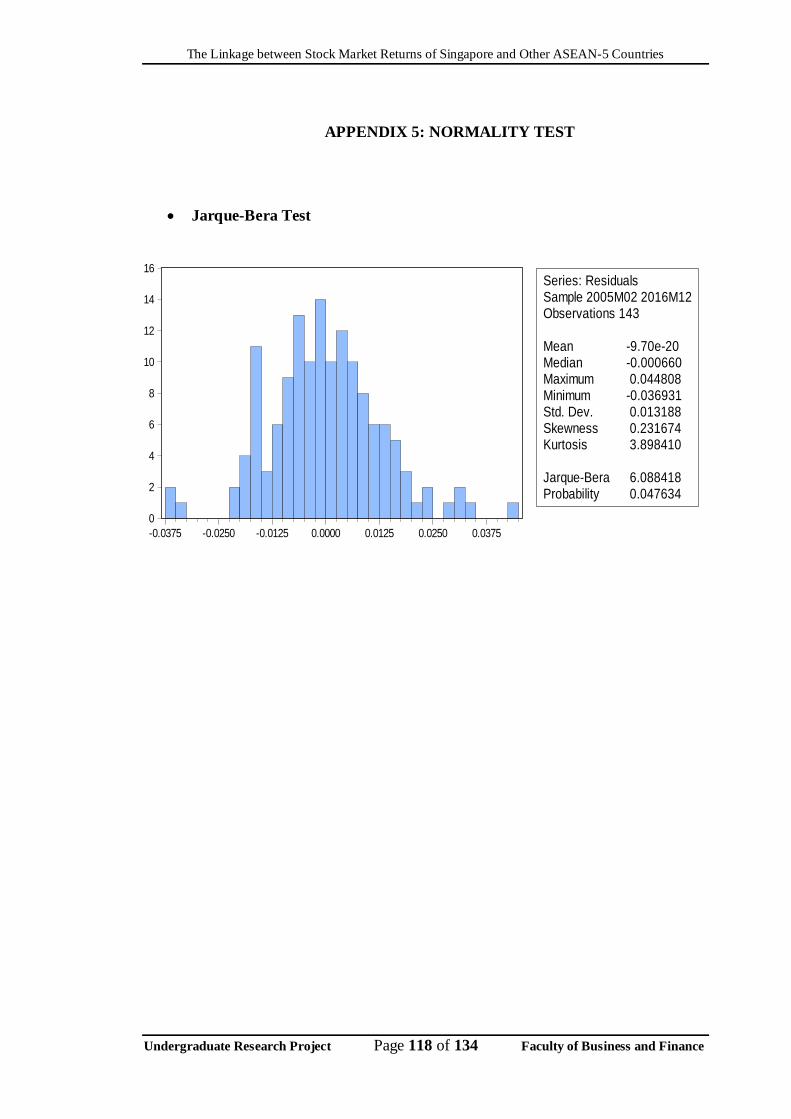
The Linkage between Stock Market Returns of Singapore and Other ASEAN-5 Countries
Undergraduate Research Project Page 118 of 134 Faculty of Business and Finance
APPENDIX 5: NORMALITY TEST
Jarque-Bera Test
0
2
4
6
8
10
12
14
16
-0.0375 -0.0250 -0.0125 0.0000 0.0125 0.0250 0.0375
Series: ResidualsSample 2005M02 2016M12Observations 143
Mean -9.70e-20Median -0.000660Maximum 0.044808Minimum -0.036931Std. Dev. 0.013188Skewness 0.231674Kurtosis 3.898410
Jarque-Bera 6.088418Probability 0.047634
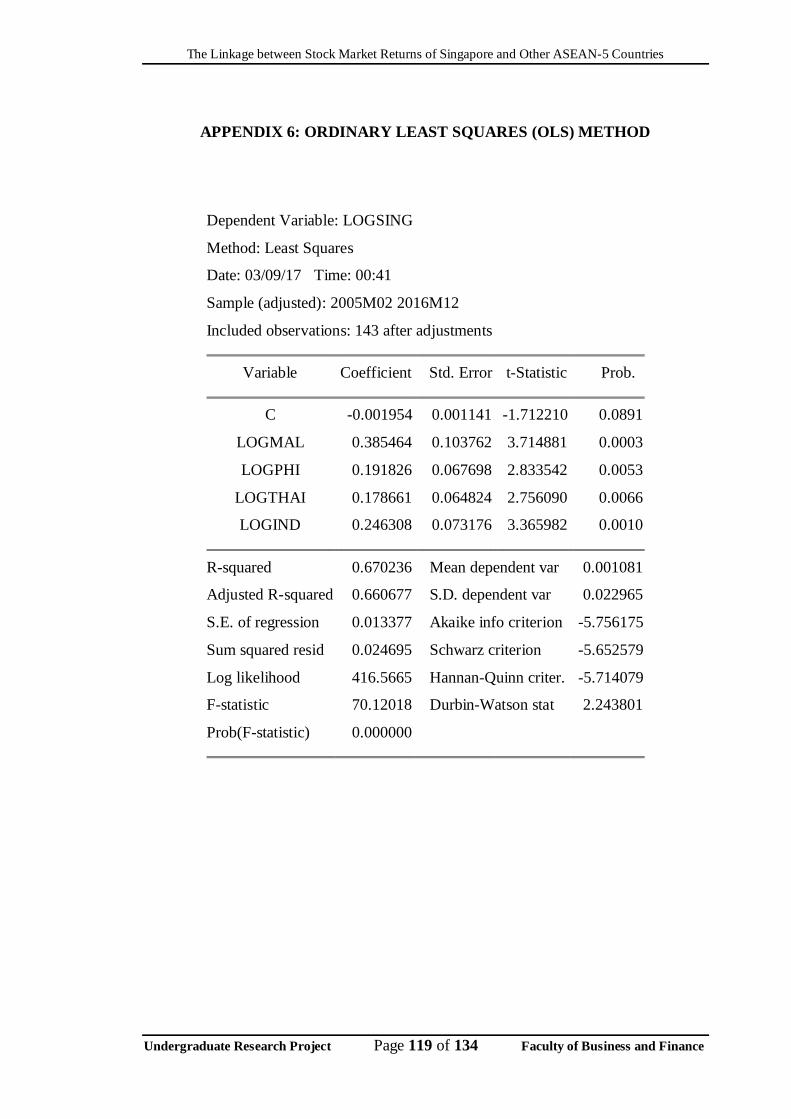
The Linkage between Stock Market Returns of Singapore and Other ASEAN-5 Countries
Undergraduate Research Project Page 119 of 134 Faculty of Business and Finance
APPENDIX 6: ORDINARY LEAST SQUARES (OLS) METHOD
Dependent Variable: LOGSING
Method: Least Squares
Date: 03/09/17 Time: 00:41
Sample (adjusted): 2005M02 2016M12
Included observations: 143 after adjustments
Variable Coefficient Std. Error t-Statistic Prob.
C -0.001954 0.001141 -1.712210 0.0891
LOGMAL 0.385464 0.103762 3.714881 0.0003
LOGPHI 0.191826 0.067698 2.833542 0.0053
LOGTHAI 0.178661 0.064824 2.756090 0.0066
LOGIND 0.246308 0.073176 3.365982 0.0010
R-squared 0.670236 Mean dependent var 0.001081
Adjusted R-squared 0.660677 S.D. dependent var 0.022965
S.E. of regression 0.013377 Akaike info criterion -5.756175
Sum squared resid 0.024695 Schwarz criterion -5.652579
Log likelihood 416.5665 Hannan-Quinn criter. -5.714079
F-statistic 70.12018 Durbin-Watson stat 2.243801
Prob(F-statistic) 0.000000

The Linkage between Stock Market Returns of Singapore and Other ASEAN-5 Countries
Undergraduate Research Project Page 120 of 134 Faculty of Business and Finance
APPENDIX 7: UNIT ROOT TEST
Augmented Dickey-Fuller test
Unit root for Log(1+IND)
Null Hypothesis: IND has a unit root
Exogenous: Constant
Lag Length: 0 (Automatic - based on SIC, maxlag=13)
t-Statistic Prob.*
Augmented Dickey-Fuller test statistic -9.379497 0.0000
Test critical values: 1% level -3.476805
5% level -2.881830
10% level -2.577668
*MacKinnon (1996) one-sided p-values.
Augmented Dickey-Fuller Test Equation
Dependent Variable: D(IND)
Method: Least Squares
Date: 03/09/17 Time: 00:27
Sample (adjusted): 2005M03 2016M12
Included observations: 142 after adjustments
Variable Coefficient Std. Error t-Statistic Prob.
IND(-1) -0.771839 0.082290 -9.379497 0.0000
C 0.003768 0.002274 1.657161 0.0997
R-squared 0.385897 Mean dependent var 4.60E-06
Adjusted R-squared 0.381511 S.D. dependent var 0.033914
S.E. of regression 0.026672 Akaike info criterion -4.396457
Sum squared resid 0.099592 Schwarz criterion -4.354825

The Linkage between Stock Market Returns of Singapore and Other ASEAN-5 Countries
Undergraduate Research Project Page 121 of 134 Faculty of Business and Finance
Log likelihood 314.1484 Hannan-Quinn criter. -4.379540
F-statistic 87.97496 Durbin-Watson stat 1.984291
Prob(F-statistic) 0.000000
Unit root for Log(1+MAL)
Null Hypothesis: MAL has a unit root
Exogenous: Constant
Lag Length: 0 (Automatic - based on SIC, maxlag=13)
t-Statistic Prob.*
Augmented Dickey-Fuller test statistic -10.17477 0.0000
Test critical values: 1% level -3.476805
5% level -2.881830
10% level -2.577668
*MacKinnon (1996) one-sided p-values.
Augmented Dickey-Fuller Test Equation
Dependent Variable: D(MAL)
Method: Least Squares
Date: 03/09/17 Time: 00:29
Sample (adjusted): 2005M03 2016M12
Included observations: 142 after adjustments
Variable Coefficient Std. Error t-Statistic Prob.
MAL(-1) -0.849957 0.083536 -10.17477 0.0000
C 0.001552 0.001296 1.197279 0.2332
R-squared 0.425112 Mean dependent var 7.22E-05
Adjusted R-squared 0.421006 S.D. dependent var 0.020175
S.E. of regression 0.015351 Akaike info criterion -5.501236
Sum squared resid 0.032993 Schwarz criterion -5.459604

The Linkage between Stock Market Returns of Singapore and Other ASEAN-5 Countries
Undergraduate Research Project Page 122 of 134 Faculty of Business and Finance
Log likelihood 392.5877 Hannan-Quinn criter. -5.484318
F-statistic 103.5259 Durbin-Watson stat 2.044006
Prob(F-statistic) 0.000000
Unit root for Log(1+PHI)
Null Hypothesis: PHI has a unit root
Exogenous: Constant
Lag Length: 0 (Automatic - based on SIC, maxlag=13)
t-Statistic Prob.*
Augmented Dickey-Fuller test statistic -11.08000 0.0000
Test critical values: 1% level -3.476805
5% level -2.881830
10% level -2.577668
*MacKinnon (1996) one-sided p-values.
Augmented Dickey-Fuller Test Equation
Dependent Variable: D(PHI)
Method: Least Squares
Date: 03/09/17 Time: 00:34
Sample (adjusted): 2005M03 2016M12
Included observations: 142 after adjustments
Variable Coefficient Std. Error t-Statistic Prob.
PHI(-1) -0.933885 0.084286 -11.08000 0.0000
C 0.003396 0.002009 1.690260 0.0932
R-squared 0.467207 Mean dependent var -6.35E-05
Adjusted R-squared 0.463402 S.D. dependent var 0.032288
S.E. of regression 0.023652 Akaike info criterion -4.636738
Sum squared resid 0.078320 Schwarz criterion -4.595106

The Linkage between Stock Market Returns of Singapore and Other ASEAN-5 Countries
Undergraduate Research Project Page 123 of 134 Faculty of Business and Finance
Log likelihood 331.2084 Hannan-Quinn criter. -4.619820
F-statistic 122.7664 Durbin-Watson stat 1.990925
Prob(F-statistic) 0.000000
Unit root for Log(1+SING)
Null Hypothesis: SING has a unit root
Exogenous: Constant
Lag Length: 0 (Automatic - based on SIC, maxlag=13)
t-Statistic Prob.*
Augmented Dickey-Fuller test statistic -9.710794 0.0000
Test critical values: 1% level -3.476805
5% level -2.881830
10% level -2.577668
*MacKinnon (1996) one-sided p-values.
Augmented Dickey-Fuller Test Equation
Dependent Variable: D(SING)
Method: Least Squares
Date: 03/09/17 Time: 00:35
Sample (adjusted): 2005M03 2016M12
Included observations: 142 after adjustments
Variable Coefficient Std. Error t-Statistic Prob.
SING(-1) -0.805063 0.082904 -9.710794 0.0000
C 0.000847 0.001906 0.444609 0.6573
R-squared 0.402474 Mean dependent var -4.98E-05
Adjusted R-squared 0.398206 S.D. dependent var 0.029241
S.E. of regression 0.022684 Akaike info criterion -4.720347
Sum squared resid 0.072038 Schwarz criterion -4.678715

The Linkage between Stock Market Returns of Singapore and Other ASEAN-5 Countries
Undergraduate Research Project Page 124 of 134 Faculty of Business and Finance
Log likelihood 337.1446 Hannan-Quinn criter. -4.703429
F-statistic 94.29953 Durbin-Watson stat 2.026562
Prob(F-statistic) 0.000000
Unit root for Log(1+THAI)
Null Hypothesis: THAI has a unit root
Exogenous: Constant
Lag Length: 2 (Automatic - based on SIC, maxlag=13)
t-Statistic Prob.*
Augmented Dickey-Fuller test statistic -5.303441 0.0000
Test critical values: 1% level -3.477487
5% level -2.882127
10% level -2.577827
*MacKinnon (1996) one-sided p-values.
Augmented Dickey-Fuller Test Equation
Dependent Variable: D(THAI)
Method: Least Squares
Date: 03/09/17 Time: 00:37
Sample (adjusted): 2005M05 2016M12
Included observations: 140 after adjustments
Variable Coefficient Std. Error t-Statistic Prob.
THAI(-1) -0.677612 0.127768 -5.303441 0.0000
D(THAI(-1)) -0.068427 0.103896 -0.658607 0.5113
D(THAI(-2)) -0.245814 0.082017 -2.997120 0.0032
C 0.001828 0.002120 0.862289 0.3900
R-squared 0.447942 Mean dependent var 0.000171
Adjusted R-squared 0.435764 S.D. dependent var 0.033063

The Linkage between Stock Market Returns of Singapore and Other ASEAN-5 Countries
Undergraduate Research Project Page 125 of 134 Faculty of Business and Finance
Phillips-Perron (PP) test result
Unit root for Log(1+IND)
Null Hypothesis: IND has a unit root
Exogenous: Constant
Bandwidth: 5 (Newey-West automatic) using Bartlett kernel
Adj. t-Stat Prob.*
Phillips-Perron test statistic -9.470687 0.0000
Test critical values: 1% level -3.476805
5% level -2.881830
10% level -2.577668
*MacKinnon (1996) one-sided p-values.
Residual variance (no correction) 0.000701
HAC corrected variance (Bartlett kernel) 0.000757
Phillips-Perron Test Equation
Dependent Variable: D(IND)
Method: Least Squares
Date: 03/28/17 Time: 20:12
Sample (adjusted): 2005M03 2016M12
Included observations: 142 after adjustments
S.E. of regression 0.024835 Akaike info criterion -4.524955
Sum squared resid 0.083883 Schwarz criterion -4.440908
Log likelihood 320.7469 Hannan-Quinn criter. -4.490801
F-statistic 36.78360 Durbin-Watson stat 2.012582
Prob(F-statistic) 0.000000

The Linkage between Stock Market Returns of Singapore and Other ASEAN-5 Countries
Undergraduate Research Project Page 126 of 134 Faculty of Business and Finance
Variable Coefficient Std. Error t-Statistic Prob.
IND(-1) -0.771839 0.082290 -9.379497 0.0000
C 0.003768 0.002274 1.657161 0.0997
R-squared 0.385897 Mean dependent var 4.60E-06
Adjusted R-squared 0.381511 S.D. dependent var 0.033914
S.E. of regression 0.026672 Akaike info criterion -4.396457
Sum squared resid 0.099592 Schwarz criterion -4.354825
Log likelihood 314.1484 Hannan-Quinn criter. -4.379540
F-statistic 87.97496 Durbin-Watson stat 1.984291
Prob(F-statistic) 0.000000
Unit root for Log(1+MAL)
Null Hypothesis: MAL has a unit root
Exogenous: Constant
Bandwidth: 5 (Newey-West automatic) using Bartlett kernel
Adj. t-Stat Prob.*
Phillips-Perron test statistic -10.52009 0.0000
Test critical values: 1% level -3.476805
5% level -2.881830
10% level -2.577668
*MacKinnon (1996) one-sided p-values.
Residual variance (no correction) 0.000232
HAC corrected variance (Bartlett kernel) 0.000311
Phillips-Perron Test Equation
Dependent Variable: D(MAL)
Method: Least Squares

The Linkage between Stock Market Returns of Singapore and Other ASEAN-5 Countries
Undergraduate Research Project Page 127 of 134 Faculty of Business and Finance
Date: 03/28/17 Time: 20:13
Sample (adjusted): 2005M03 2016M12
Included observations: 142 after adjustments
Variable Coefficient Std. Error t-Statistic Prob.
MAL(-1) -0.849957 0.083536 -10.17477 0.0000
C 0.001552 0.001296 1.197279 0.2332
R-squared 0.425112 Mean dependent var 7.22E-05
Adjusted R-squared 0.421006 S.D. dependent var 0.020175
S.E. of regression 0.015351 Akaike info criterion -5.501236
Sum squared resid 0.032993 Schwarz criterion -5.459604
Log likelihood 392.5877 Hannan-Quinn criter. -5.484318
F-statistic 103.5259 Durbin-Watson stat 2.044006
Prob(F-statistic) 0.000000
Unit root for Log(1+PHI) Null Hypothesis: PHI has a unit root Exogenous: Constant
Bandwidth: 6 (Newey-West automatic) using Bartlett kernel Adj. t-Stat Prob.* Phillips-Perron test statistic -11.28256 0.0000
Test critical values: 1% level -3.476805
5% level -2.881830 10% level -2.577668
*MacKinnon (1996) one-sided p-values.
Residual variance (no correction) 0.000552
HAC corrected variance (Bartlett kernel) 0.000718
Phillips-Perron Test Equation Dependent Variable: D(PHI)
Method: Least Squares Date: 03/28/17 Time: 20:14
Sample (adjusted): 2005M03 2016M12 Included observations: 142 after adjustments

The Linkage between Stock Market Returns of Singapore and Other ASEAN-5 Countries
Undergraduate Research Project Page 128 of 134 Faculty of Business and Finance
Variable Coefficient Std. Error t-Statistic Prob. PHI(-1) -0.933885 0.084286 -11.08000 0.0000
C 0.003396 0.002009 1.690260 0.0932 R-squared 0.467207 Mean dependent var -6.35E-05
Adjusted R-squared 0.463402 S.D. dependent var 0.032288
S.E. of regression 0.023652 Akaike info criterion -4.636738 Sum squared resid 0.078320 Schwarz criterion -4.595106
Log likelihood 331.2084 Hannan-Quinn criter. -4.619820 F-statistic 122.7664 Durbin-Watson stat 1.990925
Prob(F-statistic) 0.000000
Unit root for Log(1+SING)
Null Hypothesis: SING has a unit root
Exogenous: Constant
Bandwidth: 5 (Newey-West automatic) using Bartlett kernel
Adj. t-Stat Prob.*
Phillips-Perron test statistic -9.864524 0.0000
Test critical values: 1% level -3.476805
5% level -2.881830
10% level -2.577668
*MacKinnon (1996) one-sided p-values.
Residual variance (no correction) 0.000507
HAC corrected variance (Bartlett kernel) 0.000580
Phillips-Perron Test Equation
Dependent Variable: D(SING)
Method: Least Squares
Date: 03/28/17 Time: 20:15
Sample (adjusted): 2005M03 2016M12
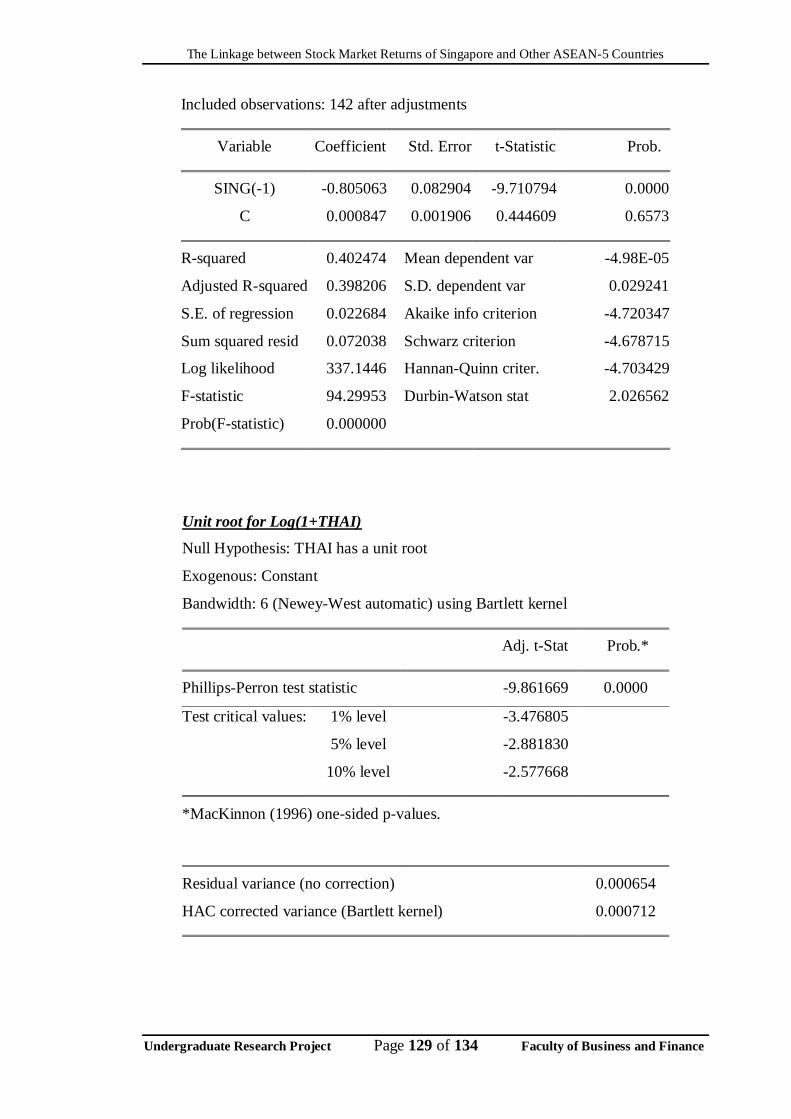
The Linkage between Stock Market Returns of Singapore and Other ASEAN-5 Countries
Undergraduate Research Project Page 129 of 134 Faculty of Business and Finance
Included observations: 142 after adjustments
Variable Coefficient Std. Error t-Statistic Prob.
SING(-1) -0.805063 0.082904 -9.710794 0.0000
C 0.000847 0.001906 0.444609 0.6573
R-squared 0.402474 Mean dependent var -4.98E-05
Adjusted R-squared 0.398206 S.D. dependent var 0.029241
S.E. of regression 0.022684 Akaike info criterion -4.720347
Sum squared resid 0.072038 Schwarz criterion -4.678715
Log likelihood 337.1446 Hannan-Quinn criter. -4.703429
F-statistic 94.29953 Durbin-Watson stat 2.026562
Prob(F-statistic) 0.000000
Unit root for Log(1+THAI)
Null Hypothesis: THAI has a unit root
Exogenous: Constant
Bandwidth: 6 (Newey-West automatic) using Bartlett kernel
Adj. t-Stat Prob.*
Phillips-Perron test statistic -9.861669 0.0000
Test critical values: 1% level -3.476805
5% level -2.881830
10% level -2.577668
*MacKinnon (1996) one-sided p-values.
Residual variance (no correction) 0.000654
HAC corrected variance (Bartlett kernel) 0.000712

The Linkage between Stock Market Returns of Singapore and Other ASEAN-5 Countries
Undergraduate Research Project Page 130 of 134 Faculty of Business and Finance
Phillips-Perron Test Equation
Dependent Variable: D(THAI)
Method: Least Squares
Date: 03/28/17 Time: 20:16
Sample (adjusted): 2005M03 2016M12
Included observations: 142 after adjustments
Variable Coefficient Std. Error t-Statistic Prob.
THAI(-1) -0.808810 0.082771 -9.771645 0.0000
C 0.001793 0.002169 0.826478 0.4099
R-squared 0.405482 Mean dependent var -0.000103
Adjusted R-squared 0.401236 S.D. dependent var 0.033273
S.E. of regression 0.025746 Akaike info criterion -4.467052
Sum squared resid 0.092803 Schwarz criterion -4.425421
Log likelihood 319.1607 Hannan-Quinn criter. -4.450135
F-statistic 95.48505 Durbin-Watson stat 1.911981
Prob(F-statistic) 0.000000
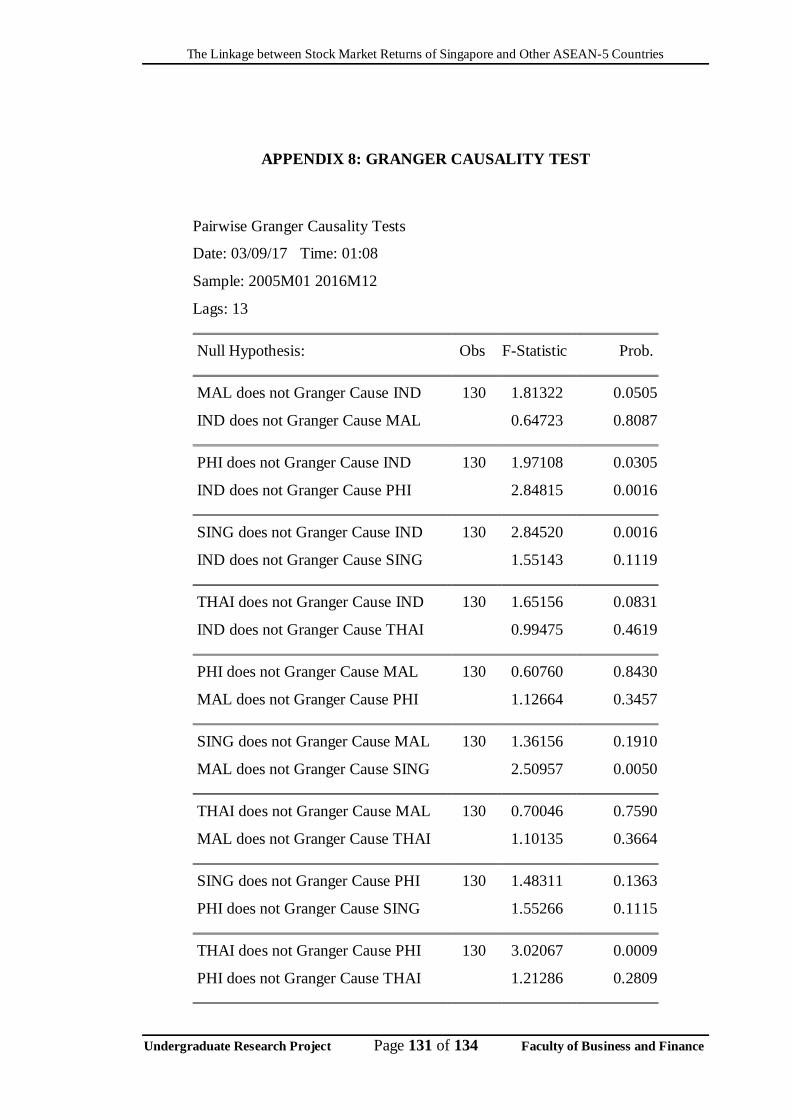
The Linkage between Stock Market Returns of Singapore and Other ASEAN-5 Countries
Undergraduate Research Project Page 131 of 134 Faculty of Business and Finance
APPENDIX 8: GRANGER CAUSALITY TEST
Pairwise Granger Causality Tests
Date: 03/09/17 Time: 01:08
Sample: 2005M01 2016M12
Lags: 13
Null Hypothesis: Obs F-Statistic Prob.
MAL does not Granger Cause IND 130 1.81322 0.0505
IND does not Granger Cause MAL 0.64723 0.8087
PHI does not Granger Cause IND 130 1.97108 0.0305
IND does not Granger Cause PHI 2.84815 0.0016
SING does not Granger Cause IND 130 2.84520 0.0016
IND does not Granger Cause SING 1.55143 0.1119
THAI does not Granger Cause IND 130 1.65156 0.0831
IND does not Granger Cause THAI 0.99475 0.4619
PHI does not Granger Cause MAL 130 0.60760 0.8430
MAL does not Granger Cause PHI 1.12664 0.3457
SING does not Granger Cause MAL 130 1.36156 0.1910
MAL does not Granger Cause SING 2.50957 0.0050
THAI does not Granger Cause MAL 130 0.70046 0.7590
MAL does not Granger Cause THAI 1.10135 0.3664
SING does not Granger Cause PHI 130 1.48311 0.1363
PHI does not Granger Cause SING 1.55266 0.1115
THAI does not Granger Cause PHI 130 3.02067 0.0009
PHI does not Granger Cause THAI 1.21286 0.2809

The Linkage between Stock Market Returns of Singapore and Other ASEAN-5 Countries
Undergraduate Research Project Page 132 of 134 Faculty of Business and Finance
THAI does not Granger Cause SING 130 1.63538 0.0872
SING does not Granger Cause THAI 1.01407 0.4437

The Linkage between Stock Market Returns of Singapore and Other ASEAN-5 Countries
Undergraduate Research Project Page 133 of 134 Faculty of Business and Finance
APPENDIX 9: JOHANSEN CO-INTEGRATION TEST
Date: 03/23/17 Time: 17:48
Sample (adjusted): 2005M04 2016M12
Included observations: 141 after adjustments
Trend assumption: Linear deterministic trend
Series: LOGSING LOGMAL LOGTHAI LOGPHI LOGIND
Lags interval (in first differences): 1 to 1
Unrestricted Cointegration Rank Test (Trace)
Hypothesized Trace 0.05
No. of CE(s) Eigenvalue Statistic Critical Value Prob.**
None * 0.456245 323.6265 69.81889 0.0001
At most 1 * 0.424779 237.7213 47.85613 0.0001
At most 2 * 0.379334 159.7481 29.79707 0.0001
At most 3 * 0.323032 92.49645 15.49471 0.0000
At most 4 * 0.233462 37.48784 3.841466 0.0000
Trace test indicates 5 cointegrating eqn(s) at the 0.05 level
* denotes rejection of the hypothesis at the 0.05 level
**MacKinnon-Haug-Michelis (1999) p-values
Unrestricted Cointegration Rank Test (Maximum Eigenvalue)
Hypothesized Max-Eigen 0.05
No. of CE(s) Eigenvalue Statistic Critical Value Prob.**
None * 0.456245 85.90520 33.87687 0.0000
At most 1 * 0.424779 77.97313 27.58434 0.0000
At most 2 * 0.379334 67.25167 21.13162 0.0000
At most 3 * 0.323032 55.00861 14.26460 0.0000
At most 4 * 0.233462 37.48784 3.841466 0.0000
The Linkage between Stock Market Returns of Singapore and Other ASEAN-5 Countries
Undergraduate Research Project Page 134 of 134 Faculty of Business and Finance
Max-eigenvalue test indicates 5 cointegrating eqn(s) at the 0.05 level
* denotes rejection of the hypothesis at the 0.05 level
**MacKinnon-Haug-Michelis (1999) p-values


