
University of Massachusetts - AmherstScholarWorks@UMass AmherstInternational Conference on Engineering andEcohydrology for Fish Passage
International Conference on Engineering andEcohydrology for Fish Passage 2012
Jun 7th, 10:30 AM - 10:50 AM
Session B7 - The Lower Susquehanna River: 3 FishLifts & 3 Fish Passage ResultsJoshua TryninewskiPennsylvania Fish and Boat Commission Bureau of Fisheries, [email protected]
Follow this and additional works at: http://scholarworks.umass.edu/fishpassage_conference
This is brought to you for free and open access by the The Fish Passage Community at UMass Amherst at ScholarWorks@UMass Amherst. It has beenaccepted for inclusion in International Conference on Engineering and Ecohydrology for Fish Passage by an authorized administrator ofScholarWorks@UMass Amherst. For more information, please contact [email protected].
Tryninewski, Joshua, "Session B7 - The Lower Susquehanna River: 3 Fish Lifts & 3 Fish Passage Results" (2012). InternationalConference on Engineering and Ecohydrology for Fish Passage. 2.http://scholarworks.umass.edu/fishpassage_conference/2012/June7/2

The Lower Susquehanna River: Three Fish Lifts – Three Fish Passage Results
Joshua D. Tryninewski & Michael L. Hendricks
Pennsylvania Fish and Boat Commission
Mission: To protect, conserve, and enhance the Commonwealth’s aquatic
resources and provide fishing and boating opportunities.
Fish Passage 2012
University of Massachusetts Amherst

Overview
Project Locations
Technical Fishways
Annual Monitoring
Passage Studies
Summary

Project Locations
Source: Normandeau Associates, Inc.
Gomez and Sullivan Engineers, P.C.
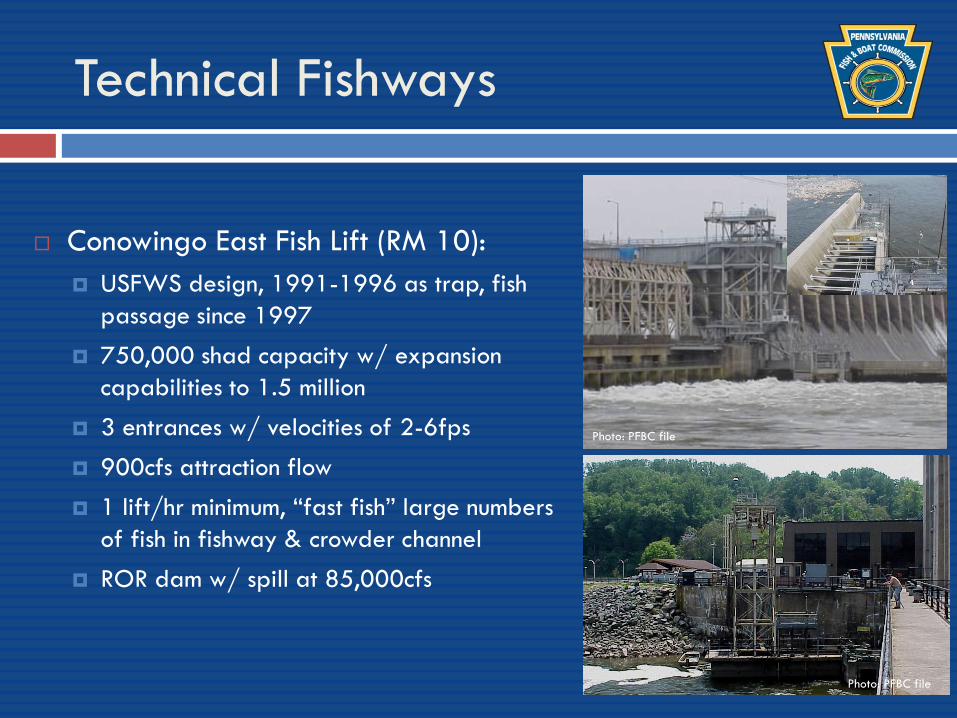
Technical Fishways
Conowingo East Fish Lift (RM 10):
USFWS design, 1991-1996 as trap, fish
passage since 1997
750,000 shad capacity w/ expansion
capabilities to 1.5 million
3 entrances w/ velocities of 2-6fps
900cfs attraction flow
1 lift/hr minimum, “fast fish” large numbers
of fish in fishway & crowder channel
ROR dam w/ spill at 85,000cfs
Photo: PFBC file
Photo: PFBC file

Technical Fishways
Holtwood Fish Lift (RM 24):
USFWS design, operational since 1997
2.7 million shad capacity
3 entrances w/ velocities of 5-6fps
800cfs attraction flow
Tailrace & spillway lifts, 10min cycle
ROR dam w/ spill at 31,500cfs
Project redevelopment – fish passage
performance measures incorporated in
amended license
Photo: PFBC file
Photo: PFBC file
Photo: TornadoAlleyHoops.com

Technical Fishways
Safe Harbor Fish Lift (RM 31):
USFWS design, operational since 1997
2.5 million shad capacity
3 entrances w/ velocities of 5-6fps
1,000cfs attraction flow
Tailrace lift, 10min cycle
ROR facility w/ spill at 110,000cfs
Photo: Microsoft Corp
Photo: PFBC file
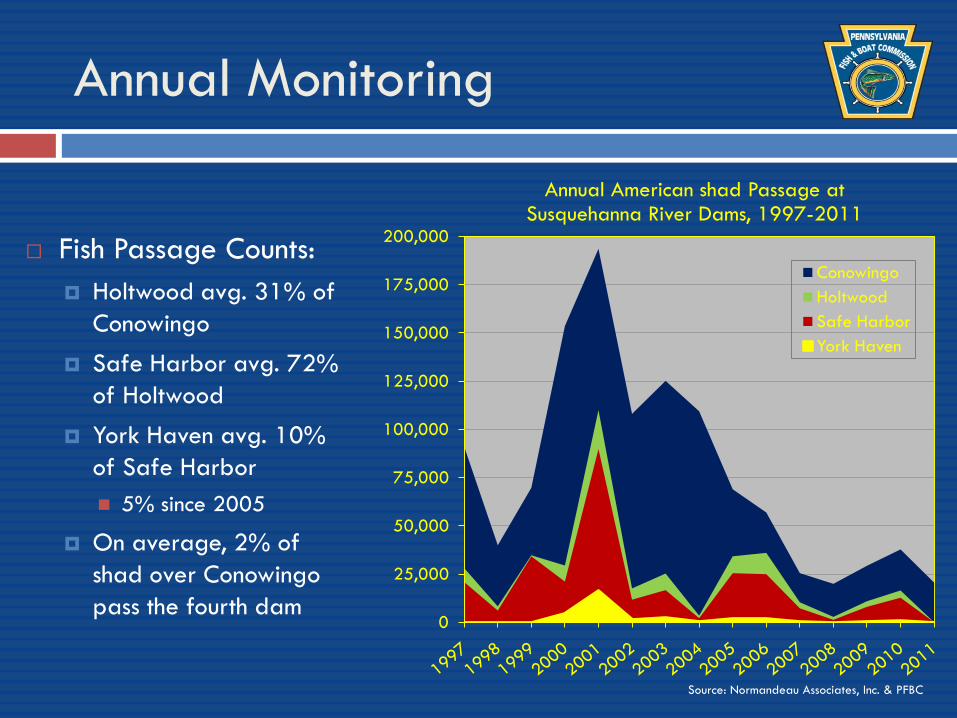
Annual Monitoring
Fish Passage Counts:
Holtwood avg. 31% of
Conowingo
Safe Harbor avg. 72%
of Holtwood
York Haven avg. 10%
of Safe Harbor
5% since 2005
On average, 2% of
shad over Conowingo
pass the fourth dam0
25,000
50,000
75,000
100,000
125,000
150,000
175,000
200,000
Annual American shad Passage at Susquehanna River Dams, 1997-2011
Conowingo
Holtwood
Safe Harbor
York Haven
Source: Normandeau Associates, Inc. & PFBC

Annual Monitoring
0%
10%
20%
30%
40%
50%
60%
70%
80%
90%
100%
4/3
4/7
4/11
4/15
4/19
4/23
4/27
5/1
5/5
5/9
5/13
5/17
5/21
5/25
5/29
6/2
6/6
6/10
6/14
Ave
rage %
Cum
ula
tive
Tota
l
Average Cumulative Total American shad Passage by Date at Lower Susquehanna River Dams, 1999-2010
Conowingo
Holtwood
Safe Harbor
York Haven
Source: PFBC
Fish Passage Counts:
Runs peak early May
Time to pass Holtwood
increases run progresses
Up to 11 days on avg.
Safe Harbor passes
shad w/in 1-3d
Up to 20d for passage
of all four dams
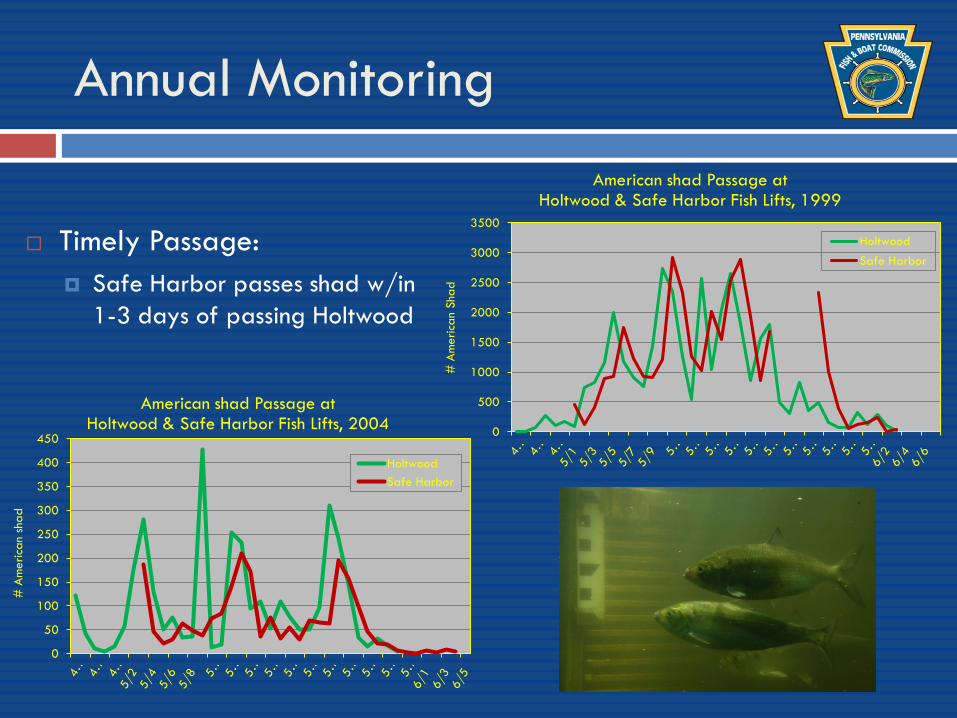
Annual Monitoring
Timely Passage:
Safe Harbor passes shad w/in
1-3 days of passing Holtwood
0
500
1000
1500
2000
2500
3000
3500
# A
meri
can
Sha
d
American shad Passage at Holtwood & Safe Harbor Fish Lifts, 1999
Holtwood
Safe Harbor
0
50
100
150
200
250
300
350
400
450
# A
meri
can
shad
American shad Passage at Holtwood & Safe Harbor Fish Lifts, 2004
Holtwood
Safe Harbor

Annual Monitoring
Apparent Efficiency:
Higher flows decrease
passage efficiency
Holtwood efficiency shows
steeper decline w/ increasing
flows than Safe Harbor
Safe Harbor more consistent
at wider range of flows
0%
20%
40%
60%
80%
100%
10,000 25,000 40,000 55,000 70,000 85,000
% P
ass
age
Mean May Flow (cfs)
Apparent passage efficiency at Holtwood & Safe Harbor Dams vs. mean May flow (cfs), 1997-2010
Holtwood
Safe Harbor
Source: PFBCPhoto: TornadoAlleyHoops.com

Passage Studies
2001 Holtwood Fish Passage Study (radio-telemetry)
Fishway attraction effectiveness 63%
Fish passage efficiency 34%
53% (46/86) shad that entered fishway passed, 47% exited w/o passing
Fish Passage
Efficiency
Passage Shad
Fishway Attraction 46 (34% of TR Shad)
Effectiveness /
Fish Lift Shad
86 (63% of TR Shad)
/ \
Found in Non-Passage Shad
Holtwood Tailrace 40 (47% of FL Shad)
136 (67% of released) - Non-Fish Lift Shad
/ 50 (37% of TR Shad)
Total Conowingo
Reservoir
204 Passed w/in 1h
\ Found upstream 1 (<1%)
Not Found in (not Holtwood) /
Holtwood Tailrace - 48 (24% of released) Passed Downstream _ Passed w/in 8h
68 (33% of released) 17 (8% of released) 4 (2%)
\ / \
Never found upstream Passed up to 18d
20 (10% of released) 12 (6%)
\
Never detected again
(Spill, Dead)
3 (1% of released)Source: Normandeau Associates, Inc.
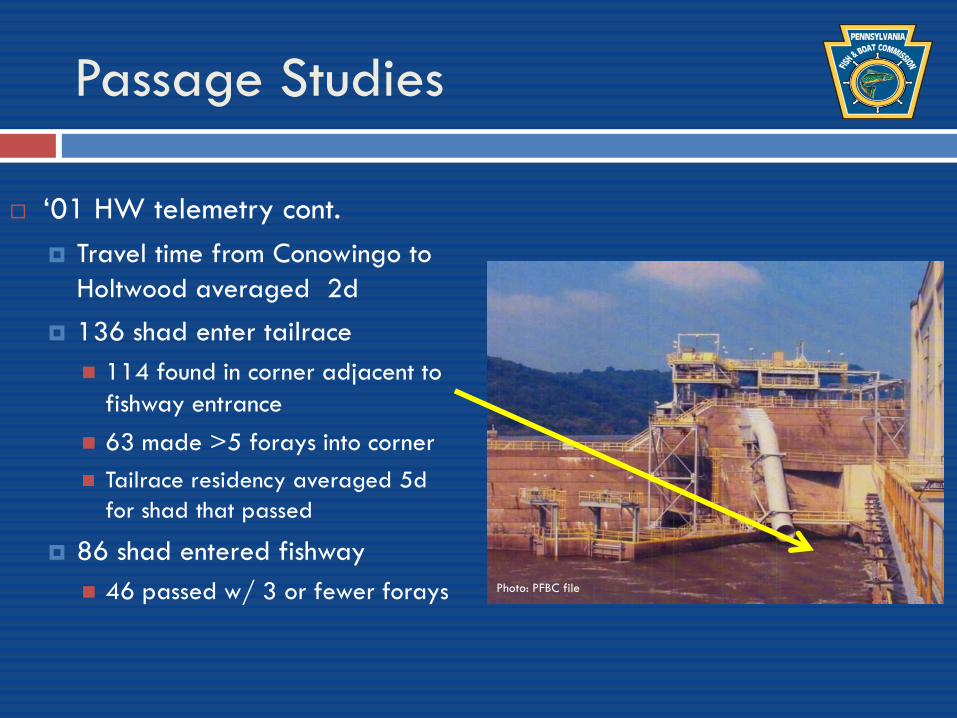
Passage Studies
„01 HW telemetry cont.
Travel time from Conowingo to
Holtwood averaged 2d
136 shad enter tailrace
114 found in corner adjacent to
fishway entrance
63 made >5 forays into corner
Tailrace residency averaged 5d
for shad that passed
86 shad entered fishway
46 passed w/ 3 or fewer forays Photo: PFBC file
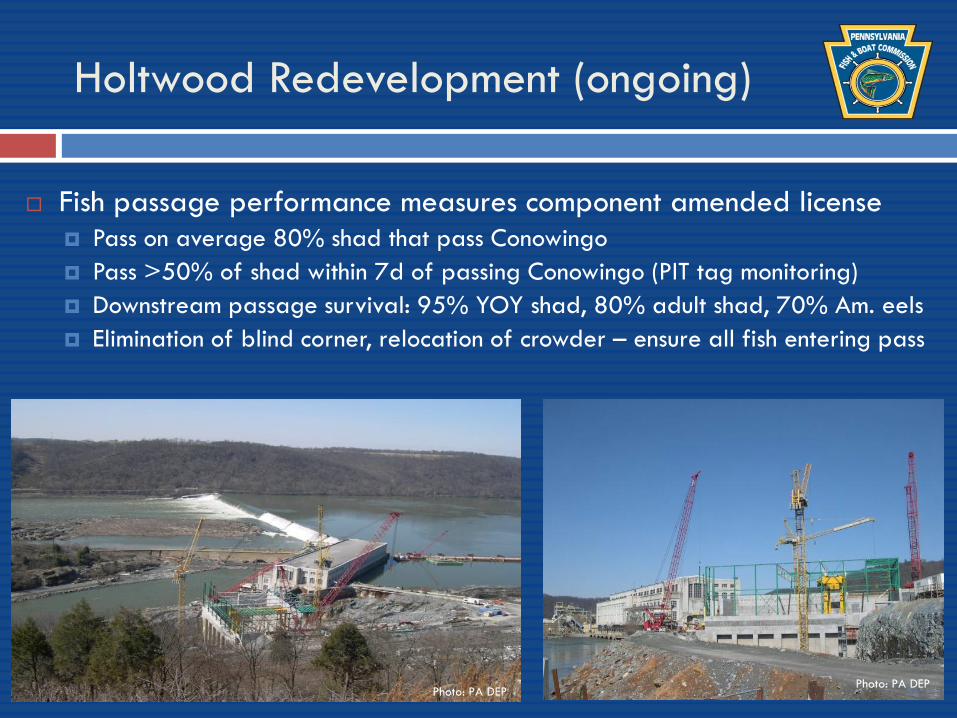
Holtwood Redevelopment (ongoing)
Fish passage performance measures component amended license Pass on average 80% shad that pass Conowingo
Pass >50% of shad within 7d of passing Conowingo (PIT tag monitoring)
Downstream passage survival: 95% YOY shad, 80% adult shad, 70% Am. eels
Elimination of blind corner, relocation of crowder – ensure all fish entering pass
Photo: PA DEPPhoto: PA DEP
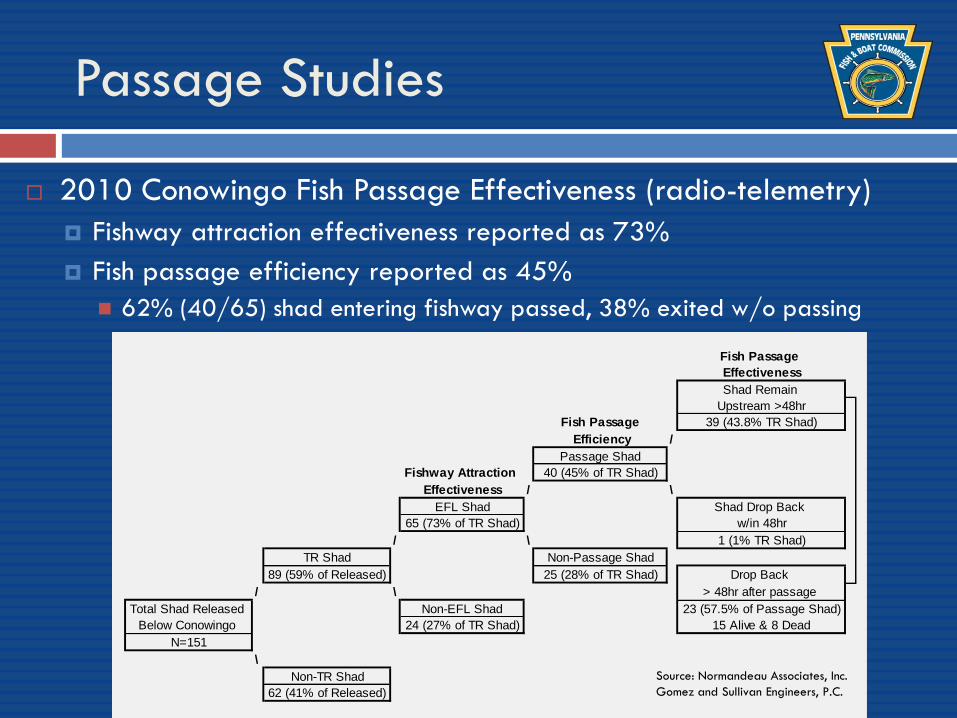
Passage Studies
2010 Conowingo Fish Passage Effectiveness (radio-telemetry)
Fishway attraction effectiveness reported as 73%
Fish passage efficiency reported as 45%
62% (40/65) shad entering fishway passed, 38% exited w/o passing
Fish Passage
Effectiveness
Shad Remain
Upstream >48hr
Fish Passage 39 (43.8% TR Shad)
Efficiency /
Passage Shad
Fishway Attraction 40 (45% of TR Shad)
Effectiveness / \
EFL Shad Shad Drop Back
65 (73% of TR Shad) w/in 48hr
/ \ 1 (1% TR Shad)
TR Shad Non-Passage Shad
89 (59% of Released) 25 (28% of TR Shad) Drop Back
/ \ > 48hr after passage
Total Shad Released Non-EFL Shad 23 (57.5% of Passage Shad)
Below Conowingo 24 (27% of TR Shad) 15 Alive & 8 Dead
N=151
\
Non-TR Shad
62 (41% of Released)
Source: Normandeau Associates, Inc.
Gomez and Sullivan Engineers, P.C.

Passage Studies
2010 Conowingo Fish Passage Effectiveness cont.
Source: Normandeau Associates, Inc. & Gomez and Sullivan Engineers, P.C.
Behavior in Tailrace:
Orient to dominant flow
Shad tend to congregate
below Francis units, avoiding
mixed-flow Kaplan units
Behavior in Fishway:
29 shad pass on 1st foray
11 shad made 19 forays
before passing
25 shad made 42 forays w/o
passing

Summary
Passage Efficiencies:
Conowingo = 45% (telemetry)
Holtwood = 34% (telemetry), 31% (fishway counts)
Safe Harbor = 71% (fishway counts)
Passage Issues:
Not enough shad locating fishway entrances - (competing flows, generation scheme, confusion)
Shad must enter fishway & pass w/o delay or turning back
Fish passage efficiency remains the number one issue preventing shad restoration on the Susquehanna River
Photo: Microsoft Corp
Photo: Microsoft Corp

Acknowledgments
Exelon Generation Company, LLC
PPL Holtwood, LLC
Safe Harbor Water Power Corporation
Normandeau Associates, Inc.
Gomez and Sullivan Engineers, PC


