

THE LYON EXPERIENCE WITH URBANSIM
(version 4.1.0)
speaker: Mark Kryvobokov
contributors: Fabrice Marchal
Jean-Pierre Nicolas
Philippe Zuccarello
European URBANSIM User Group meeting
at Swiss Federal Institute of Technology, Zurich
17-18 March 2008
European UrbanSim User Group, IVT, Zürich, 17-18 March 2008
LET

Contents
0. Two projects with UrbanSim at LET
1. Our way from Eugene to Lyon
2. Tables and relations
3. Estimation and simulation
4. Preliminary results
5. Some obstacles with the software
6. Questions
European UrbanSim User Group, IVT, Zürich, 17-18 March 2008
LET

SMA-LOCMOB (resp. Fabrice Marchal)
– Systems of Multi-Agents for LOCation and MOBility
– Investigatation of some issues in TLUMs:
• spatial and temporal resolution
• modeling features
SIMBAD (resp. Jean-Pierre Nicolas)
– A more macroeconomic model of the Lyon Urban Area
– Purpose: assessing the sustainability of transport policies by crossing environmental, economic and social indicators
0. Two projects with UrbanSim at LET
European UrbanSim User Group, IVT, Zürich, 17-18 March 2008
LET

1. Our way from Eugene to Lyon
The Lyon Urban Area:
1,576,000 inhabitants
more than 660,000 households
about 700,000 jobs
European UrbanSim User Group, IVT, Zürich, 17-18 March 2008
LET
1. Our way from Eugene to Lyon
European UrbanSim User Group, IVT, Zürich, 17-18 March 2008
LET
HLCM
ELCM
DPLCM
LPM
RLSM
Transportation model
Car ownership model
+
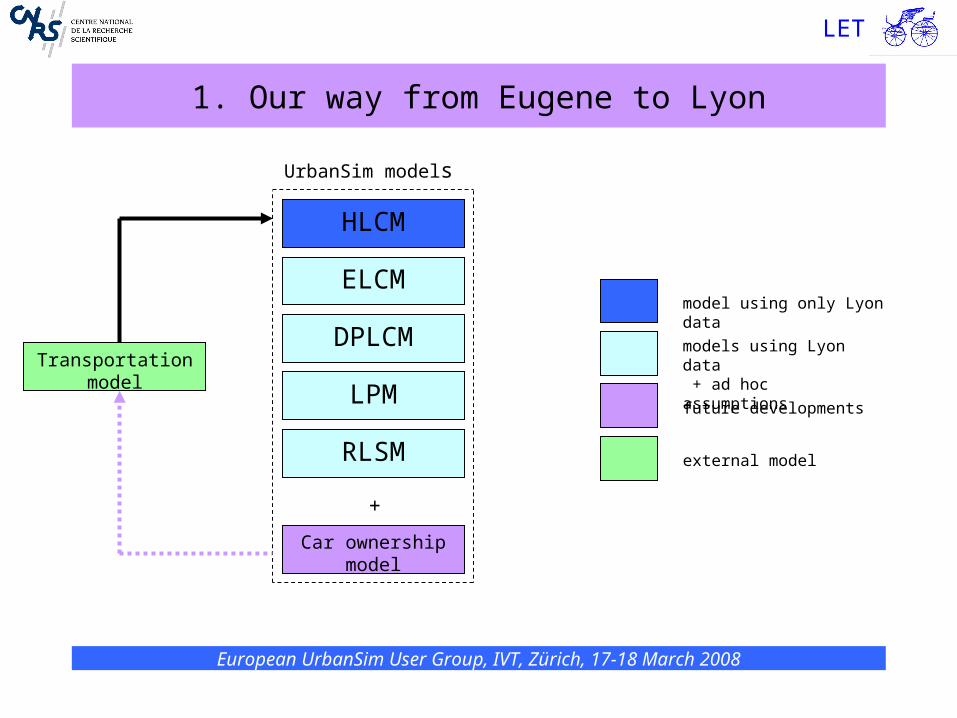
UrbanSim models
model using only Lyon data
external model
future developments
models using Lyon data + ad hoc assumptions

1. Our way from Eugene to Lyon
• 777 zones covering the Lyon Urban Area
• geographic data: polygons, centroïds
• origin-destination matrix of accessibilities
• number of residential units
• environmental data: percent water, open space, residential land, distance to highway and arterial etc.
• average apartment price per square meter
• number of jobs for 4 sectors in each zone
• household characteristics: zone, number of persons, workers, cars, income, age of head, ownership status, job status of head
zones and gridcells
tables
jobs table
households table
Overview of available data
European UrbanSim User Group, IVT, Zürich, 17-18 March 2008
LET

1. Our way from Eugene to Lyon
Spatial resolution
of the Lyon prototype:
each zone includes only one gridcell:
777 zones = 777 gridcells
(but zone_id and grid_id are different)
zones roughly correspond to municipalities
European UrbanSim User Group, IVT, Zürich, 17-18 March 2008
LET

1. Our way from Eugene to Lyon
Example: data sources for the gridcells table in the Lyon prototype
Lyon data Assumptions Eugene datagrid_idzone_idresidential_unitsdistance_to_highwaydistance_to_arterialrelative_xrelative_ypercent_waterpercent_open_spacefraction_residential_land
Additional data:percent_industrial_spaceaverage_apartment_price
residential_improvement_valueindustrial_sqftindustrial_improvement_valuecommercial_sqftcommercial_improvement_valuegovernmental_sqftgovernmental_improvement_valueresidential_land_valuenonresidential_land_valueis_outside_urban_growth_boundarydevelopment_type_idplan_type_id
city_idcounty_idpercent_wetlandpercent_roadspercent_public_spacepercent_slopepercent_stream_bufferpercent_floodplainyear_builtgovernmental_sqft_per_jobcommercial_sqft_per_jobindustrial_sqft_per_job
European UrbanSim User Group, IVT, Zürich, 17-18 March 2008
LET

1. Our way from Eugene to Lyon
Examples of assumptions:
relative_X = (X - minX)/100 + 1
relative_Y = (Y - minY)/100 + 1
residential_improvement_value =
= average_apartment_price • 80 • residential_units
residential_land_value = residential_improvement_value • 0.2
European UrbanSim User Group, IVT, Zürich, 17-18 March 2008
LET
1. Our way from Eugene to Lyon
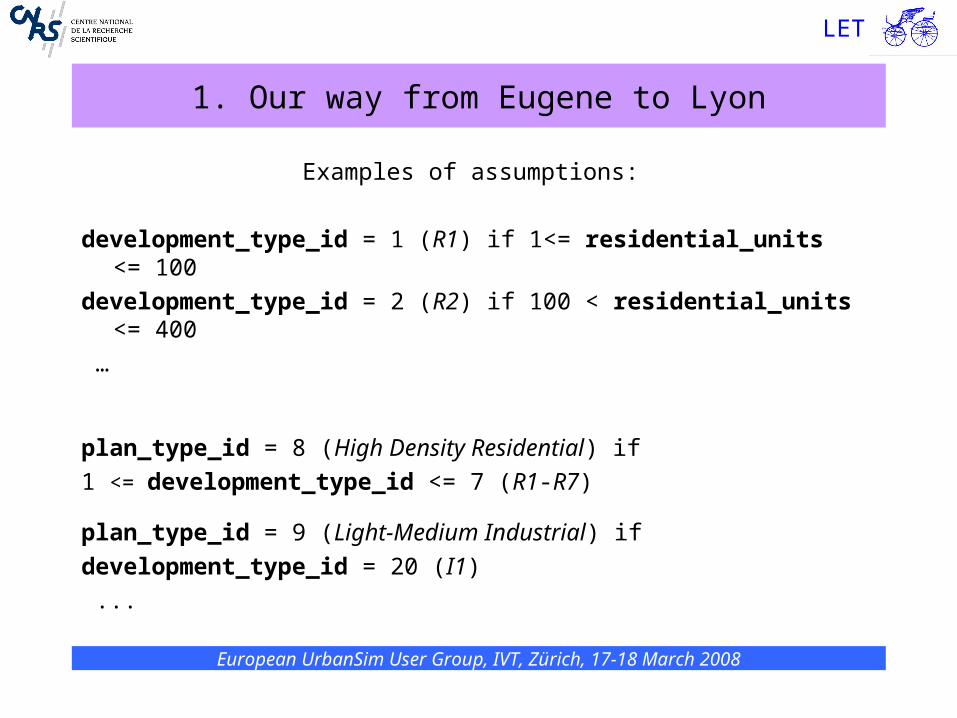
Examples of assumptions:
development_type_id = 1 (R1) if 1<= residential_units <= 100
development_type_id = 2 (R2) if 100 < residential_units <= 400
…
plan_type_id = 8 (High Density Residential) if
1 <= development_type_id <= 7 (R1-R7)
plan_type_id = 9 (Light-Medium Industrial) if
development_type_id = 20 (I1)
...
European UrbanSim User Group, IVT, Zürich, 17-18 March 2008
LET
1. Our way from Eugene to Lyon
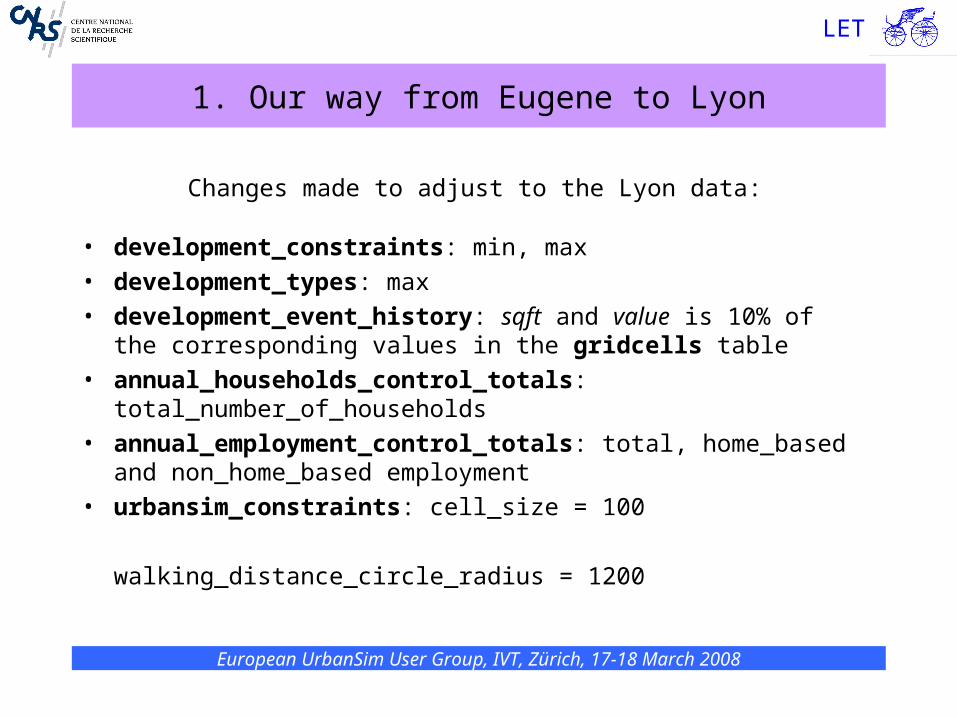
Changes made to adjust to the Lyon data:
• development_constraints: min, max
• development_types: max
• development_event_history: sqft and value is 10% of the corresponding values in the gridcells table
• annual_households_control_totals: total_number_of_households
• annual_employment_control_totals: total, home_based and non_home_based employment
• urbansim_constraints: cell_size = 100
walking_distance_circle_radius = 1200
European UrbanSim User Group, IVT, Zürich, 17-18 March 2008
LET

1. Our way from Eugene to Lyon
European UrbanSim User Group, IVT, Zürich, 17-18 March 2008
LET
HLCM
ELCM
DPLCM
LPM
RLSM
Transportation model
Car ownership model
+
UrbanSim models
model using only Lyon data
external model
future developments
models using Lyon data + ad hoc assumptions

2. Tables and relations
European UrbanSim User Group, IVT, Zürich, 17-18 March 2008
LET

3. Estimation and simulation
Estimation with logit models:
European UrbanSim User Group, IVT, Zürich, 17-18 March 2008
LET
HLCM
ELCM
DPLCM
LPM
RLSM
Transportation model
Car ownership model
+
UrbanSim models

3. Estimation and simulation
Estimation with logit models:
Model Number of variablesAdjusted likelihood
ratio indexHLCM 6 0.392ELCM-industrialsubmodel 1 (industrial empl.)submodel 5 (construction empl.)submodel 11 (service empl.)submodel 16 (agricultural empl.)
2222
0.0230.0230.0300.018
ELCM-commercialsubmodel 1 (industrial empl.)submodel 5 (construction empl.)submodel 11 (service empl.)submodel 16 (agricultural empl.)
3432
0.0140.0030.0050.002
ELCM-home_based 6 0.047DPLCM-industrial 2 - 13.600DPLCM-commercial 5 0.226DPLCM-residential 3 0.008
European UrbanSim User Group, IVT, Zürich, 17-18 March 2008
LET

3. Estimation and simulation
European UrbanSim User Group, IVT, Zürich, 17-18 March 2008
LET
HLCM
ELCM
DPLCM
LPM
RLSM
Transportation model
Car ownership model
+
UrbanSim models
Estimation with regression models:
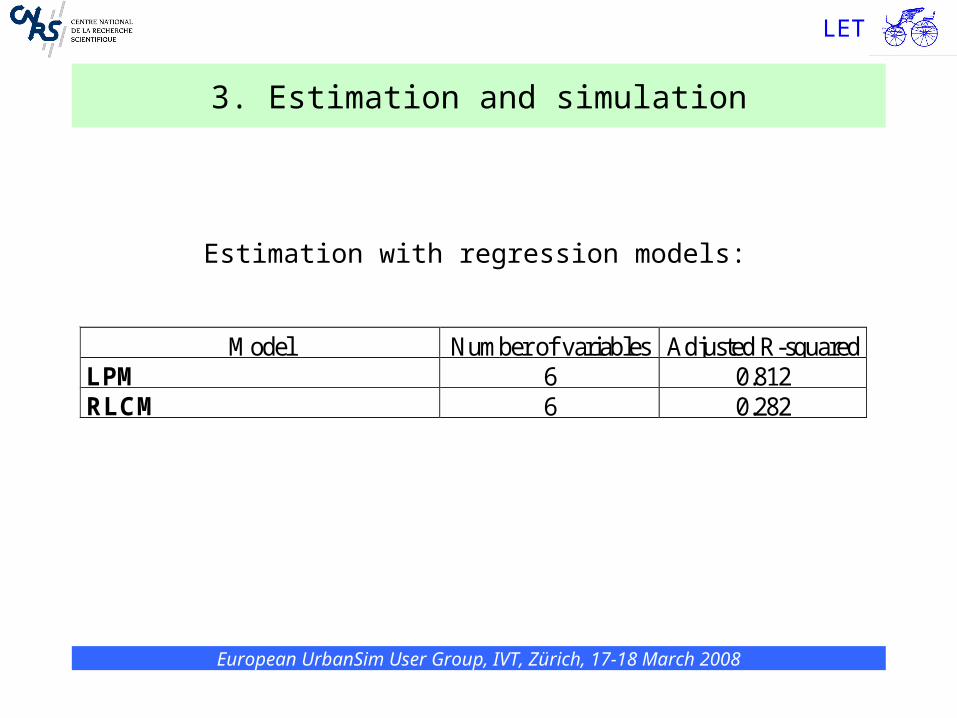
3. Estimation and simulation
Estimation with regression models:
Model Number of variables Adjusted R-squaredLPM 6 0.812RLCM 6 0.282
European UrbanSim User Group, IVT, Zürich, 17-18 March 2008
LET

3. Estimation and simulation
Simulation:
Technical performance:
Baseyear cache: 71 MB
Simulation for 14 years (1981-1994) takes 1 hour 20 min.
Output cache: 931 MB
Limitations:
In DPLCM, there is only residential and industrial development.
In the households table, after the first year simulation some households are located in a gridcell with grid_id=0...
European UrbanSim User Group, IVT, Zürich, 17-18 March 2008
LET

4. Preliminary results
Output from make_indicators.py
(fragment of population)
European UrbanSim User Group, IVT, Zürich, 17-18 March 2008
LET

4. Preliminary results
European UrbanSim User Group, IVT, Zürich, 17-18 March 2008
LET

4. Preliminary results
Map_Pop
POP91_90
-153 - -51
-50 - -1
0 - 50
51 - 100
101 - 336
Population change 1990-1991
Map_Pop
POP81_80
-3566 - -1001
-1000 - -51
-50 - -1
0 - 50
51 - 100
101 - 1119
Population change 1980-1981
Map_Pop
POP94_93
-135 - -51
-50 - -1
0 - 50
51 - 100
101 - 198
Population change 1993-1994
European UrbanSim User Group, IVT, Zürich, 17-18 March 2008
LET

4. Preliminary results
European UrbanSim User Group, IVT, Zürich, 17-18 March 2008
LET
Map_Jobs
Job91_90
-4 - 0
1 - 20
21 - 50
51 - 100
101 - 223
Commercial employment change 1990-1991
Map_Jobs
Job94_93
-7 - 0
1 - 20
21 - 50
51 - 100
101 - 255
Commercial employment change 1993-1994
Map_Jobs
Job81_80
-993 - -201
-200 - -11
-10 - 0
1 - 20
21 - 46
Commercial employment change 1980-1981
5. Some obstacles with the software
• Not everything is described and updated in the documentation. Comments for each attribute are absent in the MySQL tables (suggestion: distribute Eugene also as a MySQL dump?)
Thank you so much for the MAILING LIST!
• Our attempt to work with 9-digit zone_id values failed
• The map representation of indicators is mirrored vertically (as if the ordinate is multiplied by -1)
European UrbanSim User Group, IVT, Zürich, 17-18 March 2008
LET

5. Some obstacles with the software
• Handling of gridcells and polygons
• Ambiguity in the Eugene package:– the identifiers group_id for employment and group_id for development are
unrelated
European UrbanSim User Group, IVT, Zürich, 17-18 March 2008
LET

5. Some obstacles with the software
• Ambiguity in the Eugene package:– the same identifier has 3 different
names in 3 tables:
id in job_building_types;
building_type in jobs;
building_type_id in building_types
European UrbanSim User Group, IVT, Zürich, 17-18 March 2008
LET

6. Questions
1. Can we have long values and big differences between values of zone_id (and grid_id)?
2. How improvement value and land value were calculated for each gridcell for Eugene?
3. Should the development_type_id in the jobs table correspond to the development_type_id from the gridcells table?
4. Where the table households_characteristics_for_ht is used?
European UrbanSim User Group, IVT, Zürich, 17-18 March 2008
LET
6. Questions
5. If we do not have data about buildings, should we set corresponding values for employment sector_id and building_types :
- if sector_id is services then
building_types are commercial and governmental;
- if sector_id is construction then
building_type is industrial
etc.?
European UrbanSim User Group, IVT, Zürich, 17-18 March 2008
LET

6. Questions
6. What is number_of_developer_model_history_years and developer_model_estimation_threshold_count in the table urbansim_constants?
7. In RLSM, the number of observations for estimation is less than the number of gridcells with fraction_residential_land>0, but we do not see any threshold in residential_land_share_model_configuration_creator.py
8. How to create indicators for population change and employment change?
9. How to create our own REPM for gridcells using the San Francisco model?
European UrbanSim User Group, IVT, Zürich, 17-18 March 2008
LET


