

Nova Southeastern UniversityNSUWorks
College of Psychology Theses and Dissertations College of Psychology
1-1-2014
The Neuropsychological Application of the WAIS-IV over the WAIS-IIIJessica RobbinsNova Southeastern University, [email protected]
This document is a product of extensive research conducted at the Nova Southeastern University College ofPsychology. For more information on research and degree programs at the NSU College of Psychology, pleaseclick here.
Follow this and additional works at: https://nsuworks.nova.edu/cps_stuetd
Part of the Psychology Commons
Share Feedback About This Item
This Dissertation is brought to you by the College of Psychology at NSUWorks. It has been accepted for inclusion in College of Psychology Theses andDissertations by an authorized administrator of NSUWorks. For more information, please contact [email protected].
NSUWorks CitationRobbins, J. (2014). The Neuropsychological Application of the WAIS-IV over the WAIS-III. .Available at: https://nsuworks.nova.edu/cps_stuetd/91

The Neuropsychological Application of the WAIS-IV over the WAIS-III
By
Jessica H. Robbins, M.S.
A Dissertation Presented to the Center for Psychological Studies
of Nova Southeastern University
in Partial Fulfillment of the Requirements
for the Degree of Doctor of Philosophy
NOVA SOUTHEASTERN UNIVERSITY
October 2014

ii
This dissertation was submitted by Jessica H. Robbins under the direction of the
Chairperson of the dissertation committee listed below. It was submitted to the Center for
Psychological Studies and approved in partial fulfillment of the requirements for the
degree of Doctor of Philosophy in Clinical Psychology at Nova Southeastern University.
Approved: ____________________ ____________________________________ Date of Defense Charles Golden, Ph.D. Chairperson ____________________________________ Ed Simco, Ph.D. Committee Member
____________________________________ Barry Schneider, Ph.D. Committee Member ____________________ ____________________________________ Date of Final Approval Charles Golden, Ph.D. Chairperson

iii
ACKNOWLEDGEMENTS
First, I would like to thank my dissertation committee members, Charles Golden,
Ph.D., Ed Simco, Ph.D., and Barry Schneider, Ph.D. for contributing your time and
energy to the completion of this research. I would like to thank my family, whose love
and support were a tremendous help through this process. Last but certainly not least, I
want to thank my husband, Ben. Your love, support, patience, and humor were invaluable
through this process. I could not have done this without you.

iv
TABLE OF CONTENTS
LIST OF TABLES..............................................................................................................vi
ABSTRACT .................................................................................................................... viii
CHAPTER I: STATEMENT OF THE PROBLEM............................................................1
CHAPTER II: REVIEW OF THE LITERATURE .............................................................3 Wechsler Adult Intelligence Scales .................................................................................3 Wechsler Adult Intelligence Scales and Neuropsychological Measures .........................8 Purpose...........................................................................................................................14 Hypothesis I ...................................................................................................................15 Hypothesis II ..................................................................................................................15 Hypothesis III.................................................................................................................16 Hypothesis IV ................................................................................................................17 Hypothesis V..................................................................................................................17 Hypothesis VI ................................................................................................................18
CHAPTER III: METHOD.................................................................................................20 Participants.....................................................................................................................20 Procedures......................................................................................................................20 Institutional Review Board ............................................................................................21 Measures ........................................................................................................................21 Analyses .........................................................................................................................26 Preliminary Analyses ................................................................................................26 Regression Analyses .................................................................................................26
Chapter IV: RESULTS......................................................................................................28 Preliminary Analyses .....................................................................................................28 Hypothesis I ...................................................................................................................33 Hypothesis II ..................................................................................................................35 Hypothesis III.................................................................................................................35 Hypothesis IV ................................................................................................................40 Hypothesis V..................................................................................................................43 Hypothesis VI ................................................................................................................46

v
Post-hoc Analyses ..........................................................................................................50
Chapter V: DISCUSSION.................................................................................................52 Hypothesis I ...................................................................................................................52 Hypothesis II ..................................................................................................................62 Hypothesis III.................................................................................................................62 Hypothesis IV ................................................................................................................75 Hypothesis V..................................................................................................................81 Hypothesis VI ................................................................................................................91 Conclusions..................................................................................................................100 Visual Puzzles and Neuropsychological Measures......................................................105 Limitations ...................................................................................................................106 Implications for Future Research.................................................................................109 Summary ......................................................................................................................112
REFERENCES ................................................................................................................115

vi
LIST OF TABLES
Table 1: Descriptive Statistics for Neuropsychological Measures in the Sample .............30
Table 2: Pearson Correlations between WAIS-III and WAIS-IV .....................................31
Table 3: Pearson Correlations between Neuropsychological Measures and WAIS-III ....32
Table 4: Pearson Correlations between Neuropsychological Measures and WAIS-IV ....34
Table 5: Summary of Multiple Regressions for Category Error Performance..................36
Table 6: Confidence Intervals for Unstandardized Regression Coefficients for Category
Errors .................................................................................................................................37
Table 7: Comparison of the Squared Multiple Correlation Coefficients...........................38
Table 8: Summary of Multiple Regressions for FTT Dominant Performance..................39
Table 9: Confidence Intervals for Unstandardized Regression Coefficients for FTT
Dominant ...........................................................................................................................40
Table 10: Summary of Multiple Regressions for FTT Non-Dominant Performance........41
Table 11: Confidence Intervals for Unstandardized Regression Coefficients for FTT Non-
Dominant ...........................................................................................................................42
Table 12: Summary of Multiple Regressions for Trails A Performance...........................44
Table 13: Confidence Intervals for Unstandardized Regression Coefficients for Trails A
Total Time .........................................................................................................................45
Table 14: Summary of Multiple Regressions for Trails B Performance...........................46
Table 15: Confidence Intervals for Unstandardized Regression Coefficients for Trails B
Total Time .........................................................................................................................47
Table 16: Summary of Multiple Regressions for WCST Performance.............................48
Table 17: Confidence Intervals for Unstandardized Regression Coefficients for WCST.49

vii
Table 18: Pearson Correlations between WAIS-III Subtests ............................................50
Table 19: Pearson Correlations between WAIS-IV Subtests ............................................51

viii
ABSTRACT
The Neuropsychological Application of the WAIS-IV over the WAIS-III
By
Jessica H. Robbins, M.S.
Nova Southeastern University
The current study examined the WAIS-IV and how the changes to the test may
impact the measure’s usefulness in neuropsychological evaluations. It was hypothesized
that the WAIS-IV would be a significantly better predictor of performance on the
neuropsychological measures of the Category Test, Finger Tapping Test, Trail Making
Test, and Wisconsin Card Sorting Test over the WAIS-III. The mixed clinical sample
came from an archival database of volunteer research participants and individuals
clinically referred to a university outpatient facility. A total of 91 participants were
administered the WAIS-III and WAIS-IV as part of a larger neuropsychological battery.
The results of the current study found that both the WAIS-III and the WAIS-IV
were able to account for a significant amount of the variance in performance on the
neuropsychological measures, with the exception of the FTT dominant and non-dominant
hands, where only the WAIS-IV was able to significantly account for the variance in
performance on the measures. Using the Alf and Graf (1999) model, there were no
significant R2 differences between the WAIS-III subtests and WAIS-IV at the .01
significance level. Thus, the WAIS-IV did not provide a better model for predicting
performance on any of the neuropsychological measures. It should be noted that the small
sample size of the current study may have inflated the R2, particularly in the WAIS-III
models, which could have masked greater R2 differences between the two models.

ix
While the publishers endeavored to make the WAIS-IV a better measure of
processing speed, working memory, and fluid reasoning, these goals were largely unmet.
The analyses of the WAIS-IV working memory subtests, showed that the sequencing
component added to the Digit Span subtest did not add to the relationship with
neuropsychological measures with working memory components. The analyses of the
WAIS-IV processing speed subtests showed that the Coding subtest of the WAIS-IV was
a better measure of processing speed than the WAIS-III version, but this was not found
for the PSI as a whole. Changes to Symbol Search did not show any improvement in the
relationship to neuropsychological measures.
One interesting finding was that the new subtest of Visual Puzzles does appear to
add to the relationship with neuropsychological measures over the other subtests of the
WAIS-IV. Visual Puzzles was consistently the highest correlated PRI subtest with the
neuropsychological measures, with the exception of the WCST. The subtest appears to
assess a wide range of abilities outside of the spatial reasoning skills purported by the test
publishers. Specifically, the subtest was correlated with measures of processing speed,
executive skills, and motor speed/reaction time. Thus, clinicians should use caution and
examine all possible options when evaluating poor performance on this new subtest.
Since none of the WAIS-IV models were able to significantly predict
performance on any of the neuropsychological measures over the WAIS-III models, it
would appear that the WAIS-IV as a whole is not a better neuropsychological measure
than its predecessor. Despite being the gold standard for intellectual assessment, the
WAIS-IV appears to add little to clinical utility over the WAIS-III outside of shorter
administrative time. Clinicians are advised to continue using neuropsychological

x
measures to assess processing speed, working memory, and higher order cognitive skills
in conjunction with the WAIS.

1
CHAPTER I
Statement of the Problem
The Wechsler Adult Intelligence Scale-Fourth Edition (WAIS-IV) is the most
recent version of the Wechsler Adult Intelligence Scale. The history of the scale dates
back to 1955 when David Wechsler published the first version of the WAIS as a revision
to the Wechsler-Bellevue Intelligence Scale, which was published in 1939 (Sattler, 2008).
The second version of the WAIS, the Wechsler Adult Intelligence Scale-Revised (WAIS-
R), was published in 1981. Instead of aligning with theories of cognitive ability, these
early versions of the test stayed consistent with previous versions; recent revisions to the
WAIS have seen an increased effort to be aligned with current research and theoretical
advances (Benson, Hulac, & Kranzler, 2010). Research conducted comparing the
relationship of the WAIS-R with neuropsychological measures has indicated that the
abilities assessed by the WAIS-R were consistent with those measured by
neuropsychological tests (Johnstone, Holland, & Hewett, 1997; Golden, Kushner, Lee, &
McMorrow, 1998).
The Wechsler Adult Intelligence Scale-Third Edition (WAIS-III) was published
in 1997 and included a Verbal IQ (VIQ), Performance IQ (PIQ), and Full Scale IQ
(FSIQ). New subtests were added to the WAIS-III (Devaraju-Backhaus, Espe-Pfeifer,
Mahrou, & Golden, 2001), and four secondary indices could be obtained on the WAIS-III
(Sattler, 2008). Much research has been conducted examining and supporting the
relationship between neuropsychological measures and the WAIS-III (Titus, Retzlaff, &
Dean, 2002; Sherman, Strauss, Spellacy, & Hunter, 1995; Sanchez-Cubillo et al., 2009).
The newest version of the test, the WAIS-IV, was published in 2008. With the

2
fourth edition of the test, the designers attempted to make the test more consistent with
current research and theories (Benson et al., 2010). Specifically, the latest version departs
from the three traditional scores of VIQ, PIQ, and FSIQ. While the FSIQ is still derived
from the scores on each subtest, instead of a VIQ and PIQ, the four index scores obtained
as secondary scores on the WAIS-III are the primary scores obtained with the WAIS-IV
(Gregoire, Coalson, & Zhu, 2011). The four index scores of the WAIS-IV are considered
more consistent with current theories regarding the multi-factor model of intelligence.
Changes in subtests were made to the new version of the WAIS and subtests were added.
The revisions to and additions of subtests were designed to make the WAIS-IV a better
measure of fluid reasoning, processing speed, and working memory (Lichtenberger &
Kaufman, 2013). With the changes to the WAIS-IV, it is yet to be seen if these
modifications have increased the clinical utility for neuropsychological evaluations. The
current study was designed to examine the WAIS-IV and how the changes to the new
version may impact the test’s usefulness in neuropsychological evaluations.

3
CHAPTER II
Review of the Literature
In order to understand the relevance of the proposed investigation, it is necessary
to present an examination of the Wechsler Adult Intelligence Scales and the relationship
between the Wechsler Adult Intelligence Scales and neuropsychological measures.
Wechsler Adult Intelligence Scales
The WAIS has evolved into one of the most commonly used intelligence scales
(Johnstone et al., 1997). The original version of the WAIS was published in 1955 by
David Wechsler as a revision to the Wechsler-Bellevue Intelligence Scale published in
1939 (Sattler, 2008). The second version of the WAIS, the WAIS-R, was published in
1981 and included verbal subtests of Information, Comprehension, Arithmetic, Digit
Span, Similarities, and Vocabulary. Picture Arrangement, Picture Completion, Block
Design, Object Assembly, and Digit Symbol made up the performance subtests
(Johnstone et al., 1997). The WAIS-R yielded a Verbal IQ, Performance IQ, and Full
Scale IQ (Zarantonello, 1988). Additionally, Berger (1998) stated that the WAIS-R can
be conceptualized as a three-factor test with each factor providing information about
cognitive functioning. The three-factor conceptualization of the WAIS-R included the
Verbal Comprehension, Perceptual Organizational, and the Freedom from Distractibility
factors. The Verbal Comprehension factor consisted of the subtests of Vocabulary,
Information, Comprehension, and Similarities. The Perceptual Organizational factor
consisted of the subtests of Block Design, Object Assembly, Picture Completion, and
Picture Arrangement. The Freedom From Distractibility factor consisted of the subtests
of Arithmetic and Digit Span (Berger, 1998). While early versions of the test were more
4
consistent with previous editions of the test as opposed to aligning with theories of
cognitive ability, recent revisions to the WAIS have been more consistent with current
research and theoretical advances (Benson et al., 2010).
The third version of the test, the WAIS-III, was published in 1997 and included a
Verbal IQ (VIQ), Performance IQ (PIQ), and Full Scale IQ (FSIQ). Letter-Number
Sequencing, Matrix Reasoning, and Digit Symbol Coding were new subtests added to the
WAIS-III (Devaraju-Backhaus et al., 2001). Four secondary indices could be obtained on
the WAIS-III. The Verbal Comprehension Index (VCI) consisted of Vocabulary,
Similarities, Information, and Comprehension. The Perceptual Organization Index (POI)
was comprised of Picture Completion, Block Design, and Matrix Reasoning. Digit
Symbol-Coding and Symbol Search made up the Processing Speed Index (PSI). The
Working Memory Index consisted of Arithmetic, Digit Span, and Letter-Number
Sequencing (Sattler, 2008).
The Wechsler Adult Intelligence Scale-Fourth Edition (WAIS-IV) is the most
recent version of the WAIS and was published in 2008. With the new version of the test,
the publishers aimed to make the test a better measure of fluid reasoning, processing
speed, and working memory, while making the test more consistent with current theories
of intelligence. The publishers sought to decrease the speeded demands of the subtests as
well as the motor demands (Coalson, Raiford, Saklofske, & Weiss, 2010).
Canivez and Watkins (2010a) and Canivez and Watkins (2010b) conducted factor
analyses of the WAIS-IV with an adolescent and adult sample and found the test to be a
strong measurement of general intelligence for adolescents and adults. Gottfredson and
Saklofske (2009) discussed the psychological utility and application of intelligence tests
5
and stated that the WAIS-IV further expanded on theoretical foundations and clinical
utility over the WAIS-III. Further, Gottfredson and Saklofske (2009) explained that the
newer WAIS-IV and the standardization studies used in its development provided a
stronger empirical foundation for the clinical utility of the test. According to Hartman
(2009), the WAIS-IV was designed to be an improvement from the WAIS-III in terms of
developmental appropriateness (i.e., more useable for individuals with nonintellectual
limitations), user friendliness, and clinical utility. The changes included clearer
instructions, decreased time bonuses, and fewer motor demands (Hartman, 2009).
Benson et al. (2010) examined the WAIS-IV and what the test measures. The
researchers found that some Cattell-Horn-Carroll (CHC) abilities were measured more
thoroughly by the WAIS-IV. The results indicate that the CHC structures can be used to
describe abilities measured by the WAIS-IV and included crystallized intelligence, fluid
reasoning, visual processing, short-term memory, and processing speed. Specifically, the
results indicated that Similarities, Vocabulary, Information, and Comprehension assess
crystallized abilities. The PRI was shown to measure fluid reasoning and visual
processing. Block Design, Visual Puzzles, and Picture Completion assessed visual
processing. Matrix Reasoning, Figure Weights, and Arithmetic assessed fluid reasoning.
Arithmetic, Digit Span, and Letter-Number Sequencing were shown to measure short-
term memory. Symbol Search, Coding, and Cancellation were shown to examine
processing speed. Figure Weights and Arithmetic were shown to evaluate Quantitative
Reasoning.
Taub and Benson (2013) examined the goals of the publishers of the WAIS-IV to
see if the test was a better measure than the WAIS-III. Specifically, the authors examined

6
the fit of the standardization data from the WAIS-III and WAIS-IV to assess which test
fit the publisher’s measurement and scoring model best as well as which measure best fit
the Cattell-Horn-Carroll model. The authors addressed how the scores achieved on the
WAIS-III compared to the scores achieved on the WAIS-IV and if the scores assess the
same abilities across measures. Finally, the authors sought to see if the publishers of the
WAIS-IV achieved the stated goals of making the measure a better assessment of fluid
reasoning, processing speed, and working memory. The authors’ findings showed that the
WAIS-IV provided a better fit to the instrument’s standardization data when compared to
the WAIS-III models. Thus, the authors concluded that the WAIS-IV provides a better
theoretical measurement of intelligence than the WAIS-III. The analyses examining the
two versions of the WAIS and the Cattell-Horn-Carroll model were unable to be
completed because the models were unidentified. From the other analyses, the authors
were able to conclude that FSIQ scores obtained by the WAIS-IV and the WAIS-III were
not equivalent and should not be directly compared to one another, as the constructs were
different across the overall test. Finally, the research showed that processing speed was
better represented and more reliable and valid as measured by the WAIS-IV than the
WAIS-III. Working memory was shown to be better measured by the WAIS-IV. In
contrast, fluid reasoning was not better measured by the WAIS-IV. Taub and Benson
(2013) concluded that the WAIS-IV was a technological improvement over the WAIS-
III.
According to Loring and Bauer (2010), research has shown that the VIQ and PIQ
of the previous versions of the WAIS were not uniform measures of verbal and nonverbal
abilities. Research indicates that the VIQ assessed not only verbal abilities and

7
knowledge, but included the subtest of Digit Span, a measure of attention and working
memory. The PIQ has been shown to assess visual spatial problem solving skills, but
contained subtests that assessed processing speed (Loring & Bauer, 2010). Evaluations of
the previous versions of the WAIS have shown that the subtests that make up the VIQ
and PIQ cluster into four cognitive domains (i.e., Verbal Comprehension, Perceptual
Reasoning, Working Memory, and Processing Speed). Studies with earlier versions of the
WAIS supported the four-factor structure and resulted in the factor-based composite
scores that were introduced as supplemental to the VIQ and PIQ scores of the WAIS-III
(Loring & Bauer, 2010).
In the development and release of the WAIS-IV, the VIQ and PIQ scores were
eliminated based on research supporting the composite scales. The WAIS-IV provides
four indices that make up Full Scale IQ (FSIQ) and coincide more with the theoretical
framework of multiple factors making up intelligence rather than the two factors that
made up FSIQ on the earlier versions of the WAIS. Loring and Bauer (2010) discussed
the trend away from global IQ scores to composite scores as with the WAIS-IV and
described index scores or composite scores as a more useful way to assess differential
diagnoses. Hartman (2009) stated that the VCI and PRI were more conceptually accurate
than the VIQ and PIQ.
The WAIS-IV includes changes to some and the elimination of other subtests
along with three new subtests. The WAIS-IV, with only 10 core subtests, is significantly
shorter than the WAIS-III, with 13 subtests (Hartman, 2009). The new core subtest of
Visual Puzzles is part of the PRI. Hartman (2009) described the new Visual Puzzles
subtest as requiring the individual to select components of an abstract puzzle figure from

8
a set of designs shown under the figure. Figure Weights, a new supplemental test added
to the WAIS-IV, was said to be an assessment of fluid reasoning and involves the
individual looking at a scale containing geometric figures on two plates. One scale is
missing an item and the individual is told to choose the answer that would balance the
scale (Hartman, 2009). Additionally, a Cancellation subtest, similar to that seen on the
WISC-IV was added as a supplemental subtest.
According to Loring and Bauer (2010), the emphasis on speeded responses has
been decreased on the WAIS-IV by the elimination of bonus points based on time.
Hartman (2009) stated that the rational for omitting Object Assembly and Picture
Arrangement from the WAIS-IV was to decrease the motor demand required to complete
the assessment and to reduce time bonus points. Loring and Bauer (2010) went on to state
that, because psychomotor slowing is considered a central feature of various brain
injuries, this may decrease the number of individuals in neurologic populations obtaining
a FSIQ below 70 on the WAIS-IV. Thus, there may be a decrease in the number of
individuals in this group who qualify for services using the FSIQ cutoff criteria of 70.
Because of these changes, it was suggested that the FSIQ on the WAIS-IV has the same
overall implications as the FSIQ from earlier versions of the WAIS but may have a
different meaning, which may alter the WAIS-IV FSIQ in relation to its sensitivity to
neuropsychological impairment. Loring and Bauer (2010) stressed the need for research
examining how the modified and new subtests of the WAIS-IV are impacted by
neurologic conditions.
Wechsler Adult Intelligence Scales and Neuropsychological Measures
It was hypothesized that the more recent versions of the WAIS were more

9
consistent with theory and research and have been more useful clinically than their
predecessors (Gottfredson & Saklofske, 2009). Recent research has examined the
relationship between the new subtest of Visual Puzzles and neuropsychological measures.
Fallows and Hilsabeck (2012) examined the Visual Puzzles subtest to assess the cognitive
functions tapped by the subtest. The subtest was moderately correlated with Trail Making
Test (TMT) Parts A and B (Trails A; Trails B) but not the Wisconsin Card Sorting Test
(WCST) perseverative errors. Overall, the authors found that Visual Puzzles had
significant correlations with neuropsychological measures of learning and recall,
cognitive flexibility, visuospatial reasoning, processing speed, and naming. Thus, the
authors concluded that Visual Puzzles assessed a broader range of abilities than proposed
by the publisher as well as broader abilities than those assessed by Matrix Reasoning and
Block Design.
While little other research is currently available regarding the current version of
the WAIS and performance with neuropsychological measures, even earlier versions of
the WAIS have been shown to have a significant relationship between their scores and
neuropsychological measures (Zarantonello, 1988). Using a sample of individuals with
various levels of neuropsychological impairment, Zarantonello (1988) examined the
relationship between the WAIS and WAIS-R and neuropsychological measures from the
Halstead-Reitan Battery. Participants obtained lower IQ scores on the WAIS and WAIS-
R as the level of neuropsychological impairment increased. No significant differences
were shown between the WAIS and the WAIS-R at various levels of neuropsychological
impairment because a relationship exists between the WAIS scores and other
neuropsychological measures (Zarantonello, 1988).

10
Johnstone et al. (1997) examined the construct validity of the Category Test by
investigating its relationship between several widely used assessment measures, including
the WAIS-R as a measure of intelligence, in a sample with various cognitive
impairments. The investigators used a factor analysis to see which assessment measures
loaded on each factor of the Category Test. The results showed that Information,
Vocabulary, Arithmetic, Comprehension, and Similarities from the WAIS-R loaded on
Factor 1 of the Category Test, Verbal Intelligence. Digit Span and Digit Symbol Coding
from the WAIS-R loaded on Factor 4 of the Category Test, Processing Speed. The
WAIS-R subtests of Picture Completion, Picture Arrangement, Object Assembly, and
Block Design did not load on any factors of the Category Test.
Berger (1998) administered the Wechsler Adult Intelligence Scale-Revised
(WAIS-R), the Wechsler Memory Scale-Revised, and the Halstead Reitan
Neuropsychological Test Battery to 112 patients to examine the relationship between the
WAIS-R and neuropsychological and memory measures. The results showed that the
WAIS-R scores on the Verbal Comprehension, Perceptual Organizational, and the
Freedom from Distractibility factors of the WAIS-R all correlated with the
neuropsychological and memory measures. The Verbal Comprehension factor correlated
with the Category Test. The Perceptual Organizational factor correlated with the
Category Test, TMT Part A (Trails A), TMT Part B (Trails B), Finger Tapping Test
(FTT), and Tactual Performance Test. The Freedom From Distractibility factor correlated
with the Category Test, Trails A, and Trails B. The author concluded that the WAIS-R
factors provide a model that can be utilized in further understanding the cognitive
processes that underlie neuropsychological test performance, and when used in

11
conjunction with neuropsychological tests, can assist in the clarification of deficits seen
in neuropsychological test performance. Berger (1998) went on to state that the Verbal
Comprehension factor was related not only to verbal abilities but also executive function.
The Perceptual Organizational factor was shown to be highly correlated with each
neuropsychological measure used in the study. The Category Test was correlated with
each factor of the WAIS-R. Berger (1998) concluded that this was most likely the result
of the fact that many neuropsychological measures, like the Category Test, assess a
variety of functions.
Sherman et al. (1995) examined the relationship between the WAIS-R and
neuropsychological measures that were said to assess the same abilities. The results of the
study indicate that the Verbal Comprehension factor (i.e., Vocabulary, Information,
Comprehension, and Similarities) was related to verbal ability, verbal memory, and
executive functioning. The Perceptual Organization factor (i.e., Block Design, Object
Assembly, Picture Completion, and Object Assembly) primarily assessed visual-spatial
perception and visual constructional ability but was related to visual-spatial memory,
visual attention, and executive functioning. The Freedom From Distractibility factor (i.e.,
Arithmetic and Digit Span) was associated with measures of attention but not measures
of memory. The authors indicated that the correlations between the WAIS-R and
neuropsychological measures were moderate in size.
Golden et al. (1998) examined the Category Test and the WCST and their
relationship with the WAIS-R in a sample of brain injured clients. The researchers used
the subtest scores of the WAIS-R and examined each subtest’s ability to predict scores on
the Category Test and the WCST. The results revealed that the Category Test was related

12
to the WAIS-R subtests of Block Design and Picture Arrangement. Golden et al. (1998)
hypothesized that the explanation may be that variations seen in performance on the
Category Test were the result of spatial and sequential reasoning as would be used in
Block Design and Picture Arrangement. The WCST was correlated with Similarities and
Object Assembly, and it was suggested that verbal categorization, important for
Similarities, and the ability to imagine whole objects, important for Object Assembly,
were skills required for performance on the WCST. The overall results from the study
indicated that the WCST could be more indicative of verbal abstract skills than the
Category Test that appears to rely more on spatial skills (Golden et al., 1998).
Research with the WAIS-III has shown the test to be correlated with
neuropsychological measures. Sanchez-Cubillo et al. (2009) examined the TMT and the
cognitive abilities it measures. The results showed that Digit Symbol Coding from the
WAIS-III accounted for the most variance in performance on Trails A, indicating that the
measure was mostly impacted by the speed of visual searching as used in Digit Symbol
Coding. Digit Span Backward accounted for a large portion of the variance seen in
performance on Trails B, showing that skills used on this task, like the ability to
manipulate information in working memory, contributed the most to performance on
Trails B (Sanchez-Cubillo et al., 2009).
Dugbartey, Sanchez, Rosenbaum, Mahurin, Davis, and Townes (1999) evaluated
the relationship between the Matrix Reasoning subtest on the WAIS-III and the Category
Test. Specifically, whether Matrix Reasoning was associated with performance on
measures of verbal abstract and verbally mediated thinking. Matrix Reasoning was
administered to a group of English and non-English-speaking adults. The results showed

13
a modest relationship between the Category Test and Matrix Reasoning in complex
spatial abstract reasoning and using conceptual rules in reasoning. A significant
relationship was observed between Matrix Reasoning and verbal fluency and higher order
verbal conceptualization in both English-speaking and non-English-speaking adults. The
authors concluded that these results suggested a strong verbal mediation component of
Matrix Reasoning but stated that executive functions may explain the relationship
observed between Matrix Reasoning and higher order conceptual skills as assessed by the
Category Test.
Titus et al. (2002) showed a modest relationship between scores on the Category
Test and PIQ on the WAIS-III. The subtests that most significantly predicted scores on
the Category Test were Block Design, Object Assembly, and Matrix Reasoning. Verbal
measures from the WAIS-III (i.e., Letter-Number Sequence, Arithmetic, Information, and
Digit Span) correlated with the Category Test but not as strongly as the Performance
measures. These findings led the authors to conclude that, while the Category Test was
not solely a measure of nonverbal intelligence, the test does require a higher level of
nonverbal over verbal intelligence.
Devaraju-Backhaus et al. (2001) investigated the relationship between the Luria-
Nebraska Neuropsychological Battery-Third Edition (LNNB-III) and the WAIS-III. The
results showed a significant relationship between the WAIS-III subtest of Letter-Number
Sequencing and Complex Auditory skills, Visual-Spatial skills, Arithmetic, and Non-
verbal Auditory function subtests of the LNNB-III. Matrix Reasoning of the WAIS-III
was shown to highly correlate with Visual-Spatial, Arithmetic, Figural Memory, and
Non-verbal Auditory function subtests of the LNNB-III. The research was further

14
evidence that the WAIS-III shares a relationship with measures of neuropsychological
functioning and may assess similar abilities.
Other research has been conducted to examine specific subtests of previous
versions of the WAIS and neuropsychological measures. Davis and Pierson (2012)
examined the relationship between the WAIS-III Digit Symbol Coding subtest and
executive functioning among a sample of 63 college students. Executive functions were
assessed with the Delis-Kaplan Executive Functions System (D-KEFS) TMT. The
authors found that the Digit Symbol Coding subtest was correlated with the Letter-
Number Sequencing component of the D-KEFS TMT.
The previous research supports the notion that the skills assessed by the former
versions of the WAIS have a direct relationship with those assessed by
neuropsychological measures. To date, little research has been done to examine the
relationship between the WAIS-IV and measures used in neuropsychological assessments
or, taking into account the improvements to the test, to examine the differences between
the WAIS-III and WAIS-IV on neuropsychological measures. Because the WAIS-IV is
said to be more closely aligned with current theories concerning cognitive abilities, the
WAIS-IV should be more correlated with neuropsychological measures than the WAIS-
III.
Purpose
The purpose of the study was to examine the neuropsychological utility of the
WAIS-IV compared to the WAIS-III. The study aimed to determine if the WAIS-IV was
more useful at predicting performance on neuropsychological measures than the WAIS-
III.

15
Hypothesis one. Based on the revisions made to the WAIS-IV to coincide with
theoretical changes and to be a better assessment of frontal lobe skills, it was expected
that the subtests of the WAIS-IV would better predict performance on the
neuropsychological measure of the Category Test than the WAIS-III.
Each revision of the WAIS has provided an assessment tool that bares a
relationship with neuropsychological assessments and a measure that more closely
resembles current research and assessment theories (Benson et al., 2010). The results of
previous research examining the WAIS-R have shown that the subtests of the WAIS-R
were correlated with scores on the Category Test (Berger, 1998; Golden et al., 1998).
Modest relationships have been shown between the Category Test and Matrix Reasoning
and other subtests of the WAIS-III (Dugbartey et al., 1999; Titus et al., 2002).
Specifically, Dugbartey et al. (1999) concluded that the Category Test measured complex
spatial abstract reasoning and was more closely related to Matrix Reasoning subtest of
the WAIS-III. There is little literature examining the WAIS-IV and performance on the
Category subtest. With the addition of Visual Puzzles, that is proposed to be a measure of
frontal lobe functioning, the WAIS-IV was expected to be better able to account for the
variance seen in performance for Category errors over the WAIS-III.
Hypothesis two. Due to the revisions made to the WAIS-IV to coincide with
theoretical changes and to be a purer measure of processing speed, it was expected that
the subtests of the WAIS-IV would better predict dominant hand performance on FTT
than the WAIS-III.
Often, the dominant hand FTT performance is accepted as a pure measure of
psychomotor speed, a simple response time task (Kennedy, Clement, & Curtiss, 2003).

16
Some classify motor speed as one of three domains of processing speed (Suchy, Eastvold,
Strassberg, & Franchow, 2014). With the WAIS-IV being designed to be a stronger
measure of processing speed, it is reasonable to hypothesize that it would be able to better
predict dominant hand performance than the WAIS-III.
Additionally, the results of previous research examining the WAIS-R have shown
that the subtests of the WAIS-R were correlated with scores on the FTT (Berger, 1998).
Specifically, Berger (1998) found that the FTT was correlated with performance on the
non-verbal subtests of the WAIS-R. These results have not been repeated using newer
versions of the WAIS. Thus, since each revision of the WAIS has provided an assessment
tool that has a relationship with neuropsychological assessments and a measure that more
closely resembles current research and assessment theories (Benson et al., 2010), it is
reasonable to expect that the WAIS-IV would better predict or be more correlated with
performance on the FTT than the WAIS-III.
Hypothesis three. Based on the revisions made to the WAIS-IV to coincide with
theoretical changes and to be a purer measure of processing speed, it was expected that
the subtests of the WAIS-IV would better predict non-dominant hand performance on
FTT than the WAIS-III.
The results of previous research examining the WAIS-R have shown that the
subtests of the WAIS-R were correlated with scores on the FTT (Berger, 1998). These
results have not been repeated using newer versions of the WAIS. Thus, since each
revision of the WAIS has provided an assessment tool that bares a relationship with
neuropsychological assessments and a measure that more closely resembles current
research and assessment theories (Benson et al., 2010), it is reasonable to expect that the

17
WAIS-IV would better predict or be more correlated with performance on the FTT than
the WAIS-III.
Hypothesis four. Based on the revisions made to the WAIS-IV to coincide with
theoretical changes and to more closely assess processing speed and working memory, it
was expected that the subtests of the WAIS-IV would better predict performance on
Trails A than the WAIS-III.
Previous research has shown that the WAIS-R and WAIS-III were closely related
to neuropsychological measures. Results have shown that particular subtests from the
WAIS-III can account for the variance in performance on neuropsychological measures
like Trails A and Trails B (Sanchez-Cubillo et al., 2009). Specifically, the Digit Symbol
Coding and Digit Span subtests of the WAIS-III were used to assess speed of perceptual
processing and visual scanning and working memory and mental control, respectively.
Results showed that 45% of the variance in performance on Trails A was explained by
visual searching, as measured by WAIS-III Digit Symbol Coding. An initial finding that
WAIS-III Digit Span Backward accounted for 24% of the variance in Trails A
disappeared once visual scanning and perceptual speed were controlled for. Indicating
that WAIS-III Digit Symbol Coding likely holds a significant relationship with Trails A
(Sanchez-Cubillo et al., 2009). Based on the previous research and the changes to the
WAIS-IV to make the measure a better measure of processing speed and working
memory, it was hypothesized that the WAIS-IV would be a better predictor of
performance on Trails A than the WAIS-III.
Hypothesis five. Based on the revisions made to the WAIS-IV to coincide with
theoretical changes and to be a better assessment of working memory, processing speed,

18
and frontal skills, it was expected that the subtests of the WAIS-IV would better predict
performance on Trails B than the WAIS-III.
The results of previous research has revealed that the greatest portion of the
variance in performance on the Trails B was accounted for by Digits Backward of the
Digit Span subtest from the WAIS-III, even when visual searching (i.e., Digit Symbol
Coding) was controlled for, leading to the conclusion of the authors that working memory
(i.e., the ability to mentally manipulate information) may play a role in the
implementation of executive control involved in task switching (Sanchez-Cubillo et al.,
2009). Thus, this relationship between measures of working memory, visual scanning,
and processing speed measures seen between the Trails B and the WAIS-III leads to the
reasonable assumption that the WAIS-IV measures would be better predictors of
performance on the Trails B, due to the test’s revision being more consistent with current
assessment theories and neuropsychological measures.
Hypothesis six. Based on the revisions made to the WAIS-IV to coincide with
theoretical changes and to be a better measure of fluid reasoning and frontal skills, it was
expected that the subtests of the WAIS-IV would better predict performance on the
neuropsychological measure WCST than the WAIS-III.
Previous research examining the WAIS-R has shown that the subtests of the
WAIS-R were correlated with scores on the WCST (Golden et al., 1998). Specifically,
the WCST was correlated with Similarities and Object Assembly, and it was suggested
that verbal categorization, important for Similarities, and the ability to imagine whole
objects, important for Object Assembly, were skills required for performance on the
WCST. Since previous research has shown a relationship between WCST and WAIS

19
subtests and because the WAIS-IV aimed to be a better measure of fluid reasoning and
executive abilities, it was expected that the WAIS-IV would be better able to predict
performance on the WCST over the WAIS-III.

20
CHAPTER III
Method
Participants
The current study involved the analysis of archival data from two databases.
Participants consisted of adults referred for neuropsychological evaluation at the
Neuropsychology Assessment Center at Nova Southeastern University and adults who
volunteered to participate in research and receive a full neuropsychological evaluation.
Participants included 91 adults of ages 18 to 78 (M = 33.38; SD = 15.03) with 7 to 20
years of education (M = 14.09; SD = 2.30). Females comprised 55% of the sample. The
ethnic and racial make up of the sample consisted of 59% Caucasian, 9% African
American, 24% Latino-Hispanic, and 8% Other. Diagnostically, the sample was made of
63% with no DSM-IV diagnosis, 11% with a Reading Disorder diagnosis, 8% with a
Math Disorder diagnosis, 7% with a Cognitive Disorder NOS diagnosis, 3% with an
Anxiety Disorder diagnosis, 3% with a Major Depressive Disorder diagnosis, 2% with an
Adjustment Disorder diagnosis, 2% with a Dysthymia diagnosis, and 1% ADHD
Combined Type diagnosis.
Procedures
Data collection. For the purposes of this research, all data were collected from
psychological evaluations of adults referred to the Neuropsychological Assessment
Center at Nova Southeastern University and from volunteer research participants.
Doctoral level clinical psychology practicum students, under the supervision of a licensed
clinical psychologists at Nova Southeastern University, administered all of the measures.
All students completed Nova Southeastern University Citi training. Multiple measures

21
were administered as part of the complete battery, but only the TMT, the Category Test,
FTT, WCST, WAIS-III, and WAIS-IV were included in the analyses.
Institutional Review Board Requirement
Before any data were analyzed, approval was obtained from the Institutional Review
Board (IRB) at Nova Southeastern University to conduct archival research. As mandated
by the IRB, all data were de-identified in order to maintain confidentiality.
Measures
The measures selected involved standardized scores. The measures yielded T-
Scores with a mean of 50 and standard deviation of 10 and Standard Scores with a mean
of 100 and a standard deviation of 15. Because the standard scores were age and
education corrected, the raw scores were used in the current study. The measures
consisted of instruments described as assessments of verbal abilities, perceptual skills,
motor speed, and executive functions and are detailed below.
The Trail Making Test. The Trails Making Test (TMT) is made up of two parts,
Trails A and Trails B. The individual is asked to draw lines connecting numbers in
sequential order as quickly and accurately as possible in the Trails A. The Trails B
involves the client completing the same task but alternating between numbers and letters
in sequential order. The TMT is often used as a measure of visual conceptual abilities,
cognitive flexibility, set shifting, sequencing ability, visual-motor tracking, and visual-
spatial functioning. The TMT has been shown to be highly sensitive to brain injury and
has a large attentional component. Trails B is often considered one of the best indicators
of cerebral dysfunction (Golden, Espe-Pfeifer, & Wachsler-Felder, 2000).
Finger Tapping Test (FTT). The Finger Tapping Test (FTT) is used to assess an

22
individual’s motor dexterity and manual motor speed (Sanchez-Cubillo et al., 2009). The
individual is asked to place his or her hand flat on a board and place the index finger of
the dominant hand on a lever that moves up and down and is attached to a device with a
counter. The person is then asked to push or tap the lever making it move up and down as
quickly as possible for 10 seconds. The counter on the device records the number of taps
the individual achieves. The administration for each hand continues until the client
achieves five consecutive trials within a five tap range or ten trials are completed. The
process is then repeated with the non-dominant hand. The averages of the five
consecutive trials within a five tap range or all ten trials are calculated for each hand. The
FTT is often used to assess for brain dysfunction and to identify the lateralization of
specific lesions (Golden, Espe-Pfeifer, & Wachsler-Felder, 2000).
Wisconsin Card Sorting Test (WCST). The Wisconsin Card Sorting Test
(WCST) is used to evaluate an individual’s ability to learn concepts. The test is a
computerized task with four stimulus cards and one response deck. The stimulus cards
are made up of a card with one red triangle, a card with two green stars, a card with three
yellow crosses, and a card with four blue circles. The response deck consists of 128 cards
that have varying geometric shapes (i.e., circle, square, triangle, or cross), colors (i.e.,
red, yellow, green, or blue), and numbers of shapes (i.e., one, two, three, or four). The
cards from the deck are comprised of all possible combinations of color, form, and
number. The individual is asked to match each card from the deck to one of the four
stimulus cards and is not instructed how to match the cards from the deck. One
opportunity is given to match each card in the deck, and the computer provides audio and
visual feedback to the individual by displaying and stating the words “correct” or

23
“incorrect” after each response. The individual must use this feedback to modify
responses until reaching the desired response. After reaching 10 consecutive correct
response matches (e.g., color, form, or number), the criterion for matching changes. The
test begins with color, changes to form, then number, and then goes back through color,
form, and number categories. Scores consists of number of correct responses,
perseverative errors (i.e., responses that would have been correct on a previous category),
nonperseverative errors, and the total number of categories completed (Golden, Espe-
Pfeifer, & Wachsler-Felder, 2000).
Wechsler Adult Intelligence Scale-III (WAIS-III). The Wechsler Adult
Intelligence Scale-III (WAIS-III; The Psychological Corporation, 1997) is a series of
tests used to assess general intelligence in an adult population of ages ranging from 16 to
89 years. The test consists of measures of general information knowledge, word
definitions, problem solving, and visual-spatial processing.
The WAIS-III is divided into Verbal and Performance sections. The Verbal
section has 7 subtests (i.e., Vocabulary, Similarities, Arithmetic, Digit Span, Information,
Comprehension, and Letter Number Sequence) that contribute to the Verbal IQ score.
The Vocabulary subtest is a measure of general word knowledge, where an individual is
asked to define single words. Similarities involves asking an individuals how two words
are alike and is a measure of verbal abstract reasoning. Arithmetic is a measure of
working memory and mental control under timed conditions, where an individual is
asked to mentally compute simple arithmetic problems under timed conditions. The Digit
Span subtest assess immediate attention, asking an individual to recite a series of
numbers, initially, in the same order that the numbers were heard. A second part of the

24
subtest asks the individual to recite the numbers in the reverse order in which they were
heard. The Information subtest involves an individual being asked general questions
about everyday information and assesses general fund of knowledge. Comprehension is a
subtest of everyday reasoning and involves answering questions about everyday
problems. Letter-Number Sequencing is another subtests assessing working memory and
immediate attention. The subtest requires an individual to recite a string of numbers and
letters in an order that lists the numbers first in numerical order and the letters last in
alphabetical order.
The Performance section consists of 7 additional subtests (i.e., Picture
Completion, Digit Symbol Coding, Block Design, Matrix Reasoning, Picture
Arrangement, Symbol Search, and Object Assembly) that contribute to the Performance
IQ score. The Picture Completion subtest assesses attention to detail and visual
discrimination. The subtest requires the individual to find a missing part of a picture
under timed constraints. Digit Symbol Coding is a measure of speeded transcription of
symbols using a key, assessing processing speed and psychomotor speed. Block Design is
a measure of three-dimensional visuoconstructional abilities under timed conditions.
Matrix Reasoning is a measure of visuospatial problem solving. Symbol Search is a
measure that requires visual scanning and processing speed. The Verbal and Performance
subtests combine to generate a Full Scale IQ.
Wechsler Adult Intelligence Scale-IV (WAIS-IV). Loring and Bauer (2010)
discuss the changes to the WAIS-IV and state that revisions to the test allow
improvements in test content that coincide with current research and theoretical models
of cognitive function. Changes from the WAIS-III to the WAIS-IV include scale indices,

25
subtest content, and administration. The index scores include the Verbal Comprehension
Index (VCI), Perceptual Reasoning Index (PRI), Processing Speed Index (PSI), and
Working Memory Index (WMI). The core subtests included on the WAIS-IV are the
Vocabulary, Information, Similarities, Arithmetic, Digit Span, Block Design, Matrix
Reasoning, Visual Puzzles, Coding, and Symbol Search. The test includes five
supplemental tests including: Comprehension, Picture Completion, Figure Weights,
Letter-Number Sequencing, and Cancellation. For the purposes of this study, only the
core subtests were used. The core subtests are largely the same as described previously in
the WAIS-III section. Subtest changes from the previous version include shortened
discontinue criteria and fewer motor demands as well as fewer timed bonuses, shorter
discontinuation rules, and clearer administration instructions and teaching examples.
Additionally, Digit Span includes a third sequencing component that requires the
individual to recite a series of numbers heard in sequential order from least to greatest.
Visual Puzzles is the only new subtest in the core group of subtests and involves looking
at a picture and identifying three pieces from six options that make the pictured puzzle.
The individual is asked to complete the task within a given time frame. The test was
standardized on ages ranging from 16 to 90 years.
Category Test. The Category Test consists of seven subtests that involve a series
of images that suggest a number from 1 to 4. The first subtest has items that are Roman
numerals ranging from 1 to 4 (I, II, III, IV). The second subtest requires the individual to
count the number of objects on the computer screen. For the more complex subtests (3
through 6), the number is suggested by the spatial location, orientation of an odd or
specific item, or through proportional reasoning. The final subtest is made up of items

26
from other subtest that the individual has seen before. The individual must guess the
appropriate strategy to use in each subtest and is allowed one guess per item. A bell
signals a correct response and a buzzer signals an incorrect response for each item. This
feedback allows the individual to alter responses until finding the appropriate strategy to
respond correctly. The individual’s score is determined by the number of errors the
individual makes on the seven subtests (Golden, Espe-Pfeifer, & Wachsler-Felder, 2000).
Analyses
Preliminary Analyses. Demographic variables of age and education were
collected for each participant. Participant diagnoses were gathered and the distribution of
diagnoses for the sample was recorded. The Statistical Package for the Social Sciences
(SPSS) was employed for analysis of data in the study.
Due to the sensitivity of multiple regression analyses to data outliers, the
statistical assumptions of multiple regressions were assessed before the data were
analyzed. Predictor and dependent variables were examined for outliers. Specifically,
analyses were run to examine the student deleted residuals, the leverage, and the
multicollinearity for each model.
Regression Analyses. To evaluate hypotheses one through six, Pearson
correlations and hierarchical multiple regression analyses were used to see if raw subtest
scores on the WAIS-III and WAIS-IV were able to predict scores on neuropsychological
measures (i.e., Trails A and B, WCST, Category, and FTT) in a sample of adults. While
Standard Scores for the WAIS-III and IV were age corrected, T-scores for the
neuropsychological measures were age, education, gender, and race corrected.
Additionally, the Standard and T-scores were based on two different scales, making the

27
scores difficult to compare. Thus, based on these factors, raw scores were used in the
multiple regression analyses in order to ensure that the scores being compared were the
same in nature. Age and education were entered as predictor variables in the first block of
the hierarchical regression, in order to assess their contribution to the models. The raw
subtest scores were used as the predictor variables in the second block in the hierarchical
regression models. Multiple regression analyses were conducted for each of the six
neuropsychological measures. The differences in the regression coefficients, R2, for the
WAIS-III and WAIS-IV raw subtest scores were compared using confidence intervals as
proposed by Alf and Graf (1999) to see if the subtests of the WAIS-IV were significantly
better predictors of, or accounted for more of the variance in, each neuropsychological
measure than the subtests of the WAIS-III.

28
CHAPTER IV
Results
Preliminary Results
Preliminary results included regression diagnostics, run in order to ensure the
regression models’ validity. Multiple regression analyses were run to examine the student
deleted residuals, the leverage, and the multicollinearity for each model. To assess for
outliers scores for centered leverage value and studentized deleted residuals were
examined. Leverage is a value used to assess how extreme an observation is in relation to
the independent variables, and an accepted leverage value cutoff is considered 2p/n,
where p is the number of predictors including the intercept in the model and n is the
sample size (Quinn & Keough, 2002). For the regression models containing the WAIS-III
this would be .34 and .22 for the models containing the WAIS-IV. The leverage values
were calculated by conducting preliminary regression models in SPSS.
Studentized deleted residuals examine whether an observation is unusual
compared to the rest of the sample so much so that it would change the model if that
observation were removed. Higher values indicated that the observations were outliers
from the other observations (Quinn & Keough, 2002). The general rule of thumb is that a
studentized deleted residual of 3 or higher is considered extreme. The studentized deleted
residuals were calculated by running preliminary regression models using SPSS.
For the current study, centered leverage, studentized deleted residuals, and
DFBETAS were examined to evaluate for outliers and influential observations in the
dataset. Those with both high centered leverage and high student deleted residuals (i.e., 3
and above) were considered extreme observations. These preliminary diagnostics showed

29
three participants with extreme scores (i.e., high studentized deleted residual, high
centered leverage values, and high DFBETAS) that were removed from the dataset, as
not to distort the regression models or coefficient estimates. Thus, the remaining results
were run with a sample size of 91 individuals.
SPSS was used to conduct multiple regression analyses with the outlier reduced
dataset to examine multicollinearity (i.e., multiple variables in the regression model have
exact linear relationships). When present, multicollinearity impacts the coefficients of the
regression model and the standard error of each coefficient becomes inflated. Accepted or
rule of thumb cutoff values for multicollinearity is a variance inflation factor (VIF) of
greater than 5. For each regression model, no variables exhibited a VIF of 5 or above,
which would rule out multicollinearity issues.
Table 1 illustrates the descriptive statistics for the neuropsychological measures in
the sample. All variables had an approximately normal distribution. A .01 significance
value was employed for all analyses in order to ensure a conservative approach to testing
the hypotheses and lowering the chances of a type I error. Table 2 shows the correlations
between all the WAIS-III and WAIS-IV subtests in the sample. Most subtests of the
WAIS-III and WAIS-IV were significantly correlated with one another, with the
exception of WAIS-III Vocabulary and WAIS-IV Symbol Search, WAIS-III Digit
Symbol Coding and WAIS-IV Information, and WAIS- III Digit Span with WAIS-IV
Information, WAIS-III Information with WAIS-IV Visual Puzzles, WAIS-III Vocabulary
and WAIS-IV Coding, WAIS-III Comprehension and WAIS-IV Symbol Search, and
WAIS-III Comprehension and WAIS-IV Coding.
The results of the correlations between the neuropsychological measures and the

30
Table 1 Descriptive Statistics for Neuropsychological Measures in the Sample Measure N M SD Skewness Kurtosis Trails A 91 27.76 9.90 .97 1.34 Trails B 91 72.41 42.20 3.00 13.00 WCST Perseverative Errors 91 8.51 4.23 1.70 4.22 Category Number of Errors 91 46.58 29.14 .78 -.32 Finger Tapping Test – Dominant 91 47.49 7.23 -.36 .42 Finger Tapping Test – Non-dominant 91 43.96 7.03 -.06 .89 WAIS-III Picture Completion 91 20.13 3.16 -1.46 2.59 WAIS-III Vocabulary 91 46.91 11.72 -.393 -.880 WAIS-III Digit Symbol Coding 91 74.62 18.80 -.445 .211 WAIS-III Similarities 91 24.46 4.85 -.50 -.20 WAIS-III Block Design 91 41.88 14.41 -.17 -.72 WAIS-III Arithmetic 91 12.77 3.88 .05 -.92 WAIS-III Matrix Reasoning 91 18.25 4.71 -.95 .34 WAIS-III Digit Span 91 17.55 4.90 .28 -.19 WAIS-III Information 91 17.67 4.79 -.53 -.51 WAIS-III Picture Arrangement 91 14.11 4.82 -.61 -.13 WAIS-III Comprehension 91 22.26 5.78 -.48 -.05 WAIS-III Symbol Search 91 34.31 9.68 -.09 -.33 WAIS-III Letter Number Sequencing 91 11.27 2.99 .23 -.28 WAIS-IV Block Design 91 41.23 13.17 -.15 -.95 WAIS-IV Similarities 91 26.03 5.56 -.61 -.09 WAIS-IV Digit Span 91 28.19 6.02 -.19 .17 WAIS-IV Matrix Reasoning 91 19.03 4.23 -.70 .21 WAIS-IV Vocabulary 91 38.89 10.00 -.39 -.74 WAIS-IV Arithmetic 91 13.07 3.65 .12 -.68 WAIS-IV Symbol Search 91 32.64 9.28 -.18 -.64 WAIS-IV Visual Puzzles 91 15.25 4,89 -.08 -1.05 WAIS-IV Information 91 15.03 4.78 -.29 -.53 WAIS-IV Coding 91 72.09 17.17 -.26 -.30 Note. M = mean; SD = Standard Deviation

31
WAIS-III are found in Table 3. Of the neuropsychological measures, the WCST and
Category exhibited significant negative correlations with all of the WAIS-III subtests.
Table 2
Pearson Correlations between WAIS-III and WAIS-IV
WAIS-IV
WA
IS-I
II
BD SI DS MR VC AR IN SS VP CD
PC
VC
CD
SM
BD
AR
MR
DS
IN
PA
CP
SS
LS
.60*
.42*
.54*
.55*
.89*
.62*
.74*
.47*
.40*
.56*
.43*
.70*
.59*
.48*
.68*
.34*
.75*
.50*
.61*
.44*
.31*
.57*
.45*
.66*
.46*
.48*
.37*
.44*
.47*
.38*
.50*
.52*
.54*
.74*
.35*
.35*
.38*
.52*
.70*
.55*
.39*
.49*
.49*
.65*
.45*
.69*
.47*
.47*
.59*
.38*
.59*
.51*
.34*
.89*
.28*
.73*
.41*
.58*
.37*
.35*
.76*
.52*
.73*
.32*
.58*
.46*
.56*
.48*
.61*
.65*
.85*
.58*
.45*
.59*
.44*
.57*
.56*
.54*
.38*
.68*
.22
.63*
.30*
.56*
.42*
.14
.86*
.48*
.67*
.28*
.38*
.44*
.20
.60*
.30*
.55*
.47*
.61*
.53*
.30*
.36*
.23
.77*
.53*
.59*
.29*
.44*
.40*
.80*
.48*
.63*
.48*
.21
.43*
.28*
.67*
.58*
.49*
.20
.78*
.32*
.51*
.46*
.57*
.46*
.32*
.42*
.23
.76*
.45*
Note. * = p ≤ .01; PC = Picture Completion; VC = Vocabulary; CD = Digit Symbol Coding; SM = Similarities; BD = Block Design; AR = Arithmetic; MR = Matrix Reasoning; DS = Digit Span; IN = Information; PA = Picture Arrangement; CP = Comprehension; SS = Symbol Search; LS = Letter Number Sequencing; VP = Visual Puzzles
Thus, as the raw scores on the WAIS-III subtest decreased the errors on the WCST and

32
Category increased. Trails A was correlated significantly with all of the subtests of the
Table 3
Pearson Correlations between Neuropsychological Measures and WAIS-III
Neuropsychological Measures
WAIS-III
Trai
ls A
Tr
ails
B
FTT
Dom
inan
t
FTT
Non
-D
omin
ant
W
CST
C
ateg
ory
PC
VC
CD
SM
BD
AR
MR
DS
IN
PA
CP
SS
LS
-.45*
-.28*
-.56*
-.38*
-.47*
-.49*
-.47*
-.51*
-.30*
-.37*
-.25
-.62*
-.54*
-.49*
-.25
-.48*
-.40*
-.44*
-.52*
-.53*
-.50*
-.31*
-.47*
-.26
-.54*
-.50*
.28*
.07
.31*
.22
.34*
.25
.25
.25
.05
.26
.06
.35*
.34*
.24
.01
.28*
.16
.23
.18
.18
.20
.05
.19
-.01
.32*
.23
-.37*
-.28*
-.50*
-.38*
-.49*
-.34*
-.54*
-.34*
-.38*
-.53*
-.28*
-.48*
-.40*
-.59*
-.39*
-.55*
-.53*
-.71*
-.63*
-.60*
-.49*
-.38*
-.55*
-.43*
-.67*
-.53*
Note. * = p ≤ .01; PC = Picture Completion; VC = Vocabulary; CD = Digit Symbol Coding; SM = Similarities; BD = Block Design; AR = Arithmetic; MR = Matrix Reasoning; DS = Digit Span; IN = Information; PA = Picture Arrangement; CP = Comprehension; SS = Symbol Search; LS = Letter Number Sequencing
WAIS-III with the exception of Comprehension. Similarly, Trails B was significant with
all WAIS-III subtests except Vocabulary and Comprehension. FTT Dominant was only

33
correlated with the WAIS-III subtests of Picture Completion, Digit Symbol Coding,
Block Design, Symbol Search, and Letter Number Sequencing. FTT Non-Dominant was
only correlated with Digit Symbol Coding and Symbol Search of the WAIS-III.
Table 4 shows the correlations between the WAIS-IV subtests and the
neuropsychological measures. Trails A was significantly correlated with all subtests with
the exception of Vocabulary and Information. Trails B was significantly correlated with
all of the WAIS-IV subtests. FTT Dominant was only correlated with Block Design,
Digit Span, Visual Puzzles, and Coding. FTT Non-Dominant was only correlated with
Visual Puzzles and Coding. WCST was significantly correlated with all subtests except
Information. Category was significantly correlated with all subtests.
Hypothesis 1
The first hypothesis stated that, based on the revisions made to the WAIS-IV to
coincide with theoretical changes and to more closely resemble neuropsychological
assessment measures, it was expected that the subtests of the WAIS-IV would better
predict the Category Test than would the WAIS-III. The first block of the hierarchical
regression contained age and education predicting Category Test scores and was
significant, R2 = .18, F(2, 88) = 9.62, p < .001. The WAIS-III subtests were added to a
second variable block of the hierarchical regression and was significant, ∆R2 = .52, F
Change(13, 75) = 9.83, p < .001, showing that they contribute above and beyond age and
education, R2 = .70, F(15, 75) = 11.47, p <.001. In a separate hierarchical regression age
and education were entered as the first block of the hierarchical regression. The second
block with the WAIS- IV subtests was significant, ∆R2 = .46, F Change(10, 78) = 9.97, p
< .001, indicating that the subtests account for a significant amount of variance over and

34
above age and education alone, R2 = .64, F(12, 78) = 11.55, p < .001. Tables 5 and 6
show the individual predictive values for each predictor entered in both hierarchical
regression models as well as the confidence intervals.
Table 4
Pearson Correlations between Neuropsychological Measures and WAIS-IV
Neuropsychological Measures
WAIS-IV
Tr
ails
A
Tr
ails
B
FTT
Dom
inan
t
FTT
Non
-D
omin
ant
W
CST
C
ateg
ory
Block Design
Similarities
Digit Span
Matrix Reasoning
Vocabulary
Arithmetic
Information
Symbol Search
Visual Puzzles
Coding
-.46*
-.39*
-.39*
-.44*
-.24*
-.52*
-.25*
-.55*
-.49*
-.60*
-.46*
-.42*
-.45*
-.38*
-.31*
-.53*
-.27*
-.52*
-.52*
-.56*
.32*
.16
.27*
.22
.07
.26
.04
.23
.43*
.31*
.22
.11
.28
.15
.07
.20
.14
.08
.37*
.34*
-.42*
-.34*
-.31*
-.60*
-.30*
-.34*
-.26
-.47*
-.37*
-.46*
-.63*
-.52*
-.51*
-.61*
-.39*
-.58*
-.36*
-.57*
-.64*
-.62*
Note. * = p ≤ .01
To evaluate the differences in the predictive ability of the two versions of the
WAIS, the squared multiple correlation coefficients (i.e., R2) were compared using a
method proposed by Alf and Graf (1999). With an R2 difference of 0.06, the 99%
confidence interval produced by the Alf and Graf (1999) model had a lower limit of -0.02

35
and an upper limit of 0.13, as seen in Table 7. The comparison of the R2 difference was
not significant. Thus, neither model was a significantly better predictor of performance
on Category than the other. The hypothesis was not supported.
Hypothesis 2
The second hypothesis hypothesized that the WAIS-IV would be a better
predictor of performance on the FTT for the dominant hand over the WAIS-III. The first
block of both hierarchical regressions contained age and education predicting dominant
hand performance on the FTT which were not significant, R2 = .07, F(2, 88) = 3.52, p =
.034. For the first hierarchical regression, the second block contained the WAIS-III
subtests and showed that the predictors did not account for a significant amount of the
variance in dominant hand performance on the FTT, ∆R2 = .22, F Change(13, 75) = 1.83,
p = .05, R2 = .30, F(15, 75) = 2.11, p = .02. The second hierarchical regression contained
the WAIS-IV subtests in the second block and was significant overall, ∆R2 = .21, F
Change(10, 78) = 2.30, p = .02, which indicated that the subtests contribute over and
above age and education, R2 = .29, F(12, 78) = 2.59, p = .006, for predicting performance
on the FTT with the dominant hand. Tables 8 and 9 show the individual predictive values
and confidence intervals for each predictor entered in both hierarchical regression
models. With an R2 difference of 0.01, the 99% confidence interval produced by the Alf
and Graf (1999) model was not significant and had a lower limit of -0.04 and an upper
limit of 0.06, as shown in Table 7. Hypothesis two was not supported, as the WAIS-IV
was not a significantly better predictor of performance on the FTT for the dominant hand.
Hypothesis 3
The third hypothesis examined the predictive ability of the versions of the WAIS

36
Table 5
Summary of Multiple Regressions for Variables Predicting Category Error Performance
WAIS-III WAIS-IV
Variable B SE B β sr2 B SE B β sr2
Age
Education
.72
-3.61
.19
1.25
.37*
-.29*
.14
.08
.72
-3.61
.19
1.25
.37*
-.29*
.14
.08
Age
Education
Information
Digit Span
Vocabulary
Arithmetic
Comprehension
Similarities
PC
PA
Block Design
MR
Coding
LNS
Symbol Search
Visual Puzzles
.51
-.66
.63
-.38
.06
-2.49
-.86
.02
-1.87
-.74
-.44
.76
.08
1.04
-.69
-
.17
1.06
.76
.61
.33
.85
.61
.79
.82
.69
.23
.76
.76
1.12
.34
-
.26*
-.05
.10
-.06
.02
-.33*
-.17
.00
-.20
-.12
-.22
.12
.05
.11
-.23
-
.04
.00
.00
.00
.00
.04
.01
.00
.02
.01
.01
.00
.00
.00
.02
-
.27
.50
-.26
-.09
-.12
-.56
-
-1.18
-
-
.11
-1.05
-.50
-
.17
-1.79
.18
1.07
.64
.46
.36
.97
-
.56
-
-
.30
.66
.18
-
.35
.75
.14
.04
-.04
-.02
-.04
-.07
-
-.23
-
-
.05
-.15
-.30*
-
.05
-.30
.01
.00
.00
.00
.00
.00
-
.02
-
-
.00
.01
.04
-
.00
.03
Note. dash = variable not included on specific version of test. *p < .01. B = unstandardized coefficient; SE B = Standard error of unstandardized coefficient; β = Standardized coefficient; sr2 = squared semipartial correlation; PC = Picture Completion; PA = Picture Arrangement; MR = Matrix Reasoning
and the FTT for the non-dominant hand, stating that the WAIS-IV would be a better
predictor of performance on the FTT for the non-dominant hand over the WAIS-III.

37
For performance on the FTT with the non-dominant hand, the first block of both
hierarchical regressions contained age and education as predictors of performance on the
Table 6
Confidence Intervals for Unstandardized Regression Coefficients for Category Error
WAIS-III WAIS-IV
99% Confidence Interval 99% Confidence Interval
Variable
Lower
Limit
Upper
Limit
Lower
Limit
Upper
Limit
Age
Education
.22
-6.90
1.22
-.33
.22
-6.90
1.22
-.33
Age
Education
Information
Digit Span
Vocabulary
Arithmetic
Comprehension
Similarities
Picture Completion
Picture Arrangement
Block Design
Matrix Reasoning
Digit Symbol Coding
LNS
Symbol Search
Visual Puzzles
.08
-3.47
-1.37
-1.99
-.82
-4.74
-2.47
-2.08
-4.04
-2.55
-1.04
-1.26
-.34
-1.92
-1.60
--
.95
2.14
2.63
1.23
.94
-.25
.74
2.12
.30
1.08
.17
2.78
.49
3.99
.22
--
-.21
-2.31
-1.94
-1.32
-1.07
-3.12
--
-2.65
--
--
-.68
-2.80
-.99
--
-.76
-3.76
.74
3.31
1.43
1.13
.83
1.99
--
.28
--
--
.91
.70
-.01
--
1.09
.18
Note. Dashes indicate that variable was not included on specific version of test

38
task and were not significant, R2 = .08, F(2, 88) = 4.02, p = .02. For the first hierarchical
regression, the second block contained the WAIS-III subtests and did not produce a
Table 7
Comparison of the Squared Multiple Correlation Coefficients
Confidence Interval
Measure
R21
R22 Lower Upper
Limit Limit
Category Test Errors .70 .64 -.02 .13
FTT Dominant Hand .30 .29 -.04 .06
FTT Non-Dominant Hand .23 .28 -.14 .06
Trails A .50 .47 -.04 .78
Trails B .52 .49 -.04 .88
WCST Perseverative Error .43 .42 -.03 .04
significant model, ∆R2 = .15, F Change(13, 75) = 1.13, p = .35, R2 = .23, F(15, 75) =
1.53, p = .12. In contrast, the second hierarchical regression contained the WAIS-IV
subtests in the second block and was significant, ∆R2 = .19, F Change(10, 78) = 2.09, p =
.04, revealing that the subtests contribute over and above age and education alone, R2 =
.28, F(12, 78) = 2.49, p = .008, for predicting performance on the FTT with the non-
dominant hand. Tables 10 and 11 show the individual predictive values and confidence
intervals for each predictor entered in both hierarchical regression models. With an R2
difference of 0.04, the 99% confidence interval produced by the Alf and Graf (1999)
model is shown in Table 7 and was not significant and had a lower limit of -0.14 and an
upper limit of 0.06. The hypothesis was not supported, as the WAIS-IV did not produce
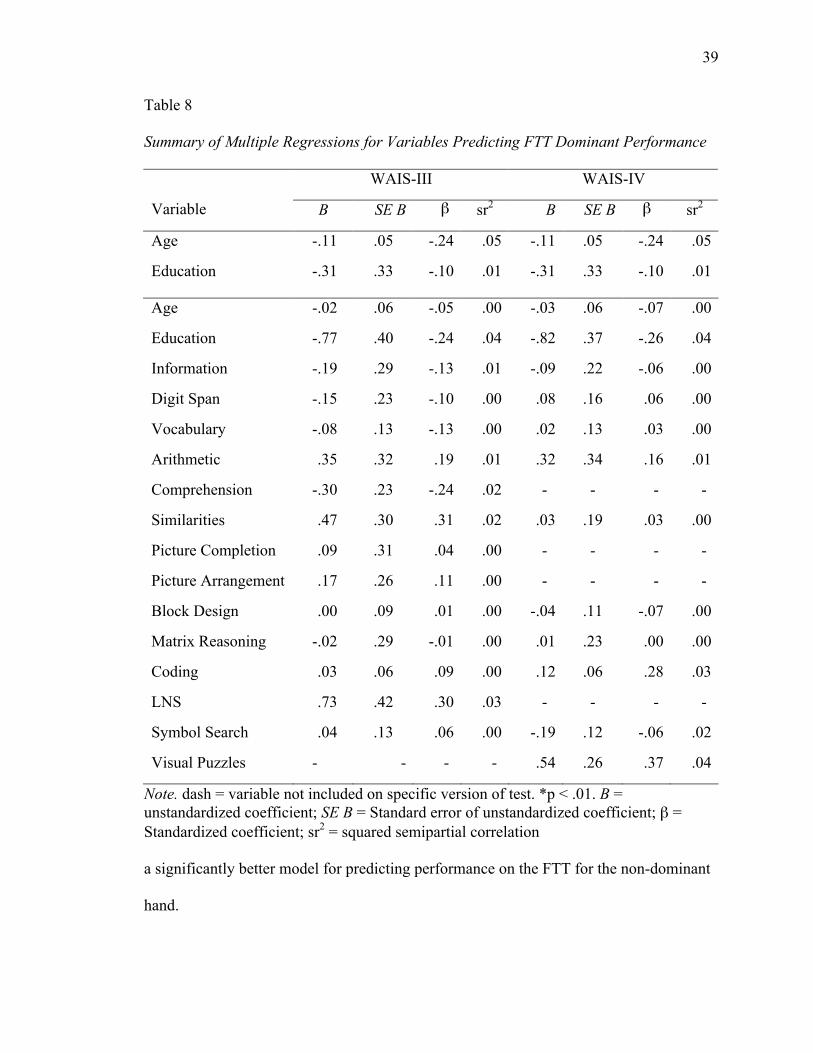
39
Table 8
Summary of Multiple Regressions for Variables Predicting FTT Dominant Performance
WAIS-III WAIS-IV
Variable B SE B β sr2 B SE B β sr2
Age
Education
-.11
-.31
.05
.33
-.24
-.10
.05
.01
-.11
-.31
.05
.33
-.24
-.10
.05
.01
Age
Education
Information
Digit Span
Vocabulary
Arithmetic
Comprehension
Similarities
Picture Completion
Picture Arrangement
Block Design
Matrix Reasoning
Coding
LNS
Symbol Search
Visual Puzzles
-.02
-.77
-.19
-.15
-.08
.35
-.30
.47
.09
.17
.00
-.02
.03
.73
.04
-
.06
.40
.29
.23
.13
.32
.23
.30
.31
.26
.09
.29
.06
.42
.13
-
-.05
-.24
-.13
-.10
-.13
.19
-.24
.31
.04
.11
.01
-.01
.09
.30
.06
-
.00
.04
.01
.00
.00
.01
.02
.02
.00
.00
.00
.00
.00
.03
.00
-
-.03
-.82
-.09
.08
.02
.32
-
.03
-
-
-.04
.01
.12
-
-.19
.54
.06
.37
.22
.16
.13
.34
-
.19
-
-
.11
.23
.06
-
.12
.26
-.07
-.26
-.06
.06
.03
.16
-
.03
-
-
-.07
.00
.28
-
-.06
.37
.00
.04
.00
.00
.00
.01
-
.00
-
-
.00
.00
.03
-
.02
.04
Note. dash = variable not included on specific version of test. *p < .01. B = unstandardized coefficient; SE B = Standard error of unstandardized coefficient; β = Standardized coefficient; sr2 = squared semipartial correlation
a significantly better model for predicting performance on the FTT for the non-dominant
hand.

40
Hypothesis 4
The fourth hypothesis stated that performance on the WAIS-IV subtests would be
Table 9
Confidence Intervals for Unstandardized Regression Coefficients for FTT Dominant
WAIS-III WAIS-IV
99% Confidence Interval 99% Confidence Interval
Variable
Lower
Limit
Upper
Limit
Lower
Limit
Upper
Limit
Age
Education
-.25
-1.18
.02
.56
-.25
-1.18
.02
.56
Age
Education
Information
Digit Span
Vocabulary
Arithmetic
Comprehension
Similarities
Picture Completion
Picture Arrangement
Block Design
Matrix Reasoning
Digit Symbol Coding
LNS
Symbol Search
Visual Puzzles
-.19
-1.83
-.95
-.76
-.41
-.50
-.91
-.33
-.72
-.52
-.23
-.78
-.12
-.39
-.30
--
.14
.29
.56
.46
.25
1.20
.30
1.26
.91
.86
.23
.75
.19
1.85
.37
--
-.20
-1.81
-.68
-.35
-.31
-.57
--
-.48
--
--
-.32
-.61
-.05
--
-.51
-.15
.13
.16
.50
.51
.35
1.22
--
.55
--
--
.24
.62
.29
--
.14
1.23
Note. Dashes indicate that variable was not included on specific version of test

41
better predictors of performance on Trails A than performance on the WAIS-III subtests.
The first block of both hierarchical regressions contained age and education predicting
performance on Trails A and were significant, R2 = .10, F(2, 88) = 4.87, p = .010. The
Table 10
Summary of Multiple Regressions for FTT Non-Dominant Performance
WAIS-III WAIS-IV
Variable B SE B β sr2 B SE B β sr2
Age
Education
-.12
-.23
.05
.32
-.27
-.08
.07
.01
-.12
-.23
.05
.32
-.27
-.08
.07
.01
Age
Education
Information
Digit Span
Vocabulary
Arithmetic
Comprehension
Similarities
Picture Completion
Picture Arrangement
Block Design
Matrix Reasoning
Coding
LNS
Symbol Search
Visual Puzzles
-.06
-.68
.11
-.03
-.12
.35
-.31
.45
.21
.05
-.06
-.07
.03
.33
.08
-
.06
.41
.29
.23
.13
.33
.23
.30
.31
.26
.09
.30
.06
.43
.13
-
-.13
-.22
.07
-.02
-.20
.19
-.25
.31
.09
.04
-.12
-.05
.08
.14
.11
-
.01
.03
.00
.00
.01
.01
.02
.02
.01
.00
.01
.00
.00
.01
.00
-
-.05
-.69
.07
-.03
-.07
.17
-
.03
-
-
-.15
-.17
.16
-
-.11
.67
.06
.36
.22
.16
.12
.33
-
.19
-
-
.10
.23
.06
-
.12
.26
-.11
-.23
.05
-.03
.10
.09
-
.02
-
-
-.29
-.10
.39
-
-.15
.46
.01
.03
.00
.00
.00
.00
-
.00
-
-
.02
.01
.06
-
.01
.06
Note. dash = variable not included on specific version of test. *p < .01. B = unstandardized coefficient; SE B = Standard error of unstandardized coefficient; β = Standardized coefficient; sr2 = squared semipartial correlation

42
first hierarchical regression contained the WAIS-III subtests in the second block and was
significant, ∆R2 = .40, F Change(13, 75) = 4.52, p < .001, which shows that the subtests
Table 11
Confidence Intervals for Unstandardized Regression Coefficients for FTT Non-Dominant
WAIS-III WAIS-IV
99% Confidence Interval 99% Confidence Interval
Variable
Lower
Limit
Upper
Limit
Lower
Limit
Upper
Limit
Age
Education
-.25
-1.07
.00
.60
-.25
-1.07
.00
.60
Age
Education
Information
Digit Span
Vocabulary
Arithmetic
Comprehension
Similarities
Picture Completion
Picture Arrangement
Block Design
Matrix Reasoning
Digit Symbol Coding
LNS
Symbol Search
Visual Puzzles
-.23
-1.75
-.66
-.64
-.46
-.51
-.92
-.35
-.63
-.64
-.29
-.84
-.13
-.81
-.27
--
.11
.40
.87
.59
.22
1.21
.31
1.26
1.04
.75
.17
.71
.19
1.46
.43
--
-.21
-1.65
-.50
-.45
-.26
-.70
--
-.47
--
--
-.43
-.77
-.01
--
-.43
-.01
.11
.27
.65
.39
.39
1.05
--
.53
--
--
.12
.43
.33
--
.20
1.34
Note. Dashes indicate that variable was not included on specific version of test
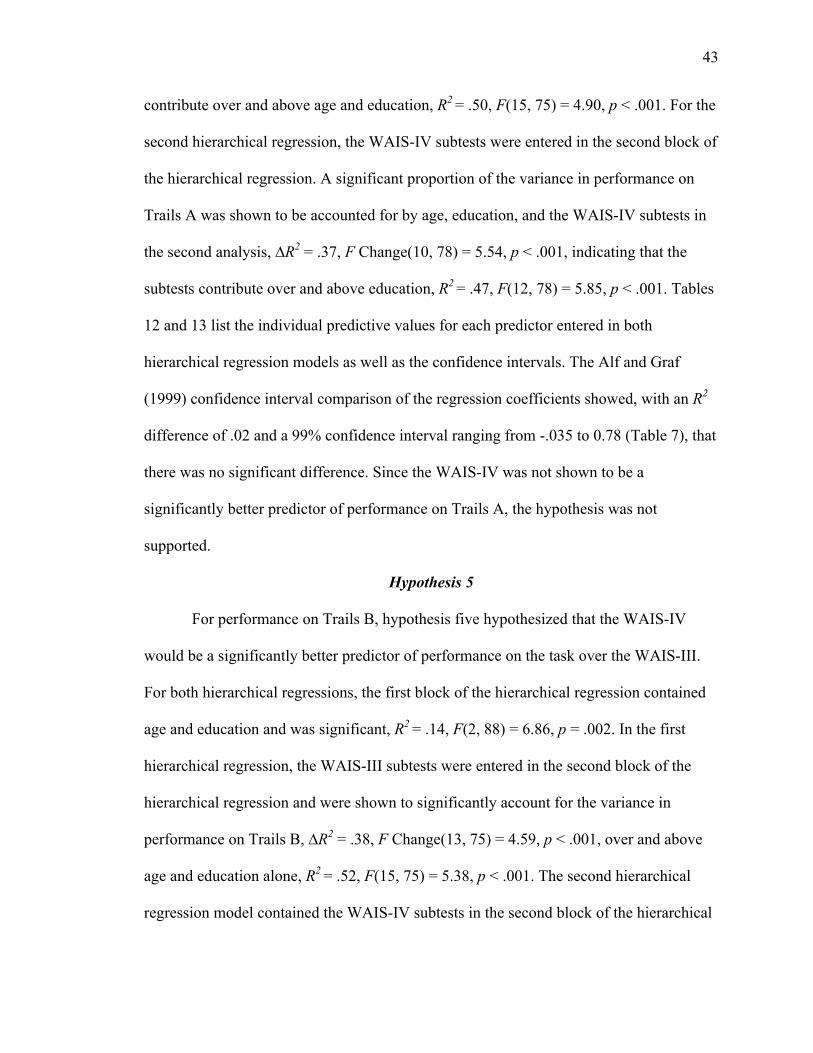
43
contribute over and above age and education, R2 = .50, F(15, 75) = 4.90, p < .001. For the
second hierarchical regression, the WAIS-IV subtests were entered in the second block of
the hierarchical regression. A significant proportion of the variance in performance on
Trails A was shown to be accounted for by age, education, and the WAIS-IV subtests in
the second analysis, ∆R2 = .37, F Change(10, 78) = 5.54, p < .001, indicating that the
subtests contribute over and above education, R2 = .47, F(12, 78) = 5.85, p < .001. Tables
12 and 13 list the individual predictive values for each predictor entered in both
hierarchical regression models as well as the confidence intervals. The Alf and Graf
(1999) confidence interval comparison of the regression coefficients showed, with an R2
difference of .02 and a 99% confidence interval ranging from -.035 to 0.78 (Table 7), that
there was no significant difference. Since the WAIS-IV was not shown to be a
significantly better predictor of performance on Trails A, the hypothesis was not
supported.
Hypothesis 5
For performance on Trails B, hypothesis five hypothesized that the WAIS-IV
would be a significantly better predictor of performance on the task over the WAIS-III.
For both hierarchical regressions, the first block of the hierarchical regression contained
age and education and was significant, R2 = .14, F(2, 88) = 6.86, p = .002. In the first
hierarchical regression, the WAIS-III subtests were entered in the second block of the
hierarchical regression and were shown to significantly account for the variance in
performance on Trails B, ∆R2 = .38, F Change(13, 75) = 4.59, p < .001, over and above
age and education alone, R2 = .52, F(15, 75) = 5.38, p < .001. The second hierarchical
regression model contained the WAIS-IV subtests in the second block of the hierarchical

44
Table 12
Summary of Multiple Regressions for Variables Predicting Trails A Performance
WAIS-III WAIS-IV
Variable B SE B β sr2 B SE B β sr2
Age
Education
.16
-1.11
.07
.44
.24
-.26
.05
.06
.16
-1.11
.07
.44
.24
-.26
.05
.06
Age
Education
Information
Digit Span
Vocabulary
Arithmetic
Comprehension
Similarities
PC
PA
Block Design
MR
Coding
LNS
Symbol Search
Visual Puzzles
-.01
-.15
.00
-.21
.11
-.25
.21
-.43
-.45
.21
.08
-.14
-.10
-.80
-.23
-
.07
.47
.33
.27
.15
.38
.27
.35
.36
.30
.10
.33
.07
.49
.15
-
-.02
-.03
.00
-.10
.13
-.10
.12
-.21
-.15
.10
.12
-.07
-.19
-.24
-.23
-
.00
.00
.00
.00
.00
.00
.00
.01
.01
.00
.00
.00
.01
.02
.02
-
-.01
-.04
.01
-.00
.07
-.61
-
-.21
-
-
.16
-.09
-.22
-
-.12
-.52
.07
.44
.26
.19
.15
.40
-
.23
-
-
.12
.27
.08
-
.14
.31
-.02
-.01
.00
-.00
.07
-.23
-
-.12
-
-
.21
-.04
-.37*
-
-.11
-.26
.00
.00
.00
.00
.00
.02
-
.01
-
-
.01
.00
.05
-
.01
.02
Note. dash = variable not included on specific version of test. *p < .01. B = unstandardized coefficient; SE B = Standard error of unstandardized coefficient; β = Standardized coefficient; sr2 = squared semipartial correlation; PC = Picture Completion; PA = Picture Arrangement; MR = Matrix Reasoning
regression and was able to significantly explain the variance in performance on the Trails
B, ∆R2 = .36, F Change(10, 78) = 5.47, p < .001, over and above age and education, R2 =
.49, F(12, 78) = 6.28, p < .001. Tables 14 and 15 show the individual predictive values
and confidence intervals for each predictor entered in both hierarchical regression

45
Table 13
Confidence Intervals for Unstandardized Regression Coefficients for Trails A Total Time
WAIS-III WAIS-IV
99% Confidence Interval 99% Confidence Interval
Variable
Lower
Limit
Upper
Limit
Lower
Limit
Upper
Limit
Age
Education
-.02
-2.28
.34
.06
-.02
-2.28
.34
.06
Age
Education
Information
Digit Span
Vocabulary
Arithmetic
Comprehension
Similarities
Picture Completion
Picture Arrangement
Block Design
Matrix Reasoning
Digit Symbol Coding
Letter-Number Sequencing
Symbol Search
Visual Puzzles
-.20
-1.38
-.88
-.91
-.27
-1.23
-.50
-1.35
-1.41
-.59
-.19
-1.03
-.28
-2.09
-.63
--
.18
1.08
.88
.50
.50
.74
.91
.49
.50
1.00
.34
.74
.08
.50
.17
--
-.21
-1.20
-.69
-.50
-.32
-1.66
--
-.81
--
--
-.17
-.81
-.42
--
-.50
-1.33
.18
1.11
.70
.50
.46
.44
--
.40
--
--
.48
.40
-.02
--
.26
.29
Note. Dashes indicate that variable was not included on specific version of test
models. With an R2 difference of .03 and a 99% confidence interval can ranging from -
.035 to 0.88, the WAIS-IV was not shown to be a significantly better predictor of
performance on Trails B. Since the WAIS-IV was not shown to be a significantly better

46
Table 14
Summary of Multiple Regressions for Variables Predicting Trails B Performance
WAIS-III WAIS-IV
Variable B SE B β sr2 B SE B β sr2
Age
Education
.90
-4.61
.28
1.86
.32*
-.25
.10
.06
.90
-4.61
.28
1.86
.32*
-.25
.10
.06
Age
Education
Information
Digit Span
Vocabulary
Arithmetic
Comprehension
Similarities
PC
PA
Block Design
MR
Coding
LNS
Symbol Search
Visual Puzzles
.46
.66
-.17
-1.28
.87
-4.02
.61
-2.28
-2.77
-.50
.87
-1.17
-.11
-1.32
-.35
-
.30
1.94
1.38
1.11
.61
1.55
1.11
1.45
1.50
1.25
.61
1.39
.29
2.04
.63
-
.17
.04
-.02
-.15
.24
-.37
.08
-.26
-.21
-.06
.24
-.13
-.05
-.09
-.08
-
.01
.00
.00
.01
.01
.04
.00
.02
.02
.00
.03
.01
.00
.00
.00
-
.47
-.19
.13
-.28
-.21
-2.90
-
-1.51
-
-
.86
1.18
-.74
-
-.34
-2.64
.31
1.83
1.10
.80
.62
1.67
-
.96
-
-
.52
1.14
.32
-
.60
1.29
.17
-.01
.01
-.04
-.05
-.25
-
-.20
-
-
.27
.12
-.30
-
-.08
-.31
.00
.00
.00
.00
.00
.02
-
.02
-
-
.02
.01
.04
-
.00
.03
Note. dash = variable not included on specific version of test. *p < .01. B = unstandardized coefficient; SE B = Standard error of unstandardized coefficient; β = Standardized coefficient; sr2 = squared semipartial correlation; PC = Picture Completion; PA = Picture Arrangement; MR = Matrix Reasoning
predictor of performance on Trails B, the hypothesis was not supported.
Hypothesis 6
The sixth hypothesis stated that the subtests of the WAIS-IV would be better
47
predictors of performance on the WCST, specifically in the number of errors, than would
Table 15
Confidence Intervals for Unstandardized Regression Coefficients for Trails B Total Time
WAIS-III WAIS-IV
99% Confidence Interval 99% Confidence Interval
Variable Lower
Limit
Upper
Limit
Lower
Limit
Upper
Limit
Age
Education
.15
-9.50
1.65
.28
.15
-9.50
1.65
.28
Age
Education
Information
Digit Span
Vocabulary
Arithmetic
Comprehension
Similarities
Picture Completion
Picture Arrangement
Block Design
Matrix Reasoning
Digit Symbol Coding
Letter-Number Sequencing
Symbol Search
Visual Puzzles
-.33
-4.45
-3.82
-4.22
-.74
-8.12
-2.32
-6.11
-6.73
-3.82
-.26
-4.85
-.87
-6.72
-2.01
--
1.26
5.78
3.48
1.65
2.47
.08
3.54
1.55
1.19
2.81
1.95
2.51
.64
4.07
1.31
--
-.34
-5.03
-2.77
-2.39
-1.84
-7.29
--
-4.04
--
--
-.51
-1.84
-1.58
--
-1.93
-6.03
1.29
4.65
3.03
1.82
1.42
1.50
--
1.01
--
--
2.23
4.18
.10
--
1.25
.76
Note. Dashes indicate that variable was not included on specific version of test
the WAIS-III. Tables 16 and 17 show the individual predictive values for each predictor

48
entered in both hierarchical regression models as well as the confidence intervals. For
both hierarchical regressions, the initial block of the hierarchical regressions contained
age and education as predictors for WCST perseverative errors and were significant, R2 =
Table 16
Summary of Multiple Regressions for Variables Predicting WCST Performance
WAIS-III WAIS-IV
Variable B SE B β sr2 B SE B β sr2
Age
Education
.09
-.55
.03
.19
.30*
-.30*
.09
.08
.09
-.55
.03
.19
.30*
-.30*
.09
.08
Age
Education
Information
Digit Span
Vocabulary
Arithmetic
Comprehension
Similarities
PC
PA
Block Design
MR
Coding
LNS
Symbol Search
Visual Puzzles
.02
-.13
-.16
.01
.06
.17
.00
-.05
.09
-.20
-.04
-.13
-.05
-.10
-.03
-
.03
.21
.15
.12
.07
.17
.12
.16
.16
.14
.05
.15
.03
.22
.07
-
.06
-.07
-.19
.01
.17
.15
.00
-.06
.07
-.22
-.15
-.14
-.21
-.07
-.07
-
.00
.00
.01
.00
.01
.01
.00
.00
.00
.02
.01
.01
.02
.00
.00
-
.02
-.07
.04
.06
-.06
.11
-
-.06
-
-
.00
-.43
-.03
-
-.06
-.01
.03
.20
.12
.09
.07
.18
-
.10
-
-
.06
.12
.03
-
.06
.14
.08
-.04
.04
.08
-.13
.09
-
-.08
-
-
.01
-.43*
-.14
-
-.14
-.01
.00
.00
.00
.00
.01
.00
-
.00
-
-
.00
.10
.01
-
.01
.00
Note. dash = variable not included on specific version of test. *p < .01. B = unstandardized coefficient; SE B = Standard error of unstandardized coefficient; β = Standardized coefficient; sr2 = squared semipartial correlation; PC = Picture Completion; PA = Picture Arrangement; MR = Matrix Reasoning

49
.15, F(2, 88) = 7.51, p = .001. The second block of the first hierarchical regression
contained the WAIS-III subtests and was significant, ∆R2 = .28, F Change(13, 75) = 2.81,
Table 17
Confidence Intervals for Unstandardized Regression Coefficients for WCST
WAIS-III WAIS-IV
99% Confidence Interval 99% Confidence Interval
Variable
Lower
Limit
Upper
Limit
Lower
Limit
Upper
Limit
Age
Education
.01
-1.03
.16
-.06
.01
-1.03
.16
-.06
Age
Education
Information
Digit Span
Vocabulary
Arithmetic
Comprehension
Similarities
Picture Completion
Picture Arrangement
Block Design
Matrix Reasoning
Digit Symbol Coding
Letter-Number Sequencing
Symbol Search
Visual Puzzles
-.07
-.68
-.56
-.31
-.11
-.28
-.32
-.47
-.34
-.56
-.16
-.53
-.13
-.69
-.21
--
.10
.43
.24
.33
.24
.61
.32
.37
.52
.17
.08
.28
.04
.49
.15
--
-.07
-.59
-.27
-.17
-.23
-.36
--
-.33
--
--
-.14
-.75
-.12
--
-.23
-.38
.11
.45
.35
.28
.12
.58
--
.21
--
--
.15
-.11
.06
--
.11
.35
Note. Dashes indicate that variable was not included on specific version of test
p = .003, revealing a contribution over and above age and education, R2 = .43, F(15, 75) =

50
3.71, p < .001. The second hierarchical regression contained the WAIS-IV subtests in the
second block and was significant, ∆R2 = .27, F Change(10, 78) = 3.67, p < .001,
indicating that the subtests contribute over and above education, R2 = .42, F(12, 78) =
4.69, p < .001. With an R2 difference of 0.07 and a 99% confidence interval ranging from
-.03 to .04, the comparison was not significant. The confidence intervals can be found in
Table 7. Neither model was a significantly better predictor of performance on the WCST
than the other. The hypothesis was not supported.
Post-hoc Analyses
In reviewing the results of the analyses, it was determined that it would be
beneficial to examine the Pearson correlations among the subtests for the WAIS-III and
the WAIS-IV. The WAIS-III correlations are found in Table 18. For the WAIS-III, all
Table 18
Pearson Correlations between WAIS-III Subtests
VC CD SM BD AR MR DS IN PA CP SS LNS
PC VC CD SM BD AR MR DS IN PA CP SS
.33* -
.42*
.31* -
.45*
.78*
.37* -
.57*
.41*
.56*
.56* -
.42*
.57*
.50*
.62*
.63* -
.57*
.36*
.52*
.45*
.69*
.57* -
.34*
.30*
.50*
.27
.49*
.49*
.49* -
.36*
.78*
.34*
.72*
.40*
.61*
.47*
.22 -
.61*
.51*
.46*
.60*
.54*
.45*
.70*
.35*
.56* -
.34*
.75*
.27*
.73*
.45*
.62*
.43*
.21
.72*
.48* -
.51*
.32*
.73*
.45*
.64*
.56*
.60*
.51*
.36*
.43*
.34* -
.44*
.55*
.47*
.48*
.59*
.60*
.54*
.70*
.48*
.50*
.49*
.57* Note. * = p ≤ .01. PC = Picture Completion; VC = Vocabulary; CD = Digit Symbol Coding; SM = Similarities; BD = Block Design; AR = Arithmetic; MR = Matrix Reasoning; DS = Digit Span; IN = Information; PA = Picture Arrangement; CP = Comprehension; SS = Symbol Search; LS = Letter Number Sequencing.

51
subtests were significantly correlated with the exception of Digit Span with Similarities,
Information, and Comprehension. The WAIS-IV subtests correlations can be found in
Table 19. Most of the subtests were highly correlated. The exceptions involve the
Vocabulary and Information subtests. Vocabulary was not significantly correlated with
Symbol Search or Coding, and Information was not significantly correlated with Symbol
Search, Visual Puzzles, or Coding.
Table 19
Pearson Correlations between WAIS-IV Subtests
SIM DS MR VOC AR SS VP IN CD BD
.54*
.57*
.59*
.44*
.66*
.61*
.80*
.34*
.53*
SIM -
.42*
.47*
.64*
.67*
.37*
.40*
.52*
.31*
DS -
.45*
.47*
.56*
.52*
.51*
.31*
.45*
MR -
.40*
.53*
.53*
.51*
.39*
.52*
VOC -
.58*
.22
.29*
.73*
.21
AR -
.47*
.55*
.54*
.48*
SS -
.59*
..22
.72*
VP - .20 .45* IN - .26
Note. * = p ≤ .01. BD = Block Design; SIM = Similarities; DS = Digit Span; MR = Matrix Reasoning; VOC = Vocabulary; AR = Arithmetic; SS = Symbol Search; VP = Visual Puzzles; IN = Information; CD = Digit Symbol Coding.

52
CHAPTER V
Discussion
The current study aimed to examine the WAIS-IV and how the changes to the
new version may impact the test’s usefulness in neuropsychological evaluations. The
purpose of the study was to examine the neuropsychological utility of the WAIS-IV
compared to the WAIS-III and sought to determine if the WAIS-IV was more useful at
predicting performance on neuropsychological measures than the WAIS-III.
Hypothesis 1
The first hypothesis stated that, based on the changes to the WAIS-IV proposing
that the measure was more consistent with neuropsychological theory, the WAIS-IV
would be a better predictor of performance on the Category Test than the WAIS-III. The
hypothesis was not supported by the current analyses.
Changes to the WAIS-IV were believed to make the test a better measure that
would be more closely related to neuropsychological measures and theory. In particular,
the WAIS-IV contains fewer time bonuses and fewer motor demands, which can
negatively impact neurologically impaired individuals unnecessarily. The most
significant change that was expected to yield significant changes in the prediction of
performance on the Category Test was the redesigning of subtests that was intended to
produce a stronger association and perceived better measurement of fluid reasoning (i.e.,
ability to process/manipulate abstractions, rules, generalization, and logical
relationships), which are strongly measured by the Category Test and used in higher
order cognitive processing and executive skills. Not only did the designers of the WAIS-
IV strive to make the PRI subtests better measures of fluid reasoning by diminishing

53
motor demands and timed bonuses, a new subtest (i.e., Visual Puzzles) was added to the
WAIS core battery in order to be a better measure and make an overall better index
measure of perceptual reasoning/fluid reasoning/intelligence. These changes were
expected to yield a greater neuropsychological utility of the WAIS-IV because of the
focus on underlying cognitive principles and fewer extraneous variables that can impact
raw scores and, subsequently, the achieved intellectual scores.
The hypothesis was proposed because of the addition of Visual Puzzles to the test,
which, while a related nonverbal measure of intelligence, adds to the WAIS-IV over and
above Block Design and Matrix Reasoning in that it assesses more of an integrative
frontal, executive process than both Block Design and Matrix Reasoning. With the
inclusion of a timed component to puzzle manipulation and spatial reasoning, the
integrative features of Visual Puzzles were proposed to influence more frontal lobe
functions over and above the other nonverbal tests from the WAIS-III in that the task
requires frontal skills of hypothesis formation, mental flexibility, planning, problem
solving, and conceptualization. Thus, the task requires more of the frontal lobe functions
that the Category Test measures as opposed to simply the spatial relations of the Category
Test that are more consistent with Block Design and the untimed problem solving of
Matrix Reasoning.
The frontal lobes possess a group of abilities known as the executive skills,
include attention, reasoning, judgment, problem solving, creativity, emotional regulation,
impulse control, and awareness of one’s functioning (Scott & Schoenberg, 2011). Luria
(1973) discussed the simple to complex processes involved in higher order executive
skills that are produced in the frontal lobes. According to Luria (1973), the frontal lobes

54
are responsible for the regulation of complex intellectual processes and voluntary
attention. Visuoconstruction, visual reasoning, and problem solving, as measured by
Block Design and Matrix Reasoning, are some nonverbal abilities partially assessed by
the frontal lobes. The perception of shapes as assessed in Block Design, Matrix
Reasoning, and Visual Puzzles is an active process, which requires the individual to
search for the most important elements of information, compare them, create an
hypothesis concerning the meaning of the design as a whole, and then verify the
hypothesis by comparing it with the original elements of the objects or designs seen.
Exceeding these shared aspects of the three PRI subtests of the WAIS-IV, the new
subtest addition of Visual Puzzles was designed to assess the more complex and
integrated abilities of executive skills that are more heavily influenced by frontal lobe
functioning and requires the individual to develop and test hypotheses based on given
rules under timed constraints. The test replaced the former subtest of Picture Completion
of the WAIS-III, which was not as highly correlated with Category performance or other
executive measures and tended to rely more on visual attention. Visual Puzzles was
expected to be a measure of integrated functional lobe functioning. The integrated
process taps frontal lobe functions used when an individual must test and develop
hypotheses. Individuals with frontal lobe conditions are more likely to exhibit impulsive,
fragmentary guesses as opposed to intellectual activity and hypothesis testing required to
adequately complete the activity with the given set of rules and criteria (Luria, 1973).
Visual Puzzles, like Category, requires the individual to understand the given material,
distinguish the details of the designs, compare them, formulate an hypothesis of the
designs, and test the hypothesis with the given set of rules in order to evaluate the

55
hypothesis and further resume the analysis of the designs. This program of analysis and
synthesis requires switching from various operations and hypotheses, which can be
disrupted with frontal lobe conditions (Luria, 1973). Individuals with frontal lobe
conditions have difficulty switching and testing hypotheses and are easily distracted,
making it difficult for them to perform the correct analysis and synthesis of material to
generate and test hypotheses to complete the tasks. This produces inflexibility in the
problem solving approach, as they are often unaware of their mistakes and unable to
correct them (Luria, 1973). The process of forming and executing a program is difficult
for individuals with frontal lobe lesions, as they are unable to first analyze the component
elements of the given conditions, formulate a definite strategy and then compare the
results with the original conditions given in both the Visual Puzzles subtest and the
Category Test. For less complex tests with simple and unambiguous solutions, these
individuals may not show significant difficulties (e.g., Matrix Reasoning and Block
Design), as the process is not as complex and the approach is not as integrated as Visual
Puzzles and the Category Test.
Based on this more integrative process as well as the more integrative process of
the Category task, it would be expected for the new subtest to add more predictive ability
to the performance on the Category Test over and above Block Design and Matrix
Reasoning, which contain less integrated assessments of executive skills and are less
frontal in nature and more spatially oriented. Despite these similarities and the focus
towards a more integrated measure of frontal lobe functioning and executive abilities, the
current analyses do not support the hypothesis. The Visual Puzzles subtests did not
significantly add to the predictive ability of the WAIS-IV over and above the WAIS-III
56
nonverbal subtests.
While Visual Puzzles and the Category Test do tap similar integrative abilities,
the two tests are not without their differences. The Category Test contains multiple
components that range from simple knowledge of roman numerals to visual
discrimination, spatial reasoning, working memory/simple arithmetic, and a memory
component that assesses the ability to recall previously seen problems. These multiple
components set the test apart from Visual Puzzles that assesses a more straightforward
integrated process of hypothesis testing and problem solving with puzzles.
Not only was the Visual Puzzles test expected to make the newest version of the
WAIS more consistent with the Category Test but the WAIS-IV was designed to be a
stronger measure of working memory, which is another ability tapped by the Category
Test. Working memory is assessed through two subtests of the Category Test through the
assessment of simple arithmetic. On the WAIS-III and WAIS-IV working memory is
assessed through two subtests of Digit Span and Arithmetic. The WAIS-IV was designed
to be a better measure of working memory (ability to actively maintain information and
mentally manipulate it in order to produce a result). The digit span subtest was
redesigned to decrease rhyming numbers and a sequencing portion was added that
requires the individual to perform a more complex working memory task than the
previous version of Digit Span that contained only forwards and backwards. Changes
were made to the Arithmetic subtest to make instructions and problems clearer as well as
decrease the impact of timed bonuses. The test is associated with frontal lobe functions
and working memory, as the individual must analyze the given information and then
develop a strategy to solve the problems. For more simple problems, individuals with a

57
frontal lobe condition would be unlikely to show difficulty. As the problems become
more difficult, as seen in the progressive difficulty in the Arithmetic subtest, the nature of
the test changes, becoming a higher load measure of working memory and an executive
process of analysis and problem solving (Luria, 1973). These changes are relevant to
performance on the Category Test, as parts of the test are strongly related to and directly
require working memory skills to mentally manipulate minor mathematical information.
Despite these changes that were proposed to make the test a better predictor of
performance on the Category Test, the current results show that the WAIS-IV was not a
significantly better predictor of performance on Category errors than the WAIS-III.
Further examination of the relationship between the two versions and the
Category Test revealed there were observed differences in the most significant predictors
of Category errors performance for the different versions of the WAIS. For the WAIS-III,
the Arithmetic subtest was the only significant predictor of performance on the Category
Test. This finding makes sense, considering that two subtests of the Category Test
involve fractions, mental arithmetic, and working memory. In contrast, the WAIS-IV
subtest that was the most significant predictor of performance on the Category Test was
WAIS-IV Coding. While WAIS-IV Coding is not necessarily an executive functioning
measure, the task does involve processing speed, visual scanning, and visual
discrimination, required to transcribe numbers quickly. Components of the Category Test
require visual discrimination in order to find the most different object and correctly
identify missing quadrants. The WAIS-IV Arithmetic subtest was not a significant
predictor of performance on the Category Test.
The differences are of interest because, while both processing speed and working

58
memory are components of higher order cognitive functions like those measured by the
Category Test, the two subtests assess different properties. The ability to mentally
manipulate information (i.e., working memory), as that required for the Arithmetic
subtest, is fundamentally different than the Coding subtest that assesses speeded visual
discrimination and visual scanning (i.e., processing speed). Changes made to the
Arithmetic subtests from the WAIS-III to the WAIS-IV dealt with fewer timed bonuses
and clearer administration instructions. Changes in the Digit Symbol Coding/Coding
subtest from the WAIS-III to the WAIS-IV were strictly in the symbols themselves and in
the administration directions. It was expected that the new Visual Puzzles subtest of the
WAIS-IV and the WAIS-IV subtests as a whole would be significantly better predictors
of performance, which was not supported and leads to the conclusion that the changes in
the WAIS do not result in better prediction of performance on Category errors.
Additionally, Pearson correlations were examined to further assess the
relationship between the two versions of the WAIS and performance on Category errors.
For the WAIS-III, all of the subtests had significant negative correlations with
performance on Category errors, indicating that as the raw scores for the subtests
increased (i.e., performance improved) the number of Category errors decreased,
indicating better performance on the Category Test. Thus, as performance on intellectual
subtests measures increased, fewer Category errors were made.
The WAIS-III subtest most highly correlated with performance on Category
errors was Block Design, which would be expected considering that Block Design is a
measure of visuospatial reasoning and nonverbal problem solving, similar to the Category
Test. The Symbol Search subtest was the next highest correlated subtest, which likely

59
shows the relationship between visual discrimination used with both the subtest and the
Category Test. Arithmetic was the next most highly correlated WAIS-III subtest with
Category errors, showing the use of working memory and simple arithmetic used for the
subtest and the Category Test. The WAIS-III Matrix Reasoning subtest had the fourth
highest correlation with Category errors. The subtest assesses fluid reasoning and
includes nonverbal, visuospatial problem solving, and it is considered a strong measure g.
It would be expected to be strongly related to the Category Test, which is a measure of
fluid reasoning and problem-solving. The remaining order of significant WAIS-III
subtest correlations with performance on the Category Test was as follows: Picture
Completion, Picture Arrangement, Digit Symbol Coding, Letter Number Sequencing,
Similarities, Digit Span, Comprehension, Vocabulary, and Information.
Due to the nonverbal nature of the Category Test, it would be expected for the
verbal subtests of Similarities, Comprehension, Vocabulary, and Information to be the
least related to the test. Picture Completion and Picture Arrangement require nonverbal
reasoning and visual attention. Thus, the two tests would be expected to be related to the
Category Test. The results of the correlation analyses support the justification in
removing these test from the core battery in the case of picture completion and in
removing picture arrangement from the tests, as the tests were not as strongly correlated
with fluid reasoning abilities as the other fluid reasoning measures of the Block Design
and the Matrix Reasoning subtests. The order of the verbal WAIS-III measures was not
surprising, since Similarities and Comprehension require more abstraction, even verbally,
than Vocabulary and Information. Digit Span being less correlated as the other working
memory subtest of Arithmetic was not surprising, since the Arithmetic subtest shares

60
simple arithmetic skills like the Category Test as well as being a higher load working
memory measure requiring more mental manipulation of information.
For the WAIS-IV, the highest correlated subtest was Visual Puzzles, which is a
new subtest to the WAIS and designed to make the test a better measure of frontal,
executive skills. Thus, it was not a surprise that it was strongly correlated with
performance on the Category Test. The next most highly correlated WAIS-IV measure
with performance on Category errors was the Block Design subtest, a similar measure
assessing parallel abilities. The third most highly correlated subtest was the WAIS-IV
Coding subtest, assessing visual discrimination and processing speed, a component of
higher order cognitive processing. The WAIS-IV Matrix Reasoning subtest was the
fourth most highly correlated test with performance on the Category Test, showing the
fluid reasoning relationship and measurement of each test. The remaining order of
significantly correlated subtests was Arithmetic, Symbol Search, Digit Span, Similarities,
Vocabulary, and Information. As noted in the earlier discussion with the WAIS-III
correlations, the Arithmetic subtest taps similar abilities to two subtests of the Category
measure and the significant correlation was not surprising. It was not surprising that the
verbal measures were the least correlated with Category performance, with Similarities
being more highly correlated due to the use of verbal abstraction, a more complex and
higher order process despite being verbal in nature.
The observed differences in the correlations shows that, as would be anticipated,
the fluid reasoning and executive skills measures are strongly related to the Category Test
and higher order cognitive abilities such as problem solving, hypothesis testing,
reasoning, and pattern finding. Additionally, the correlations show that processing speed
61
measures and mental arithmetic (i.e., mental manipulation/working memory) are strongly
related to executive abilities. Digit Span from the WAIS-III as well as Digit Span from
the WAIS-IV were not as strongly correlated as might be expected, given the working
memory component of the measures. A new sequencing component was added to the
WAIS-IV Digit Span subtest, as a proposed way to make a higher load working memory
measure. The results of the correlation analyses indicate that the sequencing component
of the WAIS-IV Digit Span subtest did not add to the neuropsychological utility of the
measure, in that the measure does not appear to be any more highly related to the
Category Test, which requires an amount of working memory abilities for a portion of the
test, than the WAIS-III version with only forward and backward digit span. While the
hypothesis was not supported, the order of significant correlations for the WAIS-IV
shows that the changes to the WAIS-IV did result in closer relationships with the subtests
proposed to measure fluid reasoning and a widely used neuropsychological measure of
fluid reasoning.
With the changes to the WAIS-IV, it would be expected that the PRI subtests of
Block Design, Matrix Reasoning, and Visual Puzzles as well as the WMI subtests of
Digit Span and Arithmetic would be more highly correlated with the Category Test than
the WAIS-III subtests of Block Design, Matrix Reasoning, and Picture Completion. The
results of the Pearson correlation comparisons shows that both the PRI subtests and WMI
subtests of the WAIS-IV are not more highly correlated with performance on the
Category Test as those on the previous version of the WAIS, despite the proposed
changes to make the subtests more consistent with fluid reasoning, frontal lobe
functioning, and working memory.

62
Hypotheses 2 and 3
The second and third hypotheses theorized that the WAIS-IV would be a better
predictor of performance on the FTT for the dominant and non-dominant hands over the
WAIS-III. Changes made to the WAIS-IV were proposed to make the test a better
measure of processing speed, which led to the hypothesis that the WAIS-IV would be a
better predictor of performance on FTT, a measure of psychomotor speed and reaction
time, considered to be components of processing speed. The WAIS-IV was designed to
reduce motor demands, which would be expected to make it have a stronger negative
predictive relationship with FTT, a purer measure of motor speed. The hypothesis was
not supported by the current analyses.
The FTT dominant hand and non-dominant hand are measures of psychomotor
speed. Particularly, the FTT dominant hand performance is often used as a measure of
pure psychomotor and reaction speed over the non-dominant hand. This is due to the fact
that most individuals are more adept with their dominant hand. Scores for the dominant
hand are expected to be about 10% faster than the non-dominant hand (Golden, et al.,
2000). Thus, the FTT dominant hand would be expected to be slightly more related to
measure of speeded processing and reaction time than the non-dominant hand FTT
performance.
The FTT was proposed to be better predicted by the newest version of the WAIS,
due to the changes alleged to make the test more consistent with neuropsychological
theory and a better measure of processing speed. Psychomotor speed is a component of
processing speed that assesses the speed of movements like that required with rapid
fingertip manipulations and sustained speed over brief periods of time, as assessed with

63
the finger tapping task.
Slowed psychomotor movements are observed in neurological populations after
brain injury, stroke, as well as individuals with diagnoses of schizophrenia, multiple
sclerosis, and Parkinson’s disease. The frontal lobe is responsible for simple and complex
motor skills as well as sequenced motor skills (Luria, 1973). In addition, Luria (1973)
states that the foundation for the configuration of voluntary movement and conscious
action takes place in the frontal lobe, where the movement formulates, the action
preservation takes place, and the performance of the action is regulated and monitored.
All motor movements require some planning and goal selection from the executive skill
set. While mostly accepted as a measure of pure psychomotor speed, without significant
influence of higher order cognitive skills, some classify processing speed in three
different domains of motor speed, visual-perceptual speed, and visual-motor integration
(Suchy, Eastvold, Strassberg, & Franchow, 2014). Often, the dominant hand finger
tapping performance is accepted as a pure measure of psychomotor speed, a simple
response time task (Kennedy, Clement, & Curtiss, 2003). The PSI measures of the WAIS
are accepted as measures of speed of responding to simple content (Kennedy et al.,
2003).
The WAIS-IV was also designed to cut down on the motor demands that could
impact performance in neurologically impaired populations. The changes to Symbol
Search for the WAIS-IV include larger stimuli and the individual marks the matching
symbol or the NO box as opposed to marking a YES or NO box as with the WAIS-III.
These changes are proposed to have fewer motor and visual demands. The Coding subtest
of the WAIS-IV saw changes to the symbols as well as larger stimuli, believed to

64
decrease visual and motor demands. With each processing measure still having an
obvious motor component involved in writing, it would be expected that there would still
be a relationship between the measures. Thus, it would be expected that the WAIS-IV
would be a better predictor of performance on the FTT due to an inverse relationship,
with fewer motor demands leading to an inverse relationship with the FTT, but a better
predictive power than the WAIS-III, which has not shown a close relationship with the
FTT.
It was also expected that the Block Design subtest would have a relationship with
the FTT because the test requires manual manipulation of blocks in order to make the
designs. The changes made to the subtest for the WAIS-IV included larger stimuli and
decreased timed bonuses, lessening the speeded component of the test. Thus, the
relationship would be expected to have an inverse relationship, as the measure likely is
less influenced by psychomotor speed but continues to maintain a motor component.
The analyses showed that the WAIS-III was not a significant predictor of
dominant hand performance for the FTT. In contrast, the WAIS-IV was able to
significantly predict dominant hand performance on the FTT. Despite the WAIS-IV
showing a significant model of prediction for FTT dominant hand performance while the
WAIS-III did not, the difference between the models was not statistically significant.
Thus, the WAIS-IV was not a statistically significant better predictor over and above the
WAIS-III.
For the FTT dominant hand, further examination of the relationship between the
two versions revealed that there were no observed differences in the most significant
predictors of FTT dominant hand performance in the regression models for the different

65
versions of the WAIS. For the WAIS-III, the overall regression was not significant and
no analysis of the individual predictors can be conducted. For the WAIS-IV overall
regression was significant, but none of the individual predictors significantly predicted
performance on FTT with the dominant hand over and above the other predictors in the
regression model.
Pearson correlations were examined to further assess the relationship between the
two versions of the WAIS and FTT dominant hand performance. All of the WAIS-III
subtests had positive correlations with FTT dominant hand performance, indicating that
as the raw scores for the subtests increased (i.e., performance improved) the number of
taps performed by the dominant hand increased, showing better performance on the FTT
dominant hand. As performance on intellectual subtests measures increased, FTT
dominant performance increased.
For the WAIS-III, only Symbol Search, Block Design, Letter Number
Sequencing, Digit Symbol Coding, and Picture Completion were significantly correlated
with FTT dominant hand performance. Symbol Search being the most highly correlated
with FTT dominant hand performance was not surprising considering that the test has a
motor and processing component. Block Design’s strong motor component that requires
manipulation of blocks in the construction of the design reveals a relationship between
the two tasks. Letter Number Sequencing being highly correlated with FTT dominant
hand performance was surprising, considering the working memory component of Letter
Number Sequencing, which appears to have little relation to the motor/processing
components of FTT dominant hand performance. There was evidence of an underlying
relationship between working memory and processing speed. The relationship may have

66
something to do with a reaction time component involved in both FTT dominant hand
performance and Letter Number Sequencing, in that increased reaction time improves
performance on both tasks. Digit Symbol Coding being the next most significantly
correlated measure with FTT dominant hand performance was not surprising considering
the measure is a processing speed measure with a motor component required in the
transcription of the symbols. Picture Completion being the final significantly correlated
measure with FTT dominant performance was not surprising, considering there can be a
motor component involved in the task, as the individual is allowed to point to the missing
part of the picture as opposed to only naming the missing part. The remaining order of
non-significant WAIS-III subtest correlations with FTT dominant hand performance was
as follows: Picture Arrangement, Arithmetic, Matrix Reasoning, Digit Span, Similarities,
Vocabulary, Comprehension, and Information. These non-significant correlations are not
surprising considering the lack of abstract reasoning or problem solving involved in
completing FTT with the dominant hand. Due to the nonverbal and motor dependent
nature of the FTT, it would be expected for the verbal subtests of Similarities,
Comprehension, Vocabulary, and Information to be the least related to the test.
For the WAIS-IV, all of the subtests had positive correlations with FTT dominant
hand performance. Thus, as performance on intellectual subtests increased, FTT
dominant performance increased. Only Visual Puzzles, Block Design, Coding, and Digit
Span were significantly correlated with FTT dominant hand performance.
The highest correlated WAIS-IV subtest was Visual Puzzles, which is a new
subtest to the WAIS and designed to make the test a better measure of frontal, executive
skills. While the FTT is not necessarily a measure of executive skills, it was not a surprise

67
that Visual Puzzles was strongly correlated with FTT dominant hand performance, as
simple motor skills are partially controlled and accommodated by the frontal lobes
(Luria, 1973). The next most highly correlated WAIS-IV measure with FTT dominant
hand performance was the Block Design subtest, a timed motor dependent measure, as
described earlier. As described in the WAIS-III FTT dominant hand discussion, it was
not surprising that the measure was significantly related to FTT dominant hand
performance. The third most highly correlated subtest was the WAIS-IV Coding subtest.
The high correlation observed was not surprising considering the subtest shares some
similar characteristics with FTT performance with the dominant hand. The Coding
subtest assesses processing speed, with a graphomotor component required in the
transcription of symbols, which would be an element of the skills assessed by
performance on FTT with the dominant hand. The WAIS-IV Digit Span subtest was the
fourth most highly correlated test with FTT dominant hand performance, again, showing
the relationship with the two measures and reaction time. The remaining order of non-
significantly correlated subtests was Arithmetic, Symbol Search, Matrix Reasoning,
Similarities, Vocabulary, and Information. The analysis of the correlations shows that
Symbol Search was not significantly related to FTT dominant hand performance, which
was of interest considering the processing component of the test as well as the motor
dependent functions of the test. It was not surprising that Arithmetic and Matrix
Reasoning were not significantly correlated with FTT dominant hand performance, as the
FTT does not assess problem solving or executive skills nor does it require visuospatial
skills or verbal abilities to complete the task.
The observed differences in the correlations show that there are only minor

68
differences in the relationship between FTT dominant hand performance and the
processing and motor dependent measures of the WAIS-III and WAIS-IV. Neither the
WAIS-III or the WAIS-IV subtests showed more significant relationships with FTT
dominant hand performance and the correlation values were not substantially different for
either version of the test. It does not appear that the changes to the subtests greatly
changed the relationship with motor speed or reaction time, as measured by a
neuropsychological measure.
Visual Puzzles had the highest value and was the most highly correlated subtest
with FTT dominant hand performance across the WAIS-III and the WAIS-IV. These high
correlations with the new subtest on the WAIS-IV likely shows the tests relationship with
frontal lobe functioning, which mediates motor functions as well as the strong reaction
time component, as Visual Puzzles has a timed component, which obviously influences
individuals performance on the task similar to FTT dominant hand. While both
processing speed measures of Symbol Search and Coding were significantly correlated
for the WAIS-III, only Coding was significantly correlated for the WAIS-IV. This is
likely explained by the proposed decrease in motor demands and motor processing for
Symbol Search on the WAIS-IV. It should be noted that none of these differences in
correlations are substantial differences in correlation values. Working memory measures
revealed significant correlations for dominant performance on the FTT, such as Letter
Number Sequencing on the WAIS-III and Digit Span on the WAIS-IV. It is believed that
the reaction required in these tasks is responsible for the observed relationships.
With the changes to the WAIS-IV, it would be expected that the PSI subtests of
Coding and Symbol Search as well as the PRI subtest of Block Design would be more

69
highly correlated with dominant hand performance on the FTT than the WAIS-III
subtests of Symbol Search and Digit Symbol Coding and the PRI subtest of Block
Design, due to the decreased motor demands and an increased relationship to processing
speed. The results of the Pearson correlation comparisons had surprising findings of the
highest correlations with dominant hand performance on FTT being Visual Puzzles. The
next highest correlations of Block Design and Coding were more expected than the
Visual Puzzles outcome with the dominant hand FTT performance. Both measures
contain motor and timed components and were expected to be more strongly correlated
with dominant hand performance on the FTT.
There was a lack of a significant relationship between Symbol Search and
performance on the WAIS-IV. The WAIS-III Symbol Search subtest was significantly
correlated with dominant hand performance on the FTT. While the differences are not
significant, qualitatively the differences in the relationship between the WAIS-IV Symbol
Search and the WAIS-III Symbol Search did meet the goal of eliminating motor demands
on the subtest. The Coding subtest continues to be significantly correlated with the FTT
for both the WAIS-III and WAIS-IV and had a higher correlation with the WAIS-IV,
meaning that the measure continues to have higher motor demands.
In regards to the analyses for the non-dominant hand performance on the FTT, the
analyses showed that the WAIS-III was not a significant predictor of non-dominant hand
performance for the FTT. The regression model with the WAIS-IV subtests was able to
significantly predict non-dominant hand performance on the FTT. Despite the WAIS-IV
regression model showing significance when the WAIS-III model did not, the WAIS-IV
regression model was not a statistically significant better predictor over the WAIS-III for
70
non-dominant hand performance on the FTT. These findings are consistent with the
findings with the FTT dominant hand.
For the FTT non-dominant hand, further examination of the relationship between
the two versions revealed that there were no observed differences in the most significant
predictors of FTT non-dominant hand performance in the regression models for the
different versions of the WAIS. For the WAIS-III, the overall regression was not
significant and no analysis of the individual predictors was conducted. For the WAIS-IV,
the overall regression was significant, but none of the individual predictors significantly
predicted performance on FTT with the non-dominant hand over and above the other
predictors in the regression model.
Pearson correlations were examined to further assess the relationship between the
two versions of the WAIS and FTT non-dominant performance. For the WAIS-III, all of
the subtests had positive correlations with FTT non-dominant performance with the
exception of Comprehension, which had a small negative correlation with FTT non-
dominant performance. The observed correlations showed that for all subtests, except
Comprehension, as the number of non-dominant hand taps increased on the FTT the raw
scores on the subtests increased. Thus, better performance by the non-dominant hand on
the FTT led to better performance on all subtests, except Comprehension. For the
Comprehension subtest, as FTT non-dominant hand performance increased performance
on Comprehension decreased.
The only significant correlations with WAIS-III and FTT non-dominant
performance were Symbol Search and Digit Symbol Coding. This finding of significant
correlations between the two processing speed measures with motor processing

71
components was what would be expected with FTT non-dominant performance, which is
strictly associated with reaction time, motor speed, and motor performance. The order of
the other non-significant correlations are as follows: Picture Completion, Block Design,
Letter Number Sequencing, Digit Span, Picture Arrangement, Arithmetic, Matrix
Reasoning, Similarities, Information, Vocabulary, and Comprehension. These non-
significant correlations are not surprising, considering the lack of verbal skills tapped by
non-dominant hand finger tapping. While Block Design contains a motor component, as
can Picture Completion, these motor components are likely better assessed through FTT
dominant hand performance over FTT non-dominant hand performance. The reasons for
this include the fact that the dominant hand is likely used for Picture Completion as
individuals are more likely to point with their dominant hand and motor speed itself does
not play a role in the completion of the task. Picture Completion is a timed task and
speeded processing and reaction time likely play a large role and are better assessed with
FTT dominant hand performance.
For the WAIS-IV, all of the subtests were positively correlated with FTT non-
dominant performance. As FTT non-dominant hand performance improved, performance
on the subtests of the WAIS-IV improved. Only two of the subtests were significantly
correlated with FTT non-dominant performance. The highest correlated WAIS-IV subtest
was Visual Puzzles, which is a new subtest to the WAIS and designed to make the test a
better measure of frontal, executive skills. The test does not contain a motor component,
but it is likely that the relationship is linked to the frontal nature of motor initiation and
movement. The next most highly correlated WAIS-IV measure with FTT non-dominant
performance was the Coding subtest, assessing visual discrimination and processing

72
speed, with a motor component required to transcribe the symbols. The remaining order
of non-significantly correlated subtests was Block Design, Digit Span, Matrix Reasoning,
Information, Similarities, Symbol Search, and Vocabulary. Similar to the WAIS-IV
findings for the FTT dominant hand performance, it was surprising that the Symbol
Search subtest of the WAIS-IV was not significantly correlated with performance on FTT
non-dominant performance, which would be expected considering the processing nature
and motor components of the task. The results likely show that the motor demands of the
subtest were decreased, as was the goal of the design of the new Symbol Search subtest.
It was not surprising that Arithmetic and Matrix Reasoning were not significantly
correlated with FTT non-dominant hand performance, as the FTT does not assess
problem solving or executive skills nor does it require visuospatial skills to complete the
task and the subtests do not contain motor speed or motor components. It was not
surprising that the verbal measures were the least correlated with FTT non-dominant
hand performance, as there are no verbal abilities tapped by FTT.
The observed differences in the correlations show that for the WAIS-III the PSI
subtest of Symbol Search and Coding were the only significantly correlated subtests with
FTT non-dominant hand performance. Only Coding from the WAIS-IV PSI measures
was significantly correlated with FTT non-dominant performance. It is likely that the
changes made to the Symbol Search subtest met the goal of decreasing motor demands on
the task. The WAIS-IV Coding subtest contains more motor demands that are required in
the transcription of symbols. It should be noted that none of the observed differences in
correlations were significant from the WAIS-III to the WAIS-IV and any discussion of
difference reflect qualitative changes and discussion in the differences in the order or

73
significant of correlations over significant differences in the correlations from one
version to the other.
Visual Puzzles was the most highly correlated subtest with FTT non-dominant
hand performance across the WAIS-III and the WAIS-IV. This could be due to the more
integrated frontal component of the new subtest, which could show the frontal connection
between motor movement initiation and Visual Puzzles. The finding was unexpected and
warrants discussion, which is done below.
With the changes to the WAIS-IV, it would be expected that the PRI subtest of
Block Design would be more highly correlated with non-dominant hand performance on
the FTT, due to the motor demands involved in the task. The results of the Pearson
correlation comparisons had surprising findings that the Block Design subtest of the
WAIS-IV was not significantly correlated with FTT non-dominant hand performance.
Both measures contain motor and timed components and Block Design was expected to
be more strongly correlated with dominant hand performance on the FTT. The fact that
the measure was not correlated with FTT non-dominant hand performance could be due
to the decrease in the timed bonus, which may decrease the reaction time component of
the task as well as the speed motor demands. The non-dominant hand performance on
FTT is not as closely related to a pure measure of psychomotor speed as the dominant
hand performance, which is usually higher than that of the non-dominant hand.
The differences between FTT dominant and non-dominant performance show that
the FTT dominant hand performance bore a stronger relationship with measures of
reaction time and psychomotor speed than the non-dominant hand, as would be expected.
The FTT dominant hand performance showed significant relationships with Visual

74
Puzzles, Block Design, Coding, and Digit Span. In contrast, the non-dominant hand only
had a significant relationship with Visual Puzzles and Coding.
An interesting finding was the significantly correlated relationship between
performance with the dominant and non-dominant hand of the FTT with performance on
the WAIS-IV Visual Puzzles subtest. The finding was not predicted, but as stated earlier,
likely shows the frontal lobe activities assessed by the two tasks. It shows the importance
of the speeded reaction time and speeded processing involved in both tasks. While the
timed component of Visual Puzzles might not be expected to play a large role in
performance on the task, these results show that reaction time and speed likely do play a
role in performance on Visual Puzzles.
The WAIS-IV Symbol Search had a decrease in the size of the correlation from
dominant hand performance to non-dominant hand performance. It may be assumed that
this was due to the writing portion of Symbol Search that was only completed with the
dominant hand. This would be expected to be true for Coding as well, but it was not. It
could be that the Coding subtest, which actually had a slightly larger correlation with the
non-dominant hand is less influenced by graphomotor speed and is more influenced by
reaction time and general psychomotor speed, as shown by performance with the non-
dominant hand.
The dominant and non-dominant analyses of FTT show that the attempts to
decrease the motor demands for Symbol Search on the WAIS-IV appear to have been
successful. The WAIS-IV Symbol Search subtest was not significantly correlated with
FTT performance with the dominant or non-dominant hand, as to where the WAIS-III
version of the subtest was significantly correlated with both the dominant and non-

75
dominant hand performance on the FTT. There was not a substantial change in the size of
the correlations from WAIS-III to WAIS-IV but the lack of a significant relationship was
note worthy. It would appear that there was not a significant decrease in the motor
demands required for the WAIS-IV Coding, as the subtest was significantly related to
FTT dominant and non-dominant hand performance. It was significantly correlated with
both FTT components for the WAIS-III, with very little change in the magnitude of the
correlation from the WAIS-III to the WAIS-IV.
Hypothesis 4
The fourth hypothesis stated that performance on the WAIS-IV subtests would be
a better predictor of performance on Trails A than performance on the WAIS-III subtests.
Changes made to the WAIS-IV were proposed to make the test a better measure of
processing speed, thus leading to the hypothesis that the WAIS-IV would be a better
predictor of performance on Trails A, a measure of visual scanning and processing speed.
The hypothesis was not supported by the current analyses.
Processing speed is defined as the ability to process information quickly
(Lichtenberger & Kaufman, 2013). It is thought to be a complex construct that plays a
pivotal role in higher level cognitive functioning. Impairments in processing speed can
result in impairments in other areas of cognitive abilities (O’Brien & Tulsky, 2008).
Processing speed is typically measured by tasks of timed psychomotor performance and
reflects an individual’s cognitive efficiency and ability to perform simple psychomotor
tasks quickly and efficiently. The processing speed subtests of the WAIS-IV were
designed to measure processing speed in a nonverbal format. The primary constructs
assessed by the processing speed tasks of the WAIS are visual processing speed, motor

76
processing speed, and visual-motor processing speed (Lichtenberger & Kaufman, 2013).
There are additional constructs that influence performance on processing speed measures
that include visual discrimination, visual attention, sustained attention, memory, and
understanding instructions (Golden et al., 2000). These tests of processing speed are
influenced by motor impairment, difficulties concentrating and understanding
instructions, anxiety and depression, hyperactivity, motivation, fatigue, and low
frustration tolerance (Golden et al., 2000).
The WAIS-IV PSI is made up the two subtests, Coding and Symbol Search. The
Coding subtest measures the individual’s ability to quickly and accurately scan and
sequence simple visual information. The subtest may be influenced by short-term visual
memory, attention, or visual-motor coordination. The Coding subtest of the WAIS is
much more likely to be influenced by graphomotor skills than the Symbol Search subtest
of the WAIS, due to the transcription of symbols as opposed to making simple marks
over symbols or boxes. Symbol Search requires an individual to scan target symbols and
a set of symbols to find if there are is a target symbol that matches a symbol displayed in
the set of symbols provided to the right of the target symbols. The measure requires speed
and accuracy as well as visual scanning. The Symbol Search subtest can be influenced by
visual discrimination and visual-motor coordination (Lichtenberger & Kaufman, 2013).
In order to make the processing measures clearer measures of processing speed,
as well as making other measures less dependent on processing speed, timed bonuses
were reduced and graphomotor and motor demands were reduced for the WAIS-IV.
Other changes to the PSI subtests include bolder and larger symbols designed to reduce
visual concerns. For Symbol Search, the examinee now marks the symbol as opposed to a
77
“YES” box, which provides a qualitative examination of errors made by the examinee.
For the Coding subtest, there is larger vertical space between the key and top of the page
in order to decrease issues with left-handed examinees blocking the key from their view
while completing the task. The numbers were randomized and appear an equal number of
times across each row, ensuring an equal exposure to each paired number and symbol.
Like Symbol Search, the numbers and symbols are presented in a bolder fashion,
decreasing issues with visual acuity. The instructions involved in the WAIS-IV
processing speed subtests emphasize a greater degree of teaching than the WAIS-III. All
individuals are taught to complete the subtests in the same manner, in order to decrease
the impact of individual learning differences and comprehension difficulties that can
impact performance on processing speed measures (Raiford, Coalson, Saklofske &
Weiss, 2010).
Similar to the processing speed measures of the WAIS-III and WAIS-IV, Trails A
is a measure of visual scanning and processing speed, with a graphomotor component
that requires the individual to draw lines connecting the numbers 1 through 25 in
sequential order as quickly as possible. The measure requires an individual to recognize
numbers and scan the page continuously to indentify the sequence of the numbers under
the pressure of time. Poor performance on Trails A is generally due to difficulties with
motor speed or visual scanning. It would be expected that performance on Trails A would
be predicted by the processing measures on the WAIS. Specifically, since the WAIS-IV
is designed to be a purer measure of processing, it would be expected that the WAIS-IV
would be a better predictor of Trails A performance than its predecessor.
It was expected that the WAIS-IV subtest of Digit Span would be a better
78
predictor of performance on Trails A, due to changes to the test from the previous
version. For the WAIS-IV, a sequencing component was added to the subtest to make it a
higher load working memory measure. The change was expected to show a stronger
relationship with Trails A, which has a mental sequencing, as the individual is required to
sequence numbers in order to complete the task.
While Trails A and the processing measures of WAIS-IV and the Digit Span
subtest of the WAIS-IV have similarities, the tests have some differences. Trails A has
less of a graphomotor component and fewer motor demands, as the task only requires
drawing lines to numbers in sequential order as opposed to the transcription of symbols
required for the WAIS-IV Coding subtest. Trails A has less of a visual discrimination and
visual attention component than the WAIS-IV Symbol Search subtest, because the
individual is only required to visually scan for numbers as opposed to scan and attend to
differences in symbols that sometimes include more subtle differences. While the
sequencing component of the WAIS-IV Digit Span subtest may tap similar abilities as the
sequencing involved in Trails A, the sequencing component of Digit Span requires the
individual to attend to the numbers heard and mentally put them in sequential order.
These numbers that the individual hears during the Digit Span subtest are not in natural
order and are often numbers repeated, unlike Trails A that requires the individual to
simply go from 1 to 25 in sequential order and are provided visually.
The results of the current analyses show that, while both versions of the WAIS are
able to significantly predict performance on Trails A, there are differences in subtests that
significantly predict performance on the measure. For the WAIS-III, no one subtest was
able to significantly predict performance on Trails A over and above the other subtest and

79
age and education. For the WAIS-IV, Coding was able to significantly predict
performance on Trails A over and above the other subtest and age and education. It
would appear that the changes made to the Coding subtest on the WAIS-IV does make
the subtest a better measure of processing speed and more consistent with a traditionally
used neuropsychological measure of processing speed. The lack of significant predictive
ability shown for Symbol Search leads to questions regarding the utility of the measure as
an assessment of processing speed and the utility of the changes made to make the
measure more consistent with neuropsychological measures of processing speed.
In order to further evaluate the two versions of the WAIS and how these changes
impact the relationship between the subtests of both versions and Trails A, Pearson
correlations were examined to further assess the relationship. For all of the WAIS-III
subtests, there was a significant negative correlation with performance on Trails A, with
the exception of Comprehension, which had a negative correlation that was not
significant. The negative correlations show that as time to complete Trails A increased
raw scores on the subtests of the WAIS-III decreased, meaning that poorer performance
on Trails A related to poorer performance on the WAIS-III subtests. The order of the
correlations showed that Symbol Search was the most highly correlated subtest with
Trails A performance, followed by Digit Symbol Coding, Letter Number Sequencing,
Digit Span, Arithmetic, Block Design, Matrix Reasoning, Picture Completion,
Similarities, Picture Arrangement, Information, and Vocabulary.
These correlations show that the relationship between the subtest of the WAIS-III
and performance on Trails A are what would be expected, with the processing speed
subtests the most significantly correlated with performance on Trails A. The third, fourth,

80
and fifth most significantly correlated subtests with performance on Trails A were
subtests linked with working memory, which likely shows a relationship to Trails A in
that the measure requires keeping track of a running string of numbers while completing
the task. The results also show the close working relationship between working memory
and processing speed. The remaining order of the correlations was not surprising
considering that Trails A does not contain a significant visuospatial or problem solving
component like Block Design and Matrix Reasoning. There was not a substantial verbal
component to the test and the verbal subtests of the WAIS-III would not be expected to
be as highly correlated with the measure. Picture Completion was the eighth most highly
correlated test with performance on Trails A. It would be expected that the visual
attention component under the pressure of time required to complete the subtest might
make it more highly correlated with the Trails A than was found in the analyses. The
finding is likely due to the more complex nature of the visual attention involved in
Picture Completion.
For the WAIS-IV, all subtests revealed significant negative correlations with
performance on Trails A, with the exception of the Vocabulary and Information subtests
that were negatively correlated but were not statistically significant. These correlations
show that as performance on Trails A became poorer so did performance on the subtests
of the WAIS-IV. Thus, as time to complete Trails A increased, raw subtest scores
decreased. The most highly correlated subtest for performance on Trails A was Coding,
followed by Symbol Search, Arithmetic, Visual Puzzles, Block Design, Matrix
Reasoning, Similarities, and Digit Span.
Similar to the findings with the WAIS-III, it was not surprising that the processing

81
speed subtests were the most highly correlated with Trails A performance. The working
memory subtest of Arithmetic was highly correlated with performance on Trails A, which
was not surprising considering the close relationship between working memory and
processing speed, as well as the working memory component required for completion of
Trails A through mentally sequencing numbers. Digit Span was not as highly correlated
and was the lowest significant correlation. This was surprising considering the
sequencing component added to the subtest and was expected to make the measure more
closely related to performance on Trails A, a measure that requires sequencing of
numbers. The lack of a high relationship between the two tests could show the difference
between the auditory and visual formatting of the two measures. The remaining order of
the correlations was not surprising considering that Trails A did not contain a significant
visuospatial or problem solving component like Visual Puzzles, Block Design and Matrix
Reasoning. There was no real verbal component to the test and the verbal subtests of the
WAIS-IV would not be expected to be as highly correlated with the measure.
While the results of the analyses did not show a significant difference in the
overall predictive abilities of the WAIS-IV over the WAIS-III, there were differences in
the contribution of individual subtests, as Coding was able to significantly predict
performance over and above the other variables in the model. There were no substantial
differences in the correlation between the subtests of the WAIS-III and Trails A and the
WAIS-IV and Trails A. Thus, the changes to the WAIS-IV did not significantly change
the relationship between the subtests and performance on Trails A.
Hypothesis 5
For performance on Trails B, hypothesis five hypothesized that the WAIS-IV

82
model would be a significantly better predictor of performance on the task over the
WAIS-III model. Based on the changes to the WAIS-IV that included a stronger measure
of processing speed, a more integrated measure of frontal lobe functioning in Visual
Puzzles, and a higher load working memory component, in particular, a sequencing
component on Digit Span, it was expected that the WAIS-IV would be a better predictor
in performance for Trails B. The hypothesis was not supported by the current analyses.
Trails B is a test that assesses cognitive flexibility, set shifting, sequencing ability,
and visual-motor tracking, while having a substantial attentional and inhibition
component. Processing speed and working memory are a large factor in performance on
the test, as is cognitive flexibility, a higher order executive skill. Trails B requires the
individual to switch between two sequentially running sets and draw a line that connects,
first, a number and then a letter beginning with 1 and then A. Impulsive errors that
involve going from a number to a number despite being told to alternate between
numbers and letters are often seen in individuals with brain injuries. Depression and other
emotional conditions, as well as mild head injuries can have a slowing effect on Trails B.
The main abilities assessed by Trails B are housed in the frontal lobe, such as complex
attention as well as the inhibition required to not respond to irrelevant stimuli. When
damage occurs in the frontal lobes, individuals have difficulty staying on task and are
distracted by irrelevant stimuli. Individuals with frontal lobe injuries are unable to inhibit
responses. The frontal lobes are responsible for the inhibition of responses and the
preservation of goal-directed behavior (Luria, 1973). In completing the Trails B task,
individuals are required to inhibit a response in order to alternate between the running
sets of numbers and letters. Thus, errors occur when an individual displays cognitive

83
inflexibility and is unable to inhibit a response and switch between the set of numbers
and letters.
Processing speed is defined as the ability to process information quickly
(Lichtenberger & Kaufman, 2013). It is thought to be a complex construct that plays a
pivotal role in higher level cognitive functioning. Impairments in processing speed can
result in impairment in other areas of cognitive abilities (O’Brien & Tulsky, 2008).
Processing speed is typically measured by tasks of timed psychomotor tasks that reflect
an individual’s cognitive efficiency and ability to perform simple psychomotor tasks
quickly and efficiently. The processing speed subtests of the WAIS-IV were designed to
measure processing speed in a nonverbal format. The primary constructs assessed by the
processing speed task of the WAIS are visual processing speed, motor processing speed,
and visual-motor processing speed (Lichtenberger & Kaufman, 2013). There are
additional constructs that influence performance on processing speed measures that
include visual discrimination, visual attention, sustained attention, memory, and
understanding instructions (Golden et al., 2000). These tests of processing speed are
influenced by motor impairment, difficulties concentrating and understanding
instructions, anxiety and depression, hyperactivity, motivation, fatigue, and low
frustration tolerance (Golden et al., 2000). The WAIS-IV was designed to be a better
measure of processing speed. Decreases in motor demands as well as a decrease in visual
acuity were goals of the newest version of the WAIS, in order to make the test a purer
measure of processing speed. Because Trails B has a strong processing speed component,
it would be expected that subtests designed to be better measures of processing speed
would be better predictors of performance on Trails B. The results of the analyses did not

84
support the hypothesis.
The hypothesis was proposed because of the addition of Visual Puzzles to the test,
which, while a related nonverbal measure of intelligence, adds to the WAIS-IV over and
above Block Design and Matrix Reasoning in that it assesses more of an integrative
frontal, executive process than both Block Design and Matrix Reasoning. With the
inclusion of a timed component to puzzle manipulation and spatial reasoning, the
integrative features of Visual Puzzles were proposed to influence more frontal lobe
functions over and above the other nonverbal tests from the WAIS-III in that the task
requires frontal skills of hypothesis formation, mental flexibility, planning, problem
solving, and conceptualization. The task taps more of the frontal lobe functions that are
assessed by Trails B as opposed to only the flexibility component that is more consistent
with the untimed problem solving of Matrix Reasoning and timed in Block Design but
where there is more emphasis on visuospatial reasoning and skills.
The frontal lobes possess a group of abilities known as the executive skills,
include attention, reasoning, judgment, problem solving, creativity, emotional regulation,
impulse control, and awareness of one’s functioning (Scott & Schoenberg, 2011). Luria
(1973) discussed the simple to complex processes involved in higher order executive
skills that are produced in the frontal lobes. According to Luria (1973), the frontal lobes
are responsible for the regulation of complex intellectual processes and voluntary
attention. Visuoconstruction, visual reasoning, and problem solving, as measured by
Block Design and Matrix Reasoning, are some nonverbal abilities partially assessed by
the frontal lobes. The perception of shapes as assessed in Block Design, Matrix
Reasoning, and Visual Puzzles is an active process, which requires the individual to

85
search for the most important elements of information, compare them, create a hypothesis
concerning the meaning of the design as a whole, and then verify the hypothesis by
comparing it with the original elements of the objects or designs seen.
Over and above these shared aspects of the three PRI subtests of the WAIS-IV,
the new subtest addition of Visual Puzzles was designed to assess the more complex and
integrated ability of executive skills that is more heavily influenced by frontal lobe
functioning and requires the individual to develop and test hypotheses based on give rules
under timed constraints. The integrated process taps frontal lobe functions in that an
individual must test and develop hypotheses. Visual Puzzles, like Trails B, requires the
individual to use cognitive flexibility and psychomotor speed. This program of analysis
and synthesis requires switching from various operations and hypotheses, which can be
disrupted with frontal lobe conditions (Luria, 1973). Individuals with frontal lobe
conditions have difficulty switching and testing hypotheses and are easily distracted,
making it difficult for them to perform the correct analysis and synthesis of material to
generate and test hypotheses to complete the tasks. This produces inflexibility in the
problem solving approach, as they are often unaware of their mistakes and unable to
correct them (Luria, 1973). This is similar to the inflexibility observed with Trails B,
when an individual is unable to shift between sets and both are mediated by the frontal
lobes.
Based on this more integrative process as well as the more integrative process of
the Trails B, it would be expected for the new subtest to add more predictive ability to the
performance on Trails B over and above Block Design and Matrix Reasoning, which
contain less integrated assessments of executive skills and are less frontal in nature and

86
can be more spatially oriented. Despite these similarities and the focus towards a more
integrated measure of frontal lobe functioning and executive abilities, the current
analyses do not support the hypothesis. The Visual Puzzles subtests did not significantly
add to the predictive model of the WAIS-IV over and above the WAIS-III predictive
model.
Not only was the Visual Puzzles test expected to make the newest version of the
WAIS more consistent with Trails B but the WAIS-IV was designed to be a stronger
measure of working memory, which is another ability tapped by Trails B. Working
memory is assessed by Trails B through the individual being required to mentally hold
information and continue alternating sets of numbers and letters in sequential order. On
the WAIS-III working memory is assessed through Digit Span, Arithmetic, and Letter
Number Sequencing. For the WAIS-IV working memory is assessed through two subtests
of Digit Span and Arithmetic. The WAIS-IV was designed to be a better measure of
working memory (i.e., the ability to actively maintain information and mentally
manipulate it in order to produce a result). Specifically, the Digit Span subtest was
redesigned to decrease rhyming numbers and a sequencing portion was added that
requires the individual to perform a more complex working memory task than the
previous version of Digit Span that contained only forwards and backwards. The specific
sequencing component would be expected to be more consistent with sequencing abilities
tapped by Trails B. These changes are relevant to performance on Trails B, as parts of the
test are strongly related to and directly require working memory skills to mentally hold
two sets of sequential numbers and letters. Despite these changes that were proposed to
make the test a better predictor of performance on Trails B, the current results show that

87
the WAIS-IV was not a significantly better predictor of performance on Trails B than the
WAIS-III.
While Visual Puzzles, Digit Span, and the PSI subtests and Trails B do tap similar
abilities, the tests are not without their differences. Trails B is an integrated measure of
the abilities assessed by the various measures of the WAIS-IV. Trails B is considered to
be a good measure of cerebral dysfunction and contains more cognitive flexibility and
set-shifting components. Like the new sequencing component of the Digit Span subtest,
Trails B requires sequencing, but unlike Digit Span’s sequencing component, Trails B
requires shifting or alternating between a set of numbers and letters simultaneously as
part of the sequencing component, as opposed to simply sequencing numbers. Thus,
Trails B is a more difficult task. Trails B is presented in a visual format as opposed to
auditory format, like Digit Span. In regards to the PSI subtests and Trails B, Trails B has
less of a graphomotor component and fewer motor demands, as the task only requires
drawing lines to numbers in sequential order as opposed to the transcription of symbols
required for the WAIS-IV Coding subtest. Trails B has less of a visual discrimination and
visual attention component than the WAIS-IV Symbol Search subtest, because the
individual is only required to visually scan for numbers and letters as opposed to
scanning and attending to differences in symbols that sometimes include only subtle
differences. In regards to Visual Puzzles and Trails B, Trails B requires a graphomotor
component and less of a demand for visuospatial skills. Trails B does not require
visuospatial problem solving.
Further examination of the relationship between the two versions and Trails B
revealed that there were no observed differences in the most significant predictors of
88
Trails B performance for the different versions of the WAIS, in that no subtest was able
to significantly predict performance over and above the other subtests and age an
education. The lack of differences are of interest because the changes to the WAIS-IV
discussed earlier would be expected to show different predictive abilities of the subtests.
Pearson correlations were examined to further assess the relationship between the
two versions of the WAIS and performance on Trails B. For the WAIS-III, all of the
subtests had significant negative correlations with performance on Trails B, with the
exceptions of Comprehension and Vocabulary. Thus, the correlation analyses indicate
that as the raw scores for the subtests increased (i.e., performance improved) the amount
of time to complete Trails B decreased, indicating better performance on Trails B.
The WAIS-III subtest most highly correlated with performance on Trails B was
Symbol Search, Matrix Reasoning, Arithmetic, Letter Number Sequencing, Digit Span,
Picture Completion, Digit Symbol Coding, Picture Arrangement, Block Design,
Similarities, and Information. The Symbol Search subtest was the highest correlated
subtest, which likely shows the relationship between processing and psychomotor speed
used with both the subtest and Trails B. Matrix Reasoning was the second most highly
correlated subtest with Trails B, indicating the cognitive flexibility required for both
tasks. Matrix Reasoning requires cognitive flexibility in being able to formulate
hypotheses and problem solve to find patterns in the stimuli provided, while Trails B
requires cognitive flexibility in alternating between two running sets of numbers and
letters. Arithmetic was the next most highly correlated WAIS-III subtest with Trails B,
showing the use of working memory used for the subtest and Trails B and showing the
relationship between working memory and processing speed as well as executive

89
functions. The same is true for the next highest correlations of Letter Number Sequencing
and Digit Span. Picture Completion’s correlation with Trails B is likely due to the
relationship of visual attention under timed constraints required for both measures. Digit
Symbol Coding being one of the subtest less significantly correlated with Trails B
performance was surprising considering the processing and psychomotor speed
similarities of both tasks. The lower relationship could be due to the more complex
psychomotor speed required for Digit Symbol Coding. Due to the nonverbal nature of
Trails B, it would be expected for the verbal subtests of Similarities, Comprehension,
Vocabulary, and Information to be less strongly correlated with performance on Trails B.
All of the subtests of the WAIS-IV had significant negative correlations with
Trails B. Similar to the WAIS-III results, as performance time on Trails B increased raw
scores on the subtests decreased. The results show that poorer performance on Trails B
was indicative of poorer performance on the subtests of the WAIS-IV.
For the WAIS-IV, the highest correlated subtest was Coding, which was not
surprising considering the processing and psychomotor components of each measure. The
second most highly correlated WAIS-IV subtest with performance on Trails B was
Arithmetic, which likely reflects the strong working memory and processing speed
relationship, while showing the working memory component of Trails B required to
mentally hold to different sequential sets of information. Visual Puzzles was the third
most highly correlated subtest with performance on Trails B. The observed relationship
shows the executive and frontal lobe abilities tapped by both Visual Puzzles and Trails B.
The PSI subtest of Symbol Search was the fourth most highly correlated subtest with
performance on Trails B. The relationship shows the visual attention, visual scanning,

90
and processing and psychomotor speed required for each measure. Block Design was the
next most highly correlated subtest with Trails B, indicating the psychomotor and
flexibility required for each task as well as the motor components of the tests. Digit Span
was the sixth most highly correlated subtest with Trails B performance. The observed
relationship was expected to be higher, given the sequencing component added to the
new version of the subtest that is similar to the sequencing component of Trails B. The
lack of a stronger relationship to the subtest is likely due to the differences in the visual
and auditory presentation differences as well as the fact that the sequencing component of
the subtest that only makes up a third of the subtest. Similarities was the next most highly
correlated subtest with performance on Trails B that could show the low relationship with
verbal measures and Trails B. The verbal abstract reasoning involved in Similarities does
have a relationship to the cognitive flexibility involved in Trails B. Matrix Reasoning was
the eighth most highly correlated subtest with performance on Trails B, which was
surprising that it was not higher considering that both test require a high amount of
cognitive flexibility. The differences could show the differences in a timed and untimed
test and the fact that Matrix Reasoning does not have a speeded component nor does it
involve any motor abilities. Vocabulary and Information being the least correlated
subtests with Trails B performance was not surprising considering that Trails B does not
required verbal abilities.
The observed correlations show that, as would be anticipated, the processing and
psychomotor speed and executive skills measures are strongly related to Trails B and
higher order cognitive abilities such as cognitive flexibility. The correlations show that
mental arithmetic (i.e., mental manipulation/working memory) are strongly related to

91
executive abilities. Digit Span from the WAIS-III as well as Digit Span from the WAIS-
IV were not as strongly correlated as might be expected, given the working memory
component of the measures as well as the new sequencing component of the WAIS-IV
Digit Span. The new sequencing component that was added to the WAIS-IV Digit Span
subtest, as a proposed way to make a higher load working memory measure was expected
to make the measure more consistent with Trails B that has a strong sequencing aspect.
The results of the correlation analyses indicate that the sequencing component of the
WAIS-IV Digit Span subtest did not add to the neuropsychological utility of the measure,
in that the measure does not appear to be any more highly related to Trails B, which
requires an amount of working memory abilities for a portion of the test, than the WAIS-
III version with only forward and backward digit span. While the hypothesis was not
supported, the order of significant correlations for the WAIS-IV shows that the changes
to the WAIS-IV did result in closer relationships with the subtests proposed to measure
fluid reasoning and a widely used neuropsychological measure of fluid reasoning. The
processing speed subtest showed significant relationships with performance on Trails B,
as would be expected considering the processing component.
Hypothesis 6
The sixth hypothesis stated that the subtests of the WAIS-IV would be better
predictors of performance on the WCST, specifically in the number of perseverative
errors, than would the WAIS-III. The changes to the WAIS-IV to make the measure more
consistent with neuropsychological measures like executive abilities and processing
speed and working memory were expected to make the WAIS-IV a better predictor of
performance on the WCST than the WAIS-III. The hypothesis was not supported by the

92
current analyses.
The WCST is a widely used neuropsychological measure that assesses executive
functions, particularly problem-solving, abstraction, hypothesis generation and testing,
learning, incorporating feedback, and set-shifting, all mediated by the frontal lobe. In
addition, the measure involves other abilities like attention and concentration, which are
required for the individual to keep track of the present category to which he/she is
matching. To complete the task, the individual is asked to match a deck of cards with one
of four stimulus cards without being told how to match the card. After attempting to
match the card, the individual is told whether the match was correct or incorrect. The
individual must incorporate the feedback received in order to make an attempt at finding
the correct match for the next card in the deck. Performance on the WCST produces
several scores, but the most consistent with frontal lobe issues is the perseverative errors
score. Perseverative errors on the WCST are defined as an individual continuing with a
certain category despite receiving feedback that the category is incorrect. A perseverative
error is indicative of difficulties with set-shifting and cognitive flexibility as well as
difficulties incorporating feedback. The frontal lobe mediates these activities, as
individuals with frontal lobe difficulties often display perseverative errors and difficulty
with cognitive flexibility. Individuals with frontal lobe damage may make little attempt to
examine the conditions of the problems and, thus, attempt to problem solve impulsively,
without a plan. These individuals do not compare their answers with the original
conditions of the task and have do not incorporate feedback well, as they are not aware of
the futility of their solution. These individuals may display impulsive guesses as opposed
to true problem solving strategies (Luria, 1973).

93
Changes to the WAIS-IV were believed to make the test a better measure that
would be more closely related to neuropsychological measures and theory. The WAIS-IV
contains fewer time bonuses and fewer motor demands, which can negatively impact
neurologically impaired individuals unnecessarily. The most significant change that was
expected to yield significant changes in the prediction of performance on the WCST was
the redesigning of subtests that was intended to produce a stronger association and
perceived better measurement of fluid reasoning (i.e., ability to process/manipulate
abstractions, rules, generalization, and logical relationships), which are strongly
measured by the WCST and used in higher order cognitive processing and executive
skills. Specifically, not only did the designers of the WAIS-IV strive to make the PRI
subtests better measures of fluid reasoning by diminishing motor demands and timed
bonuses, a new subtest (i.e., Visual Puzzles) was added to the WAIS core battery in order
to be a better measure and make an overall better index measure of perceptual
reasoning/fluid reasoning/intelligence. These changes were expected to yield a greater
neuropsychological utility of the WAIS-IV because of the focus on underlying cognitive
principles and fewer extraneous variables that can impact raw scores and the achieved
intellectual scores.
The hypothesis was proposed because of the addition of Visual Puzzles to the test,
which, while a related nonverbal measure of intelligence, adds to the WAIS-IV over and
above Block Design and Matrix Reasoning in that it assesses more of an integrative
frontal, executive process than both Block Design and Matrix Reasoning. With the
inclusion of a timed component to puzzle manipulation and spatial reasoning, the
integrative features of Visual Puzzles were proposed to influence more frontal lobe

94
functions over and above the other nonverbal tests from the WAIS-III in that the task
requires frontal skills of hypothesis formation, mental flexibility, planning, problem
solving, and conceptualization. The task taps more of the frontal lobe functions that the
WCST measures as opposed to simply the spatial relations of the WCST that are more
consistent with Block Design and the untimed problem solving of Matrix Reasoning.
Matrix Reasoning, like WCST contains an untimed problem solving component in order
to complete the task. Thus, it would be expected to have a strong relationship with WCST
performance, though it would not be expected to be as highly related as the more frontal
task of Visual Puzzles.
The frontal lobe possesses a group of abilities known as the executive skills,
which include attention, reasoning, judgment, problem solving, creativity, emotional
regulation, impulse control, and awareness of one’s functioning (Scott & Schoenberg,
2011). Luria (1973) discussed the simple to complex processes involved in higher order
executive skills that are produced in the frontal lobes. According to Luria (1973), the
frontal lobes are responsible for the regulation of complex intellectual processes and
voluntary attention. Visuoconstruction, visual reasoning, and problem solving, as
measured by Block Design and Matrix Reasoning, are some nonverbal abilities partially
assessed by the frontal lobes. The perception of shapes as assessed in Block Design,
Matrix Reasoning, and Visual Puzzles is an active process, which requires the individual
to search for the most important elements of information, compare them, create a
hypothesis concerning the meaning of the design as a whole, and then verify the
hypothesis by comparing it with the original elements of the objects or designs seen.
Over and above these shared aspects of the three PRI subtests of the WAIS-IV,

95
the new subtest addition of Visual Puzzles was designed to assess the more complex and
integrated ability of executive skills that is more heavily influenced by frontal lobe
functioning and requires the individual to develop and test hypotheses based on give rules
under timed constraints. The test replaced the former subtest of Picture Completion of the
WAIS-III, which was not as highly correlated with WCST performance or other
executive measures and tended to rely more on visual attention. Visual Puzzles was
expected to be a measure of integrated functional lobe functioning. The integrated
process taps frontal lobe functions in that an individual must test and develop hypotheses.
Individuals with frontal lobe conditions are more likely to exhibit impulsive, fragmentary
guesses as opposed to intellectual activity and hypothesis testing required to adequately
complete the activity with the given set of rules and criteria (Luria, 1973). Visual
Puzzles, like WCST, requires the individual to understand the given material, formulate a
hypothesis, and test the hypothesis with the given set of rules in order to evaluate the
hypothesis and further resume solving problems. This program of analysis and synthesis
requires switching from various hypotheses, which can be disrupted with frontal lobe
conditions (Luria, 1973).
Individuals with frontal lobe conditions have difficulty switching and testing
hypotheses and are easily distracted, making it difficult for them to perform the correct
analysis of material to generate and test hypotheses to complete the tasks. This produces
inflexibility in the problem solving approach, as they are often unaware of their mistakes
and unable to correct them, even if told (Luria, 1973). When told of an incorrect
performance, individuals may show perseveration and continue with the same approach
even when told their approach is incorrect. The process of forming and executing a
96
program is difficult for individuals with frontal lobe lesions, as they are unable to first
analyze the component elements of the given conditions, formulate a definite strategy and
then compare the results with the original conditions given in both the Visual Puzzles
subtest and the WCST. For less complex tests with simple and unambiguous solutions,
these individuals may not show significant difficulties (e.g., Matrix Reasoning and Block
Design), as the process is not as complex and the approach not as integrated as that seen
with Visual Puzzles and the WCST.
Based on this more integrative process as well as the more integrative process of
the WCST task, it would be expected for the new subtest to add more predictive ability to
the performance on the WCST over and above Block Design and Matrix Reasoning,
which contain less integrated assessments of executive skills and are less frontal in nature
and more spatially oriented. Despite these similarities and the focus towards a more
integrated measure of frontal lobe functioning and executive abilities, the current
analyses do not support the hypothesis. The Visual Puzzles subtests did not significantly
add to the predictive ability of the WAIS-IV over and above the WAIS-III nonverbal
subtests.
While Visual Puzzles and the WCST do tap similar integrative abilities, the two
tests are not without their differences. The WCST contains multiple components that
assess concept formation, hypothesis testing, and sustained attention without the timed
component of Visual Puzzles and while the individual receives direct feedback regarding
his/her performance. Perseveration and the ability to incorporate feedback are more
heavily assessed by WCST. These components set the test apart from Visual Puzzles and
the other PRI subtests that assess an integrated process of hypothesis testing and problem

97
solving with puzzles, as measured by the other PRI subtests of Block Design and Matrix
Reasoning.
Further examination of the relationship between the two versions and the WCST
revealed that there were observed differences in the most significant predictors of WCST
performance for the different versions of the WAIS. For the WAIS-III, no individual
subtest was a significant predictor of performance on the WCST over and above the other
subtests and age and education. For the WAIS-IV, the Matrix Reasoning subtest was able
to significantly predict performance on the WCST over and above the other subtests and
age and education. This finding makes sense, considering that the WCST and Matrix
Reasoning share components in that both assess problem solving and hypothesis
generation and testing. The changes in the Matrix Reasoning subtest from the WAIS-III
to the WAIS-IV involved clearer teaching and instructions and fewer types of problems
presented with clearer teaching instructions.
Pearson correlations were examined to further assess the relationship between the
two versions of the WAIS and performance on WCST. For the WAIS-III, all of the
subtests had significant negative correlations with performance on WCST, indicating that
as the raw scores for the subtests increased the number of perseverative errors on the
WCST decreased. Thus, better performance on the WCST resulted in better performance
on WAIS-III subtests.
The WAIS-III subtest most highly correlated with performance on WCST was
Matrix Reasoning, which was not surprising considering the nonverbal nature of the test
and the problem solving, hypothesis testing, and cognitive flexibility tapped by both
subtests. Picture Arrangement was the next most highly correlated measure, which

98
involves nonverbal problem solving, hypothesis testing, cognitive flexibility, and abstract
reasoning. This is similar to the WCST that involves nonverbal problem solving,
cognitive flexibility, abstract reasoning and hypothesis testing. Digit Symbol Coding was
the third most highly correlated subtest with WCST performance, which was surprising
considering the perceived lack of processing speed involved in the untimed WCST
measure. The observed relationship may show that the visual attention involved in both
tasks. The next most highly correlated subtest with WCST was Block Design, which
shows the nonverbal reasoning involved with both measures. The remaining correlations
were in the following order Symbol Search, Letter Number Sequencing, Information,
Similarities, Picture Completion, Arithmetic, Digit Span, Vocabulary, and
Comprehension. The order was not surprising, particularly with the verbal subtests being
less correlated with WCST, as the measure does not heavily assess verbal abilities.
For the WAIS-IV, all of the subtests had significant negative correlations with
performance on the WCST, with the exception of Information that showed a non-
significant negative correlation. Similar to the WAIS-III correlations, as performance
improved on the WCST and fewer perseverative errors were committed, performance on
WAIS-IV subtests increased.
The highest correlated subtest was Matrix Reasoning, Symbol Search, Coding,
Block Design, Visual Puzzles, Similarities, Arithmetic, Digit Span, and Vocabulary. The
Matrix Reasoning subtest being the most highly correlated with performance on the
WCST was not surprising as both measures tap nonverbal reasoning, cognitive flexibility,
and hypothesis generation and testing. The second and third most highly correlated
subtests with performance on the WCST were the two subtests of the PSI (i.e., Symbol

99
Search, Coding) of the WAIS-IV. While this was an unexpected finding, it likely shows
the visual attention components of the three tasks as well as the role processing speed
may play in executive abilities and cognitive functioning. The fourth and fifth most
highly correlated tests were the remaining two subtests of the PRI of Block Design and
Visual Puzzles. These are not surprising considering that the WCST assesses nonverbal
reasoning, hypothesis testing, and cognitive flexibility. It would be expected that the two
tests would be more highly correlated with WCST performance than the PSI subtests.
The timed component of both tests and the motor component of Block Design could
explain why the relationship was not higher. It was expected that the Visual Puzzles
subtest would bare a stronger relationship with performance on the WCST due to the
frontal and executive components of the subtest. The final correlations with performance
on the WCST involve the verbal subtests and the working memory subtest of the WAIS-
IV. The nonverbal nature of the test makes it unsurprising that the verbal subtests are not
strongly correlated with performance on the WCST. The strongest relationship between
the verbal subtests and the WCST was with Similarities, which makes since considering
that the subtest requires verbal abstract reasoning. The lower correlations with the WCST
and the working memory measures are not surprising, considering that the WCST does
not strongly assess working memory.
The observed differences in the correlations show that, as would be anticipated,
the fluid reasoning and executive skills measures are strongly related to the WCST and
higher order cognitive abilities such as problem solving, hypothesis testing, reasoning,
and pattern finding. Specifically, it was evident that the Matrix Reasoning subtest taps
similar abilities to the WCST performance, as the subtest had the strongest correlation

100
between both the WAIS-III and WAIS-IV. Additionally, the correlations show that
processing speed measures are strongly related to executive abilities. While the
hypothesis was not supported, the order of significant correlations for the WAIS-IV
shows that the changes to the WAIS-IV did result in closer relationships with the subtests
proposed to measure fluid reasoning and a widely used neuropsychological measure of
fluid reasoning.
With the changes to the WAIS-IV, it was be expected that the PRI subtests of
Block Design, Matrix Reasoning, and Visual Puzzles would be more highly correlated
with the WCST than the WAIS-III subtests of Block Design, Matrix Reasoning, and
Picture Completion. The results of the Pearson correlation comparisons showed that there
was not a substantial difference in the correlations between the PRI subtests of the
WAIS-IV and performance on the WCST than the nonverbal subtests of the WAIS-III,
despite the proposed changes to make the subtests more consistent with fluid reasoning,
frontal lobe functioning.
Conclusions
The current study sought to examine the WAIS-IV and how the changes to the
new version may impact the measure’s usefulness in neuropsychological evaluations. The
WAIS-IV included changes to some and the elimination of other subtests along with two
new subtests (one core and one supplemental subtest). The two new subtests of Visual
Puzzles and Figure Weights, an optional subtest, are part of the PRI. The WAIS-IV, with
only 10 subtests, is significantly shorter than the WAIS-III, with 13 subtests (Hartman,
2009). The WAIS-IV aimed to be a better measure of fluid reasoning, processing speed,
and working memory, while lowering the emphasis of speeded responses and on motor
101
demands (Lichtenberger & Kaufman, 2013).
Earlier versions of the WAIS have been shown to have a significant relationship
between their scores and neuropsychological measures (Zarantonello, 1988). It has been
hypothesized that the more recent versions of the WAIS are more consistent with theory
and research and are more useful clinically than their predecessors (Gottfredson &
Saklofske, 2009). These changes support the need for the current research examining the
WAIS-IV’s predictive ability of neuropsychological measures and assessing the
measure’s utility in neuropsychological evaluations.
To examine the differences between the WAIS-III and the WAIS-IV, the subtests
that make up the index scores for the WAIS-III (i.e., all subtests except Object Assembly)
were entered into a hierarchical regression model after age and education were entered
into the first block. The same was done for the core subtests of the WAIS-IV. The overall
WAIS-III models were significant for all measures except FTT dominant and FTT non-
dominant. The overall WAIS-IV models were significant for all neuropsychological
measures.
When compared, no statistically significant differences were seen between the R2
of the WAIS-III and the R2 of the WAIS-IV regressions for the neuropsychological
measures. There were differences in the subtests that accounted for a significant amount
of variance in WAIS-III and WAIS-IV models, specifically for Trails A, WCST, and the
Category Test. For Trails A, the Coding subtest was able to account for a significant
amount of variance over and above the other subtests and age and education. This shows
that the attempts to make the WAIS-IV a better measure of processing speed were likely
achieved, at least for the Coding subtest. This was not the case for Symbol Search, which

102
did not significantly predict performance. For the WCST, the WAIS-IV subtest of Matrix
Reasoning was able to account for a significant amount of variance in the model over and
above the other variables in the model. This indicates that the measure was a better
measure of problem solving and may better assess the use of rules in reasoning than the
Matrix Reasoning subtest on the WAIS-III. The findings of a stronger relationship with
Matrix Reasoning and WCST are consistent with previous research that has shown that
Matrix Reasoning was strongly related to executive skills (Dugbartey et al., 1999).
Previous research has shown that WCST performance reflected sequential skills, which
are prominent in assessing patterns seen in Matrix Reasoning (Golden et al., 1998). The
stronger relationship with WAIS-IV Matrix Reasoning compared to WAIS-III Matrix
Reasoning could be due to the subtest being reduced to only two types of problems on the
WAIS-IV as opposed to 4 types of problems on the WAIS-III. There are more sequential
problems on the subtest. Both Matrix Reasoning and the WCST have shown relationships
with verbal analyses (Dugbartey et al., 1999; Golden et al., 1998).
For the Category Test, the WAIS-III subtest of Arithmetic was able to account for
a significant amount of the variance over and above the other variables in the model. For
the WAIS-IV, Coding was a significant predictor of performance on the Category Test.
The WAIS-III Arithmetic subtest predicting performance on the Category Test shows the
relationship between working memory and calculations used for both measures. The
WAIS-IV subtest of Coding being a better predictor of Category performance shows the
relationship between processing speed and visual discrimination of the measures. The
finding coincides with other research that has shown a relationship between Coding and
executive functioning measures (Davis & Pierson, 2012).

103
Based on the statistical comparison of the WAIS-III and WAIS-IV models, it
appears that, despite efforts to make the test more consistent with neuropsychological
measures and theory, the WAIS-IV does not provide substantially better clinical utility in
neuropsychological evaluations over the WAIS-III. The WAIS-IV does appear to have
achieved the task of fewer motor demands on some tasks (i.e., Symbol Search), while not
on others (i.e., Coding). Symbol Search showed less of a relationship with motor speed,
as measured by the FTT, from the WAIS-III to the WAIS-IV. It appears that, in an effort
to decrease motor demands, the Symbol Search subtest does not account for a significant
amount of variance on a neuropsychological measure of processing speed and was
surpassed by the Coding subtest, which was shown to be more closely related to
performance on Trails A but contained a stronger speeded motor component than Symbol
Search.
In regards to the goal of the publishers of the WAIS-IV to decrease motor
demands on all motor related tests, the WAIS-IV did not appear to decrease motor
demands on the Coding subtest, as the correlations changed very little from the WAIS-III
to the WAIS-IV. From the WAIS-III to the WAIS-IV, Digit Symbol Coding and Coding
had significant and strong relationships with motor speed. In contrast, Symbol Search did
show a decrease, while not significant, in correlations from WAIS-III to WAIS-IV in
both motor speed measures. Block Design maintained a similar relationship to motor
speed measures from WAIS-III to WAIS-IV.
It appears that the attempt to make the WAIS-IV a better measure of fluid
reasoning and frontal lobe abilities was not accomplished. The Visual Puzzles subtest
was not a better predictor of performance on more traditional neuropsychological
104
measures of frontal lobe functioning and executive measures, as it did not significantly
predict performance on any measure nor did Visual Puzzles add enough to make the
overall models significantly better predictors of performance than the WAIS-III overall
models. The finding is supported by Taub and Benson (2013) who found that the WAIS-
IV was not a better measure of fluid reasoning than the WAIS-III.
The WAIS-IV model was not a significantly better predictor of working memory
than the WAIS-III model. As previous research has shown, Trails B (Sanchez-Cubillo et
al., 2009), Trails A (Mahurin et al., 2006), and Category (Golden et al., 1998) to be
correlated with or related to working memory measures, it would be expected that the
WAIS-IV working memory measures would be more strongly related to these
neuropsychological measures. The overall regression models of the WAIS-III and WAIS-
IV show that, for the Category Test, Arithmetic was significant for the WAIS-III and not
the WAIS-IV, indicating a weaker relationship on the WAIS-IV and working memory. It
appears that the sequencing component added to the WAIS-IV Digit Span subtest did not
make the measure more consistent with neuropsychological measures of working
memory, like Trails A and Trails B that require mental sequencing skills. The finding
appears to contradict findings of Taub and Benson (2013) who found that the WAIS-IV
provided a better measure of working memory than the WAIS-III.
The WAIS-IV was not a significantly better predictor of processing speed across
the two PSI subtests than the WAIS-III. For Trails A, the WAIS-IV subtest of Coding
was able to significantly account for the variance over and above the other variables in
the model, while this was not observed for the WAIS-III. The overall models were not
statistically different in the predictive abilities. Symbol Search did not account for a

105
significant portion of the variance in either model. Correlation analyses for both versions
of the WAIS did not show significant differences between Symbol Search and Coding
and Trails A performance. For the WAIS-III, Symbol Search and then Digit Symbol
Coding were the most strongly correlated subtests with performance on Trails A. While
for the WAIS-IV, Coding and then Symbol Search were the most highly correlated
subtests with performance on Trails A. It would appear that the changes to the Coding
subtest of the WAIS-IV resulted in a slightly better measure of processing speed. The
results of these analyses show that, despite these changes and a stronger relationship of
the Coding subtest, the WAIS-IV, overall, was not a significantly better measure of
processing speed over the WAIS-III. The finding contradicts findings of Taub and
Benson (2013) who found that the WAIS-IV provided a better measure of processing
speed than the WAIS-III.
Visual Puzzles and Neuropsychological Measures
It should be noted that the Visual Puzzles subtest did appear to add to the measured
relationship with several neuropsychological measures over many of the subtests on the
WAIS-III. The Visual Puzzles subtests were consistently the highest correlated PRI
measure of the WAIS-IV subtests with all of the neuropsychological measures, with the
exception of the WCST. Visual Puzzles had the highest correlation of the WAIS-IV
subtests with performance on the Category Test, FTT dominant hand, and FTT non-
dominant hand. The finding shows that Visual Puzzles was strongly related to frontal
lobe functions and reaction time. It would appear that the timed component of the subtest
plays a large role in performance on the task. Further examination of the relationship
between the FTT dominant hand and non-dominant hand should be examined as this was

106
an unexpected finding based on the fact that Visual Puzzles was designed as a non-
motoric task.
Due to Visual Puzzles being the highest correlated PRI subtest with performance
on Trails A and Trails B, it would appear that processing speed and cognitive flexibility
are tapped by the new subtest. The findings of the current analyses coincide with the
findings of Fallows and Hilsabeck (2012), who found that Visual Puzzles performance
correlated with visuospatial reasoning, mental flexibility, and processing speed. Fallows
and Hilsabeck (2012) found that Visual Puzzles was significantly correlated with
performance on Trails A and Trails B but not WCST perseverative errors. The current
research shows a significant correlation between WCST perseverative errors and Visual
Puzzles, but this was the only neuropsychological measure where Visual Puzzles was not
the most highly correlated PRI measure. For the WCST, Visual Puzzles was the lowest
correlated PRI subtest. The correlation was significant, which would be expected
considering that both tap problem solving abilities. The current study upholds the
findings of Fallows and Hilsabeck (2012) that, despite the assertions of the creators of the
subtest, Visual Puzzles is not a pure measure of nonverbal reasoning because the subtest
assesses other abilities of mental flexibility, processing speed and reaction time, and
visuospatial reasoning.
Limitations
There are several limitations of the present research that could limit the
applicability of the results across settings. One of the limitations of the current research
involves the potential practice effects of taking both the WAIS-III and WAIS-IV versions
of the intellectual measure. A portion of the data came from an archival dataset. There

107
was no way to control for the order of tests given and whether or not the WAIS-IV was
given first, as done with the non-archival portion of the data collected. The WAIS-IV was
generally given as the first test in the battery, with the WAIS-III being the final test in the
battery. Since the tests were given as part of a larger neuropsychological battery, the time
between the administration of the WAIS-IV and WAIS-III varied from as much as a few
days to as much as several months. Previous research has shown that individuals,
especially those of average and high average intelligence, a benefit from prior exposure
on previous versions of the WAIS when the test was administered again two weeks later
(Rapport et al., 1997). No research is currently available examining practice effects on
the WAIS-III when previously exposed to the WAIS-IV. Practice effects could play a
role in performance and the raw scores achieved on the subtests but to what extent is not
determined, due to changes within subtests and subtest items from one version to the
next.
Another weakness of the current research has to do with the population being
pulled from a university clinic sample and research volunteers, with a mixed sample of
healthy volunteers and clinically referred individuals with various diagnoses. Having a
substantial portion of volunteers with no diagnoses, many who were college students, led
to slightly higher than average IQ scores (WAIS-III FSIQ M = 106; WAIS-IV FSIQ M =
103) and could have influenced the results and performances. There could be less
variation in abilities across the mixed sample. The mixed sample of individuals referred
to the outpatient clinic of a university and healthy volunteers could make the results less
generalizable to other settings, such as private practice facilities or hospital settings.
In the completion of the neuropsychological assessments, individuals provided
108
background information regarding diagnoses and physical and mental health. Only
general information was included in the databases. It may have been helpful to know
more about each individual’s medical history, medications at the time of testing, and
severity of psychiatric illness or neurological conditions at the time of testing,
specifically anything that may have impacted performance on cognitive assessments. The
findings of the current research may be more generalizable, if this information had been
available for analyses.
Another limitation of the current study involved the small sample size of
individuals who had taken a battery with both the WAIS-III and the WAIS-IV. A total
sample of 91 adults was used in the analyses. When the small sample size is coupled with
a large number of predictors in a multiple regression, the squared multiple correlation
coefficients can become unstable. Maxwell (2000) discusses the many rules of thumb that
are used in deciding appropriate sample sizes to conduct a multiple regression. Some of
the various rules of thumb discussed include the recommendation that with a moderate
number of predictors a sample size of 300 to 400 individuals is needed for a multiple
regression and the recommendation that the ratio of subjects to predictors should be at
least 10 to 1. No matter which rule of thumb is considered, the current study’s sample
size of 91 participants with 12 and 15 predictors in the multiple regression models does
not meet the suggested rules. The R2 will increase with the addition of each predictor in
the model (Maxwell, 2000). The differences seen between the squared multiple
correlation coefficients in the current study should be interpreted with caution. The
WAIS-III group had 15 predictors but the WAIS-IV group had only 12 predictors
included in the model. Because of the smaller sample size and the larger number of

109
predictors in the WAIS-III model, it may be that the squared multiple correlation
coefficients seen are inflated due to the higher number of predictors and not to actual
predictive ability of the WAIS-III.
The model used to compare the squared multiple correlation coefficients in the
current study was proposed by Alf and Graf (1999) as a way to test the significance of
differences observed in multiple correlation coefficients between two dependent groups.
Alf and Graf (1999) modified the Olkin and Finn (1995) models, in order to simplify the
method and reduce the complexity of the calculations. Olkin and Finn (1995) recommend
that the method be used with caution in moderate sample sizes (e.g., 60 < n < 200) but
can be readily used with larger sample sizes. In the current study the sample sizes fall
within the suggested size for careful use of the method. Algina and Keselman (1999)
suggested that the model could be used reliably with smaller sample sizes but warned that
as k, the number of predictors, increased larger sample sizes would be needed to control
the coverage probability. Alf and Graf (1999) demonstrated that the approach could be
used with dependent samples. The samples used were large, much larger than the sample
in the current study. The current study does meet the sample size requirements, but has a
high number of predictors used in the models, with a smaller sample size than that used
by Alf and Graf (1999). As a result, conclusions based on the model comparing the
squared multiple correlation coefficients should be made cautiously.
Implications for Future Research
For future studies, the literature would benefit from an expansion of the current
study using much larger sample sizes to get an examination of the differences in the
predictive ability of the WAIS-III and WAIS-IV on neuropsychological measures.

110
According to Johnstone et al. (1997) and Loring and Bauer (2010), the WAIS is one of
the most commonly used intelligence scales. Understanding the clinical utility of the
newest version of the WAIS is important for neuropsychologists who will be
implementing the use of the measure in their standard test batteries. Previous versions of
the WAIS have been shown to correlate with and predict performance on
neuropsychological measures (Berger, 1998; Devaraju-Backhaus et al., 2001; Dugbartey
et al., 1999; Golden et al., 1998; Johnstone et al., 1997; Sanchez-Cubillo et al., 2009;
Titus et al., 2002). Loring and Bauer (2010) explain that because of the changes to the
content of the scales and subtests, there could be problems with an inaccurate diagnosis
or classification of individuals if processes or rules developed using the earlier versions
of the WAIS are used with the WAIS-IV. Understanding the full neuropsychological
utility of the WAIS-IV is important and future studies could replicate studies conducted
with the WAIS-III to examine whether the same findings hold true for the WAIS-IV.
The WAIS-IV contains a new core subtest of Visual Puzzles. The current study
found that the Visual Puzzles subtest was significantly correlated with all of the
neuropsychological measures used in the current analyses. While a test similar to Visual
Puzzles (i.e., Spatial Relations) exists on the Woodcock-Johnson III Tests of Cognitive
Abilities and is said to assess manipulation of visual images and visual-spatial thinking, it
will be important for future research to examine the usefulness of the version presented
on the WAIS-IV and how it contributes to the PRI and the FSIQ. Due to the relationship
shown between Visual Puzzles and motor measures, further examination of potential
causes for the observed relationship would be beneficial, as the test is purported to be a
non-motoric task.
111
It will be important to understand the relationship between Visual Puzzles and
other neuropsychological measures. The literature would benefit from studies evaluating
Visual Puzzles’ relationship to other neuropsychological measures not evaluated in the
current study. These, some as suggested by Fallows and Hilsabeck (2012), could include
the Judgment of Line Orientation (Benton, Sivan, Hamster, Varney, & Spreen, 1994),
Hooper Visual Organization Test (Hooper, 1958), and Visual Form Discrimination Test
(Benton et al, 1994) as well as Rey-Osterrieth Complex Figure Test (Meyers & Meyers,
1995). Since research has shown potential verbal components assessed by Visual Puzzles
(McCrea & Robinson, 2011), it would be helpful to further assess the subtest’s
relationship with measures of verbal abilities.
While it would be helpful for clinicians to understand the relationship between
Visual Puzzles and these other neuropsychological measures to assess the utility of the
subtest and what the subtest measures, it would be helpful to fully assess the entire
WAIS-IV and its relationship with other widely used neuropsychological measures to
further asses the entire tests clinical utility. This could include examining various
memory measures commonly used in neuropsychological batteries and the WAIS-IV.
It would be beneficial for future research to examine the supplemental subtests of
the WAIS-IV and neuropsychological measures. While it was beyond the scope of the
current research, examining the utility of the new subtest of Figure Weights could be
helpful. The new subtest is hypothesized to add to the fluid reasoning measured by the
WAIS-IV and research is needed to verify the utility of the task in neuropsychological
batteries.
The current study consisted of individuals with various psychiatric and

112
neurological conditions as well as healthy volunteers. Future research would be wise to
examine specific populations to evaluate the types of WAIS-IV profiles that are seen in
specific conditions. Currently, there is little in the published literature examining the
WAIS-IV in neuropsychological cases. It is yet to be seen how the four index scores will
add to neuropsychological evaluations of an individual. Loring and Bauer (2010) explain
that it is too early to say that the VCI and the PRI are comparable to the Performance IQ
and Verbal IQ. The VCI and the PRI may be less sensitive to non-focal brain impairment
than the Performance IQ and the Verbal IQ because of more narrowed composite scores
and less sensitivity to psychomotor slowing due to a decrease in emphasis on speeded
performance (Loring & Bauer, 2010). Therefore, it is important that future studies
examine the utility of the WAIS-IV with various populations and the types of profiles
seen in specific populations.
Summary
In conclusion, while the hypotheses of the current study were not supported, the
results provide meaningful additions to the limited literature examining the newest
version of the WAIS. Despite seeing little difference in the two versions of the test in
regards to predictive ability on the neuropsychological measures, the WAIS-IV continues
to show strong relationships with neuropsychological measures as has been found with
earlier versions of the WAIS (Johnstone et al., 1997; Berger, 1998; Sherman et al., 1995;
Golden et al. 1998; Sanchez-Cubillo, 2009; Dugbartey et al., 1999; Titus et al., 2002;
Devarju-Backhaus et al., 2001). While no significant changes in the predictive ability
were seen between the WAIS-III and WAIS-IV, it should not be concluded that the
WAIS-IV is of no improvement over the WAIS-III.
113
Hartman (2009) explains that the WAIS-IV was designed to mirror theoretical
changes in the field and strengthen the test’s developmental appropriateness, user
friendliness, and clinical utility. With only 10 subtests and lower discontinue rules, the
WAIS-IV is significantly shorter than the WAIS-III (Hartman, 2009). Loring and Bauer
(2010) discuss the move away from global IQ scores like those used with the WAIS-III to
composite scores as with the WAIS-IV, explaining that index scores are a more useful
way to assess differential diagnoses. The WAIS-IV provides four indices that make up
FSIQ and coincide more with the theoretical framework of multiple factors making up
intelligence rather than the two factors of FSIQ on the earlier versions of the WAIS. In
the current study, little significant difference was seen between the WAIS-III and WAIS-
IV in terms of predictive ability for neuropsychological measures. The findings of the
current study may indicate that the WAIS-IV may not be a vast improvement in regards
to neuropsychological utility over the WAIS-III, but the shorter administration time and
movement towards consistency with current theoretical models of intelligence are
substantial advances from the previous versions.
Despite the WAIS-IV not being a significantly better predictor of performance on
neuropsychological measures over the WAIS-III, the new version of the test is useful in
neuropsychological batteries because the test assesses a range of abilities with a strong
standardization (Lezack, Howieson, Loring, Hannay, & Fischer, 2004). The current
research shows that the subtests of the WAIS-IV are related to neuropsychological
measures and may help in the interpretation and assessment of these abilities. While the
WAIS is considered the gold standard for intellectual assessments and is included in most
neuropsychological batteries, the newer version does not appear to add significantly to

114
the clinical utility over the WAIS-III. It is important that clinicians use the subtests in
conjunction with neuropsychological measures, as the current research shows the
relationships between subtests and measures are not perfect and there could be danger in
over interpreting the subtests and index scores if only the WAIS-IV is used to assess
working memory, frontal skills, and processing speed.

115
REFERENCES
Alf, E.F. & Graf, R.G. (1999). Asymptotic confidence limits for the difference between
two squared multiple correlations: A simplified approach. Psychological Methods,
4(1), 70-75. doi: 10.1037/1082-989X.4.1.70
Algina, J. & Keselman, H.J. (1999). Comparing squared multiple correlation coefficients:
Examination of a confidence interval and a test of significance. Psychological
Methods, 4(1), 76-83. doi: 10.1037/1082-989X.4.1.76
Benson, N., Hulac, D.M., & Kranzler, J.H. (2010). Independent examination of the
Wechsler Adult Intelligence Scale-Fourth Edition (WAIS-IV): What does the
WAIS-IV measure? Psychological Assessment, 22(1), 121-130. doi:
10.1037/a0017767
Benton, A.L., Sivan, A.B., Hamsher, K. deS., Varney, N.R., & Spreen, O. (1994).
Contributions to neuropsychological assessment: A clinical manual (2nd ed.).
New York, NY: Oxford University Press.
Berger, S. (1998). The WAIS-R factors: Usefulness and construct validity in
neuropsychological assessments. Applied Neuropsychology, 5(1), 37-42.
doi: 10.1207/s15324826an0501_5
Canivez, G. L., & Watkins, M. W. (2010). Investigation of the factor structure of the
Wechsler Adult Intelligence Scale-Fourth Edition (WAIS–IV): Exploratory and
higher order factor analyses. Psychological Assessment, 22(4), 827-836.
doi:10.1037/a0020429

116
Canivez, G.L. & Watkins, M.W. (2010). Exploratory and higher-order factor analyses of
the Wechsler Adult Intelligence Scale-Fourth Edition (WAIS-IV) adolescent
subsample. School Psychology Quarterly, 25(4), 223-235. doi: 10.1037/a0022046
Coalson, D.L., Raiford, S.E., Saklofske, D.H., & Weiss, L.G. (2010). WAIS-IV:
Advanced in the assessment of intelligence. In L.G. Weiss, D.H. Saklofske, D.
Coalson, & S.E. Raiford (Eds.), WAIS-IV Clinical Use and Interpretation (3-24).
New York, NY: Elsevier. doi: 10.1016/B978-0-12-375035-8.10010-2
Choca, J. (1987). Category Test Computer Program. Ontario, Canada: Multi-Health
Systems.
Davis, A.S. & Pierson, E.E. (2012). The relationship between the WAIS-III Digit Symbol
Coding and executive functioning. Applied Neuropsychology: Adult, 19, 192-197.
doi: 10.1090/09084282.2011.643958
Devaraju-Backhaus, S., Espe-Pfeifer, P., Mahrou, M.L., & Golden, C.J. (2001).
Correlation of the LNNB-III with the WAIS-III in a mixed psychiatric and brain-
injured population. International Journal of Neuroscience, 111, 235-240.
doi: 10.3109/00207450108994234
Dugbartey, A.T., Sanchez, P.N., Rosenbaum, J.G., Mahurin, R.K., Davis, M., & Townes,
B.D. (1999). WAIS-III Matrix Reasoning test performance in a mixed clinical
sample. The Clinical Neuropsychologist, 13(4), 396-404. doi: 10.1076/1385-
4046(199911)13:04

117
Fallows, R.R. & Hilsabeck, R.C. (2012). WAIS-IV Visual Puzzles in a mixed clinical
sample. The Clinical Neuropsychologist, 26(6), 942-950. doi:
10.1080/13854046.2012.697193
Glyshaw, K.J. (1990). Relationship between the Category Test and the Picture
Arrangement subtest of the WAIS-R. International Journal of Neuroscience, 51,
79-81. doi: 10.3109/00207459009000511
Golden, C.J., Espe-Pfeifer, P., & Wachsler-Felder, J. (2000). Neuropsychological
interpretations of objective psychological tests. New York, NY: Kluwer
Academic/Plenum Publishers.
Golden, C.J., Kushner, T., Lee, B., & McMorrow, M.A. (1998). Searching for the
meaning of the Category Test and the Wisconsin Card Sort Test: A comparative
analysis. International Journal of Neuroscience, 93(1-2), 141-150.
doi: 10.3109/00207459808986419
Gottfredson, L. & Saklofske, D.H. (2009). Intelligence: Foundations and issues in
assessment. Canadian Psychology, 50(3), 183-195. doi: 10.1037/a0016641
Gregoire, J., Coalson, D.L., & Zhu, J. (2011). Analysis of WAIS-IV index score scatter
using significant deviation from the mean index score. Assessment, 18(2), 168-
177. doi: 10.1177/1073191110386343
Hartman, D.E. (2009). Test review Wechsler Adult intelligence Scale-IV (WAIS-IV):
Return of the gold standard. Applied Neuropsychology, 16, 85-87.
doi:10.1080/09084280802644466
Heaton, R.K. (1981). Wisconsin card sorting test: Computer version-2. Odessa, FL:
Psychological Assessment Resources.

118
Hooper, H.E. (1958). The Hooper Visual Organization Test: Manual. Beverly Hills, CA:
Western Psychological Services.
Johnstone, B., Holland, D., & Hewett, J.E. (1997). The construct validity of the Category
Test: Is it a measure of reasoning or intelligence? Psychological Assessment, 9(1),
28-33. doi: 10.1037/1040-3590.9.1.28
Kennedy, J.E., Clement, P.F., & Curtiss, G. (2003). WAIS-III processing speed index
scores after TBI: The influence of working memory, psychomotor speed and
perceptual processing. The Clinical Neuropsychologist, 17(3), 303-307. doi:
10.1076/clin.17.3.303.18091
Lichtenberger, E.O. & Kaufman, A.S. (Eds.). (2013). Essentials of WAIS-IV assessment:
Second edition. Hoboken, NJ: John Wiley & Sons, Inc.
Loring, D.W. & Bauer, R.M. (2010). Testing the limits: Cautions and concerns regarding
the new Wechsler IQ and memory scales. Neurology, 74, 685-690. doi:
10.1212/WNL.0b013e3181d0cd12
Luria, A.R. (1973). The Working Brain: An Introduction to Neuropsychology. New York,
NY: Basic.
McCrea, S.M. & Robinson, T.P. (2011). Visual Puzzles, Figure Weights, and
Cancellation: Some preliminary hypotheses on the functional and neural
substrates of these three new WAIS-IV subtests. International Scholarly Research
Network Neurology, 2011, 1-19 doi: 10.1080/13854046.2012.697193
Mahurin, R.K., Velligan, D.I., Hazelton, B., Davis, J.M., Eckert, S., Miller, A.L. (2006).
Trail Making Test errors and executive function in schizophrenia and depression.
The Clinical Neuropsychologist, 20, 271-288. doi: 10.1080/13854040590947498

119
Maxwell, S.E. (2000). Sample size and multiple regression analysis. Psychological
Methods, 5(4), 434-458. doi: IO.I037//I082-989X.5.4.434
Meyers, J.E. & Meyers, K.R. (1995). Rey complex figure test and recognition trial:
Professional Manual. Odessa, FL: Psychological Assessment Resources.
O’Brien, A.R. & Tulsky, D.S. (2008). The history of processing speed and its relationship
to intelligence. In J. DeLuca & J.H. Kalmar (Eds.), Information Processing Speed
in Clinical Populations (1-28). New York, NY: Taylor & Francis.
Olkin, I. & Finn, J.D. (1995). Correlation redux. Psychological Bulletin, 188, 155-164.
doi: 10.1037/0033-2909.118.1.155
Raiford, S.E., Coalson, D.I., Saklofske, D.H., & Weiss, L.G. (2010). Practical issues in
WAIS-IV administration and scoring. In L.G. Weiss, D.H. Saklofske, D. Coalson,
& S.E. Raiford (Eds.), WAIS-IV Clinical Use and Interpretation (25-60). New
York, NY: Elsevier. doi: 10.1016/B978-0-12-375035-8.10010-2
Rapport, L.J., Brines, D.B., Axelrod, B.N., Theisen, M.E. (1997). Full scale IQ as
mediator of practice effects: The rich get richer. The Clinical Neuropsychologist,
11(4), 375-380. doi: 10.1080/13854049708400466
Reitan, R.M. & Wolfson, D. (1985). The Halstead-Reitan Neuropsychological Test
Battery: Theory and clinical interpretation. Tucson, AZ: Neuropsychology Press.
Sanchez-Cubillo, I., Perianez, J.A., Adrover-Roig, D., Rodriguez-Sanchez, J.M., Rios-
Lago, M., Tirapu, J., & Barcelo, F. (2009). Construct validity of the Trail Making
Test: Role of task-switching, working memory, inhibition/interference control,
and visuomotor abilities. Journal of the International Neuropsychological Society,
15, 438-450. doi:10.1017/S1355617709090626

120
Sattler, J.M. & Ryan, J.J. (2008). Wechsler Adult Intelligence Scale-Third Edition
(WAIS-III): Description. In Sattler (Eds.), Assessment of Children: Cognitive
Foundations (5th ed.) (489-517). San Diego, CA: Jerome M. Sattler, Publisher,
Inc.
Sattler, J.M. & Ryan, J.J. (2008). WAIS-III Subtests and interpreting the WAIS-III. In
Sattler (Eds.), Assessment of Children: Cognitive Foundations (5th ed.) (518-564).
San Diego, CA: Jerome M. Sattler, Publisher, Inc.
Scott J.G. & Schoenberg, M.R. (2011). Frontal lobe/executive functioning. In J.G. Scott
& M.R.Schoenberg (Eds.), The Little Black Book of Neuropsychology (219-248).
New York, NY: Springer. doi: 10.1007/978-0-387-76978-3
Sherman, E.M.S., Strauss, E., Spellacy, F., Hunter, M. (1995). Construct validity of
WAIS-R factors: Neuropsychological test correlates in adults referred for
evaluation of possible head injury. Psychological Assessment, 7(4), 440-444.
doi: 10.1037/1040-3590.8.2.171
Suchy, Y., Eastvold, A.D., Strassberg, D.S., & Franchow, E.I.. (2014). Understanding
processing speed weaknesses among pedophilic child molesters: Response style
vs. neuropathology. Journal of Abnormal Psychology, 123(1), 273-285. doi:
10.1037/a0035812
Taub, G.E. & Benson, N. (2013). Matters of consequence: An empirical investigation of
the WAIS-III and WAIS-IV and implications for addressing the Atkins
intelligence criterion. Journal of Forensic Psychology Practice, 13(1), 27-48.
doi:10.1080/15228932.2013.746913

121
Titus, J.B., Retzlaff, P.D., & Dean, R.S. (2002). Predicting scores of the Halstead
Category Test with the WAIS-III. International Journal of Neuroscience, 112,
1099-1114. doi:10.1080/00207450290026085
Wechsler, D. (1997). The Wechsler Adult Intelligence Scale – Third Edition. San
Antonio, TX: The Psychological Corporation.
Wechsler, D. (2008). The Wechsler Adult Intelligence Scale – Fourth Edition. San
Antonio, TX: Pearson.
Zarantonello, M.M. (1988). Comparability of the WAIS and the WAIS-R: A
consideration of level of neuropsychological impairment. Journal of Consulting
and Clinical Psychology, 56(2), 295-297. doi: 10.1037/0022-006X.56.2.295


