
The Nutrient Rich Foods Index NRF9.3:The science behind nutrient density scores
Adam Drewnowski, Ph.D.Director, Center for Public Health Nutrition
Director, Center for Obesity ResearchUniversity of Washington
Instituto Nacional de Salud PublicaCuernavaca, MX
April 16, 2009
Nutrient profiling is the science of ranking or classifying foods based on their nutrient
composition*
Each food is assigned a unitary score that best reflects its nutrient quality
What is nutrient profiling?
*Defined by the UK Food Standards Agency, FSA
What is nutrient profiling?
Confidential Information© 2009, Nutrient Rich Foods Coalition

Applications of nutrient profiling
Drewnowski Nutrition Today, Sep/Oct 2007
• Protect public healthHelp consumers get more nutrients from the calories they consume and so promote healthier diets• Promote regulationProvide a uniform benchmark for mandated or self-regulation by industry
Develop front of pack labelsDevelop shelf labelsHarmonize health and nutrition claims
• Promote innovationEncourage the production and selling of more nutrient-rich foods
Applications of nutrient profiling
Confidential Information© 2009, Nutrient Rich Foods Coalition
How to bridge the gap
Drewnowski Nutrition Today, Sep/Oct 2007
Nutrient Rich Foods Index is a science-based, consumer-driven,guidance system
Food labeling or food guidance?
Confidential Information© 2009, Nutrient Rich Foods Coalition
Confidential Information© 2009, Nutrient Rich Foods Coalition
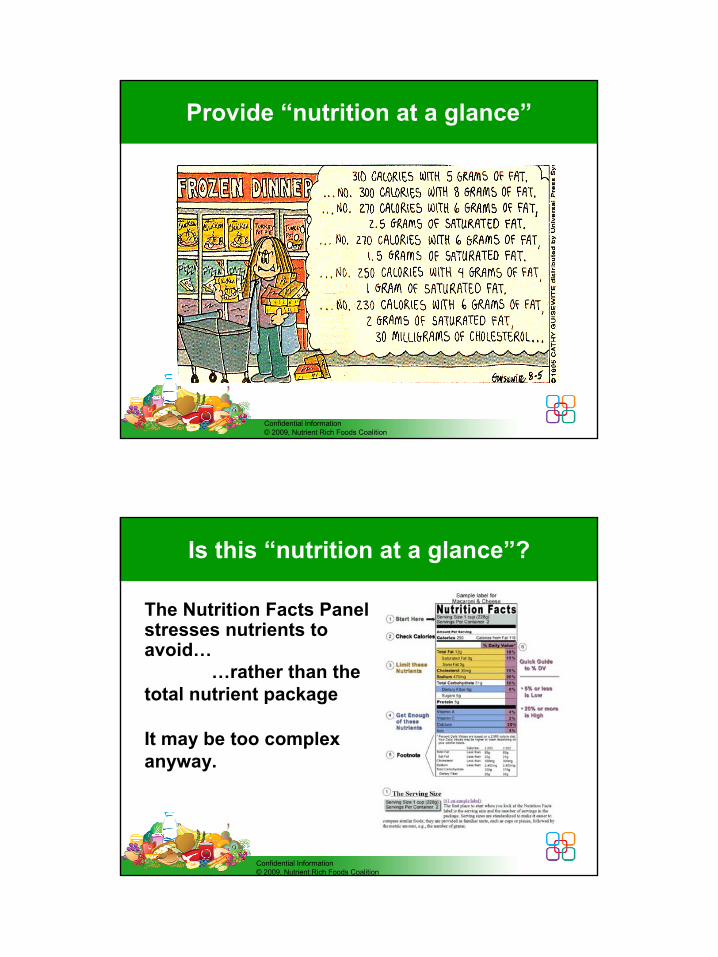
Provide “nutrition at a glance”
Why nutrient profiling?
The Nutrition Facts Panel stresses nutrients to avoid…
…rather than the total nutrient package
It may be too complex anyway.
Is this “nutrition at a glance”?
Confidential Information© 2009, Nutrient Rich Foods Coalition

For effective nutrition labelingfollow these steps
Confidential Information© 2009, Nutrient Rich Foods Coalition
Drewnowski: American J Clinical Nutrition 2005;82:721-32
The Nutrient Rich Foods Index
The beginning….
The Nutrient Rich Foods Index
Confidential Information© 2009, Nutrient Rich Foods Coalition

Nutrient Rich Foods Coalition
The Beef Checkoff through the National Cattlemen’s
Beef Association
Nutrient Rich Foods Coalition
Confidential Information© 2009, Nutrient Rich Foods Coalition
The vision:The Nutrient Rich Foods approach makes it easy for people to build and enjoy healthier diets by getting the most nutrition from their calories.
Coalition Advisory CommitteesCoalition Advisory CommitteesAdam Drewnowski, PhD, University of Washington
Victor Fulgoni III, PhD, Nutrition ImpactDan Kraemer, IA Collaborative
Scientific Advisory Committee• Robert Heaney, MD, FACP,
FAIN, Creighton University• Eileen Kennedy, PhD,
Tufts University• Janet King, PhD, University
of California, Berkeley & Davis• Nancy Krebs, MD,
University of Colorado• Paul LaChance, PhD,
Rutgers University• Esther Myers, PhD, RD,
American Dietetic Association
Consumer Communications & Nutrition Behavior Committee• Robert McKinnon,
YellowBrick Road• Amy Mobley, PhD, RD,
Purdue University • Laura Peracchio, PhD,
University of Milwaukee • Connie Diekman,
MEd, RD, LD, FADA, Washington Univ St. Louis
• Kathleen Zelman, MPH, RD, nutrition consultant
Confidential Information© 2009, Nutrient Rich Foods Coalition
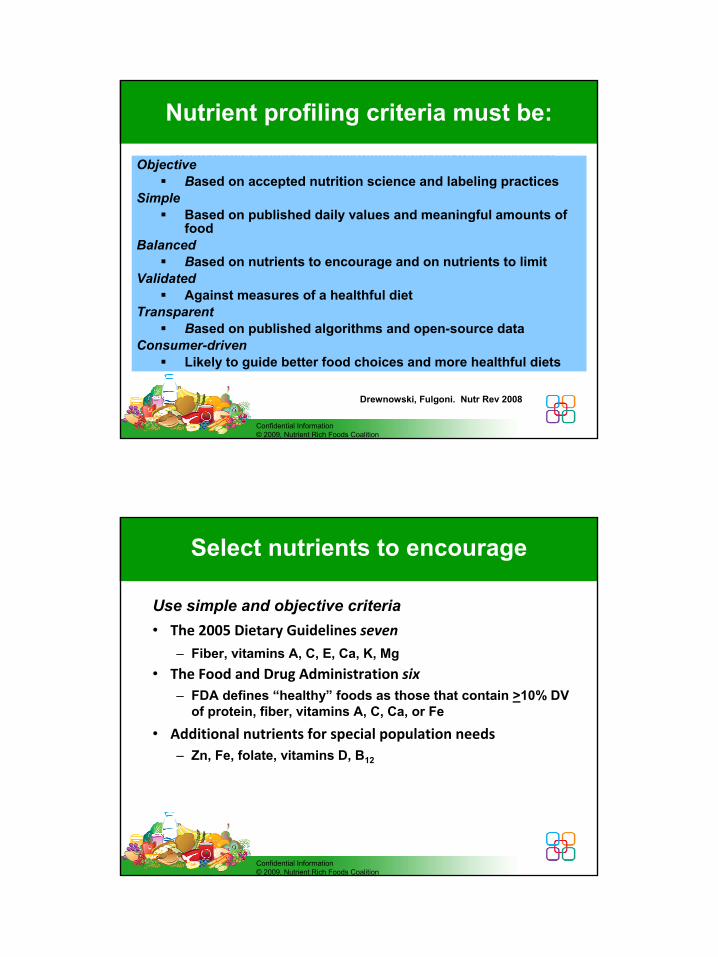
Objective Based on accepted nutrition science and labeling practices
SimpleBased on published daily values and meaningful amounts of food
Balanced Based on nutrients to encourage and on nutrients to limit
Validated Against measures of a healthful diet
TransparentBased on published algorithms and open-source data
Consumer-driven Likely to guide better food choices and more healthful diets
Nutrient Profiling Criteria
Drewnowski, Fulgoni. Nutr Rev 2008
Nutrient profiling criteria must be:
Confidential Information© 2009, Nutrient Rich Foods Coalition
Use simple and objective criteria• The 2005 Dietary Guidelines seven
– Fiber, vitamins A, C, E, Ca, K, Mg• The Food and Drug Administration six
– FDA defines “healthy” foods as those that contain >10% DV of protein, fiber, vitamins A, C, Ca, or Fe
• Additional nutrients for special population needs– Zn, Fe, folate, vitamins D, B12
Select nutrients to encourage
Confidential Information© 2009, Nutrient Rich Foods Coalition
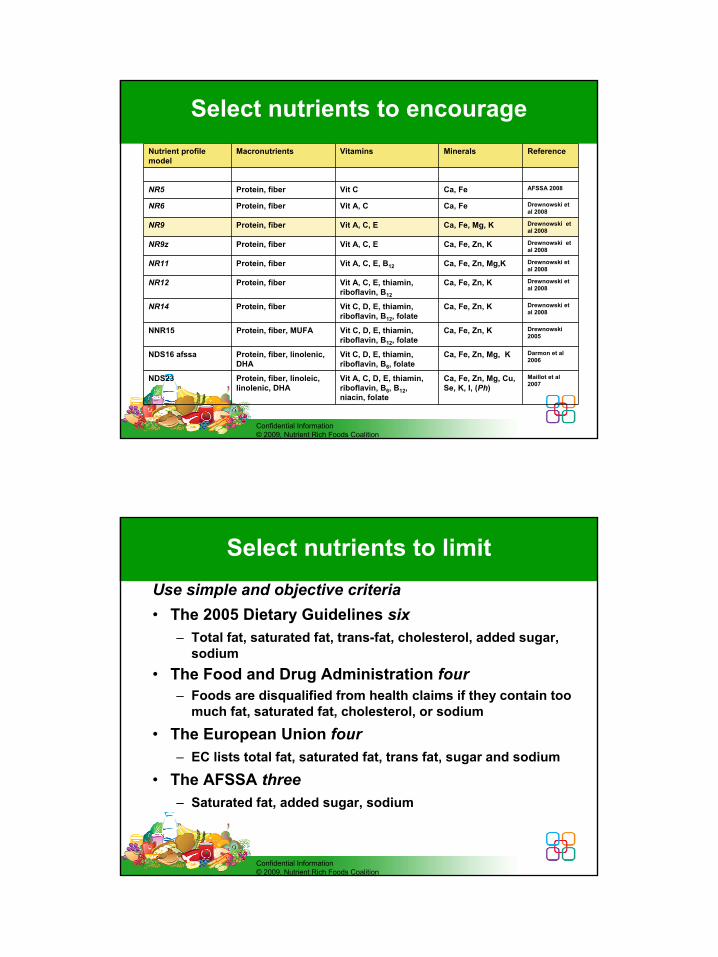
Nutrient profile model
Macronutrients Vitamins Minerals Reference
NR5 Protein, fiber Vit C Ca, Fe AFSSA 2008
NR6 Protein, fiber Vit A, C Ca, Fe Drewnowski et al 2008
NR9 Protein, fiber Vit A, C, E Ca, Fe, Mg, K Drewnowski et al 2008
NR9z Protein, fiber Vit A, C, E Ca, Fe, Zn, K Drewnowski et al 2008
NR11 Protein, fiber Vit A, C, E, B12 Ca, Fe, Zn, Mg,K Drewnowski et al 2008
NR12 Protein, fiber Vit A, C, E, thiamin, riboflavin, B12
Ca, Fe, Zn, K Drewnowski et al 2008
NR14 Protein, fiber Vit C, D, E, thiamin, riboflavin, B12, folate
Ca, Fe, Zn, K Drewnowski et al 2008
NNR15 Protein, fiber, MUFA Vit C, D, E, thiamin, riboflavin, B12, folate
Ca, Fe, Zn, K Drewnowski2005
NDS16 afssa Protein, fiber, linolenic, DHA
Vit C, D, E, thiamin, riboflavin, B6, folate
Ca, Fe, Zn, Mg, K Darmon et al2006
NDS23 Protein, fiber, linoleic, linolenic, DHA
Vit A, C, D, E, thiamin, riboflavin, B6, B12, niacin, folate
Ca, Fe, Zn, Mg, Cu, Se, K, I, (Ph)
Maillot et al2007
Select nutrients to encourageSelect nutrients to encourage
Confidential Information© 2009, Nutrient Rich Foods Coalition
Use simple and objective criteria• The 2005 Dietary Guidelines six
– Total fat, saturated fat, trans-fat, cholesterol, added sugar, sodium
• The Food and Drug Administration four– Foods are disqualified from health claims if they contain too
much fat, saturated fat, cholesterol, or sodium
• The European Union four– EC lists total fat, saturated fat, trans fat, sugar and sodium
• The AFSSA three– Saturated fat, added sugar, sodium
Select nutrients to limitSelect nutrients to limit
Confidential Information© 2009, Nutrient Rich Foods Coalition

Nutrient Reference DV Nutrient Maximum RV
Protein 50 g Total fat 65 g
Fiber 25 g Saturated fat 20 g
Vit A 5000 IU Total sugars 125 g
Vit C 60 mg Added sugars 50 g
Vit E 30 IU Sodium 2,400
Calcium 1,000 mg
Iron 18 mg
Potassium 3,500 mg
Magnesium 400 mg
Use published reference amounts
Drewnowski, Fulgoni. Nutr Rev 2008
Select reference daily values
Select the basis for calculation
Use science to decide among alternative options• 100 grams
– Food labels in the EU are based on 100g amounts – so are some EU-based nutrient profiles (e.g. UK FSA)
• 100 kcal– Better reflects the nutrient-to-calorie ratio – but will
consumers relate?
• Government-mandated serving size– Food labels in the US are based on Reference Amounts
Customarily Consumed (RACC)
Select the basis for calculation
Confidential Information© 2009, Nutrient Rich Foods Coalition
0
100
200
300
400
500
600
700
800
900
0 20 40 60 80 100 120 140 160 180 200 220 240 260 280
RACC value (g)
Ener
gy p
er 1
00g
meatdairyfruitvegetablesgrainsfatsmixedsweets
cheeses
meat
fruitjuices
yogurt
vegetables
oil
sugarmixed foods
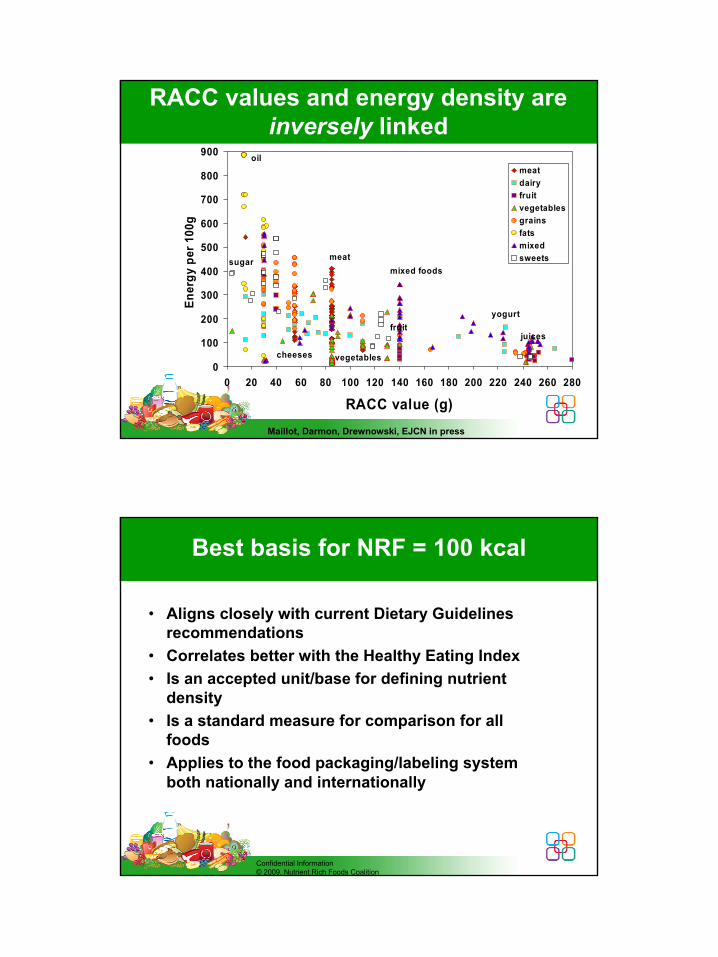
Maillot, Darmon, Drewnowski, EJCN in press
RACC values and energy density are inversely linked
Select the basis for calculationBest basis for NRF = 100 kcal
Confidential Information© 2009, Nutrient Rich Foods Coalition
• Aligns closely with current Dietary Guidelines recommendations
• Correlates better with the Healthy Eating Index• Is an accepted unit/base for defining nutrient
density• Is a standard measure for comparison for all
foods • Applies to the food packaging/labeling system
both nationally and internationally

Confidential Information© 2009, Nutrient Rich Foods Coalition
• A formal process was used to decide among alternative algorithms
• Tested a family of NRF Indices– Range of positive nutrients (5-15)– With and without nutrients to limit (3-4)– Calculated per 100 kcal and per RACC
• Used diet quality measures (e.g., Healthy Eating Index- HEI-2005) and health-related variables
• Used regression analyses with dependent variables:– Measure of diet quality (HEI-2005)– Selected health outcomes (BMI, blood pressure, lipids)
The validation process
Component Points Std. for max. score Std. for min. scoreTotal Fruit (includes 100% juice) 5 ≥0.8 cup equiv. per 1,000 kcal No Fruit
Whole Fruit (not juice) 5 ≥0.4 cup equiv. per 1,000 kcal No Whole Fruit
Total Vegetables 5 ≥1.1 cup equiv. per 1,000 kcal No vegetables
Dark Green and OrangeVegetables and Legumes
5 ≥0.4 cup equiv. per 1,000 kcal No Dark Green or Orange Vegetables and Legumes
Total Grains 5 ≥3.0 oz equiv. per 1,000 kcal No Grains
Whole Grains 5 ≥1.5 oz equiv. per 1,000 kcal No Whole Grains
Milk 10 ≥1.3 cup equiv. per 1,000 kcal No Milk
Meat and Beans 10 ≥2.5 oz equiv. per 1,000 kcal No Meat or Beans
Oils 10 ≥12 grams per 1,000 kcal No Oil
Saturated Fat 10 ≤7% of energy ≥15% of energy
Sodium 10 ≤0.7 gram per 1,000 kcal ≥2.0 g per 1,000 kcal
Calories from Solid Fat, Alcohol,and Added Sugar (SoFAAS)
20 ≤20% of energy ≥50% of energy
Healthy Eating Index - 2005
Confidential Information© 2009, Nutrient Rich Foods Coalition

The NRFn.3 indices and HEI
Confidential Information© 2009, Nutrient Rich Foods Coalition
0.0%
5.0%
10.0%
15.0%
20.0%
25.0%
30.0%
35.0%
40.0%
45.0%
50.0%
L IM NR F 5.3 NR F 6.3 NR F 9.3 NR F 11.3 NR F 15.3
P er R A C C
P er 100
The NRF9.3 algorithm
9 nutrients to encourage
Protein Fiber VitaminA
Iron Calcium VitaminC
Potassium Magnesium VitaminE
3 nutrients to limit
SaturatedFat
Added Sugars
Sodium
CONFIDENTIAL© 2009 Nutrient Rich Foods Coalition
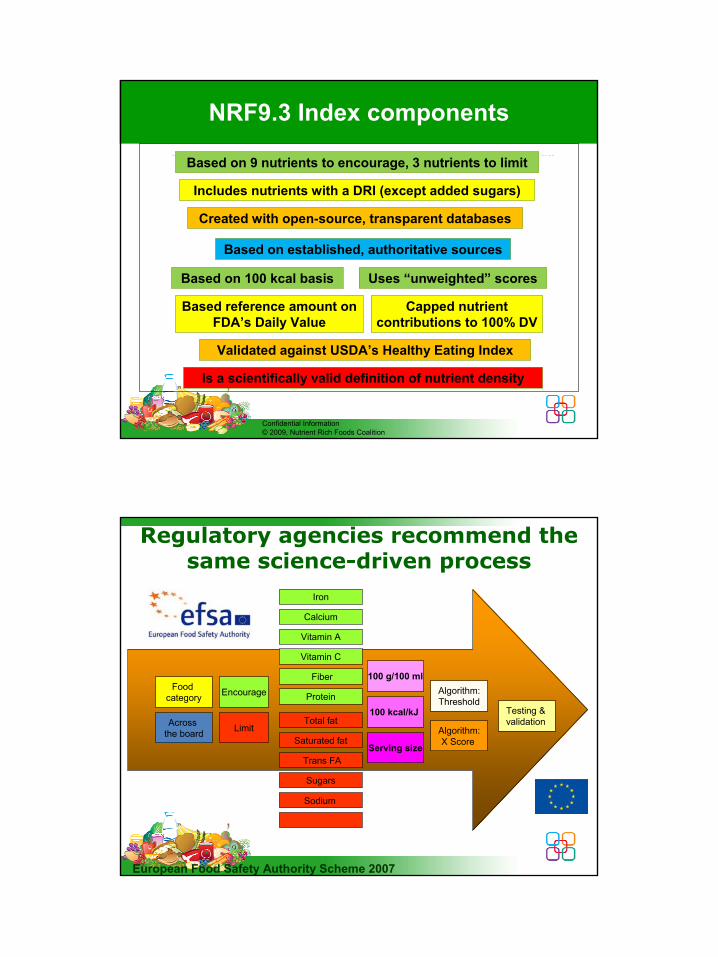
NRF9.3 Index components
Based on 9 nutrients to encourage, 3 nutrients to limit
Uses “unweighted” scores
Based reference amount on FDA’s Daily Value
Based on 100 kcal basis
Created with open-source, transparent databases
Includes nutrients with a DRI (except added sugars)
Based on established, authoritative sources
Capped nutrient contributions to 100% DV
Validated against USDA’s Healthy Eating Index
Is a scientifically valid definition of nutrient density
Confidential Information© 2009, Nutrient Rich Foods Coalition
Across the board
Food category
Limit
Encourage
Total fat
Saturated fat
Trans FA
Sugars
Protein
Fiber
Vitamin A
Vitamin C
Calcium
Iron
100 g/100 ml
100 kcal/kJ
Serving size
Algorithm:Threshold
Algorithm:X Score
Testing & validation
Sodium
Regulatory agencies recommend the same science-driven process
European Food Safety Authority Scheme 2007
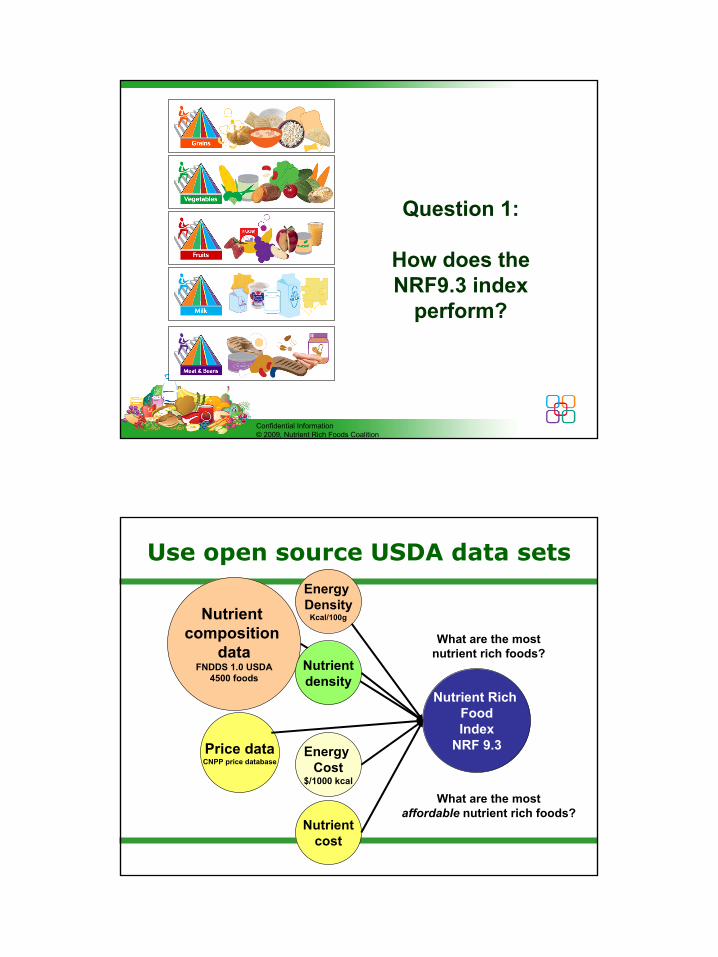
Question 1:
How does the NRF9.3 index
perform?
Confidential Information© 2009, Nutrient Rich Foods Coalition
Nutrient Rich FoodIndex
NRF 9.3Price dataCNPP price database
Nutrient composition
dataFNDDS 1.0 USDA
4500 foods
Energy Density
Kcal/100g
Nutrientcost
Nutrientdensity
Energy Cost
$/1000 kcal
What are the most nutrient rich foods?
Use open source USDA data sets
What are the most affordable nutrient rich foods?
0
100
200
300
400
500
600
700
800
900
-200 -100 0 100 200 300NRF9.3 per 100 kcal
Ener
gy d
ensi
ty (k
cal/1
00g)
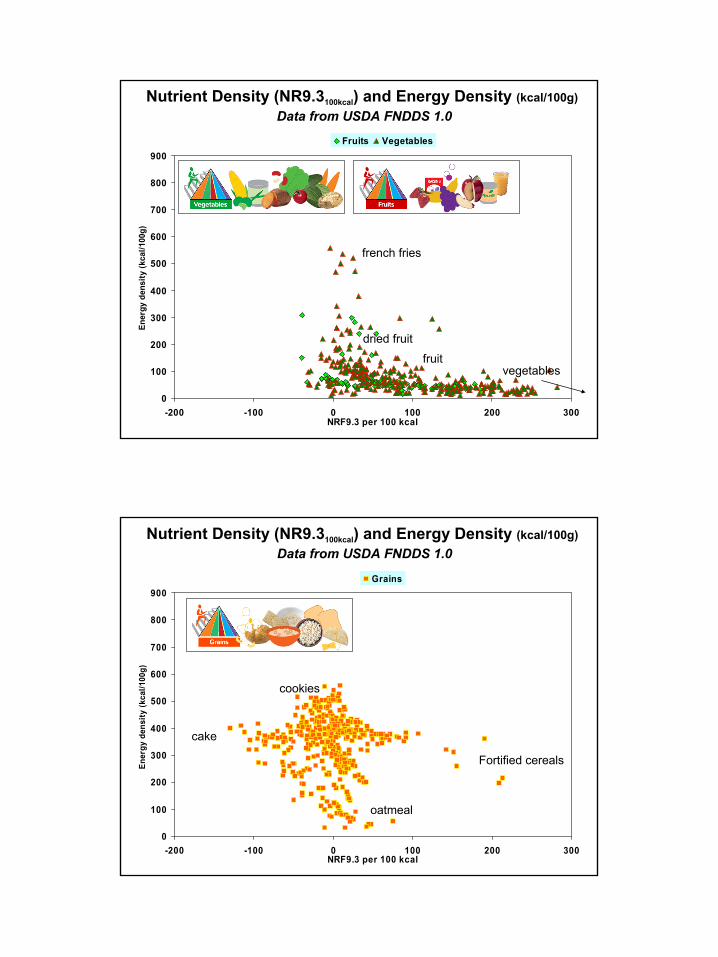
Fruits Vegetables
Nutrient Density (NR9.3100kcal) and Energy Density (kcal/100g)Data from USDA FNDDS 1.0
french fries
dried fruit
vegetablesfruit
0
100
200
300
400
500
600
700
800
900
-200 -100 0 100 200 300NRF9.3 per 100 kcal
Ener
gy d
ensi
ty (k
cal/1
00g)
Grains
Nutrient Density (NR9.3100kcal) and Energy Density (kcal/100g)Data from USDA FNDDS 1.0
oatmeal
Fortified cereals
cake
cookies
0
100
200
300
400
500
600
700
800
900
-200 -100 0 100 200 300NRF9.3 per 100 kcal
Ener
gy d
ensi
ty (k
cal/1
00g)
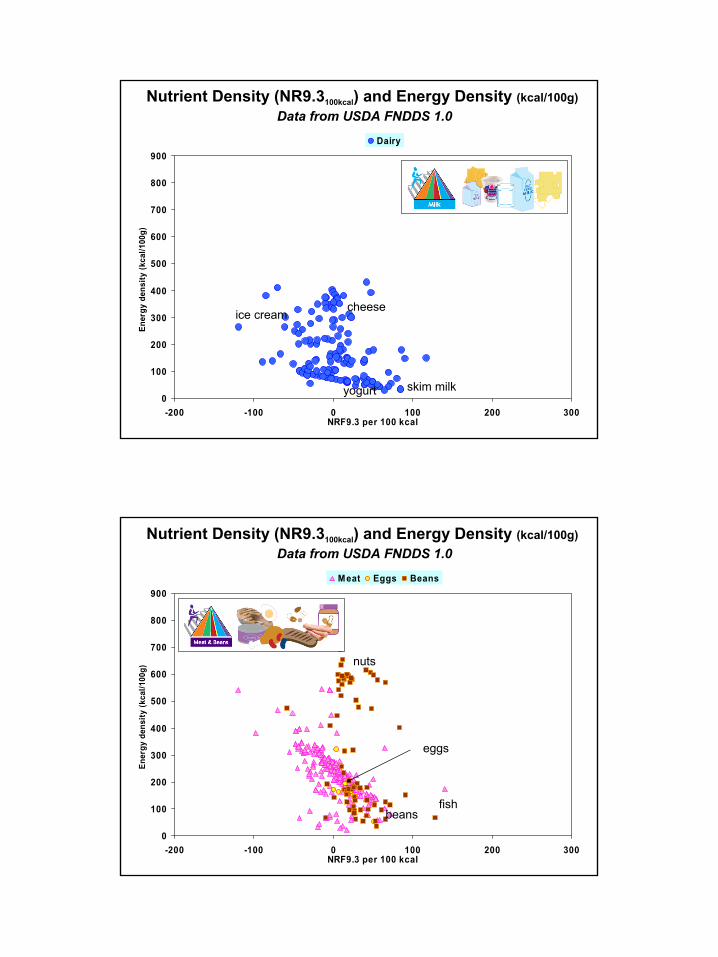
Dairy
Nutrient Density (NR9.3100kcal) and Energy Density (kcal/100g)Data from USDA FNDDS 1.0
skim milkyogurt
ice creamcheese
0
100
200
300
400
500
600
700
800
900
-200 -100 0 100 200 300NRF9.3 per 100 kcal
Ener
gy d
ensi
ty (k
cal/1
00g)
Meat Eggs Beans
Nutrient Density (NR9.3100kcal) and Energy Density (kcal/100g)Data from USDA FNDDS 1.0
nuts
fishbeans
eggs

0
100
200
300
400
500
600
700
800
900
-200 -100 0 100 200 300NRF9.3 per 100 kcal
Ener
gy d
ensi
ty (k
cal/1
00g)
Fats
Nutrient Density (NR9.3100kcal) and Energy Density (kcal/100g)Data from USDA FNDDS 1.0
0
100
200
300
400
500
600
700
800
900
-200 -100 0 100 200 300NRF9.3 per 100 kcal
Ener
gy d
ensi
ty (k
cal/1
00g)
Sugars
Nutrient Density (NR9.3100kcal) and Energy Density (kcal/100g)Data from USDA FNDDS 1.0
fortified beverages
desserts
sugar
Soft drinks
0
100
200
300
400
500
600
700
800
900
-200 -100 0 100 200 300NRF9.3 per 100 kcal
Ener
gy d
ensi
ty (k
cal/1
00g)
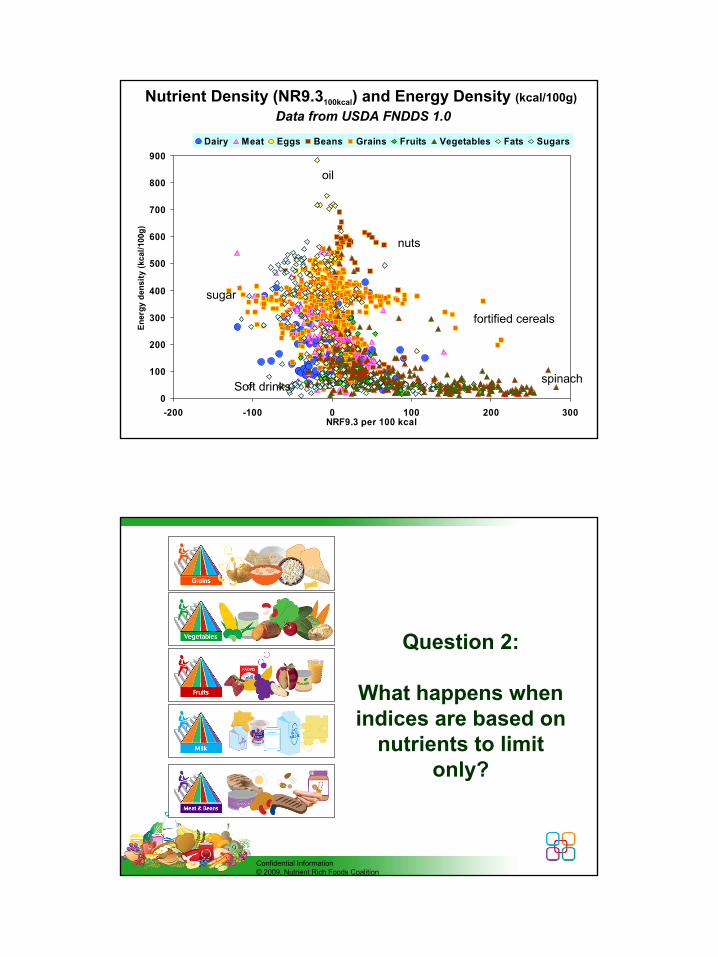
Dairy Meat Eggs Beans Grains Fruits Vegetables Fats Sugars
Nutrient Density (NR9.3100kcal) and Energy Density (kcal/100g)Data from USDA FNDDS 1.0
sugar
spinach
oil
fortified cereals
Soft drinks
nuts
Question 2:
What happens when indices are based on
nutrients to limit only?
Confidential Information© 2009, Nutrient Rich Foods Coalition
35
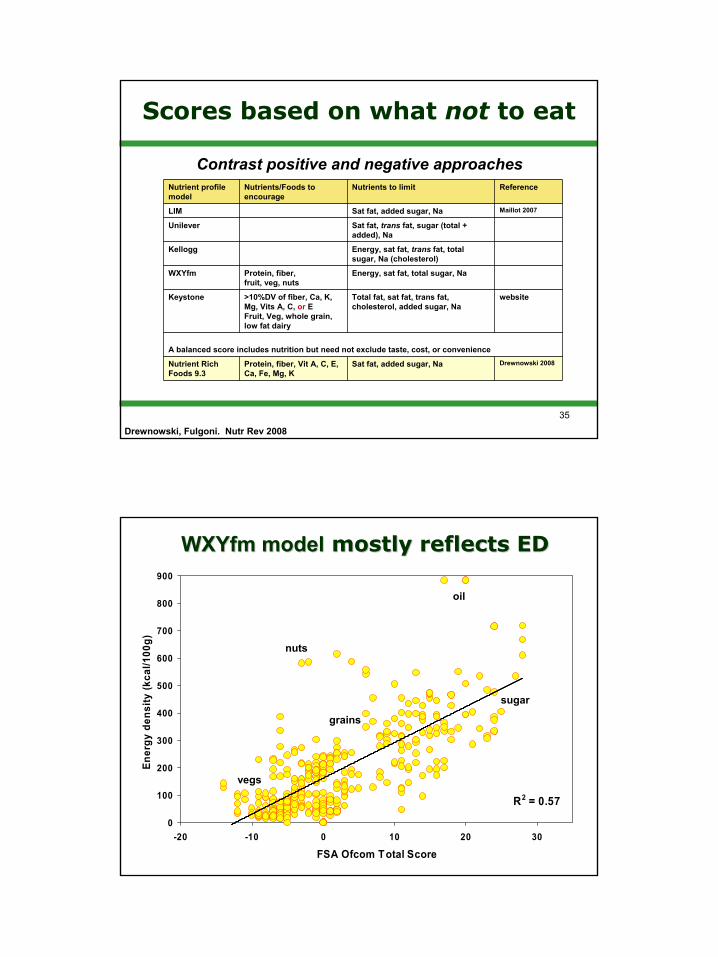
Energy, sat fat, total sugar, Na Protein, fiber, fruit, veg, nuts
WXYfm
Nutrient profile model
Nutrients/Foods to encourage
Nutrients to limit Reference
LIM Sat fat, added sugar, Na Maillot 2007
Unilever Sat fat, trans fat, sugar (total + added), Na
Kellogg Energy, sat fat, trans fat, total sugar, Na (cholesterol)
Keystone >10%DV of fiber, Ca, K, Mg, Vits A, C, or EFruit, Veg, whole grain, low fat dairy
Total fat, sat fat, trans fat, cholesterol, added sugar, Na
website
A balanced score includes nutrition but need not exclude taste, cost, or convenience
Nutrient Rich Foods 9.3
Protein, fiber, Vit A, C, E, Ca, Fe, Mg, K
Sat fat, added sugar, Na Drewnowski 2008
Scores based on what not to eat
Drewnowski, Fulgoni. Nutr Rev 2008
Contrast positive and negative approaches
R2 = 0.57
0
100
200
300
400
500
600
700
800
900
-20 -10 0 10 20 30
FSA Ofcom Total Score
Ener
gy d
ensi
ty (k
cal/1
00g)
oil
grains
sugar
WXYfmWXYfm modelmodel mostly reflects EDmostly reflects ED
nuts
vegs
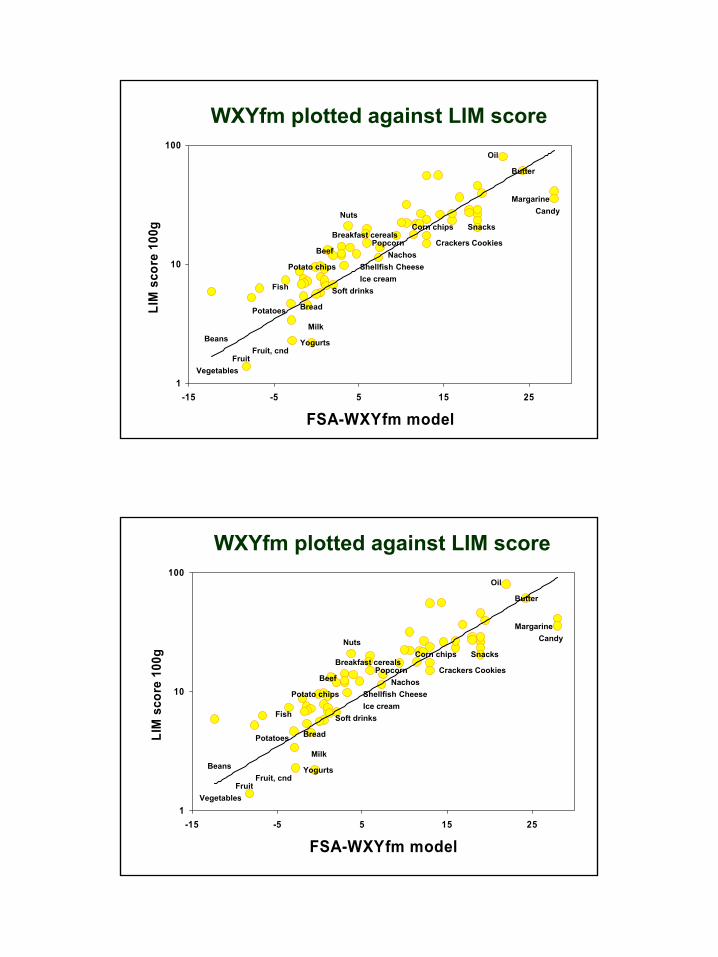
1
10
100
-15 -5 5 15 25
FSA-WXYfm model
LIM
sco
re 1
00g
Shellfish
Fish
Potatoes
Corn chips
Milk
Snacks
Cheese
Beef
Oil
Candy
Beans
Potato chips
Breakfast cereals
Yogurts
Nuts
Margarine
Butter
FruitVegetables
Fruit, cnd
Ice cream
Bread
CookiesCrackers
Soft drinks
PopcornNachos
WXYfm plotted against LIM score

Question 3:
What do consumers want?
Confidential Information© 2009, Nutrient Rich Foods Coalition
0
100
200
300
400
500
600
700
800
900
-200 -100 0 100 200 300NRF9.3 per 100 kcal
Ener
gy d
ensi
ty (k
cal/1
00g)
Dairy Meat Eggs Beans Grains Fruits Vegetables Fats Sugars
100 point scale – too much information? Data from USDA FNDDS 1.0
sugar
spinach
oil
fortified cereals
Soft drinks
nuts
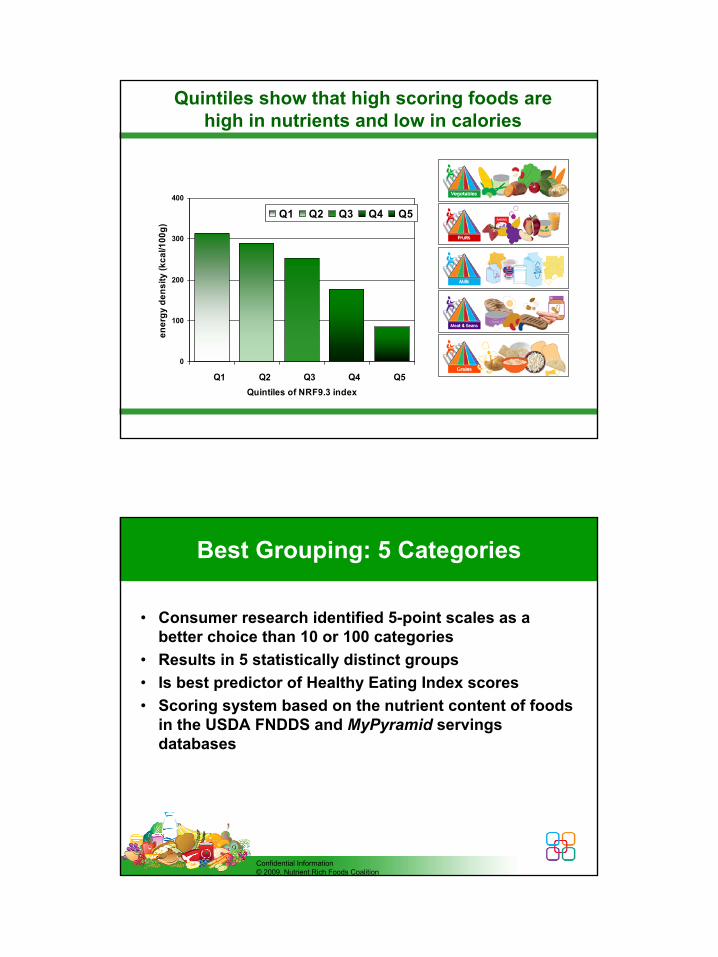
Quintiles show that high scoring foods are high in nutrients and low in calories
0
100
200
300
400
Q1 Q2 Q3 Q4 Q5Quintiles of NRF9.3 index
ener
gy d
ensi
ty (k
cal/1
00g)
Q1 Q2 Q3 Q4 Q5
Confidential Information© 2009, Nutrient Rich Foods Coalition
Best Grouping: 5 Categories
• Consumer research identified 5-point scales as a better choice than 10 or 100 categories
• Results in 5 statistically distinct groups • Is best predictor of Healthy Eating Index scores• Scoring system based on the nutrient content of foods
in the USDA FNDDS and MyPyramid servings databases
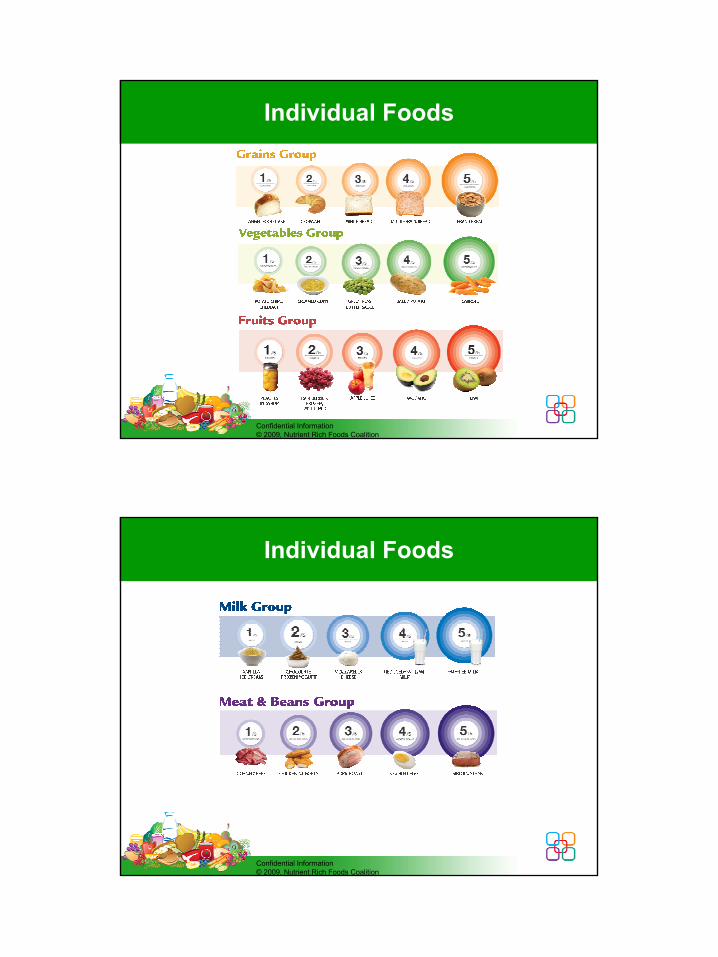
Individual Foods
Confidential Information© 2009, Nutrient Rich Foods Coalition
Individual FoodsIndividual Foods
Confidential Information© 2009, Nutrient Rich Foods Coalition

Question 3:
What about cost?
Confidential Information© 2009, Nutrient Rich Foods Coalition
0
100
200
300
400
500
600
700
800
900
0.1 1 10 100Energy cost ($/1000 kcal)
Ener
gy d
ensi
ty (k
cal/1
00g)
Dairy Meat Eggs Beans Grains Fruits Vegetables Fats Sugars
Log scale!
Energy density (kcal/100g) and energy cost ($/1000 kcal) Data from USDA FNDDS 1.0 and CNPP prices database
nuts
Salad greens
fruit
Low cost
Higher cost
beans
meat
yogurt
cheese
milk
pasta
cereals
oil
sugar
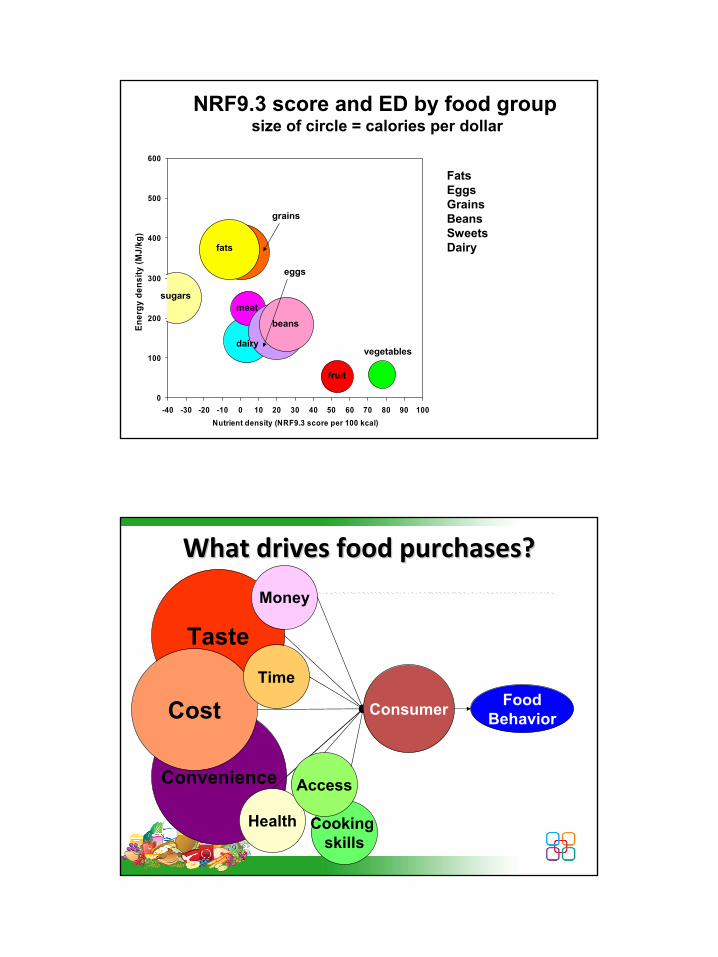
0
100
200
300
400
500
600
-40 -30 -20 -10 0 10 20 30 40 50 60 70 80 90 100Nutrient density (NRF9.3 score per 100 kcal)
Ener
gy d
ensi
ty (M
J/kg
)
fats
beans
vegetables
eggs
NRF9.3 score and ED by food groupsize of circle = calories per dollar
grains
meat
dairy
fruit
sugars
FatsEggsGrainsBeansSweetsDairy
Consumer
Convenience
Taste
Cooking skills
FoodBehavior
What drives food purchases?What drives food purchases?
Cost
Money
Health
Time
Access
49
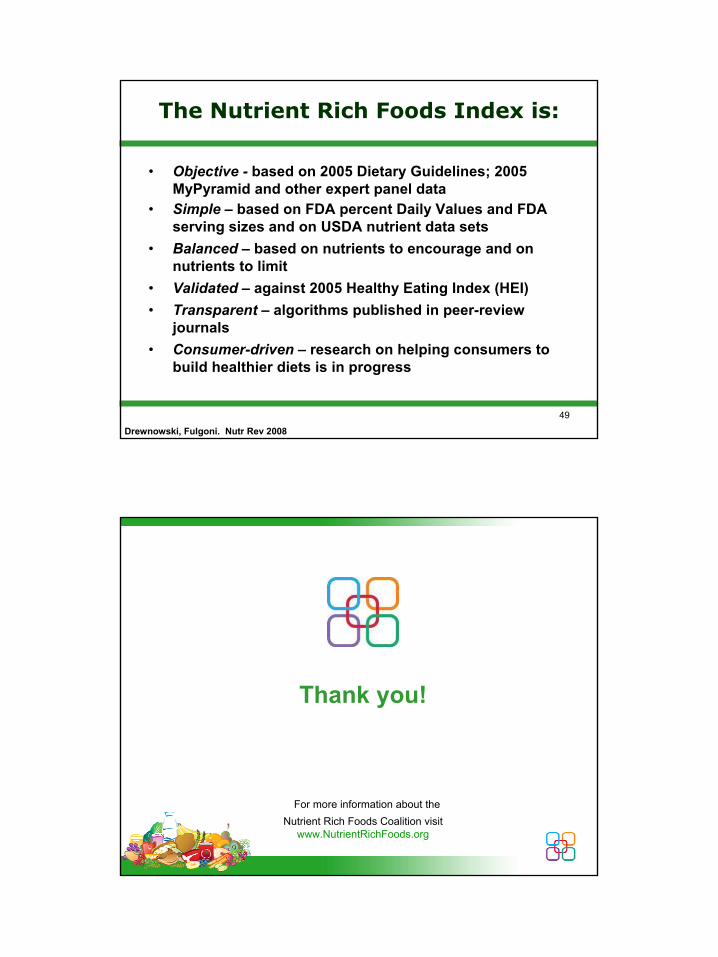
The Nutrient Rich Foods Index is:
• Objective - based on 2005 Dietary Guidelines; 2005 MyPyramid and other expert panel data
• Simple – based on FDA percent Daily Values and FDA serving sizes and on USDA nutrient data sets
• Balanced – based on nutrients to encourage and on nutrients to limit
• Validated – against 2005 Healthy Eating Index (HEI)• Transparent – algorithms published in peer-review
journals• Consumer-driven – research on helping consumers to
build healthier diets is in progress
Drewnowski, Fulgoni. Nutr Rev 2008
Thank you!
For more information about the Nutrient Rich Foods Coalition visit
www.NutrientRichFoods.org


