

The Politics of the Restoration of Ex-Felon VotingRights: The Case of Iowa∗
Marc Meredith Michael MorseUniversity of StanfordPennsylvania University
[email protected] [email protected]
March 24, 2014
Abstract
We investigate how the restoration of voting rights affects the political participationof ex-felons. Our primary analysis uses unique administrative data from Iowa, whichchanged how ex-felons restore their voting rights in both 2005 and 2011. Prior to2005, ex-felons had to apply to apply to the governor restore their voting rights. Weshow that ex-felon turnout increased after Iowa began to automatically restore theserights. Consistent with misinformation being a significant barrier to ex-felons’ politicalparticipation, ex-felons were more likely to vote if they were informed about this policychange. The application requirement was re-instated for ex-felons discharged since 2011and we show that this reduced their 2012 presidential election turnout. We concludeby comparing the actual turnout rate of recently discharged ex-felons in Iowa, Maine,and Rhode Island to the turnout rate predicted by Uggen and Manza (2002). Thiscomparison suggests that although restoration procedures can substantively affect ex-felon turnout, restoration procedures are not the only reason why ex-felons vote lessoften than observably similar non-felons.
∗We thank Jeffrey Dawson of the Iowa State Archives and Becky Elming and Larry Johnson of the IowaGovernor’s Office for helping with data collection. We thank John Dilulio, Alec Ewald, Jacob Hacker, JohnLapinski, Anna Mastri, Rogers Smith, Caroline Tolbert, Ryan Vander Wielen, Vesla Weaver, ChristopherWildeman, and audience members at MIT, Princeton University, the University of Texas, the University ofVirginia, the University of Wisconsin, the 2012 State Politics and Policy Conference, the 2012 Yale AmericanPolitics Summer Workshop, the 2012 Yale Detaining Democracy Conference, and the 2013 Empirical LegalStudies Conference for useful comments and suggestions. We thank the Center for the Study of DemocraticPolitics at Princeton University as well as the Center for Undergraduate Research and Fellowships, the PennHumanities Forum, and the Program on Democracy, Citizenship, and Constitutionalism, all at the Universityof Pennsylvania, for their financial support of this project.

1 Introduction
Felon disenfranchisement has become a contentious and significant public policy issue of
late, a response to both the unprecedented rise of the carceral state and mounting questions
of fairness in American democracy. More than two hundred years after this country was
founded on the principle of equality, felons are the only class of citizens still disenfranchised
from the vote.1 Recent estimates by the Sentencing Project suggest that over five million
citizens are ineligible to vote on the basis of a criminal conviction (Porter, 2010), including
one out of every eight African-American males (Sentencing Project, 1998).
Each state determines the eligibility of convicted felons to vote and there is a mosaic
of different laws regarding when they are disenfranchised.2 Every state except Maine and
Vermont disenfranchises individuals who are incarcerated on a felony conviction, with a
majority extending that period of disenfranchisement through probation or parole. Twelve
states permanently disenfranchise at least some ex-felons, although these states have a pro-
cess through which ex-felons can apply to have their voting rights restored (Uggen, Shannon
and Manza, 2012).
The contested 2000 presidential election — in which at least 600,000 ex-felons in Florida
were barred from the polls (Burch, 2012) — generated a flood of research on the electoral
consequences of felon disenfranchisement. Seminal works by Uggen and Manza (2002) and
Manza and Uggen (2004, 2006) argue that felon disenfranchisement causes Republican can-
didates to win elections that they would otherwise lose and that, with reform, Al Gore
would have been president. They reach this conclusion by fitting models of turnout and
vote choice using data on non-felons, and extrapolating the probability that ex-felons with
the same demographic characteristics would turnout and support Democratic candidates if
they were allowed to vote. This extrapolation rests on what Haselswerdt (2009) calls an
“equivalence assumption” that the disenfranchised population would vote at the same rates
1While we use the term “felon disenfranchisement” throughout the paper, the term “criminal disenfran-chisement” is more accurate as some states also disenfranchise because of misdemeanor convictions.
2See Sentencing Project (2011) for a recent summary
1

as the non-felons who share the same observable characteristics.
Subsequent work questions the validity of this assumption. Hjalmarsson and Lopez (2010)
and Burch (2012) argue that unobservable differences between felons and non-felons causes
such an assumption to overstate both the probability that felons would vote and their pref-
erence for Democratic candidates. Recent work that estimates the turnout rates of ex-felons
by matching criminal justice discharge records to voter files also generally find that sub-
stantially fewer enfranchised ex-felons vote than Uggen and Manza’s model predicts (Burch,
2007; Haselswerdt, 2009; Burch, 2011; Meredith and Morse, 2014).
While Hjalmarsson and Lopez (2010) conclude that felon disenfranchisement is electorally
inconsequential based on the low turnout rates of enfranchised ex-felons, we argue that
enfranchised ex-felons may vote at low rates because of felon disenfranchisement policy. In
particular, we theorize that misinformation about voting rights may inhibit ex-felon turnout.
Previous work shows that a high percentage of individuals with past criminal involvement
hold uncertain or incorrect beliefs about their right to vote (Drucker and Barreras, 2005;
Manza and Uggen, 2006). Because the cost of voting when ineligible is much greater than
the cost of not voting when eligible — casting a vote when ineligible is a felony — such
uncertainty about voting rights is likely to reduce voter turnout. Resolving uncertainty
about voting rights is difficult because election administrators and criminal justice officials
are often just as misinformed about the process (Ewald, 2005; Allen, 2011). Moreover,
the complexity of voting rights laws inhibits candidates, parties, and interest groups from
informing and mobilizing the ex-felon community on their own. As a result, we expect that
enfranchised ex-felons will vote at higher rates when they are actually informed about their
voting rights.
We also contend that bureaucratic procedures reduce ex-felon turnout. While most states
automatically restore voting rights after felons complete the requisite portions of their sen-
tence, a number of states place additional requirements on voting rights restoration, such
as payment of court costs or restitution. Clearly these requirements restrict the political
2
participation of ex-felons who do not satisfy these conditions. But we hypothesize that the
bureaucratic procedures used to implement these requirements also impose significant bar-
riers to political participation by ex-felons who do satisfy these conditions. We expect that
ex-felons will vote at lower rates when they are required to apply to restore their voting
rights instead of having these voting rights restored automatically.
We test our hypotheses by studying how the registration and turnout rates of ex-felons
in Iowa vary across time as voting rights restoration policies change. Historically, ex-felons
who wanted to regain the right to vote would submit an application to the governor, which
he generally granted. In 2005, Executive Order 42 eliminated the application process and
established a protocol by which voting rights would be automatically restored upon dis-
charge from the correctional system, although only some ex-felons were informed of this
change. Consistent with our expectations, ex-felon turnout increased between the 2004 and
2008 presidential elections, particularly among ex-felons who were officially informed that
their voting rights were restored. Executive Order 70, which reinstated the application pro-
cess for ex-felons discharged after 2011, subsequently reduced ex-felon turnout in the 2012
presidential election.
To bolster the external validity of our findings, we also estimate the registration and
turnout rates of ex-felons from Maine and Rhode Island. Advocates against felon disenfran-
chisement often promote Maine’s disenfranchisement policy because felons can vote while
incarcerated. As a result, we believe that fewer ex-felons are prevented from voting because
of misinformation in Maine than in most other states. Because the incarcerated population
can vote, Maine doesn’t need to purge their voter registration records from its voter regis-
tration database. The loss of voter registration records is another bureaucratic procedure
that may inhibit ex-felon participation. We focus on Rhode Island because it engages in the
most aggressive campaign that we know of to register ex-felons upon discharge. Consistent
with our expectations, we find higher ex-felon registration rates in Maine and Rhode Island
than in other states that we have studied. Yet, we do not find that ex-felons from Maine
3

and Rhode Island vote at substantially higher rates. These findings suggest that although
notification of voting rights and automatic restoration policies can improve ex-felon politi-
cal participation, misinformation and bureaucratic procedures are not the only reason why
enfranchised ex-felons vote at lower rates than demographically similar non-felons.
Although recently enfranchised ex-felons are less likely to vote than Uggen and Manza
(2002) and Manza and Uggen (2004, 2006) predict, this does not necessarily imply that felon
disenfranchisement is electorally irrelevant. While Manza and Uggen likely overestimate
the number of criminally disenfranchised individuals who would vote, our results suggest
there are a significant number of enfranchised citizens who believe that they are criminal
disenfranchised. Our findings also demonstrate the importance of the procedures used to
restore ex-felons’ voting rights. While felon disenfranchisement policy debates often focus
on the length of disenfranchisement, our results highlight that the ease and transparency of
the voting rights restoration process should also be considered when assessing punitiveness.
2 Our Argument
No scholarly consensus exists on the electoral consequences of felon disenfranchisement.
While Uggen and Manza (2002) and Manza and Uggen (2004, 2006) contend that Republican
candidates benefit from felon disenfranchisement — an argument bolstered by Republicans
reticence to vote for reform3 — Hjalmarsson and Lopez (2010) and Burch (2012) argue that
this Republican bias is overstated. One reason these scholars reach different conclusions
is that they disagree about the rates at which ex-felons would vote if eligible. Everyone
expects that, if eligible, ex-felons would vote at a lower rate than the general population,
as the demographics of felons - disproportionately male, racial and ethnic minorities, young,
less educated, unmarried - are associated with lower voter turnout. However, it remains an
open question whether ex-felons would vote at such a low rate that their electoral impact
3When explaining Republican opposition to a 2003 bill that would have made it easier for ex-felons torestore their voting right in Alabama, then-Party Chairman Marty Connors said, “As frank as I can be, we’reopposed to it because felons don’t vote Republican (Felons’ Rights More About Partisan Politics, 2013).”
4

would be negligible.4
One way to assess Uggen and Manza’s approach is to compare the predicted and actual
turnout behavior of recently enfranchised ex-felons. Uggen and Manza (2002) predict that
about 35 percent of the disenfranchised population would vote in presidential elections. Yet
a series of recent papers show that recently enfranchised ex-felons vote at substantially lower
rates (Burch, 2007; Haselswerdt, 2009; Burch, 2011; Meredith and Morse, 2014). These
papers measure the turnout rates of the recently enfranchised by searching statewide voter
files for records with a similar name and age to individuals in criminal justice discharge
records. Haselswerdt finds that only five percent of ex-felons discharged in Erie County,
New York prior to the 2004 presidential election voted in either the 2004 presidential or 2005
statewide election. Burch estimates that about twenty percent of male ex-felons voted in
Florida, Georgia, Michigan, Missouri, and North Carolina in the 2008 presidential election.
Meredith and Morse show that about ten percent of recently enfranchised ex-felons voted in
New Mexico and North Carolina in the 2008 presidential election and New York in the 2012
presidential election.
Two schools of thought exist for why ex-felons vote at lower rates than observably similar
non-felons. One suggests that the same variables that caused ex-felons to commit crimes
also cause them not to vote (Gerber et al., 2013). For example, belief in prosocial norms is
thought to both prevent criminal behavior and increase voter turnout. The other emphasizes
contact with the carceral state. Weaver and Lerman (2010) show that being convicted of a
crime reduces trust in the political system and this may lead to a reduced desire to participate
in politics. Both schools of thought though predict that ex-felons will vote at lower rates
than members of the general population who share the same gender, race, age, education
level, and marital status.
We contend that the existing literature understates the role that misinformation plays in
4Burch (2012) also contends that the candidate preferences of the criminally disenfranchised populationare sufficiently similar to the candidate preferences of the general voting population that election outcomeswould not change if the criminally disenfranchised population voted at higher rates.
5

inhibiting ex-felons’ political participation. Because felon disenfranchisement policy is set at
the state level and frequently administered at even more local levels of government, it is often
difficult to determine which specific policies apply to a particular ex-felon. Disenfranchise-
ment policies differ in subtle ways across states, with distinctions based on the specific crime
or the length of time since discharge. Moreover, many states’ policies governing when and
how ex-felons’ voting rights are restored have been particularly fluid (Ewald, 2009; Porter,
2010).
Surveys and interviews of individuals with past criminal involvement confirm that many
hold incorrect beliefs about their voting rights. Drucker and Barreras’s (2005) survey of in-
dividuals with a history of criminal justice involvement in Connecticut, New York, and Ohio
shows that about fifty percent of respondents held incorrect or uncertain views about their
right to vote. Likewise, Manza and Uggen (2006) report that a majority of the Minnesota
felons that they interviewed incorrectly believed that they would continue to be disenfran-
chised after they were discharged from prison, probation, and parole.
A number of barriers prevent ex-felons from resolving misinformation or uncertainty
about their voting rights. Candidates and campaigns risk backlash if their actions are seen
as mobilizing ex-felons. Burch (2013), for example, found no mentions of mobilizing ex-
felons in her content analysis of interviews with partisan voter outreach directors during the
2008 presidential campaign. Although some non-partisan voter outreach directors mentioned
mobilizing ex-felons specifically, variation in laws across states complicates such efforts by
inhibiting national campaigns. In states with some form of post-prison disenfranchisement,
voter outreach operations also must take great care in explaining laws in order to avoid mo-
bilizing ineligible ex-felons.5 Although election administrators and criminal justice officials
could help fill this information vacuum, previous work shows that they often hold incorrect
beliefs about how and when ex-felons voting rights are restored (Ewald, 2005; Manza and
5An early version of this paper was presented at a conference attended by people who design and im-plement voter outreach campaigns. Afterwards a number of attendees told us that although they thoughtit was important to inform ex-felons of their voting rights, their organization could not because of the riskassociated with doing so.
6

Uggen, 2006; Allen, 2011). For example, Allen finds that about half of the New York county
election boards inaccurately reported the conditions under which an ex-felon’s voting rights
could be restored.
Uncertainty about voting rights is likely to reduce voter turnout because the costs of
voting when ineligible is much greater than the costs of not voting when eligible. Since
Riker and Ordeshook (1968), political scientists have thought about voter turnout as a cost-
benefit calculus and uncertainty about voting rights introduces some additional consideration
into this calculus for ex-felons. An ex-felon who wishes to vote, but is uncertain of his or
her rights, may err by voting even though he or she is disenfranchised or by not voting
even though he or she is enfranchised. There are recent examples of harsh punishments,
including incarceration, for even unintentional illegal voting by ex-felons (Minnite, 2011b).
While there is also a cost associated with not casting a ballot when eligible, this cost is
orders of magnitude less than the cost associated with incarceration. Thus, ex-felons must
be almost certain they are enfranchised before they are willing to vote. We expect that
informing enfranchised ex-felons about their voting rights will increase their probability of
voting.
The bureaucratic procedures that a number of states use to restore voting rights are
also likely to reduce ex-felon voter turnout. A number of states place additional conditions
beyond time served on when ex-felons’ voting rights can be restored. For example, Arkansas
only restores voting rights after an ex-felon proves to their county clerk’s office that he or she
has paid applicable court costs, fines, parole or probation fees, and restitution. Tennessee
also considers whether an ex-felon has paid child support when deciding whether to restore
their voting rights. States typically use an application procedure to enforce these restrictions,
which are often burdensome in terms of their length, documentation required, and processing
time. We expect that eliminating applications will increase ex-felons’ probability of voting.
7

3 Research Design
Article II, Section 5 of the Iowa Constitution states that:
No idiot, or insane person, or person convicted of any infamous crime,
shall be entitled to the privilege of an elector.
Infamous crimes are those that are potentially punishable by imprisonment for at least
one year. As a result, all individuals convicted of a felony and some individuals convicted
of an aggravated misdemeanor are permanently stripped of their right to vote in Iowa.6
However, Section 48A.6 of the Iowa Code adds that:
The following persons are disqualified from registering to vote and from
voting:
1. A person who has been convicted of a felony as defined in section
701.7, or convicted of an offense classified as a felony under federal law.
If the person’s rights are later restored by the governor, or by the
president of the United States, the person may register to vote.
As the statute establishes no formal guidelines, the governor has substantial autonomy
in determining the conditions under which an ex-felon regains the right to vote. Prior to
July 4, 2005, ex-felons could submit an application for the restoration of voting rights.
The application required ex-felons to list all convictions, provide details on the fines, fees,
and court-ordered restitution paid, and “give reasons why you believe you should be granted
Executive Clemency.” Per the administrative rules of the Iowa Board of Parole, the governor
received a recommendation from the Parole Board about whether to grant the request for
voting rights, but the governor held the ultimate authority. If an application was granted,
the applicant would receive a certificate in the mail denoting the restoration of their voting
6For the remainder of the paper we use the term “ex-felon” in the context of Iowa to refer to an in-dividual who has been discharged from their entire sentence, including probation and parole, for either adisenfranchising aggravated misdemeanor or felony sentence.
8
rights. We present an example of such a certificate in Figure A.3.7 Both the application and
the certificate clearly distinguish the restoration of voting rights from a pardon.
Executive Order 42, which was signed by Governor Thomas Vilsack on July 4, 2005,
eliminated the need for ex-felons to submit an application in order to restore their voting
rights. This executive order established a protocol by which every month the Iowa Depart-
ment of Corrections would forward to the Governor’s Office a list of all felons discharged
from the criminal justice system in the previous month. While in theory the governor could
select which individuals on this list would have their voting rights restored, our understand-
ing is that in practice voting rights were restored to everyone. Once the governor restored
an individual’s right to vote, a certificate, like that in Figure A.3, was mailed to their last
known address. Executive Order 42 also granted a blanket restoration of voting rights to all
ex-felons who completed their sentences on or before July 4, 2005, including those ex-felons
whose applications were previously denied. However, such individuals were not mailed a
certificate.
Executive Order 70, which was signed by Governor Terry Branstad on January 14, 2011,
reinstated the application process that existed prior to July 4, 2005. Branstad, who previ-
ously served as governor from 1983 to 1999, was an outspoken critic of Executive Order 42
on the stated grounds that the payment of financial obligations owed to the state is a critical
component in determining whether the restoration of voting rights is appropriate (Dorman,
2005). The last group of ex-felons to have their voting rights automatically restored en masse
by the Governor’s Office were those individuals discharged in December 2010; those ex-felons
discharged beginning January 1, 2011 had to apply to restore their voting rights.8 Executive
Order 70 clearly states that it does not affect voting rights restored under Executive Order
42.
7The use of the “Restoration of Citizenship” header on this certificate is misleading because Trop v.Dulles, 356 U.S. 86 (1958) made it unconstitutional for citizenship rights to be revoked as punishment.
8Becky Elming, then-Executive Assistant to the Chief of Staff for Terry Branstad, communicated to usin an email on May 25, 2012 that some individuals discharged in December 2010 may not have had theirvoting rights restored if their discharge paperwork had not been processed before January 12, 2011.
9

Figure 1: Ex-Felon Voting Rights in Iowa by Presidential Election and Discharge Date
Figure 1 summarizes the implications of these Iowa policy changes for ex-felon voting
rights in the 2004, 2008, and 2012 presidential elections as a function of discharge date.
The figure highlights that ex-felons discharged in relatively close proximity may be treated
differently in the context of a specific election. For example, ex-felons discharged in July 2005
were informed that their voting rights had been restored by Executive Order 42 prior to the
2008 election, while ex-felons discharged a month earlier in June 2005 were not. Likewise,
while ex-felons discharged in January 2011 needed to submit an application in order to vote
in the 2012 presidential election, the voting rights of ex-felons discharged in December 2010
were automatically restored.
These Iowa policy changes allow us to implement three empirical tests of our hypotheses
about the effects of applications and notification on ex-felon political participation. We first
examine the behavior of the cohort of ex-felons discharged in 2002 and 2003. Members of
10

this cohort were eligible to apply to restore their voting rights prior to the 2004 presidential
election. Thus, the percentage of ex-felons who filed an application provides an upper bound
on the number of ex-felons who could have voted in this election legally. Because of the blan-
ket retroactive restoration instituted in Executive Order 42, we expect ex-felons discharged
in 2002 and 2003 to turn out at higher rates in 2008 than in 2004. Of course this cohort’s
turnout rate also could have increased between 2004 and 2008 as a result of the group being
four years older and further removed from the criminal justice system or from enthusiasm,
particularly among African-Americans, for Barack Obama’s candidacy. Thus, observing an
increase in this cohort’s turnout between 2004 and 2008 is evidence that is consistent with,
but not conclusive of, an application requirement reduceing ex-felon turnout.
Our second test focuses on the differences in the registration and turnout rates of those ex-
felons discharged just before and after July 4, 2005. Figure 1 shows that ex-felons discharged
just before and after July 4, 2005 were automatically eligible to vote in both the 2008 and
2012 presidential elections. However, only those ex-felons discharged after July 4, 2005 were
notified that they were eligible to vote. Because this should cause ex-felons discharged after
July 4, 2005 to be better informed about their voting rights, the discontinuous increase in
the probability of registering and voting as a result of being discharged after July 4, 2005
provides an estimate of the percentage of ex-felons who abstain from political participation
because of misinformation and uncertainty.
Our third test focuses on the differences in the registration and turnout rates of those
ex-felons discharged just before and after December 31, 2010. Figure 1 shows that only
ex-felons discharged on or before December 31, 2010 were automatically eligible to vote in
the 2012 presidential election. In contrast, ex-felons discharged after December 31, 2010
had to submit an application to legally vote in the 2012 presidential election. Because
the application requirement only applied to ex-felons discharged after December 31, 2010,
the discontinuous decrease in the probability of registering and voting as a result of being
discharged after December 31, 2010 provides an estimate of the percentage of ex-felons who
11

are dissuaded from voting because of an application requirement.
Focusing on Iowa allows us to benefit from some advantages commonly associated with
studies of a single political jurisdiction (Nicholson-Crotty and Meier, 2002; Golden, 2005;
Gehrig, 2006). Looking at how ex-felon participation changes within a state as restoration
policies change allows us to control for the unobserved determinants of ex-felon participation
that remain constant within the state across time. Moreover, because Executive Order 42
and Executive Order 70 apply different policies to different groups of ex-felons at the same
point in time, we also can implement some tests that hold fixed the unobserved determinants
of ex-felon participation within a given election. Focusing on a single state also allows us to
follow recent work that directly measures ex-felon political participation through a relatively
labor intensive process of matching public records.
Although focusing on a single state has some drawbacks for external validity (King,
Keohane and Verba, 1994), we think these findings from Iowa are of broad interest. A
number of other states use an application process similar to that used in Iowa to restore
the voting rights of ex-felons (Uggen, Shannon and Manza, 2012). While ex-felons in these
other states may not be affected by applications in the exact same manner, knowing the
demobilizing effect of applications in Iowa helps provide a sense of what the demobilizing
effect of applications are likely to be in these other states. A number of state legislatures
have also recently considered bills mandating that ex-felons be notified about their voting
rights without any evidence of how notification affects turnout (Meredith and Morse, 2014).
We further address concerns about external validity by also estimating the registration
and turnout rates of ex-felons from Maine and Rhode Island. The disenfranchisement policies
of Maine and Rhode Island should be among the least likely to dissuade ex-felons from
registering and voting. Maine is one of the two states that never restricts felons’ voting
rights. While Rhode Island disenfranchises incarcerated felons, dischargees are engaged in
a voting rights informational session that concludes with an administrator attempting to
12

register the ex-felon upon release.9. If restoration policies are the primary reason that ex-
felons abstain from registering and voting, then we expect that the turnout rates of ex-felons
from Maine and Rhode Island should approach the turnout rates of observably similar non-
felons. Thus, comparing the turnout rates that we find in administrative data to turnout
rates predicted by Uggen and Manza (2002) and Manza and Uggen (2004, 2006) helps to test
the efficacy of the assumptions that underlie their assessments of the electoral consequences
of felon disenfranchisement.
We also make methodological contributions to the growing literature that measures voter
turnout by matching administrative records to voter files. Existing literature often equates
the turnout rate to the number of administrative records that match a turnout record in the
voter file. But as we discuss in Section 4.4, matching error may cause the number of matches
to either underestimate or overestimate the actual turnout rate. We develop a number of
diagnostic tests that can be applied in other contexts to assess the prevalence of matching
errors.
4 Data
4.1 Discharge Data
We collected individual-level criminal justice records from Iowa, Maine, and Rhode Island.
The Iowa Department of Corrections provided individual-level records on the population
discharged from a felony or aggravated misdemeanor sentence between January 1, 2002 and
February 28, 2012.10 These data contain an individual’s full name, date of birth, gender,
most serious crime, and date of discharge. The date of discharge is the date on which an
ex-felon completed all prison, parole, and probation requirements, and thus became eligible
9This was part of a broad felon disenfranchisement referendum passed by voters in 2006 that is detailedin Owens and Orr (2011).
10As we note in section 3, aggravated misdemeanors are only disenfranchising when the sentence length isgreater than one year. Because data on sentence length is unavailable, we do not know who is disenfranchisedamong the population of aggravated misdemeanor discharges.
13
to have their voting rights restored under Iowa law.
The Maine Department of Corrections provided individual-level records on the population
discharged from a correctional facility or state prison between January 1, 2009 and December
31, 2010. These data contain an individual’s full name, date of birth, gender, race, and date
of discharge. Because Maine does not disenfranchise incarcerated felons, the the date of
discharge is not related to an ex-felons’ voting rights.
The Rhode Island Department of Corrections provided individual-level records on the
population discharged from a Rhode Island prison between January 1, 2009 and December
31, 2010. These data contain an individual’s first and last name, date of birth, gender, race,
and date of discharge. Because Rhode Island restores voting rights upon discharge from
prison, an individual is eligible to vote on this date.
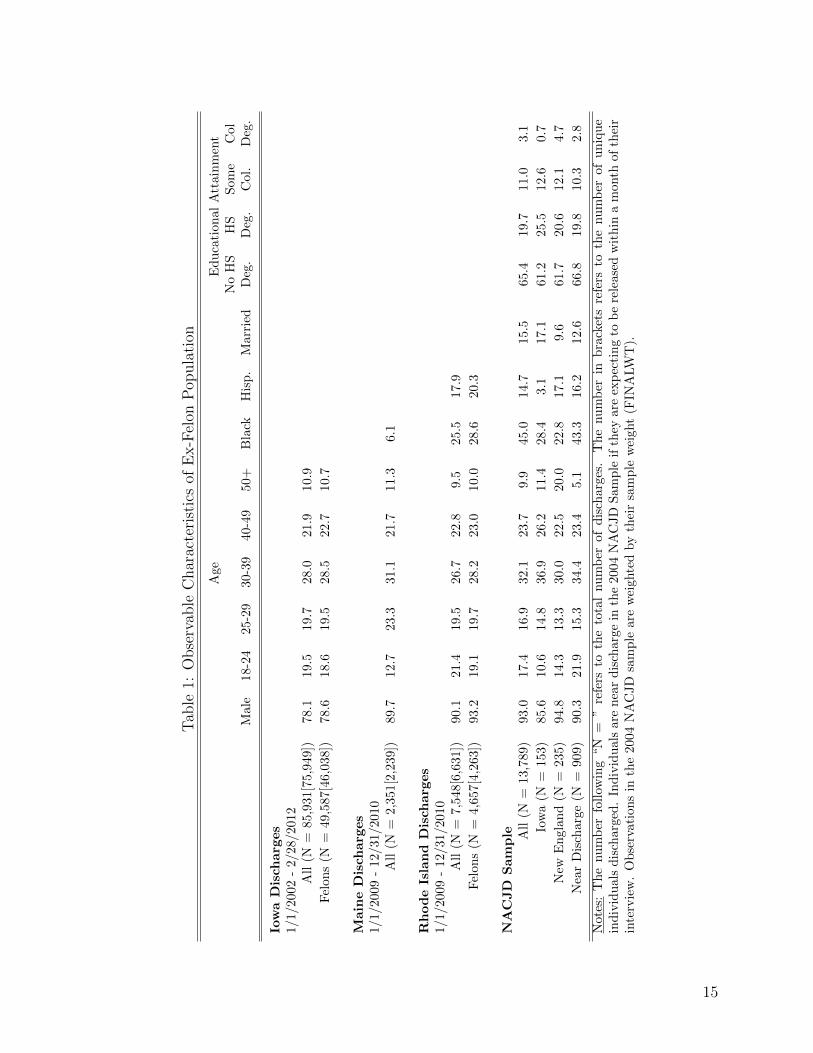
Table 1 compares the population of ex-felons discharged in Iowa, Maine, and Rhode Island
to the general incarcerated population. The characteristics of the incarcerated population
are estimated from the National Archive of Criminal Justice Data’s (NACJD) 2004 Survey
of Inmates in State and Federal Correctional Facilities. Both the NACJD survey and the
state discharge data show that the ex-felon population is overwhelmingly male, although
slightly less so in Iowa. The age distribution in the state discharge data is broadly similar
to the NACJD sample, with about 40 percent under the age of 30, 50 percent between age
30 and 50, and 10 percent over age 50. Given the state demographics, it is not surprising
that the NACJD survey and the state discharge data show that African-Americans make up
a smaller percentage of Iowa, Maine, and Rhode Island’s felon population. While none of
the state discharge data contains educational attainment, the NACJD survey shows similar
patterns of educational attainment among the general prison population, the Iowa prison
population, the New England prison population, and the subset of the prison population
that is about to be released.
14
Tab
le1:
Obse
rvab
leC
har
acte
rist
ics
ofE
x-F
elon
Pop
ula
tion
Age
Ed
uca
tion
al
Att
ain
men
tN
oH
SH
SS
om
eC
ol
Mal
e18-2
425-2
930-3
940-4
950+
Bla
ckH
isp
.M
arr
ied
Deg
.D
eg.
Col.
Deg
.
IowaDisch
arg
es
1/1/
2002
-2/
28/2
012
All
(N=
85,9
31[7
5,94
9])
78.1
19.5
19.7
28.0
21.9
10.9
Fel
ons
(N=
49,5
87[4
6,03
8])
78.6
18.6
19.5
28.5
22.7
10.7
MaineDisch
arg
es
1/1/
2009
-12
/31/
2010
All
(N=
2,35
1[2,
239]
)89
.712.7
23.3
31.1
21.7
11.3
6.1
RhodeIsland
Disch
arg
es
1/1/
2009
-12
/31/
2010
All
(N=
7,54
8[6,
631]
)90
.121.4
19.5
26.7
22.8
9.5
25.5
17.9
Fel
ons
(N=
4,65
7[4,
263]
)93
.219.1
19.7
28.2
23.0
10.0
28.6
20.3
NACJD
Sample A
ll(N
=13
,789
)93
.017.4
16.9
32.1
23.7
9.9
45.0
14.7
15.5
65.4
19.7
11.0
3.1
Iow
a(N
=15
3)85
.610.6
14.8
36.9
26.2
11.4
28.4
3.1
17.1
61.2
25.5
12.6
0.7
New
En
glan
d(N
=23
5)94
.814.3
13.3
30.0
22.5
20.0
22.8
17.1
9.6
61.7
20.6
12.1
4.7
Nea
rD
isch
arge
(N=
909)
90.3
21.9
15.3
34.4
23.4
5.1
43.3
16.2
12.6
66.8
19.8
10.3
2.8
Not
es:
Th
enu
mb
erfo
llow
ing
“N=
”re
fers
toth
eto
tal
nu
mb
erof
dis
charg
es.
Th
enu
mb
erin
bra
cket
sre
fers
toth
enu
mb
erof
un
iqu
ein
div
idu
als
dis
char
ged
.In
div
idu
als
are
nea
rd
isch
arg
ein
the
2004
NA
CJD
Sam
ple
ifth
eyare
exp
ecti
ng
tob
ere
lease
dw
ith
ina
month
of
thei
rin
terv
iew
.O
bse
rvat
ion
sin
the
2004
NA
CJD
sam
ple
are
wei
ghte
dby
thei
rsa
mp
lew
eight
(FIN
ALW
T).
15

4.2 Voter File Data
We used voter files to measure the political participation and partisan preferences of ex-
felons. Voter files are publicly available databases that provide demographic information
and turnout history for all registered voters in a state. The cost of these files, as well as
the demographic information available, varies substantially across states, although nearly all
states provide registrants’ full name, address, and either date of birth or age. Many states
also report party registration. We can use voter files to learn whether someone with a similar
full name and age as a particular ex-felon is registered to vote, voted in a particular election,
and registered with a particular party.
Our analysis uses two copies of the Iowa voter file and one copy of the Maine and Rhode
Island voter files. An important difference between these voter files is that Iowa and Rhode
Island report a registrant’s date of birth, while Maine reports a registrant’s year of birth. A
concern with using voter files to measure voter turnout is that voter records can be purged
once an individual is no longer an eligible voter in the state. We will underestimate ex-
felon turnout if turnout records of ex-felons are purged between Election Day and when
we acquire the voter file. Hence, we use an Iowa voter file from October 2010 to measure
2008 presidential election turnout and an Iowa voter file from January 2013 to measure 2012
presidential election turnout. We also use voter files from June 2013 and December 2013 to
measure 2012 presidential election turnout in Maine and Rhode Island respectively.
One limitation of voter files is that they only measure registration and turnout within a
single state. Although ex-felons are most likely to reside in the same state that they were
convicted in, some may move to other states. If these ex-felons also vote in other states,
we will underestimate ex-felon participation by focusing only on participation in the state
of conviction. To assess the prevalence of such turnout, we also use copies of the voter file
in Connecticut, Minnesota, Missouri, New York, and Ohio from various months in 2013.
Connecticut, Missouri, and New York report a registrant’s date of birth, while Minnesota
and Ohio report a registrant’s year of birth. We expect that if ex-felons move, they are most
16

likely to reside in states in close proximity to our states of interest. Thus, observing the
prevalence of turnout among Iowa ex-felons in Minnesota and Missouri and Rhode Island
ex-felons in Connecticut and New York is particularly informative for benchmarking the
amount of potential cross-state turnout.
4.3 Voting Rights Restoration Application Data
The Iowa State Archives provided information on who successfully applied to have their
voting rights restored. These data contain the full name, address, gender, date of birth,
date of application receipt, and date of acceptance decision for all applications for voting
rights restoration granted between March 1999 and March 2006. Unfortunately, the Iowa
State Archives does not maintain records of denied applications. To obtain this information,
we made a public records request to the Iowa Governor’s Office to get copies of all of the
applications for the restoration of voting rights filed between January 1, 2002 and July 4,
2005. We also requested copies of the response letters mailed to denied applicants and the
restoration certificates mailed to successful applicants.11 We extracted from these data the
full name, date of birth, and stated reason for denying the application.
4.4 Matching
We use an automated matching procedure to search for observations in the statewide voter
files that match the name and age of each ex-felon record. Implementing this procedure
requires that we specify a criterion by which the name and ages in the two sources match.
Two types of matching error were considered when designing this criterion. Another in-
dividual’s record in the voter file may be similar enough to an ex-felon’s that it satisfies
our matching criterion (McDonald and Levitt, 2008). Alternatively, the same individual’s
information may be presented in a sufficiently different manner in the voter file that it fails
11In the process of coding these data, we uncovered a small number of additional accepted applicationsthat were not included in the spreadsheet maintained by the Iowa State Archives.
17

to satisfy our matching criterion. The individual’s registration record may also fail to match
to their discharge record because it has been purged from the voter file or is contained in
another state’s voter file. The political participation of ex-felons will be overestimated if the
former type of matching error is more prevalent and underestimated if the later type of error
is more prevalent.
Section 8.1 in the Appendix describes and evaluates our matching procedure. We propose
a technique to assess the prevalence of incorrect matches by slightly permuting the ages of
ex-felons. Because the voter file records of non-felons should be almost equally likely to
falsely match our actual criminal discharge records as our age-permuted criminal discharge
records, the number of matches using the age-permuted records provides an estimate of the
number of false matches. We expect the prevalence of false matches to decrease as we increase
the number of variables that we match on. For example, we expect to observe fewer false
matches when we match on name and birth date instead of name and birth year. The results
presented in Section 6 and Section 8.1 in the Appendix are consistent with this intuition.
We observe almost no matches between our age-permuted discharge records and the voter
file in Iowa and Rhode Island, where both the discharge data and the voter file contain birth
date. In contrast, about one percent of our age-permuted discharge records match to the
voter file in Maine, where we can only match on full name and birth year.
The results presented in Section 8.1 also show that our matching procedure does not cause
us to substantially underestimate turnout. We reach this conclusion by studying the number
of cases where the corrections data and voter file records nearly match. We do systematically
miss some matches because information is presented differently in the two data sources. For
example, Table A.1 shows we underestimate female turnout by about seven percentage points
because women change their last names after being discharged. However, the total number
of cases affected by such matching error is relatively small. Likewise, Table A.4 and Table
A.7 in the Appendix show only a small number of ex-felons vote in states besides the state
in which they were sentenced. We conclude from this analysis that our matching procedure
18
underestimates the 2012 turnout of Iowa dischargees by four to five percentage points.
5 Iowa Results
5.1 Applications
We first examine the frequency that ex-felons applied to have their voting rights restored
prior to the signing of Executive Order 42 on July 4, 2005. We are not confident that
we have complete data on either applications or discharges prior to 2002. We are also
concerned that ex-felons discharged immediately before the signing of Executive Order 42
on July 4, 2005 lacked sufficient opportunity to submit an application.12 Thus, we specifically
focus on the cohort of individuals discharged between January 1, 2002 and December 31,
2003. Everyone discharged from a felony sentence and some of those discharged from an
aggravated misdemeanor sentence during this time period must have had an application for
the restoration of voting rights approved in order to legally vote in the 2004 presidential
election.
Table 2 shows that few ex-felons applied to restore their voting rights before the signing
of Executive Order 42. The first row shows that only 366 of the 8,646 individuals discharged
from a felony sentence in 2002 or 2003 applied to restore their voting rights prior to the
signing of Executive Order 42. The 4.2 percent application rate of individuals discharged
from a felony sentence was slightly higher than the 3.6 percent application rate of individuals
discharged from an aggravated misdemeanor sentence, although not all individuals discharged
from an aggravated misdemeanor sentence needed to apply to restore their voting rights.
About 80 percent of the applications from both felony and misdemeanor applicants were
ultimately approved.13 The most commonly cited reason for the denial of an application was
that the applicant had outstanding obligations (e.g., court costs, restitution, etc.) to the
12The median response time to an application was about 109 days, although there a small number of casesthat take over a year.
13Table 2 shows that eight of these approvals occurred after an initial application was denied.
19

Table 2: Voting Rights Restoration Applications by 2002 and 2003 Dischargees
(1) (2) (3) (4) (5)InitiallyDenied,Later
Discharged Applied Approved Approved Denied
Felony Discharges 8,646 366 299 3 64
4.23% 81.69% 0.82% 17.49%
Misdemeanor Discharges 5,762 209 163 5 41
3.63% 77.99% 2.39% 19.62%
state.
The results in Table 2 imply that at most 302 of the 8,646 (i.e. 3.5 percent) of the
individuals discharged from a felony sentence in 2002 and 2003 were eligible to vote in
the 2004 presidential election. Executive Order 42 changed Iowa’s felon disenfranchisement
policy so that members of this cohort were eligible to vote in the 2008 presidential election
without submitting an application. If the application requirement significantly inhibited
ex-felon political participation, we expect to observe that this cohort voted at higher rates
in the 2008 presidential election. Consistent with this expectation, Table 3 shows that 14.8
percent of this cohort voted in the 2008 presidential election.14
Some of the increased ex-felon turnout in 2008 could reflect the effect of time since
discharge rather than the effect of removing the application requirement. Thus, we also look
at the 2008 turnout rate of individuals discharged from a felony sentence in 2006 and 2007,
as they were at a similar time since discharge in 2008 as the cohort discharged in 2002 and
2003 was in 2004. Table 3 shows that ex-felons discharged in 2002 and 2003 and ex-felons
discharged in 2006 and 2007 turned out at nearly identical rates in 2008, providing further
14Seven percent of ex-felons discharged from a felony sentence between 2002 and 2003 are recorded asvoting in the 2004 presidential election, suggesting that some ex-felons may have voted in 2004 withouthaving submitted an application.
20

Table 3: Registration and Turnout Rates of Iowa Dischargees from 1/1/2002 - 9/30/2008
(1) (2) (3) (4) (5) (6) (7) (8)% of Reg. Affliated as: % Voted in:
No Oth.% Reg. Dem. Rep. Party Party 2004 2006 2008
Felony Discharges:All Years (N = 31,464) 29.1 42.1 14.1 43.7 0.1 5.9 3.9 14.6
2002-2003 (N = 8,646) 28.2 43.5 13.6 42.7 0.2 7.0 5.4 14.8
2006-2007 (N = 10,304) 29.3 41.3 14.5 44.1 0.1 4.9 2.8 14.4
Misdemeanor Discharges:All Years (N = 20,531) 46.9 38.7 16.3 44.9 0.1 19.1 9.1 23.4
2002-2003 (N = 5,762) 42.1 39.4 16.4 44.1 0.1 17.7 9.4 21.7
2006-2007 (N = 7,590) 47.1 38.2 15.6 46.0 0.2 17.6 7.8 22.8
evidence that removal of the application requirement is what caused turnout to increase.
Differences in the 2004 and 2008 electoral environments could also have potentially in-
creased ex-felon turnout between 2004 and 2008. Less educated and poorer citizens were
more likely to vote for the first time in 2008 (Minnite, 2011a), presumably because of Barack
Obama’s candidacy. We expect that individuals discharged from a felony sentence and in-
dividuals discharged from an aggravated misdemeanor sentence would be similarly affected
by such an Obama effect. Yet the turnout rate of individuals discharged from an aggravated
misdemeanor sentence in 2002 and 2003 only increased from 17.7 to 21.7 percent between
2004 and 2008. Moreover, a portion of this increase is likely due to the fact that some in-
dividuals discharged from an aggravated misdemeanor sentence were required to submit an
application to be eligible to vote in 2004. Thus, we conclude that changes in the electoral
environment are unlikely to be the primary cause of the increase in ex-felon turnout between
2004 and 2008.
We cannot rule out the possibility that some ex-felons abstained from applying to restore
their voting rights because they believed their application would be denied. The Vilsack
21

administration had substantial discretion to approve or reject applications prior to Executive
Order 42 and Table 2 suggests that most applications were approved. However, strategic
behavior may cause the observed acceptance rate to overstate the probability of success
in the general ex-felon population. Also, some ex-felons may have inaccurately assessed
the probability that their application would be approved. Thus, we cannot definitively say
whether it is the cost of finding and filling out the applications or beliefs about the probability
of acceptance that caused applications to reduce ex-felon turnout.
5.2 Notification
We next examine whether notifying ex-felons that their voting rights were restored by Ex-
ecutive Order 42 caused them to register and turnout at higher rates. Our empirical speci-
fication compares the registration and turnout rates of ex-felons discharged just before and
just after July 4, 2005. Our identification strategy is based on the assumption that ex-felons
discharged just before and after July 4, 2005 should be similar both in terms of observable
characteristics — such as their age and the amount of time they have been in the criminal
justice system — and unobservable characteristics — such as political knowledge and desire
to participate in politics. While both cohorts were automatically restored the right to vote,
only those discharged after July 4, 2005 were officially informed of the governor’s action.
Therefore, if we observe a discontinuous change in registration and voting rates from being
discharged after July 4, 2005, we can attribute it to notification.
Figure 2 shows how registration and 2008 turnout rates vary as a function of discharge
date. The top panel shows that while the probability of registering varies substantially from
month-to-month, there is a relatively steady decrease in the probability of being registered
as the time since discharge decreases. The exception is the jump in the probability of being
registered that corresponds with ex-felons being informed about the restoration of their
voting rights beginning in July 2005. About 33 percent of ex-felons discharged in the first
half of 2005 were registered, as compared to 38 percent of those discharged in the second
22

half of 2005. Likewise, about 16 percent of ex-felons discharged in the first half of 2005
voted in the 2008 presidential election, as compared to 19 percent of those discharged in the
second half of the year. Because there is no reason to expect a discontinuous increase in
both registration and turnout among those discharged in July 2005 absent the policy change,
these figures suggest that notifying ex-felons that their voting rights are restored increases
their probability of registering and voting.
We estimate and test the statistical significance of the discontinuous jump in registration
and turnout that occurred from being discharged after July 4, 2005 using Equation 1. We
define a control variable forcingi equal to the number of days after July 4, 2005 that individual
i was discharged from the Iowa criminal justice system (e.g., forcingi = 1 if individual i was
discharged on July 5, 2005 and forcingi = −2 if individual i was discharged on July 2,
2005). An outcome variable Yi (e.g., whether individual i is registered or voted in the 2008
presidential election) is then regressed on a constant, 1(forcing i > 0) (i.e., an indicator
for being discharged after notification begins), a kth-order polynomial of forcingi , and the
interaction between 1(forcing i > 0) and a kth-order polynomial of forcingi . Including a kth-
order polynomial of forcingi and the interaction between 1(forcing i > 0) and a kth-order
polynomial is a relatively standard approach to control for the effect that time since discharge
has on our outcome variables absent its effect on notification (Imbens and Lemieux, 2008).15
In this specification γ0, the coefficient on the indicator for being discharged after notification
begins, represents the discontinuous change in the probability of an ex-felon registering or
voting as result of being discharged after July 4, 2005.
Yi = Σkj=0(θj + γj1(forcing i > 0))forcing ji + εi (1)
We interpret our estimates of γ0 as the estimated effect of notification on registration and
15When choosing the value of k there is a trade-off between setting k too low and missing some of therelationship between time since discharge and our outcome variables and setting k too high and over-fittingthe relationship to sampling noise. As a result, we present results using k = 0, k = 1, and k = 3.
23

Figure 2: Registration and 2008 Presidential Election Turnout Rate by Month of Discharge
.25
.3.3
5.4
.45
Pe
rce
nt
Re
gis
tere
d
Jan02 Jan03 Jan04 Jan05 Jan06 Jan07 Jan08
.12
.14
.16
.18
.2.2
2P
erc
en
t V
otin
g in
20
08
Pre
sid
en
tia
l E
lectio
n
Jan02 Jan03 Jan04 Jan05 Jan06 Jan07 Jan08Month and Year of Discharge
Didn’t Receive Restoration Certificate Received Restoration Certificate
24

turnout. This interpretation relies on the assumption that individuals who are discharged
just after July 4, 2005 would register and vote at similar rates as individuals discharged on or
just prior to July 4, 2005, but for the difference in notification. To increase the plausibility of
this assumption, we restrict the sample to discharges that occur in relatively close proximity
to July 4, 2005 in our baseline specification. We are particularly worried that individuals who
were discharged before the 2004 presidential election may be more likely to vote in the 2008
presidential election (Meredith, 2009). Consequentially, the sample is restricted to 2005
discharges when estimating our baseline specification. However, the results are generally
robust to other bandwidths.
Our interpretation of γ0 is bolstered by the fact that the observable characteristics of
individuals discharged between January 1, 2005 and July 4, 2005 are similar to the observable
characteristics of individuals discharged between July 5, 2005 and December 31, 2005. Table
A.5 in the Appendix compares the cohorts’ previous political experience, age, gender, type
of crime, and type of discharge and shows that the cohorts are similar in terms of each of
these characteristics. The last two columns of Table A.5 show that Equation 1 also estimates
few significant discontinuous changes in the observable characteristics from being discharged
after July 4, 2005. Figure A.4 also shows that the number of discharges is roughly balanced
across months. These patterns also help assure us that the two groups are likely similar in
their unobserved characteristics as well.16
Table 4 presents our estimates of the increase in registration and turnout that result from
notification. Column 1 of the first row shows that individuals discharged after notification
begins are 5.1 (s.e. 1.0) percentage points (p.p.) more likely to be registered to vote. As
registration generally increases with time since discharge, this provides a lower bound on
the effect of notification on registration. We report regressions in Columns 2 and 3 that
16Another concern is that other interventions also may have been targeted at ex-felons discharged afterJuly 4, 2005. Our research uncovered no other criminal justice or campaign activity that was based on thissame cutoff. The fact that only ex-felons discharged after July 4, 2005 were notified that their voting rightswere restored was not an immediately obvious component of Executive Order 42. Moreover, no documentswe collected made it easier to observe information about ex-felons discharged before or after July 4, 2005.
25

control for the direct effect of time since discharge on registration using a first- and third-
order polynomial. Including these polynomials increases our point estimate on the effect of
notification on registration to 8.8 (s.e. 2.1) and 9.5 (s.e. 4.2) p.p. respectively.
Columns 7 through 12 of Table 4 show that turnout also significantly increased because
of notification. Column 10 shows that individuals who were notified about their voting rights
were 3.8 (s.e. 0.8) p.p. more likely to vote in the 2008 presidential election. Our estimate
of the effect of notification on 2008 turnout is 6.7 (s.e. 1.7) and 6.2 (s.e. 3.3) p.p. when
controlling for time since discharge using a first- and third-order polynomial. There is also
some evidence that notification increased turnout in the 2006 midterm election, although the
magnitude of the effect is smaller and its statistical significance varies depending on model
specification.
Because notification didn’t occur until 2005, there should not be any relationship between
notification and 2004 turnout. Columns 4 through 6 of Table 4 show that individuals who
would be notified in 2005 about their voting rights did not vote at higher rates in the 2004
presidential election.17 Thus, increased participation post-notification does not appear to
simply reflect pre-notification differences.
The remainder of Table 4 shows that the increase in participation from being discharged
after July 4, 2005 is greater for individuals discharged from a felony sentence than for in-
dividuals discharged from a misdemeanor sentence. Using a first-order polynomial we find
that individuals discharged from a felony sentence are 12.3 (s.e. 2.6) p.p. more likely to
be registered and 8.9 (s.e. 2.0) p.p more likely to turnout in 2008 if they were discharged
after July 4, 2005. Using the same specification we find that individuals discharged from an
aggravated misdemeanor are 3.8 (s.e. 3.4) p.p. more likely to be registered and 3.6 (s.e. 2.8)
p.p more likely to turnout in 2008. The bottom row of Table 4 shows that we can reject the
null hypothesis that the estimates are the same for felons and misdemeanors at the p = 0.045
17While we find a marginally significant negative effect of notification on 2004 presidential election turnoutwhen controlling for time trends with a third-order polynomial, this finding is not robust to alternativespecifications.
26

Tab
le4:
Dis
conti
nuou
sC
han
gein
Pol
itic
alP
arti
cipat
ion
Rat
esfr
omD
isch
arge
Aft
erJuly
4,20
05
(1)
(2)
(3)
(4)
(5)
(6)
(7)
(8)
(9)
(10)
(11)
(12)
Dep
.V
aria
ble
Reg
istr
atio
n2004
Tu
rnou
t2006
Turn
ou
t2008
Tu
rnou
tD
egre
eof
Pol
yn
omia
l(k
)0
13
01
30
13
01
3
All
Dis
charg
es0.
051
0.08
80.0
95
0.0
06
-0.0
09
-0.0
52
0.0
09
0.0
26
0.0
11
0.0
38
0.0
67
0.0
62
N=
8,59
2(0
.010
)(0
.021
)(0
.042)
(0.0
06)
(0.0
13)
(0.0
25)
(0.0
05)
(0.0
10)
(0.0
19)
(0.0
08)
(0.0
17)
(0.0
33)
Fel
ony
Dis
char
ges
0.08
10.
123
0.2
04
0.0
11
-0.0
02
-0.0
14
0.0
16
0.0
25
0.0
21
0.0
61
0.0
89
0.1
50
N=
5,04
4(0
.013
)(0
.026
)(0
.052)
(0.0
06)
(0.0
12)
(0.0
26)
(0.0
06)
(0.0
11)
(0.0
23)
(0.0
10)
(0.0
20)
(0.0
41)
Mis
dem
ean
orD
isch
arge
s0.
007
0.03
8-0
.040
-0.0
02
-0.0
16
-0.0
98
-0.0
02
0.0
27
-0.0
02
0.0
04
0.0
36
-0.0
53
N=
3,54
8(0
.017
)(0
.034
)(0
.067)
(0.0
13)
(0.0
25)
(0.0
47)
(0.0
09)
(0.0
18)
(0.0
32)
(0.0
14)
(0.0
28)
(0.0
54)
Diff
eren
ce0.
074
0.08
50.2
44
0.0
13
0.0
14
0.0
84
0.0
18
-0.0
02
0.0
23
0.0
57
0.0
53
0.2
03
p-v
alu
eon
Diff
eren
ce=
00.
000
0.04
50.0
04
0.3
56
0.6
16
0.1
17
0.0
91
0.9
12
0.5
52
0.0
01
0.1
20
0.0
03
Not
es:
Eac
hce
llre
pre
sents
the
esti
mat
edco
effici
ent
an
dro
bu
stst
an
dard
erro
rcl
ust
ered
by
dis
charg
eeonγ0
from
ad
iffer
ent
spec
ifica
tion
of
Equ
atio
n1.
Sam
ple
incl
ud
esd
isch
arge
sfo
rth
egiv
enoff
ense
typ
eb
etw
een
January
1,
2005
an
dD
ecem
ber
31,
2005.
27

and p = 0.120 level for registration and 2008 turnout, respectively. The differences between
felons and misdemeanors are greater when we control for time since discharge using a third-
order polynomial. While we cannot observe data on the percentage of misdemeanors that
were disenfranchised, we suspect that we observe this difference because many misdemeanors
were not disenfranchising.
We present a number of robustness checks in the Appendix to provide further evidence
that the patterns in Table 4 represent the effect of notification. Because the voter file contains
the of date of registration, we can examine when this increase in registration occurred among
those discharged after July 4, 2005.18 If this increase is caused by notification, there should
be no difference in registration before notification occurs. Consistent with this expectation,
Table A.6 shows only a 1.1 (s.e. 0.8) p.p. difference in registration prior to December 31,
2004. The remainder of Table A.6 shows that not all of the divergence in the number of
registrants occurred immediately after notification, but that the registration gap between
the two cohorts expanded by three p.p. between 2006 and 2008.
A concern about using Equation 1 to estimate the effect of notification is that it might
partially reflect differences in the types of individuals who get discharged in the first and
second halves of the year. To investigate this possibility, we estimate the same equation
in neighboring years where notification does not discontinuously change on July 4th. The
results of these placebo regressions, displayed in Figure A.5, do not show a general pattern
of increased voting in 2008 among individuals discharged after July 4th. In three of the
five placebo years the point estimates are in the opposite direction, and only when using a
first-order polynomial in 2007 is an estimate in the same direction marginally statistically
significant. However, we do observe in 2002 a negative effect of being discharged after July
4 that is of a similar magnitude and level of statistical significance as our actual estimates.
This finding suggests we may be somewhat understating the degree of uncertainty in our
estimates.
18Date of registration refers to the last date a registrant updated their registration. If someone registeredto vote in 2000, but updated their registration in 2005, their date of registration is listed as 2005.
28

As a final robustness check, we look at how the estimated effect of notification varies as we
increase and decrease the range of observations that are included in our sample. Our baseline
sample consists of individuals who were discharged within six months of the policy change
(i.e., a bandwidth of six months). Figure A.6 shows that while there is some sensitivity to
bandwidths of three months or less, the estimates of the effect of notification on 2008 turnout
are generally robust to the choice of bandwidth.
5.3 Executive Order 70
If reinstating the application requirement reduced ex-felon political participation, we expect
to observe a discontinuous drop in registration and turnout for those ex-felons discharged
after December 31, 2010. Consistent with this expectation, Figure 3 shows that individuals
discharged in the fourth quarter of 2010 were more likely to be registered and vote in the
2012 presidential election than individuals discharged in the first quarter of 2011. It also
shows that those ex-felons who were notified that their voting rights were restored under
Executive Order 42 continued to be registered and vote in the 2012 presidential election
more often than those who were not notified.
Table 5 presents formal statistical tests of the patterns observed in Figure 3 using Equa-
tion 1. The discontinuous decline in both registration and 2012 turnout from being dis-
charged after December 31, 2010 is both statistically significant and substantively large.
The decline in registration is estimated to be 4.8 (s.e. 2.1) and 9.0 (s.e. 4.3) p.p. when
first- and third-order polynomials are used to control for time-trends respectively. The de-
cline in 2012 turnout is quite similar. Again, the impact is primarily concentrated on felon
dischargees; both the registration rate and 2012 turnout rate of felony discharges dropped
by almost ten percentage points.
If the discontinuous decrease in registration and turnout rates after December 31, 2010
reflects the effect of Executive Order 70, we should not observe any discontinuous difference
29

Figure 3: Registration and 2012 Presidential Election Turnout Rate by Quarter of Discharge
.3.3
2.3
4.3
6.3
8.4
Pe
rce
nt
Re
gis
tere
d
2002q1 2004q1 2006q1 2008q1 2010q1 2012q1
.14
.16
.18
.2.2
2P
erc
en
t V
otin
g in
20
12
Pre
sid
en
tia
l E
lectio
n
2002q1 2004q1 2006q1 2008q1 2010q1 2012q1
Not Notified that Eligible in 2008 Notified that Eligible in 2008
Notified that Eligible in 2010 Notified that Eligible in 2010
Must Apply to be Eligible in 2012
30

Tab
le5:
Dis
conti
nuou
sC
han
ges
in20
12P
resi
den
tial
Ele
ctio
nT
urn
out
and
2013
Reg
istr
atio
nR
ates
(1)
(2)
(3)
(4)
(5)
(6)
(7)
(8)
(9)
(10)
(11)
(12)
Dep
.V
aria
ble
Reg
istr
ati
on
2008
Tu
rnou
t2010
Tu
rnou
t2012
Turn
ou
tD
egre
eof
Pol
yn
omia
l(k
)0
13
01
30
13
01
3
Disch
arg
ed
After7/4/2005:
All
Dis
char
ges
0.04
90.0
91
0.1
16
0.0
40
0.0
64
0.0
64
0.0
16
0.0
28
0.0
26
0.0
32
0.0
37
0.0
34
N=
8,59
2(0
.010
)(0
.020)
(0.0
42)
(0.0
08)
(0.0
16)
(0.0
32)
(0.0
06)
(0.0
12)
(0.0
24)
(0.0
08)
(0.0
17)
(0.0
33)
Fel
ony
Dis
char
ges
0.07
00.1
08
0.1
66
0.0
63
0.0
83
0.1
12
0.0
24
0.0
37
0.0
61
0.0
47
0.0
53
0.0
75
N=
5,04
4(0
.013
)(0
.025)
(0.0
52)
(0.0
10)
(0.0
19)
(0.0
39)
(0.0
07)
(0.0
14)
(0.0
30)
(0.0
10)
(0.0
20)
(0.0
40)
Mis
dem
ean
orD
isch
arge
s0.
017
0.0
68
0.0
56
0.0
08
0.0
35
0.0
03
0.0
05
0.0
15
-0.0
18
0.0
09
0.0
14
-0.0
18
N=
3,54
8(0
.017
)(0
.033)
(0.0
66)
(0.0
14)
(0.0
27)
(0.0
54)
(0.0
11)
(0.0
21)
(0.0
40)
(0.0
14)
(0.0
28)
(0.0
55)
Disch
arg
ed
After12/31/2010:
All
Dis
char
ges
-0.0
61-0
.048
-0.0
90
-0.0
08
-0.0
28
-0.0
63
-0.0
04
-0.0
03
-0.0
13
-0.0
35
-0.0
50
-0.0
90
N=
8,51
4(0
.010
)(0
.021)
(0.0
43)
(0.0
08)
(0.0
15)
(0.0
30)
(0.0
05)
(0.0
10)
(0.0
21)
(0.0
08)
(0.0
16)
(0.0
34)
Fel
ony
Dis
char
ges
-0.1
14-0
.097
-0.1
36
0.0
00
-0.0
06
-0.0
17
-0.0
14
0.0
00
0.0
10
-0.0
65
-0.0
77
-0.0
92
N=
4,61
5(0
.012
)(0
.024)
(0.0
47)
(0.0
07)
(0.0
13)
(0.0
24)
(0.0
05)
(0.0
09)
(0.0
18)
(0.0
09)
(0.0
17)
(0.0
34)
Mis
dem
ean
orD
isch
arge
s-0
.008
-0.0
17
-0.0
86
-0.0
23
-0.0
73
-0.1
59
0.0
05
-0.0
16
-0.0
58
-0.0
05
-0.0
33
-0.1
21
N=
3,89
8(0
.016
)(0
.033)
(0.0
70)
(0.0
14)
(0.0
28)
(0.0
59)
(0.0
10)
(0.0
20)
(0.0
43)
(0.0
14)
(0.0
29)
(0.0
62)
Not
es:
Eac
hce
llre
pre
sents
the
esti
mat
edco
effici
ent
an
dro
bu
stst
an
dard
erro
rcl
ust
ered
by
dis
charg
eeonγ0
from
ad
iffer
ent
spec
ifica
tion
of
Equ
ati
on
1.R
egre
ssio
ns
esti
mat
ing
7/4/
2005
dis
conti
nu
ity
incl
ud
ed
isch
arg
esfo
rth
egiv
enoff
ense
typ
eb
etw
een
Janu
ary
1,
2005
an
dD
ecem
ber
31,
2005
an
dre
gres
sion
ses
tim
ati
ng
12/3
1/20
10d
isco
nti
nuit
yin
clu
de
dis
charg
esfo
rth
egiv
enoff
ense
typ
eb
etw
een
Ju
ly1,
2010
an
dJun
e30,
2011.
31

in registration or turnout rates prior to this date. Columns 4 though 9 of Table 5 show
no discontinuous change in 2008 or 2010 turnout from being discharged after December 31,
2010 among felon dischargees, although we do see some evidence of pretreatment differences
among misdemeanor discharges. Unreported regressions also show that the entire discontin-
uous decrease in registration among those discharged after December 31, 2010 is caused by
registration that occurred after someone was discharged from correctional system.19
Table 5 also shows that individuals who were notified that their voting rights were restored
by Executive Order 42 continued to vote at higher rates in the 2010 midterm and 2012
presidential elections than individuals who were not notified that their voting rights were
restored. We estimate that being discharged after July 4, 2005 increased the probability
that a felon dischargee voted in 2010 and 2012 by 3.7 (s.e. 1.4) p.p. and 5.3. (s.e. 2.0)
p.p. respectively. This is somewhat less than the eight p.p. increase we estimated in 2008.
In contrast, we find that misdemeanor discharges who were discharged just before and after
July 4, 2005 voted at similar rates in 2010 and 2012.
6 Maine and Rhode Island Results
The results in the previous section strongly support our hypothesis that misinformation and
bureaucratic procedures reduce ex-felon turnout. In this section we examine the extent to
which misinformation and bureaucratic procedure explain why ex-felons vote less often than
observably similar non-felons. Table 6 shows that 13 percent of ex-felons discharged in Iowa
in 2009 and 2010 — the final cohort of dischargees to get their voting rights automatically
restored under Executive Order 42 — voted in the 2012 presidential election. Even after
correcting for matching error, this is far below the 35 percent turnout rate predicted by
Uggen and Manza (2002).20 This section estimates the rate at which ex-felons from two other
19While in theory all registration should have occurred post-discharge for those discharged after December31, 2010, it appears that Iowa failed to purge some previously registered ex-felons from the voter file priorto the 2012 presidential election.
20Some of these dischargees were ineligible to vote in the 2012 presidential election because they wereconvicted of another felony or disenfranchising aggravated misdemeanor before November 6, 2012. Although
32

states with clear voting rights restoration policies register and vote in the 2012 presidential
election. If dischargees from Maine and Rhode Island also vote substantially less than Uggen
and Manza predict, then we would conclude that there are other factors in addition to
misinformation and bureaucratic procedures that cause felons to vote at lower rates than
observably similar non-felons.
Even though Maine never disenfranchises incarcerated individuals, Table 6 shows that
ex-felons register and vote at low rates post-discharge. 39.1 percent of dischargees match
a registration record in the Maine voter file and 12.1 percent of dischargees match a 2012
turnout record, which is a slight increase from the 11.4 percent that match to a 2008 turnout
record.
Because we can match only on year of birth instead of date of birth in the Maine, we
are more concerned about an ex-felon’s discharge records matching other individuals’ voter
records in Maine. Table 6 shows there are more false matches, although the number of such
matches is still relatively low. Slightly more than one percent of our age-permuted discharge
records match a registrant’s in the voter file. Thus, we conclude that the ex-felon registration
rate is at least 38 percent and the ex-felon turnout rate is at least 11.5 percent.
Table 6 reveals broadly similar patterns in Rhode Island. A slightly higher percentage of
dischargees are registered to vote in Rhode Island than in Maine. 45.8 percent of individuals
discharged from a Rhode Island prison match a registration record in Rhode Island. This
registration rate drops slightly to 43.3 percent if we focus on individuals discharged from
a felony sentence. Just under 10 percent of discharges match to a 2012 turnout record.
Because we observe almost no matches between our age-permuted discharge data and the
voter file, we conclude that just about all of the matches between the discharge and voter
file records in Rhode Island accurately reflect the political participation of the dischargee.
we were unable to get the exact number from the Iowa Department of Correction, we were able to scrape thesubsequent conviction history of these dischargees from http://www.doc.state.ia.us/OffenderInfo.asp.Based on these records, we conclude that about 10 percent of these dischargees were ineligible to vote in the2012 presidential election.
33

Tab
le6:
Reg
istr
atio
n,
Par
tyA
ffiliat
ion,
and
Turn
out
of20
09an
d20
10D
isch
arge
esin
Mai
ne,
Rhode
Isla
nd,
and
Iow
a
(1)
(2)
(3)
(4)
(5)
(6)
(7)
(8)
%of
Reg
.A
fflia
ted
as:
%V
ote
din
:N
oO
th.
%R
eg.
Dem
.R
ep.
Part
yP
art
y2008
2010
2012
Iowa:
All
Dis
char
ges
(N=
17,5
52):
Bir
thD
ate
37.2
38.8
15.9
44.8
0.5
12.7
7.0
18.2
Bir
thD
ate
-35
Day
s0.0
No
Reg
iste
red
Vote
rs0.0
0.0
0.0
Bir
thD
ate
+35
Day
s0.0
0.0
100.0
0.0
0.0
0.0
0.0
0.0
Fel
ony
Dis
char
ges
(N=
9,9
60):
Bir
thD
ate
26.7
39.6
14.7
45.2
0.5
5.1
4.4
13.3
Bir
thD
ate
-35
Day
s0.0
No
Reg
iste
red
Vote
rs0.0
0.0
0.0
Bir
thD
ate
+35
Day
s0.0
0.0
100.0
0.0
0.0
0.0
0.0
0.0
Maine:
All
Dis
char
ges
(N=
2,2
39):
Bir
thY
ear
39.1
29.6
16.4
45.5
8.4
11.4
6.9
12.1
Bir
thY
ear
-2
Yea
rs1.3
13.8
17.2
58.6
10.3
0.7
0.5
0.6
Bir
thY
ear
+2
Yea
rs1.1
32.0
36.0
28.0
4.0
0.7
0.5
0.7
RhodeIsland:
All
Dis
char
ges
(N=
6,6
31):
Bir
thD
ate
45.8
44.4
6.0
49.1
0.4
7.9
2.7
9.8
Bir
thD
ate
-35
Day
s0.0
50.0
0.0
50.0
0.0
0.0
0.0
0.0
Bir
thD
ate
+35
Day
s0.0
33.3
33.3
33.3
0.0
0.0
0.0
0.0
Fel
ony
Dis
char
ges
(N=
4,2
63):
Bir
thD
ate
43.3
46.5
5.6
47.6
0.3
5.5
2.4
9.1
Bir
thD
ate
-35
Day
s0.0
No
Reg
iste
red
Vote
rs0.0
0.0
0.0
Bir
thD
ate
+35
Day
s0.0
0.0
50.0
50.0
0.0
0.0
0.0
0.0
34

We are concerned that dischargees from Rhode Island may be more likely to move to,
and subsequently vote in, other states because Rhode Island is so small. However, Table A.7
shows that there is minimal registration and 2012 turnout by Rhode Island dischargees in
either Connecticut and New York, where we expect to observe the most out-of-state turnout.
This suggests there is also little registration or 2012 turnout in other states as well.
Another concern is that some individuals discharged from a Rhode Island prison in 2009
and 2010 were ineligible to vote in the 2012 presidential election because they were in-prison
for another felony sentence. Although we were unable to get precise information on 2012
election eligibility, we were able to use the online Rhode Island Inmate Search to find the
percentage of 2009 and 2010 dischargees who were listed as being incarcerated in January
of 2014.21 We find that about 14.8 percent of all dischargees and 17.2 percent of felon
dischargees were incarcerated in January 2014, which suggests that about 11 percent among
non-incarcerated ex-felons voted in 2012.22
We use the approach of Uggen and Manza (2002) to compare the turnout rates we observe
in Maine and Rhode Island to demographically similar members of the general public. Table
A.8 in the Appendix shows how race, ethnicity, educational level, sex, marital status, age,
and employment status relate to the probability of self-reported turnout in the 2012 Current
Population Survey. Ideally, we would observe these variables for all of the dischargees,
use the results reported in Table A.8 to construct a predicted turnout probability for an
individual with the observable characteristics of each dischargee, and average this predicted
turnout probability across all of the dischargees. Unfortunately, educational, marital, and
employment status are not observed in the Maine and Rhode Island discharge data. Instead,
we assume that the characteristics of dischargees in Maine and Rhode Island are similar to
those individuals who reported that they would be released within the next month on the
2004 NACJD Survey of Inmates in State and Federal Correctional Facilities.23 Using the
21The web address of this inmate search is http://www.doc.ri.gov/inmate_search/search.php229.1 / (100 - 17.2) ≈ 11.0.and 9.8 / (100 - 14.8) ≈ 11.5.23The characteristics of such individuals are summarized in the bottom row of Table 1. Results are nearly
identical if we use the characteristics of all respondents or respondents from New England.
35

regression coefficients reported in Column 2 of Table A.8, we find the lower bound on the
average predicted turnout probability of such individuals using Uggen and Manza’s approach
is 32 percent.24
Put together, the results in this section highlight both the importance and limits of voting
rights restoration policies on ex-felon political participation. Rhode Island’s attempt to
register ex-felons upon discharge is the most pro-active state policy we know of to reintegrate
ex-felons into the electoral process. Thus, it is not surprising that we observe larger estimates
of the ex-felon registration rate in Rhode Island than in Iowa, Maine, New Mexico, New York,
and North Carolina, often by a wide margin (Meredith and Morse, 2014). Yet, the ex-felon
turnout rate in Rhode Island is less than ten percent and not noticeably higher than the
ex-felon turnout rates in these other states. Moreover, we estimate that the ex-felon turnout
rate in Maine and Rhode Island lags the turnout rate of demographically similar members
of the general public by at least 20 percentage points despite few immediate barriers to ex-
felon voting in these states. This suggests that there are other forces besides voting rights
restoration policies that contribute to large turnout gap between felons and non-felons.
7 Discussion
We show that recently enfranchised ex-felons vote less often than demographically similar
members of the general public. This suggests that Uggen and Manza (2002) substantially
overstate the number of citizens who would vote absent felon disenfranchisement. Extending
their methodology to the 2012 election, we would expect felon disenfranchisement to prevent
over two million votes. But our finding that less than 15 percent of recently enfranchised ex-
felons voted in Iowa, Maine, and Rhode Island suggests that actually fewer than one million
disenfranchised citizens would have voted. This significant discrepancy brings into question
24Because employment status is not observed, we assume that no ex-felons are employed to construct thislower bound on predicted turnout rate. We also do not adjust for the finding in Column 3 of Table A.8 thatthe general public votes at a significantly higher rate in Maine and an insignificantly higher rate in RhodeIsland than in the rest of the country.
36

Uggen and Manza’s (2002) claim that felon disenfranchisement is electorally consequential.
Three caveats to this conclusion are worth considering. First, the population of ex-felons
that we study in Iowa, Maine, and Rhode Island may not be representative of the ex-felon
population more generally. Second, these states’ electoral environments may not encourage
ex-felon voter turnout as much as we conjecture. Finally, felon disenfranchisement may still
be electorally consequential even if we are accurately measuring the rate at which ex-felons
vote. We discuss each of these caveats in turn.
Our Maine and Rhode Island analysis focuses on the registration and turnout rates of
ex-felons who were recently incarcerated. Many felons though are never incarcerated, and
we expect that felons sentenced only to probation are more likely to vote than felons who
are incarcerated. This potentially explains why we observe a slightly higher turnout rate
in Iowa, where we also observe felons sentenced to only probation, than in Maine or Rhode
Island.
Our analysis also focuses on ex-felons’ turnout in relatively close proximity to discharge.
The vast majority of states do restore voting rights on or before the completion of a sen-
tence, but because some disenfranchise ex-felons for life, nearly half of the disenfranchised
population is found in just twelve states, as the stock of ex-felons accumulates across time
Uggen, Shannon and Manza (2012). A sizable portion of the disenfranchised population is
much further removed from the criminal justice system than the population we study. While
we observe that ex-felons discharged in Iowa in 2002 and 2010 voted at similar rates in the
2012 presidential election, this does not imply that ex-felons discharged in previous decades
vote at the same rate as ex-felons discharged in the 2000s. In Section 8.2 in the Appendix
we do show that individuals discharged from a felony sentence in the 1990s in Iowa only vote
at a slightly higher rate than individuals discharged from a felony sentence in the 2000s.
Unfortunately, Maine and Rhode Island do not have credible data on discharges before the
2000s, and we were unable to assess the turnout rates of ex-felons who are further removed
from the criminal justice system in either state.
37

Our findings suggest that application requirements in lifetime disenfranchisement states
prevent a sizable number of ex-felons from voting. We show that requiring applications
reduced ex-felon turnout in Iowa by about ten percentage points. A similar application
process is currently active in a number of states, including Alabama, Florida, Kentucky,
Mississippi, and Tennessee. Uggen, Shannon and Manza (2012) estimate that more than
2,000,000 ex-felons are disenfranchised in these five states, which suggests that about 200,000
more ex-felons would vote if these application requirements were eliminated.
While we find clear evidence that being subject to an application requirement reduced
ex-felon turnout in Iowa in 2012, it is possible that reinstating the application requirement
also reduced the turnout of ex-felons who were not subject it. While Executive Order 70
states that it doesn’t affect voting rights restored by Executive Order 42, this may not have
been commonly understood. Notification might have increase turnout over time had it not
been for this additional misinformation. Executive Order 70 also may have made groups
more hesitant to target get-out-the-vote (GOTV) efforts at ex-felon communities, as doing
so risked encouraging a felony. Because GOTV activity is particularly effective at mobilizing
low propensity voters in presidential elections (Arceneaux and Nickerson, 2009), turnout is
likely to drop in response to Executive Order 70.
The electoral environments in Maine and Rhode Island also may not be as conducive
to ex-felon turnout as we claim. Maine is one of two states that allows felons to vote and
Rhode Island is the most aggressive state in registering ex-felons upon discharge. Thus, we
assumed that there were fewer structural barriers to ex-felon turnout in these states than in
just about any others. Yet, Rhode Island, and to a lesser extent Maine, lacked competitive
races in 2012, meaning there was less GOTV activity than in battleground states. Moreover,
there may still be ample confusion in Maine about voting rights, as disenfranchisement is
the policy in almost every other state and there is no notification process that we are aware
of.
The potential for misinformation about voting rights in Maine highlights the important
38
distinction between the number of disenfranchised citizens who would vote and the number
of citizens who abstain from voting because of felon disenfranchisement laws. Our results
suggest that many enfranchised ex-felons are de facto disenfranchised because they are mis-
informed about their voting rights. Uggen and Manza’s (2002) analysis of the electoral
consequence of felon disenfranchisement implicitly assumes that felon disenfranchisement
only affects the political participation of the population that is currently disenfranchised.
Our results suggest that misinformation may also cause felon disenfranchisement to affect
the participation of enfranchised citizens. Specifically, we find that ex-felons discharged in
Iowa before July 4, 2005 were five to ten percentage points less likely to vote in subsequent
presidential elections than ex-felons discharged after. This finding is consistent with our
hypothesis that many enfranchised ex-felons abstain from voting because they are uncertain
about their voting rights.
The electoral consequences of de facto disenfranchisement are potentially huge. Uggen,
Shannon and Manza (2012) estimates that the ex-felon population is about three times larger
than the population currently under some form of supervision. Thus, a five percentage point
increase in the participation rate of the ex-felon population has roughly the same electoral
impact as a fifteen percent point increase in the participation rate of the population currently
under supervision. While our results suggest that Uggen and Manza (2002) overestimate the
percentage of ex-felons that would vote, this disparity could be more than offset by the
demobilizing effects of disenfranchisement policy on the enfranchised population. Future
work should focus on more precisely quantifying the amount of de facto disenfranchisement,
especially in communities that are most likely to be misinformed.
Our finding that informative mailings increased turnout is important because Brennan
Center data shows that only about half of states are statutorily required to notify ex-felons
about their voting rights.25 Within the last ten years, Louisiana, Minnesota, New Mexico,
New York, and North Carolina considered bills that require the state to notify ex-felons about
25The Brennan Center data was reported to us by Erika Wood, Deputy Director of the Democracy Program,in an email dated March 11, 2011.
39

their voting rights (Meredith and Morse, 2014). Our results demonstrate that notification
can increase ex-felon participation. However, legislating an ex-felon notification policy will
not necessarily translate into an ex-felon becoming better informed about their voting rights.
Unlike Iowa, New Mexico, New York, and North Carolina delegate responsibility for notifica-
tion to individual members of criminal justice agencies. Meredith and Morse (2014) find no
evidence that turnout increased after these notification laws were passed. This brings into
question whether notification protocols are actually implemented. Further work is needed
to better understand how the specifics of notification policy relate to its effectiveness.
40

References
Allen, Jessie. 2011. “Documentary Disenfranchisement.” Tulane Law Review 86:389–464.
Arceneaux, Kevin and David W. Nickerson. 2009. “Who Is Mobilized to Vote? ARe-Analysis of 11 Field Experiments.” American Journal of Political Science 53(1):1–16.
Burch, Traci. 2007. Punishment and Participation: How Criminal Convictions ThreatenAmerican Democracy. PhD thesis Harvard University.
Burch, Traci. 2011. “Turnout and Party Registration among Criminal Offenders in the2008 General Election.” Law & Society Review 45(3):699–730.
Burch, Traci. 2012. “Did Disfranchisement Laws Help Elect President Bush? NewEvidence on the Turnout Rates and Candidate Preferences of Florida’s Ex-Felons.”Political Behavior 34(1):1–26.
Burch, Traci. 2013. Trading Democracy for Justice. University of Chicago Press.
Dorman, Todd. 2005. “Former Governor Criticizes Vilsack’s Voting Rights for Felons.”Quad-City Times, The (IA) June 21:A6.
Drucker, Ernest and Ricardo Barreras. 2005. “Studies of Voting Behavior and FelonyDisenfranchisement Among Individuals in the Criminal Justice System in New York,Connecticut, and Ohio.” The Sentencing Project.URL: http: // www. sentencingproject. org/ doc/ publications/ fd_studiesvotingbehavior. pdf
Ewald, Alec C. 2005. “A “Crazy–Quilt” of Tiny Pieces: State and Local Administration ofAmerican Criminal Disenfranchisement Law.” The Sentencing Project.URL:http: // www. sentencingproject. org/ doc/ publications/ fd_ crazyquilt. pdf
Ewald, Alec C. 2009. “Criminal Disenfranchisement and the Challenge of AmericanFederalism.” Publius 39(3):527–556.
Felons’ Rights More About Partisan Politics. 2013. Tuscaloosa News July 1:A3.
Gehrig, John. 2006. Case Study Research: Principles and Practices. Cambridge UniversityPress.
Gerber, Alan S., Gregory A Huber, Marc Meredith, Daniel R Biggers and David J Hendry.2013. “Felony Status, Participation, and Political Reintegration: Results from a FieldExperiment.” Yale University mimeo.
Golden, Miriam A. 2005. “Single Country Studies: What Can We Learn?” Italian Politics& Society 60:5–8.
Haselswerdt, Michael V. 2009. “Con Job: An Estimate of Ex-Felon Voter Turnout UsingDocument-Based Data.” Social Science Quarterly 90(2):262–273.
41

Hjalmarsson, Randi and Mark Lopez. 2010. “The Voting Behavior of YoungDisenfranchised Felons: Would They Vote if They Could?” American Law andEconomics Review 12(2):265–279.
Hur, Aram and Christopher H. Achen. 2013. “Coding Voter Turnout Responses in theCurrent Population Survey.” Public Opinion Quarterly 77(4):985–993.
Imbens, Guido W. and Thomas Lemieux. 2008. “Regression Discontinuity Designs: AGuide to Practice.” Journal of Econometrics 142(2).
King, Gary, Robert O. Keohane and Sidney Verba. 1994. Designing Social Inquiry.Princeton University Press.
Manza, Jeff and Christopher Uggen. 2004. “Punishment and Democracy:Disenfranchisement of Nonincarcerated Felons in the United States.” Perspectives onPolitics 2(3):491–505.
Manza, Jeff and Christopher Uggen. 2006. Locked Out: Felon Disenfranchisement andAmerican Democracy. Oxford University Press: New York:, NY.
McDonald, Michael P. and Justin Levitt. 2008. “Seeing Double Voting: An Extension ofthe Birthday Problem.” Election Law Journal: Rules, Politics, and Policy 7(2):111–122.
Meredith, Marc. 2009. “Persistence in Political Participation.” Quarterly Journal ofPolitical Science 4(3):187–209.
Meredith, Marc and Michael Morse. 2014. “Do Voting Rights Notification Laws IncreaseEx-Felon Turnout?” The ANNALS of the American Academy of Political and SocialScience 651.
Minnite, Lorraine C. 2011a. “First-Time Voters in the 2008 Election.” Project VoteResearch Memo.URL:http://projectvote.org/images/publications/Reports%20on%20the%20Electorate/FINAL%20First-Time-Voters-in-2008-Election.pdf
Minnite, Lorraine C. 2011b. The Myth of Voter Fraud. Cornell University Press.
Nicholson-Crotty, Sean and Kenneth J. Meier. 2002. “Size Doesn’t Matter: In Defense ofSingle-State Studies.” State Politics & Policy Quarterly 2(4):411–422.
Owens, Michael Leo and Marion Orr. 2011. “Changing Policy Designs for “Deviant”:Political Lessons from the Rhode Island “Right to Vote” Campaign.” Presented at theannual meeting of the American Political Science Association, Washington D.C.
Porter, Nicole D. 2010. “Expanding the Vote: State Felony Disenfranchisement Reform,1997-2010.” The Sentencing Project.URL: http: // www. sentencingproject. org/ doc/ publications/ publications/vr_ ExpandingtheVoteFinalAddendum. pdf
42

Riker, William H. and Peter C. Ordeshook. 1968. “A Theory of the Calculus of Voting.”American Political Science Review 62(1):25–42.
Sentencing Project, The. 1998. “Losing the Vote: The Impact of FelonyDisenfranchisement Laws in the United States.”.URL:http: // www. sentencingproject. org/ doc/ File/ FVR/ fd_ losingthevote. pdf
Sentencing Project, The. 2011. “Felony Disenfranchisement Laws in the United States.”.URL: http: // www. sentencingproject. org/ doc/ publications/ fd_ bs_fdlawsinusDec11. pdf
Uggen, Christopher and Jeff Manza. 2002. “Democratic Contraction? PoliticalConsequences of Felon Disenfranchisement in the United States.” American SociologicalReview 67(6):777–803.
Uggen, Christopher, Sarah Shannon and Jeff Manza. 2012. “State-Level Estimates of FelonDisenfranchisement in the United States, 2010.” The Sentencing Project.URL: http: // www. sentencingproject. org/ doc/ publications/ fd_ State_Level_ Estimates_ of_ Felon_ Disen_ 2010. pdf
Weaver, Vesla M. and Amy E. Lerman. 2010. “Political Consequences of the CarceralState.” American Political Science Review 104(4):817–833.
43

8 Appendix
8.1 Matching Procedure
This section details the matching procedure that we use to match discharge records to voter
file records. In general, the matching procedure identifies records with similar names that
share a common birth date. The simplest match criterion would require that the first, middle,
and last names are presented in the exact same manner in both data sources. However, we
risk missing matches with such a strict strategy because names are often presented slightly
differently. This may occur because someone uses a shortened version of their first name in
one source but not the other (e.g. Mike in one, Michael in the other) or only lists a middle
name in one source but not the other (e.g. Andrew in one, nothing in the other), or because
of a spelling error (e.g., Nicholus in one, Nicholas in the other). Instead, we consider two
names as similar if their first, middle, and last names individually satisfy one of the following
criteria:26
1. The name in source one is the same as the name in source two
2. The name in source one is a single character and the name in source two begins with
that character (e.g., “R” and “Robert”).
3. The name in source one and the name in source two are multiple characters and
the name in source one is contained in the name in source two (e.g., “Chris” and
“Christopher”).
4. The name in source one and the name in source two are of length N ≥ 2, and the
name in source one is the same as the name in source two after character i ∈ [1, N ] is
removed from the names in both sources (e.g., “Marc” and “Mark”).
26All non characters (e.g., “.”, “-”, and “ ”) are removed from names in both files prior to running thiscriterion
Appendix–1

5. The name in source one is length N , the name in source two is length N + 1, and the
name in source one is the same as the name in source two after character i ∈ [1, N ] is
removed from the name in source two (e.g., “Michele” and “Michelle”).
6. The name in source one and the name in source two are of length N ≥ 2, and the
name in source one is the same as the name in source two after character i ∈ [1, N − 1]
and character i+ 1 are flipped in source two (e.g., “Michael” and “Micheal’).
7. The name in source one is identified by a program that we wrote to be a common
nickname or misspelling of the name in source two (e.g., “Al”, “Allan”, “Alen”, and
“Allen” are common nicknames or misspelling of the name “Alan”)
8. Our matching criterion is also satisfied for the middle name when the middle name is
missing in source one, but not in source two.
The top row of Table A.1 shows that 27,394 voter file records match to a discharge record
using the matching procedure described above. These 27,394 matches are a combination of
true matches — dischargees matching their own voter file record — as well as false matches
— dischargees matching the voter file record of a different individual with the same birth
date and similar name. We estimate our error rate by matching discharge records with
slightly permuted ages to the voter file. The expected number of false matches between
the actual discharge records and the voter file is nearly identical to the expected number of
matches between the age-permuted discharge records and the voter file. Because all of the
matches between the age-permuted discharge records and the voter file are known to be false
matches, the difference between the number of matches using these two strategies provides
an estimate of the number of correct matches.
Rows two and three of Table A.1 show that our matching procedure produces almost no
false matches. Four voter file records match our age-permuted discharge records when we
Appendix–2
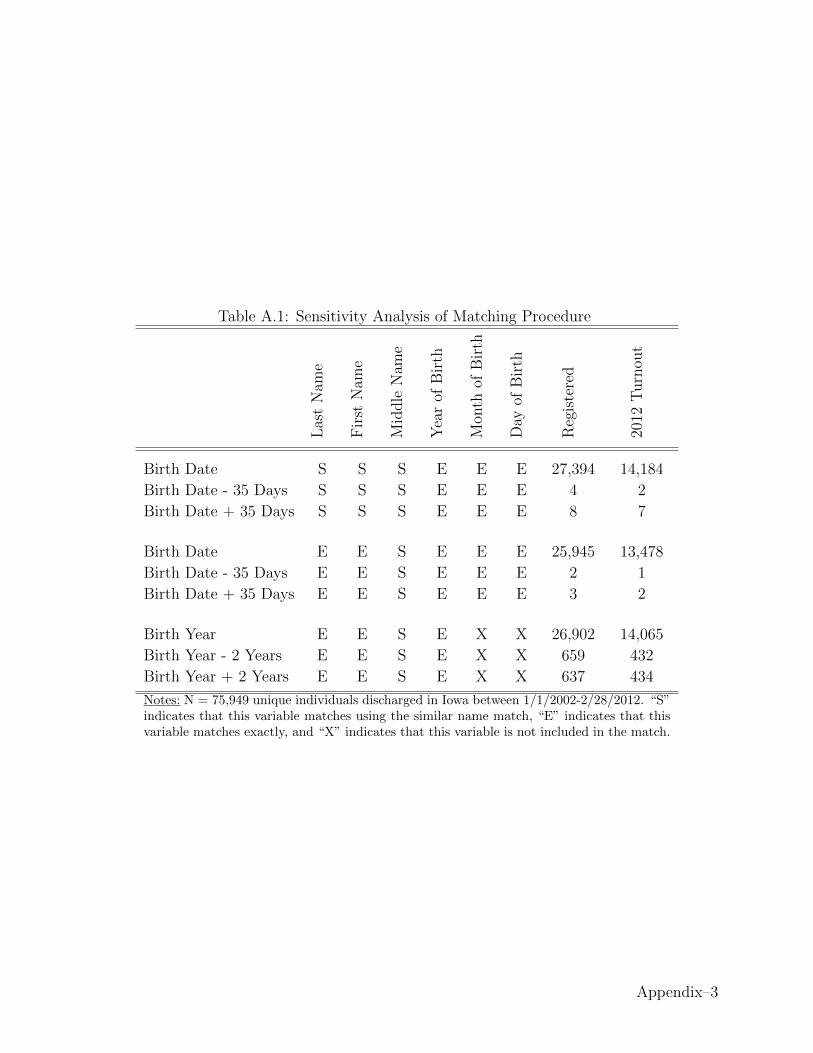
Table A.1: Sensitivity Analysis of Matching ProcedureL
ast
Nam
e
Fir
stN
ame
Mid
dle
Nam
e
Yea
rof
Bir
th
Mon
thof
Bir
th
Day
ofB
irth
Reg
iste
red
2012
Turn
out
Birth Date S S S E E E 27,394 14,184
Birth Date - 35 Days S S S E E E 4 2
Birth Date + 35 Days S S S E E E 8 7
Birth Date E E S E E E 25,945 13,478
Birth Date - 35 Days E E S E E E 2 1
Birth Date + 35 Days E E S E E E 3 2
Birth Year E E S E X X 26,902 14,065
Birth Year - 2 Years E E S E X X 659 432
Birth Year + 2 Years E E S E X X 637 434
Notes: N = 75,949 unique individuals discharged in Iowa between 1/1/2002-2/28/2012. “S”indicates that this variable matches using the similar name match, “E” indicates that thisvariable matches exactly, and “X” indicates that this variable is not included in the match.
Appendix–3

construct placebo dischargees that are 35 days older than the actual dischargees.27 Likewise,
eight voter file records match the record of placebo dischargees that are 35 days younger
than the actual dischargees. Thus, we conclude that just about all of the 27,394 matches are
correct matches.
Comparing rows one and four of Table A.1 shows that our matching procedure finds a
modest number of matches that would be missed if we only matched names exactly. Our
matching procedure finds 1,449 registration records and 706 2012 turnout records where
the first or last name does not exactly match across the two sources. Given that there are
75,949 unique discharge records, this equates to about a two percentage point increase in
the registration rate and a one percentage point increase in the 2012 turnout rate.
The final rows of Table A.1 illustrate that we get more false matches when we match
on year, rather than date, of birth. Comparing rows four and seven shows that we find 957
more matches between the actual discharge data and voter file when we match only on year
of birth. However, we also find about 645 more matches between the age-permuted discharge
data and the voter file. Thus, we conclude that about 645 of the 957 additional matches are
false matches, with the remaining 312 matches being cases in which the same individual is
listed as having a different month or day of birth across the two sources.
Table A.2 further explores the possibility that the same individual has a different birth
date in the two data sources and thus would fail to match. The first row of Table A.2 shows
that there are 250 cases where a voter file record has a similar first, middle, and last name,
the same month and day of birth, but a different year of birth as a record in the discharge
data.28 About 175 of these cases appear to be the same individual’s record. There are
also 143 cases in which everything matches except for birth month and 438 cases in which
everything matches except for birth day, 310 of which appear to be the same individual’s
record. Overall, Table A.2 suggests that we miss about 500 registration records and 200
27We use 35 days because it is the smallest number of days in which our placebo dischargees are born onthe same day of the week, but a different month, as the actual dischargees.
28For computational reasons, this analysis only considers cases where the tens or the ones digit of the yearwas the same in the voter file and discharge data.
Appendix–4

Table A.2: Birth Dates that Almost Match using our Matching Procedure
Yea
rof
Bir
th
Mon
thof
Bir
th
Day
ofB
irth
Reg
iste
red
2012
Turn
out
Birth Date N E E 250 123
Birth Date - 35 Days N E E 92 55
Birth Date + 35 Days N E E 63 44
Birth Date E N E 143 73
Birth Date - 35 Days E N E 56 35
Birth Date + 35 Days E N E 68 50
Birth Date E E N 438 230
Birth Date - 35 Days E E N 217 137
Birth Date + 35 Days E E N 203 132
Notes: N = 75,949 unique individuals discharged in Iowa between1/1/2002-2/28/2012. “E” indicates that this variable matches ex-actly and “N” indicates that this variable does not match exactly.All matches have a similar first, middle, and last name.
2012 turnout records because of typographical errors in birth dates, although there could
be additional cases where the same individual’s birth date is presented in a significantly
different manner across the two sources.
Table A.3 shows that there are more cases in which the same individual’s discharge and
voter file record fail to match because their name is substantially different across the two
sources. Most of these cases are females that match on everything except their last name.
There are 3,656 voter file records that match the first name, middle name, and date of birth,
but not the last name, of a female dischargee’s record. We only find about 1,700 similar
cases in the age-permuted discharge data, implying that about 2,000 females register using
a different last name than what is on their discharge record. In contrast, we find fewer
than 100 males register using a different last name than their discharge record. Thus, we
Appendix–5
speculate that most of these missed matches occur because females change their last name
post-discharge due to marriages and divorces.
The remainder of Table A.3 shows that there are fewer cases in which the same indi-
vidual’s discharge and voter file record fail to match because the first or middle name is
substantially different across the two sources. 1,200 voter file records match a discharge
record on everything except first or middle name. There are about 900 similar cases in the
age-permuted discharge data, implying that about 300 dischargees register using a different
first or middle name than what is on their discharge record. In sum, Table A.3 indicates that
we miss about 2,350 registration records and 1,375 2012 turnout records because of differ-
ences in how names are presented in the two sources. Once again, it is possible that there are
even more cases where the same individual’s name is presented in a significantly different
manner in the two sources. For example, we would fail to match dischargees who adopt
Islamic names post-discharge to their voter file record. However, we expect the number of
such cases to be relatively small.
Our matching procedure may also underestimate political participation if Iowa dis-
chargees vote in states besides Iowa. Table A.4 examines how frequently Iowa discharge
records match to records in the Missouri, New York, Minnesota, and Ohio voter files. We
use the same matching procedure described above when working with the Missouri and New
York voter file. The results in Table A.4 indicate that we miss about 428 registration records
and 113 2012 turnout records because they occur in Missouri and 80 registration records and
14 2012 turnout records because they occur in New York.
We must use a modified matching procedure to match the Iowa discharge data to the
Minnesota and Ohio voter files because these voter files contain year of birth instead of date
of birth. First, we run our program that transforms common nicknames or misspellings of a
name into a common root name. Next, we generate a modified first name that only contains
the first seven letters of the first name. Then, the discharge data and voter file are exactly
Appendix–6

Table A.3: Names that Almost Match using Matching Procedure
Las
tN
ame
Fir
stN
ame
Mid
dle
Nam
e
Reg
iste
red
2012
Turn
out
Females:Birth Date N S S 3,656 2,442
Birth Date - 35 Days N S S 1,672 1,247
Birth Date + 35 Days N S S 1,731 1,246
Birth Date S N S 264 166
Birth Date - 35 Days S N S 216 144
Birth Date + 35 Days S N S 208 134
Birth Date S S N 71 38
Birth Date - 35 Days S S N 11 6
Birth Date + 35 Days S S N 15 11
Males:Birth Date N S S 4,105 2,767
Birth Date - 35 Days N S S 3,998 2,703
Birth Date + 35 Days N S S 4,027 2,786
Birth Date S N S 720 480
Birth Date - 35 Days S N S 638 431
Birth Date + 35 Days S N S 630 432
Birth Date S S N 148 76
Birth Date - 35 Days S S N 49 31
Birth Date + 35 Days S S N 31 18
Notes: N = 17,233 unique females and 58,716 unique males dis-charged in Iowa between 1/1/2002-2/28/2012. “S” indicates thatthis variable matches using the similar name match and “N” in-dicates that this variable does not match using the similar namematch. All matches have the same date of the birth.
Appendix–7

Table A.4: Iowa Discharge Records Matched to Other States’ Voter Files
2012Registered Turnout
Missouri:Birth Date 442 122
Birth Date - 35 Days 14 9
Birth Date + 35 Days 15 9
New York:Birth Date 164 47
Birth Date - 35 Days 87 32
Birth Date + 35 Days 82 35
Minnesota:Birth Year 1,360 1,246
Birth Year - 2 Years 1,105 1,028
Birth Year + 2 Years 1,140 1,048
Ohio:Birth Year 5,682 3,702
Birth Year - 2 Years 5,570 3,455
Birth Year + 2 Years 5,664 3,779
Notes: N = 75,949 unique individuals discharged in Iowa between 1/1/2002-2/28/2012
Appendix–8
matched on year of birth, last name, and the modified first name. Finally, we keep the cases
within these matches in which the middle name in the discharge data and the middle name
in the voter file are similar according to our baseline matching procedure.
The bottom rows of Table A.4 show that we continue to find a small number of cases
in which an Iowa dischargee is registered to vote or voted in the 2012 presidential election
in either Minnesota or Ohio. As we demonstrate in Table A.1, there are substantially more
matches between the age-permuted discharge data and the voter file when we match on year,
rather than date, of birth. Although this makes it more difficult to make precise statements
about the number of cases in which an Iowa discharge matches to his or her own record in
the Minnesota or Ohio voter file, Table A.4 suggests that about 250 Iowa dischargees are
registered to vote in Minnesota and 65 Iowa dischargees are registered to vote in Ohio.
We apply a simple model to calibrate what the patterns in Table A.4 imply about the
total number out-of-state registrants and 2012 voters. We expect such individuals dispropor-
tionately reside in states that border Iowa. Table A.4 suggests that about 665 dischargees
are registered to vote in Minnesota and Missouri. If dischargees are as densely registered
in other states that border Iowa, this implies that about 1,900 dischargees are registered to
vote in a state that borders Iowa.29 Table A.4 also suggests that about 145 dischargees are
registered to vote in New York and Ohio. If dischargees are as densely registered in other
states that do not border Iowa, this implies about 1,300 are registered to vote in a state that
does not border Iowa.30 Performing similar calculations on 2012 turnout suggests there were
about 900 dischargees who voted in the 2012 presidential election in states that border Iowa
and 900 dischargees that voted in the 2012 presidential election in states that do not border
Iowa.
Considering all of the reasons why an individual may not match their own participation
record we believe we are missing about 6,000 registration records and and about 3,375 2012
29Minnesota and Missouri contain about 34.9 percent of the population that resides in a state that bordersIowa and 665/.349 ≈ 1, 900.
30New York and Ohio contain about 11.0 percent of the population that resides in a state that doesn’tborder Iowa and 145/.110 ≈ 1, 300.
Appendix–9

turnout records. Given that there are 75,949 unique discharge records, this suggests our
matching procedure underestimates the 2012 turnout rate of Iowa dischargees by four to five
percentage points.
8.2 Alternative Iowa Discharge Data
One limitation of discharge data provided by the Iowa Department of Corrections is that
the data only contains records of discharges that occurred since 2002. This prevents us from
observing whether ex-felons who are further removed from the criminal justice system vote
at different rates than ex-felons who were recently discharged. To get older discharge records,
we scraped the discharge records available via an Iowa offender search engine, http://www.
doc.state.ia.us/OffenderInfo.asp, maintained by the Department of Corrections. Iowa
uses a seven-digit offender number to track people across time. An individual’s history in the
Iowa Department of Corrections is available at http://www.doc.state.ia.us/InmateInfo.
asp?OffenderCd=ABCDEFG, where ABCDEFG represents the individual’s seven-digit offender
number. We scraped the webpages associated with an offender identification number between
0000001 and 0089999, 1000000 and 1170000, 6000000 and 700000, and every seven-digit
number that contains ”0” in the first digit, does not contain ”0” in the second digit, and
contains ”0” in the third digit (e.g., 0101535 and 0303673). We selected these ranges by
randomly generating offender numbers between 0 and 7000000, and observing that 6,453 of
6,458 of the records that we scraped had an identification number that fit one of these four
criteria.
Figure A.1 shows that we observe a substantial number of discharge records from the early
1990s in the scraped dataset. The biggest limitation of these alternative discharge data is
that we do not know how comprehensive these data are. We caution against interpreting
the scraped sample as a census of discharge records because not every discharge record from
our primary dataset appears on the website.31 Unlike our primary discharge data, which
3182.3% of the felony records and 84.5% of the aggravated misdemeanor records contained in our primary
Appendix–10

Figure A.1: Discharges Per Year in Alternate Iowa Discharge Data
05000
10000
15000
Num
ber
of D
ischarg
es
1980 1990 2000 2010Year of Discharge
Felons Aggravated Misdemeanors
only includes information on the final discharge from a single sentence, the scraped data
also includes information on intermediate discharges (e.g., discharged prison to parole) that
occur within a single sentence. Unfortunately, it is not always possible to observe whether
a discharge record corresponds to an intermediate or final discharge in the scraped data.
Thus, we only consider an individual’s most recent discharge when constructing Figure A.1
and looking at turnout by year of discharge.
Figure A.2 shows that turnout among ex-felons increases slightly with time since discharge
among ex-felons. About eleven percent of ex-felons who were last discharged from the Iowa
correctional system in the early 1990s voted in the 2012 presidential election, as compared
to about nine percent of ex-felons who were last discharged in the early 2000s. Because
discharge data set appear in the scraped data set. We also observe a non-trivial number of felony andaggravated misdemeanor records in the scraped data that do not appear in our primary discharge data set.
Appendix–11
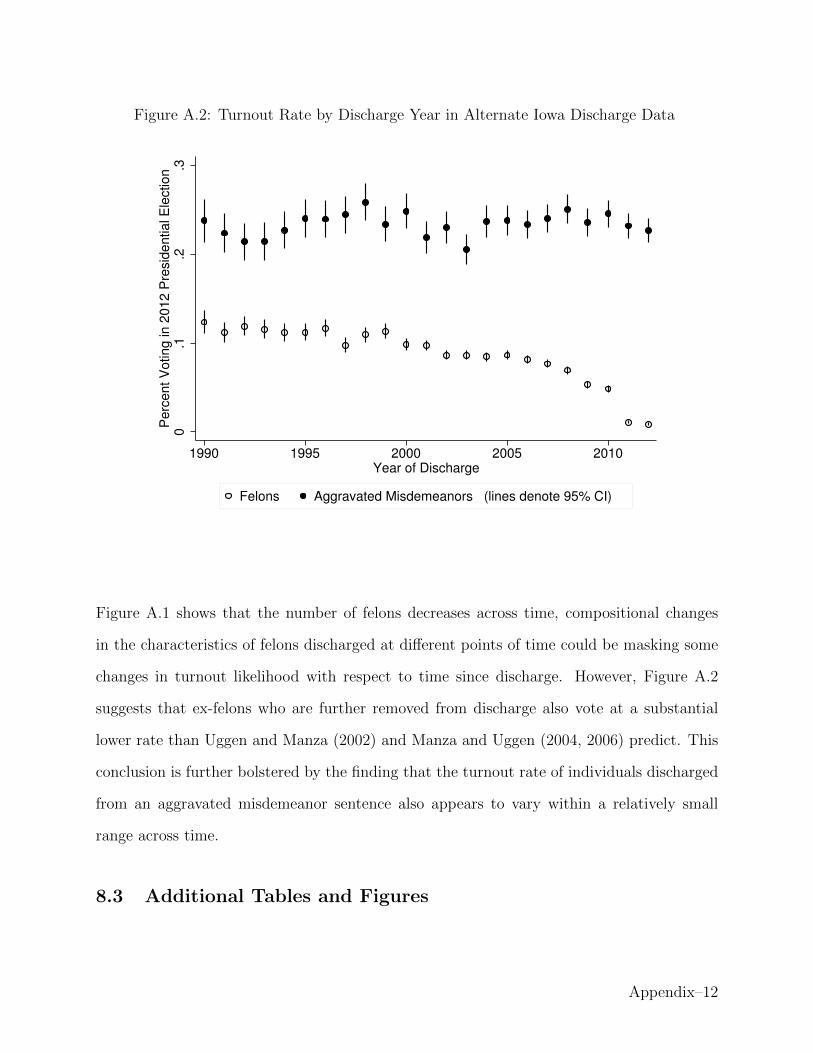
Figure A.2: Turnout Rate by Discharge Year in Alternate Iowa Discharge Data
0.1
.2.3
Perc
ent V
oting in 2
012 P
resid
ential E
lection
1990 1995 2000 2005 2010Year of Discharge
Felons Aggravated Misdemeanors (lines denote 95% CI)
Figure A.1 shows that the number of felons decreases across time, compositional changes
in the characteristics of felons discharged at different points of time could be masking some
changes in turnout likelihood with respect to time since discharge. However, Figure A.2
suggests that ex-felons who are further removed from discharge also vote at a substantial
lower rate than Uggen and Manza (2002) and Manza and Uggen (2004, 2006) predict. This
conclusion is further bolstered by the finding that the turnout rate of individuals discharged
from an aggravated misdemeanor sentence also appears to vary within a relatively small
range across time.
8.3 Additional Tables and Figures
Appendix–12

Figure A.3: Sample Certificate that Notifies Ex-Felon of the Restoration of Voting Rights
Appendix–13

Table A.5: Characteristics of Individuals Discharged Pre- and Post-July 4th in 2005
(1) (2) (3) (4) (5)Discharged Discharged DifferenceAfter 7/4 By 7/4 In Linear CubicN =4,163 N =4,429 Means Trend Trend
% 2000 Turnout 0.067 0.061 0.007 0.004 -0.007(0.004) (0.004) (0.005) (0.010) (0.021)
% 2002 Turnout 0.040 0.036 0.004 -0.004 -0.002(0.003) (0.003) (0.004) (0.008) (0.017)
% 2004 Turnout 0.100 0.094 0.006 -0.009 -0.052(0.005) (0.004) (0.006) (0.013) (0.025)
Year of Birth 1970.4 1970.3 0.124 -0.857 -1.356(0.17) (0.16) (0.232) (0.470) (0.958)
% Male 0.782 0.794 -0.012 -0.022 -0.022(0.006) (0.006) (0.009) (0.018) (0.036)
% C Class Felony 0.155 0.148 0.007 0.017 0.035(0.006) (0.005) (0.008) (0.015) (0.031)
% D Class Felony 0.400 0.412 -0.012 0.000 0.019(0.008) (0.007) (0.011) (0.021) (0.043)
% Other Felony 0.029 0.030 -0.001 -0.009 -0.030(0.003) (0.003) (0.004) (0.008) (0.017)
% Misdemeanor 0.416 0.410 0.006 -0.009 -0.024(0.008) (0.007) (0.011) (0.022) (0.044)
% Early Discharge 0.411 0.409 0.002 0.011 0.007(0.008) (0.007) (0.011) (0.021) (0.042)
% Alcohol 0.204 0.199 0.005 0.020 0.000(0.006) (0.006) (0.009) (0.017) (0.036)
% Drug 0.234 0.217 0.017 -0.018 -0.009(0.007) (0.006) (0.009) (0.018) (0.037)
% Property 0.300 0.316 -0.016 0.006 0.006(0.007) (0.007) (0.010) (0.020) (0.041)
% Violent 0.161 0.166 -0.005 -0.002 0.001(0.006) (0.006) (0.008) (0.016) (0.034)
% Other Type 0.073 0.072 0.000 0.004 0.032(0.005) (0.005) (0.007) (0.015) (0.030)
% Prison Discharge 0.135 0.138 -0.003 -0.026 -0.006(0.005) (0.005) (0.007) (0.015) (0.031)
% Parole Discharge 0.197 0.205 -0.008 -0.024 -0.024(0.006) (0.006) (0.009) (0.018) (0.036)
% Probation or 0.668 0.657 0.011 0.050 0.030Other Discharge (0.007) (0.007) (0.010) (0.021) (0.042)
Notes: Sample includes all discharges between January 1, 2005 and December 31, 2005.Linear trend and cubic trend refer to the estimate of γ0 when Equation 1 is estimated withthe listed variable as the dependent variable when k = 1 and k = 3 respectively.
Appendix–14

Figure A.4: Number of Discharges in Iowa by Month
40
06
00
80
01
00
01
20
0#
of
Dis
ch
arg
es
Jan02 Jan03 Jan04 Jan05 Jan06 Jan07 Jan08 Jan09 Jan10 Jan11 Jan12
30
04
00
50
06
00
70
0#
of
Fe
lon
y D
isch
arg
es
Jan02 Jan03 Jan04 Jan05 Jan06 Jan07 Jan08 Jan09 Jan10 Jan11 Jan12Month and Year of Discharge
Voting Rights Automatically Restored, Didn’t Receive Restoration Certificate
Voting Rights Automatically Restored, Received Restoration Certificate
Voting Rights Not Automatically Restored
Appendix–15

Table A.6: Date of Registration of Individuals Discharged Pre- and Post-July 4th in 2005
(1) (2) (3) (4) (5) (6)All Discharges Felony Discharges
Discharged Discharged Discharged DischargedAfter 7/4 By 7/4 Difference After 7/4 By 7/4 Difference
% Registered By N =4,163 N =4,429 N =2,430 N =2,614
12/31/2000 0.102 0.100 0.002 0.066 0.057 0.008(0.005) (0.005) (0.007) (0.005) (0.005) (0.007)
12/31/2004 0.181 0.170 0.011 0.117 0.103 0.014(0.006) (0.006) (0.008) (0.006) (0.006) (0.009)
12/31/2005 0.200 0.189 0.011 0.137 0.121 0.017(0.006) (0.006) (0.009) (0.007) (0.007) (0.009)
12/31/2006 0.242 0.217 0.025 0.185 0.150 0.035(0.007) (0.006) (0.009) (0.008) (0.007) (0.010)
12/31/2007 0.271 0.235 0.036 0.217 0.165 0.052(0.007) (0.007) (0.009) (0.008) (0.008) (0.011)
12/31/2008 0.352 0.299 0.053 0.305 0.222 0.083(0.007) (0.007) (0.010) (0.009) (0.009) (0.012)
12/31/2009 0.364 0.313 0.052 0.319 0.235 0.083(0.007) (0.007) (0.010) (0.009) (0.009) (0.013)
10/22/2010 0.379 0.327 0.052 0.329 0.248 0.081(0.007) (0.007) (0.010) (0.009) (0.009) (0.013)
Notes: Sample includes discharges for the given offense type between January 1, 2005 andDecember 31, 2005.
Table A.7: Out-of-State Political Participation by Rhode Island Dischargees
2012Registered Turnout
Connecticut:Birth Date 31 3
Birth Date - 35 Days 5 2
Birth Date + 35 Days 9 5
New York:Birth Date 64 16
Birth Date - 35 Days 21 10
Birth Date + 35 Days 29 9
Notes: N = 6,631 unique individuals discharged in Rhode Island between 1/1/2009-12/31/2010
Appendix–16

Figure A.5: Estimate of Discontinuous Change in 2008 Turnout from Being Discharged AfterJuly 4th by Year
−.2
−.1
0.1
Est.
Ch
an
ge
in
20
08
Tu
rno
ut
fro
m P
ost−
7/4
Dis
ch
arg
eB
lack C
ircle
(k =
1),
Wh
ite
Circle
(k =
3)
2002 2003 2004 2005 2006 2007Year
Appendix–17

Figure A.6: Estimated Effect of Notification on 2008 Turnout by Bandwidth (k) for FelonyDischarges
−.0
50
.05
.1.1
5
Est.
Ch
an
ge
in
20
08
Tu
rno
ut
fro
m N
otifica
tio
nk =
1
0 3 6 9 12 15 18 21 24 27 30
−.1
0.1
.2.3
Est.
Ch
an
ge
in
20
08
Tu
rno
ut
fro
m N
otifica
tio
nk =
3
0 3 6 9 12 15 18 21 24 27 30Bandwidth(# of months)
Appendix–18

Table A.8: Correlates of Self-Report Turnout in 2012 Current Population Survey
(1) (2) (3)
Black 0.539 (0.028) 0.565 (0.028) 0.545 (0.028)
Hispanic -0.208 (0.028) -0.208 (0.028) -0.203 (0.028)
No HS Degree -1.783 (0.032) -1.693 (0.032) -1.785 (0.032)
Only HS Degree -1.152 (0.022) -1.108 (0.022) -1.154 (0.022)
Some College -0.513 (0.023) -0.485 (0.023) -0.515 (0.023)
Male -0.141 (0.016) -0.173 (0.017) -0.141 (0.016)
Married 0.384 (0.018) 0.370 (0.018) 0.384 (0.018)
Age 18-19 -0.983 (0.069) -1.121 (0.070) -0.984 (0.069)
Age 20-24 -1.030 (0.059) -1.231 (0.060) -1.031 (0.059)
Age 25-29 -0.941 (0.059) -1.177 (0.060) -0.941 (0.059)
Age 30-34 -0.800 (0.059) -1.041 (0.060) -0.801 (0.059)
Age 35-39 -0.664 (0.060) -0.901 (0.061) -0.665 (0.060)
Age 40-44 -0.552 (0.059) -0.790 (0.060) -0.553 (0.059)
Age 45-49 -0.415 (0.059) -0.649 (0.060) -0.416 (0.059)
Age 50-54 -0.275 (0.058) -0.500 (0.059) -0.276 (0.058)
Age 55-59 -0.093 (0.059) -0.300 (0.060) -0.094 (0.059)
Age 60-64 -0.044 (0.060) -0.188 (0.060) -0.044 (0.060)
Age 65-69 0.133 (0.062) 0.063 (0.062) 0.133 (0.062)
Age 70-74 0.248 (0.065) 0.213 (0.065) 0.248 (0.065)
Age 75-79 0.399 (0.070) 0.382 (0.070) 0.398 (0.070)
Age 80-84 0.303 (0.073) 0.295 (0.073) 0.302 (0.073)
Employed 0.356 (0.020)
Iowa Resident 0.404 (0.053)
Maine Resident 0.353 (0.054)
Rhode Island Resident 0.055 (0.057)
Constant 1.449 (0.055) 1.405 0.055 1.444 0.055
Notes: All columns report coefficients and standard errors from a logit regression. N =94,311 and observations are weighted by the sample weight (PWSSWGT). Following Hurand Achen (2013), the dependent variable is coded as one if a respondent reported voting,and zero if a respondent reported not voting, did not know if he or she voted, refused tosay if he or she voted, or did not respond to the question. The excluded type is a white,non-Hispanic female who is over the age of 85, not married, and graduated from college.
Appendix–19


![[PPT]LOCKING UP THE VOTE: Felon Disenfranchisement …johnjay.jjay.cuny.edu/files/UggenManzaJune2006.ppt · Web viewThe Project What are the origins of voting restrictions on the](https://static.documents.pub/doc/80x56/5b2199337f8b9ad0448b4955/pptlocking-up-the-vote-felon-disenfranchisement-web-viewthe-project-what.jpg)