

Indonesian Journal of Geology, Vol. 8 No. 1 March 2013: 39-53
The Potential of Ketungau and Silat Shales in Ketungau and Melawi Basins, West Kalimantan: For Oil Shale and Shale Gas Exploration
Potensi Serpih Ketungau dan Silat di Cekungan Ketungau dan Melawi, Kalimantan Barat: Untuk Eksplorasi Oil Shale dan Shale Gas
L. D. Santy and H. Panggabean
Center of Geological Survey - Geological AgencyJln. Diponegoro 57, Bandung, West Java, Indonesia
AbstractThe Ketungau and Melawi Basins, in West Kalimantan, are Tertiary intramontane basins of which the
potential for economic conventional oil and gas discoveries have not previously been confirmed. The Ketungau Basin is bordered by the Melawi Basin in the south. Besides non-ideal trapping mechanisms, another major problem in these basins is source rock maturation. Nevertheless, both basins are promising to be explored for oil shale and shale gas energy resources. Therefore, the aim of this paper is to give some perspectives on their source rocks, as an input for the evaluation of the potential of unconventional oil and gas. About twenty samples collected from the Ketungau and Melawi Basins were analyzed using pyrolysis and organic petrographic methods. The results show a poor to good quality of source rock potential. The Ketungau shale, which is the main source rock in the Ketungau Basin, is dominated by type III, immature, and gas prone kerogen. The Silat shale, which is the main source rock in the Melawi Basin, is dominated by type II, im-mature to early mature, mixed gas, and oil prone kerogen. In the field, Ketungau and Silat Formations have a widespread distribution, and are typically 900 m to 1000 m thick. Both the Ketungau and Silat shales occur within synclinal structures, which have a poor trapping mechanism for conventional oil or gas targets, but are suitable for oil shale and shale gas exploration. This early stage of research clearly shows good potential for the future development of unconventional energy within the Ketungau and Melawi Basins.
Keywords: Ketungau and Melawi Basins, oil shale, shale gas, unconventional energy
Sari
Cekungan Ketungau dan Melawi di Kalimantan Barat adalah cekungan antar pegunungan yang secara ekonomis belum cukup terbukti sebagai cekungan berpotensi minyak dan gas untuk dieksplorasi. Di selatan, cekungan ini berbatasan dengan Cekungan Melawi. Selain mekanisme perangkap yang tidak ideal, ma-salah utama lain pada cekungan-cekungan tersebut adalah kematangan batuan sumber. Namun demikian, kedua cekungan tersebut menjanjikan kehadiran sumber daya energi minyak dan gas serpih. Oleh sebab itu, makalah ini bertujuan untuk memberikan beberapa perspektif sumber batuan di permukaan, sehingga cekungan tersebut dapat ditentukan potensi energi non-konvensionalnya. Sebanyak dua puluh percontoh yang diambil dari Cekungan Ketungau dan Melawi telah dianalisis dengan menggunakan metode petrogafi organik dan pirolisis. Hasilnya memperlihatkan bahwa potensi sumber batuannya “buruk” sampai “baik”. Serpih Ketungau yang merupakan batuan sumber utama di Cekungan Ketungau didominasi oleh kerogen type III, tidak matang, dan berpotensi sebagai gas prone. Sementara itu, Serpih Silat yang merupakan batuan sumber utama di Cekungan Melawi, didominasi oleh kerogen tipe II, tidak matang sampai matang awal, dan berpotensi menghasilkan minyak dan gas. Di lapangan, Formasi Ketungau dan Serpih Silat tersebar luas, dan mempunyai ketebalan antara 900 m sampai 1000 m. Kedua formasi terdapat pada suatu struktur sinklin, sehingga sangat buruk sebagai perangkap untuk eksplorasi sumber daya energi konvensional. Sebaliknya struktur tersebut cocok untuk eksplorasi serpih minyak dan serpih gas. Tahap penelitian awal di Cekungan Ketungau dan Melawi jelas memperlihatkan hasil baik, sehingga bisa dikembangkan untuk mendapatkan sumber daya energi non konvensional di masa mendatang.
Kata kunci: Cekungan Ketungau dan Melawi, serpih minyak, gas serpih, energi nonkonvensional
39
Manuscript received: December 07, 2011, final acceptance: March 03, 2013Corresponding Author: +6281317002449/[email protected]

40 Indonesian Journal of Geology, Vol. 8 No. 1 March 2013: 39-53
Introduction
BackgroundThe Ketungau and Melawi Basins are located
in the West Kalimantan region, adjacent to the Ma-laysian border (Figure 1). The Melawi Basin, in the south is separated from the Ketungau Basin by the Semitau High. Tectonically, the Ketungau and Me-lawi Basins can be classified as intramontane basins. The Ketungau and Melawi basins are separated from each other by a belt of deep-water rocks and a belt of melange (Boyan Melange; Williams et al., 1984). On the northern margin, the Ketungau Basin is also bounded by the Lubok Antu Melange (Tan, 1982).
Preliminary exploration and assessment of the Ketungau and Melawi Basins were carried out during 1980s and 1990s by several oil companies, includ-ing Pertamina and Canadian Occidental Petroleum (Canadian Occidental Petroleum Ltd, 1992). In 1995, Canadian Oxy also ran some seismic lines and drilled some wells, including well Kedukul-1 (Canadian Oxy, 1995). However, no economic discovery was made. The most recent assessment work is conducted by Lemigas Team, and resulted in the Kayan Play Model for Melawi Basin exploration (Lemigas, 2004; Yulihanto et al., 2006).
Recently, in 2009-2010, the Geological Agency carried out field work activities in the Ketungau
Cenozoic
Volcanic rocks
Neogene sedimentary rocks principally shallow water
Eocene-Neogene deep marine sedimentary rocks
Major lineament
Pre-Cenozoic
Mostly Mesozoic Igneous, metamorphic and sedimentary rocks with some upper Paleozoic and lower Cenozoic rocks
Mainly Cretaceous ophiolitic rocks
Ceaseous volcanic arc and ophiolite sequence
Cretaceoous granites intruding Paleozoic metamorphic rocks
KALIMANTAN
SARAWAK
BRUNEI
SABAH
CELEBES SEA
SUNDA SHELF
SOUTH CHINA
SEA
SULU SEA
NatunaIslands
Luconia Shoals
Nor
th B
orne
o Tro
ugh
Balingian delta
Rajang river
mouth
Baram delta
Sabah delta
Sandakan delta
Tarakan delta
Mangkalihatpeninsula
200m
200m
2000
m
2000
m
2000m
2000m
4000m
2000
m
200m
Central Kalimantan Ranges
Ketungau BasinSemitau
ridgeMelawi Basin
Muler Mts
Schwaner Mountains
Kutai Basin
Mahakam delta
Mak
asar
Str
ait
Barito Basin
Meratus Mountains
Patemoster platform
Laut Island
SU
LA
WE
SI
o110 E o112 E o114 E o116 E o118 E
o6 N
o4 N
o2 N
o0
o2 S
o4 S
Location
N
Figure 1. Regional geological pattern of Kalimantan (Halls and Nichols, 2002), showing rock unit distributions, structure and major lineament, and location discussed.

41The Potential of Ketungau and Silat Shales in Ketungau and Melawi Basins, West Kalimantan: For Oil Shale and Shale Gas Exploration (L.D. Santy and H. Panggabean )
and Melawi Basins, which was intended to collect field data, outcrop samples, and sedimentologic and stratigraphy data, as reported by Santy et al. (2009), Gumilar et al. (2009), Heryanto et al. (2009), Santy et al. (2010), and Gumilar et al. (2010). Observation had been done in the Ketungau Formation, outcrop-ping in Ketungau and Sekalau River, and Silat For-mation, outcropping in Silat Rivers and its tributaries in the Melawi Basin (Figure 2). The aim of the study is to assess the probability of petroleum source rock potential for hydrocarbon play in the Ketungau and Melawi Basins. Several samples had been selected for an organic geochemistry analysis.
General Geological SettingTectonic activities in this region were controlled
by the movement of Eurasian Plate to the southeast during Cretaceous - Early Tertiary. Pre-Tertiary tectonic activities created uplifting of Semitau Complex and Boyan Melange Complex separat-ing the Ketungau and Melawi Basin (Williams et
al., 1984). Nevertheless, Halls and Nichols (2002) suggest that the Ketungau and Melawi Basins are not conventional foreland basin formed by loading of thrust sheets, indicated by the absence of thin skinned thrusting in the highly eroded areas.
The pattern of Ketungau-Melawi Basin bound-aries follows the direction pattern of NW-SE strike slip zone developing during Eocene-Oligocene (± 30 Ma) at the Sundaland Margin in Kalimantan (Hall, 1996). A 45o counter clockwise rotation during Late Oligocene to Early Miocene (± 20-10 Ma) resulted in a basin configuration as observed today. The next Neogene tectonic activities caused an E-W trending thrust system (Yulihanto et al., 2006), sediment fold-ing, and created Ketungau, Silat, and Melawi syn-clines, as well as Sintang anticline (Figures 1 and 2).
The base of Ketungau and Melawi Basins is not exposed, though there is a thick succession of lithic arenite sandstone sequence consisting of sandstone, silt, and mudstone. The thick sediment succession is a result of basin subsidence as the response of sedi-
09YK03
09PE0109PE02
09PE07A-B
09PE0909PE15
09PE19
09PE0309PE05
09PE07C
09PE06
09YK0109KW06
09KW05
09LS03
09LS02
09LS04
09LS05
09LS05
Tebidah Fm.
10LS24 10PE02
10PE01
10LS15
10LS19
10LS13
10LS14
10LS16
10LS17
10LS18
Sekayam Sandstone
Silat ShaleDangkan SandstoneIngar Fm.Haloq Sandstone
Payak Fm.
Alluvium dissected deposit
Sintang Intrusive
Lake depositAlluvium deposit
Rivers
ContourAnticline-Syncline
Location of fieldwork2009
Location of fieldwork2010
LEGENDS
Ketungau Fm.Tutoop Fm.Kantu Fm.
Selangkai Group
Kapuas Complex
Betung Volcanics
Semitau Complex
Undifferentiated Silat Shale, Dangkan Sandstone, andIngar Fm
Mercator Projection
SEMITAU HIGH
Jongkong Ulu
Ng. Dangkan
o o111 20' o111 25' o111 30' o111 35' o111 40' o111 45' o111 50' o111 55' o112 o
112 05' o112 10' o112 15' E o
o111 15' E o111 20' o111 25' o111 30' o111 35' o111 40' o111 45' o111 50' o111 55' o112
o11205' o112 10' o112 15' E o112 19'
o0 50'
o0 45'
o0 40'
o0 35'
o0 30'
o0 25'
o020'
o0 15'
o 0 10'
SYNCLINE
111 15' E 112 19'
09PE03
09PE05
09PE07C
09PE06
09YK01
09YK03
09PE01
09PE02
09PE07A-B
09PE09
09PE15
09PE19
09PE111
09LS11
KETUNGAU
09KW06
09KW05
10LS13
10LS24 10PE02
10PE01
10LS15
10LS19
10LS14
10LS16
10LS17
10LS18
09LS03
09LS02
09LS06
09LS05
09LS04
Ng. Merakai
Tirtakarya
N
kilometres
o0 50'
o0 45'
o0 40'
o0 35'
o0 30'
o0 25'
o0 20'
o0 15'
o0 10'
0 10
N
N
N
N
Figure 2. Geological Map of Ketungau-Melawai Basins (Heryanto, 1993 a&b); showing location observations and sample locations during fieldwork conducted in 2009 & 2010.

42 Indonesian Journal of Geology, Vol. 8 No. 1 March 2013: 39-53
ment infill in the boundary between a linear zone of granite and schist in the northern part (Semitau High), and the base of continental plate in the south-ern part (Schwaner Mountain Zone).
Sediment infill in the Ketungau-Melawi basin was dominantly from the eroded rocks of older orogen in the Kalimantan Island. Small part of sedi-ment supply probably also comes from Indochina land (Halls and Nichols, 2002). High rate of clastic detrital sediment supply in this basin had suppressed the productive development of carbonate benthic, therefore no well developed carbonate sediments exist (Smith et al., 1990; Halls and Nichols, 2002).
Sedimentary phase of the Ketungau Basin oc-curred during Eocene until Oligocene, with the deposition of fluvial conglomerate unit gradationally change to be lacustrine and shallow marine sediment unit of Kantu Formation (Figure 3). The Kantu For-mation is conformably overlain by a fluvial clastic unit of the Tutoop Formation and a fluvio-marine de-posit of the Ketungau Formation (Pieters et al., 1987; Heryanto et al., 1993a&b; Supriyatna et al., 1993).
Stratigraphic succession in the early develop-ment of the Melawi Basin has a similar character-istic and lithologic distribution with the Ketungau Basin. Those formations were deposited above the Pre-Tertiary basal sediments of Selangkai Formation (Figure 3; Heryanto et al.,1993a&b). The Haloq For-mation, the oldest sediments deposited in the basin, is regarded as an equivalence of Lower Ketungau. This formation consists of fluvial quartz sandstone and conglomeratic unit, deposited during Upper Eo-cene. The Ingar Formation unconformably overlying the Haloq Formation, consists of alternating mud-stone, silt, and fine sandstone of lacustrine deposit. The Dangkan Formation, which is considered to be equivalent to the Tutoop sandstone, was deposited unconformably over the Ingar Formation. It is fol-lowed by the Silat Shale, regarded to be equivalent to the Ketungau Formation, that was deposited dur-ing Oligocene. When the sediment deposition in the Ketungau Basin had terminated, the deposition in the Melawi Basin still occurred where fluvial units of the Payak, Tebidah, and Sekayam Formations were deposited (Pieters et al., 1987, Pieters et al., 1993)
Description of Ketungau and Silat FormationsAs a whole packet, the Ketungau Formation
is 900 m thick, consisting of claystone, shale, silt,
fine sandstone, and thin bedded coal in the upper part (Figure 4a). Claystone layers usually contain silt or fine sand concretions and mollusk fossils of Gastropods and Bivalves. Ichnofossils of Planolites, Thalassinoides, and Ophiomorpha were sometimes found in some layers (Figure 5). Sandstone is usu-ally micaceous and contains framboidal pyrite as an indication of marine influence (Stach et al., 1982; Diessel, 1992). Shale layers are flaky, rich in organic matters, and contain mollusk fossils of Gastropods and Bivalves, of which some of them are in juvenile forms. The depositional environment of this forma-tion is fluvio-marine, with the interval of shallow marine sediments appearing periodically (Heryanto et al.,1993a&b).
The Silat Formation consists of 1000 thick sedi-ments, dominated by black carbonaceous mudstone, shale, slaty shale, minor dark coloured siltstone, fine- to medium-grained sandstone, and occasionally thin layer of coal (Figures 4b and 6). In several spots, there are also rich layers of Gastropod, Pelecypod, and plant remains. The depositional environment of Silat shale is fluvio-marine to open marine (Pieters et al., 1987, Heryanto et al., 1993a & b).
Methods
Field studies were carried out in 2009 (Santy et al., 2009; Gumilar et al., 2009, and Suyono et al., 2009) within the Ketungau Basin, including the collection samples of the Ketungau Formation at the Ketungau and Sekalau Rivers and their tributar-ies (Figure 2). In 2010, the fieldwork (Santy et al., 2010, Gumilar et al., 2010) was continued within the Melawi Basin, including the collection of samples of the Silat Formation at the Silat River and its tributaries (Figure 2).
Several samples were carefully selected for the laboratory analysis, including eighteen samples of organic fine sediments for petroleum geochemistry analysis. Rock-Eval Pyrolysis and Gas Chromatog-raphy-Mass Spectometry (GC-MS) were carried out at Lemigas. Eight samples from the Ketungau Formation and ten samples from the Silat Formation were picked up for Rock-Eval Pyrolysis (Table 1) to test their total organic carbon (TOC), maximum tem-perature at the top of S2 peak (oC, Tmax), the amount of free hydrocarbon (S1), the amount of hydrocar-

43The Potential of Ketungau and Silat Shales in Ketungau and Melawi Basins, West Kalimantan: For Oil Shale and Shale Gas Exploration (L.D. Santy and H. Panggabean )
Figure 3. Stratigraphic comparison between Ketungau Basin and Melawi Basin, and Lupar-Serawak Valley (Tan, 1979; Heryanto et al. 1993 a&b).
Qal : Alluvial and lake depositsQa : Alluvial deposits
Tml : Lapung VolcanicsToms : Sintang Intrusives
Temu : Muller VolcanicsTeme : Mentemol Formation
Tos : Sekayam SandstoneTot : Tebidah FormationTeop : Payak FormationTesi : Silat ShaleTed : Dangkan SandstoneTei : Ingar FormationTeh : Haloq Sandstone
Teu : Silat shale, Dangkan sst, and Ingar Fm. undovided
Ketungau FormationTeke : Tetu : Tutoop SandstoneTeka : Kantu Formation
Temd : Mandai GroupTep : Piyabung VolcanicsTen : Nyaan Volcanics
Kue : Era GraniteKup : Pesinduk Granodiorite
Kte : Embaluh GroupKse : Selangkai GroupKlme : Menyukung Granite
Jklk : Kapuas ComplexJkld : Danau Mafic Complex
Trkb : Batung VolcanicsTruj : Jambu VolcanicsPTRb : Busang ComplexCTRs : Senintau Complex
LUPAR VALLEY
Q : QuaternaryPS : Plateu SandstoneSil : Silantek Formation
us : Upper Silantekrb : lenticular redbedss : lenticular sandstoneTm : Temudok Memberbs : basal sandstone Member
Grd/mGrd: Granodiorite/ microgranodioriteDr/mDr: Diorite/microdiorite
LUBOK ANTU MELANGE BELT
Lup : Lupar FormationLy : Layar Member of Belaga
Formation
Gb : Gabbro
PAKONG MAFIC COMPLEX:
Pmb : Basalt ZonePmg : Gabbro ZonePmu : Undifferentiated ophiolithic
Rocks
SINTANG & PUTUSSIBAU SHEETS
PERIOD
QUATERNARY
PALEOCENE
CR
ET
AC
EO
US
JUR
AS
SIC
TRIASSIC
PERMIAN
CARBKONIFEROUS
DEVONIANPA
LE
OZ
OIC
ME
SO
ZO
IC
SILURIAN
CTRs
Jklk
K
K
T
s
e
e
JKld
TRuj TRKb
PTRb
NE
OG
EN
E
MIO
CE
NE
PLIOCENE
Upper
Upper
MELAWI BASIN
MANDAI BASIN
KETUNGAU BASIN
W. KUTEI BASIN
Upper
Teh
Ps
Intermediate
Basic
(a)
(a)
(a)
(a)(b)
(b)
(b)
(c)
Acid
Temu
Upper
Upper
Middle
Middle
Middle
Lower
Lower
Lower
Lower
Lower
TE
RT
IAR
Y
PA
LE
OG
EN
E OL
IGO
CE
NE
E
PO
CH
AGE SINTANG&PUTUSSIBAU WEST LUPAR FAULT ZONE
EAST LUPAR FAULT ZONE EXPLANATION

44 Indonesian Journal of Geology, Vol. 8 No. 1 March 2013: 39-53
Figure 4. Stratigraphic sequence of Ketungau and Silat Formations. a. Ketungau stratigraphic sequence is taken from loca-tion 09LS02, Temiang Hill. b. Silat stratigraphic sequence is taken from location 10LS17, Pengga River.
Shale, dk grey, carbonaceous, containingcoal lens, ichnofossil Ophiomorpha,diameter 4 cm.
Shale, dk grey, parallel laminationcarbonaceous
Thinly bedded clay and sandstone
Clay, dk grey, massive, low angle X-lamination, carbonaceous
Clay, dk grey, massive, parallellamination, carbonaceous.
Clay, dk brn, massive, medium compaction, lignite streaks appears.
Clay, dk brwn, massive, carbonaceous,o ostrike/dip N 1 05 E/12.
Shale, dark grey, friable, parallel lamination,containing wood fragments, strike/dip
o oN 220 E/6.
Shale, dk grey, friable, parallel lamination,containing wood fragment, interbedded withclay and thin lignite layer.
Shale, dark grey, friable, parallel lamination,containing wood fragments, strike/dip N 220°E/6°.
Clay, dark grey, thin bedded 5 -15 em,carbonaceous, partly oxidized, strike/ dip N 295°E/5°.
Stratigraphic sequenceof Ketu gau Fm.n
Stratigraphic sequenceof Silat Fm.
b a
11 11
10 10
9 9
8 8
7 7
6 6
5 5
4 4
3 3
2 2
1 1
0o12
o5
o6
0
Interbedded quartz sst, dk grey, fine sand high compaction, well sorted,carbonaceous, load cast in thebottom
Quartz sst, dk grey, fine sst, massive high compaction, well sorted,
o10carbonaceous, o o
strike/dip N 120 E/10

45The Potential of Ketungau and Silat Shales in Ketungau and Melawi Basins, West Kalimantan: For Oil Shale and Shale Gas Exploration (L.D. Santy and H. Panggabean )
Figure 6. Carbonaceous shale of Silat Formation, out-cropping at point 10LS17, Sengkuang Teribuk (see Figure 2 for the position on the map).
Figure 5. Thick layer of Ketungau Shale contains fine sand concretions and Ophiomorpha ichnofossil. Location of the outcrop is at point 09PE10,Sekalau River (see Figure 2 for the position on the map).
bon released from kerogen (S2), and the amount of organic carbon dioxide (S3). Whereas, totally eight samples were taken for GC-MS analysis (Table 2). The analysis were conducted for biomarker purposes in order to determine the origin of organic matter and the maturity level of the source rocks following the method recommended by Bordenave (1993). The analysis includes derivation values of n-alkanes, steranes, isoprenoids, and triterpanes.
Total hydrocarbon volume is calculated through the formula suggested by Waples (1985), as follows :
Volume of HC = (k) x (TOC) x (HI)x(f)Total HC volume = (HC volume/cubic mile) x (cubic mile of source rock)
Total oil can be generated = (Expulsion efficiency) x (Total HC volume)Where :k = 0,7 (constant value for shale)TOC = Total Organic Carbon (in wt%)HI = Hydrogen Indeks (mg HC/ gr TOC)ƒ = value of fractional conversion for HC maturity
Maturity is expressed as a fraction f between 0 (completely immature) and 1 (fully mature). Sluijk and Nederlof (1984, in Waples 1985) suggested a relationship between reflectance vitrinite values (Ro) and fractional conversion (f) of every types of kerogen, as shown in Figure 7.
Source Rock Evaluation
Origin of Organic MatterThe origin of organic matter is determined from
the content of normal alkanes, isoprenoids, triter-panes, and steranes in every samples analyzed. Bio-marker analysis was conducted from two samples of the Ketungau Formation and six samples of the Silat Formation (Table 2).
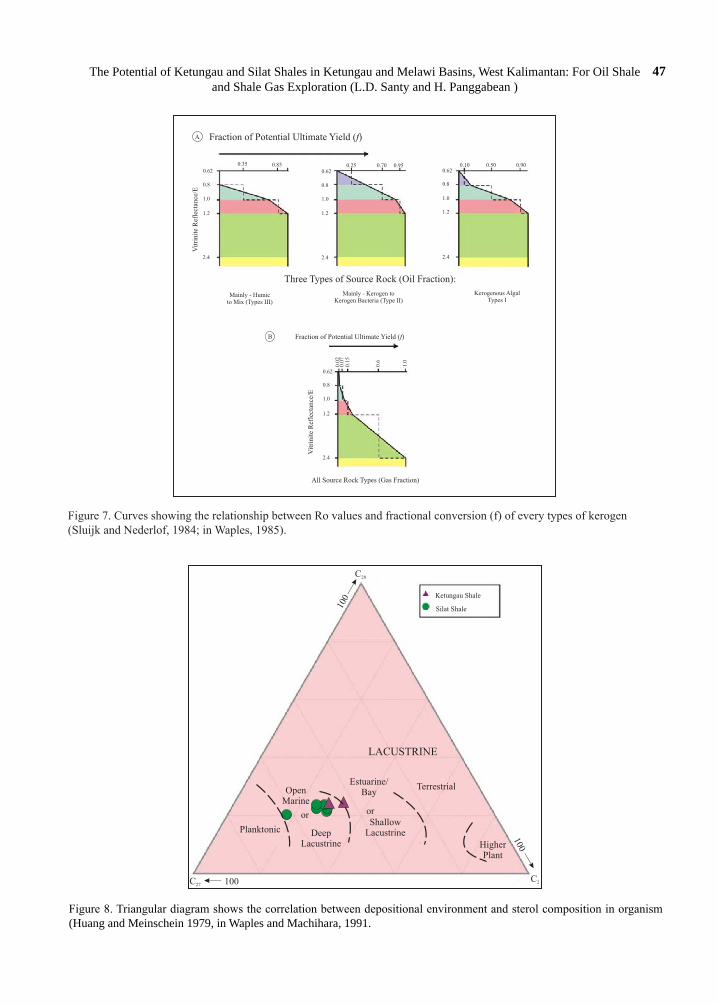
Waples (1985) explains isoprenoid as a good indicator of depositional environment. High ratio of pr/ph (with CPI < 1) usually marks oxidizing envi-ronment (Bordenave (1993). Peters and Moldowan (1993) mention that the presence of oleanane and gammacerane can be used to differentiate terrestrial high plant origin over hypersaline condition. While the application of sterane hase been used by Huang and Meinschein (1979, in Waples and Machihara, 1991), and Bordenave (1993) to determine the depo-sitional environment. The relative amount of C27-C29 in sterol is related to a specific range of depositional environment. Therefore, the content of sterane in the sediments will be useful in determining the origin of organic matter.
Biomarker analysis for all Ketungau samples show pr/ph ratio > 1, indicating an oxic marine condition (Table 2). Plotting of C27-C29 distribution (Figure 8) also resulted in the similar depositional environment. However the presence of oleanane in all samples (ranging from 0.04 - 0.06;Table 2) sug-gests input of terrestrial high plants (Moldowan et al., 1985; Peters and Moldowan, 1993). Therefore the environment suitable for these conditions is an

46 Indonesian Journal of Geology, Vol. 8 No. 1 March 2013: 39-53
Table 1. TOC and Pyrolysis Rock Eval Data of Ketungau and Silat Formations
Table 2. GC-MS Data of Ketungau and Silat Formations
No Forma-tion Sample No.
Sam-ple
Type
Analized Lithol-
ogy
EOM (ppm)
TOC Sat. Arc. NSOPr/Ph
Pr/nC17
Pr/nC13
CPISterane Triterpane
(% weight) C27 C28 C29 OI Gam-mm
1 Ketungau 09 LS 02 D OC sh, v.dkgy 111.59 - 44.44 3.7 51.86 1.24 0.94 0.19 0.98 43 24 33 0.04 -2 09 LS 05 A OC sh, v.dkgy 1.015.90 - 31.9 4.76 63.34 3.65 0.6 0.29 1.05 48 24 29 0.06 -3 Silat 10 LS 13 OC sh, v.dkgy 178 0.75 19.44 16.66 63.9 - - - - 49 23 27 0.13 -4 10 LS 17 B OC sh, v.dkgy 71 0.62 13.79 13.79 72.42 - - - - 52 22 26 0.22 -5 10 LS 17 C OC sh, v.dkgy 102 0.71 10.25 5.13 84.62 - - - - 62 20 18 0.11 -6 10 LS 22 A OC sh, v.dkgy 3066 1.21 69.1 8.97 21.93 - - - - 51 23 25 0.17 -7 10 LS 23 A OC sh, v.dkgy 2926 1.37 63.65 12.14 24.21 - - - - 49 21 29 0.03 -8 10 LS 23 B OC sh, v.dkgy 3386 1.72 56.61 13.46 29.93 - - - - 49 22 29 0.02 -
Remarks: EOM : gram bitumen/gram sample x106 (ppm) Pr : Pristane BDG : Biodegraded
Sat : Saturated fraction Ph : Phytane OC : Outcrop
Aro : Aromatic fraction n-C17 : Normal alkane OI : Oleanane
NSO : Polar fraction CPI : Carbon Preference Index CPI : (C25+C27+C29+C31)/2*(C25+C28+C30)
No
Form
a-tio
n Sample No.Sam-ple
TipeAnalized Lithology TOC
(%)
S1 S2 S3 PYS2/S3 PI PC Tmax
(oC) HI OImg/g
1
Ket
unga
u
09 LS 02 A OC Shale, dkgy, Hd 0.64 0.40 0.13 0.07 0.53 1.86 0.75 0.04 360** 20 11
2 09 LS 03 B OC Shale, v dkgy, sl hd, slickensided (slighty meta) 4.70 0.15 0.00 2.23 0.15 0.00 1.00 0.01 412** 0 47
3 09 LS 05 A OC Shale, v dkgy, sl hd, slickensided (slighty meta) 4.72 0.09 0.00 0.20 0.09 0.00 1.00 0.01 247** 0 4
4 09 LS 05 B OC Shale, v dkgy, hd, slighty meta 0.86 0.06 0.00 0.15 0.06 0.00 1.00 0.00 246** 0 18
5 09 LS 11 D OC Shale, brn dkgy 2.79 0.37 4.48 0.49 4.85 9.14 0.08 0.40 424 160 18
6 09 PE 18 A OC Shale, v dkgy/blk 10.53 0.18 7.52 2.43 7.70 3.09 0.02 0.64 415 71 23
7 09 PE 18 C OC coal, blk, vitreos 50.63 1.32 66.86 5.66 68.18 11.81 0.02 5.66 412 132 11
8 09 YK 09 OC claystone, gy-med dkgy 0.74 0.05 0.42 0.16 0.47 2.63 0.11 0.04 427 57 22
9
Sila
t
10 LS 13 OC Sh, v dkgy 0.75 0.39 0.02 0.33 0.41 0.06 0.95 0.03 433 3 44
10 10 LS 17 A OC Sh, v dkgy 0.52 0.08 0.03 0.37 0.11 0.08 0.73 0.01 273 6 71
11 10 LS 17 B OC Sh, v dkgy 0.62 0.04 0.00 0.19 0.04 0.00 1.00 0.00 246 0 31
12 10 LS 17 C OC Sh, v dkgy 0.71 0.11 0.00 0.16 0.11 0.00 1.00 0.01 273 0 23
13 10 LS 20 A OC Sh, v dkgy - - - - - - - - - - -
14 10 LS 20 B OC Sh, v dkgy, calc 0.80 0.95 1.40 0.24 2.35 5.83 0.40 0.20 439 174 30
15 10 LS 22 A OC Sh, v dkgy, black 1.21 1.51 3.06 0.22 4.57 13.91 0.33 0.38 442 252 18
16 10 LS 22 B OC Sh, dkbrown-dkgy - - - - - - - - - - -
17 10 LS 23 A OC Sh, v.dkgy.black 1.37 1.12 3.98 0.17 0.17 23.41 0.22 0.42 445 290 12
18 10 LS 23 B OC Sh, v.dkgy.black 1.72 1.36 4.67 0.21 0.21 22.24 0.23 0.50 443 272 12
open marine with the influence of fluvial channel as a terrestrial input that can be deposited.
While plotting of C27-C29 distribution for Silat shales (Figure 8) shows an open marine or deep la-custrine environment. High amount of C27 indicates source from marine phytoplankton, whereas large amount of C29 indicates contribution from terrestrial input. Sample 10LS17C has the highest content of C27 sterane (ratio of αββC27 is 62; Table 2), refering to a deeper marine environment. Nevertheless, olenane appears in all Silat samples (ranging from 0.02 - 0.22;
Table 2), indicating the presence of terrestrial input in the environment.
Organic RichnessFor the purpose of assessing the source rock po-
tential of the Ketungau and Silat shales, a diagram of crossplott between TOC (in wt %) and total genera-tion potential (PY, in mg HC/g rocks) was made. The ranges of potential values used in the cross-plot are based on the classification suggested by Tissot and Welte (1984), Waples (1985), Peters (1986), and Bor-
47The Potential of Ketungau and Silat Shales in Ketungau and Melawi Basins, West Kalimantan: For Oil Shale and Shale Gas Exploration (L.D. Santy and H. Panggabean )
Vit
rinit
e R
efle
ctan
ce/E
Vit
rini
te R
efle
ctan
ce/E
Fraction of Potential Ultimate Yield (f)
Three Types of Source Rock (Oil Fraction):
Mainly - Humic to Mix (Types III)
Mainly - Kerogen to Kerogen Bacteria (Type II)
Kerogenous Algal Types I
0.35 0.25 0.100.62
0.8
1.0
1.2
2.4
0.85 0.70 0.50 0.95 0.900.62
0.02
0.62
0.8
1.0
1.2
2.4
0.07
0.15
0.6
1.0
0.8
1.0
1.2
2.4
0.62
0.8
1.0
1.2
2.4
A
B
Figure 7. Curves showing the relationship between Ro values and fractional conversion (f) of every types of kerogen (Sluijk and Nederlof, 1984; in Waples, 1985).
Ketungau Shale
Silat Shale
LACUSTRINE
Open Marine
Estuarine/Bay
Terrestrial
or or
Planktonic Deep Lacustrine
Shallow Lacustrine
Higher Plant
C27C29
C28
100
100
100
Figure 8. Triangular diagram shows the correlation between depositional environment and sterol composition in organism (Huang and Meinschein 1979, in Waples and Machihara, 1991.

48 Indonesian Journal of Geology, Vol. 8 No. 1 March 2013: 39-53
denave (1993). The result of the cross-plot in Figure 9a shows that four samples from the Silat Formation and five samples from the Ketungau Formation are categorized as poor source rocks (TOC 0.52 - 4.72 wt %; PY 0.04 - 0.53 mg HC/g rock). One sample taken from a Ketungau coal layer (09PE 18C) shows an excellent source type (TOC 50.63 wt% and PY 68.18 mg HC/g rock).
Good source rock potentials (TOC 1.72 - 10.53 wt%; PY 6.03 - 7.70 mg HC/ g rock) are shown by one sample from the Ketungau shale (09PE 18A) and one sample from the Silat Shale (10LS 23B). While, three samples from the Silat shale (10LS20B, 10LS22A, and 10LS23A) and one sample from the Ketungau shale (09LS11D) are considered as fair source rocks (TOC 0.80 - 2.79 wt%; PY 2.35 - 5.10 mg HC/ g rock). A cross-plot between TOC versus Hydrogen Index (HI) was also made for a comparison (Figure 9b).
Kerogen Type and Maturity IndicatorThe crossplot between Hydrogen Index and Tmax
(Figure 10) shows that all samples from the Ketun-gau Formation are kerogen type III, derived from mixed marine algae and terrestrial plant, and tend to be more gas prone (Waples, 1985). While only one sample from the Silat Formation (10LS13) is identi-
fied as type III kerogen. Four samples from the Silat Formation are type II kerogen, derived dominantly from marine algae, and tend to be more oil prone.
Maturity indicator from pyrolisis temperature (Tmax) identifying five samples of the Ketungau Formation are immature (Tmax < 435 oC). Whereas, four samples from the Silat Formation have reached maturity level, and only one sample (10LS13) is still immature.
Maturity indicator from biomarker analysis was taken for a comparison. Waples and Machihara (1991) mention that maturity indicator from kerogen and biomarker analyses is different. Kerogen has an immobile characteristic, therefore the maturity indicator from kerogen is similar to the rock or sedi-ment maturity when it is found. While biomarker from bitumen fraction has a mobile characteristic in rock or sediments, so the maturity identification from biomarker can only be done for indigeneous bitumen.
Triterpane paramaters, C30 moretane/hopane, C27-trisnorhopane 17α(H)-22,29-30 (Tm), and C27-trisnorneohopane 18α(H)-22,29-30 (Ts) have been used as the biomarker maturity parameter (Figure 11). Two samples from the Ketungau Formation (09LS02D and 09LS 05A) indicate an immature to
Ketungau Shale
Ketungau Shale
900
800
700
600
500
400
300
200
100
Silat Shale
Silat Shale
0.1 0.1 1.0 1.0 10.0 10.0 100.0100.0
1000.0
100.0
20.0
10.0
1.0
0.1
0.01
Poo
r
Poor
Poor -
Fai
r
Fair
Fair
Goo
d
Good
Good - Excellent
Oil
Prone
Coal
Gas
Pro
ne
EXCELLENT
Total Organic Carbon (TOC)(wt. %)Total Organic Carbon (TOC)(wt. %)
Tota
l G
ener
atio
n P
oten
tial
(P
Y)
(mg
HC
/g r
ocks
)
A BType I
Figure 9. a). Diagram TOC vs PY shows source rock potential of the Ketungau and Silat Formations b). Diagram TOC vs HI shows slightly different values of source rock potential compared to TOC vs PY crossplot.
a b

49The Potential of Ketungau and Silat Shales in Ketungau and Melawi Basins, West Kalimantan: For Oil Shale and Shale Gas Exploration (L.D. Santy and H. Panggabean )
early mature level. While one sample of the Silat Formation (10LS17C) shows peak mature level, and two samples (10LS23A and 10LS23B) have reached a late mature level.
Oil Shale/Shale Gas Potential
So far, several main key parameters for oil shale to be economically produced according to Tissot and Welte (1984) are: 1) composition of organic matter, 2) TOC content and Oil Yield, and 3) density and type of kerogen. The kerogen in oil shale can be converted to oil through the chemical process of pyrolysis. During pyrolysis the oil shale was heated to ca500°C in the absence of air and the kerogen was converted to oil and separated out. The process is called “retorting” (Tissot and Welte, 1984). Thus, much more abundant organic matter within the shale and the higher TOC content and Oil Yield, are better,
so that more oil could be generated during pyrolysis.While, key parameters for potential shale gas are
slightly more complicated, that include: 1) Reservoir thickness, 2) thermal maturity, 3) TOC content, 4) high gas in place, and 5) adsorbed gas capacity, and fracability or friability ( Jarvie, et al., 2007; Ross and Bustin, 2008). Cipolla et al. (2009) mentions that typical shale gas reservoirs exhibit a net thickness of 50 to 600 ft (equivalent to 15 to 185 m), porosity of 2-8%, TOC content of 1-14%, and are found at depth ranging from 1,000 to 13,000 ft (equivalent to 300 to 4000 m).
Unlike in conventional oil and gas exploration, migration and trapping mechanism are not important factors, since the oil shale and shale gas explorations are conducted within the layer that was previously called as source rock or/ and cap rock. Therefore, the distribution of the Ketungau and Silat Forma-tions within syncline structures will not become a major problem for potential exploration. In fact, it is
Ketungau Shale
Silat Shale
TYPE I
TYPE II
LS23ALS23BLS22A
LS20BPE18C
PE18A
Ls13YK09
375
900
600
300
200
100
0
405 435 465 495 525 T max
o( C)
LS02A
TYPE III
IMMATURE
Hyd
rog
en i
ndex
(m
g H
C/g
C)
org
MATURE POST MATURE
Figure 10. Crossplot between hydrogen index and Tmax shows most of the Ketungau samples are immature, in the contrary most of the Silat shales have reached a mature condition.

50 Indonesian Journal of Geology, Vol. 8 No. 1 March 2013: 39-53
just suitable for the common structure of shale gas reservoir (Bowker, 2007).
Assessment for Ketungau FormationThe Ketungau Formation is distributed within
Ketungau syncline, on an area of about 2216 km2 (equivalent to 855.7 square miles), and the average thickness is 900 m (Santy et al. 2009 and Santy et al. 2010). The potential thickness to be accounted for the resources of oil and gas for the Ketungau Forma-tion is estimated to be 10 % of the total thickness, which is 90 m (Sutjipto, 1992). Maturity becomes a big issue for Ketungau source rock, since most samples from this formation were identified to be immature. However, in order to show the possibility of potential oil shale and shale gas exploration, the volume of oil and gas that can be generated from this source rock will be estimated. TOC and HI cal-culation from sample 09LS11D has been used for this estimation (TOC 2.79 wt %; HI 160 mg HC/g rock; Table 1).
The Ketungau source rocks mostly consist of kerogen type III that can commonly generate about 20% oil and 80% gas as suggested by Waples (1985). However, because in oil shale exploration all fine organic rich sediment fraction can be converted into
liquid oil through pyrolysis, probably the amount of organic carbon capable of generating oil is thus 100% of the 2.79% of TOC.
Calculating the volume of oil generated, the rela-tionship between f and Ro for humic to mix kerogen (type III) is used in this study as shown in Figure 7, which is 0.35 for the f value. Using the formula suggested by Waples (1985), then the volume of oil that can be generated from Ketungau source rock is :k)(TOC)(HI)(f) = (0.7) x (2.79) x (160) x (0.35) = 109.368 million barrels oil/cubic mile of source rockVolume of sediment = area x thickness = 2216 km2 x 0.09 km = 199.44 km3 = 47.84 cubic mileTotal oil volume = (oil volume/ cubic mile) x (cubic miles of souce rock) = 109.368 x 47.84 = 5,232.2 million barrels
As the result, the total oil that can be converted from the Ketungau source rock is 5,232.2 million barrels.
The volume of gas generated is calculated in the similar way, except that f for gas generation it is determined to be 0.07 from the curves of Ro vs f for gas fraction (Figure 7). TOC value is calculated
Peak Mature
Late Mature
Early Mature
Immature
LS23BLS23A
LS17C
LS05ALS17B
LS13LS02D
LS22A
Crossplot of Triterpane Maturity Parameters
Tm/Ts
C m
oretane/hopane30
20.00
0.05
0.10
0.20
0.30
0.50
1.00
10.00 5.00 2.00 1.00 0.50 0.20 0.10
Ketungau Shale
Silat Shale
Figure 11. Triterpane maturity parameter shows different result of maturity indication for samples of Ketungau and Silat Formation

51The Potential of Ketungau and Silat Shales in Ketungau and Melawi Basins, West Kalimantan: For Oil Shale and Shale Gas Exploration (L.D. Santy and H. Panggabean )
80% of the 2.79% of TOC, or 2.23% (the amount of gas generated from type III kerogen). Constant k is multiplied by 6 (six) to obtain the volume of gas in billion of standard cubic feet per cubic mile of source rock. While, the effective thickness for shale gas layer is estimated 90 m.
The volume of gas that can be generated from the Ketungau source rock is :
= (0.7) x (6) x (2.23) x (160) x (0.07)= 104.8992 billion cubic feet gas per cubic mile
of source rockVolume of sediments = area x thickness = 2216
km2 x 0.09 km = 199.44 km3 = 47.848 cubic mileTotal gas volume = (gas volume/ cubic mile) x
(cubic miles of souce rock)= 104.8992 x 47.848= 5019.2 billion cubic feet gas (BCF)
Then, the total gas that can be produced from the Ketungau shale layer is about 5019.2 BCF.
Assessment for Silat FormationThe Silat Formation is distributed within Silat
Syncline, on an area of about 715.4 km2 (equivalent to 276.2 square miles), and 1000 m thick on the av-erage (Heryanto et al., 1993b; Suyono et al., 2009; Santy et al., 2010). Similarly, the potential thickness to be accounted for the resources of oil and gas for the Silat Shale is estimated to be 10 % of the total thickness, which is 100 m (Sutjipto, 1992). Maturity calculation for the Silat shale shows that almost all samples analyzed have reach mature levels. TOC and HI calculation from sample 10LS23C has been used for this estimation (TOC 1.72 wt %; HI 272 mg HC/g rock; Table 1).
Calculating the volume of oil generated, the rela-tionship between f and Ro for humic to mix kerogen (type II) has been applied here as shown in Figure 7, which is 0.5 for the f value. Then, the volume of oil can be generated from Silat shale is:(k)(TOC)(HI)(f) = (0.7) x (1.72) x (272) x (0.5) = 163.744 million barrels oil/ cubic mile of source rock Volume of sediment = area x thickness = 715.4 km2 x 0.1 km = 71.54 km3 = 17.16 cubic mileTotal oil volume = (oil volume/ cubic mile) x (cubic miles of souce rock) = 147.56 x 17.16 = 2,532.6 mil lion barrels
Therefore, the total oil that can be converted from Silat shale is around 2,532.6 million barrels.
The Silat shale source rock mostly consists of kerogen type II that can commonly generate about 90% oil and 10% gas (Waples, 1985). However, most shale gas play in the world comes from type II kerogen instead (Ross and Bustin, 2008; Cipolla et al., 2009). In order to get an illustration about gas potential from the Silat shale, 80% of gas generation from 1.72% of TOC, or 1.55% is used in this calcula-tion. The value of constant k is multiplied by 6 to get the volume of gas in billion of standard cubic feet per cubic mile of source rock. While, the effective thickness for shale gas layer is 100 m.
Then, the total gas that can be generated from Silat shale is:
= (0.7)(6)(1.4)(272)(0.07)= 111.9552 billion cubic feet gas per cubic mile of source rock
Volume of sediment = area x thickness = 715.4 km2 x 0.1 km = 71.54 km3 = 17.16334 cubic mileTotal gas volume = (gas volume/ cubic mile) x (cubic miles of souce rock) = 111.9552 x 17.16334 = 1,921.525 billion cubic feet
Then, the total gas that can be produced from Silat shale layer is about 1,921.525 BCF or 1.92 TCF.
Conclusions
The Ketungau and Silat Formations surely have good potential for unconventional oil shale or/and shale gas exploration. Apart of both formations having great sediment thickness, the composition of organic matter, TOC content and Oil Yield, density and type of kerogen are all important factors in oil shale and shale gas to be economically explored. The Ketungau shale mostly consist of kerogen type III, while the Silat shale consists of kerogen type II.
A total volume of oil which can be generated from oil shale production from the Ketungau Forma-tion is about 5,232.2 million barrels, and the total gas that can be generated from the shale gas layer is about 5019.2 BCF. While, the total oil that can be generated from the Silat Shale is 2,532.6 million barrels, and total gas can be generated is 1.92 TCF. However, source rock maturity in the Ketungau

52 Indonesian Journal of Geology, Vol. 8 No. 1 March 2013: 39-53
Formation is variated, and is mostly still in imma-ture level. This condition can surely decrease the potential of the Ketungau source rock to produce oil and gas. On the contrary, the Silat shale can become a very good source rock, since the maturity distri-bution in this formation is spreading more evenly, mostly reaching a mature level.
Acknowledgement---The authors wish to thank the Head of the Centre for Geological Survey, Geological Agency, and also the Programme Coordinator for Basin Dynamics who gave permission to publish this paper. The authors also extend gratitude to all colleagues that have helped and gave great contribution during the fieldwork, laboratory analysis, and also discussions.
References
Bordenave, M.L., (eds) 1993. Applied Petroleum Geochemistry Editions Technip, 27 Rue Ginoux 75737, Paris, Cedex 15, 524pp.
Bowker, K.E., 2007. Barnett Shale gas production, Fort Worth Basin: Issues and discussion. American Association of Petroleum Geologists, Bulletin, 91 (4), p.523-533.
Canadian Occidental Petroleum Ltd., 1992. Kalimantan, Indonesia Melawi Ketungau Basin Exploration Potential. Unpublished report Canadian Occidental Petroleum Ltd.
Canadian Oxy, 1995. Final Well Report Kedukul-1 West Kalimantan Sintang PSC. Unpublished report Canadian Oxy Indonesia.
Cipolla, C.L., Lolon, E.P., StrataGen Engineering, Erdle, J.C., and Rubin, B., 2009, Reservoir Modelling in Shale-Gas Reservoir, SPE 125530. Society of Petroleum Engineers, West Virginia - USA, p.1-19.
Diessel, C. F.K., 1992. Coal-bearing depositional systems. Springer-Verlag, Berlin Heidelberg-New York-London-Paris-Tokyo-Hongkong-Barcelona-Budapest, 721pp.
Gumilar, I.S., Agustyanto, D., Gunawan, EW., Irawan, D., Hamzah, A., and Saragih, R.Y., 2009. Penelitian Dinamika dan evolusi Cekungan Ketungau, Kalimantan Barat. Laporan akhir Pusat Survei Geologi, laporan tidak terbit, 89p.
Gumilar, I.S., Agustyanto, D., Nugroho, E.H., Ismawan, Rijani, S., and Kusuma, A.B., 2010. Studi Cekungan Ketungau, Kalimantan Barat, Kalimantan Barat. Laporan akhir Pusat Survei Geologi, laporan tidak terbit. 56pp.
Hall, R. and Nichols, G., 2002. Cenozoic Sedimentation and Tectonics in Borneo : Climatic Influences on Orogenesis. In: Jones, S.J. and Frostick, L. (eds.), 2002 Sedimen Flux to Basins : Causes, Controls, and Consequences, The Geological Society of London, Special Publication.
Hall, R., 1996. Reconstructing Cenozoic SE Asia: In: Hall R. and Blundell D., (eds.) Tectonic evolution of Southeast Asia. Geological Society of London, p. 153-184.
Heryanto, R. Williams, P.R., Harahap, B.H., and Pieters, P.E., 1993a. Peta Geologi Lembar Putussibau, Kalimantan, Skala 1: 250.000, Pusat Penelitian dan Pengembangan Geologi, Bandung.
Heryanto, R., Williams P.R., Harahap B.H., Pieters P.E., 1993b. Peta Geologi Lembar Sintang, Kalimantan skala 1 : 250.00. Pusat Penelitian dan Pengembangan Geologi, Bandung.
Heryanto, R., Panggabean, H., Bachri, S., Suyono, Santi, L., Gumilar, I.S., Panjaitan, S., and Sudarwono, 2009. Cekungan Ketungau, Kalimantan Barat. Desk Work, Pusat Survei Geologi. p.109. tidak terbit.
Jarvie, D.M., Hill., R.J., Ruble, T.E, and Pollastro, R.M., 2007. Unconventional shale-gas systems: The Mississippian Barnett Shale of north-central Texas as obe model for thermogenic shale gas assessment. American Association of Petroleum Geologist, Bulletin, 91 (4), p.475-499.
Lemigas, 2004. Petroleum System Cekungan Melawi-Ketungau, Kalimantan Barat. Tim Studi Petroleum System Cekungan Melawi-Ketungau, Laporan Penelitian PPPTMGB-Lemigas, Unpublished report, 63 pp.
Moldowan, J.M., Seifert, W.G., and Gallegos, E.J., 1985. Relationship between Petroleum Composition and Depositional Environment of Petroleum Source Rocks. In: American Association of Petroleum Geologist Treatise of Petroleum Geology Reprint Series, No.8, Geochemistry, p.1255-1268.
Peters, E. and Moldowan, J., 1993. The Biomarker Guide : Interpreting Molecular Fossils in Petroleum and Ancient Sediments, Englewood Cliffs, Prentice Hall, 363pp.
Peters, K.E., 1986. Guidelines for Evaluating Petroleum Source Rock Using Programmed Pyrolysis. American Association of Petroleum Geologists, Bulletin, 70(3), p.318-329.
Pieters, P.E., D.S. Trails, and Supriatna S., 1987. Correlation of Early Tertiary Rocks Across Kalimantan. Proceedings of Sixteenth Annual Convention of Indonesian Petroleum Association,16, p.291-306.
Pieters, P.E., Surono, and Noya Y., 1993. Peta Geologi Lembar Nangaobat, Kalimantan, skala 1 : 250.00, Pusat penelitian dan Pengembangan Geologi, Bandung.
Ross, D.K. and Bustin, R.M., 2008. Characterizing The Shale Gas Resource Potential of Devonian - Mississippian Strata in The Western Canada Sedimentary Basin : Application of An Integrated Formation Evaluation, American Association of Petroleum Geologists, Bulletin, 92 (1), p.87-125.
Santy, L.D., Nugroho, E.H., Kusworo, A., Hikmat, A. Suyoko, Hermanto, B., Putra A.P., and Saputra, A., 2009. Penelitian Dinamika dan Evolusi Cekungan Ketungau Bagian Barat, Kalimantan Barat. Laporan akhir Pusat Survei Geologi, Bandung, Badan Geologi, Kementerian Sumber Daya Energi, laporan tidak terbit. 134pp.
Santy, L.D., Suyoko, and Putra, A.P., 2010. Penelitian Stratigrafi Cekungan Ketungau, Kalimantan Barat. Laporan akhir Sesi-II, Pusat Survei Geologi, Bandung, Badan Geologi, Kementerian Sumber Daya Energi, laporan tidak terbit. 134pp.

53The Potential of Ketungau and Silat Shales in Ketungau and Melawi Basins, West Kalimantan: For Oil Shale and Shale Gas Exploration (L.D. Santy and H. Panggabean )
Smith, R., Betzler, C., Brass, G.W., Huang, Z., Linsley, B., Merril, D., Muller, C.M., Nederbragt, A., Nichols, G.J., Pubellier, M., Sajona, F.M., Scherer, R.P., Shyu, J.P., Solidum, R., Spadea, P. and LEG 124 SCIENTIFIC PARTY, 1990. Depositional Systems of the Celebes Sea from ODP sites 767 and 770. Geophysical Research Letters, 17.
Stach, E., Mackowsky, M-TH., and Teichmuller, M., Taylor, G.H, Chandra, D., and Teichmuller, R., 1982. Stach’s Textbook of Coal Petrology. 3rd Edition., Gebruder Borntraeger-Berlin-Stuttgart., 535pp.
Supriatna, S., Margono U., Sutrisno, Keyser F. de, Langford R.P., and Trail D.S., 1993. Peta Geologi Lembar Sanggau, Kalimantan skala 1 : 250.00. Pusat Penelitian dan Pengembangan Geologi, Bandung.
Sutjipto, R.H., 1992. Sedimentology of the Melawi and Ketungau Basins, West Kalimantan, Indonesia. PhD Thesis, the University of Wollongong, Australia, (unpubl.), 255pp.
Suyono, Limbong, A., Hermiyanto, M.H., Setiawan, R., Amiruddin, Rachmansyah, and Wahyudiono, M., 2009. Penelitian Stratigrafi dan Sedimentologi Cekungan Ketungau Bagian Timur, Kalimantan Barat. Laporan akhir Pusat Survei Geologi, laporan tidak terbit. 81 pp.
Tan, D.N.K., 1982. The Lubok Antu Melange, Lupar Valley West Sarawak a lower Tertiary Subduction Complex. Bulletin of the Geological Society of Malaysia, 15, p. 31-46.
Tissot, B. and Welte, D.H., 1984. Petroleum Formation and Occurrence, Springer-Verlag, Berlin-Heidelberg-New York-London-Paris-Tokyo. 2nd ed., 699pp.
Waples, D.W. and Machihara, T., 1991. Biomarkers for Geologist - A Practical Guide to the Application of Steranes and Triterpanes in Petroleum Geology, American Association of Petroleum Geologists Methods in Exploration Series 9. The American Association of Petroleum Geologists, Tulsa, Oklahoma, USA.
Waples, D.W., 1985. Geochemistry in Petroleum Exploration, International Human Resources Development Corpora-tion, Boston, 232pp.
Williams, P. R., Supriatna, S., Trail, DS., and Heryanto, R., 1984. Tertiary Basin of West Kalimantan, Associated Igneous Activity and Structural Setting. Indonesian Petroleum Association 13th Annual Convention Proceed-ings, p.151-160.
Yulihanto, B., Wiyanto, B., Sulistiyono, and Junaedi, T., 2006. Hydorcarbon System of the Paleogen Sediment of the Melawi Basin, West Kalimantan, Indonesia. Proceedings, Jakarta 2006 International Geosciences Conference and Exhibition, Jakarta , August 14-16, 2006. 4pp.


