

The Relationship between Board Composition and Firm
Performance: A Study of South African Public Companies
A research report submitted in partial fulfilment of the
requirements of the degree of Master of Commerce by
Munyaradzi Raymond Muchemwa
Student number: 569164
Ethics clearance number: CACCN/1033
Supervisor:
Professor Nirupa Padia
University of the Witwatersrand

1
Table of Contents
Declaration ................................................................................................................. 3
Acknowledgements ..................................................................................................... 4
List of Abbreviations .................................................................................................. 5
List of figures and tables ............................................................................................ 6
Abstract ...................................................................................................................... 7
Chapter I: Introduction .............................................................................................. 8
1.1 Background ................................................................................................................ 8
1.2 Corporate governance: – the South African context ................................................ 12
1.3 Statement of the research problem........................................................................... 15 1.3.1 Research questions ............................................................................................ 15
1.4 Purpose of the study ................................................................................................. 16
1.5 Significance of the study .......................................................................................... 16
1.6 Definition of terms ................................................................................................... 17
1.7 Layout of the study .................................................................................................. 18
Chapter II: Literature Review ................................................................................. 19
2.1 Introduction .............................................................................................................. 19
2.2 Agency and resource dependence theories .............................................................. 20 2.2.1 Agency theory ................................................................................................... 22 2.2.2 Resource dependence theory ............................................................................. 25
2.3 The emergence of corporate governance reforms: - The King Reports .................. 29
2.4 Board composition and firm performance ............................................................... 37
2.5 Board size and firm performance ............................................................................. 40
2.6 Summary .................................................................................................................. 43
Chapter III: Research Methodology and Data ......................................................... 44
3.1Research purpose and research hypothesis ............................................................... 44
3.2 Overview of research method .................................................................................. 45 3.2.1 Independent variable ......................................................................................... 46

2
3.2.2 Dependent variables .......................................................................................... 47 3.2.3 Control variables ............................................................................................... 48 3.2.4 Regression model specification ........................................................................ 49
3.3 Population and study sample ................................................................................... 54
3.4 Sample size and selection of sample........................................................................ 55
3.5 Data sources ............................................................................................................. 55
3.6 Collection of data ..................................................................................................... 56
3.7 Data management .................................................................................................... 56
3.8 Data analysis ............................................................................................................ 56
3.9 Validity and reliability ............................................................................................. 58 3.9.1 Validity .............................................................................................................. 58 3.9.2 Reliability .......................................................................................................... 59
3.10 Assumptions and delimitations of the study .......................................................... 59 3.10.1 Assumptions .................................................................................................... 59 3.10.2 Delimitations ................................................................................................... 59
3.11 Summary ................................................................................................................ 60
Chapter IV: Results and Discussion ......................................................................... 61
4.1 Introduction .............................................................................................................. 61
4.2 Descriptive statistics ................................................................................................ 61
4.3 Regression diagnostics ............................................................................................. 68
4.4 OLS regression results ............................................................................................. 70
4.5 Summary .................................................................................................................. 78
Chapter V: Summary and Conclusion ..................................................................... 79
5.1 Summary .................................................................................................................. 79
5.2 Conclusion ............................................................................................................... 80
5.3 Recommendations and areas for further research .................................................... 83
5.4 Limitations of the study ........................................................................................... 87
REFERENCES ......................................................................................................... 88

3
Declaration
I declare that this research report is my own original work and that all sources have been
accurately reported and acknowledged. The report is submitted for the degree of Masters of
Commerce at the University of Witwatersrand, Johannesburg. This research has not been
submitted for any degree or examination at this or any other university.
Raymond Munyaradzi Muchemwa Date

4
Acknowledgements
I would like to express my gratitude to my supervisor, Professor Nirupa Padia, for her constant
guidance, wisdom, and support, and to my wife and family, for their ongoing support.

5
List of Abbreviations
ASX Australian Stock Exchange
CALPERS California Public Employees’ Retirement System
CEO Chief Executive Officer
FT Financial Times
GDP Gross Domestic Product
IOD Institute of Directors
JSE Johannesburg Securities Exchange
King Code King code for corporate governance
King I King code for corporate governance
King II King code for corporate governance
King III King code for corporate governance
MRA Multiple Regression Analysis
NYSE New York Stock Exchange
OLS Ordinary Least Squares
ROA Return on Assets
ROE Return on Equity
SA South Africa
SAICA South Africa Institute of Chartered Accountants
SPSS Statistical Package for the Social Sciences
TIAA-CREF Teachers Insurance and Annuity Association – College
Retirement Equities Fund
TOB Tobin’s Q
UK United Kingdom
US United States
VIF Variance Inflation Factors

6
List of figures and tables
Figure List of figures Page
Figure 2.1 Theoretical model 21
Figure 4.1 Date of incorporation/listing on JSE 62
Figure 4.2 Financial Times (FT) industrial class 63
Table List of tables Page
Table 4.1 Between subject factors 65
Table 4.2 Descriptive statistics 66
Table 4.3 OLS dependent variable: logtobinq 72
Table 4.4 OLS dependent variable: return on total assets 75
Table 4.5 OLS dependent variable: return on equity 77
Table 4.6 Frequencies of performance variables 101
Table 4.7 Means and standard deviations 101
Table 4.8 Multicollinearity diagnostics 103
Appendix 1 Histograms, P-P plots and scattergrams 104
Appendix 2 Durbin-Watson statistics 108

7
Abstract
Academic and commercial interest in the corporate governance practices of publicly listed
companies has increased significantly in recent years (Rossouw, 2005). With high-profile
corporate failures such as Enron and WorldCom heightening the interest in corporate governance
practices (Rashid, 2011). It has become evident that the performance of well governed firms is
superior to that of less well governed firms (Kyereboah-Coleman & Biekpe, 2005). Despite the
fact that corporate governance is multi-dimensional (Kyereboah-Coleman & Biekpe, 2005), this
study focused on the impact of board composition (defined by the percentage representation of
independent non-executive directors on the board) and board size on the firm performance
measures namely; Tobin’s Q (TOB), return on assets (ROA), and return on equity (ROE) of
firms listed on the Johannesburg Securities Exchange (JSE). Annual data, from the period 2006
to 2012 was used while the analysis of data was done using the Multiple Regression Analysis
Model. After having analysed the research results, it was found that no significant relationship
exists between the proportion of independent non-executive directors on the board and board
size, and firm performance measures. Thus, this research study suggests that performance of
South African companies listed on the JSE Securities Exchange is not influenced by board
composition and board size.
Keywords: Corporate governance, firm performance, Tobin’s Q, board composition, board size
8
Chapter I: Introduction
1.1 Background
Corporate failures and massive corporate scandals, including Enron, WorldCom, and Parmalat
internationally, and LeisureNet, Regal Treasury Bank Limited and Saambou Limited in South
Africa in recent years have aroused considerable interest in the literature and research on
corporate governance principles and codes of best practices with a view both to improving
corporate governance and to enhancing corporate performance and survival (Sanda, Garba, &
Mikailu, 2011). The role of the board of directors constitutes an important element in the
implementation of corporate governance (Nicholson & Kiel, 2003). The board monitors the
management of the organisation, sets the strategic direction for the organisation, reviews and
ratifies management proposals, and is in fact the primary and dominant internal corporate
governance mechanism within the organisation (Brennan, 2006). The King1 Reports on
Corporate Governance for South Africa, The King Codes of Governance Principles and the
Companies Act, 20082 makes a number of recommendations about boards and their function in
Corporate South Africa (Cliffe Dekker Hofmeyr, 2013; IOD, 2012).
The need to adopt the correct corporate governance mechanisms is driven by the agency problem
and also the associated free-rider problem that make it difficult for any single investor or
stakeholder to bear the cost of monitoring managers (Sanda et al. 2011). Agency theory (Jensen
1 The King Committee on governance issued all King reports on governance for South Africa (the Reports) and also
the King Codes of Governance Principles (the codes) in 1994, 2002, and 2009. Together these are referred to as
King I, King II, and King III respectively.
2 Section 66 of the Companies Act, 2008 requires that the business and affairs of a company must be managed by or
under the directions of the board, which has authority to exercise all of the powers and perform the functions of the
company.

9
& Meckling, 1976; Eisenhardt, 1989) has emerged as a dominant approach in the literature on
economics and finance (Hermalin & Weisbach, 2003). The theory focuses on aligning the
interests of owners and managers (Jensen & Meckling, 1976; Fama, 1980; Fama & Jensen, 1983)
and is based on the premise that there is an inherent conflict between the interests of the owners
of an organisation and its management (Fama & Jensen, 1983). The theory suggests that a board
of which the majority of members are independent non-executive directors would be able to
monitor any self-interested actions on the part of managers (Zahra & Pearce, 1989; Bathala &
Rao, 1995; Nicholson & Kiel, 2007; Kaymark & Bektas, 2008), and this, in turn would enhance
the organisation’s performance (Luan & Tang, 2007).
On the other hand, resource dependence theory explains how external dependencies may be
reduced by linking an organisation to its external environment through both networking and
legitimacy (Huse, 2007). Huse (2007) notes that, boards of directors may contribute to the
financial performance of an organisation by including directors who have either direct or indirect
access to, control of or knowledge of important external resources or influential groups. Thus,
boards are chosen to maximize the provision of important resources to the firm (Pfeffer &
Salancik, 1978; Hillman & Dalziel, 2003). Klein (1998), for example, suggests that the advisory
requirements of the chief executive officer (CEO) should increase to the extent to which a firm
depends on the environment for resources. Klein (1998) uses the ratio of debt to assets (book
leverage) as a proxy for this dependence. Anderson, Bates, Bizjak and Lemmon (2000) states
that firms with bigger boards usually have a lower cost of debt.
10
The board of directors of a corporation performs the critical function of monitoring and advising
the executive management on the corporation’s strategy (Rashid, 2011; Lorsch & MacIver,
1989). As advocated by agency theory, conventional wisdom also suggests that a higher level of
board independence would enable the more effective monitoring and improvement of firm
performance (Huse, 2007). Prior studies have documented that a majority of independent non-
executive boards ensures better decisions from the perspective of the shareholder’s as regards the
carrying out discrete tasks such as the hiring and firing of the CEO (Weisbach, 1988,
Borokhovich, Parrino, & Trapani, 1996), the adoption of anti-takeover provisions (Brickley,
Coles, & Terry, 1994), and negotiating takeover premiums (Byrd & Hickman, 1992, Cotter,
Shivdasani, & Zenner, 1997).
Both institutional investors and corporate governance entities have called for boards dominated
by independent non-executive director (Coles, Daniel, & Naveen, 2004). The Teachers Insurance
and Annuity Association – College Retirement Equities Fund (TIAA-CREF), one of the largest
pension funds in the world, has stated that it will not invest in companies that do not have a
majority of independent non-executive directors on their boards (Coles et al. 2004). Similarly,
the California Public Employees’ Retirement System (CALPERS), another large pension fund,
recommends that the CEO should be the only executive director on a firm’s board (Coles et al.
2004). Such institutional pressure has resulted in a decrease in both board size (Wu, 2003) and in
the number of executive on the board of directors (Huson, Parrino, & Starks, 2001).
Another important factor that is deemed to affect the ability of a board to function effectively is
the size of the board (Kyereboah-Coleman & Biekpe, 2005). Lipton and Lorsch (1992) and
11
Jensen (1993) suggest that larger boards may be less effective than smaller boards as a result of
the co-ordination problems experienced by larger boards and also problems such as director free-
riding. In addition, Yermack (1996) and Eisenberg, Sundgren, and Wells (1998) have provided
evidence that firms with smaller boards have higher Tobin’s Q3. While Klein (1998), argues that
a CEO’s need for advice increases with the complexity of the organisation. Diversified firms are
more complex than less diversified firms (Hermalin & Weisbach, 1988). Both Hermalin and
Weisbach (1988), and Yermack (1996), suggest that the CEOs of diversified firms have a greater
need for advice than the CEOs for less diversified firms as they operate in multiple segments,
and therefore they require larger boards.
Despite the fact that the results cited above are extremely interesting, they nevertheless raise the
question as to why large boards with a high concentration of executive directors do, in fact, exist
(Coles et al. 2004). Hermalin and Weisbach (2003) raise the following question, namely “Why
has economic Darwinism not eliminated these unfit organisational forms?” Bhagat and Black
(2002), on the other hand question whether “executive directors play valuable roles that may be
lost in a single-minded drive for greater independent non-executive boards.” McConnell (2002)
urges caution in compelling companies to conform to a single model of board composition, while
the King III report (2009) recommends that an optimal mix of executive and independent non-
executive directors serve on boards (Cliffe Dekker Hofmeyr, 2013).
3 Tobin’s Q is the ratio of the market value of assets to the book value of assets. This ratio has been widely used
incorporate finance as a proxy for firm value/firm performance (Morck, Shleifer, & Vishny, 1988;McConnell &
Servaes, 1990; Yermack, 1996;Bhagat & Black, 2002)
12
1.2 Corporate governance: – the South African context
Corporate governance in South Africa was not precipitated by any significant crisis in the
corporate sector as was the case in certain other countries, but by concerns about competitiveness
following the re-admission of South Africa to the global economy after the country’s transition
to a fully-fledged democracy with the collapse of apartheid in 1994 (Malherbe & Segal, 2001).
Corporate governance has developed significantly since both the establishment of the King
Committee on Corporate Governance in 1992, and the release of the first King Report (King I) in
November 1994 (Armstrong, 2003) and also as a result of the instigation of the Institute of
Directors of Southern Africa (IOD, 2002).
The King I Report focused attention on the importance of a properly functioning board of
directors as a key ingredient of effective corporate governance (Armstrong, 2004). Despite the
fact that King I advocated many of the standards and principles which had been adopted in
several Commonwealth countries, following the release of the Cadbury Report in the United
Kingdom in 1992, the King I report was perhaps distinguished by its integrated approach to good
governance in the interests of a wide range of stakeholders in respect of sound financial, social,
ethical and environmental practice (IOD, 2002).
Armstrong (2004) noted that, up until the early 1990’s; the South African economy was
characterised by a small number of mining finance houses that had dominated the economy.
These mining finance houses had included diverse activities and investments, and had operated
primarily in South Africa on account of both the stringent exchange control restrictions and the
political isolation of the economy (Harrison, 2003). The consequence of this was that the
effective functioning of market mechanisms and a sound corporate culture of transparency and

13
disclosure had been largely stifled while, accompanied by excessive rent seeking on the part of
the government and a complacent private sector management (Armstrong, 2004). At the same
time, the capital and money markets, though mature and well developed by emerging market
standards, were dominated by a small number of large insurance and pension funds with mutual
ownership structures in which the same private sector institutions were central (Harrison, 2003).
In addition, the utilities, infrastructure industries as well as the key strategic sectors of the
economy were under government controlled state-owned enterprises. The rationale for state
involvement was overtly political and no serious thought was given to issues of governance
(Armstrong, 2004).
By the beginning of the truly democratic political dispensation in 1994, South Africa’s economy
was in an advanced state of decline as a result of political isolation, inward-looking economic
policies and the legacy of racial exclusion (Armstrong, 2004). In addition, the economy was
vulnerable to external forces because of insufficient net inflows and an unattractive investment
climate (Vaughn & Ryan, 2006). This resulted in a policy of economic liberalisation, with
special emphasis on capital market development and corporate reform (Rossouw, 2005). The
creation of sound macro-economic fundamentals has enabled more micro-economic targeted
reforms aimed at generating economic growth levels which would address South Africa’s policy
goals, with corporate governance playing a significant role in this process (Malherbe & Segal,
2001).
Post 1994, South Africa’s financial system has emerged as a sophisticated and well developed
sector of the economy, with marked similarities to the major financial centres of the developed
world (Armstrong, 2004) In terms of Gross Domestic Product (GDP) size, both private sector

14
lending and the equity market rank as one of the best in the world. The increasing importance of
financial services in the economy and the role it plays in the asset allocation process have
increased the pressure for market reforms in order to improve transparency and efficiency and
also a more vibrant corporate governance reforms and principles that align with those of the
developed economies such as the United Kingdom and the United States (Armstrong, 2004).
This pressure, in turn led to the King Committee on Corporate Governance releasing an updated
version of the King I report, namely, the King Report 2002 (King II). King II recognises the
importance of board structure, accountability and independence as regards effective corporate
governance (Rossouw, 2005). King II contains guidelines and standards on good corporate
governance practices, and in essence adopts the concept of stakeholder reporting.
A third report (King III) on corporate governance in South Africa became necessary because of
the new Companies Act 71 of 2008 (the Act) and also changes in international governance trends
(IOD, 2009; Cliffe Dekker Hofmeyr, 2013). South African listed companies are regarded by
foreign institutional investors as ranking among the best governed in the world‘s emerging
economies and it is essential that the country strive to maintain this high ranking (IOD, 2009) As
evidenced by the significant capital inflows into South Africa before the global financial crisis in
2008, South Africa’s economy has benefited significantly as a result of the fact that its listed
companies adhere to sound governance principles and practices (IOD, 2009). The existence of
King III and the Act establishes the relevance of this research study within the South African
context. A more comprehensive review of the relevant provisions of King III is contained in
Chapter 2.
15
1.3 Statement of the research problem
Corporate failures and scandals such as those of Enron, WorldCom and HIH, and Regal Treasury
Bank in South Africa, amongst others, have raised a question regarding the ability of the board of
an organisation to monitor management effectively and enhance firm performance (Rashid,
2011; Mizruchi, 2004). This issue is particularly relevant in view of the fact that the boards in
question were apparently not sufficiently effective to have been able to check some of the
corporate governance failures, as they later came to be known. This in turn, focused attention on
the composition and size of these boards. According to Rashid (2011) this raised the following
important question, namely; “Who will monitor the monitors?” Although it is agreed that the
shareholders may monitor the board by exercising their ownership right in appointing and
removing board members, the shareholders may not be aware of the inside activities of the firm
(Nicholson & Kiel, 2003).
1.3.1 Research questions
Does board composition (executive vs independent non-executive directors) influence
firm performance and also comply with the requirements/recommendation on board
composition as contained in King III and the Companies Act 2008?
Does board size influence firm performance?
The following research hypotheses were formulated in response to the research questions:
Does board composition (executive vs independent non-executive directors) influence
firm performance and also comply with the requirements/recommendation on board
composition as contained in King III and the Companies Act 2008?

16
H0: There is an insignificant positive relationship between board composition (proportion of
outside independent directors) and firm performance in South Africa.
H1: There is a significant positive relationship between board composition (proportion of outside
independent directors) and firm performance in South Africa.
Does board size influence firm performance?
H0: Board size is not positively correlated with firm performance.
H1: Board size is positively correlated with firm performance.
1.4 Purpose of the study
This study examines the impact of board composition and board size on the economic
performance of firms in South Africa. Thus, the study sought to provide additional evidence of
the efficiency of board composition and size by examining the explanatory and predictive power
of board composition and size in order to determine whether board composition and size could
both explain and predict firm performance as measured by the Tobin’s Q, ROA, and ROE within
the South African context.
1.5 Significance of the study
This study is significant because it attempts to analyse the relationship between corporate
governance practices and the financial performance of firms in South Africa thus providing the
basis for a framework for institutional regulations. Despite the fact that studies by Fama and

17
Jensen (1983), Baysinger and Butler (1985), and Baysinger and Hoskinsson (1990), have
asserted that the effectiveness of a board depends on an optimal mix of executive and non-
executive directors, there is very little theory on the determinants of an optimal board
composition (Hermalin & Weisbach, 2003). The majority of previous studies have used data
from the developed nations such as the United States and United Kingdom and it is questionable
whether the findings of such studies are applicable in alternative regions with different social and
environmental factors for example in South Africa. It is, thus, anticipated that this study with its
focus on South Africa will make valuable contribution to the existing literature on the South
African market and Africa as a whole.
1.6 Definition of terms
Board of directors – A board of directors is a body of elected members who jointly oversee the
activities of a company or organization.
Independent non-executive directors – is a member of the board of directors of a company
who does not form part of the executive management team. They are not employees of the
company or affiliated with it in any other way and are differentiated from executive directors.
Corporate governance - is the set of processes, customs, policies, laws, and institutions
affecting the way a corporation (or company) is directed, administered or controlled. Corporate
governance also includes the relationships among the many stakeholders involved and the goals
for which the corporation is governed.
18
1.7 Layout of the study
The remainder of the research study is organised as follows; chapter 2 contains a discussion of
relevant literature and explains the formulation of the research hypotheses. The purpose of the
literature review is to provide a basic theoretical and empirical foundation for the study, as well
as to extend the conversation on the value relevance of board composition and board size to firm
performance. Chapter 3 describes the methodology used in the study and, as such, discusses the
data collection and analysis processes as well as, the key variables used in the study. While
Chapter 4 discusses the research results relating to board composition and size and firm
performance. Finally chapter 5 concludes the study by summarising of the research findings,
presenting the conclusions drawn from the research results, suggesting recommendations and
areas for further research, and discussing the limitations of the study.
19
Chapter II: Literature Review
2.1 Introduction
Various definitions have been suggested for the concept of corporate governance (Kyereboah-
Coleman & Biekpe, 2005). Charkham (1994, p.1) and Cadbury (1992, p.15) both define
corporate governance “as the system by which companies are directed and controlled”. While,
Metrick and Ishii (2002, p.2) define corporate governance from the perspective of the investor as
“both the promise to repay a fair return on capital invested and the commitment to operate a firm,
efficiently given investment”. Metrick and Ishii (2002) argue that the level of organisational
governance may be more important for developing markets with weaker institutions as it helps to
distinguish between organisations.
Corporate governance is concerned with the relationship between the internal governance
mechanisms of corporations and society’s perception of the scope of corporate accountability
(Deakin & Hughes, 1997). Corporate governance has also been defined by Keasey, Thompson
and Wright (1997, p.12) as including “the structures, processes, cultures and systems that
engender the successful operation of organisations”. In addition corporate governance may be
seen as the entire set of measures that are taken within the social entity that is an enterprise in
order to encourager the economic agents to take part in the productive process and, thus to
generate some organisational surplus, and to set up a fair distribution between the shareholders,
taking into consideration what they have brought to the organisation (Labie, 2001).
In the main this research study has adopted the definition of corporate governance of Huse
(2007, p.15) who defines corporate governance “as concerned with ways of bringing the interests
20
of (shareholders and managers) into line and ensuring that firms are run for the benefit of
shareholders by board of directors”. This definition has its origin in the separation of the
ownership and the leadership of corporations that was discussed in the early 1930s (Berle &
Means, 1932). This definition was deemed relevant to the research topic as agency theory was
developed in order to offer solutions to the monitoring problem. In addition, the definition was
also deemed relevant as it includes the issue of board members and the value they bring to a firm
through their links with important resources. The following section contains an overview of the
agency and resource dependence theories.
2.2 Agency and resource dependence theories
A number of theoretical perspectives may be used to explain corporate governance practices and
problems (Rashid, 2011). Researchers seeking evidence of links between boards of directors and
firm performance usually follow the two distinct paths of agency theory and resource
dependence theory (Hillman & Dalziel, 2003). Thus the researcher will focus primarily on
agency and resource dependence as they are directly related to the research topic at hand.
Hillman and Dalziel (2003) proposed a theoretical model (see fig 2.1 below), in which both
agency and resources dependence theories are combined. Hillman and Dalziel (2003) argue that
board capital positively influences both the functions of the board, namely, monitoring
management and providing resources. As, regards board incentives, Hillman and Dalziel (2003)
suggest that board dependence negatively affects the relationship between board capital and
monitoring but positively affects the relationship between board capital and the provision of
resources. In addition, they argue that board equity compensation positively affects both the

21
relationship between board capital and monitoring and the relationship between board capital and
provision of the resources (Fig 2.1).
Figure 2.1: Theoretical model
Board incentives
Board dependence
Director compensation
Board capital
Human capital
Relational capital
Monitoring activities – (agency theory)
Monitoring the CEO
Monitoring strategy
implementation
Planning succession
Evaluating and rewarding the
CEO/top managers.
Firm
Performance
Provision of resources activities (resource
dependence theory)
Providing expertise
Administering advice and counsel
Facilitating access to capital
Building external relations
Diffusing innovation
Aiding in the formulation of
strategy
Linking firm to important
stakeholders or other entities
22
2.2.1 Agency theory
The monitoring function of boards, also described as the “control” role (Boyd, 1990; Johnson,
Daily, & Ellastrand, 1996), has attracted the attention of corporate governance researchers
(Hillman & Dalziel, 2003). The monitoring function refers directly to the responsibility of
directors to monitor managers on behalf of the shareholders (Rashid, 2011). The theoretical
underpinning of the board’s monitoring function is derived from the agency theory, which
describes the potential for conflicts of interest that may arise from the separation of ownership
and control in organisations (Berle & Means, 1932; Fama et al. 1983). Advocates of the agency
theory see the primary function of boards as that of monitoring the actions of managers (agents)
in order to protect the interests of shareholders (principals) (Eisenhardt, 1989; Mizruchi, 1983;
Andreasson, 2011). On the other hand, legal and finance scholars emphasise the fiduciary
responsibilities of directors to ensure that managers are acting in the interests of shareholders
(Brainbridge, 1993; Miller, 1993).
Monitoring by the board is important because of the potential costs which may be incurred
should management pursue their own interests at the expenses of the shareholders’ interests
(Nicholson & Kiel, 2007). Berle and Means (1932) assert that when ownership and control are
separated, managers are able to pursue their self-interest at the expense of profit maximisation,
thereby creating “agency” costs. Monitoring by boards of directors may reduce the agency costs
inherent in the separation of ownership and control and, in this way, improve firm performance
(Fama, 1980; Zahra & Pearce, 1989).

23
As regards the monitoring function/activities of directors as noted in Fig 2.1 above, scholars
typically discuss a number of specific activities, including the monitoring of the CEO (Boyd,
1995), monitoring the implementation of strategy (Rindova, 1999), planning the CEO’s
succession (Pitcher, Chreim, & Kisfalvi, 2000), and evaluating and rewarding the CEO/executive
managers of the firm (Conyon & Peck, 1998). Each of these activities has in common is the
activity’s relationship to the monitoring function (Wu, 2003). While the primary driver behind
each of these activities is the obligation to ensure that management operates in the interest of
shareholders. This obligation often encompasses the scrutiny, evaluation, and regulation of the
actions of the executive management by the board (Hillman & Dalziel, 2003).
According to agency theory, the primary obstacle to the monitoring function is board incentives
(Hillman & Dalziel, 2003). Agency theorists acknowledge that the incentives available to
directors and boards as regards fulfilling their monitoring role in order to protect shareholder
interests do vary and; thus, incentives are an important precursor to effective monitoring
(Kyereboah-Coleman & Biekpe, 2005). Agency theorists suggest that when incentives are
aligned with shareholders' interests, the boards monitoring of management will be more
effective, and thus, firm performance will improve (Fama, 1980; Jensen & Meckling, 1976).
Two alternatives for board incentives have figured prominently in agency theory research,
namely, board dependence and director compensation (Hillman & Dalziel, 2003). Researchers
studying the monitoring function have expressed a general preference for boards dominated by
independent non-executive directors (Barnhart, Marr, & Rosenstein, 1994; Baysinger & Butler,
1985; Daily, 1995; Daily & Dalton, 1994a,b; Weisbach, 1988). These researchers contend that
24
boards which consist primarily of executive directors have less incentive to monitor management
as a result of their dependence on the CEO/organisation (Hillman & Dalziel 2003).
Agency scholars argue that dependence on the current CEO/organisation is an obstacle to both
executive directors and dependent outsiders siding with the shareholders when their interests
oppose those of management (Nicholson & Kiel, 2007). However, it is thought that boards
dominated by outside, non-affiliated directors, are better monitors because they lack this
disincentive to monitor (Hillman & Dalziel, 2003). A key hypothesis of this research study is
that dependent boards will be less effective monitors and thus dependent boards will be
negatively associated with firm performance. A meta-analysis of 54 studies of board dependence
showed no significant statistical relationship between board incentives to monitor and firm
performance (Dalton, Daily, Ellstrand & Johnson, 1998).
The second obstacle to a board's monitoring performance that has received significant attention
is equity compensation (Jensen, 1993). Equity compensation aligns the interests of shareholders
and directors, thus motivating boards of directors to be better monitors (Elson, 1995). When
boards do not directly share in the appreciation of the equity of the company, their incentives to
uphold shareholder interests are diminished (Dalton, Daily, Certo, & Roengpitya, 2003). The
primary hypothesis states that board equity compensation will be positively associated with firm
performance because of improved monitoring (Hillman & Dalziel 2003). However, while
theoretically appealing, this hypothesis was not statistically supported in a recent meta-analysis
(Dalton et al., 2003).

25
2.2.2 Resource dependence theory
A second important board function is the provision of resources (Nicholson & Kiel 2007). This
perspective represents the dominant perspective adopted by scholars4 in the resource dependence
(Hillman & Dalziel, 2003) and stakeholder traditions (Hillman, Keim, & Luce, 2001; Johnson &
Greening, 1999; Luoma & Goodstein, 1999). This board function refers directly to the ability of
the board to bring resources to the firm with, resources being “anything that could be thought of
as a strength or weakness of a given firm” (Wernerfelt, 1984, p.172).
The theoretical underpinning of this function is based on the work conducted by Pfeffer and
Salancik (1978) on resource dependency. Pfeffer and Salancik (1978, p.163) note that “when an
organisation appoints an individual to a board, it expects the individual will come to support the
organisation, will concern himself with its problems, will variably present it to others, and will
try to aid the organisation”. They assert that boards may offer the following four primary
benefits, firstly, advice and counsel, secondly, legitimacy, thirdly, channels for communicating
information between external organisations and the firm, and lastly, preferential access to
commitments or support from important elements outside of the firm (Pfeffer & Salancik, 1978,
p.145,161). This view is primarily concerned with the board's provision of resources, defined
broadly (Huse, 2007).
Resource dependence logic suggests that a board's provision of resources is directly related to
firm performance (Nicholson & Kiel, 2007). Resources help reduce the dependency between the
4 These scholars include, Boyd (1990); Daily and Dalton, (1994a,b); Gales and Kesner, (1994); Hillman, Cannella,
and Paetzold, (2000); Pfeffer, (1972); Pfeffer and Salancik (1978)

26
organisation and external contingencies (Pfeffer & Salancik, 1978), diminish uncertainty for the
firm (Pfeffer, 1972), lower transaction costs (Williamson, 1984), and ultimately aid in the
survival of the firm (Singh, House, & Tucker, 1986).
The provision of resources function of the board encompasses a variety of specific activities as
also noted in (Fig 2.1 above), including but not limited to, providing legitimacy/bolstering the
public image of the firm (Selznick, 1949), providing expertise, including the provision of internal
firm information by executive directors (Baysinger & Hoskisson, 1990), administering advice
and counsel (Lorsch & MacIver, 1989; Mintzberg, 1983), linking the firm to important
stakeholders or other important entities (Burt, 1980; Hillman et al., 2001), facilitating access to
resources such as capital (Mizruchi & Stearns, 1988), building external relations and diffusing
innovation (Haunschild & Beckman, 1998), and aiding in the formulation of strategy or other
important firm decisions (Judge & Zeithaml, 1992; Lorsch & MacIver, 1989).
The theoretical link between these various activities is the fact that they all focus on the board as
a provider of resources, rather than as an evaluator of management (Huse, 2007). Zahra and
Pearce (1989) propose two roles for directors in addition to the monitoring or control role,
namely strategy and service. Johnson et al (1996) propose a slightly different terminology for the
roles of directors, namely, the control, service, and resource dependency roles. Zahra and Pearce
(1989, p.292) characterise the “service” role as “enhancing company reputation, establishing
contacts with the external environment, and giving advice and counsel to executives”. They
depict the “strategy” role as directors' active involvement “in the strategic arena through advice
and counsel to the CEO, by initiating their own analyses, or by suggesting alternatives” (Zahra &
27
Pearce, 1989, p.298). on the other hand, Johnson et al.'s (1996, p.411) review of boards defines
the “service” role as “directors advising the CEO and top managers on administrative and other
managerial issues as well as more actively initiating and formulating strategy”, and the “resource
dependence” role as directors “facilitating the acquisition of resources critical to the firm's
success” and serving a legitimising function.
According to the resource dependence theory, the primary obstacle to the board's provision of
resources is board capital (Hillman & Dalziel, 2003). Board capital consists of both human
capital (experience, expertise, and reputation) and relational capital (networking to other firms
and external contingencies) (Hillman & Dalziel, 2003). Board capital has been positively
associated with the provision of each of the four benefits as discussed by Pfeffer and Salancik
(1978). Firstly, board capital has been associated with the provision of advice and counsel, which
Westphal (1999) linked to subsequent firm performance. Boards often include lawyers, financial
representatives, top management of other firms, public affairs or marketing specialists, former
government officials and community leaders, and also other directors who bring with them
important expertise, experience, and skills to facilitate advice and counsel (Baysinger & Butler,
1985; Gales & Kesner, 1994).
Secondly, board capital has been linked to the establishment of firm legitimacy and reputation
(Daily & Schwenk, 1996; Hambrick & D'Aveni, 1992). Certo, Daily, and Dalton (2001) found
that firms with more prestigious boards experienced better performance at their initial public
offering. This in turn suggests that the prestige of directors (board capital) may enhance the
credibility and performance of the firms they serve (Hillman & Dalziel, 2003). Pfeffer and

28
Salancik (1978, p.145) note that “prestigious or legitimate persons or organisations represented
on the focal organisation's board provide confirmation to the rest of the world of the value and
worth of the organisation”. While Bazerman and Schoorman (1983, p.211) state, “An
organisation's reputation can be affected by who serves on the board of directors and to whom
the organisation is seen to be linked”. Galaskiewicz (1985) argues that an executive's directorate
ties similarly confer legitimacy and status on his/her home organisation. Thus, board human and
relational capital may also enhance firm’s legitimacy and reputation, and this, in turn may
improve firm performance.
Thirdly, board capital provides channels of communication and conduits of information between
the firm and external organisations (Hillman & Dalziel, 2003) with board capital providing the
firm with timely and valuable information. In addition, board capital serves to reduce the
transaction costs of dealing with uncertainties in the environment, thereby enhancing
performance (Huse, 2007). Hillman, Zardkoohi, and Bierman (1999) found that when directors
established connections with the United States government, shareholder value was positively
affected. They concluded that such connections held the promise for information flow, more
open communication, and/or potential influence with the government, a critical source of
uncertainty for many firms (Hillman et al, 1999).
Researchers have also found that interlocking directorates may play an important role in
disseminating information across firms (Burt, 1980; Palmer, 1983; Useem, 1984), by reducing
both vertical coordination and scanning costs (Bazerman & Schoorman, 1983), and in serving as
a mechanism for the diffusion of innovation (Haunschild & Beckman, 1998). The external ties of
29
executive directors also facilitate access to strategic information and opportunities (Pfeffer,
1991), enhance environmental scanning (Useem, 1984), and reveal information about the
agendas and operations of other firms (Burt, 1983). Empirical evidence has shown that
executives’ external ties play a critical role in future strategy formulation and subsequent firm
performance (Eisenhardt & Schoonhoven, 1996; Geletkanycz & Hambrick, 1997). Rosenstein &
Wyatt (1994) have further shown that the shareholder value of a firm improves when the firm’s
CEO is asked to join the board of another firm.
Finally, board capital may be helpful in acquiring resources from important elements outside of
the firm, for example, financial capital influence and influence with political bodies or other
important stakeholder groups such as customers, suppliers, and communities (Boeker &
Goodstein, 1991). Directorate ties enable firms to secure critical resources, often on more
favourable terms than would otherwise have been the case (Boeker & Goodstein, 1991; D'Aveni,
1990; Zald, 1969). A study conducted by Pfeffer (1972), showed that firms with directorate ties
to sectors in the environment which represented the most critical constraints outperformed their
industry counterparts who lacked such external ties.
2.3 The emergence of corporate governance reforms: - The King Reports
The First King Report on Corporate Governance (King I) for South Africa, issued in November
1994 was inspired by the Cadbury Committee Report on Corporate Governance (1992). King I
offered to both South African companies and state-owned enterprises a coherent and disciplined
governance framework which was relevant to local circumstances and practical in its guidance
(Vaughn & Ryan, 2006). Unlike nearly all other similar initiatives globally, the King Committee
30
had no official mandate, and thus its recommendations are self-regulatory in nature (IOD, 1994)
The King I report made an important contribution to the significant progress of South Africa as
regards its inclusive model of corporate governance reform since the political transition in the
mid-1990s (Rossouw, 2005; Cliffe Dekker Hofmeyr, 2002). The breadth and sophistication of
these reform measures have placed South Africa in the top ranks of emerging market economies,
and in some cases even alongside some of the more developed markets (Armstrong, 2004).
The Second King Report on Corporate Governance (King II) for South Africa, issued in March
2002 came about following an assessment of the developments that had taken place in the South
African economy and in the global markets since 1994 (Cliffe Dekker Hofmeyr, 2002) and, thus,
King II was not driven by any major crisis in the corporate sector. However, coinciding with this
review a number of crises did come to light, in both private and public sector companies, and
these provided a stimulus to this second review (Armstrong, 2004).Compared to King I, King II
acknowledges that there has been a move away from the single bottom line (i.e. profit to
shareholders) to a triple bottom line, which embraces the economic, environmental and social
aspects of a company’s activities (West, 2006).
King II was designed to elaborate on the practices of good governance as required in law,
although it was not intended to substitute or in any way to replace legal deficiencies in the South
African systems (Cliffe Dekker Hofmeyr, 2013). A particular emphasis in the King II was on the
qualitative aspects of good corporate governance (Harrison, 2003). King II was not designed as a
regulatory instrument but was in fact developed in order to identify core areas of good practice
for boards, directors and companies, with these core areas extending beyond the existing legal
and regulatory framework to embrace a number of aspirational issues (Vaughn & Ryan, 2006).

31
The review reinforced guidelines which acknowledged the societal obligations of companies,
indirectly emphasising the expectations of government and the wider community with respect to
the contribution of the corporate sector to South Africa’s transition and development (Harrison,
2003). In view of the difficulties involved in applying the guidelines throughout the entire South
African economy, the guidelines contained in the King II focused primarily on the companies
quoted on the JSE, banks and financial institutions, and public sector enterprises and agencies at
the national and provincial levels (IOD, 2002).
The Code of Corporate Practices and Conduct which enshrines the core principles in King II
addresses the following key components of corporate governance (IOD, 2002):
Firstly the board of directors is identified as the focal point of the corporate governance system
and is ultimately accountable and responsible for the performance and affairs of the company
(IOD, 2002). This in turn calls for a unitary board structure, which is common to countries which
fall broadly-speaking under the Commonwealth system of law, and requires a balance of
executive and non-executive directors on the board with a majority of the non-executive
directors preferably independent of management (IOD, 2002).
Secondly, independence is broadly defined, driven primarily by the more rigorous tests used by
international investors, and was directed at the historically tight-knit nature of the South African
business community and the need for boards to consider a wider pool of candidates. Thus, board
independence, has given particular emphasis to issues of diversity, both in terms of gender and
race, highlighted as a strategic imperative for companies wishing to remain relevant in the South
African business environment (IOD, 2002).
32
Board independence has given rise to the need for a more effective induction process for
directors as well as the ongoing development of directors to ensure that companies in both the
private and public sectors remain competitive with effective boards and directors well versed in
their duties and obligations. The Institute of Directors has been particularly prominent in
instituting significant training programmes for inexperienced, as well as experienced, directors
(IOD, 2002).
Directors training programmes has led to the more sophisticated aspects of board governance
coming into play with the requirement that directors and boards undergo regular evaluation,
preferably conducted by an independent facilitator, in order to validate both board effectiveness
and continuing suitability of individual directors standing for re-election (Armstrong, 2003). In
view of the shortage of skills in the South African economy, it was not considered appropriate to
prescribe age limits and constraints on the length of service on boards, although these are
problems. However, it was felt that it would be difficult to address these problems in the light of
the myriad of other demands facing boards in South Africa at the time (Harrison, 2003).
Thirdly, while the size of boards was not regulated, the issue of size has drawn the attention of
institutional investors and regulators with the result that a number of boards have seen fit to
reduce their size to a more acceptable level in governance terms (Armstrong, 2003). The roles of
chairman and CEO are required to be separate and this has since been reinforced by the JSE,
banking and financial markets regulators, and regulations governing public sector companies. In
addition, the position of chairman should be held by an independent non-executive director, and
steps have been taken by a wide variety of companies to address this requirement (IOD, 2002).
33
Lastly, the IOD (2002), noted that the length of executive director service contracts is restricted
to a maximum term of three years and should be the subject of shareholder confirmation if
longer, while extensive disclosure of the remuneration and benefits of individual director
(executive and non-executive) is now enforced by a number of the regulators.
The Third King Report on Corporate Governance (King III) issued by the King committee in
September 2009, became necessary because of both the new Companies Act, 2008 and changes
in international governance trends (Cliffe Dekker Hofmeyr 2013). The existence of King III
establishes the relevance of this research study within the South African context. King III is a
report that builds on the pertinent issues raised by King I and King II. However it also addresses
the inclusion of and renewed emphasis on issues such as sustainability, governance, the role and
function of the audit committee, stakeholder relationship, compliance with laws and regulations
and integrated reporting (Deloitte, 2009; IOD, 2009). By adopting an “apply or explain”
approach, King III set an international benchmark (IOD, 2009; Cliffe Dekker Hofmeyr, 2013;
IOD, 2012). This approach means that entities need not to fully comply with King III when they,
through an “application of the mind”, can justify their non-compliance (IOD, 2012).
King III became effective on 1 March 2010 and it places the board of directors at the centre of
the implementation of the corporate governance principles of public companies in South Africa
(IOD, 2012). In addition King III notes that the board of directors should be responsible for the
affairs of the company by determining the company’s strategic direction in a lawful and efficient
manner in such a way as to ensure that the company is constantly improving its value creation
and performance (IOD, 2009). The board should also ensure that the value being created is
shared among the shareholders and employees with due regard to the interests of other

34
stakeholders (IOD, 2009) in order to carry out perform these responsibilities the board should
inter alia, ensure the integrity of the financial controls and reports and also ensure that ethical
standards are maintained and that the company complies with the laws of South Africa (IOD,
2009).
Principle 2.18 of the King III and S66 (2)(b) of the Companies Act 2008 recommends that the
composition of the board of directors should include a balance of power, a mix of executive and
independent non-executive directors, with a majority of independent non-executive directors
(Cliffe Dekker Hofmeyr, 2013; IOD, 2012). King III further recommends that the board should
be composed in such a way as to ensure diversity of experience without compromising the
integrity, compatibility, availability and independence of the board (IOD, 2012; Deloitte, 2013).
The important aspect of King III that is relevant to this research study relates to
recommendations that the board of directors comprise majority of independent non-executive
directors. Both the King III Report on Corporate Governance (2009) and the Companies Act
(2008) identify an independent non-executive director as a: director who is not a member of
management (a non- executive director) and who is not a substantial shareholder of the company
or an officer of or otherwise associated directly or indirectly with a substantial shareholder of the
company; has not within the last three years been employed in an executive capacity by the
company or another group member or been a director after ceasing to hold any such
employment; is not a principal of a professional adviser to the company or another group
member; is not a significant supplier or customer of the company or another group member or an
officer of or otherwise associated directly or indirectly with a significant supplier or customer;
35
has no significant contractual relationship with the company or another group member other than
as a director of the company; and is free from any interest and any business or other relationship
which could, or could reasonably be perceived to, materially interfere with the director’s ability
to act in the best interests of the company (IOD, 2009).
King III states that the board of directors and in particular the independent non-executive
directors play a central role in any corporate governance system and are viewed as a primary
means for the shareholders to exercise control over the executive management (IOD, 2012). The
standard approach in empirical finance and in modern global corporates involves viewing the
board’s independence as closely related to both its efficiency and its effectiveness (Huse, 2007).
In line with this reasoning, section 303A.01 of the New York Stock Exchange’s listed companies
manual requires a majority of independent non-executive directors on the board (Rashid, 2011).
Independent non-executive directors are viewed as superior monitors because their careers are
not linked to the CEO of the firm and consequently they are free to take decisions that may go
against the CEO without fear that they may be jeopardising their positions and future
compensation (Huse, 2007). This view is often referred to as the monitoring effect theory which
is advocated by agency theorists. Independent non-executive directors have incentives to build
their reputations as expert monitors in order to obtain additional director appointments (Hillman
& Dalziel, 2003). Consequently, they are more likely to maintain proper control over a firm’s
executive management team (Fama & Jensen, 1983).
Several papers have reported evidence supporting the notion of boards with a majority of
independent non-executive directors as recommended by King III and the monitoring effect
36
(agency) theory. Rosenstein and Wyatt (1994), show that the financial markets demonstrated a
significant positive reaction following the announcement of independent non-executive board
appointments in the Wall Street Journal. While Weisbach (1988), suggests that CEO turnover is
more sensitive to performance in firms with independent non-executive dominated boards than it
is in firms whose boards are dominated by executive directors. MacAvoy and Millstein (1999)
found that board independence is positively correlated with accounting-based measures of firm
performance, while Cotter et al. (1997) showed that boards who comprise a majority of
independent non-executive directors receive higher returns as compared to similar firms without
such a majority. Brickley et al. (1994) found a statistically positive and significant market
reaction following the adoption of a poison pill clause when the board is dominated by a majority
of independent non-executive directors. Beasley (1996) and Dechow, Sloan and Sweeney (1996)
showed that a higher level of independent non-executive directors on the board decreases the
likelihood of the firm’s financial statements containing fraudulent information; while, Klein
(1998) found that companies with independent non-executive boards are less likely to manage
their earnings by reporting abnormal accruals.
On the other hand, Fosberg (1989) found that firms with a large percentage of independent non-
executive directors on their board are not characterised by better performance as measured by the
firm’s ROE. The absence of any relation between the firm’s performance and the independence
of its board members has also been confirmed by Hermalin and Weisbach (1991), Klein (1998),
and Bhagat & Black (2002) and more recently by Hayes, Mehran & Schaefer (2004).

37
2.4 Board composition and firm performance
Board composition is measured in terms of different degrees of heterogeneity (Bhagat & Black,
2002). Common assessments of board composition include executive and independent non-
executive director’s ratio, age and gender diversity among board members and board size
(Rashid, 2011). There are inconclusive findings as regards the relationship between board
composition and firm performance (Finegold, Benson & Hecht, 2007; Bermig & Frick, 2010; &
Rashid, De Zoysa, Lodh & Rudkin, 2010). There are several advantages to board heterogeneity
as measured by a mix of executive and independent non-executive directors because of enhanced
decision making arising from more information; although this would come at a considerable cost
(Sanda et al 2011). It is in light of this that Eklund; Palmberg and Wiberg (2009) note that:
Board heterogeneity is associated with a trade-off between increased costs in terms of
longer decision time and lower external costs. That is, a trade-off between increased
information efficiency associated with heterogeneous boards and decision efficiency
associated with homogenous boards. Heterogeneous boards tend to be better informed
regarding issues outside the firm and thereby better equipped to question and discuss
corporate strategic decisions, whereas homogenous boards to a larger extent are based on
trust, cooperation, as well as shared experience and values.
In respect of composition in terms of the executive and independent non-executive director ratio,
the agency theory is in favour of a majority of independent non-executive directors (Huse, 2007;
Rashid, 2011). King III notes that, the board should include a balance of executive and non-
executive directors, with a majority of independent non-executive directors as this reduces the
possibility of conflicts of interest (IOD, 2009). Executive directors serve in at least one of the
following categories, namely management of the company or advisers to the company (Davidson
38
& Rowe, 2004). Sahin, Basfirinci and Ozsalih (2011) observe that previous literature does not
contain consistent findings on the impact of proportion of executive and independent non-
executive director on financial performance. Pearce and Zahra (1992), Daily and Dalton (1993)
and Krivogorsky, (2006) studies suggest that a positive relationship exists between executive and
independent non-executive dominated boards and the performance of the company. However
some studies have not found significant relationship between the proportion of executive and
independent non-executive directors and firm performance (Bhagat & Black (1999), Daily &
Johnson (1997) and Dulewicz & Herbert (2004). Finegold, Benson and Hecht (2007) note that:
The many empirical studies that have examined the impact to the executive and
independent non-executive ratio on boards have found no consistent evidence to suggest
that increasing the percentage of outsiders on the board will enhance performance. If
anything, they suggest that pushing too far to remove insider and affiliated directors may
harm firm performance by depriving boards of the valuable firm and industry specific
knowledge they provide.
The argument challenging the role of independent non-executive directors is bases on the
information asymmetry between executive directors and independent non-executive directors
(Rashid, 2011). It is argued that executive directors live in the company they govern and thus,
they have better understanding of the business than independent non-executive directors and are
better able to make useful decision (Sanda et al. 2011). On the other hand, the independent non-
executive directors lack day to day inside knowledge of company and so they may play a
reduced control role in the firm (Nicholson & Kiel, 2007; Rashid et al. 2010).

39
The arguments in favour of increasing the proportion of independent non-executive directors
have been based on the agency theory in terms of which such outsider independent non-
executive directors are better able to protect the interest of the shareholders by fulfilling
important monitoring functions (Bathala & Rao, 1995). It is argued that the executive directors
are not be able to monitor the day-to-day activities of the managers effectively since that would
mean that they would be monitoring their own operation and this would be operationally
impracticable (Huse, 2007).
However this debate will continue as there are no empirical findings to tilt the argument in any
particular direction (Rashid, 2011). There are several explanations for the inconclusive results on
this relationship between executive and independent non-executive directors and firm
performance with one such explanations being that boards that are optimally weighted between
insiders and outsiders would result in an insignificant relation (Wu, 2003). Another explanation
is that simultaneity between key variables of interest confounds the interpretation of the results in
studies that focus on a direct relation (Finegold et al. 2007). Yet another explanation is that
performance and board characteristics, such as composition are jointly endogenous and thus,
firm performance is a function not of past board independence only but, also a predictor of the
future board structure (Panasian, Prevost & Bhabra, 2008).
The literature on corporate governance tends to advocate expanding the independent/outsider
elements in corporate boards (Sanda et al. 2011). Thus the literature5 indicates that board
5 These literature include, Rosenstein and Wyatt (1994); Weisbach (1988); MacAvoy and Millstein (1999);
Krivogorsky (2006).

40
composition is in some way related to corporate performance. Panasian et al. (2008, p.136)
remark that, “despite the inconclusive results of empirical literature on the effectiveness of
outsider directors on the board, an international movement advocating greater board
independence continues to strengthen”.
2.5 Board size and firm performance
A board of directors fulfils various functions (Solomon, 2010). While independent non-executive
directors monitor the executive management and advise the CEO on the business strategy,
executive directors convey information to the outsiders (Mace, 1971; Lipton & Lorsch, 1992;
Jensen, 1993). Much of the literature on board size has called for smaller boards (Wu, 2003).
These arguments are based on the notion that smaller groups are more cohesive and more
productive, and are able to monitor the firm more effectively than larger groups (Pablo, Valentin,
Felix, 2005). On the other hand, larger groups are fraught with problems such as social loafing
and higher co-ordination costs, and are thus not good monitors (Rashid, 2011). Lipton and
Lorsch (1992) argue that boards comprising eight or nine members are the most effective.
According to them, when the board exceeds this optimal size, it becomes difficult for all the
board members to express their ideas and opinions in the limited time available at board
meetings. Jensen (1993) concurs with this view and states those boards of more than seven or
eight members function less effectively and are easier for the CEO to control than smaller
boards. Yermack (1996) provides empirical support for these arguments by showing a significant
negative correlation between Tobin’s Q and board size for large United States public firms.
There are, however, certain advantages to larger boards (Wu, 2003). From an agency
perspective, it may be argued that a larger board is more likely to be vigilant as regards agency

41
problems simply because a greater number of people will be reviewing management actions
(Nicholson & Kiel, 2003). Mak and Li (2001) showed a significant and positive correlation
between Tobin’s Q and board size for Singapore firms in OLS regression. However, agency
theorists recognise that there is an upper limit to boards (Huse, 2007). Jensen (1993) suggests
this limit to be approximately eight directors, as a greater number would interfere with group
dynamics and inhibit board performance. Alternatively, it may be argued that it is not the size of
the board, that is critical, but rather the number of independent non-executive members on the
board (Dalton, et al., 1999).
From a resource dependence theory perspective, it may similarly be argued that a larger board
offer greater opportunities for more external linkages and hence access to resources (Nicholson
& Kiel, 2003). Nicholson and Kiel (2003) note the existence of a variety of studies that argue
that boards link a firm to the external environment to secure resources6. According to these
studies, one of the functions of directors is to provide assistance in obtaining resources from
outside of the firm (Nicholson & Kiel 2003). Pfeffer (1972) suggests that the need for external
resources such as debt finance would increase the CEO’s need for advice and, thus the size of the
board of such a firm would probably increase. For example, Booth and Deli (1999) found that
firms that require more debt financing are more likely to have a commercial banker on the board
as compared to firms requiring less debt financing. Similarly, Ferris, Hagannathan and Pritchard
(2000), found a positive and significant correlation between log (board size in 1995) and ratio of
market to book value for firms requiring debt financing.
6 These studies include, Pfeffer and Salancik (1978); Klein (1998); and Hillman, Cannella, and Paetzold (2000).

42
Dalton et al (1999), maintain that larger boards may offer an exceptional level of high quality
advice and counsel to the CEO. Hermalin and Weisbach (1988) suggest that independent non-
executive directors serve as potential sources of counsel and add expertise and experience to the
board, while Lorsch and McIver (1989) similarly, note that directors consider that one of their
key duties during normal times is to advise the CEO. In fact, Adams and Mehran (2003)
documents that boards devote significant resources up to 52% of total director meetings to
activities that are not traditionally considered to be monitoring activities.
Further evidence of the advisory role of outside directors is provided by Adams and Mehran
(2003). They found that as the number of states in which a bank has operations increases, the
board size increases, perhaps to accommodate representatives of the subsidiaries from different
states (Adam & Mehran, 2003). Agrawal and Knoeber (2001) found that firms that require more
political advice have a higher proportion of outsiders with political connections on their board. It
is therefore, likely that while smaller boards are more effective at monitoring, board size will
increase as the firm’s advising requirements grow (Agrawal et al. 2001).
Yermack (1996) suggests that the CEOs of diversified firms may require higher levels of advice,
as compared to less diversified firms and that the need for advice may increase with the number
of business segments. Thus, in diversified firms, the board should be large enough to
accommodate independent non-executive with backgrounds matching the disparate business
interests of the firm, and who will be able to advise the CEO on investment opportunities
(Yermack, 1996). Yermack (1996) reports a strong inverse relationship between board size and

43
firm performance as measured by Tobin’s Q. Bhagat and Black (2002), also reports an inverse
correlation found by Yermack (1996) for large United States public firms.
2.6 Summary
Chapter 2 discussed issues found in the literature relevant to the research study, namely, an
overview of corporate governance, the agency and resource dependence theories of corporate
governance, corporate governance reforms and the King Reports and the link between the
composition and size of the board and firm performance. Each of these contributes to an
understanding of corporate governance in general, and the nature of a board of directors in
particular. Chapter 3 presents the research methodology used in the study.
44
Chapter III: Research Methodology and Data
3.1Research purpose and research hypothesis
The purpose of this study was to examine the impact of board composition and board size on the
economic performance of firms listed on the Johannesburg Stock Exchange in South Africa.
The following research hypothesis was formulated and tested in this study:
As regards board composition, the agency theory suggests that a greater proportion of
independent non-executive directors compared to executive directors are able to monitor any
self-interested actions on the part of managers and so minimise the agency costs and enhance
firm performance (Fama, 1980; Fama & Jensen, 1983).
H0: There is an insignificant positive relationship between board composition (proportion of
outside independent directors) and firm performance in South Africa.
H1: There is a significant positive relationship between board composition (proportion of outside
independent directors) and firm performance in South Africa.
It is acknowledged internationally that board size and firm size are correlated (Dalton et al.,
1999; Yermack, 1996). This finding may be explained in terms of at least two of the prevailing
governance theories. From an agency perspective, larger companies require a greater number of
directors in order to monitor and control a firm’s activities (Yermack, 1996). While from a
resource dependence perspective, larger and diversified companies require access to a greater
45
range of resources and thus, such firms will appoint more directors to provide access to those
resources (Nicholson & Kiel, 2003). Consequently, the researcher would expect either:
H0: Board size is not positively correlated with firm performance.
H1: Board size is positively correlated with firm performance.
3.2 Overview of research method
In the area of both business and management, qualitative and quantitative methods are the
methods selected for research data analysis (Leedy & Ormrod, 2010). Data and methodology are
inextricably intertwined and for this reason, it is essential that the methodology used in the
context of a particular research problem always take into account the nature of the data that will
be collected in order to resolve the problem (Leedy & Ormrod, 2010). Bryman and Bell (2007,
p.45) noted that “quantitative research can be construed as a research strategy that emphasizes
quantification in the collection and analysis of data”. According to Trochim (2006), quantitative
methods are numerical in form and encompass the confirmatory and deductive approach. During
this research study, the researcher used published annual reports as the main source of data and
used statistical analysis in order to draw the research conclusion. Leedy & Ormrod (2010) further
note that data dictates the research method.
Thus, the study adopted a quantitative approach and used multiple regression analysis (MRA)
and analysis of variance (ANOVA) as the primary statistical techniques. This research study may
be classified as an empirical study and was concerned with establishing the relationships
46
between variables (Ryan, Scapens & Theobald, 2002). The variables considered in empirical
research may be dichotomised as dependent and independent variables. The independent
variables in an experiment are the variables that are manipulated by the researcher; they are in
effect the variables that are being studied. The dependent variables measure the response to the
manipulation of the independent variables. Thus in an experiment the researcher is interested in
determining the impact of the changes in the independent variable upon the dependent variable.
The study adopted the quantitative research approach as the study focused on the amounts of one
or more variables of interest (Leedy & Ormrod, 2010).
3.2.1 Independent variable
In line with studies conducted in the United States of America (Bhagat & Black, 2002; Coles,
McWilliams & Sen, 2001; Daily & Dalton, 1993) the researcher employed two measures of
board composition/demographics for the purposes of this study. Firstly, the researcher calculated
the size of each board contained in the dataset. Secondly, when collecting the data the researcher
classified each director as either an executive (inside) director or an independent non-executive
(outside) director. This, in turn allowed the researcher to calculate the percentage of outsiders on
each board. However, the researcher acknowledged that this did not allow for the calculation and
the presence of “grey/affiliated” directors. For the purpose of this study board composition was
defined as the percentage of independent non-executive directors who were members of the
board (Rashid et al. 2010). This satisfied the requirements contained in the definition of board
composition as stipulated in the King III Report of the Committee on Corporate Governance of
Public Companies in South Africa (2009). On the other hand, board size refers to the number of
members serving on a firm’s board.

47
3.2.2 Dependent variables
While there are many measures of firm performance for example stakeholder satisfaction and
intellectual capital (Clarkson, 1995), the researcher in this study followed the approach adopted
by Bhagat and Black (2002) and Nicholson and Kiel (2003) by using three financial measures of
firm performance, namely Tobin’s Q, return on assets (ROA) and return on equity (ROE). The
financial measures of a firm’s financial performance may be classified into two key categories,
namely, accounting based measures and market based measures (Nicholson & Kiel, 2003).
Accounting based measures of performance are historical and thus, are characterised by a more
backward and inward looking focus (Cochrane & Wood, 1984) Developed as a reporting
mechanism, accounting based measures take into account the impact of numerous factors
including the past successes of advice given by the board to the executive management team and
are the traditional mainstay of corporate performance measures (Nicholson & Kiel, 2003).
Examples of these measures which are used in the governance literature include return on assets
(Cochran & Wood, 1984; Hoskisson, Johnson & Moesel, 1994), earnings per share (Pearce &
Zahra, 1992), and return on equity (Baysinger & Butler, 1985). In general, however, the major
concern with accounting measures is that they are historical and thus they lag behind the actual
actions that bring about results (Nicholson & Kiel, 2003).
In contrast, market based measures of a firm’s performance relate to the overall value ascribed to
the firm by the market (Nicholson & Kiel, 2003). Such measures may not bear any relationship
to asset valuations, current operations or even the firm’s historical profitability (Muth &
Donaldson, 1998). These market based measures emphasise the expected future earnings of the

48
firm and, thus, they are considered a forward-looking indicator that reflect current plans and
strategies. Measures in this category include market to book ratio, Tobin’s Q (Barnhart et al.
1994) or constructed indices such as the Sharpe measure (Hoskisson et al., 1994).
In view of the strong market efficiency in South Africa (Armstrong, 2004), the researcher
followed the lead of Hermalin and Weisbach (1991), Bhagat and Black (2002) and Nicholson
and Kiel (2003) in using Tobin’s Q. in terms of the assumption of a strong market, any positive
impacts of board demographics/composition would be readily apparent to the market participants
and, thus, they would be reflected in the market capitalisation of the firm (Fama, 1998).
This study used both accounting and market-based measures: As regards the profitability of a
firm’s assets in terms of generating revenue, net return on assets (ROA) managed was calculated
as the ratio of net profit to total assets. While, in order to measure a firm’s efficiency in using
investment funds to create increased earnings, return on equity (ROE) was calculated as the ratio
of net profit to equity. Finally as a market based variable, Tobin’s Q was calculated. In line with
study conducted by Bhagat and Black (2002), Tobin Q was denoted as follows:
Tobin’s Q = (Market Value (Equity) + Book Value (Assets) – Book Value (Equity))/ Book
Value (Assets)
3.2.3 Control variables
Statistical predictions may often be improved by the use of more than one independent variable
(Van Staden, 1998). Thus, by using control variables in addition to the independent variable, the
predictive values of the multiple regression models are increased. The regression results

49
controlled for a number of factors that could have affected firm performance, board composition
or both. The researcher used a number of control variables, including firm size, firm age, market
capitalisation and growth as recommended in the study by Bhagat and Black (2002).
3.2.4 Regression model specification
In order to examine the relationship between board composition and firm performance, the
following MRA model was developed:
Yi,t=α+β1BDCOMPi,t+β2BDSIZEi,t+β3AGEi,t+β4SIZE1i,t+β5SIZE2i,t+β6GROWTHi,t+εi,t
Where, Yi,t represents firm performance variables; ROAi,t, ROEi,t, and Tobin’s Qi,t are for
firm i in time t. BDCOMPi,t is the board composition (exec vs. non exec directors), BDSIZEi,t is
the board size, and AGEi,t is the firm age. SIZE1i,t and SIZE2i,t represents the firm size
measured by revenue and market capitalisation, GROWTHi,t is the firm’s growth as represented
by the changes in sales, α is the intercept, β is the regression coefficient and ε is the error term.
MRA is a statistical technique which is used for modelling the relationship between variables.
However, it does not imply a cause-and-effect relationship (Montgomery, Peck, & Vining,
2006). The result of MRA is an equation that represents the best prediction of a dependent
variable from several independent variables (Coakes & Steed, 2001). There are three major
regression models, namely, standard or simultaneous regression, hierarchical regression, and
stepwise regression. In the standard or simultaneous regression, all the independent variables
enter the regression equation at once because the aim is to examine the entire set of predictors
and also the dependent variable. In hierarchical multiple regression, the order of entry of the
50
independent variables is determined based on theoretical knowledge while, in stepwise
regression, the number of independent variables and the order of entry are determined by
statistical criteria generated by the stepwise procedure. The choice of technique depends
primarily on the researcher’s goals (Coakes & Steed, 2001). The standard or simultaneous model
was employed for the purpose of this study as the objective of the study was to examine the
effect of all the predictors on the dependent variable.
Accordingly, the multiple regression models were be tested for both validity and adequacy using
statistical tools such as hypothesis testing using the classical approach, ANOVA analysis, and
the coefficient of determination (R²). Finally, based on the regression models derived,
conclusions were drawn as to whether there was a significant positive relationship between board
composition and size and firm performance.
However, there are four assumptions that have to be met in order to draw inferences from a
regression model. According to Sheather (2009), these include the following, firstly, there must
be a linear relationship between the dependent variable/s (Y1…n) and the independent variable/s
(X1…n); secondly, the errors must be independent of each other; thirdly, the errors must have a
common variance (homoscedacicity); and finally, the errors must be normally distributed with a
mean of 0.
In order to ensure the linearity of data by limiting the effect of both outliers and leverage points,
the variables Tobin’s Q was transformed into its natural logarithm form. The transformation of
certain variables was necessary as this ensured that the error of variances became constant

51
(Sheather, 2009). The llinearity of the dependent and independent variables was tested by
observing scattergrams of standardised residuals against the predicted values. A non-discernible
pattern in the plots of the residuals would indicate that the models were valid.
In order to address the problem of the data collected from one year to the other becoming serially
correlated, also termed autocorrelation, the Durbin-Watson statistic calculated in SPSS was
observed as autocorrelation would have violated the assumption of the independence of errors.
The values of the Durbin-Watson statistic range from 0 to 4 and as a general rule, the residuals
are uncorrelated if the value is approximately 2, with a value close to 0 indicating a strong
negative correlation and a value of 4 indicating strong positive correlation.
Another critical assumption of regression analysis is that the errors must have constant variance
otherwise all the inferential statistics such as p-values, confidence intervals and prediction
intervals are rendered invalid (Sheather, 2009). The violation of this assumption is referred to as
the heterogeneity of variance or heteroscedasticity (Gamst, Meyers, & Guarino, 2008). It is
however, possible to overcome the problem by using methods such the transformation of data in
terms of which certain variables are transformed into their square root or natural logarithm
forms. In order to test for homoscedasticity, a scatterplot of the standardised residuals was
plotted against the firm performance variables. Any pattern formed by the plots would have
indicated the existence of heteroscedasticity.
The normality of errors was tested by using a normal probability plot (P-P) of the standardised
residuals and histograms of the residuals. Plots in an approximate straight line are assumed to be

52
evidence of data consistent with that from a normal distribution. A histogram is a conventional
solution for the display of interval-ratio data (Cooper & Schindler, 2001) and is used when it is
possible to group variable values into intervals. Histograms are constructed using bars with each
value occupying an equal amount of area within an enclosed area. Histograms are useful both for
displaying all the intervals in a distribution and for examining the shape and distribution for
skewness, kurtosis and the modal pattern (Cooper & Schindler, 2001). In the case of a histogram,
the empirical distribution of the data should be bell-shaped and resemble the normal distribution.
Lastly, multicollinearity was assured by firstly conducting, the correlation coefficient calculation
in Excel, secondly by variance inflation factors (VIFs) and lastly by computing the Eigen Value
Collinearity both in SPSS. Multicollinearity is a situation which arises in regression analysis
when strong correlations exist between the independent variables. This may result in incorrect
regression coefficient signs and statistically insignificant independent variables despite the fact
that the F-test may be highly significant. The acceptable cut-off point often used in practice is 5
(Sheather, 2009) as any VIF above 5 is indicative of a strong correlation between the respective
variable with this, in turn leading to poorly estimated regression coefficients (Sheather, 2009).
Regression analysis (hypothesis testing) was conducted through SPSS. SPSS provided the
following two important regression analysis reports:
1. Model summary;
2. Coefficients.
The model summary consists of R, R², adjusted R² and the standard error of the estimate. For the
purposes of this research study R² was used as the tool with which to test the internal validity of

53
the research study. The internal validity of an experiment is determined by the degree of control
that has been achieved in the study. In other words, the greater the control achieved, the higher
the internal validity (Ryan et al. 2002). When a study is described as possessing a high internal
validity, this is understood to mean that the changes in the dependent variable have been brought
about, in the main by changes in the nature of the independent variable (Ryan et al. 2002). The
correlation of determination (R²) is considered to be one of the preferred statistical tests for this
purpose.
Firstly, the coefficient of determination is determined by squaring the coefficient of correlation
(Julyan & Nel, 2003). For example, if R² is around 80% this should be interpreted to mean that
80% of the change in the dependent variable may be explained by the independent variables
while 20% of the change in the dependent variable is caused by factors other than the
independent variables which were used.
Secondly the t-test may be used. This test measures the statistical significance of each of the
regression coefficients, and must be read in conjunction with levels of significance measured as a
probability value (ρ-value). The t-test also indicates the direction of the relationship between
variables with a positive t-test indicating a positive relationship and a negative t-test indicating a
negative relationship. The ρ-value refers to the probability of observing a sample value as
extreme as, or more extreme than, the actual value observed, given that the null hypothesis is
true. The ρ-value is compared to the level of significance determined above and on this basis the
null hypothesis is either rejected or not rejected. If the ρ < 0.05 (significance level), the null
54
hypothesis is rejected while if ρ > 0.05 (significance level), the null hypothesis is not rejected.
SPSS compute the ρ-value during the execution of the hypothesis test.
The alternative hypothesis holds that there is a relationship between variables. In other words, for
the purpose of this study, there is a relationship between board composition and firm
performance. The objective of this research study was to establish whether there is a relationship
between board composition and firm performance. As a result of the conceptual framework
adopted in the study and in line with the hypotheses were formulated, this relationship must be
positive. Accordingly, a one-tailed test or directional test was be used. This directional test was a
right one-tailed test in order to minimise the possibility of a type II error. This, in turn means that
the t-statistic calculated must be positive and significant (t is > zero). If it is negative (t< 0) the
null hypothesis will not be rejected.
3.3 Population and study sample
According to Thomas, Burnham and Buckland (2004, p.105), a population may be defined as the
total set of elements in which the researcher is interested. The size of the population usually
renders it both impractical and uneconomical to involve all members of the population in a
research project (Welman & Kruger, 2001). Accordingly, samples are drawn for investigation.
Defining the population that is to be studied is an important prelude to drawing samples from it
(Thomas et al. 2004). Thus, the research objectives and scope of the study are critical in defining
the target population that will be studied (Hair, Bush & Ortinau, 2003).
Based on the population which has been defined it is then necessary to define the sampling frame
as “the sampling frame provides a working definition of the target population” (Hair et al, 2003,

55
p.211). The sampling frame takes into account practical issues relating to the availability of
information. An accurate sampling frame is extremely important as it helps to reduce bias and to
ensure that the sample used truly represents the population from which it is taken (Zikmund,
2003). For the purpose of this study the sample frame was defined as all JSE listed companies
with the results of the operations of these companies for the 2006 to 2012 financial years being
used in the study.
3.4 Sample size and selection of sample
Of the total companies (1861) listed on the JSE from 2006 to 2012 and found on the OSIRS
financial database, the researcher used all the companies from across all industrial sectors and
listed on the JSE from 2006 to 2012.
3.5 Data sources
In view of the difficulty involved in acquiring information from private companies, it was
decided to limit the study to public companies that are listed on the JSE Securities Exchange. For
the purposes of this study, the extent of firm performance was measured using the statutory
annual reports. Thus, the data used in the study was collected from the published annual reports
of companies listed on the JSE Securities Exchange from the 2006 to 2012 fiscal years. The
primary source of information for the study was the secondary database from OSIRIS, which
supplies both real-time and historical fundamental information on South African listed
companies.

56
3.6 Collection of data
The data was sourced from the published annual reports on each company’s website and was
downloaded from the OSIRIS financial database directly into Microsoft Excel. The data was
collected in May and analysed from June 2013 with the first research report draft being ready at
the end of December 2013.
3.7 Data management
The data collected from the OSRIS financial database was downloaded in Excel workbooks
containing seven worksheets each representing a financial year end. These workbooks were
managed by storing them on a laptop and backing them up on an external hard drive.
3.8 Data analysis
Data is of little or no value merely as data (Leedy & Ormrod, 2010). Thus, data analysis is an
essential element in an empirical research. The process of data analysis may take takes several
forms, depending on the nature of the research question and research design, and on the nature of
the data itself (Bless, 2006). This study encompassed an empirical research design and thus
quantitative primary data was collected for the purpose of the study. The data analysis tools
which were deemed to be the most appropriate for the study were statistical analysis techniques
using SPSS statistical software package. The most common of these statistical analysis
techniques are descriptive statistical tools and inferential statistical tools.
Descriptive statistics are statistics which are used to describe or summarise information about a
population or sample (Zikmund, 2003). Descriptive statistics uses a wide range of techniques to
describe the sample being investigated. The techniques employed include standard deviation

57
correlations, factor analysis and frequency counts with each technique extracting a somewhat
different meaning from a set of data (Leedy & Ormrod, 2010). On the other hand, inferential
statistics enable the researcher to make inferences or predictions about large populations by
using the data collected, from observation and analysis on a relatively small sample (Leedy &
Ormrod, 2010).
The statistical analysis in the study was conducted by a statistical consultant at the University of
the Witwatersrand. A descriptive analysis was conducted using basic frequency tabulations with
measures of central tendency and dispersion such as means, standard deviations and ranges and
graphic material in the form of histograms, normal P-P plots and scattergrams to describe the
sample. For inferential statistics, the study used the multiple regression analysis to evaluate the
relationships between these measures of firm performance and board composition.
Both parametric (where data is transformed) and non-parametric (where data in not transformed)
methodology was employed. The multiple regression models was run using the standard or
simultaneous model, as the objective of the research study was to examine the effect of all the
predictors on the dependent variable. For the purpose of this study various options of multiple
regressions were run, including fixed effects, random effects, ordinary least squares (OLS),
generalised least squares (GLS) and a dynamic panel. The most robust of all was the OLS and,
thus, the tables below present the results of the OLS regression.
58
3.9 Validity and reliability
3.9.1 Validity
Validity encompasses both external and internal validity (Leedy & Ormrod, 2005). According to
Bryman and Bell (2007) validity is an important criterion in research and “validity is concerned
with the integrity of the conclusions that are generated from a piece of research”. Thus, validity
refers to whether the researcher is observing, identifying, or measuring data which coincides
with what he/she should do (Bryman & Bell, 2007).
According to Bryman and Bell (2007), there are four types of validity, namely, measurement
validity, internal validity, external validity and ecological validity. Measurement validity relates
to the issue of whether or not an indicator that has been devised to estimate a concept does, in
fact, measure that concept while internal validity relates to whether a conclusion which has been
drawn incorporates a causal relationship between two or more variables (Bryman & Bell, 2007).
On the other hand, external validity refers to whether it is possible to generalise an outcome of a
specific beyond the specific research and, finally, ecological validity is concerned with social
environment, social settings and people’s routine life (Bryman & Bell, 2007).
As regards this study, the researcher focused primarily on measurement validity in terms of using
different control variables and endeavoured to examine whether each control variable was able to
reflect an association with firm performance. However, the internal validity was reflected in the
correlation test between different variables in order to examine the relationship between them.
Thus, various regression diagnostics including a, test for normality, heteroscedasticity and
multicollinearity were carried out to enhance internal validity of the regression model. The

59
researcher is of the opinion that the data was valid. All data used was extracted from the audited
and published annual reports of the companies and these reports are characterised by a high level
of both credibility and accountability.
3.9.2 Reliability
Reliability involves whether the results of a study are repeatable, and it is particularly relevant in
quantitative research (Bryman & Bell, 2007). All the data for the purposes of this study was
collected from audited published annual reports, and the researcher was sure this would ensure in
a high level of reliability. The regression model used had been tested by prior researchers and
was deemed a mature model. The use of SPSS statistical software package ensured that the
processing of the data was accurate, controllable and reliable. Thus, the researcher is convinced
of the transparency, relevance and reliability for this dissertation.
3.10 Assumptions and delimitations of the study
3.10.1 Assumptions
It was assumed that the total number of firms included in the sample was sufficient to ensure
adequate data on corporate financial reporting and performance and also that the corporate
governance information was communicated candidly and truthfully by the firms. False data
would have had a detrimental effect on the study’s results.
3.10.2 Delimitations
The study used public listed companies on the Johannesburg Stock Exchange only and focused
on the Code of Governance Principles for South Africa 2009. Thus, detailed data on the budgets
and forecasts of specific business units was not discussed.
60
3.11 Summary
The objective of this research study was to establish whether board composition and board size is
associated with, or is able to explain firm performance. Thus, using statistical terminology, the
aim of the research study was to explain or predict a dependent variable (firm performance) from
a set of independent variables (board composition and board size) and control factors. Multiple
regression analysis was selected for this purpose. Regression results provide information on the
statistical significance of the independent variables, the strength of the association between one
or more of the predictors, and a predictive equation for future use. The information provided by
the regression analysis clearly enabled the aims and objectives of this research study to be
realised. The next chapter discusses the results of the OLS regression models. This is followed by a
summary and conclusion of the research study.

61
Chapter IV: Results and Discussion
4.1 Introduction
The objective of this chapter is to explore, display and examine the data which was collected.
The chapter discusses the descriptive statistics applied to the primary variables, describes the
statistical results of the multiple regression analysis conducted for each firm performance
variable and determines whether the hypotheses are to be accepted or rejected. The regression
equations were tested at a 5% confidence level.
4.2 Descriptive statistics
Descriptive statistics are used to summarise information about a population (Zikmund, 2003) by
conveying more precise information about the behaviour of the random variables through the
measures of central location (mean and median) and dispersion (standard deviation and range)
(Wegner, 2001). These measures reduce huge volumes of data to a simpler format to enable the
understanding of a population sample.
The first King Report (1994) (King I) was instrumental in raising the awareness of what
constitutes good governance, both in the private and public sectors (Malherbe & Segal, 2001).
The report offered to both companies and state-owned enterprises, for the first time, a coherent
and disciplined governance framework that was relevant to local circumstances and which
offered practical guidance (Armstrong, 2004). The listing requirements of the former
Johannesburg Stock Exchange (JSE), now known as the JSE Securities Exchange South Africa,
were comprehensively revised, first in 1995 and again in 2000, to incorporate both King I and II
recommendations on Corporate Governance in order to ensure that rules governing companies

62
listed and to be listed on JSE remained in line with international best practice. It is evident from
Figure 4.1 below that the majority of the companies were listed between 1994 and 2007 with
more than 60% being incorporated in 1998 following the release of King I & II reports.
Figure 4.1: Date of incorporation/listing on JSE
The researcher identified the following Financial Times (FT) industrial classes which are in line
with the classification as noted in the manual guideline of the StatsSA (2012):
Agriculture & Fishing
Construction
Diversified Holding Companies
Financial Services & Real Estate
Health Care
Hotels & Restaurants
Manufacturing
Mining and Extracting industries
Telecommunications & Electronics
Transport Services
Wholesale & Retail Trade
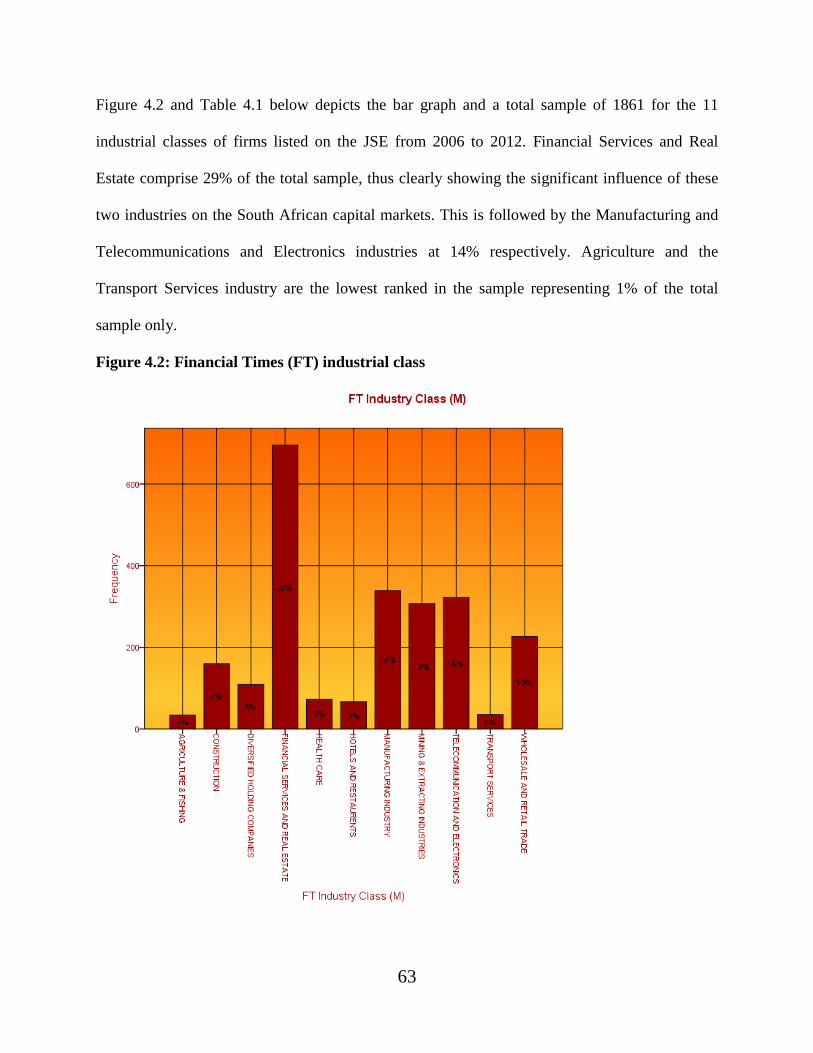
63
Figure 4.2 and Table 4.1 below depicts the bar graph and a total sample of 1861 for the 11
industrial classes of firms listed on the JSE from 2006 to 2012. Financial Services and Real
Estate comprise 29% of the total sample, thus clearly showing the significant influence of these
two industries on the South African capital markets. This is followed by the Manufacturing and
Telecommunications and Electronics industries at 14% respectively. Agriculture and the
Transport Services industry are the lowest ranked in the sample representing 1% of the total
sample only.
Figure 4.2: Financial Times (FT) industrial class

64
Table 4.2 and Table 4.7 below depict that the mean percentage of independent non-executive
directors on the boards of directors of South African companies listed on the JSE Securities
Exchange before King III was 50% while, after King III this figure went up to 53% with a
median of 57%. These results are consistent with findings of Vafas and Theodorou (1998) who
reported that of the 250 publicly listed firms surveyed, the percentages of independent non-
executive and executive directors on the boards of directors were 61% and 39% respectively.
Mitchell Williams (2000) observed that the representation of independent non-executive and
executive directors on the boards of South African publicly listed companies was evenly divided.
However, it should be noted that this research study was conducted after the implementation of
King III and that King III recommends for a greater percentage of independent non-executive
directors on a board of directors than executive directors (Cliffe Dekker Hofmeyr, 2013).
Of all the firms included in this study Table 4.7 below depicts that, the mean board size was
approximately 12.87 before King III, rising marginally to 13.54 after King III, thus, suggesting
that the boards of firms in South Africa are of a relatively larger size. With a maximum board
size of 24 and a standard deviation average of 4, it is clear that the boards of firms in South
Africa are of a relatively similar large size. According to researchers such as Pfeffer and Salancik
(1978) and Burt (1980) large boards are essentially good for firm performance as they argue that
large board sizes are associated with positive corporate performance. Table 4.7 shows that, the
mean company age was 39 years before King III but relatively lower after King III at 36 years.
The findings of the descriptive research study confirm both agency and resource dependence
theory in supporting the proposition that independent non-executive directors have a significant

65
impact on firm performance (Pfeffer & Salancik, 1978; Wang & Dewhirst, 1992). Rosenstein
and Wyatt (1994) found that the addition of an independent non-executive director to the board
of directors resulted in the company’s earning a positive excess return. This, in turn suggests that
the shareholders of a company view the appointment of a non-executive director as possessing
intrinsic value. The descriptive statistics explain the findings of the study that there were a
greater percentage of independent non-executive directors on the boards of South African
companies listed on the JSE for the 2006 to 2012 fiscal years as compared to the percentage of
executive directors, thus, complying with King III recommendations on board composition.
Table 4.1: Between-subjects factors
Value Label N
Year (King)
1.00 2006 171
2.00 2007 271
3.00 2008 295
4.00 2009 283
5.00 2011 270
6.00 2012 300
7.00 2010 271
FT Industry Class (M)
AGRICULTURE & FISHING
29
CONSTRUCTION
140
DIVERSIFIED HOLDING COMPANIES
81
FINANCIAL SERVICES AND REAL
ESTATE
415
HEALTH CARE
67
HOTELS AND RESTAURENTS
62
MANUFACTURING INDUSTRY
297
MINING & EXTRACTING INDUSTRIES
250
TELECOMMUNICATION AND
ELECTRONICS
279
TRANSPORT SERVICES
32
WHOLESALE AND RETAIL TRADE
209
Listed/unlisted/delisted
Delisted
136
Listed
1725

66
Table 4.2: Descriptive statistics
Year N Mean Median Std. Deviation Minimum Maximum Kurtosis Skewness
Operating Rev./Turnover th
LCU
2006 316 4887385.17 529080.00 13630991.364 0 163903000 63.330 6.689
2007 335 5085360.83 651267.00 12281862.261 0 99171000 24.760 4.492
2008 348 6133760.60 773257.00 14888322.426 0 130578000 27.305 4.638
2009 341 6404616.87 845948.00 15638346.010 0 138857000 28.503 4.737
2010 326 6557242.72 941757.50 15580301.154 0 123110000 24.497 4.448
2011 322 7630414.30 1029317.00 17420692.997 -84900 143524000 23.565 4.316
2012 300 12278419.31 1899239.50 26939581.826 -78000 170862000 16.877 3.846
Total 2084 6401111.05 837608.00 15790442.496 -84900 170862000 31.451 4.916
Total Assets th LCU 2006 323 16660893.18 747321.00 81365792.051 141 968455000 74.098 7.979
2007 342 18671935.98 975851.00 95956198.284 113 1182126000 81.494 8.409
2008 355 20715914.82 1038929.00 113462711.527 78 1503653000 99.893 9.302
2009 348 20361506.18 1210693.50 104624458.605 0 1292506000 83.229 8.564
2010 336 22299380.94 1220426.00 110677557.280 0 1332409000 77.570 8.242
2011 333 24743629.78 1461863.00 118436716.027 44 1492829000 84.881 8.460
2012 331 22660531.58 2359736.00 85717817.382 34392 769765000 60.971 7.367
Total 2136 20684849.18 1153385.50 104065671.225 0 1503653000 88.814 8.694
Shareholders Funds th LCU 2006 323 2803046.34 305770.00 7669422.734 -647087 54708000 19.968 4.295
2007 342 3094035.13 401975.00 8793882.461 -686027 68506000 24.477 4.727
2008 355 3594024.28 459942.00 10613789.139 -794067 99501000 34.600 5.416
2009 348 3836203.45 501168.50 10879132.946 -36567 99369000 32.925 5.281
2010 336 4270336.90 551578.50 11962981.551 -744500 103198000 30.221 5.093
2011 333 4990397.12 693734.00 13638596.466 -28132 117533000 30.484 5.071
2012 312 6879785.38 976674.00 17061873.834 -72797 125234000 25.549 4.569
Total 2136 3910185.20 503184.50 11171479.571 -794067 125234000 35.743 5.379
Net Income th LCU 2006 323 648033.80 60049.00 1976384.840 -525000 19169000 34.409 5.320
2007 342 721691.36 84593.50 2096627.530 -1405500 17030000 27.412 4.858
2008 355 830006.00 58696.00 3375858.444 -1730790 45330000 93.779 8.500
2009 348 614444.56 47102.50 2570409.139 -1507218 37458000 127.072 9.908
2010 334 636993.78 54195.50 2120918.515 -8676000 15941000 25.037 4.283
2011 332 844533.46 63224.00 2776010.519 -1972973 21527000 29.961 5.186
2012 311 1113123.31 137818.00 3070603.439 -921000 23583000 32.487 5.195
Total 2133 735092.56 61684.00 2570627.192 -8676000 45330000 81.540 7.388
Market Cap. th LCU 2006 200 10020565.00 1780089.71 24960374.164 768 184595599 21.570 4.343
2007 311 8558624.60 1136139.75 24215403.642 4800 238806003 38.521 5.599
2008 334 7150983.72 615662.66 25714774.349 1821 307601105 74.892 7.889
2009 328 7607552.98 617051.24 23022794.260 4074 216996848 37.972 5.689
2010 322 9200277.93 837019.81 26651454.931 3259 253128435 35.131 5.441
2011 320 10500888.32 1097461.98 30209222.747 2537 270903959 33.432 5.356
2012 310 14243027.17 1781150.66 31469611.942 20625 220753259 21.712 4.150
Total 1913 9026733.72 972247.01 26274454.106 768 307601105 39.873 5.709
Return on Shareh. Funds (%) 2006 309 32.51 30.25 80.609 -738 547 44.414 -3.653
2007 334 28.33 27.62 69.214 -821 329 87.955 -7.158
2008 347 16.96 20.61 87.769 -617 983 55.431 1.369
2009 338 13.02 15.23 74.319 -703 546 42.040 -1.465
2010 322 7.37 14.60 87.963 -864 435 51.857 -5.277
2011 317 11.63 16.29 52.071 -387 219 17.176 -2.571
2012 318 22.51 18.89 37.215 -62 289 28.002 3.808
Total 2061 18.42 20.15 75.533 -864 983 56.935 -2.823
Return on Total Assets (%) 2006 313 13.45348 12.38000 15.039738 -85.910 59.790 7.426 -.949
2007 339 12.31693 12.07000 13.888562 -68.610 63.010 6.362 -.875
2008 349 8.25616 8.65000 18.215318 -87.710 79.400 6.174 -.902
2009 342 5.86061 6.48500 15.858898 -63.710 79.090 5.204 -.645
2010 329 4.17979 6.13000 18.810452 -98.880 90.050 10.803 -1.861
2011 327 5.90211 6.36000 16.652353 -88.530 93.160 8.557 -1.104
2012 97 8.89196 9.26000 11.679615 -42.820 46.120 4.128 -.725
Total 2096 8.32050 8.66000 16.636917 -98.880 93.160 7.931 -1.159
Return on equity (ROE) % 2006 300 31.03530 24.60000 96.535257 -988.330 771.400 55.072 -2.142
2007 311 27.86318 22.43000 58.876006 -304.440 568.890 36.879 3.641

67
2008 315 15.67657 17.25000 42.584522 -289.550 225.960 12.362 -1.137
2009 285 9.41989 10.61000 63.053721 -390.720 577.240 34.193 1.552
2010 294 11.32881 10.92000 55.532387 -260.100 579.550 42.296 3.587
2011 287 7.60251 11.32000 75.005864 -374.770 859.310 62.053 4.031
2012 296 2.33356 13.66000 103.127855 -911.760 130.550 73.908 -8.273
Total 1879 16.66548 16.27000 69.811689 -988.330 859.310 69.107 -.515
Sales th LCU 2006 282 4379448.68 501310.00 13354557.818 0 160537000 71.733 7.326
2007 301 4571490.13 581232.00 11849450.329 0 98532000 30.886 5.071
2008 315 5590980.22 702745.00 14447380.741 0 129943000 33.109 5.152
2009 303 5935220.00 840488.00 15262905.315 0 137836000 34.147 5.237
2010 289 6099230.76 909361.00 15316513.148 0 122256000 28.165 4.828
2011 290 6960271.47 989354.00 17090243.737 0 142436000 27.568 4.742
2012 314 12265069.41 2173549.50 27408385.481 -15694 169446000 16.594 3.851
Total 1868 5905265.53 792709.50 15535033.578 -15694 169446000 36.041 5.354
Independent Non Exec 2006 323 4.06 4.00 2.529 0 13 .310 .596
2007 342 7.41 7.00 3.322 1 18 .107 .585
2008 355 7.30 7.00 3.387 0 18 .222 .473
2009 349 7.40 7.00 3.310 0 18 .235 .529
2010 336 7.52 7.00 3.212 1 18 .253 .654
2011 333 7.53 7.00 3.313 0 18 .137 .576
2012 311 8.14 8.00 3.169 2 16 -.500 .398
Total 2137 6.95 7.00 3.423 0 18 .122 .509
Exec Directors 2006 323 6.21 6.00 2.871 1 17 1.762 1.140
2007 342 6.32 6.00 2.882 1 18 2.164 1.229
2008 355 6.24 6.00 2.987 0 18 1.850 1.052
2009 346 6.39 6.00 2.904 1 18 1.974 1.200
2010 336 6.36 6.00 2.922 0 18 2.575 1.332
2011 332 6.34 6.00 2.939 0 18 2.327 1.287
2012 337 6.62 6.00 3.219 1 18 1.307 1.170
Total 2133 6.33 6.00 2.930 0 18 2.030 1.199
Board Size 2006 323 10.27 10.00 4.112 2 24 .362 .672
2007 342 13.73 13.00 4.964 4 28 -.075 .527
2008 355 13.55 13.00 5.104 0 28 .048 .414
2009 349 13.73 13.00 4.972 4 28 -.077 .546
2010 336 13.88 13.00 4.944 4 28 -.057 .597
2011 333 13.85 13.00 5.047 0 28 -.071 .533
2012 335 14.76 14.00 5.378 4 28 -.667 .339
Total 2137 13.27 13.00 5.060 0 28 -.044 .535
Percentage of Independent
Non Exec
2006 323 37.94178 40.00000 18.136509 .000 87.500 .021 -.119
2007 342 53.58536 54.77273 13.308749 9.091 87.500 .504 -.517
2008 355 53.36014 55.55556 15.391468 .000 100.000 2.163 -.851
2009 349 53.82597 55.55556 14.844084 .000 120.000 2.749 -.445
2010 336 54.10005 55.55556 12.792446 16.667 100.000 .852 -.186
2011 333 54.03771 55.55556 13.339152 .000 100.000 1.719 -.684
2012 331 55.70619 57.14286 10.640636 29.412 75.000 -.093 -.461
Total 2137 51.47244 53.84615 15.632634 .000 120.000 1.338 -.687
Tobin's Q 2006 323 2.37174 1.12144 15.827946 .000 248.819 200.286 13.793
2007 342 2.00502 1.48108 5.638739 .000 102.885 302.856 16.944
2008 355 1.71807 1.08547 8.242619 .000 155.743 347.295 18.538
2009 349 1.62653 1.04528 7.945544 .000 148.876 341.828 18.397
2010 336 1.42703 1.08866 2.448131 .000 43.488 261.940 15.308
2011 333 2.61709 1.14127 16.591778 .000 281.868 248.849 15.323
2012 331 1.53540 1.26658 .922552 .000 6.100 6.822 2.248
Total 2137 1.93371 1.15245 10.408080 .000 281.868 456.422 20.285
Company Age 2006 323 39.08 27.00 30.573 6 151 .861 1.266
2007 342 42.76 26.00 100.955 5 1818 282.371 16.062
2008 355 37.05 26.00 30.317 5 151 1.152 1.350
2009 349 36.75 26.00 30.582 4 151 1.132 1.353
2010 336 36.63 26.00 30.811 3 151 1.002 1.319
2011 333 36.23 25.00 31.243 1 151 .945 1.296
2012 331 39.27 28.00 29.367 0 118 -.029 .913
Total 2137 38.13 26.00 49.172 0 1818 803.490 22.515

68
4.3 Regression diagnostics
Before the statistical analysis may be conducted, it is important to ensure that the underlying
assumptions of correlation and regression analysis are in place. Regression diagnostics refers to
the tests which are performed on data to ensure that the resultant models do not violate the
assumptions of regression analysis. According to Sheather (2009), multiple regression analysis is
underpinned by following four underlying assumptions: firstly, there must be a linear relationshp
between the dependent variable/s (Y1…n) and the independent variable/s (X1…n); (2); secondly, the
errors must be independent of each other; thirdly, the errors must have a common variance
(homoscedasticity); and lastly, the errors must be normally distributed with a mean of zero (0).
Assumptions one and three on linearity and the common variance of errors were tested using
scattergrams (see Appendix 1). The scattergrams for the three performance variables, namely,
TOB, ROA and ROE showed no discernible pattern in the values plotted. Thus, this
demonstrates that the data did not violate the assumptions of MRA in as far as linearity and
variance of errors were concerned. Any discernible patterns would have indicated an uneven
distribution of the residuals about the regression line.
The second assumption to the effect that the errors must be independent of each other was tested
by computing the Durbin-Watson for each performance variable. The statistics came out as part
of the SPSS package output and are summarised in Appendix 2 below. All the regression models
had Durbin-Watson statistics in the range >1 and <3 thus suggesting that there was no correlation
between the variables. The values of the Durbin-Watson statistic range from 0 to 4 and as a

69
general rule, the residuals are uncorrelated if the value is approximately 2, with a value close to 0
indicating strong negative correlation and a value of 4 indicating strong positive correlation.
Multicollinearity testing was performed on the ROA and ROE ratios, as both uses a measure of
income to determine a return on the resources used to produce this income. Gujarati and
Damodar (2003, p.361) suggest the following three principal multicollinearity tests, namely, a
correlation coefficient between the two variables, a variable inflation factor (VIF), and Eigen
values. The results of the three tests are presented in table 4.8. The correlation coefficient was
calculated using Microsoft Excel, and displayed a 7% correlation between the two variables
while the VIF values were calculated using SPSS software, with all values reflecting less than 10
and therefore providing no evidence of multicollinearity. Finally all the Eigen values, which
were calculated using SPSS, displayed values well below the guideline of 100-1000, reflecting
thus no multicollinearity.
The fourth and last assumption of MRA that the errors must be normally distributed with a mean
of zero (0) was tested by observing the histograms and normal probability plots of the residuals
(see Appendix 1). In order to assess the normality of the performance variables, a histogram was
generated and visually examined for normal distribution (Appendix 1). Where the data was not
normally distributed, the observations were logged using natural logarithms. Histograms were
generated again and analysed using the transformed data. In all cases the resulting data was
found to be normally distributed. The data transformed included Tobin’s Q to (logtobinq) with a
visual inspection of the histograms revealing that the data for all the governance variables
followed a normal distribution while the normal probability plots showed that all the data points

70
were in an approximate straight line. It was therefore evident that both graphs displayed evidence
of data normality.
4.4 OLS regression results
Table 4.3 presents the regression results of the relationship between Tobin’s Q (TOB) and the
governance variables. The results clearly indicated a mixed result between the independent and
control variables and this performance variable.
The coefficient for the percentage of independent non-executive directors, although displaying a
positive relationship with TOB, was insignificant as measured by the t-statistic of 0.774
(p>0.05). Thus, on the basis of the results the alternate hypothesis was rejected, namely, that
there was a significant positive relationship between the percentage of non-executive directors on
the board of directors of publicly listed companies in South Africa and firm performance. The
results imply that when there were more external board members, the performance of the firm
tended to deteriorate. However, this contradicts the findings of other empirical studies by
Weisbach (1988), Byrd and Hickman (1992), and Brickley et al. (1994) on independent non-
executive directors promoting the beneficial monitoring and advisory functions to firm
shareholders. In addition, Baysinger and Butler (1985) and Rosenstein et al (1994) showed that
the market rewards firms for appointing outside directors. On the other hand, this is consistent
with the findings of Agrawal and Knoeber (1996) who suggest that boards expanding for
political reasons often resulted in too many outsiders on the board and this, in turn, did not
improve performance. The low level of significance between the percentage of non-executive
directors on the board of directors and firm performance is also consistent with evidence

71
supporting the managerial hegemony theory (Bhagat & Black, 2002). Thus, it should be
indicated that this variable is not significant as regards TOB.
Similarly, to the percentage of independent non-executive directors, the coefficient for the board
size, although displaying a positive relationship with TOB, was insignificant as measured by the
t-statistic of 1.521 (p>0.05). In line with the findings of studies conducted by Jensen (1993),
Lipton and Lorsch (1992) and Yermack (1996), this study showed that the larger the size of the
board, the worse the Tobin’s Q. This also confirms studies that support the view that larger
boards may be overwhelmed by poor internal communications and decision-making processes
(Yermack, 1996). In addition larger boards may also develop fractions and coalitions that lead to
group conflict while also displaying a tendency to react slowly and indecisively in a crisis (Huse,
2007). Furthermore, the argument had been advanced that larger and diverse boards may be more
easily manipulated than smaller boards on the grounds that it is easier for the CEO to gain
dominance over the board through various manipulation techniques such as coalition building
(Huse, 2007). Thus, board size is not significant in explaining Tobin’s Q for firms in South
Africa and therefore, the alternate hypothesis is rejected.
The study also suggested that the size of the firm as measured by revenue and assets had a
negative impact on Tobin’s Q although not significant as measured by the t-statistic of -0.163
(p>0.5). These results are consistent with findings of Nicholson and Kiel (2003), who found that
firm size, as measured by revenue and assets is inversely related to the three year average
Tobin’s Q. This may, however, be explained by the fact that the size of a firm as measured by its
revenue and asset base does not necessarily enhance performance if the revenue and assets are

72
not put to efficient use (Kyereboah-Coleman & Biekpe, 2005). The implication was therefore
that most firms in South Africa were not utilising their size in order to enhance their
performance. It is of interest that the co-efficient of Hotels and Restaurants industry displayed a
significant positive relationship with Tobin’s Q as measured by the t-statistic of 2.870 (p<0.05).
However, this may be attributed to the booming tourism industry in South Africa with most
tourists taking advantage of the world class hotels and restaurants in South Africa (Roelofse,
2013). Diversified Holding Companies, Financial Services and Real Estate, Transport Services
and Telecommunications industries all displayed a negative but significant relationship with
Tobin’s Q. while the co-efficient of Market Capitalisation and Return on Shareholder Funds
displayed a significant positive relationship with Tobin’s Q as measured by t-statistic of 14.192
(p<0.05) and 5.302 (p<0.05) respectively. The results are consistent with the findings of
Nicholson and Kiel (2003) who postulated a significant positive correlation between market
capitalisation and TOB. The coefficient for King III, although displaying a negative relationship
with TOB, was significant as measured by the t-statistic of -7.151 (p<0.05). This in turn
demonstrates the influence King III recommendations on the firms listed on the JSE though the
recommendations of King III are on a “apply or explain” basis hence the negative relationship.
Table 4.3: OLS dependent variable: logtobinq
Model – Equation 1 Unstandardized
Coefficients
Standardized
Coefficients
t Sig.
B Std. Error Beta
1 (Constant) 1.058 .067
15.887 .000
Operating Rev./Turnover th LCU 7.325E-009 .000 .356 1.099 .272
Total Assets th LCU -7.522E-011 .000 -.012 -.163 .871
Shareholders Funds th LCU -1.729E-008 .000 -.530 -9.434 .000
Net Income th LCU 2.858E-010 .000 .002 .063 .950

73
Market Cap. th LCU 7.951E-009 .000 .633 14.192 .000*
Return on Shareh. Funds (%) .001 .000 .112 5.302 .000*
Sales th LCU -6.507E-009 .000 -.309 -.991 .322
Exec Directors .004 .009 .036 .496 .620
Percentage of Independent Non Exec .001 .001 .036 .774 .439
AGRICULTURE & FISHING -.053 .060 -.019 -.886 .376
CONSTRUCTION -.080 .033 -.062 -2.422 .016
DIVERSIFIED HOLDING COMPANIES -.139 .039 -.083 -3.529 .000
FINANCIAL SERVICES AND REAL ESTATE -.103 .026 -.127 -3.916 .000
HEALTH CARE .053 .042 .029 1.250 .212
HOTELS AND RESTAURENTS .126 .044 .066 2.870 .004*
MANUFACTURING INDUSTRY -.049 .028 -.053 -1.780 .075
MINING & EXTRACTING INDUSTRIES -.013 .029 -.013 -.429 .668
TELECOMMUNICATION AND ELECTRONICS -.077 .028 -.081 -2.746 .006
TRANSPORT SERVICES -.190 .057 -.073 -3.360 .001
Class=Listed .008 .027 .006 .297 .767
King 3 Indicator -.101 .014 -.149 -7.151 .000**
Board Size .007 .005 .100 1.521 .128
a. R Squared = .229 (Adjusted R Squared = .220)
In table 4.4 depicts that, with the exception of Net Income, Market Capitalization and Return on
Shareholders’ funds measured by t-statistics of 7.292, 5.165, and 35.187 respectively all with
(p<0.05). The other entire independent and control variables did not play a significant role as
regards affecting firm profitability in terms of ROA.
Like Tobin’s Q, and as measured by t-statistic of .215 (p>0.05) board composition also has a
positive but insignificant impact on firm profitability, thus emphasising the fact that the
independence of a board is not really critical for the effective performance of any firm. The
results of this study are consistent with the findings of earlier studies, for example, studies
conducted by Rechner and Dalton, (1986), Fosberg, (1989), Barnhart et al, (1994), Grace,

74
Ireland, and Dunstan (1995), Dalton et al, (1998); Dalton and Daily, (1993), and Cho and Kim
(2007), thus implying that board composition in the form of outside independent directors does not
influence the economic performance of a firm. Despite the fact that studies by Fama and Jensen
(1983), Baysinger and Butler (1985), and Baysinger and Hoskinsson (1990), have asserted that
the effectiveness of a board depends on an optimal mix of executive and non-executive directors,
there is very little theory on the determinants of an optimal board composition (Hermalin &
Weisbach, 2003).
As in the case of Tobin’s Q, the size of the board is also positively related to ROA although not
significantly as measured by a t-statistic of .815 (p>0.05), thus suggesting that firms in South
Africa should have smaller boards. This is consistent with the findings of other researchers, for
example, Jensen (1993) and Lipton and Lorsch (1992) who argue that large boards are less
effective and are easier for the CEO to control than smaller boards. When a board becomes too
big, it becomes difficult to co-ordinate and process problems (Eisenberg et al. 1998). In addition,
there is further argument that smaller boards also reduce the possibility of free riding by
individual directors, and enhance their decision making processes (Sanda et al. 2011; Huse,
2007). Other empirical research supports this argument, for example, Yermack (1996)
documented that, in the case of large United States industrial corporations, the market values
firms with smaller boards more highly than those with larger boards. Similarly, in a Nigerian
study, Sanda et al (2011) found that, firm performance is positively related to small, as opposed
to large boards.
The size of the firm as measured by total assets, had an insignificant negative impact on ROA as
evidenced by the t-statistic of -1.533 (p>0.05). This result is consistent with the findings of
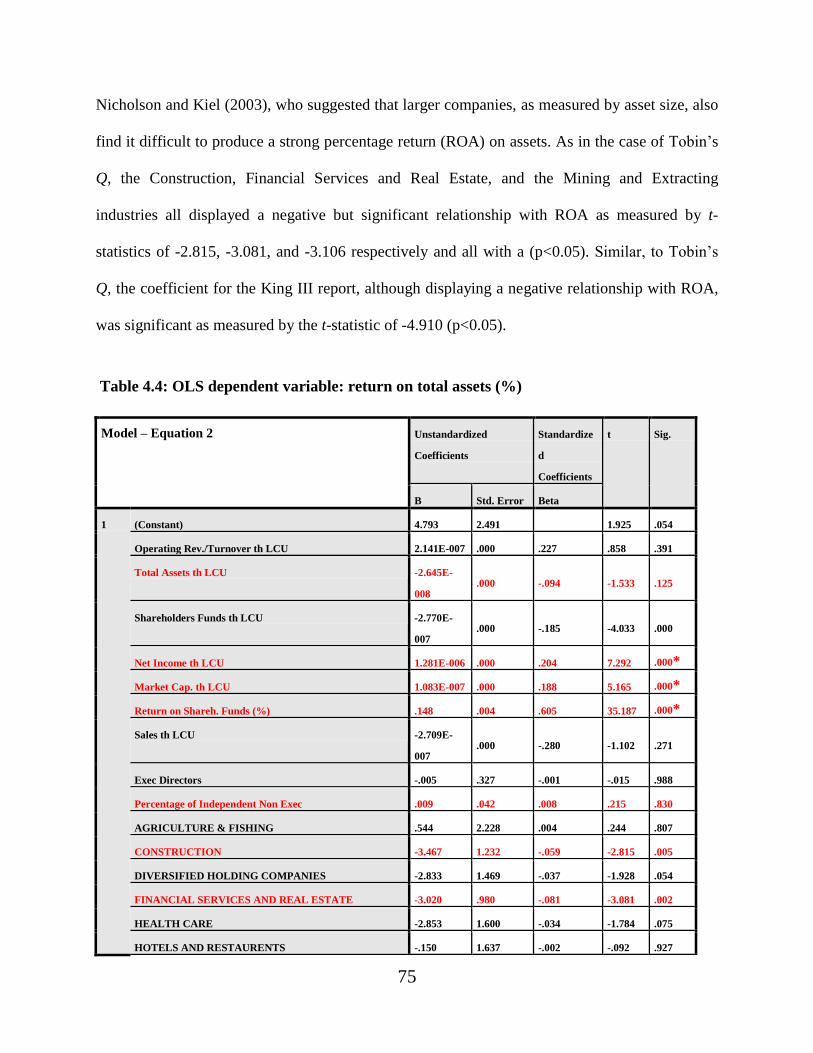
75
Nicholson and Kiel (2003), who suggested that larger companies, as measured by asset size, also
find it difficult to produce a strong percentage return (ROA) on assets. As in the case of Tobin’s
Q, the Construction, Financial Services and Real Estate, and the Mining and Extracting
industries all displayed a negative but significant relationship with ROA as measured by t-
statistics of -2.815, -3.081, and -3.106 respectively and all with a (p<0.05). Similar, to Tobin’s
Q, the coefficient for the King III report, although displaying a negative relationship with ROA,
was significant as measured by the t-statistic of -4.910 (p<0.05).
Table 4.4: OLS dependent variable: return on total assets (%)
Model – Equation 2 Unstandardized
Coefficients
Standardize
d
Coefficients
t Sig.
B Std. Error Beta
1 (Constant) 4.793 2.491 1.925 .054
Operating Rev./Turnover th LCU 2.141E-007 .000 .227 .858 .391
Total Assets th LCU -2.645E-
008 .000 -.094 -1.533 .125
Shareholders Funds th LCU -2.770E-
007 .000 -.185 -4.033 .000
Net Income th LCU 1.281E-006 .000 .204 7.292 .000*
Market Cap. th LCU 1.083E-007 .000 .188 5.165 .000*
Return on Shareh. Funds (%) .148 .004 .605 35.187 .000*
Sales th LCU -2.709E-
007 .000 -.280 -1.102 .271
Exec Directors -.005 .327 -.001 -.015 .988
Percentage of Independent Non Exec .009 .042 .008 .215 .830
AGRICULTURE & FISHING .544 2.228 .004 .244 .807
CONSTRUCTION -3.467 1.232 -.059 -2.815 .005
DIVERSIFIED HOLDING COMPANIES -2.833 1.469 -.037 -1.928 .054
FINANCIAL SERVICES AND REAL ESTATE -3.020 .980 -.081 -3.081 .002
HEALTH CARE -2.853 1.600 -.034 -1.784 .075
HOTELS AND RESTAURENTS -.150 1.637 -.002 -.092 .927

76
MANUFACTURING INDUSTRY -.709 1.029 -.017 -.689 .491
MINING & EXTRACTING INDUSTRIES -3.423 1.102 -.075 -3.106 .002
TELECOMMUNICATION AND ELECTRONICS -1.220 1.043 -.028 -1.170 .242
TRANSPORT SERVICES -4.417 2.108 -.037 -2.095 .036
Class=Listed 1.842 1.027 .031 1.794 .073
King 3 Indicator -2.634 .530 -.084 -4.970 .000**
Board Size .144 .176 .044 .815 .415
a. R Squared = .491 (Adjusted R Squared = .485)
Table 4.5 represents the regression results of the interaction between Return on Equity (ROE)
and the governance variables. As regards board composition, ROE was negatively related and
not significant to the percentage of independent non-executive directors with a t-statistic of -
2.146 (p>0.05). This result contradicts the findings of earlier studies that showed that the more
outsiders there were on a board, the more independent the board and the better the performance
of the firm thus confirming John and Senbet (1998), argument that boards of directors become
more independent as the proportion of outside director’s increase. As already mentioned,
Agrawal and Knoeber (1996), point out that, when boards expand for reasons of political
expediency, this often results in too many outsiders on the board and this, in turn does improve
performance. Fosberg (1989) also found a negative relationship between board composition and
ROE as a firm performance measure.
The board size was significantly positively related to Return on Equity as measured by the t-
statistic of 2.895 (p<0.05). Resource dependence theories have been used to argue in favour of a
positive relationship between board size and corporate financial performance (Huse, 2007).
Resource dependence theory argues that boards form environmental links in order to secure
resources and, thus, a large board would be better able to do so than a small board (Huse, 2007).

77
It is therefore argued that, the greater the need for external linkages, the larger the board should
be (Pfeffer & Salancik, 1978). In addition, Huse (2007) argues that interlocking directorates are
expected to facilitate both communication and inter-organisational coordination and, thus, from
this perspective it may also be argued that a larger board will be associated with positive
corporate performance as compared to a smaller board.
It must however be pointed out that all these governance variables are not statistically significant
in explaining ROE, although the board size, Net Income and Return on Shareholders’ funds are
all significant. The size of the firm as represented by total assets was positively related to ROE
but not significant as measured by the t-statistic of 1.242 (p>0.05), with this t-statistic falling
below the benchmark of < 2 for the t-test. This again confirms that firms in South Africa were
not utilising their size and assets to enhance financial performance. The coefficient for the King
III report, although displaying a negative relationship with ROE, was significant as measured by
the t-statistic of -4.021 (p<0.05).
Table 4.5: OLS dependent variable: return on equity (ROE) %
Model – Equation 3 Unstandardized
Coefficients
Standardized
Coefficients
t Sig.
B Std. Error Beta
1 (Constant) 18.671 8.558
2.182 .029
Operating Rev./Turnover th LCU -1.314E-006 .000 -.441 -1.554 .120
Total Assets th LCU 7.274E-008 .000 .083 1.242 .214
Shareholders’ Funds th LCU -6.572E-007 .000 -.140 -2.780 .005
Net Income th LCU 3.241E-006 .000 .168 5.609 .000*
Market Cap. th LCU -8.895E-009 .000 -.005 -.125 .901
Return on Shareh. Funds (%) .427 .013 .596 31.829 .000*

78
Sales th LCU 1.300E-006 .000 .426 1.560 .119
Exec Directors -2.441 1.129 -.138 -2.162 .031
Percentage of Independent Non Exec -.307 .143 -.088 -2.146 .032
AGRICULTURE & FISHING -2.531 7.559 -.006 -.335 .738
CONSTRUCTION -12.730 4.325 -.066 -2.943 .003
DIVERSIFIED HOLDING COMPANIES -3.767 5.136 -.015 -.733 .463
FINANCIAL SERVICES AND REAL ESTATE -.175 3.391 -.001 -.052 .959
HEALTH CARE .745 5.488 .003 .136 .892
HOTELS AND RESTAURENTS -4.302 5.669 -.015 -.759 .448
MANUFACTURING INDUSTRY -2.203 3.579 -.016 -.616 .538
MINING & EXTRACTING INDUSTRIES -3.934 3.817 -.027 -1.031 .303
TELECOMMUNICATION AND ELECTRONICS -2.689 3.606 -.019 -.746 .456
TRANSPORT SERVICES -7.411 7.155 -.020 -1.036 .300
Class=Listed 1.659 3.513 .009 .472 .637
King 3 Indicator -7.377 1.835 -.074 -4.021 .000**
Board Size 1.766 .610 .169 2.895 .004*
a. R Squared = .424 (Adjusted R Squared = .417)
4.5 Summary
Based on the findings of this research study, it may be posited that there is a lack of association
between the firm performance of South African organisations and the board composition and
board size of the firm concerned. However, this research study did find evidence of a positive
significant relationship between board size of companies listed on the JSE Securities Exchange
and Return on Equity as a performance measure. In line with international studies conducted in
developed markets, such as Bhagat & Black (2002); Nicholson & Kiel (2003); Yermack (1996);
and Fosberg (1989), the findings of this research study suggest that board composition and board
size are not important determinants of firm performance in South Africa although King III does
contain recommendations in regard to board composition. The following chapter summarise the
research study and concludes the study.
79
Chapter V: Summary and Conclusion
It is not possible to overemphasise the importance of corporate governance as it enhances the
organisational climate for the internal structures and performance of a firm (Sanda et al. 2011).
Indeed, through the presence of external independent directors, corporate governance creates a
new dimension as regards the effective running of a corporate entity thereby enhancing a firm’s
corporate entrepreneurship and competitiveness (Wu, 2003).
5.1 Summary
This empirical study examined the relationship between some measures of corporate governance
including board composition and board size, and the firm performance of all listed public firms
on the Johannesburg Securities Exchange from 2006 to 2012 with 2010 when King III came into
effect, as the base year. The study followed similar research conducted by Bhagat and Black
(2002), and Yermack (1996) in the United States. There have been previous studies most notably
the study conducted by Naomi Swartz in 2003 into the Johannesburg Securities Exchange and
which focused on board structure and intellectual capital as a firm performance measure.
Chapter 1 introduced the research study and chapter 2 contained a review of the relevant
literature with the chapter also describing corporate governance reforms and theories in South
Africa which have resulted from King I in 1994, King II in 2002 and then King III in 2009. The
empirical history of the corporate governance theories (agency and resource dependency theory)
in various markets and in different contextual settings was examined. This was followed by a
review of the emergence of corporate governance reforms in South Africa and recommendations

80
of King III on board composition and a discussion of board composition and size and firm
performance.
Chapter 3 discussed the research methodology utilised in the study, including the background of
the regression model, the research methods applied, and the validity and reliability, limitations
and delimitations of the study. The two independent variables of interest were defined as board
size as measured by the number of directors sitting on the board and board composition as
measured by the percentage of independent non-executive directors sitting on the board of
directors. Chapter 3 also discussed and described the population and study sample, data
collection method and analysis, and defined the period under study. The study was limited to JSE
listed firms in the period from 2006 to 2012. The size of the sample for this research report was
1861 firms, over a seven year period.
Chapter 4 discussed the research findings (Results), including as explanation of the descriptive
statistics, the regression diagnostics and the results of the Ordinary Least Squares Regression
models.
5.2 Conclusion
In respect of Equation 1 (logtobinq), a t-statistic of .774 (p>0.05) indicated a positive, yet
insignificant relationship between the percentage of independent non-executive directors on the
boards of directors of South African firms listed on the JSE Securities Exchange and Tobin’s Q.
These findings suggest that the independence on the board of directors is not an important
determinant of firm performance as measured by Tobin’s Q. In order to decide whether board
size could be used to explain firm performance, equation 1 also hypothesised that there was a

81
positive and yet insignificant relationship between the board size of South African firms listed on
the JSE Securities Exchange and Tobin’s Q as a performance measure and as evidenced by a t-
statistic of 1.521 (p>0.05). These findings suggest that board size is not an important determinant
of firm performance when using Tobin’s Q.
Equation 2 (ROA), hypothesised that there was a positive and insignificant relationship between
the percentage of independent non-executive directors on the board of directors of South African
publicly listed companies and ROA as a firm accounting performance measure. The findings did
not support this hypothesis with the t-statistic of the independent variable being calculated as
0.215 (p>0.05). The alternate hypothesis was therefore rejected. Thus, the findings suggest that
the presence of a majority of independent non-executive directors on the board of directors is not
related to ROA as a firm’s accounting performance measure. The same results were obtained as
regards board size, where there was a positive yet insignificant relationship between the
independent variable and ROA as evidenced by a t-statistic of 0.815 (p>0.05).
In respect of Equation 3 (ROE), a t-statistic of -2.146 (p>0.05) indicated a negative, and
insignificant relationship between ROE as a firm accounting performance measure and the
percentage of independent non-executive directors on a board of directors. In order to decide
whether board size could explain and predict firm financial performance, equation 3
hypothesised that there was a positive relationship between board size and ROE as a measure of
firm accounting performance. The findings indicated a significant relationship as evidenced by a
t-statistic of 2.895 (p<0.05). Thus, these findings suggest that the percentage of independent non-

82
executive directors on the board of directors is not a determinant of firm financial performance,
while the board size is a determinant when ROE is used as a measure of firm performance.
The control variables, Market Capitalisation, Return on Shareholders Fund, Net Income and
certain dummy industry variables included in the equations yielded significant positive
relationships at a 5% confidence level in the 3 regression equations tested although a majority of
the variables were insignificant at a greater than 5% confident level. The control factors
contributed to the explanatory power of the models. Although this study found a strong
significant positive relationship when using ROE as a firm performance measure and board size,
it is clear from the measure of model fit (R² and adjusted R²) presented in Table 4.3, 4.4, 4.5, and
appendix 2 that there are other variables which were not included in the model and which also
affected firm performance and which needed to be added to the model. Although the R² of below
0.5 (<50%) and the adjusted R² of below 0.5 (<50%) for all 3 dependent variables indicated that
the predictive power of the model was low, the results did, however, confirm that the model was
stable and adequate as a base for testing the hypotheses. As a whole, the findings indicated that
the contribution of board composition and size to firm performance was explanatory, but mixed.
In conclusion, the empirical findings suggest board composition and board size are not primary
determinants of firm performance as regards the South African companies listed on the JSE
Securities Exchange. Overall the findings suggest that despite the importance of good corporate
governance practices, firm performance when defined by Tobin’s Q, ROA & ROE is not
primarily dependent on board composition and board size as no positive significant relationship
was found on the 3 regression equations except for board size and ROE.
83
5.3 Recommendations and areas for further research
Every board should consider whether its size, diversity and demographics render it effective
(IOD, 2009). The issue of diversity applies to the academic qualifications, technical expertise,
relevant industry knowledge, experience, nationality, age, race and gender of the board members
(IOD, 2009). King III notes that directors should be individuals of integrity and courage, and that
they should possess the relevant knowledge, skills and experience required to bring judgement to
bear on the business of the company (Deloitte, 2013). In situations in which the directors may
lack experience, detailed induction as well as formal mentoring and support programmes should
be implemented (Deloitte, 2013).
Thus, a board should establish a formal induction programme to familiarise incoming directors
with the company‘s operations, its business environment, and the sustainability issues relevant to
its business (IOD, 2009; Deloitte, 2013). In addition, the programme should ensure that
incoming directors are introduced to the members of senior management and to their respective
duties and responsibilities (Deloitte, 2013). An appropriate induction programme should meet
the specific needs of both the company and the individual and should enable any new director to
make the maximum contribution as quickly as possible (IOD, 2009). New directors with either
no or limited board experience should be developed and educated as regards their duties,
responsibilities, powers and potential liabilities (IOD, 2009; Deloitte, 2013). Thus mentorship by
experienced directors is encouraged. It is important to remember that the development of the
skills of inexperienced directors is vital in alleviating the shortage of the pool of directors
available for appointment (Deloitte, 2013).

84
It is also possible that some directors who are classified as independent are not truly independent
of management because they are beholden either to the company or its current CEO in ways
which are too subtle to be captured in the customary definitions of independence (Bhagat &
Black, 2002). On that note King III, recommends that, every year, those non-executive directors
who are classified as independent should undergo an evaluation of their independence by the
chairman and the board and if the chairman is not independent, the process should be led by the
lead Independent non-executive director. Independence in this context should be assessed by
weighing all the relevant factors that may compromise independence while the classification of
directors as independent or otherwise in the integrated report should be done on the basis of this
assessment (IOD, 2009). Any term beyond nine years (e.g. three three-year terms) for an
independent non-executive director should be subject to a particularly rigorous review by the
board of not only the performance of the director, but also of those factors that may impair
his/her independence at the time (IOD, 2009). King III noted that, the review should also take
into account the need for refreshing the board.
The CEOs of companies in different industries (in terms, of number, are the majority of
independent directors) are too busy with their own business, know too little about another
business, and are overly generous in compensating another CEO (Nicholson & Kiel, 2003). It
may, thus, be that the “visible” directors, who are well-known persons with limited business
experience, and often holding multiple directorships as well as adding gender or racial diversity
to a board, are not, on average, extremely effective as directors (Bhagat & Black, 2002). King III
recommends that a programme ensuring a staggered rotation of non-executive directors should
be put in place by the board to the extent that the programme is not already regulated by the

85
company‘s memorandum of incorporation or relevant regulation. The rotation of board members
should be structured so as to ensure that valuable skills are retained the continuity of knowledge
and experience maintained and directors with new ideas and expertise are introduced (IOD,
2009). At least one-third of non-executive directors should retire by rotation yearly, usually at
the company’s Annual General Meeting or at other general meetings, unless otherwise
prescribed by any applicable legislation (IOD, 2009). However, these retiring board members
may be re-elected, provided they are eligible. The board, through the nomination committee,
should recommend eligibility, while taking into account past performance, contributions and the
objectivity of business judgement calls (IOD, 2009).
It may be that independent directors who have served for too long become, over time, less
vigorous monitors (Bhagat & Black, 2002). However, King III recommends that independent
non-executive directors may serve for longer than nine years if, after an independence
assessment by the board, there are no relationships or circumstances which are likely to affect, or
which appear to affect, the director’s judgement. The assessment should show that the
independence of character and judgement of the independent director is not in any way affected
or impaired by the length of service, and a statement to this effect should be included in the
integrated report (IOD, 2009). King III notes that shareholders are ultimately responsible for the
composition of the board and it is in their own interests to ensure that the board is properly
constituted as regards skill and representivity. The procedures in respect of appointments to the
board should be formal and transparent and should be a matter for the board as a whole, assisted
by the nomination committee, and subject to shareholder approval (IOD, 2009).
86
A final possibility is that independent directors may add value to a board, but only if they are
embedded in an appropriate board committee7 structure (Deloitte, 2013). Boards should ascertain
whether potential candidates are competent to be appointed as directors and would be able to
contribute to the business judgement calls to be made by the board (IOD, 2009). In assessing the
skills and suitability of a proposed candidate director, there are three aspects that merit
consideration, firstly, the knowledge and experience required to fill the gap on the board,
secondly, the apparent integrity of the individual, and lastly, the skills and capacity of the
individual as regards fulfilling his/her duties to the board (IOD, 2009). Prior to appointment, the
director’s background should be investigated along the lines of the approach required for listed
companies by the JSE (IOD, 2009). It is also important to ensure that new directors have not
been declared delinquent nor are serving probation (S162 of the Act). The nomination committee
should play a role in this process.
Directors should receive regular briefings on matters relevant to the business of the company as
well as changes in risks and the laws applicable to the business of the company, including
accounting standards and policies, and the environment in which the company operates (IOD,
2009) Incompetent or unsuitable directors should be removed from the office, while taking
relevant legal and other requirements into consideration (IOD, 2009).
This research study focused exclusively on board composition (defined by the percentage
representation of independent non-executive directors on the board) and board size and firm
performance. Further research could be conducted in other areas such as board structure with a
7 These committee structures includes; nomination, audit, and remuneration committees (Bhagat & Black, 2002)

87
focus on director remuneration, directorship positions held, age, director qualifications, and
gender diversity among directors. In addition, this research study examined the association
between board composition and firm performance within an isolated corporate governance
setting and, thus it could be extended to consider nations with a different corporate governance
structure to South Africa.
5.4 Limitations of the study
There are certain limitations to this study. The study focused on board independence and board
size as important variables in terms of which to examine the correlation between board
composition and firm performance while other characteristics such as tenure, diversity, age,
gender, qualification and the background of directors were not examined. In addition, financial
ratio may not totally reflect the important role of the board in corporate governance. Firm
performance is a result by interaction between several drivers and socio-economic factors. Thus,
besides the factors considered in this study, there are many other factors including strategy,
network, and social environment that may be taken into account.
88
REFERENCES
Adams, R., & Mehran, H. (2003). Is corporate governance different for bank holding companies?
Economic Policy Review (19320426), 9, 123–142.
Agrawal, A., & Knoeber, C. R. (1996). Firm performance and mechanism to control agency
problems between managers and shareholders. Journal of Financial and Quantitative
Analysis, 31, 377–397.
Agrawal, A., & Knoeber, C. R. (2001). Do some outside directors play a political role? Journal
of Law and Economics, 14, 179–198.
Anderson R., Bates, T., Bizjak, J., & Lemmon, M. (2000). Corporate governance and firm
diversification. Financial Management, 29, 5–22.
Andreasson S., (2011). Understanding corporate governance reforms in South Africa: Anglo-
American Divergence, the King Reports, and hybridization. Business & Society, 50(4),
647-673
Armstrong, P. (2003). Status report on corporate governance reform in Africa. Prepared on
behalf of the Pan-African Consultative Forum on Corporate Governance. October.
Armstrong, P. (2004). Corporate governance in South Africa: A perspective from an emerging
market. Presentation to the 5th Eurasian Corporate Governance Roundtable, Ukraine.
Armstrong, P. (2004). The evolution of corporate governance in South Africa. Speech delivered
to the 4th Annual AIG Corporate Governance Seminar, 4 August.
Bainbridge, S. (1993). Independent directors and the ALI corporate governance project. George
Washington Law Review, 61, 1034–1083.
Barnhart, S., Marr, W., & Rosenstein, S. (1994). Firm performance and board composition:
Some new evidence. Managerial and Decision Economics, 15, 329–340.
Bathala, C. T., & Rao, R. P (1995). The determinants of board composition: An agency theory
perspective. Managerial and Decision Economics, 16, 59–69.
Baysinger, B., & Butler, H. (1985). Corporate governance and the board of directors:
Performance effects of changes inboard composition. Journal of Law, Economics and
Organization, 1, 101–134.
Baysinger, B., & Hoskisson, R. (1990). The composition of boards of directors and strategic
control. Academy of Management Review, 15, 72–87.
Bazerman, M., & Schoorman, F. (1983). A limited rationality model of interlocking directorates.
Academy of Management Review, 8, 206–217.

89
Beasley, M. S. (1996). An empirical analysis of the relation between the board of director
composition and financial statement fraud. Accounting Review, 443–465.
Berle, A., & Means, G. (1932). The modern corporation and private property. New York:
Macmillan.
Bermig, A., & Frick, B. (2010). Board size, board composition and firm performance: Empirical
evidence from Germany. Working Paper (University of Paderborn) 10 June.
Bhagat, S., & Black, B. (1999). The uncertain relationship between board composition and firm
performance. Business Lawyer, 54(3), 921–963.
Bhagat, S., & Black, B. (2002). The non-correlation between board independence and long-term
firm performance. Journal of Corporation Law, 27(2), 231–273.
Bless CHS. (2006). Fundamentals of social research methods: An African perspective.
Lansdowne: Juta.
Booth, J. R., & Deli, D. N. (1999). On executives of financial institutions as outside directors.
Journal of Corporate Finance, 5(3), 227–250.
Boeker, W., & Goodstein. J. (1991). Organizational performance and adaptation: Effects of
environment and performance on changes in board composition. Academy of
Management Journal, 34, 805–826.
Borokhovich, K. A., Parrino, R., & Trapani, T. (1996). Outside directors and CEO selection.
Journal of Financial and Quantitative Analysis, 31, 337–355.
Boyd, B. (1990). Corporate linkages and organizational environment: A test of the resource
dependence model. Strategic Management Journal, 11, 419–430.
Boyd, B. (1994). Board control and CEO compensation. Strategic Management Journal, 15,
335–344.
Boyd, B. (1995). CEO duality and firm performance: A contingency model. Strategic
Management Journal, 16, 301–312.
Brennan, N. (2006). Boards of directors and firm performance: Is there an expectations gap?
Corporate Governance: An International Review, 14(6), 577–593.
Brickley, J. A., Coles, J. L. & Terry, R. L. (1994). Outside directors and the adoption of poison
pills. Journal of Financial Economics, 35, 371–390.
Bryman, A., & Bell, E. (2007). Business research methods (2nd
ed.). Oxford: Oxford University
Press.
90
Burt, R. S. (1980). Cooptive corporate actor networks: A reconsideration of interlocking
directorates involving American manufacturing. Administrative Science Quarterly, 557–
582.
Burt, R. (1983). Corporate profits and co-optation. New York: Academic Press.
Byrd, J. W., & Hickman, K. A. (1992). Do outside directors monitor managers? Evidence from
tender offer bids. Journal of Financial Economics, 32, 195–222.
Cadbury, A. (1992). Report of the committee on the financial aspects of corporate governance.
London: Gee.
Certo, T., Daily, C., & Dalton, D. (2001). Signalling firm value through board structure: An
investigation of initial public offerings. Entrepreneurship Theory and Practice, 26(2),
33–50.
Charkham, J. P. (1994). Keeping good company: A study of corporate governance in five
countries. New York: Oxford University Press.
Cho, D., & Kim, J. (2007). Outside directors, ownership structure and firm profitability in Korea.
Corporate Governance: An International Review, 15(2), 239–250.
Clarkson, M. E. (1995). A stakeholder framework for analysing and evaluating corporate social
performance. Academy of Management Review, 20(1), 92–117.
Cliffe Dekker Hofmeyr. (2002). King Report on Corporate Governance for South Africa.
Retrieved from: http://www.cliffedekkerhofmeyr.com/en/news/publications/2002/corporate/king-
report-corporate-governance.html. Accessed 11 October 2013.
Cliffe Dekker Hofmeyr. (2013). King III in a nutshell. Retrieved from: http://www.cliffedekkerhofmeyr.com/export/sites/cdh/en/legal/sectors/downloads/Cliffe-Dekker-
Hofmeyr-King-III-in-a-Nutshell.pdf. Accessed 12 October 2013.
Coakes, S., & Steed, L. (2001). SPSS analysis without anguish Version 10. Australia: John
Wiley and Sons.
Cochran, P. L., & Wood, R. A. (1984). Corporate social responsibility and financial
performance. Academy of Management Journal, 27(1), 42–56.
Coles, J. L., Daniel, N. D., & Naveen, L. (2004). Boards: Does one size fit all? Journal of
Financial Economics, 87(2), 329–356.
Coles, J. W., McWilliams, V. B., & Sen, N. (2001). An examination of the relationship of
governance mechanisms to performance. Journal of Management, 27(1), 23–50.
91
Cooper, D., & Schindler, P. (2001). Business research methods (7th
ed.). New York: McGraw-
Hill Higher Education.
Conyon, M., & Peck, S, (1998). Board control, remuneration committees, and top management
compensation. Academy of Management Journal, 41, 146–157.
Cotter, J., Shivdasani, A., & Zenner, M. (1997). Do outside directors enhance target shareholder
wealth during tender offer contests? Journal of Financial Economics, 43, 195–218.
Daily, C. (1995). The relationship between board composition and leadership structure and
bankruptcy reorganization outcomes. Journal of Management, 21, 1041–1056.
Daily, C. (1996). Governance patterns in bankruptcy reorganizations. Strategic Management
Journal, 17, 355–375.
Daily, C., & Dalton, D. (1994a). Bankruptcy and corporate governance: The impact of board
composition and structure. Academy of Management Journal, 37, 1603–1617.
Daily, C., & Dalton, D. (1994b). Corporate governance and the bankrupt firm: An empirical
assessment. Strategic Management Journal, 15, 643–654.
Daily, C. M., & Dalton, D. R. (1993). Board of directors leadership and structure and corporate
performance in entrepreneurial firms. Journal of Business Ventures, 7(5), 375–386.
Dalton, D., & Daily, C. (2001). Director stock compensation: An invitation to a conspicuous
conflict of interest? Business Ethics Quarterly, 11, 89–108.
Dalton, D., Daily, C., Certo, T., & Roengpitya, R. (2003). Meta analyses of financial
performance and equity: Fusion or confusion? Academy of Management Journal, 46, 13–
26.
Dalton, D., Daily, C., Ellstrand, A., & Johnson, J. (1998). Meta analytic review of board
composition, leadership structure, and financial performance. Strategic Management
Journal, 19, 269–290.
Dalton, D., Daily, C., Johnson, J., & Ellstrand, A, (1999). Number of directors and financial
performance: A meta-analysis. Academy of Management Journal, 42, 674–686.
Daily, C. M., & Johnson, J. L. (1997). Sources of CEO power and firm financial performance: A
longitudinal assessment. Journal of Management, 23(2), 97–112.
Daily, C., & Schwenk, C. (1996). Chief executive officers, top management teams and boards of
directors: Congruent or countervailing forces? Journal of Management, 22, 185–202.
Davidson III, W. N., & Rowe, W. (2004). Intertemporal endogeneity in board composition and
financial performance. Corporate Ownership and Control, 1(4), 49–60.

92
D’Aveni, R. (1990). Top managerial prestige and organizational bankruptcy. Organization
Science, 2, 121–142.
Deakin, S., & Hughes, A. (1997). Comparative corporate governance: An interdisciplinary
agenda. In S. Deakin & A. Hughes (Eds), Enterprise and community: New directions in
corporate governance. Oxford: Blackwell.
Dechow, P. M., Sloan, R. G., & Sweeney, A. P. (1996). Causes and consequences of earnings
manipulation: An analysis of firms subject to enforcement actions by the SEC.
Contemporary Accounting Research, 13(1), 1–36.
Deloitte, (2013). Duties of Directors – April 2013. Retrieved from:
http://www.deloitte.com/assets/Dcom-
SouthAfrica/Local%20Assets/Documents/NED_Duties_of_Directors.pdf. Accessed 15
November 2013
Deloitte, (2009). King III – September 2009. Retrieved from:
http://www.deloitte.com/view/en_ZA/za/services/audit/audit-king-III/index.htm.
Accessed 23 November 2013
Department of Statistics South Africa (2012). “Codes and Classifications” Available online:
http://www.statssa.gov.za/additional_services/code_lists.asp. Accessed 7 Nov 2013.
Dulewicz, V., & Herbert, P. (2004). Does the composition and practice of boards and directors
bear any relationship to the performance of the companies? Corporate Governance,
12(3), 263–280.
Eisenberg, T., Sundgren, S., & Wells, M. T. (1998). Larger board size and decreasing firm value
in small firms. Journal of Financial Economics, 48, 35–54.
Eisenhardt, K. (1989). Agency theory: An assessment and review. Academy of Management
Review, 14, 57–74.
Eisenhardt, K., & Schoonhoven, C. (1996). Resource-based view of strategic alliance formation:
Strategic and social effects in entrepreneurial firms. Organization Science, 7, 136–150
Eklund, J. E., Palmberg, J., & Wiberg, D. (2009). Ownership structure, board composition and
investment performance. CESIS Electronic Working Paper Series, Paper no. 172.
Elson, C. (1995). Director compensation and the management captured board: The history of a
symptom and a cure. Southern Methodist Law Review, 50(September/October), 127–174.
Fama, E. (1980). Agency problems and the theory of the firm. Journal of Political Economy, 88,
288–307.
93
Fama, E., & Jensen, M. (1983). Separation of ownership and control. Journal of Law and
Economics, 26, 301–325.
Ferris, S.P., Hagannathan, M & Pritchard A.C. (2002). Too Busy to Mind the Business?
Monitoring by Directors with Multiple Board Appointments, earlier version available at
http:/papers.ssrn.com/abstract=167288 (Social Science Research Network).
Finegold, D., Benson, G. S., & Hecht, D. (2007). Corporate boards and company performance:
Review of research in light of recent reforms. Blackwell, 15(5), 865–878.
Fosberg, R. H. (1989). Outside directors and managerial monitoring. Akron Business and
Economic Review, 20(2), 24–32.
Galaskiewicz, J. (1985). Interorganisational relations. Annual Review of Sociology, H, 281–304.
Gales, L., & Kesner, I. (1994). An analysis of board of director size and composition in bankrupt
organizations. Journal of Business Research, 30, 271–282,
Gamst, G., Meyers, L. S., & Guarino, A. J. (2008). Analysis of variance designs: A conceptual
and computational approach with SPSS and SAS. New York: Cambridge University
Press.
Geletkanycz, M., & Hambrick, D. (1997). The external ties of senior executives: Implications for
strategic choice and performance. Administrative Science Quarterly, 42, 654–681.
Grace, M., Ireland A., & Dunstan, K. (1995). Board composition, non-executive directors:
Characteristics and corporate financial performance. Asia Pacific Journal of Accounting,
2, 121–137.
Gujarati, N., & Damodar, N. (2003). Basic econometrics (4th ed.). New York: McGraw Hill.
Hair, Jr J. F., Bush, R. P., & Ortinau, D. J. (2003). Marketing research: Within a changing
information environment. New York, NY: McGraw-Hill/Irwin.
Hambrick, D., & D'Aveni, R. (1992). Top team deterioration as part of the downward spiral of
large corporate bankruptcies. Journal of Management Science, 38, 1445–1466.
Harrison, G. R. (2003). Corporate governance in South Africa: The role of capital structure.
Unpublished thesis, Queen’s University, Belfast, August.
Haunschild, P., & Beckman. C. (1998). When do interlocks matter? Alternate sources of
information and interlock influence. Administrative Science Quarterly, 43, 815–844.
Hayes, R., Mehran, H., & Schaefer, S. (2004). Board committee structures, ownership and firm
performance. A revised version of the paper presented at the Federal Reserve Bank of
New York Finance Seminar Series, New York University.
94
Hermalin, B. E., & Weisbach, M. S. (1988). The determinants of board composition. Rand
Journal of Economics, 19, 589–606.
Hermalin, B. E. & M. Weisbach (1991). “The Effects of Board Composition and Direct
Incentives on Firm Performance”, Financial Management, 20 (4)
Hermalin, B. E., & Weisbach, M. S. (1998). Endogenously chosen boards of directors and their
monitoring of the CEO. American Economic Review, 88, 96–118.
Hermalin, B., & Weisbach, M. (2003). Boards of directors as endogenously determined
institutions: A survey of the economy literature. Economy Policy Review.
Hillman, A. J., & Dalziel, T. (2003). Boards of directors and firm performance: Integrating
agency and resource dependence perspectives. Academy of Management Review, 28(3),
383–396.
Hillman, A., Cannella. A., & Paetzold, R. (2000). The resource dependence role of corporate
directors: Strategic adaptation of board composition in response to environmental change.
Journal of Management Studies, 37, 235–256.
Hillman, A., Keim, G., & Luce, R. (2001). Board composition and stakeholder performance: Do
stakeholder directors make a difference? Business & Society, 40, 295–314.
Hillman, A., Zardkoohi, A., & Bierman, L, (1999). Corporate political strategies and firm
performance: Indications of firm-specific benefits from personal service in the US
government. Strategic Management Journal, 20, 67–82.
Hoskisson, R. E., Johnson, R. A., & Moesel, D. D. (1994). Corporate divestiture intensity in
restructuring firms: Effects of governance, strategy, and performance. Academy of
Management Journal, 37(5), 1207–1251.
Huse, M. (2007). Boards, governance and value creation: The human side of corporate
governance. New York: Cambridge University Press.
Huson, M., Parrino, R., & Starks, L. (2001). Internal monitoring mechanisms and CEO turnover:
A long-term perspective. Journal of Finance, 56, 2265–2297.
Institute of Directors in Southern Africa (IOD). (1994; 2002; 2009). King Report on Corporate
Governance for South Africa. Retrieved from http://www.iodsa.co.za/corporate.htm.
Accessed 1-9 November 2013.
Institute of Directors in Southern Africa (IOD) (2012). Practice Notes King III Chapter 1 to 9:
The integrated report. Parktown: IOD.

95
Jensen, M. (1993). The modern industrial revolution, exit and the failure of internal control
systems. Journal of Finance, 8, 831–880.
Jensen, M., & Meckling, W. (1976). Theory of the firm: Managerial behaviour, agency costs and
ownership structure. Journal of Financial Economics, 3, 305–360.
John, K., & Senbet, L.W. (1998). Corporate governance and board effectiveness. Journal of
Banking & Finance, 22(4) 371-403
Johnson, J., Daily, C., & Ellstrand, A. (1996). Boards of directors: A review and research
agenda. Journal of Management, 22, 409–438.
Johnson, R., & Greening, D. (1999). The effects of corporate governance and institutional
ownership on corporate social performance. Academy of Management Journal, 42, 564–
580.
Jonsson, F. I. (2005). The role model of the board: A preliminary study of the roles of Iceland
board. Corporate Governance: An International Review, 13(5), 710–717
Judge, W., & Zeithaml, C. (1992). Institutional and strategic choice perspectives on board
involvement in the strategic decision process. Academy of Management Journal, 35, 750–
794.
Julyan, F., & Nel, C. (2003). Managerial accounting, Volume 1. Centurion: Imprenta.
Kaymark, T., & Bektas, E. (2008). East meets west? Board characteristics in an emerging
market: Evidence from Turkish banks. Corporate Governance: An International Review,
16(6), 550–561.
Keasey, K., Thompson, S., & Wright, M. (1997). Introduction: The corporate governance
problem-competing diagnoses and solutions. In K. Keasey, S. Thompson & M. Wright
(Eds), Corporate governance: Economics, management, and financial issues. Oxford,
UK: Oxford University Press.
Klein, A. (1998). Firm performance and board committee structure. Journal of Law and
Economics, 41, 137–165.
Krivogorsky, V. (2006). Ownership, board structure and performance in continental Europe.
International Journal of Accounting, 41(2), 176–197.
Kyereboah-Coleman, A. (2005). The link between corporate governance and the performance of
the non-traditional export sector: Evidence from Ghana. Working Paper, UGBS, Legon.
Kyereboah-Coleman, A., & Biekpe, N. (2005). Corporate governance and the performance of
microfinance institutions (MFIs) in Ghana. Working paper, UGBS, Legon.
96
Labie, M. (2001). Corporate governance in microfinance organisations: A long and winding
road. Management Decision, 39(4), 296–302.
Leedy, P. D., & Ormrod, J. E. (2005). Practical research: Planning and design. Harlow, UK:
Pearson.
Leedy, P. D., & Ormrod, J. E. (2010). Practical research: Planning and design. Upper Saddle
River, NJ: Merril Pearson Education.
Lipton, M. & Lorsch, J. (1992). A modest proposal for improved corporate governance, Business
Lawyer, 1, 59–77.
Lorsch, J., & Maclver, E. (1989). Pawns or potentates: The reality of America's corporate boards.
Cambridge, MA: Harvard Business School Press.
Luan, C. J., & Tang, M. J. (2007). Where is independent director efficacy? Corporate
Governance: An International Review, 15(4), 636–643.
Luoma, P., & Goodstein, J, (1999). Stakeholders and corporate boards: Institutional influences
on board composition and structure. Academy of Management Journal, 42, 553–563.
MacAvoy, P. W., & Millstein, I. M. (1999). The active board of directors and its effect on the
performance of the large publicly traded corporation. Journal of Applied Corporate
Finance, 11(4), 8–20.
Mace, M. (1971). Directors: Myth and reality. Boston, MA: Harvard Business School Press.
Mak, Y.T. & Li, Y. (2001). Determinants of Corporate Ownership and Board Structure:
Evidence from Singapore, 71 Journal of Corporate Finance. 235
Malherbe, S., & Segal, N. (2001). Corporate governance in South Africa. OECD Development
Center.
McConnell, J. (2002). Outside directors. Keynote address to Annual Meeting of Eastern Finance
Association.
McConnell, J.J., & Servaes, H. (1990). Additional evidence on equity ownership and corporate
value. Journal of Financial economics, 27(2), 595-612
Metrick, A., & Ishii J. (2002). Firm level corporate governance. Global Corporate Governance
Forum, Research Network
Miller, H. (1993). Corporate governance in chapter 11: The fiduciary relationship between
directors and stockholders of solvent and insolvent corporations. Seton Hall Law Review,
23, 1467–1515.

97
Mintzberg, H. (1983). Power in and around organisations. Engelwood Cliffs, NJ: Prentice-Hall.
Mitchell Williams, S. (2000). Association between gender and colour diversity of board structure
on the intellectual capital performance of publicly listed companies from an emerging
economy: Evidence from South Africa. Working Paper, University of Calgary, Canada.
Mizruchi, M. (1983). Who controls whom? An examination between management and boards of
directors in large American corporations. Academy of Management Review, 8, 426–435.
Mizruchi, M., & Stearns, L. (1988). A longitudinal study of the formation of interlocking
directorates. Administrative Science Quarterly, 33, 194–210.
Mizruchi, M., & Stearns, L. (1994). A longitudinal study of borrowing by large American
corporations. Administrative Science Quarterly, 39, 118–140.
Mizruchi, M. S. (2004). Berle and Means revisited: The governance and power of large US
corporations. Theory and Society, 33(5), 579–617.
Montgomery, D. C., Peck, E. A., & Vining, G. G. (2006). Introduction to linear regression
analysis (4th ed.). Hoboken, NJ: John Wiley.
Morck, R. Shleifer, A., & Vishny, R.W. (1988). Management ownership and market valuation.
An emperical analysis. Journal of financial Economics, 20, 293-315
Muth, M., & Donaldson, L. (1998). Stewardship theory and board structure: A contingency
approach. Corporate Governance: An International Review, 6(1), 5–28.
Nicholson, G. J., & Kiel, G. C. (2003). Board composition and corporate performance: How the
Australian experience informs contrasting theories of corporate governance. Corporate
Governance: An International Review, 11(3), 189–205.
Nicholson, G. J., & Kiel, G. C. (2007). Can directors impact performance? A case-based test of
three theories of corporate governance. Corporate Governance: An International Review,
15(4), 585–608.
Pablo, A., Valentin, A., & Felix, L. (2005). Corporate boards in OECD countries: Size,
composition, functioning and effectiveness. Journal of Corporate Governance, 13(2),
197–210.
Palmer, D. (1983). Broken ties: Interlocking directorates and intercorporate coordination.
Administrative Science Quarterly, 28, 40–55.
Panasian, C., Prevost, A. K., & Bhabra, H. S. (2008). “Voluntary listing requirements and
corporate performance: The case of the Dey Report and publicly listed Canadian firms,”
The Financial Review, 43, 129-157
98
Pearce, J., & Zahra, S. (1992). Board composition from a strategic contingency perspective.
Journal of Management Studies, 29, 411–438.
Pitcher, P., Chreim, S., & Kisfalvi, V. (2000). CEO succession research: Methodological bridges
over troubled waters. Strategic Management Journal, 21, 625–648.
Pfeffer, J. (1972). Size and composition of corporate boards of directors: The organization and
its environment. Administrative Science Quarterly, 17, 218–228.
Pfeffer. J. (1991). Organizational theory and structural perspectives on management. Journal of
Management, 17, 789–803.
Pfeffer, J., & Salancik, G. (1978). The external control of organizations: A resource-dependence
perspective. New York: Harper & Row.
Rashid, A. (2011). Board composition, board leadership structure and firm performance:
Evidence from Bangladesh. A paper for inclusion in the Accounting and Finance
Association Australia and New Zealand Annual Conference Adelaide, 5–7 July.
Rashid, A., De Zoysa, A., Lodh, S., & Rudkin, K. (2010). Board composition and firm
performance: Evidence from Bangladesh. Australasian Accounting Business and Finance
Journal, 4(1), 76–95.
Rechner, P. L., & Dalton, D. R. (1986). Board composition and shareholders wealth: An
empirical assessment. International Journal of Management, 3(2), 86–92.
Republic of South Africa, (2008). Companies Act. Government Gazette. (No. 71 of 2008).
SAICA Legislation handbook. Durban: LexisNexis.
Rindova, V. (1999). What corporate boards have to do with strategy: A cognitive perspective.
Journal of Management Studies, 36, 953–975.
Roelofse, A. (2013). SA on the cusp of a major tourism boom. Business partners investing in
entrepreneurs. Retrieved from http://www.businesspartners.co.za/knowledge-hub-
cat/media-room/posts/sa-on-the-cusp-of-a-major-tourism-boom-1300. Accessed 26 May
2014.
Rosenstein, S., & Wyatt, J. (1994). Shareholder wealth effects when an officer of one
corporation joins the board of directors of another. Managerial and Decision Economics,
15, 317–327.
Rossouw, G. J. (2005). Business ethics and corporate governance in Africa. Business & Society,
44(1), 94–106.
Ryan, B., Scapens, R., & Theobald, M. (2002). Research method and methodology in finance
and accounting (2nd ed.). London: Thomson.

99
Sahin, K., Basfirinci, C. S., & Ozsalih, A. (2011). The impact of board composition on corporate
financial and social responsibility performance: Evidence from public-listed companies
in Turkey. African Journal of Business Management, 5(7), 2959–2978.
Sanda, A., Garba, T., & Mikailu, A. S. (2011). Board independence and firm financial
performance: Evidence from Nigeria (No. RP_213). African Economic Research
Consortium, Nairobi Kenya.
Selznick. P. (1949). TVA and the grass roots: A study of the sociology of formal organizations.
New York: Harper & Row.
Sheather, S. J. (2009). A modern approach to regression with R. Texas: Springer.
Singh, J., House, R., & Tucker, D. (1986). Organizational change and organizational mortality.
Administrative Science Quarterly, 31, 171–193.
Siriwardhane, P. (2003). Broadening the boardroom: Corporate governance and company
performance in Sri Lanka. Retrieved November 20, 2014 from
Solomon, J. F. (2010). Corporate governance and accountability (3rd ed.). West Sussex, UK:
John Wiley.
Statistics South Africa. (2012). Codes and classifications. Retrieved November 2013 from
http://www.statssa.gov.za/additional_services/code_lists.asp
Thomas, L., Burnham, K. P., & Buckland, S. T. (2004). Temporal inferences from distance
sampling surveys. In S. T. Buckland, D. R. Anderson, K. P. Burnham, J. L. Laake, D. L.
Borchers, & L. Thomas (Eds), Advanced distance sampling (pp. 71–107). Oxford:
Oxford University Press.
Trochim, W. M. (2006). Deduction and induction: Deductive and inductive thinking. Retrieved
from http://www.socialresearchmethods.net/kb/dedind.php. Accessed 14 November 2013
US SEC (US Securities and Exchange Commission). (2001). Final Rule RIN 323S-AH75.
Useem, M. (1984). The inner circle: Large corporations and the rise of business political activity
in the US and UK. New York: Oxford University Press,
Vafas, N., & Theodorou, E. (1998). The relationship between board structure and firm
performance in the UK. The British Accounting Review, 30, 383–407.
Van Staden, C. J. (1998). The usefulness of the value added statement in South Africa. Faculty
of Economic and Management Sciences, University of Pretoria, Pretoria.

100
Vaughn, M., & Ryan, L. V. (2006). Corporate governance in South Africa: A bellwether for the
continent? Corporate Governance: An International Review, 14(5), 504–512.
Wagner, J. A., Stimpert, J., & Fubara, E. (1998). Board composition and organizational
performance: Two studies of insider/outsider effects. Journal of Management Studies, 35,
655–677.
Wang, J., & Dewhirst, H.D. (1992). Boards of Directors and stakeholder orientation. Journal of
Business Ethics, 11(2), 115-123
Wegner, T. (2001). Applied business statistics: Methods and applications. Cape Town: Juta.
Weisbach, M. (1988). Outside directors and CEO turnover. Journal of Financial Economics, 20,
431–460.
Welman, J. C., & Kruger, S. J. (2001). Research methodology for the business and
administrative sciences. Cape Town: Oxford University Press.
Wernerfelt, B. (1984). A resource-based view of the firm. Strategic Management Journal, 5,
171–180.
West, A. (2006). Theorising South Africa’s corporate governance. Journal of Business Ethics,
68(4), 433–448.
Westphal, J. (1999). Collaboration in the boardroom: Behavioural and performance
consequences of CEO-board social ties. Academy of Management Journal, 42, 7–25.
Williamson, O. (1984). Corporate governance. Yale Law Journal, 93, 1197–1229.
Wu, Y. (2003). Honey, Calpers shrunk the board! Journal of Corporate Finance, 8, 313–336.
Yermack, D. (1996). Higher market valuation of companies with small board of directors.
Journal of Financial Economics, 40(2), 185–211.
Zahra, S. E., & Pearce, J. (1989). Boards of directors and corporate financial performance: A
review and integrative model. Journal of Management, 15, 291–244.
Zald, M. (1969). The power and functions of boards of directors: A theoretical synthesis,
American Journal of Sociology, 75, 97–111.
Zikmund, W. G. (2003). Business research methods (7th ed.). Ohio: South-Western Cengage
Learning.

101
Table 4.6: Frequencies of performance variables
Statistics
Return on Total Assets
(%)
Return on equity (ROE)
%
Tobin's Q
N
Valid 2330 2123 2369
Missing 39 246 0
Table 4.7: Means and standard deviations
King 3 Indicator
Before to King 3 After to King 3 Total
Operating Rev./Turnover th LCU
Mean 5646666.14 7616055.52 6478563.38
Std. Deviation 14188078.612 17853920.340 15866609.636
Grouped Median 717343.50 1024370.50 833139.00
N 1340 980 2320
Total Assets th LCU
Mean 19171342.00 24838287.89 21565488.97
Std. Deviation 99891328.991 118037357.589 107942720.940
Grouped Median 998929.00 1445404.50 1157952.00
N 1367 1000 2367
Shareholders Funds th LCU
Mean 3346321.69 4981656.28 4037210.83
Std. Deviation 9622065.866 13729557.047 11562734.017
Grouped Median 430019.00 658289.50 516793.00
N 1367 1000 2367
Net Income th LCU
Mean 705641.95 767789.10 731852.06
Std. Deviation 2580016.177 2581055.333 2580090.964
Grouped Median 60241.00 55047.00 59271.50
N 1367 997 2364
Market Cap. th LCU
Mean 8141134.86 10621909.86 9265922.41
Std. Deviation 24447203.787 30890439.596 27576876.903
Grouped Median 906730.69 926780.46 921080.18
N 1173 973 2146
Return on Shareh. Funds (%)
Mean 22.44 9.46 16.96
Std. Deviation 78.641 68.939 74.958
Grouped Median 23.25 14.72 19.18
N 1328 970 2298
Sales th LCU Mean 5137846.37 6793131.26 5851844.73
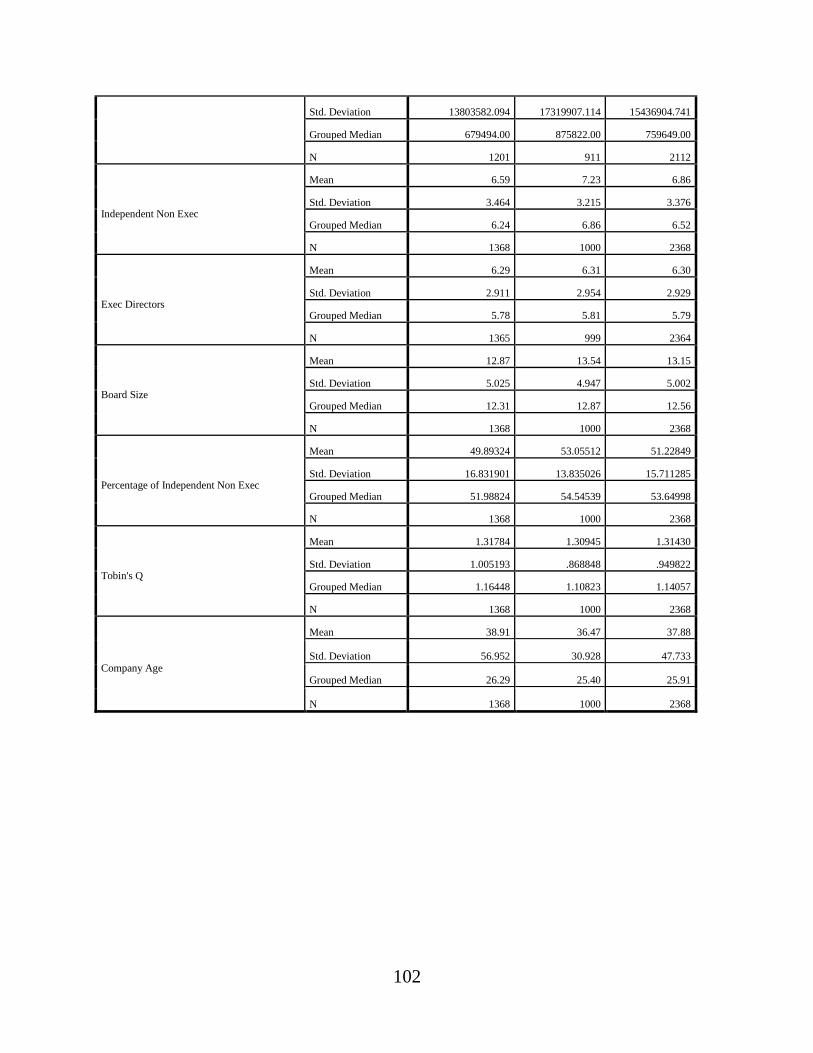
102
Std. Deviation 13803582.094 17319907.114 15436904.741
Grouped Median 679494.00 875822.00 759649.00
N 1201 911 2112
Independent Non Exec
Mean 6.59 7.23 6.86
Std. Deviation 3.464 3.215 3.376
Grouped Median 6.24 6.86 6.52
N 1368 1000 2368
Exec Directors
Mean 6.29 6.31 6.30
Std. Deviation 2.911 2.954 2.929
Grouped Median 5.78 5.81 5.79
N 1365 999 2364
Board Size
Mean 12.87 13.54 13.15
Std. Deviation 5.025 4.947 5.002
Grouped Median 12.31 12.87 12.56
N 1368 1000 2368
Percentage of Independent Non Exec
Mean 49.89324 53.05512 51.22849
Std. Deviation 16.831901 13.835026 15.711285
Grouped Median 51.98824 54.54539 53.64998
N 1368 1000 2368
Tobin's Q
Mean 1.31784 1.30945 1.31430
Std. Deviation 1.005193 .868848 .949822
Grouped Median 1.16448 1.10823 1.14057
N 1368 1000 2368
Company Age
Mean 38.91 36.47 37.88
Std. Deviation 56.952 30.928 47.733
Grouped Median 26.29 25.40 25.91
N 1368 1000 2368

103
Table 4.8: Multicollinearity diagnostics
Correlation coefficient
Array 1 ROE
Array 2 ROA
Calculated
coefficient -0.0689
Variable Inflation Factor Collinearity Diagnostics
Model
Unstandardized
Coefficients B Sig
Correlations
Zero Order Partial Part
Collinearity
Statistics
Tolerance VIF
1 Constant 1.852 0.000
ROA 3.146 0.003 0.425 0.277 0.192 0.580 1.778
ROE 2.387 0.000 0.559 0.343 0.23 0.567 1.716
Total Assets 4.63E-08 0.000 0.383 0.45 0.319 0.879 1.151
DE 0.313 0.001 0.260 0.357 0.281 0.675 1.252
TO-
RATIO 2.58E-02 0.012 0.405 0.248 0.165 0.467 2.120
Eigen Value Collinearity Diagnostics
Model Dimension Eigen Value
Condition
Index
Variance
Proportions
(Constant)
1 1 4.434 1.000 0.01
2 1.135 1.961 0.00
3 1.084 2.075 0.00
4 0.812 2.342 0.00
5 0.760 2.57 0.00
6 0.465 3.171 0.01
7 0.201 4.559 0.11
8 0.108 6.389 0.44
9 0.372 8.324 0.44

104
Appendix 1 – Histograms, P-P plots and scattergrams

105
.
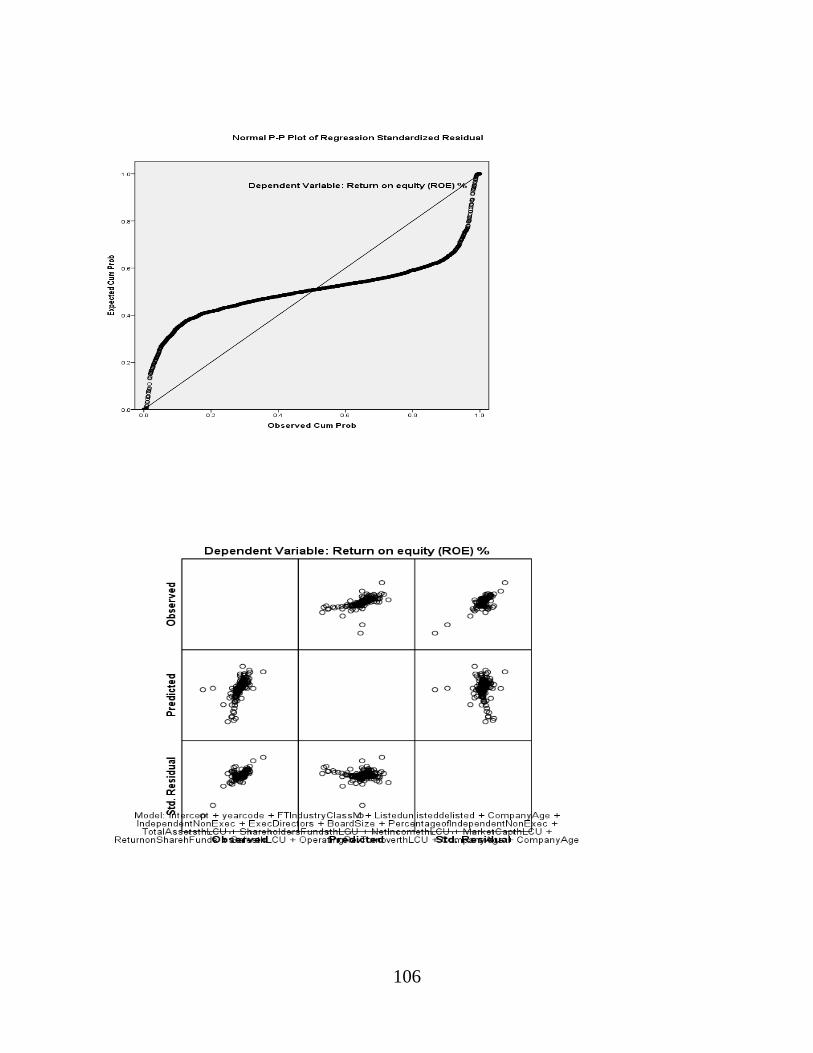
106

107

108
Appendix 2 – Durbin-Watson statistics
Durbin-Watson statistics – Tobin’s Q
Model R R Square Adjusted R
Square
Std. Error of the
Estimate
Durbin-Watson
1 .479a .229 .220 .29985 1.773
Durbin-Watson statistics – ROA
Model R R Square Adjusted R
Square
Std. Error of the
Estimate
Durbin-Watson
1 .701a .491 .485 11.181536 1.910
Durbin-Watson statistics – ROE
Model R R Square Adjusted R
Square
Std. Error of the
Estimate
Durbin-Watson
1 .651a .424 .417 37.813558 1.917


