

The Relationship Between Using Saxon Elementary School Math and Student Performance on Texas Statewide Assessments
June 2006Prepared ByMiriam Resendez, MA, Senior ResearcherSanjeev Sridiharan, PhD, Statistics ConsultantMariam Azin, PhD, President
PRES Associates, Inc.211 E. Broadway, 2nd FloorPO Box 10730Jackson, WY 83002Phone: (307) 733-3255Fax: (307) 733-2017www.presassociates.com
Final Report
Web Version

This page intentionally left blank.
The Relationship Between Using Saxon Elementary School Math and Student Performance on Texas Statewide Assessments 3
The Relationship Between Using Saxon Elementary School Math and Student Performance on Texas Statewide Assessments
Table of Contents
Executive Summary ................................................................................................................................................................... 7
Project Background .................................................................................................................................................................... 9
Project Overview ........................................................................................................................................................................ 9
Design and Methodology ........................................................................................................................................................... 9
Samples ............................................................................................................................................................................. 10
Settings .............................................................................................................................................................................. 12
Curricula ........................................................................................................................................................................... 14
Summary of Findings .............................................................................................................................................................. 15
Detailed Results ....................................................................................................................................................................... 16
1. Does math performance improve as a result of participation in Saxon Elementary Math? .................................. 16
2. Is Saxon Elementary Math associated with improvements for various subgroups? .............................................. 19
3. How does student achievement in math differ across users and nonusers of Saxon Elementary Math? ............. 22
Summary .................................................................................................................................................................................. 26
Limitations ........................................................................................................................................................................ 27
References ................................................................................................................................................................................ 28
Appendix: Statistical Background and Tables of Results ...................................................................................................... 29

Table of Figures and Tables
Figures
Figure 1. Map of Study Sites ................................................................................................................................................... 13
Figure 2. Percent of Schools by Grade Level in Which Saxon Math Program Was Used ................................................... 14
Figure 3. Saxon Students’ TAAS Texas Learning Index Growth (3rd-5th) .......................................................................... 16
Figure 4. Saxon Students’ TAKS Math Scale Score Growth (3rd-5th) ................................................................................. 16
Figure 5. Saxon Students’ TAAS Texas Learning Index Growth by Level of School’s Exposure to Saxon Math .............. 17
Figure 6. Saxon Students’ TAKS Math Scale Score Growth by Level of School’s Exposure to Saxon Math ..................... 17
Figure 7. Modeled Student TAAS Math Performance Before and After School Began Using Saxon Math ...................... 18
Figure 8. Modeled Student TAKS Math Performance Before and After School Stopped Using Saxon Math ................... 19
Figure 9. Saxon Students’ TAAS Texas Learning Index Growth by Ethnicity .................................................................... 19
Figure 10. Saxon Students’ TAAS Texas Learning Index Growth by Economic Disadvantage ......................................... 20
Figure 11. Saxon Students’ TAAS Texas Learning Index Growth by Title I Participation ................................................ 20
Figure 12. Saxon Students’ TAAS Texas Learning Index Growth by Limited English Proficiency Status ....................... 20
Figure 13. Saxon Students’ TAAS Texas Learning Index Growth by At-Risk Status ......................................................... 20
Figure 14. Saxon Students’ TAAS Texas Learning Index Growth by Gender ..................................................................... 21
Figure 15. Saxon Students’ TAAS Texas Learning Index Growth by Special Education Status ....................................... 21
Figure 16. Saxon Students’ TAKS Scale Score Growth by Ethnic Status ........................................................................... 21
Figure 17. Performance on TAAS TLI and Percent of Objectives Mastered Between Saxon and Non-Saxon Students (Cohort Analysis) ........................................................................................................................... 23
Figure 18. Change in Performance on TAAS TLI and Percent of Objectives Mastered Following Exposure to Saxon Compared to No Exposure (Non-Saxon) ................................................................................................ 23
Figure 19. Average TAKS Math Scale Score of Special Education and At-Risk Students by Group and Time ................ 25
Figure 20. Average TAKS Math Scale Score of Non-White, Title I, and Economically Disadvantaged Students by Group and Time .................................................................................................................................................................. 25
Figure 21. TAAS Performance Between Saxon and Non-Saxon Students by Program Type Across all Grade Levels ........................................................................................................................................................... 26
Tables
Table 1. TAAS Sample 1 Cohorts (Sample Size) .................................................................................................................... 11
Table 2. TAAS Sample 1 School and Statewide Average Demographic Characteristics (Based on Elementary Grades in 1998–1999) ........................................................................................................................ 11
Table 3. TAKS Sample 2 Sample Size .................................................................................................................................... 12
Table 4. TAKS Sample 2 School and Statewide Average Demographic Characteristics (Based on Elementary Grades in 2002–2003) ........................................................................................................................ 12
Table 5. Number of Schools and Percent of Students Within Schools Using Saxon by Type of Saxon Textbook .............. 14
Table 6. Percent Correct on TAKS Math Objectives by Group and Grade Level ............................................................... 24

The Relationship Between Using Saxon Elementary School Math and Student Performance on Texas Statewide Assessments 5
Appendix: Statistical Background and Tables of Results
Statistical Background ..............................................................................................................................................................29
Table A1. HLM Results for Sample 1-All Cohorts’ Performance on TAAS Math Texas Learning Index (Growth by Cohort) ....................................................................................................................................................................32
Table A2. HLM Results for Sample 1-All Cohorts’ Performance on TAAS Math Texas Learning Index (Growth) ......................................................................................................................................................................................32
Table A3. HLM Results for Sample 2- Performance on TAKS Math Scale Score (Growth) ................................................32
Table A4. HLM Results for Sample 1- All Cohorts’ Performance on TAAS Math Texas Learning Index (Growth by School Exposure) ....................................................................................................................................................33
Table A5. HLM Results for Sample 2-Performance on TAKS Math Scale Score (Growth by School Exposure) ................33
Table A6. HLM Results for Sample 1- All Cohorts’ Performance on TAAS Math Texas Learning Index (Growth by Pre-Post Saxon Exposure) .....................................................................................................................................33
Table A7. HLM Results for Sample 2-Performance on TAKS Math Scale Score (Growth by Pre-Post Saxon Exposure) .....................................................................................................................................33
Table A8. HLM Results for Sample 1-All Cohort’s Performance on TAAS Math Texas Learning Index (Growth by Subgroup) ...............................................................................................................................................................34
Table A9. HLM Results for Sample 2-Performance on TAKS Math Scale Score (Growth by Subgroups) ..........................35
Table A10. HLM Results for TAAS Main Effects Analysis (Longitudinal) ..........................................................................36
Table A11. HLM Results for TAKS Main Effects Analysis (Longitudinal) ...........................................................................37
Table A12. MANCOVA Results for TAAS Cohort Analysis ....................................................................................................37
Table A13. HLM Results for Sample 1-Growth on TAAS TLI by Pre-Post Saxon Exposure (Includes Control Schools) .........................................................................................................................................................38
Table A14. HLM Results for Sample 1-Growth on TAAS Percent of Objectives Mastered by Pre-Post Saxon Exposure (Includes Control Schools) .........................................................................................................38
Table A15. Subgroup Saxon Effects for TAKS dataset ...........................................................................................................38
Table A16. Subgroup Effects for TAAS TLI Math for 97-99 Cohort .....................................................................................39
Table A17. Subgroup Effects for TAAS TLI Math for 98-00 Cohort .....................................................................................40
Table A18. Subgroup Effects for TAAS TLI Math for 99-01 Cohort ......................................................................................41

This page intentionally left blank.
The Relationship Between Using Saxon Elementary School Math and Student Performance on Texas Statewide Assessments 7
Executive SummaryPRES Associates, an external, independent educational research firm with over 15 years of experience in applied educational research and evaluation, conducted analyses using archival data on the effectiveness of the Saxon Elementary Math program in the state of Texas. The purpose of this report is to present the results of statistical analyses conducted on existing Texas state assessment data in order to evaluate the effectiveness of the Saxon Math program in helping Texas elementary school students attain vital math skills.
Major findings arranged by evaluation questions include the following:
1. Does math performance improve as a result of participation in Saxon Elementary Math?
• Saxon students showed significant growth in TAAS and TAKS math performance from third to fifth grade.
• Growth in math among Saxon students is not dependent on how long a school has used the program. Therefore, students in schools that had only implemented the Saxon program for 1 year showed the same rates of growth as schools that had implemented the program for 5 or more years.
• Elementary students showed a significant increase in TAAS math performance after their schools began using Saxon Math as compared to their performance prior to Saxon implementation.
2. Is Saxon Elementary Math associated with improvements for various subgroups?
• Among Saxon students, there was a closing of the achievement gap between Hispanics and Whites, African Americans and Whites, economically disadvantaged and not, Title I participants and non-participants, Limited English Proficiency (LEP) students and non-LEP, and at-risk students and non–at risk as measured by the TAAS.
3. How does student achievement in math differ across users and non-users of Saxon Elementary Math?
• Longitudinal analysis of math performance growth from third to fifth grade showed no significant differences between Saxon and non-Saxon students as measured by the TAKS and TAAS math tests.
• Analysis of the average math performance of third, fourth, and fifth graders respectively showed significant differences between Saxon and non-Saxon students. Saxon students had higher TAAS test scores than non-Saxon students at each grade level.
• Among students in schools that had baseline data prior to adopting Saxon Math, there was a significant increase in TAAS test scores following exposure to Saxon. The increase in test scores was significantly higher than projected scores for students that never used Saxon.
• While comparisons between Saxon and non-Saxon users showed in differences in student performance in favor of Saxon use, examination of the effect sizes shows that overall program effects were in the small range (d = .01 to .24). However, it should be noted this is to be expected in any type of study evaluating entire curricula against one another; after all, math curricula within the same grade levels teach similar mathematical concepts (e.g., addition, subtraction, etc.). It must be emphasized that such overlap between curricula will reduce effect sizes. Nevertheless, these estimates are below the threshold for educational significance.
• Exploratory information indicates that special education, at-risk, non-Whites, Title I, and economically disadvantaged Saxon students had higher TAKS math growth rates than non-Saxon students who were in these subpopulations.
• Preliminary information also indicates that the average math performance of Saxon students was significantly higher than non-Saxon students who used a basal or investigative curriculum.

8 Final Report
In addition, a number of findings among Texas elementary school students are consistent with those found in prior Saxon Archival studies conducted in middle schools in Texas and elementary and middle schools in Georgia. Similar to the results found in these studies (a) there was growth in math performance among Saxon students; (b) the number of years a school had been exposed to Saxon was not related to math growth; and (c) there was an increase in test scores following exposure to Saxon Math. The fact that the findings in this elementary study on Saxon Math replicates what has been found in other research studies increases confidence in the validity of the results and speaks towards the generalizability of findings across multiple states and student populations.
The Relationship Between Using Saxon Elementary School Math and Student Performance on Texas Statewide Assessments �
Project Background
Our students must acquire efficient math skills that are critical to
understanding the workplace that will exist in their adulthood.
-Texas Governor Rick Perry
According to the 2003 Trends in International Mathematics and Science Study (Mullis, Martin, Gonzalez, & Chrostowski, 2004) report, U.S. fourth-graders ranked 12th out of 24 other participating countries in terms of mathematics ability. More recently, results from the 2005 National Assessment of Educational Progress showed that 65% of the nation’s fourth graders were at a basic or below basic math proficiency level. Such statistics are troublesome since the establishment of a strong foundation of math skills early on is critical to students’ future participation in higher level math courses as well as their academic success (Griffin, Case & Siegler, 1994). Furthermore, strong mathematics skills are needed for students to succeed in their future employment.
The biggest industry and the smallest of businesses, even the service professions,
need people with mathematical and scientific understanding and skills vastly different from those needed as little as a
decade ago. No longer is shopkeeper math or a little general biology sufficient to meet
the demands of living and working in a technology-driven information age
(Shafer & Foster, 1997, p. 1).
Children’s performance at the end of elementary school is an important predictor of their ultimate educational success (National Research Council, 2001). As such, programs that can help in the development of such skills need to be looked at carefully to determine the extent to which they help students attain these important skills. The Saxon Elementary School Math program
is based upon well-established cognitive and learning research and promises to be one of these effective interventions.
The No Child Left Behind Act of 2001 mandates that educational materials purchased with public funds must be proven by scientific research to improve student achievement in the classroom. To examine the effectiveness of the Saxon Elementary Math program, PRES Associates, an external, independent educational research firm with over 15 years of experience in applied educational research and evaluation, conducted analyses using archival student assessment data from the state of Texas.
Project OverviewThe purpose of this report is to present the results of statistical analyses conducted on existing Texas state assessment data in order to evaluate the effectiveness of the Saxon Elementary School Math programs in helping Texas elementary school students attain critical math skills. Specifically, the analyses were designed to address the following key evaluation questions:
1. Does math performance improve as a result of participation in Saxon Elementary Math?
2. Is Saxon Elementary Math associated with improvements for various subgroups?
3. How does student achievement in math differ across users and nonusers of Saxon Elementary Math?
Design and MethodologyA quasi-experimental design was used to evaluate the Saxon Math program in Texas elementary schools. In order to address these evaluation questions, it was determined that hierarchical linear modeling (HLM) and multivariate analysis of covariance (MANCOVA) would be most appropriate. Based on these selected analyses, samples of students were requested from the Texas Education Agency. A detailed description of the samples and measures used follows.
10 Final Report
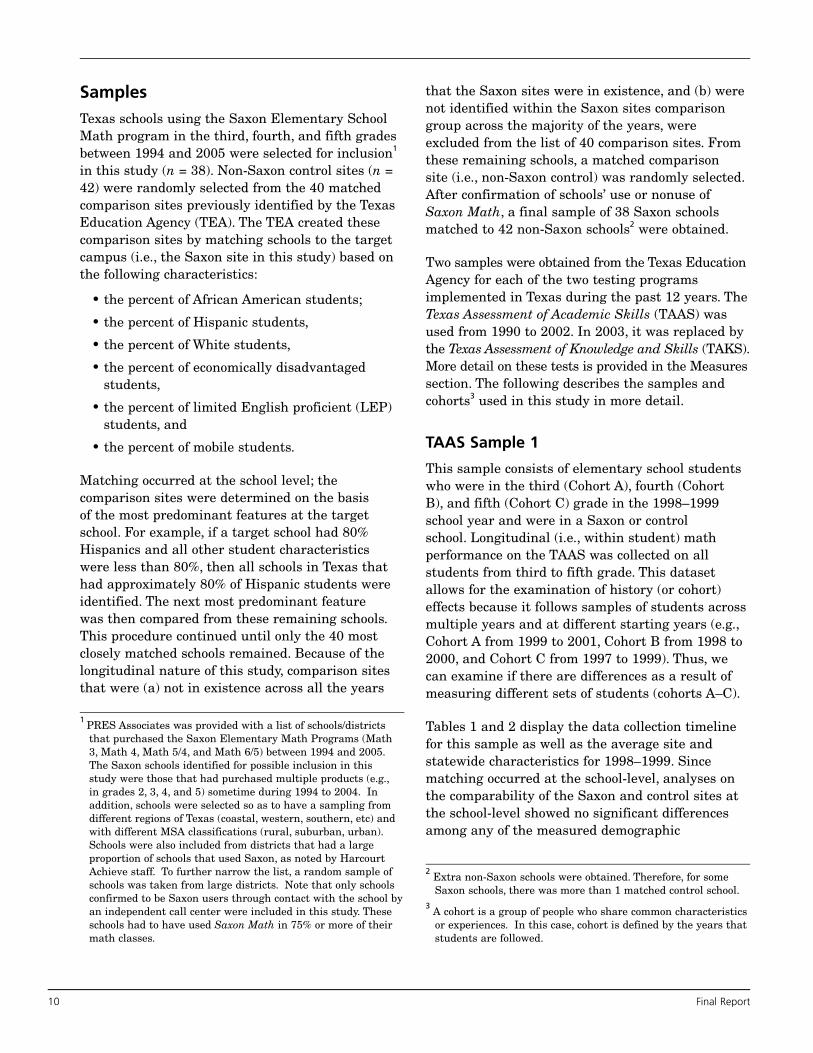
SamplesTexas schools using the Saxon Elementary School Math program in the third, fourth, and fifth grades between 1994 and 2005 were selected for inclusion1 in this study (n = 38). Non-Saxon control sites (n = 42) were randomly selected from the 40 matched comparison sites previously identified by the Texas Education Agency (TEA). The TEA created these comparison sites by matching schools to the target campus (i.e., the Saxon site in this study) based on the following characteristics:
• the percent of African American students;
• the percent of Hispanic students,
• the percent of White students,
• the percent of economically disadvantaged students,
• the percent of limited English proficient (LEP) students, and
• the percent of mobile students.
Matching occurred at the school level; the comparison sites were determined on the basis of the most predominant features at the target school. For example, if a target school had 80% Hispanics and all other student characteristics were less than 80%, then all schools in Texas that had approximately 80% of Hispanic students were identified. The next most predominant feature was then compared from these remaining schools. This procedure continued until only the 40 most closely matched schools remained. Because of the longitudinal nature of this study, comparison sites that were (a) not in existence across all the years
that the Saxon sites were in existence, and (b) were not identified within the Saxon sites comparison group across the majority of the years, were excluded from the list of 40 comparison sites. From these remaining schools, a matched comparison site (i.e., non-Saxon control) was randomly selected. After confirmation of schools’ use or nonuse of Saxon Math, a final sample of 38 Saxon schools matched to 42 non-Saxon schools2 were obtained.
Two samples were obtained from the Texas Education Agency for each of the two testing programs implemented in Texas during the past 12 years. The Texas Assessment of Academic Skills (TAAS) was used from 1990 to 2002. In 2003, it was replaced by the Texas Assessment of Knowledge and Skills (TAKS). More detail on these tests is provided in the Measures section. The following describes the samples and cohorts3 used in this study in more detail.
TAAS Sample 1
This sample consists of elementary school students who were in the third (Cohort A), fourth (Cohort B), and fifth (Cohort C) grade in the 1998–1999 school year and were in a Saxon or control school. Longitudinal (i.e., within student) math performance on the TAAS was collected on all students from third to fifth grade. This dataset allows for the examination of history (or cohort) effects because it follows samples of students across multiple years and at different starting years (e.g., Cohort A from 1999 to 2001, Cohort B from 1998 to 2000, and Cohort C from 1997 to 1999). Thus, we can examine if there are differences as a result of measuring different sets of students (cohorts A–C).
Tables 1 and 2 display the data collection timeline for this sample as well as the average site and statewide characteristics for 1998–1999. Since matching occurred at the school-level, analyses on the comparability of the Saxon and control sites at the school-level showed no significant differences among any of the measured demographic
2 Extra non-Saxon schools were obtained. Therefore, for some Saxon schools, there was more than 1 matched control school.
3 A cohort is a group of people who share common characteristics or experiences. In this case, cohort is defined by the years that students are followed.
1 PRES Associates was provided with a list of schools/districts that purchased the Saxon Elementary Math Programs (Math 3, Math 4, Math 5/4, and Math 6/5) between 1994 and 2005. The Saxon schools identified for possible inclusion in this study were those that had purchased multiple products (e.g., in grades 2, 3, 4, and 5) sometime during 1994 to 2004. In addition, schools were selected so as to have a sampling from different regions of Texas (coastal, western, southern, etc) and with different MSA classifications (rural, suburban, urban). Schools were also included from districts that had a large proportion of schools that used Saxon, as noted by Harcourt Achieve staff. To further narrow the list, a random sample of schools was taken from large districts. Note that only schools confirmed to be Saxon users through contact with the school by an independent call center were included in this study. These schools had to have used Saxon Math in 75% or more of their math classes.

The Relationship Between Using Saxon Elementary School Math and Student Performance on Texas Statewide Assessments 11
characteristics, p > .05. However, additional analyses of demographic characteristics at the student level did reveal significant differences.4 Specifically, there were more White (49.8% vs. 54.9%), economically disadvantaged (41.9% vs. 47.3%), Title I (40.2% vs. 47.1%), and at-risk (32.4% vs. 21.2%) Saxon students than non-Saxon students.
In addition, there were significantly less Hispanics (27.7% vs. 22.9%) and LEP (12.3% vs. 7.8%) Saxon students than non-Saxon students. These results indicate that it is important to control for these demographic differences in analyses involving comparisons between Saxon and non-Saxon schools.
Analyses were also run to examine if there were school-level differences in the Saxon sample and the statewide elementary school averages, p > .05. Results showed no significant differences among demographic characteristics. This means that the demographic make-up of Saxon schools is comparable to those found statewide.
TAKS Sample 2
This sample consists of elementary students who were in the third grade in the 2002–2003 school year and in a Saxon or control school. Data were also obtained for these same students when they were in the fourth (2003–04) and fifth grades (2004–05). Math performance from the Texas Assessment of Knowledge and Skills (TAKS) for the 2002–2005 school years was collected on all students. Table 3 displays the data collection timeline. In addition, Table 4 displays the average demographic characteristics of the sites and state for the 2002–2003 school year.
Analyses on the comparability of the Saxon and control schools at the school level showed no significant differences among any of the measured demographic characteristics, p > .05. However, similar to the TAAS Sample, there were differences found at the student level on selected demographic variables. There were more African Americans (15.4% vs. 29.6%), economically disadvantaged (59.0% vs. 68.7%), and Title I (74.5% vs. 82.8%) Saxon students than non-Saxon students. In addition, there were significantly less Hispanic (48.5% vs. 40.5%) and White (34.0% vs. 26.5%) Saxon students than non-Saxon students. To reiterate, it will be important to take into account these demographic differences in analyses involving comparisons between Saxon and non-Saxon schools. Further analyses showed no significant differences in the Saxon schools and the statewide elementary school averages on demographic characteristics, p > .05.
Table 1. TAAS Sample 1 Cohorts (Sample Size)G
rou
p
Gra
de
96-9
7
97-9
8
98-9
9
BA
SE Y
EAR
99-0
0
00-0
1
Saxon (schools = 21)
3C
(14��)B
(1626)A
(1701)
4C
(1572)B
(1758)A
(1481)
5C
(16�3)B
(1546)A
(131�)
Non-Saxon Control (schools = 21)
3C
(1423)B
(1723)A
(1�67)
4C
(1518)B
(18�7)A
(1787)
5C
(1655)B
(1741)A
(1604)
4 Chi-square statistics are as follows: ethnicity – χ2
(4) = 40.34, p < .001; economic disadvantage – χ2
(1) = 30.89, p < .001; Title I participation – χ2
(1) = 49.99, p <. 001; LEP – 2χ2(1) = 58.25,
p < .001; at-risk status – χ2(1) = 166.23, p < .00.
Table 2. TAAS Sample 1 School and Statewide Average Demographic Characteristics
(Based on Elementary Grades in 1998–1999)
Site
s
Ave
rag
e En
rollm
ent
% W
hit
e
% H
isp
anic
% A
fric
an A
m
% O
ther
*
%Li
mit
ed
Eng
lish
%Sp
ecia
l Ed
uca
tio
n
% E
con
om
ical
ly
Dis
adva
nta
ged
Mo
bili
ty R
ate
Saxon 504 51 28 18 3 � 12 53 1�
Control 604 45 34 17 4 16 11 53 20
Texas (Elem.)
517 44 3� 15 2 17 12 57 21
* Refers to percentage of students in all other ethnic subgroups (ie. Asian, Pacific Islander, Native American)
No differences between Saxon and non-Saxon schools were observed at the school level. In addition, characteristics of Saxon and non-Saxon schools were similar to those found statewide.

12 Final Report
SettingsFigure 1 displays the geographical location of the sites used in this study. Schools are geographically dispersed and have similar characteristics to those found statewide. Schools came from a mixture of urban, suburban, and rural communities. For confidentiality purposes, the names and exact location of the schools are excluded.
Measures Data were obtained from the Texas Education Agency in order to examine the impact of Saxon Elementary Math on students in the state of Texas. The Texas Assessment of Academic Skills (TAAS)
and the more recent Texas Assessment of Knowledge and Skills (TAKS) are the two statewide exams that have been used by Texas to assess student learning at the end of each school year. The TAAS was used from 1990 to 2002 when TAKS replaced it in the spring of 2003. In 1992, the TAAS transitioned from fall to spring administration. Furthermore, in 1993, the TAAS expanded to include grades 3–8 and the exit level test was moved to the 10th grade. Prior to this, the assessment included grades 3, 5, 7, 9 and 11(exit level). Because of these considerations, the earliest usable data was from the 1993 school year.
Information obtained from the Texas Education Agency indicated that the two tests are not comparable. Therefore, separate analyses are conducted for each test.
The TAAS and TAKS have demonstrated content, construct, and criterion validity. Reliability (i.e., internal consistency) estimates for sixth through eighth grades ranges from .92 to .93 for the TAAS and ranges from .89 to .90 for the TAKS.
The analyses use the following outcome measures:
• TAAS Texas Learning Index (TLI),
• TAKS math scale score,
• TAAS math objectives mastered, and
• percent correct in each TAKS objective.
The TAAS TLI is a statistic5 designed for comparisons between administrations and grades. It is used to determine growth in student performance. A TLI of 70 represents the passing standard (i.e., that a student has met minimum expectations); it has a range of approximately 0–90+. From grade to grade, the intent of this score is to represent the same achievement and effort. For example, a student who scores a 70 as a sixth grader and a 70 as a seventh grader (a TLI difference score of 0) has demonstrated “typical” learning growth from sixth to seventh grade and has held his or her own relative to others in the same grade level. Therefore, a student who scores a higher TLI from one year to the next has shown accelerated (more than typical) learning growth.
5 It is a scaled score anchored at the exit level passing standard of 70 (with a standard deviation of 15) and describes student performance with respect to the 1994 spring student population.
Table 3. TAKS Sample 2 Sample Size
Grade 02-03 03-04 04-05
Saxon Schools (N = 17)
3 1140
4 1062
5 1012
Non-Saxon Schools (N = 21)
3 1783
4 1638
5 1601
Table 4. TAKS Sample 2 School and Statewide Average Demographic Characteristics (Based on
Elementary Grades in 2002–2003)
Site
s
Ave
rag
e En
rollm
ent
% W
hit
e
% H
isp
anic
% A
fric
an A
m.
% O
ther
*
%Li
mit
ed E
ng
lish
%Sp
ecia
l Ed
uca
tio
n
% E
con
om
ical
ly
Dis
adva
nta
ged
Mo
bili
ty R
ate
Saxon 537 24 45 2� 3 21 � 73 23
Control 600 30 52 17 1 27 � 65 20
Texas (6-8) (Elem.)
513 38 44 15 3 1� 11 60 20
* Refers to percentage of students in all other ethnic subgroups (ie. Asian, Pacific Islander, Native American)
No differences between Saxon and non-Saxon schools were observed at the school level. In addition, characteristics of Saxon and non-Saxon schools were similar to those found statewide.

The Relationship Between Using Saxon Elementary School Math and Student Performance on Texas Statewide Assessments 13
�
�
�
�
�
�
�
�
�
�
�
�
�
�
��
��
��
��
�
�
�
�
�
�
�
�
�
��
�
�
*Numbers in black boxes represent the number of Saxon schools in each county. Numbers in blue boxes represent the number of control schools in each county.
Figure 1. Map of Study Sites*

14 Final Report
The TAKS math scale score is a derived score that takes into account the difficulty level of the items within the test and allows direct comparisons of student performance between administrations. The range of the scale score is 1,000–3,200. No math scale score is available for the TAAS.
For the TAAS, information on the number of math objectives a student mastered was obtained. The minimum and maximum number of TAAS math objectives6 a student could have mastered is 0 to 13. For the TAKS, information on student performance (i.e., percent correct) on each math objective was obtained.
Curricula
Saxon Math
In the early 1980s, John Saxon developed a theoretically-based and distributed approach to mathematics instruction, practice, and assessment that has evolved to include a textbook series and a comprehensive approach for K–12 students. At the foundation of the Saxon program is the premise that students learn best if (a) instruction is incremental and explicit; (b) they can continually review previously learned concepts; and (c) assessment is frequent and cumulative. In Saxon Math, new increments of instruction are regularly introduced while, at the same time, students continually review previously introduced math concepts. Such an approach to learning ensures that students truly integrate and retain math concepts rather than forget them as soon as they are no longer exposed to them.
Schools using the Saxon Elementary School Math program used the textbook designated for the grade level taught. For instance, third-grade classrooms used Saxon 3, fourth-grade classrooms used Saxon 4 or Saxon 5/4, and fifth grade classrooms used Saxon 6/5. Table 5 shows the average and range of the percent of students using the Saxon texts at each grade level.
Table 5. Number of Schools and Percent of Students Within Schools Using Saxon
by Type of Saxon Textbook
# of schools
Min. %
Max.%
Mean%
Saxon K 25 25 100 �4.2
Saxon 1 31 25 100 �4.5
Saxon 2 31 25 100 �4.2
Saxon 3 33 75 100 �5.�
Saxon 4-5/4 2� 75 100 �5.3
Saxon 6/5 30 75 100 �6. 3
Figure 2 shows the percent of schools using Saxon Math in all grades from K–5, 1–5, in the upper elementary grades (4–5), or in the lower elementary grades (K–3). As shown, the vast majority of the Saxon schools use the Saxon program in all their elementary grades (K–5).
Control Site Curricula
Approximately 43.6% of control schools used a core basal math curriculum. These curricula typically consist of a chapter-based approach to math instruction. Approximately 35.9% of schools use an investigative approach with an emphasis on making connections among various mathematical topics and between mathematics and problems in other disciplines. The remaining 20.5% used a combination of basal and investigative approaches or other printed material (non–textbook based).
6 Objectives measured are the same across grade levels for the TAAS but, because they are measured by a different set of items with varying levels of difficulty, it is not possible to make comparisons of their performance on each math objective. Therefore, analysis across grade levels focused only on the number mastered.
0
10
20
30
40
50
60
70
Lower Elementary
(K–3)
Upper Elementary
(4–5)
1–5K–5
Perc
ent
Figure 2.Percent of Schools by Grade Level in Which
Saxon Math Program Was Used
62.86%
11.43%14.29%
11.43%
The Relationship Between Using Saxon Elementary School Math and Student Performance on Texas Statewide Assessments 15
Summary of FindingsAnalysis of the data revealed several positive findings in favor of Saxon Elementary School Math among Texas elementary students. Major findings included the following:
1. Does math performance improve as a result of participation in Saxon Elementary Math?
• Saxon students showed significant growth in TAAS and TAKS math performance from third to fifth grade.
• Growth in math among Saxon students is not dependent on how long a school has used the program. Therefore, students in schools that had only implemented the Saxon program for 1 year showed the same rates of growth as schools that had implemented the program for 5 or more years.
• Elementary students showed a significant increase in TAAS math performance after their schools began using Saxon Math as compared to their performance prior to Saxon implementation.
2. Is Saxon Elementary Math associated with improvements for various subgroups?
• Among Saxon students, there was a closing of the achievement gap between Hispanics and Whites, African Americans and Whites, economically disadvantaged and not, Title I participants and nonparticipants, Limited English Proficiency (LEP) students and non-LEP, and at-risk students and non–at risk as measured by the TAAS.
3. How does student achievement in math differ across users and non-users of Saxon Elementary Math?
• Longitudinal analysis of math performance growth from third to fifth grade showed no significant differences between Saxon and non-Saxon students as measured by the TAKS and TAAS math tests.
• Analysis of the average math performance of third, fourth, and fifth graders respectively showed significant differences between Saxon and non-Saxon students. Saxon students had higher TAAS test scores than non-Saxon students at each grade level.
• Among students in schools that had baseline data prior to adopting Saxon Math, there was a significant increase in TAAS test scores following exposure to Saxon. The increase in test scores was significantly higher than projected scores for students that never used Saxon.
• While comparisons between Saxon and non-Saxon users showed in differences in student performance in favor of Saxon use, examination of the effect sizes shows that overall program effects were in the small range (d = .01 to .24). However, it should be noted this is to be expected in any type of study evaluating entire curricula against one another; after all, math curricula within the same grade levels teach similar mathematical concepts (e.g., addition, subtraction, etc.). It must be emphasized that such overlap between curricula will reduce effect sizes. Nevertheless, these estimates are below the threshold for educational significance.
• Exploratory information indicates that special education, at-risk, non-Whites, Title I, and economically disadvantaged Saxon students had higher TAKS math growth rates than non-Saxon students who were in these subpopulations.
• Preliminary information indicates that the average math performance of Saxon students was significantly higher than non-Saxon students who used a basal or investigative curriculum.
What follows is a detailed account of the findings, which are organized by the evaluation questions. Included are the main statistical results and associated statistics. For detailed statistical tables, the reader is referred to the referenced table in the Appendix. Furthermore, effect size (ES) estimates are also included when comparisons are made between Saxon and non-Saxon students7. It should be noted that according to Slavin (1986), a leader in educational research, an effect size of .25 is considered educationally significant.
7 Effect size (ES) is commonly used as a measure of the magnitude of an effect of an intervention relative to a comparison group. It provides a measure of the relative position of one group to another. For example, with a moderate effect size of d = .5, we expect that about 69% of cases in Group 2 are above the mean of Group 1, whereas for a small effect of d = .2 this figure would be 58% and for a large effect of d = .8 this would be 79%.

16 Final Report
Detailed Results
1. Does math performance improve as a result of participation in Saxon Elementary Math?
In order to address this overarching question, three separate analyses were performed; each was designed to address a specific component of this evaluation question.
Is there significant growth in student performance among users of Saxon?
Hierarchical linear modeling (HLM) analysis was conducted on the longitudinal TAAS (from Sample 1) and TAKS data (from Sample 2). Thus, the growth of Saxon students in performance from third to fifth grade on the TAAS Texas Learning Index (TLI) and TAKS math scale score was analyzed. HLM analysis8 revealed that Saxon exposure was related to growth in math performance in grades three through five on both measures, TAAS TLI across all cohorts t(1, 4201) = 14.909 , p < .001, see Figure 3, and TAKS math scale score t(1, 2412) = 5.059 , p < .001, see Figure 4.
Saxon students showed significant growth in TAAS and TAKS math performance
from third to fifth grade.
Because TAAS Sample 1 consists of 3 cohorts of students, analyses were also performed to examine if there were differences in growth by cohort. This would serve as a check for robustness of results across different time points (1997–99, 1998–99, and 1999–2000). Results showed no significant differences in growth by cohorts indicating that growth in this sample was independent of when students were tested, t(1, 4201) = –1.639 , p = .101. This means that the time of testing did not matter.
These findings are consistent with those found in prior archival studies examining the impact of exposure to Saxon Middle School Math in the state
of Texas9 and Saxon Elementary and Middle School Math in the state of Georgia.10 Similar to Texas middle school students and Georgia elementary school students, Texas elementary students show growth in math performance.
64
66
68
70
72
74
76
78
80
5th Grade
4th Grade
3rd Grade
TAA
S TL
I (A
vg.)
Figure 3.Saxon Students’ TAAS Texas Learning Index Growth
(3rd–5th)
73.1
78.4
71.2
2100
2120
2140
2160
2180
2200
2220
2240
5th Grade
4th Grade
3rdGrade
TAK
S M
ath
Sca
le S
core
(A
vg.)
Figure 4.Saxon Students’ TAKS Math Scale Score Growth
(3rd–5th)
2165
2216
2137
8 Detailed results are included in Tables A1–A3 in the Appendix.
9 Report available online at: http://saxonpublishers.harcourtachieve.com/HA/correlations/pdf/s/SXMath_Middle_TX_research_web.pdf
10Report available online at: http://saxonpublishers.harcourtachieve.com/HA/correlations/pdf/s/SXmath_Georgia_web.pdf
The Relationship Between Using Saxon Elementary School Math and Student Performance on Texas Statewide Assessments 17
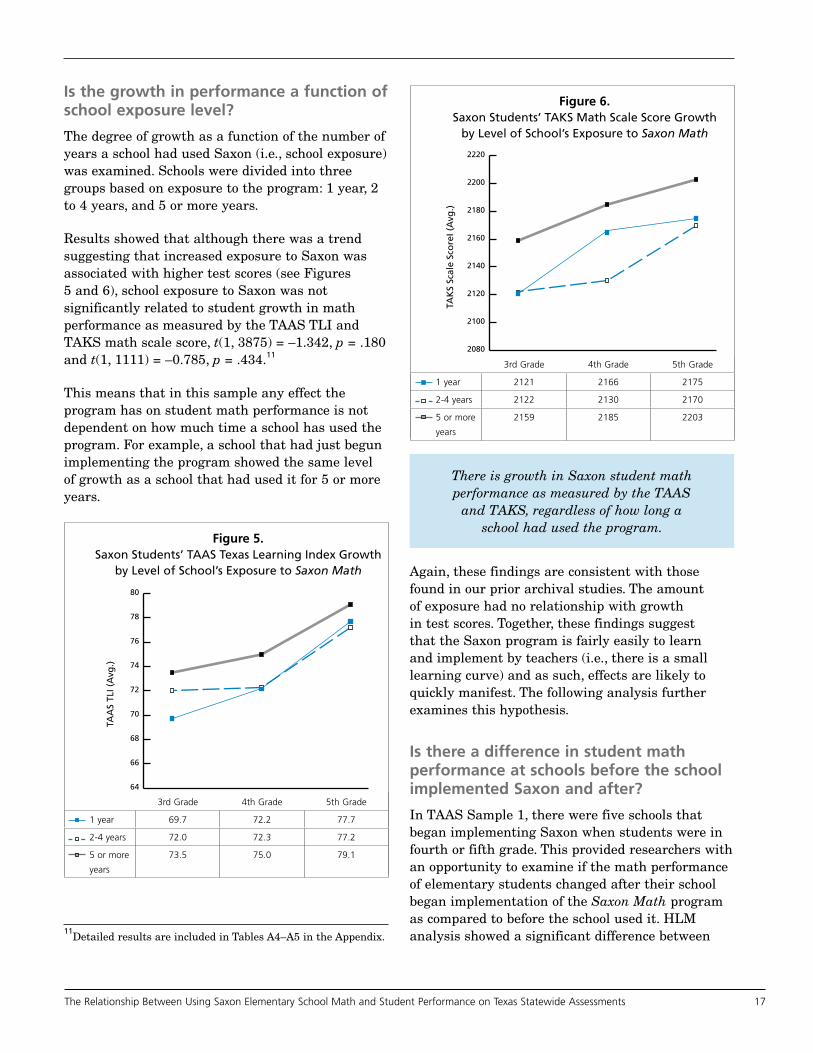
Is the growth in performance a function of school exposure level?
The degree of growth as a function of the number of years a school had used Saxon (i.e., school exposure) was examined. Schools were divided into three groups based on exposure to the program: 1 year, 2 to 4 years, and 5 or more years.
Results showed that although there was a trend suggesting that increased exposure to Saxon was associated with higher test scores (see Figures 5 and 6), school exposure to Saxon was not significantly related to student growth in math performance as measured by the TAAS TLI and TAKS math scale score, t(1, 3875) = –1.342, p = .180 and t(1, 1111) = –0.785, p = .434.11
This means that in this sample any effect the program has on student math performance is not dependent on how much time a school has used the program. For example, a school that had just begun implementing the program showed the same level of growth as a school that had used it for 5 or more years.
There is growth in Saxon student math performance as measured by the TAAS
and TAKS, regardless of how long a school had used the program.
Again, these findings are consistent with those found in our prior archival studies. The amount of exposure had no relationship with growth in test scores. Together, these findings suggest that the Saxon program is fairly easily to learn and implement by teachers (i.e., there is a small learning curve) and as such, effects are likely to quickly manifest. The following analysis further examines this hypothesis.
Is there a difference in student math performance at schools before the school implemented Saxon and after?
In TAAS Sample 1, there were five schools that began implementing Saxon when students were in fourth or fifth grade. This provided researchers with an opportunity to examine if the math performance of elementary students changed after their school began implementation of the Saxon Math program as compared to before the school used it. HLM analysis showed a significant difference between 11
Detailed results are included in Tables A4–A5 in the Appendix.
64
66
68
70
72
74
76
78
80
5th Grade
4th Grade
3rd Grade
TAA
S TL
I (A
vg.)
Figure 5.Saxon Students’ TAAS Texas Learning Index Growth
by Level of School’s Exposure to Saxon Math
3rd Grade 4th Grade 5th Grade
1 year 6�.7 72.2 77.7
2-4 years 72.0 72.3 77.2
5 or more
years
73.5 75.0 7�.1
2080
2100
2120
2140
2160
2180
2200
2220
5th4th3rd
TAK
S Sc
ale
Sco
reI (
Avg
.)
Figure 6.Saxon Students’ TAKS Math Scale Score Growth
by Level of School’s Exposure to Saxon Math
3rd Grade 4th Grade 5th Grade
1 year 2121 2166 2175
2-4 years 2122 2130 2170
5 or more
years
215� 2185 2203
18 Final Report
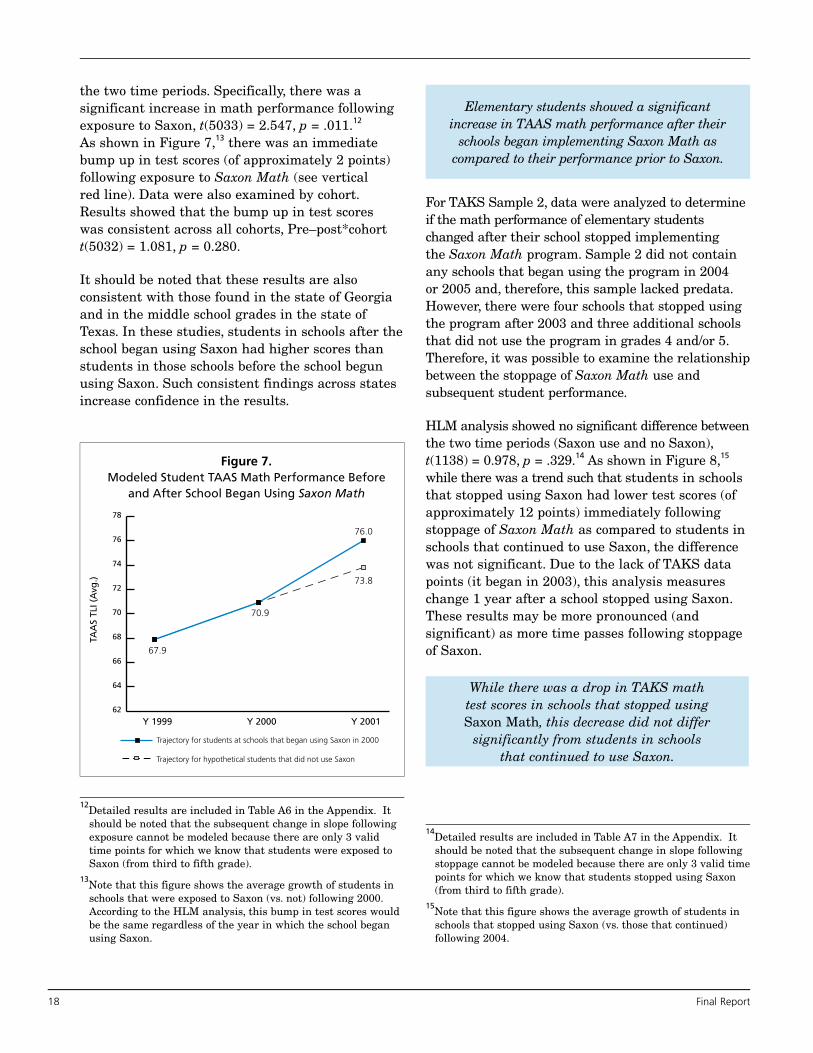
the two time periods. Specifically, there was a significant increase in math performance following exposure to Saxon, t(5033) = 2.547, p = .011.12 As shown in Figure 7,13 there was an immediate bump up in test scores (of approximately 2 points) following exposure to Saxon Math (see vertical red line). Data were also examined by cohort. Results showed that the bump up in test scores was consistent across all cohorts, Pre–post*cohort t(5032) = 1.081, p = 0.280.
It should be noted that these results are also consistent with those found in the state of Georgia and in the middle school grades in the state of Texas. In these studies, students in schools after the school began using Saxon had higher scores than students in those schools before the school begun using Saxon. Such consistent findings across states increase confidence in the results.
Elementary students showed a significant increase in TAAS math performance after their
schools began implementing Saxon Math as compared to their performance prior to Saxon.
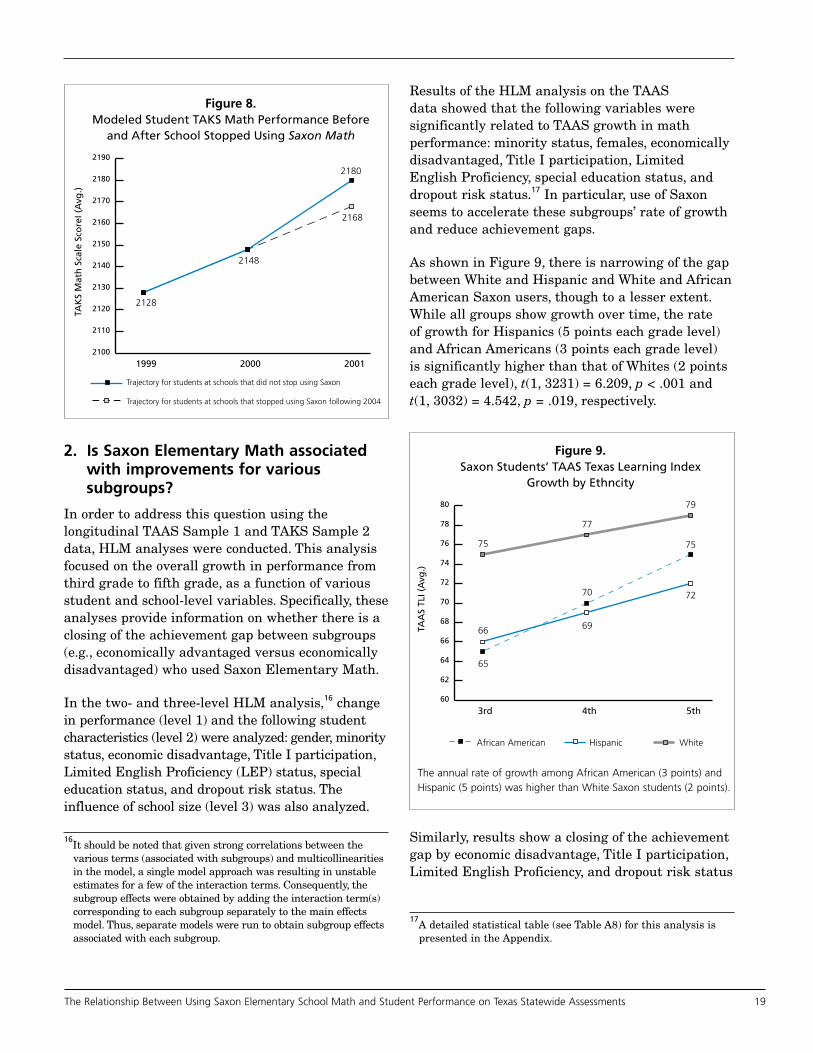
For TAKS Sample 2, data were analyzed to determine if the math performance of elementary students changed after their school stopped implementing the Saxon Math program. Sample 2 did not contain any schools that began using the program in 2004 or 2005 and, therefore, this sample lacked predata. However, there were four schools that stopped using the program after 2003 and three additional schools that did not use the program in grades 4 and/or 5. Therefore, it was possible to examine the relationship between the stoppage of Saxon Math use and subsequent student performance.
HLM analysis showed no significant difference between the two time periods (Saxon use and no Saxon), t(1138) = 0.978, p = .329.14 As shown in Figure 8,15 while there was a trend such that students in schools that stopped using Saxon had lower test scores (of approximately 12 points) immediately following stoppage of Saxon Math as compared to students in schools that continued to use Saxon, the difference was not significant. Due to the lack of TAKS data points (it began in 2003), this analysis measures change 1 year after a school stopped using Saxon. These results may be more pronounced (and significant) as more time passes following stoppage of Saxon.
While there was a drop in TAKS math test scores in schools that stopped using Saxon Math, this decrease did not differ
significantly from students in schools that continued to use Saxon.
62
64
66
68
70
72
74
76
78
Y 2001Y 2000Y 1999
TAA
S TL
I (A
vg.)
Trajectory for students at schools that began using Saxon in 2000
Trajectory for hypothetical students that did not use Saxon
Figure 7.Modeled Student TAAS Math Performance Before
and After School Began Using Saxon Math
70.9
76.0
67.9
73.8
12Detailed results are included in Table A6 in the Appendix. It should be noted that the subsequent change in slope following exposure cannot be modeled because there are only 3 valid time points for which we know that students were exposed to Saxon (from third to fifth grade).
13Note that this figure shows the average growth of students in schools that were exposed to Saxon (vs. not) following 2000. According to the HLM analysis, this bump in test scores would be the same regardless of the year in which the school began using Saxon.
14Detailed results are included in Table A7 in the Appendix. It should be noted that the subsequent change in slope following stoppage cannot be modeled because there are only 3 valid time points for which we know that students stopped using Saxon (from third to fifth grade).
15Note that this figure shows the average growth of students in schools that stopped using Saxon (vs. those that continued) following 2004.
The Relationship Between Using Saxon Elementary School Math and Student Performance on Texas Statewide Assessments 1�
2. Is Saxon Elementary Math associated with improvements for various subgroups?
In order to address this question using the longitudinal TAAS Sample 1 and TAKS Sample 2 data, HLM analyses were conducted. This analysis focused on the overall growth in performance from third grade to fifth grade, as a function of various student and school-level variables. Specifically, these analyses provide information on whether there is a closing of the achievement gap between subgroups (e.g., economically advantaged versus economically disadvantaged) who used Saxon Elementary Math.
In the two- and three-level HLM analysis,16 change in performance (level 1) and the following student characteristics (level 2) were analyzed: gender, minority status, economic disadvantage, Title I participation, Limited English Proficiency (LEP) status, special education status, and dropout risk status. The influence of school size (level 3) was also analyzed.
Results of the HLM analysis on the TAAS data showed that the following variables were significantly related to TAAS growth in math performance: minority status, females, economically disadvantaged, Title I participation, Limited English Proficiency, special education status, and dropout risk status.17 In particular, use of Saxon seems to accelerate these subgroups’ rate of growth and reduce achievement gaps.
As shown in Figure 9, there is narrowing of the gap between White and Hispanic and White and African American Saxon users, though to a lesser extent. While all groups show growth over time, the rate of growth for Hispanics (5 points each grade level) and African Americans (3 points each grade level) is significantly higher than that of Whites (2 points each grade level), t(1, 3231) = 6.209, p < .001 and t(1, 3032) = 4.542, p = .019, respectively.
Similarly, results show a closing of the achievement gap by economic disadvantage, Title I participation, Limited English Proficiency, and dropout risk status
2100
2110
2120
2130
2140
2150
2160
2170
2180
2190
200120001999
TAK
S M
ath
Sca
le S
core
I (A
vg.)
Trajectory for students at schools that did not stop using Saxon
Trajectory for students at schools that stopped using Saxon following 2004
Figure 8.Modeled Student TAKS Math Performance Before
and After School Stopped Using Saxon Math
2148
2180
2128
2168
17A detailed statistical table (see Table A8) for this analysis is presented in the Appendix.
60
62
64
66
68
70
72
74
76
78
80
5th4th3rd
TAA
S TL
I (A
vg.)
Figure 9.Saxon Students’ TAAS Texas Learning Index
Growth by Ethncity
69
72
65
70
75
66
77
79
75
African American Hispanic White
16It should be noted that given strong correlations between the various terms (associated with subgroups) and multicollinearities in the model, a single model approach was resulting in unstable estimates for a few of the interaction terms. Consequently, the subgroup effects were obtained by adding the interaction term(s) corresponding to each subgroup separately to the main effects model. Thus, separate models were run to obtain subgroup effects associated with each subgroup.
The annual rate of growth among African American (3 points) and Hispanic (5 points) was higher than White Saxon students (2 points).
20 Final Report
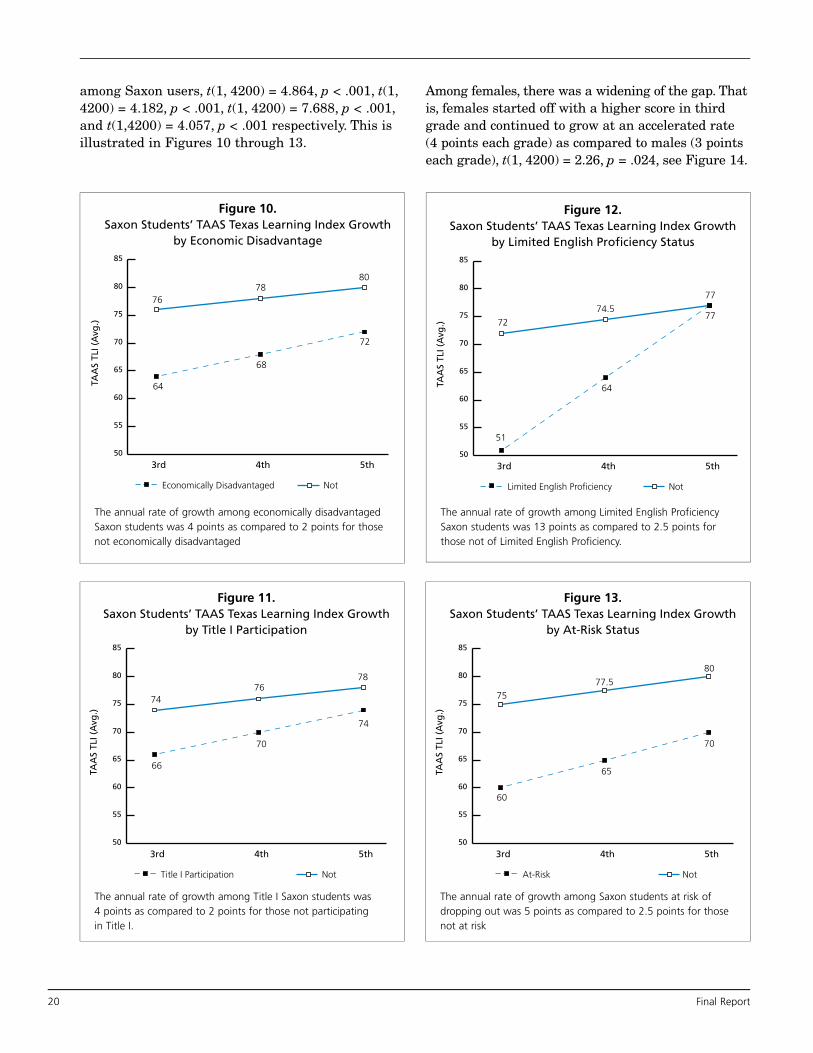
among Saxon users, t(1, 4200) = 4.864, p < .001, t(1, 4200) = 4.182, p < .001, t(1, 4200) = 7.688, p < .001, and t(1,4200) = 4.057, p < .001 respectively. This is illustrated in Figures 10 through 13.
Among females, there was a widening of the gap. That is, females started off with a higher score in third grade and continued to grow at an accelerated rate (4 points each grade) as compared to males (3 points each grade), t(1, 4200) = 2.26, p = .024, see Figure 14.
50
55
60
65
70
75
80
85
5th4th3rd
TAA
S TL
I (A
vg.)
Figure 13.Saxon Students’ TAAS Texas Learning Index Growth
by At-Risk Status
65
70
60
77.5
80
75
At-Risk Not
50
55
60
65
70
75
80
85
5th4th3rd
TAA
S TL
I (A
vg.)
Figure 10.Saxon Students’ TAAS Texas Learning Index Growth
by Economic Disadvantage
68
72
64
7880
76
Economically Disadvantaged Not
50
55
60
65
70
75
80
85
5th4th3rd
TAA
S TL
I (A
vg.)
Figure 11.Saxon Students’ TAAS Texas Learning Index Growth
by Title I Participation
70
74
66
7678
74
Title I Participation Not
50
55
60
65
70
75
80
85
5th4th3rd
TAA
S TL
I (A
vg.)
Figure 12.Saxon Students’ TAAS Texas Learning Index Growth
by Limited English Proficiency Status
64
77
51
74.5
77
72
Limited English Proficiency Not
The annual rate of growth among Limited English Proficiency Saxon students was 13 points as compared to 2.5 points for those not of Limited English Proficiency.
The annual rate of growth among Title I Saxon students was 4 points as compared to 2 points for those not participating in Title I.
The annual rate of growth among economically disadvantaged Saxon students was 4 points as compared to 2 points for those not economically disadvantaged
The annual rate of growth among Saxon students at risk of dropping out was 5 points as compared to 2.5 points for those not at risk

The Relationship Between Using Saxon Elementary School Math and Student Performance on Texas Statewide Assessments 21
In contrast, special education students showed virtually no growth over time, t(1, 4200) = –4.101, p < .001. These students started off with a significantly lower score and showed a growth of 0.4 points each year as compared to non–special education students (+4 points), see Figure 15. Note that subsequent analysis between Saxon and non-Saxon students who took the TAAS showed that this finding is consistent in non-Saxon schools as well (see page 27). Non-Saxon special education students showed limited growth on the TAAS.
Among Saxon students, there was a closing of the achievement gap between Hispanics and Whites,
African Americans and Whites, economically disadvantaged and not, Title I participants and
nonparticipants, Limited English Proficiency (LEP) students and non-LEP, and at-risk
students and non-at risk students as measured by the TAAS Texas Learning Index.
Results of the HLM analysis on the TAKS data showed that the following variables were significantly related to TAKS growth in student performance: minority status and Hispanics in particular.18 No other subgroups showed significantly different rates of growth.
As shown in Figure 16, there is closing of the achievement gap between White and non-White and, more specifically, White and Hispanic Saxon users. All groups, regardless of ethnicity, show growth over time, but the rate of growth for non-Whites (33 scale scores at each grade level) and, specifically, Hispanics (37 scale scores each grade
50
55
60
65
70
75
80
85
5th4th3rd
TAA
S TL
I (A
vg.)
Figure 14.Saxon Students’ TAAS Texas Learning Index Growth
by Gender
72
75
69
75
79
71
Male Female
40
45
50
55
60
65
70
75
80
85
5th4th3rd
TAA
S TL
I (A
vg.)
Figure 15.Saxon Students’ TAAS Texas Learning Index Growth
by Special Education Status
43.4 43.843
79
83
75
Special Education Not Special Education
2000
2050
2100
2150
2200
2250
2300
5th4th3rd
TAA
S TL
I (A
vg.)
Figure 16.Saxon Students’ TAKS Scale Score Growth
by Ethnic Status
2128
2161
2095
2148
2183
2109
22492257
2241
Non-White Hispanic White
18 A detailed statistical table (see Table A9) for this analysis is presented in the Appendix.
The annual rate of growth among females (4 points) was significantly higher than that of male Saxon students (3 points).
Whereas Saxon non–special education students showed growth each year (4 points), special education students showed minimal growth (0.4 points).
The annual rate of growth among non-Whites (33 points) and Hispanics in particular (37 points) was higher than White Saxon students (8 points).
22 Final Report
level) is significantly higher than that of Whites (8 scale scores each grade level), t(1, 1106) = –2.429, p = .015 and t(1, 724) = 2.587, p = .010, respectively.
3. How does student achievement in math differ across users and nonusers of Saxon Elementary Math?
This set of analyses provides information on the relationship between Saxon Math and math performance relative to non-Saxon students. In order to address this question, HLM and MANCOVA were performed. What follows are the overall results based on numerous models run. Consistent findings across multiple models and methods help increase confidence in the results.
Schools were coded based on whether they were a non-Saxon school (0) or whether they were an active Saxon school at the time of testing (1). As previously noted, there were some schools that started and stopped using Saxon Math during the years of interest. These schools had students that did not use Saxon Math consistently from third to fifth grades over the course of 3 years. Since the focus of this analysis is on comparing the growth rates of Saxon and non-Saxon students over 3 years (from third to fifth grades), Saxon schools that did not use the program consistently throughout the entire time period were selected out of the sample. Furthermore, although there were no school-level differences, there were student-level differences between Saxon and non-Saxon students on demographic characteristics. As such, the following variables were controlled for in both samples (TAAS and TAKS):
• Gender
• Ethnicity (White, Hispanic, others)
• Economically Disadvantaged Status
• Title I Participation
• LEP Status
• Special Education Status
• At Risk of Dropping Out
Controlling for these variables equates the two groups (Saxon and non-Saxon students) on these important demographic characteristics.
Of interest in these analyses was whether or not group (Saxon vs. non-Saxon) predicted growth in performance over time. Analyses were run separately for TAAS and TAKS samples. Results showed that there were no significant differences in the growth in performance among Saxon and non-Saxon schools in both samples, p > .05.19 Both types of schools showed increases in math performance, as measured by the TAAS TLI score, TAAS percent of math objectives mastered, and TAKS math scale score.
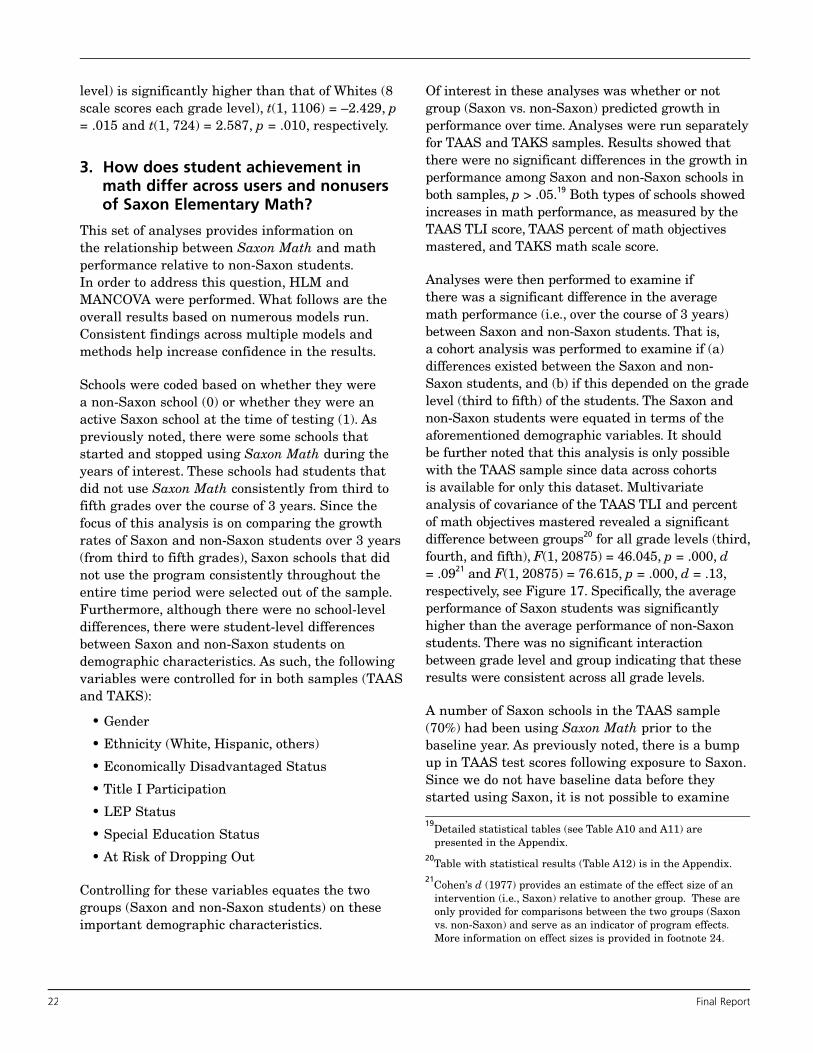
Analyses were then performed to examine if there was a significant difference in the average math performance (i.e., over the course of 3 years) between Saxon and non-Saxon students. That is, a cohort analysis was performed to examine if (a) differences existed between the Saxon and non-Saxon students, and (b) if this depended on the grade level (third to fifth) of the students. The Saxon and non-Saxon students were equated in terms of the aforementioned demographic variables. It should be further noted that this analysis is only possible with the TAAS sample since data across cohorts is available for only this dataset. Multivariate analysis of covariance of the TAAS TLI and percent of math objectives mastered revealed a significant difference between groups20 for all grade levels (third, fourth, and fifth), F(1, 20875) = 46.045, p = .000, d = .0921 and F(1, 20875) = 76.615, p = .000, d = .13, respectively, see Figure 17. Specifically, the average performance of Saxon students was significantly higher than the average performance of non-Saxon students. There was no significant interaction between grade level and group indicating that these results were consistent across all grade levels.
A number of Saxon schools in the TAAS sample (70%) had been using Saxon Math prior to the baseline year. As previously noted, there is a bump up in TAAS test scores following exposure to Saxon. Since we do not have baseline data before they started using Saxon, it is not possible to examine
19Detailed statistical tables (see Table A10 and A11) are presented in the Appendix.
20Table with statistical results (Table A12) is in the Appendix.
21Cohen’s d (1977) provides an estimate of the effect size of an intervention (i.e., Saxon) relative to another group. These are only provided for comparisons between the two groups (Saxon vs. non-Saxon) and serve as an indicator of program effects. More information on effect sizes is provided in footnote 24.
The Relationship Between Using Saxon Elementary School Math and Student Performance on Texas Statewide Assessments 23
if for this sample there is an immediate bump up in test scores. Therefore, more precise estimates of the influence of Saxon on performance are provided by the performance of Saxon schools that began using the program after the baseline years. In sum, this allows us to include baseline data prior to the introduction of the Saxon program so that program effects can be more accurately measured.
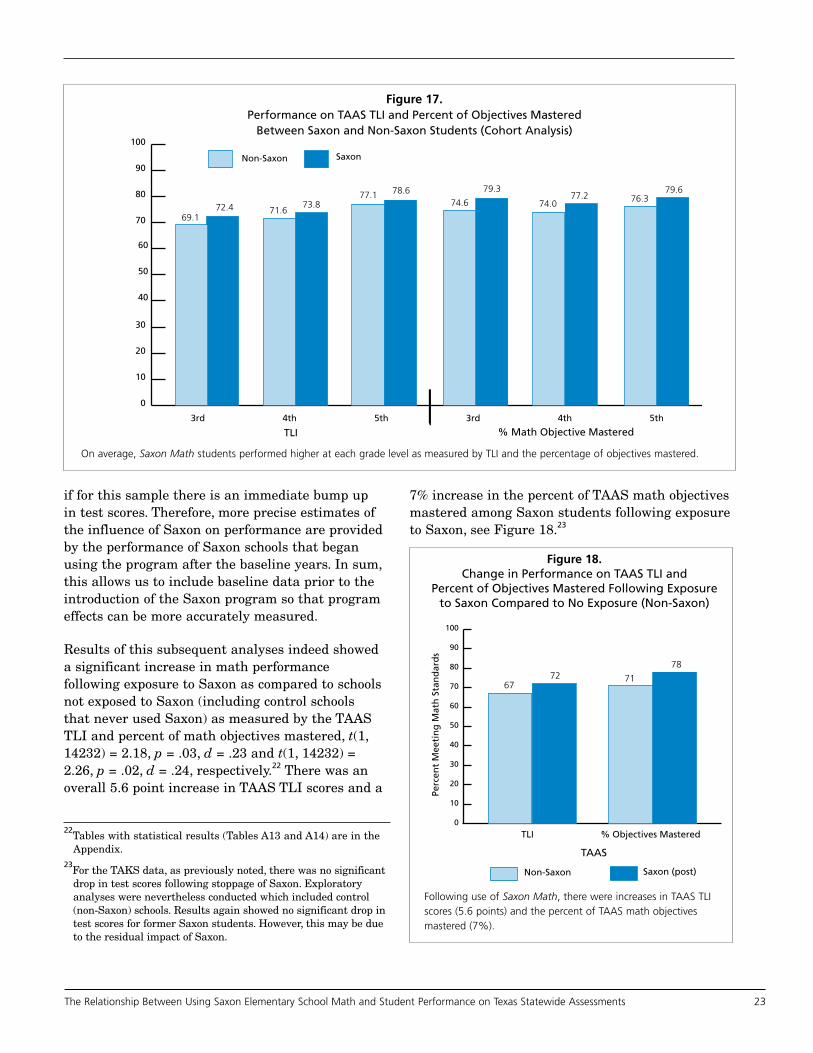
Results of this subsequent analyses indeed showed a significant increase in math performance following exposure to Saxon as compared to schools not exposed to Saxon (including control schools that never used Saxon) as measured by the TAAS TLI and percent of math objectives mastered, t(1, 14232) = 2.18, p = .03, d = .23 and t(1, 14232) = 2.26, p = .02, d = .24, respectively.22 There was an overall 5.6 point increase in TAAS TLI scores and a
7% increase in the percent of TAAS math objectives mastered among Saxon students following exposure to Saxon, see Figure 18.23
0
10
20
30
40
50
60
70
80
90
100
SaxonNon-Saxon
5th4th3rd5th4th3rd
TLI % Math Objective Mastered
Figure 17.Performance on TAAS TLI and Percent of Objectives Mastered
Between Saxon and Non-Saxon Students (Cohort Analysis)
69.172.4 74.6 74.0
71.673.8
77.1 78.677.2
79.376.3
79.6
0
10
20
30
40
50
60
70
80
90
100
% Objectives MasteredTLI
Non-Saxon Saxon (post)
TAAS
Figure 18.Change in Performance on TAAS TLI and
Percent of Objectives Mastered Following Exposure to Saxon Compared to No Exposure (Non-Saxon)
6772 71
78
Perc
ent
Mee
tin
g M
ath
Sta
nd
ard
s
22Tables with statistical results (Tables A13 and A14) are in the Appendix.
23For the TAKS data, as previously noted, there was no significant drop in test scores following stoppage of Saxon. Exploratory analyses were nevertheless conducted which included control (non-Saxon) schools. Results again showed no significant drop in test scores for former Saxon students. However, this may be due to the residual impact of Saxon.
On average, Saxon Math students performed higher at each grade level as measured by TLI and the percentage of objectives mastered.
Following use of Saxon Math, there were increases in TAAS TLI scores (5.6 points) and the percent of TAAS math objectives mastered (7%).

24 Final Report
The effect size (ES) estimates24 between Saxon versus non-Saxon can be described as small to very small (see also Appendix for effect sizes of main program effect analyses, Tables A10–A12). One way to understand what this effect size means is to examine the performance of Saxon students relative to non-Saxon students. With a small effect size of 0.24 (the largest effect size obtained), we could expect that about 59% of students using Saxon perform higher than the average of non-Saxon students. This is quite small and does not exceed the 0.25 value that Slavin (1986), a leader in educational research, notes as being educationally significant.
Saxon students that used the program continuously over 3 years (from grade 3 to 5)
and non-Saxon students showed no significant differences in TAAS and TAKS math
performance growth. However, differences in favor of Saxon Math were found on the average TAAS math performance (across 3
years) for all grade levels. In addition, among students in schools that began using the
program during the years of interest (and had baseline, non-Saxon data), there was a significant increase in TAAS test scores
following exposure to Saxon as compared to students never exposed to Saxon. Of note is
that the obtained effect sizes were quite small.
How did Saxon students perform on the TAKS math objectives compared to Non-Saxon students?
In order to ascertain in which math areas there may be differences between Saxon and non-Saxon students, performance on the TAKS math objectives was analyzed. For all analyses, demographic covariates as previously discussed were included to equate the groups in terms of demographic
characteristics. HLM analysis revealed that there were no significant differences in math growth between Saxon and non-Saxon students on all of the TAKS objectives,25 p > .05. Saxon and non-Saxon students performed similarly on all math objectives; see Table 6.
Saxon students performed similarly on all TAKS math objectives as compared to
students in non-Saxon schools.
Are there differences between subgroups of students in Saxon and Non-Saxon Schools?
Exploratory26 analyses by students’ gender, ethnicity (White, Hispanic, others), economically disadvantaged status, Title I participation, LEP status, special education status, and dropout risk status were
Table 6. Percent Correct on TAKS Math Objectives by Group and Grade Level
Gra
de
Leve
l
Gro
up
1. N
um
ber
s, O
per
atio
ns,
&
Qu
anti
tati
ve R
easo
nin
g
2. P
atte
rns,
Rel
atio
nsh
ips,
&
Alg
ebra
ic R
easo
nin
g
3. G
eom
etry
an
d S
pat
ial
Rea
son
ing
4. C
on
cep
ts a
nd
Use
s o
f M
easu
rem
ent
5. P
rob
abili
ty &
Sta
tist
ics
6. M
ath
emat
ical
Pro
cess
es
& T
oo
ls
3rd Grade
Saxon 71.1 70.4 78.0 71.3 7�.� 5�.8
Control 73.5 72.4 7�.3 72.4 80.0 5�.8
4th Grade
Saxon 80.0 77.4 73.8 71.7 72.5 70.2
Control 7�.6 77.6 77.4 6�.8 72.� 68.8
5th Grade
Saxon 77.2 72.5 80.4 75.1 74.1 74.0
Control 77.� 71.4 81.7 74.8 73.4 72.7
24Effect size (ES) is commonly used as a measure of the magnitude of an effect of an intervention relative to a comparison group. It provides a measure of the relative position of one group to another. For example, with a moderate effect size of d = .5, we expect that about 69% of cases in Group 2 are above the mean of Group 1, whereas for a small effect of d = .2 this figure would be 58% and for a large effect of d = .8 this would be 79%.
25Detailed statistical tables (see Table A11) for these analyses are presented in the Appendix.
26These analyses are exploratory because there have been very few studies that have examined subgroup effects relating to curriculum of the Saxon Math program as well as elementary math programs as a whole. In the absence of a strong program theory, the subgroup effects are viewed as empirical patterns that need theoretical frameworks and other rigorous experimental designs in the future to be estimated “causally.” Further, analyses are based on smaller sample sizes.
The Relationship Between Using Saxon Elementary School Math and Student Performance on Texas Statewide Assessments 25
conducted to obtain preliminary information on whether there were significant differences between students in these subgroups who were in Saxon and non-Saxon schools. In order to equate the groups, demographic characteristics were controlled for, as noted on page 27. HLM analyses were run separately for each sample (TAAS and TAKS).
Results showed no consistent patterns among the TAAS sample. That is, Saxon and non-Saxon students who were female, White, Hispanic, economically disadvantaged, in Title I, LEP, in special education, and at-risk tended to perform similarly over time, p > .05.
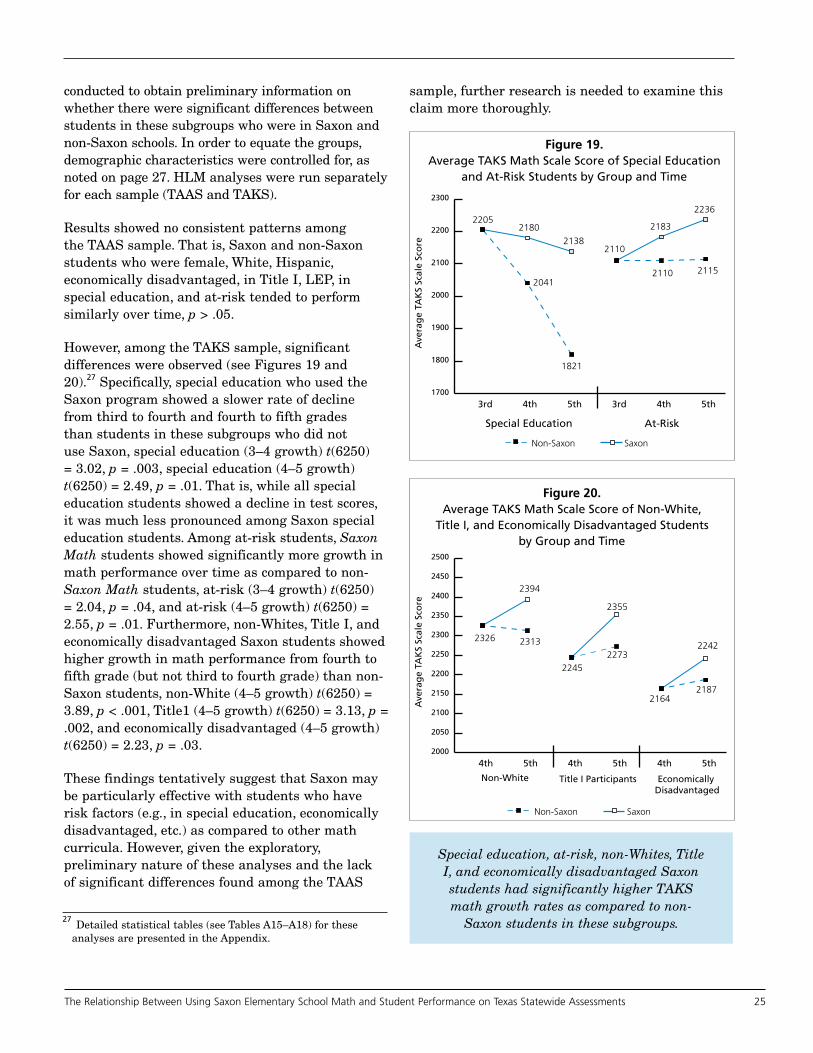
However, among the TAKS sample, significant differences were observed (see Figures 19 and 20).27 Specifically, special education who used the Saxon program showed a slower rate of decline from third to fourth and fourth to fifth grades than students in these subgroups who did not use Saxon, special education (3–4 growth) t(6250) = 3.02, p = .003, special education (4–5 growth) t(6250) = 2.49, p = .01. That is, while all special education students showed a decline in test scores, it was much less pronounced among Saxon special education students. Among at-risk students, Saxon Math students showed significantly more growth in math performance over time as compared to non-Saxon Math students, at-risk (3–4 growth) t(6250) = 2.04, p = .04, and at-risk (4–5 growth) t(6250) = 2.55, p = .01. Furthermore, non-Whites, Title I, and economically disadvantaged Saxon students showed higher growth in math performance from fourth to fifth grade (but not third to fourth grade) than non-Saxon students, non-White (4–5 growth) t(6250) = 3.89, p < .001, Title1 (4–5 growth) t(6250) = 3.13, p = .002, and economically disadvantaged (4–5 growth) t(6250) = 2.23, p = .03.
These findings tentatively suggest that Saxon may be particularly effective with students who have risk factors (e.g., in special education, economically disadvantaged, etc.) as compared to other math curricula. However, given the exploratory, preliminary nature of these analyses and the lack of significant differences found among the TAAS
sample, further research is needed to examine this claim more thoroughly.
Special education, at-risk, non-Whites, Title I, and economically disadvantaged Saxon students had significantly higher TAKS math growth rates as compared to non-
Saxon students in these subgroups.
1700
1800
1900
2000
2100
2200
2300
5th4th3rd5th4th3rd
Figure 19.Average TAKS Math Scale Score of Special Education
and At-Risk Students by Group and Time
1821
2236
2138
2183
2041
2180
2110
2205
Non-Saxon Saxon
21152110
Special Education At-RiskA
vera
ge
TAK
S Sc
ale
Sco
re
27 Detailed statistical tables (see Tables A15–A18) for these
analyses are presented in the Appendix.
2000
2050
2100
2150
2200
2250
2300
2350
2400
2450
2500
5th4th5th4th5th4th
Figure 20.Average TAKS Math Scale Score of Non-White,
Title I, and Economically Disadvantaged Students by Group and Time
2187
22452273
2313
2394
2355
2326
Non-Saxon Saxon
2242
2164
Non-White Title I Participants Economically Disadvantaged
Ave
rag
e TA
KS
Scal
e Sc
ore

26 Final Report
Are there differences between students using Saxon and students using basal or investigative curricula?
Preliminary analysis was performed to examine if math performance growth differences existed between the different types of control curricula (basal and investigative) and the Saxon curricula. Given the caveat that there are small sample sizes at the school level in each of these groups, results showed no significant differences in growth over time between Saxon students and students using a basal and investigative control curricula, p > .05. This was consistent across both TAAS and TAKS datasets.
Analyses were then performed to examine if there was a significant difference in the average math performance (i.e., over the course of 3 years) between Saxon and non-Saxon students using basal and investigative curricula. Similar to the previously cited cohort analysis, the Saxon and non-Saxon students were equated in terms of demographic variables and this analysis was only conducted with the TAAS sample since data across cohorts is available for only this dataset. MANCOVA results showed a significant difference. Namely, Saxon students had higher TLI scores and met more math objectives than students using a basal and investigative math program, F-TLI(1, 11969) = 8.733, p = .003, F-pctobjmet(1, 11969) = 21.465, p < .001, and F-TLI(1, 9193) = 10.158, p= .001, F-pctpbjmet(1, 9193) = 24.341, p <. 001, respectively. Figure 21 shows these results.
The average math performance of Saxon students was significantly higher than
non-Saxon students who used a basal or investigative curriculum.
SummaryAnalyses of longitudinal data show that the Saxon Elementary Math program is associated with positive outcomes as measured by the two Texas statewide assessments (TAAS and TAKS). Specifically, there was significant growth in math
performance among Saxon students and a closing of the achievement gap among disadvantaged Saxon students. There was also a significant and immediate increase in test scores following use of Saxon Math. Preliminary findings also suggest that Saxon Math is associated with higher scores among special education, at-risk, non-Whites, Title I, and economically disadvantaged students as compared to non-Saxon Math users.
In addition, a number of findings among Texas elementary school students are consistent with those found in prior Saxon Archival studies conducted in middle schools in Texas and elementary and middle schools in Georgia. Similar to the results found in these studies, (a) there was growth in math performance among Saxon students, (b) the number of years a school had been exposed to Saxon was not related to math growth, and (c) there was an increase in test scores following exposure to Saxon Math. The fact that the findings in this elementary study on Saxon Math replicates what has been found in other research studies increases confidence in the validity of the results and speaks towards the generalizability of findings across multiple states and grade levels.
68
69
70
71
72
73
74
75
76
77
78
SaxonBasal Non-Saxon
Investigative Non-Saxon
TLI % of Math Objectives Met
Figure 21.TAAS Performance Between Saxon and Non-Saxon Students by Program Type Across all Grade Levels
71.3
72.5 72.6
74.674
77.3
TAA
S TL
I (A
vg.)
The Relationship Between Using Saxon Elementary School Math and Student Performance on Texas Statewide Assessments 27
LimitationsThere are several limitations to this study that readers should take into account when interpreting the study’s results. First, this study is a quasi-experiment that employs matching and statistical controls in order to equate groups on important demographic characteristics. However, since it is not a true experiment with random assignment to conditions, there may still be other variables that have not been accounted for that may be producing differential effects, the most likely being local history effects. For example, another event may have occurred in Saxon sites and not in control sites that may partially explain the observed differences.
Second, teacher effects could not be examined. Research has shown that teacher quality has significant effects on student achievement (Mendro, Jordan, Gomez, Anderson, & Bembry, 1998; Sanders & Rivers, 1996). Unfortunately, due to the retrospective nature of this study, it was not possible to gather information on teacher quality. Related to this, implementation information is not available. Therefore, it is not known how teachers implemented Saxon Math in their classrooms. Such qualitative information is needed to shed further light on the program’s impact.
Third, although the large sample size increases our ability to detect differences, it also facilitates the detection of trivial or unimportant relationships. For this reason, it is important to consider the effect size associated with each analysis. Examination of the effect sizes (refer to Tables A12–A14 in
Appendix) shows that the overall program effects were small (d = .01 to .24). In addition, recall that an effect size (d) of .25 is considered educationally significant. Because the obtained effect sizes are below this threshold, the results between Saxon and non-Saxon students can be considered weak. In other words, both groups (Saxon and non-Saxon) showed increases in performance and although at times the performance of Saxon students was higher than those of non-Saxon students, the focus should be on the growth itself and not necessarily on differences between the groups. Note that small effect sizes are to be expected in any type of study evaluating entire curricula against one another; after all, math curricula within the same grade levels teach similar mathematical concepts (e.g., addition, subtraction, etc.). It must be emphasized that such overlap between curricula will reduce effect sizes.
Fourth, because non-Saxon schools were matched to Saxon schools and not randomly selected from all schools in Texas, generalizability is limited to sites with similar characteristics. Note however that a broad range of schools in geographical locations throughout the state of Texas were included (see Figure 1). In addition, the characteristics of participating schools were quite similar to those found statewide.
In conclusion, this study enabled PRES Associates to determine that Saxon Math was associated with positive improvements in elementary student math performance.
28 Final Report
ReferencesCohen, J. (1977). Statistical power analysis for the behavioral sciences. New York: Academic Press.
Griffin, S., Case, R., & Siegler, R. S. (1994). Rightstart: Providing the central conceptual prerequisites for first formal learning of arithmetic to students at risk for school failure. In K. McGilly (Ed.), Classroom lessons: Integrating cognitive theory and classroom practice (pp. 25–50). Cambridge, MA: MIT Press/Bradford Books.
Lipsey, M. W. (1990). Design sensitivity: Statistical power for experimental research. Newbury Park, CA: Sage.
Mendro, R. L., Jordan, H. R., Gomez, E., Anderson, M. C., & Bembry, K. L. (1998). An application of multiple linear regression in determining longitudinal teacher effectiveness. Dallas, TX: Dallas Public Schools.
Mullis, I. V. S., Martin, M. O., Gonzalez, E. J., & Chrostowski, S. J. (2004). TIMSS 2003 international mathematics report: Findings from IEA’s trends in international mathematics and science study at the fourth and eighth grades. Chestnut Hill, MA: TIMSS & PIRLS International Study Center, Lynch School of Education, Boston College.
National Research Council. (2001). Adding it up: Helping children learn mathematics. Washington, DC: National Academy Press.
No Child Left Behind Act of 2001, 115 Stat. 1425, 20 U.S.C. § 6301, et seq.
Raudenbush, S. & Bryk, A. (2002). Hierarchical linear models for social and behavioural research: Applications and data analysis methods. Newbury Park, CA: Sage.
Raudenbush, S., Spybrook, J., Liu, X-F., & Congdon, R. (2005). Optimal design for longitudinal and multilevel research: Documentation for the optimal design software. New York: William T. Grant Foundation.
Sanders, W. L. & Rivers, J. C. (1996). Cumulative and Residual Effects of Teachers on Future Student Achievement. Knoxville: University of Tennessee.
Shafer, M. C. & Foster, C. (1997). The hanging face of assessment. Principled practice in mathematics and science education, 1(2), 1–12. Retrieved March 22, 2006, from http://www.wcer.wisc.edu/NCISLA/Publications/newsletters/fall97.pdf
Singer, J. D., & Willett, J. B. (2003). Applied longitudinal data analysis: Modeling change and event occurrence. New York: Oxford.
Slavin, R. E. (1986). Best-evidence synthesis: An alternative to meta-analysis and traditional reviews. Educational Researcher, 15, 5–11.
U.S. Department of Education. (2003). Trends in international mathematics and science: 2003 results. Retrieved March 22, 2006, from http://nces.ed.gov/timss/Results03.asp
U.S. Department of Education, National Center for Education Statistics. (2005). The nation’s report card: Mathematics 2005. Retrieved March 22, 2006, from http://nces.ed.gov/nationsreportcard/pdf/main2005/2006453.pdf
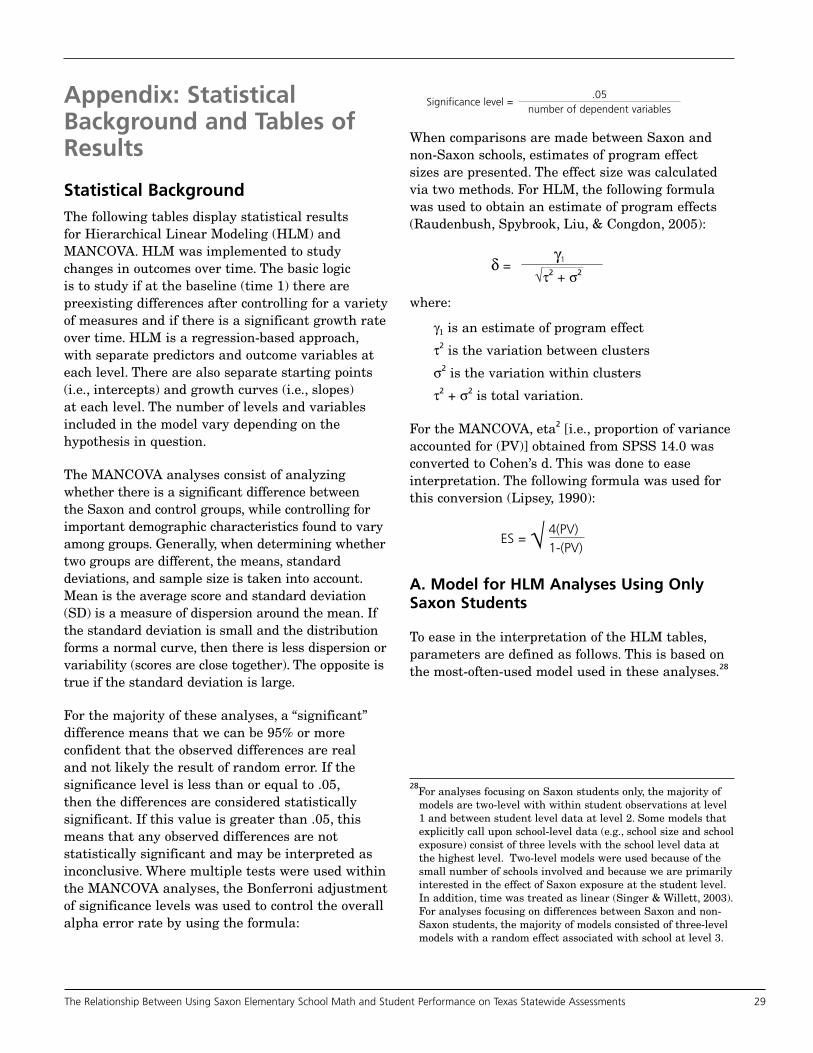
The Relationship Between Using Saxon Elementary School Math and Student Performance on Texas Statewide Assessments 2�
Appendix: Statistical Background and Tables of Results
Statistical BackgroundThe following tables display statistical results for Hierarchical Linear Modeling (HLM) and MANCOVA. HLM was implemented to study changes in outcomes over time. The basic logic is to study if at the baseline (time 1) there are preexisting differences after controlling for a variety of measures and if there is a significant growth rate over time. HLM is a regression-based approach, with separate predictors and outcome variables at each level. There are also separate starting points (i.e., intercepts) and growth curves (i.e., slopes) at each level. The number of levels and variables included in the model vary depending on the hypothesis in question.
The MANCOVA analyses consist of analyzing whether there is a significant difference between the Saxon and control groups, while controlling for important demographic characteristics found to vary among groups. Generally, when determining whether two groups are different, the means, standard deviations, and sample size is taken into account. Mean is the average score and standard deviation (SD) is a measure of dispersion around the mean. If the standard deviation is small and the distribution forms a normal curve, then there is less dispersion or variability (scores are close together). The opposite is true if the standard deviation is large.
For the majority of these analyses, a “significant” difference means that we can be 95% or more confident that the observed differences are real and not likely the result of random error. If the significance level is less than or equal to .05, then the differences are considered statistically significant. If this value is greater than .05, this means that any observed differences are not statistically significant and may be interpreted as inconclusive. Where multiple tests were used within the MANCOVA analyses, the Bonferroni adjustment of significance levels was used to control the overall alpha error rate by using the formula:
Significance level =.05
number of dependent variables
When comparisons are made between Saxon and non-Saxon schools, estimates of program effect sizes are presented. The effect size was calculated via two methods. For HLM, the following formula was used to obtain an estimate of program effects (Raudenbush, Spybrook, Liu, & Congdon, 2005):
τ2 + σ2δ =
γ1
where:
γ1 is an estimate of program effect
τ2 is the variation between clusters
σ2 is the variation within clusters
τ2 + σ2 is total variation.
For the MANCOVA, eta2 [i.e., proportion of variance accounted for (PV)] obtained from SPSS 14.0 was converted to Cohen’s d. This was done to ease interpretation. The following formula was used for this conversion (Lipsey, 1990):
ES = √ 4(PV) 1-(PV)
A. Model for HLM Analyses Using Only Saxon Students
To ease in the interpretation of the HLM tables, parameters are defined as follows. This is based on the most-often-used model used in these analyses.28
28For analyses focusing on Saxon students only, the majority of models are two-level with within student observations at level 1 and between student level data at level 2. Some models that explicitly call upon school-level data (e.g., school size and school exposure) consist of three levels with the school level data at the highest level. Two-level models were used because of the small number of schools involved and because we are primarily interested in the effect of Saxon exposure at the student level. In addition, time was treated as linear (Singer & Willett, 2003). For analyses focusing on differences between Saxon and non-Saxon students, the majority of models consisted of three-level models with a random effect associated with school at level 3.
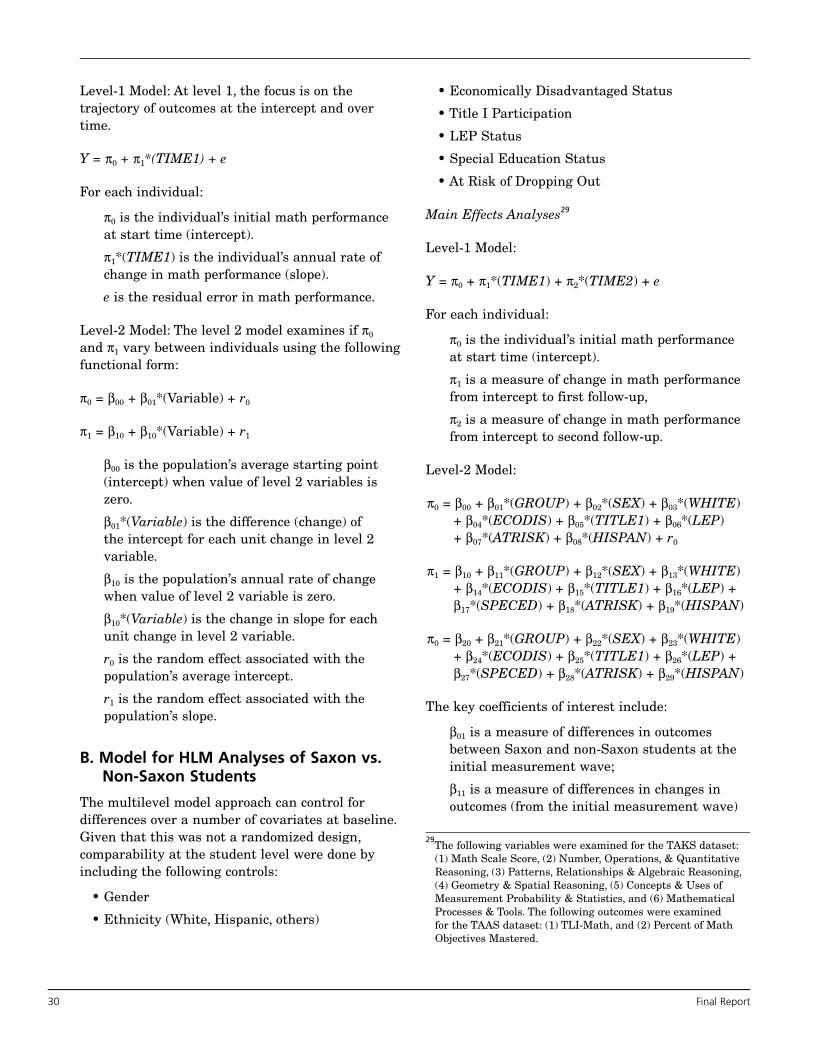
30 Final Report
Level-1 Model: At level 1, the focus is on the trajectory of outcomes at the intercept and over time.
Y = π0 + π1*(TIME1) + e
For each individual:
π0 is the individual’s initial math performance at start time (intercept).
π1*(TIME1) is the individual’s annual rate of change in math performance (slope).
e is the residual error in math performance.
Level-2 Model: The level 2 model examines if π0 and π1 vary between individuals using the following functional form:
π0 = β00 + β01*(Variable) + r0
π1 = β10 + β10*(Variable) + r1
β00 is the population’s average starting point (intercept) when value of level 2 variables is zero.
β01*(Variable) is the difference (change) of the intercept for each unit change in level 2 variable.
β10 is the population’s annual rate of change when value of level 2 variable is zero.
β10*(Variable) is the change in slope for each unit change in level 2 variable.
r0 is the random effect associated with the population’s average intercept.
r1 is the random effect associated with the population’s slope.
B. Model for HLM Analyses of Saxon vs. Non-Saxon Students
The multilevel model approach can control for differences over a number of covariates at baseline. Given that this was not a randomized design, comparability at the student level were done by including the following controls:
• Gender
• Ethnicity (White, Hispanic, others)
• Economically Disadvantaged Status
• Title I Participation
• LEP Status
• Special Education Status
• At Risk of Dropping Out
Main Effects Analyses29
Level-1 Model:
Y = π0 + π1*(TIME1) + π2*(TIME2) + e
For each individual:
π0 is the individual’s initial math performance at start time (intercept).
π1 is a measure of change in math performance from intercept to first follow-up,
π2 is a measure of change in math performance from intercept to second follow-up.
Level-2 Model:
π0 = β00 + β01*(GROUP) + β02*(SEX) + β03*(WHITE) + β04*(ECODIS) + β05*(TITLE1) + β06*(LEP) + β07*(ATRISK) + β08*(HISPAN) + r0
π1 = β10 + β11*(GROUP) + β12*(SEX) + β13*(WHITE) + β14*(ECODIS) + β15*(TITLE1) + β16*(LEP) + β17*(SPECED) + β18*(ATRISK) + β19*(HISPAN)
π0 = β20 + β21*(GROUP) + β22*(SEX) + β23*(WHITE) + β24*(ECODIS) + β25*(TITLE1) + β26*(LEP) + β27*(SPECED) + β28*(ATRISK) + β29*(HISPAN)
The key coefficients of interest include:
β01 is a measure of differences in outcomes between Saxon and non-Saxon students at the initial measurement wave;
β11 is a measure of differences in changes in outcomes (from the initial measurement wave)
29The following variables were examined for the TAKS dataset: (1) Math Scale Score, (2) Number, Operations, & Quantitative Reasoning, (3) Patterns, Relationships & Algebraic Reasoning, (4) Geometry & Spatial Reasoning, (5) Concepts & Uses of Measurement Probability & Statistics, and (6) Mathematical Processes & Tools. The following outcomes were examined for the TAAS dataset: (1) TLI-Math, and (2) Percent of Math Objectives Mastered.
The Relationship Between Using Saxon Elementary School Math and Student Performance on Texas Statewide Assessments 31
between Saxon and non-Saxon students at the first follow-up measurement wave, β21 is a measure of differences in changes in outcomes (from the initial measurement wave) between Saxon and non-Saxon students at the second measurement wave.
Level-3 Model:
A random effects term associated with school was also modeled at level 3. In order to simplify the explication of the model, the functional form is not presented here. However details of the level 3 can be readily obtained from Raudenbush and Bryk (2002).
Exploratory Interaction Analyses
The interaction effects of the Saxon curriculum were examined for the following sub-groups:
• Gender
• Ethnicity (White, Hispanic, others)
• Economically Disadvantaged Status
• Title I Participation
• LEP Status
• Special Education Status
• At Risk of Dropping Out
While the level 1 model was similar to the model described earlier, modifications were made to make the model simpler. The interaction terms were included along with other covariates at the initial measurement wave. However, the models for the interaction effects for the first and second follow-up were simpler. We were concerned that including all of the covariates might result in “over modeling” and wash out interaction effects. We stress that the interaction analysis is only intended to be exploratory.
As an example, the model for interaction effects at level 2 for the interaction effects of gender was as follows:
π0 = β00 + β01*(GROUP) + β02*(SEX) + β03*(WHITE) + β04*(ECODIS) + β05*(TITLE1) + β06*(LEP) + β07*(ATRISK) + β08*(HISPAN) + β09*GROUP*SEX + r0
π1 = β10 + β11*(GROUP) + β12*(SEX) + β13*GROUP*SEX
π2 = β20 + β21*(GROUP) + β22*(SEX) + β23*GROUP*SEX
A random effect of school was also modeled at level 3.
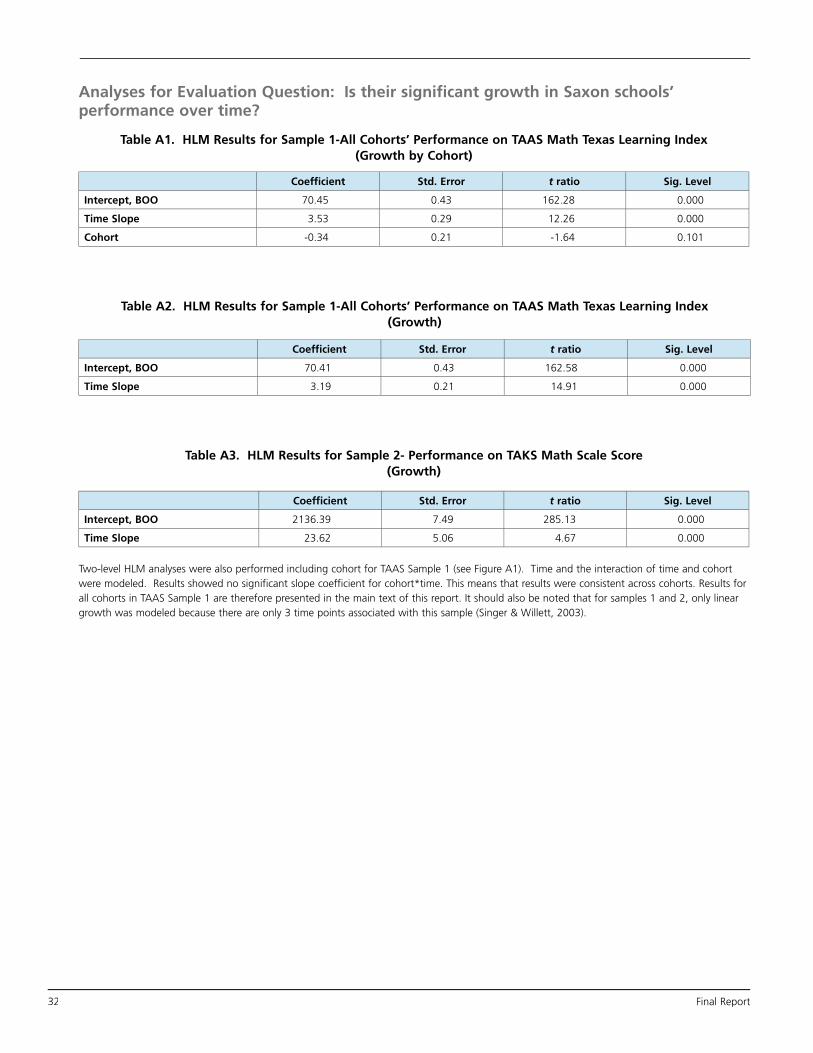
32 Final Report
Analyses for Evaluation Question: Is their significant growth in Saxon schools’ performance over time?
Table A1. HLM Results for Sample 1-All Cohorts’ Performance on TAAS Math Texas Learning Index (Growth by Cohort)
Coefficient Std. Error t ratio Sig. Level
Intercept, BOO 70.45 0.43 162.28 0.000
Time Slope 3.53 0.2� 12.26 0.000
Cohort -0.34 0.21 -1.64 0.101
Table A2. HLM Results for Sample 1-All Cohorts’ Performance on TAAS Math Texas Learning Index (Growth)
Coefficient Std. Error t ratio Sig. Level
Intercept, BOO 70.41 0.43 162.58 0.000
Time Slope 3.1� 0.21 14.�1 0.000
Table A3. HLM Results for Sample 2- Performance on TAKS Math Scale Score (Growth)
Coefficient Std. Error t ratio Sig. Level
Intercept, BOO 2136.3� 7.4� 285.13 0.000
Time Slope 23.62 5.06 4.67 0.000
Two-level HLM analyses were also performed including cohort for TAAS Sample 1 (see Figure A1). Time and the interaction of time and cohort were modeled. Results showed no significant slope coefficient for cohort*time. This means that results were consistent across cohorts. Results for all cohorts in TAAS Sample 1 are therefore presented in the main text of this report. It should also be noted that for samples 1 and 2, only linear growth was modeled because there are only 3 time points associated with this sample (Singer & Willett, 2003).
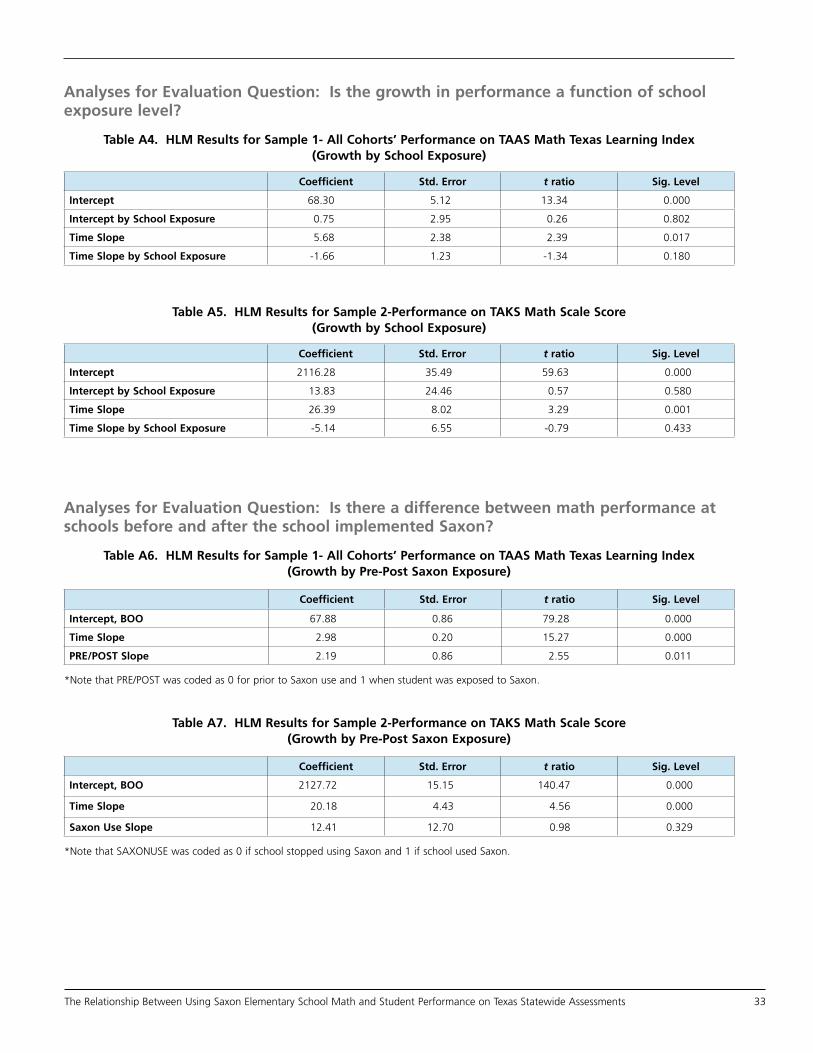
The Relationship Between Using Saxon Elementary School Math and Student Performance on Texas Statewide Assessments 33
Analyses for Evaluation Question: Is the growth in performance a function of school exposure level?
Table A4. HLM Results for Sample 1- All Cohorts’ Performance on TAAS Math Texas Learning Index (Growth by School Exposure)
Coefficient Std. Error t ratio Sig. Level
Intercept 68.30 5.12 13.34 0.000
Intercept by School Exposure 0.75 2.�5 0.26 0.802
Time Slope 5.68 2.38 2.3� 0.017
Time Slope by School Exposure -1.66 1.23 -1.34 0.180
Table A5. HLM Results for Sample 2-Performance on TAKS Math Scale Score (Growth by School Exposure)
Coefficient Std. Error t ratio Sig. Level
Intercept 2116.28 35.4� 5�.63 0.000
Intercept by School Exposure 13.83 24.46 0.57 0.580
Time Slope 26.3� 8.02 3.2� 0.001
Time Slope by School Exposure -5.14 6.55 -0.7� 0.433
Table A7. HLM Results for Sample 2-Performance on TAKS Math Scale Score (Growth by Pre-Post Saxon Exposure)
Coefficient Std. Error t ratio Sig. Level
Intercept, BOO 2127.72 15.15 140.47 0.000
Time Slope 20.18 4.43 4.56 0.000
Saxon Use Slope 12.41 12.70 0.�8 0.32�
*Note that SAXONUSE was coded as 0 if school stopped using Saxon and 1 if school used Saxon.
Analyses for Evaluation Question: Is there a difference between math performance at schools before and after the school implemented Saxon?
Table A6. HLM Results for Sample 1- All Cohorts’ Performance on TAAS Math Texas Learning Index (Growth by Pre-Post Saxon Exposure)
Coefficient Std. Error t ratio Sig. Level
Intercept, BOO 67.88 0.86 7�.28 0.000
Time Slope 2.�8 0.20 15.27 0.000
PRE/POST Slope 2.1� 0.86 2.55 0.011
*Note that PRE/POST was coded as 0 for prior to Saxon use and 1 when student was exposed to Saxon.

34 Final Report
Analyses for Evaluation Question: Is there growth in the achievement of different types of students?
Table A8. HLM Results for Sample 1-All Cohort’s Performance on TAAS Math Texas Learning Index (Growth by Subgroup)
Coefficient Std. Error t ratio Sig. Level
White, B01 �.�8 0.87 11.51 0.000
White, B11 -3.08 0.44 -7.02 0.000
Black, B01 -8.�2 1.08 -8.30 0.000
Black, B11 1.2� 0.55 2.34 0.01�
Hispanic, B01 -�.84 1.11 -8.87 0.000
Hispanic, B11 3.44 0.55 6.21 0.000
Female, B01 2.32 0.86 2.6� 0.008
Female, B11 0.�7 0.43 2.26 0.024
Economically Disadvantaged, B01 -11.75 0.87 -13.50 0.000
Economically Disadvantaged, B11 2.18 0.45 4.86 0.000
Title I, B01 -7.�7 0.86 -�.23 0.000
Title I, B11 1.81 0.43 4.18 0.000
Limited English Proficiency, B01 -21.83 2.65 -8.23 0.000
Limited English Proficiency, B11 10.5� 1.38 7.6� 0.000
At Risk, B01 -15.11 1.0� -13.8� 0.000
At Risk, B11 2.44 0.60 4.06 0.000
Special Education, B01 -32.1� 1.71 -18.7� 0.000
Special Education, B11 -3.62 0.88 -4.10 0.000
*Note that WHITE (vs. others), BLACK (vs. Whites), HISPANIC (vs. Whites), FEMALE (vs. males), ECODIS (vs. non-economically disadvantaged), TITLE1 (vs. no Title I participation), LEP (vs. not Limited English Proficiency), ATRISK (vs. not at risk of dropping out), and SPECED (vs. not special education) were coded as 1 and all others were coded as 0.
To ease in the presentation of findings, only changes in intercept and slope by subgroup designation (DEMO) is presented in Tables A8 and A�. In addition, special education status was not analyzed because of the very small sample size in the TAKS sample (n=57).

The Relationship Between Using Saxon Elementary School Math and Student Performance on Texas Statewide Assessments 35
Table A9. HLM Results for Sample 2-Performance on TAKS Math Scale Score (Growth by Subgroups)
Coefficient Std. Error t ratio Sig. Level
White, B01 147.38 15.08 �.77 0.000
White, B11 -25.16 10.36 -2.43 0.015
Black, B01 -163.�2 17.03 -�.62 0.000
Black, B11 14.03 13.36 1.05 0.2�4
Hispanic, B01 -132.25 17.2� -7.65 0.000
Hispanic, B11 2�.1� 11.28 2.5� 0.010
Gender, B01 -11.37 14.�3 -0.76 0.447
Gender, B11 6.16 10.08 0.61 0.540
Economically Disadvantaged, B01 -114.22 15.30 -7.46 0.000
Economically Disadvantaged, B11 4.3� 10.08 0.44 0.663
Title I, B01 -11�.53 18.16 -6.58 0.000
Title I, B11 1�.41 12.25 1.58 0.113
Limited English Proficiency, B01 -48.73 24.03 -2.03 0.042
Limited English Proficiency, B11 22.24 15.57 1.43 0.153
At Risk, B01 -104.34 16.52 -6.32 0.000
At Risk, B11 0.55 11.32 0.05 0.�61
*Note that WHITE (vs. others), BLACK (vs. Whites), HISPANIC (vs. Whites), FEMALE (vs. males), ECODIS (vs. non-economically disadvantaged), TITLE1 (vs. no Title I participation), LEP (vs. not Limited English Proficiency), and ATRISK (vs. not at risk of dropping out) were coded as 1 and all others were coded as 0.
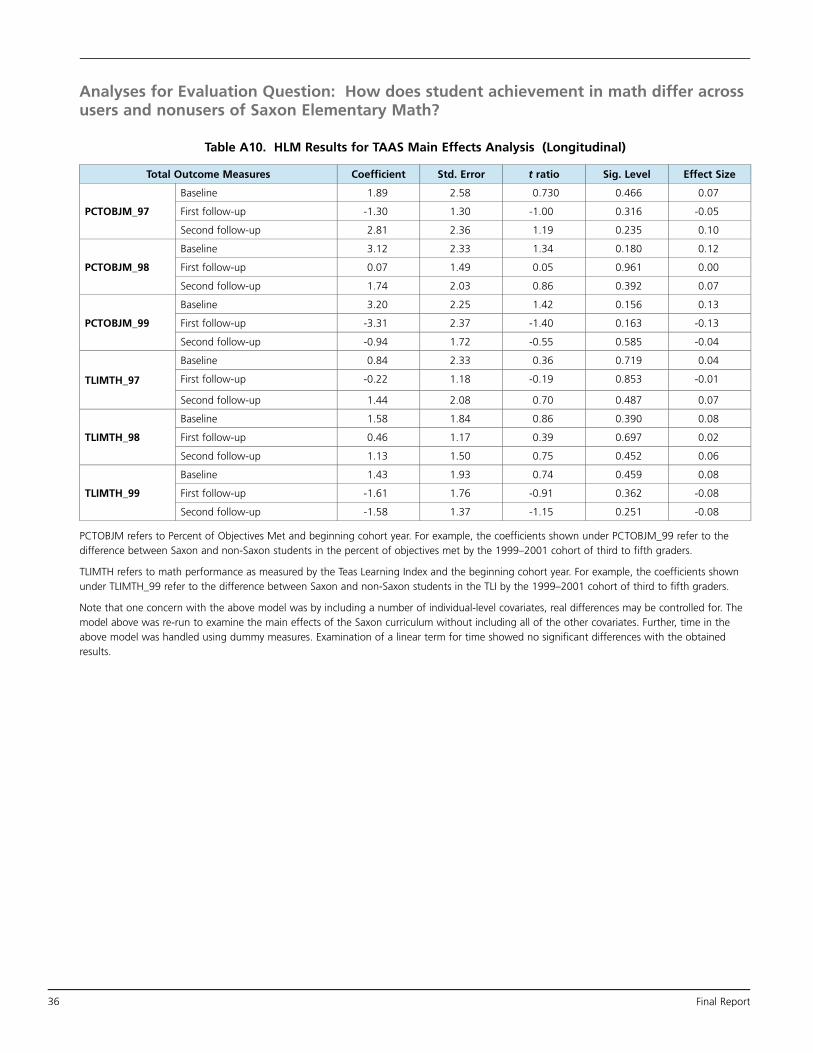
36 Final Report
Analyses for Evaluation Question: How does student achievement in math differ across users and nonusers of Saxon Elementary Math?
Table A10. HLM Results for TAAS Main Effects Analysis (Longitudinal)
Total Outcome Measures Coefficient Std. Error t ratio Sig. Level Effect Size
PCTOBJM_97
Baseline 1.8� 2.58 0.730 0.466 0.07
First follow-up -1.30 1.30 -1.00 0.316 -0.05
Second follow-up 2.81 2.36 1.1� 0.235 0.10
PCTOBJM_98
Baseline 3.12 2.33 1.34 0.180 0.12
First follow-up 0.07 1.4� 0.05 0.�61 0.00
Second follow-up 1.74 2.03 0.86 0.3�2 0.07
PCTOBJM_99
Baseline 3.20 2.25 1.42 0.156 0.13
First follow-up -3.31 2.37 -1.40 0.163 -0.13
Second follow-up -0.�4 1.72 -0.55 0.585 -0.04
TLIMTH_97
Baseline 0.84 2.33 0.36 0.71� 0.04
First follow-up -0.22 1.18 -0.1� 0.853 -0.01
Second follow-up 1.44 2.08 0.70 0.487 0.07
TLIMTH_98
Baseline 1.58 1.84 0.86 0.3�0 0.08
First follow-up 0.46 1.17 0.3� 0.6�7 0.02
Second follow-up 1.13 1.50 0.75 0.452 0.06
TLIMTH_99
Baseline 1.43 1.�3 0.74 0.45� 0.08
First follow-up -1.61 1.76 -0.�1 0.362 -0.08
Second follow-up -1.58 1.37 -1.15 0.251 -0.08
PCTOBJM refers to Percent of Objectives Met and beginning cohort year. For example, the coefficients shown under PCTOBJM_�� refer to the difference between Saxon and non-Saxon students in the percent of objectives met by the 1���–2001 cohort of third to fifth graders.
TLIMTH refers to math performance as measured by the Teas Learning Index and the beginning cohort year. For example, the coefficients shown under TLIMTH_�� refer to the difference between Saxon and non-Saxon students in the TLI by the 1���–2001 cohort of third to fifth graders.
Note that one concern with the above model was by including a number of individual-level covariates, real differences may be controlled for. The model above was re-run to examine the main effects of the Saxon curriculum without including all of the other covariates. Further, time in the above model was handled using dummy measures. Examination of a linear term for time showed no significant differences with the obtained results.

The Relationship Between Using Saxon Elementary School Math and Student Performance on Texas Statewide Assessments 37
Table A11. HLM Results for TAKS Main Effects Analysis (Longitudinal)
Outcome Measures Coefficient Std. Error t ratio Sig. Level Effect Size
Math Scale Score
Baseline -3.27 25.65 -0.13 0.8�� -0.01
First follow-up 12.53 22.45 0.56 0.576 0.05
Second follow-up 7.35 21.50 0.34 0.732 0.03
% Correct on Numbers, Operations and Quantitative Reasoning
Baseline -1.82 2.34 -0.78 0.437 -0.08
First follow-up 3.51 1.8� 1.85 0.063 0.16
Second follow-up 1.�8 1.81 1.0� 0.275 0.0�
% Correct on Patterns, Relationships, and Algebraic Reasoning
Baseline -1.�1 2.5� -0.74 0.460 -0.08
First follow-up 2.74 2.26 1.21 0.226 0.12
Second follow-up 4.03 2.36 1.71 0.086 0.17
% Correct on Geometry and Spatial Reasoning
Baseline -0.65 1.�7 -0.33 0.740 -0.03
First follow-up -1.66 1.�6 -0.85 0.3�6 -0.07
Second follow-up 0.46 1.47 0.31 0.755 0.02
% Correct on Concepts and Uses of Measurement
Baseline -1.04 2.61 -0.40 0.6�1 -0.05
First follow-up 4.31 3.24 1.33 0.184 0.1�
Second follow-up 1.73 2.80 0.62 0.536 0.08
% Correct on Probability and Statistics
Baseline -0.18 2.63 -0.07 0.�45 -0.01
First follow-up 0.63 2.45 0.26 0.7�7 0.03
Second follow-up 1.06 2.28 0.47 0.640 0.04
% Correct on Mathematical Processes and Tools
Baseline -0.10 2.66 -0.04 0.�7 -0.00
First follow-up 2.14 2.27 0.�4 0.35 0.0�
Second follow-up 1.32 1.8� 0.6� 0.4� 0.06
Models were run for the TAKS measures without controlling for (a) other covariates, and (b) linear time. The results were consistent with those reported above.
Table A12. MANCOVA Results for TAAS Cohort Analysis
df F** Sig. Effect Size
GroupTLI-Math 1, 20888 46.05 .000 .0�
% Objective Mastered 1, 20888 76.62 .000 .13
GradeTLI-Math 2, 20888 155.0� .000
% Objective Mastered 2, 20888 10.38 .000
Group * Grade
TLI-Math 2, 20888 2.47 .084
% Objective Mastered 2, 20888 1.41 .244
** Covariates appearing in the model were all significant and included Gender, Hispanic Students (vs. others), White Students (vs. others), Economically Disadvantaged, Title I Participation, LEP Status, and At Risk of Dropping Out.

38 Final Report
Table A14. HLM Results for Sample 1-Growth on TAAS Percent of Objectives Mastered by Pre-Post Saxon Exposure (Includes Control Schools)
Coefficient Std. Error t ratio Sig. Level
Intercept, BOO 71.33 1.21 5�.05 0.000
Time Slope 0.56 0.61 0.�3 0.355
PRE/POST Slope 7.0� 3.13 2.26 0.024
Table A13. HLM Results for Sample 1-Growth on TAAS TLI by Pre-Post Saxon Exposure (Includes Control Schools)
Coefficient Std. Error t ratio Sig. Level
Intercept, BOO 66.64 0.�8 68.0� 0.000
Time Slope 3.66 0.48 7.68 0.000
PRE/POST Slope 5.5� 2.56 2.18 0.02�
Table A15. Subgroup Saxon Effects for TAKS dataset
Total Outcome Measures Coefficient Std. Error t ratio Sig. Level
Sex
Baseline 21.30 1�.00 1.12 0.263
First follow-up 14.57 18.02 0.81 0.41�
Second follow-up -16.45 21.53 -0.76 0.445
White
Baseline 18.20 35.4� 0.51 0.608
First follow-up -32.01 27.75 -1.15 0.24�
Second follow-up -81.33 20.8� -3.8� 0.000
Hispanic
Baseline -2.75 33.12 -0.08 0.�34
First follow-up 30.4� 23.64 1.2� 0.1�6
Second follow-up 47.73 26.43 1.81 0.071
Economically Disadvantaged
Baseline �.65 35.18 0.27 0.784
First follow-up -1.11 1�.62 -0.06 0.�55
Second follow-up 54.�3 24.6� 2.23 0.026
Title I
Baseline 62.55 42.47 1.47 0.141
First follow-up 15.78 2�.51 0.54 0.5�2
Second follow-up 81.80 26.14 3.13 0.002
Limited English Proficiency
Baseline 7�.60 50.�4 1.56 0.118
First follow-up 0.66 30.87 0.02 0.�83
Second follow-up 2.81 50.48 0.06 0.�56
Special Education
Baseline -33.43 52.�7 -0.63 0.528
First follow-up 138.�6 46.02 3.02 0.003
Second follow-up 177.81 71.2� 2.4� 0.013
At Risk
Baseline 1�.�4 30.57 -0.65 0.514
First follow-up 53.08 26.0� 2.04 0.042
Second follow-up 67.87 26.65 2.55 0.011

The Relationship Between Using Saxon Elementary School Math and Student Performance on Texas Statewide Assessments 3�
Table A16. Subgroup Effects for TAAS TLI Math for 97-99 Cohort
Total Outcome Measures Coefficient Std. Error t ratio Sig. Level
Sex
Baseline 3.�3 2.28 1.73 0.084
First follow-up -4.05 1.88 -2.15 0.031
Second follow-up -0.34 1.�0 -0.18 0.860
White
Baseline -3.18 3.31 -0.�6 0.336
First follow-up 1.34 2.12 0.63 0.527
Second follow-up -1.44 3.16 -0.46 0.650
Hispanic
Baseline 5.55 4.43 1.25 0.211
First follow-up -2.18 2.53 -0.86 0.388
Second follow-up -1.20 4.�6 -0.24 0.810
Economically Disadvantaged
Baseline 1.67 3.45 0.48 0.628
First follow-up -2.11 2.70 -0.78 0.436
Second follow-up 0.60 3.36 0.18 0.860
Title I
Baseline 1.68 3.60 0.47 0.641
First follow-up 2.35 2.55 0.�2 0.356
Second follow-up 2.�2 3.6� 0.7� 0.427
Limited English Proficiency
Baseline 8.70 13.00 0.67 0.503
First follow-up 4.1� 6.74 0.62 0.533
Second follow-up -3.44 �.14 -0.38 0.707
Special Education
Baseline 7.65 6.18 1.24 0.216
First follow-up -3.51 4.05 -0.87 0.387
Second follow-up -12.57 6.36 -1.�8 0.048
At Risk
Baseline 18.1� 7.66 2.37 0.018
First follow-up -4.05 4.25 -0.�5 0.341
Second follow-up -14.70 7.06 -2.08 0.037
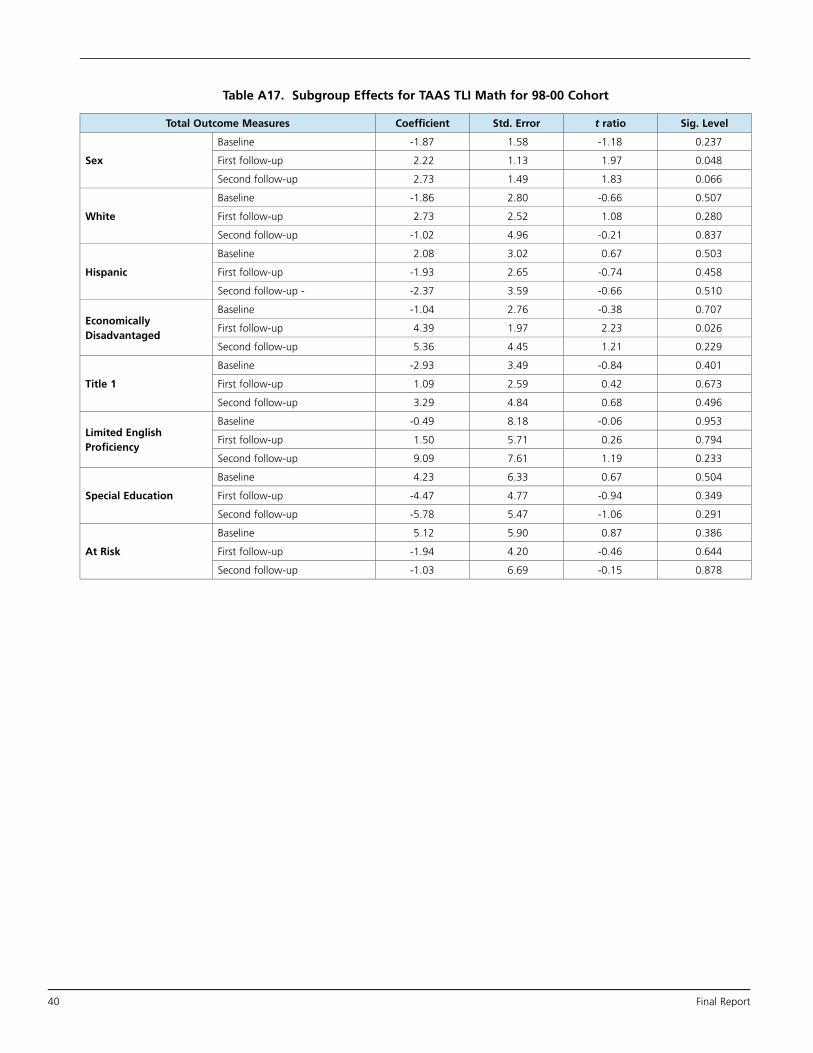
40 Final Report
Table A17. Subgroup Effects for TAAS TLI Math for 98-00 Cohort
Total Outcome Measures Coefficient Std. Error t ratio Sig. Level
Sex
Baseline -1.87 1.58 -1.18 0.237
First follow-up 2.22 1.13 1.�7 0.048
Second follow-up 2.73 1.4� 1.83 0.066
White
Baseline -1.86 2.80 -0.66 0.507
First follow-up 2.73 2.52 1.08 0.280
Second follow-up -1.02 4.�6 -0.21 0.837
Hispanic
Baseline 2.08 3.02 0.67 0.503
First follow-up -1.�3 2.65 -0.74 0.458
Second follow-up - -2.37 3.5� -0.66 0.510
Economically Disadvantaged
Baseline -1.04 2.76 -0.38 0.707
First follow-up 4.3� 1.�7 2.23 0.026
Second follow-up 5.36 4.45 1.21 0.22�
Title 1
Baseline -2.�3 3.4� -0.84 0.401
First follow-up 1.0� 2.5� 0.42 0.673
Second follow-up 3.2� 4.84 0.68 0.4�6
Limited English Proficiency
Baseline -0.4� 8.18 -0.06 0.�53
First follow-up 1.50 5.71 0.26 0.7�4
Second follow-up �.0� 7.61 1.1� 0.233
Special Education
Baseline 4.23 6.33 0.67 0.504
First follow-up -4.47 4.77 -0.�4 0.34�
Second follow-up -5.78 5.47 -1.06 0.2�1
At Risk
Baseline 5.12 5.�0 0.87 0.386
First follow-up -1.�4 4.20 -0.46 0.644
Second follow-up -1.03 6.6� -0.15 0.878

The Relationship Between Using Saxon Elementary School Math and Student Performance on Texas Statewide Assessments 41
Table A18. Subgroup Effects for TAAS TLI Math for 99-01 Cohort
Total Outcome Measures Coefficient Std. Error t ratio Sig. Level
Sex
Baseline -1.0� 1.24 -0.88 0.378
First follow-up 2.03 1.22 1.67 0.0�5
Second follow-up 1.0� 1.47 0.74 0.45�
White
Baseline -0.01 2.�2 -0.00 0.��7
First follow-up 3.72 2.5� 1.44 0.150
Second follow-up 0.17 1.�5 0.0� 0.�31
Hispanic
Baseline -2.66 2.25 -1.18 0.237
First follow-up -1.33 2.4� -0.54 0.5�2
Second follow-up 0.80 2.63 0.30 0.761
Economically Disadvantaged
Baseline 2.11 2.45 0.86 0.3�0
First follow-up -3.�2 2.34 -1.67 0.0�4
Second follow-up -2.23 2.25 -0.�� 0.323
Title 1
Baseline -1.46 2.51 -0.58 0.560
First follow-up -5.67 2.17 -2.62 0.00�
Second follow-up -1.18 2.40 -0.4� 0.622
Limited English Proficiency
Baseline �.73 12.8� 0.75 0.451
First follow-up -6.5� 10.08 -0.65 0.513
Second follow-up -6.65 11.4� -0.58 0.562
Special Education
Baseline -6.12 5.18 -1.18 0.237
First follow-up �.54 2.80 3.40 0.001
Second follow-up -5.87 4.00 -1.47 0.143
At Risk
Baseline 5.72 4.10 1.40 0.163
First follow-up -4.�3 4.10 -1.20 0.22�
Second follow-up -6.32 5.00 -1.26 0.207

This page intentionally left blank.

This page intentionally left blank.

44 Final Report
©2006 Harcourt AchieveAll rights reserved. Printed in U.S.A.
XM/NY/Print/07-06���4038761 IND
���403877X 10PK
www.HarcourtAchieve.com1.800.531.5015


