
The Rise of German Protectionism in the 1870s: A
Macroeconomic Perspective∗
Asaf Zussman
Department of Economics, Hebrew University
April 29, 2008
Abstract
The 1879 German ‘iron and rye’ tariff marked a turning point in nineteenth-century
European tariff history. This paper challenges the leading political-economy explana-
tions for the adoption of the tariff that focus on the effects of a decline in European
grain prices on Germany’s income distribution. Instead it claims that severe macro-
economic imbalances caused by the Franco-Prussian War indemnity played the crucial
role in the rise of protectionism in Germany in the 1870s and in the eventual adoption
of the tariff.
JEL classification codes: F4, F5, N1, N4
Keywords: Protectionism, Reparations, Franco-Prussian War
∗For their helpful suggestions and comments I would like to thank Avner Greif, Ronald McKinnon,
Romain Wacziarg, Assaf Razin, Mark Wright, Guillaume Daudin, and seminar participants at Stanford,
Cornell, and Trinity College, Dublin. The responsibility for all remaining errors is entirely my own. I
gratefully acknowledge financial assistance from the Stanford Institute for Economic Policy Research, the
European Science Foundation and the Institute for International Integration Studies, Trinity College, Dublin.
1
1 Introduction
The years following the 1860 Cobden-Chevalier trade treaty between Britain and France
were characterized by comprehensive trade liberalization in Europe. Inclusion of a most
favored nation clause in many of the trade treaties of the period made the spread of free
trade much easier. Germany, or more correctly its economic predecessor, the Zollverein,
was also liberalizing its trade. Then, in 1879, Germany changed its course and adopted the
‘iron and rye’ tariff. From this point until the outbreak of the First World War there was
a gradual return to protectionism in continental Europe. In this respect and in others the
German tariff of 1879 is considered to be a landmark event.1
What led to the adoption of the German ‘iron and rye’ tariff? Many historians, political
scientists and economists have proposed answers to this question over the years. The leading
explanations concentrate on interest groups within Germany. Using trade-theoretic models
these interest groups are defined along either sectoral or factoral lines. The focus in this
line of research is usually on the Prussian Junkers. As owners of large grain-producing
estates in Eastern Germany, so the typical story goes, their interests were hurt by falling
transatlantic and other transportation costs that translated into declining grain prices in
European markets.2 In reaction to these developments the Junkers successfully used their
political power to pressure Chancellor Bismarck into providing them with protection from
foreign competition.
This paper challenges the empirical validity of the explanation outlined above for the
adoption of the German tariff. It offers an alternative explanation that better fits the histor-
ical record. The explanation focuses on macroeconomic developments in Germany and traces
the roots of the process that led to the adoption of the 1879 tariff to the indemnity imposed
by Bismarck on France following the 1870/1 Franco-Prussian War. The war indemnity, in
essence a very large capital inflow, translated into a massive stimulus. This led in turn to
fast growth, price inflation and other symptoms that are typically observed in episodes of
large capital inflows.1As will be explained below, the tariff was very important in the reorganization of German politics.2The Junkers’ interests were hurt in the sense that the real return to land decreased as a result of the
decline in grain prices.
2
When the indemnity inflows stopped the boom turned into a depression. Very low rates
of growth coupled with exchange rate overvaluation led to increasing demand for protection
from a wide coalition of producers of tradable goods. Increased demand for protection was
matched by increased supply.3 Ever since the establishment of the Second German Reich
in 1871 its Chancellor, Bismarck, was interested in making the German federal government
independent in terms of tax revenues. Bismarck was more willing to support tariffs in the
second part of the 1870s because the slowdown in growth increased the dependence of the
German federal government on the member states for tax revenues. This matching of demand
and supply forces ultimately led to the adoption of the ‘iron and rye’ tariff in 1879.
The rest of the paper is organized as follows. The next section summarizes and critically
evaluates the existing explanations for the adoption of the 1879 tariff. The paper then turns
to an analysis of the effects of the Franco-Prussian War indemnity on the German economy
and of the connection between those effects and the rise of the protectionist coalition. The
last section briefly summarizes the main arguments of the paper.
2 Existing Explanations for the 1879 Tariff
The leading political-economy explanations for the ‘iron and rye’ tariff rely on trade-theoretic
models and focus on the changing income distribution among German interest groups. More
specifically the claim is that falling transatlantic and other transportation costs led to a
decline in European grain prices. As owners of large grain-producing estates, the Junkers
were hurt by the decline in grain prices and therefore became the leading supporters of tariff
protection.
Ronald Rogowski applies a Heckscher-Ohlin (Stolper-Samuelson) approach to analyze
the adoption of the ‘iron and rye’ tariff.4 In his model there are three factors of production:
labor, land and capital. By Rogowski’s account until the mid-1870s Germany had been
relatively abundant in labor and land and relatively scarce in capital. Falling transportation3The paper loosely applies a common distinction between demand and supply forces in the adoption of
tariffs. On the demand side there are private sector interests that ask for tariff protection; on the supply
side there is the government that decides on the magnitude and coverage of tariff protection.4Rogowski (1989).
3
costs allowed the massive entrance of land-abundant countries such as the United States into
the international grain market, making Germany (presumably during the 1870s) relatively
scarce in both land and capital. As a reaction to these changing circumstances agriculture
joined industry in support of protection, leading to the adoption of the ‘iron and rye’ tariff
in 1879.
Peter Gourevitch (implicitly) applies a specific factors model approach to explain the
adoption of the 1879 tariff.5 According to Gourevitch the demand for tariff protection came
from a coalition of owners of specific factors. The Junkers, who were motivated by a decline
in grain prices, led this coalition together with the producers of iron and steel. Gourevitch
allows for a large number of sectors in his analysis to capture potential sectoral conflicts of
interest. For example, he claims that grain-producing agricultural sub-sectors (led by the
Junkers) tended to support the imposition of tariffs on grain while grain-using agricultural
sub-sectors (such as animal husbandry) were much less protectionist.6
Many other accounts of the tariff agree with Rogowski’s and Gourevitch’s line of argu-
ment.7 The German 1879 tariff is often considered as the first in a series of European tariffs
(including in Germany itself) resulting from agriculture’s demand to protect itself from the
effects of increasing integration in the international economy. As such the ‘iron and rye’ tariff
is perceived as an early example of a backlash against globalization.8 Despite the popularity
of this approach the literature often neglects to empirically substantiate the central pillar of5Gourevitch (1986).6This distinction was stressed earlier in Gerschenkron (1943).7For example, Schonhardt-Bailey (1998) uses parliamentary voting data to examine not only the emer-
gence of the ‘marriage of iron and rye’ but also the evolution of the coalition over three decades. She finds
that Rogowski’s factor-endowment model captures quite well the long-run evolution of the coalition. Her
econometric analysis of the 1879 vote on tariff protection attempts to relate the voting patterns of Reichstag
members to the production profiles of the regions they represented. She finds no evidence of a significant dif-
ference between grain production and animal husbandry and between light and heavy industry. Klug (2001)
employs an occupational based analysis of voting patterns in the 1877 and 1878 elections in Germany. The
analysis assumes an imperfect mobility of labor version of the specific-factors model. For the 1877 elections
the evidence suggests that workers employed in industries that were competing successfully in the export
market tended to favor free trade and that workers employed in industries threatened by foreign competition
tended to vote for protection. No such evidence was found for the 1878 elections.8See, for example, O’Rourke (1997) and O’Rourke and Williamson (1999).
4
the argument — the decline in German, and more generally in European, grain prices. The
empirical analysis conducted below finds little support for the ‘grain invasion’ argument in
the case of Germany.9
The first part of the empirical strategy employed here to substantiate the above claim is
estimation of the potential (counter-factual) price shock that the ‘grain invasion’ would have
implied for Germany’s grain producers if this country had not adopted a protectionist policy.
This counter-factual shock is simply the changes, during the period 1870-1913, in the real
prices of grain in the European market weighted according to the relative importance of each
type of grain in Germany at the start of the period.10 The behavior of European grain prices
will be proxied by the behavior of grain prices in Britain and Denmark. Unlike many other
European countries Britain and Denmark did not impose tariffs on grain during the period
under investigation. Thus British and Danish grain prices reflect, in first approximation,
the prices of grain in the European market.11 If there was indeed a substantial decline in
real grain prices in Europe during the period 1870-1913 it should be reflected in British and
Danish data.12
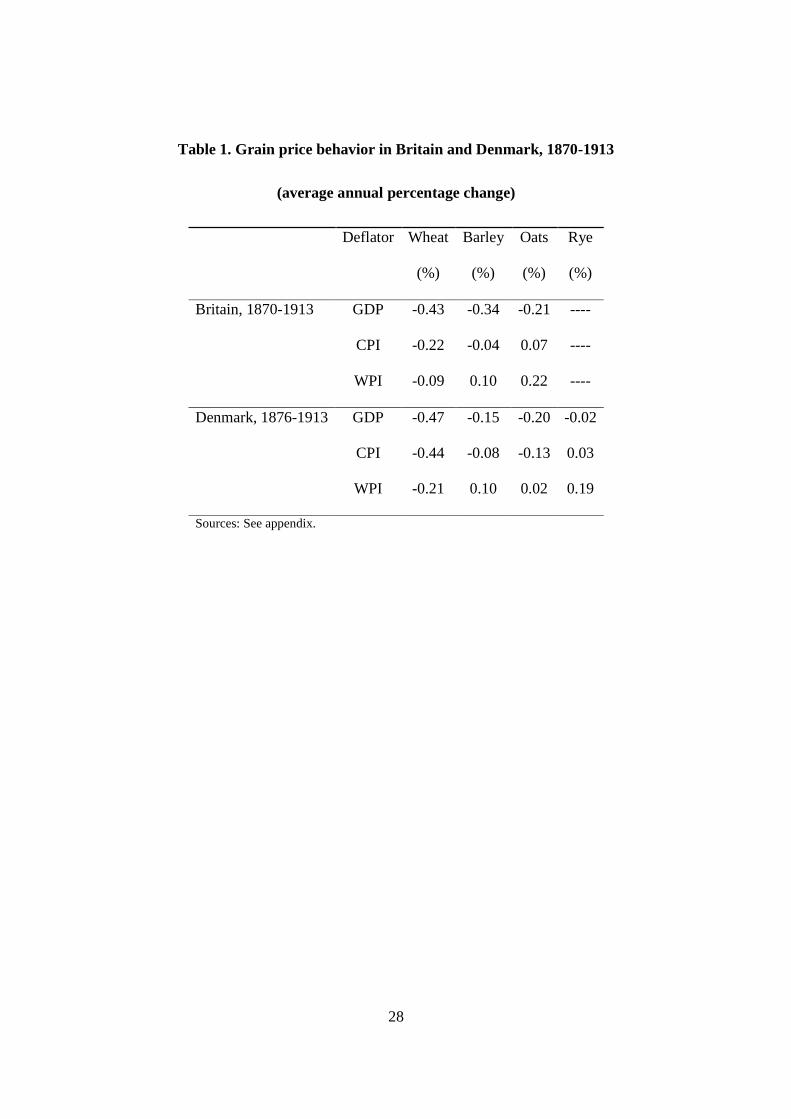
Table 1 displays the average annual percentage change in the real price of wheat, barley,
and oats in Britain during the period 1870-1913 and of these three grains and rye in Denmark
during the period 1876-1913.13 Real prices were obtained by alternatively deflating nominal
grain prices with Britain’s and Denmark’s GDP deflator, consumer price index (CPI), and
wholesale price index (WPI).14
[Insert table 1 here]9The term ‘grain invasion’ is borrowed from O’Rourke (1997).10Following O’Rourke (1997) the investigation is focused on the period 1870-1913.11No correction is introduced for intra-European transportation costs. Further discussion of the validity
of the approximation approach is provided below.12Britain was a net importer of all grains during the period under investigation. Denmark was a net
importer of wheat, rye and oats but a net exporter of barley in the first part of the period. This difference
implies that Denmark is expected to have experienced a smaller decline in the price of barley relative to
Britain during the period. See the appendix for data sources.13Rye prices are unavailable for Britain. Wholesale prices are unavailable for Denmark prior to 1876 and
therefore the period examined in this case is 1876-1913.14See the appendix for data sources and methods.
5
The table clearly shows that the degree of price decline varies with the choice of price
deflator: for both countries the largest declines are recorded when the GDP deflator is used
to derive real prices, followed by the CPI and then the WPI. The dependence of results on
the choice of deflator tends to raise the question: which deflator should be used to deflate
nominal grain prices?
There is one very good reason why the WPI should be the preferred deflator.15 Relative
to the WPI, the CPI and the GDP deflator contain much larger non-tradable components.
The pattern of price behavior that was observed in table 1 therefore implies that the price
of non-tradables relative to tradables was rising in both countries during the period under
examination. Why was the relative price of non-tradables rising over time in both the United
Kingdom and Denmark? This pattern of behavior of relative prices is quite common. It is
usually attributed in the international macroeconomics literature to a positive productivity
growth differential between the tradable and the non-tradable sectors in the economy.16 The
‘grain invasion’ argument is about declining transportation costs, not about productivity
growth differentials between sectors. In order to isolate better the effects of the ‘transporta-
tion revolution’ on real grain prices a relatively tradable price index should be used as a
deflator. In this respect the WPI is the appropriate choice. Using the CPI or the GDP
deflator, on the other hand, will create a downward bias in the measurement of real grain
price changes.17 The behavior of WPI deflated prices of grain in the United Kingdom and
Denmark during the period under investigation is displayed in figures 1 and 2.
[Insert figures 1 and 2 here]
Table 1 and figures 1 and 2 demonstrate that the degree of price decline varies also with
the type of grain being examined. In Britain the real price of wheat has decreased most,15Many authors use either the CPI or the GDP deflator while some do not deflate nominal prices at all.
An exception to this practice is found in Kindleberger (1951), where nominal prices are deflated by the WPI
in an examination of Danish grain price behavior.16This argument is known as the Balassa-Samuelson hypothesis. The original references are Balassa (1964)
and Samuelson (1964).17Another reason why the WPI should be used to deflate nominal grain prices is that the ‘grain invasion’
argument is trade-theoretic. This implies a need to analyze the behavior of the prices of grains relative to
the prices of other tradable goods. In this respect the WPI again seems to be a more appropriate choice.
6
followed by barley and oats. In Denmark the real price of wheat has also decreased most,
followed by oats, barley and rye. What was the relative importance of these four grains in
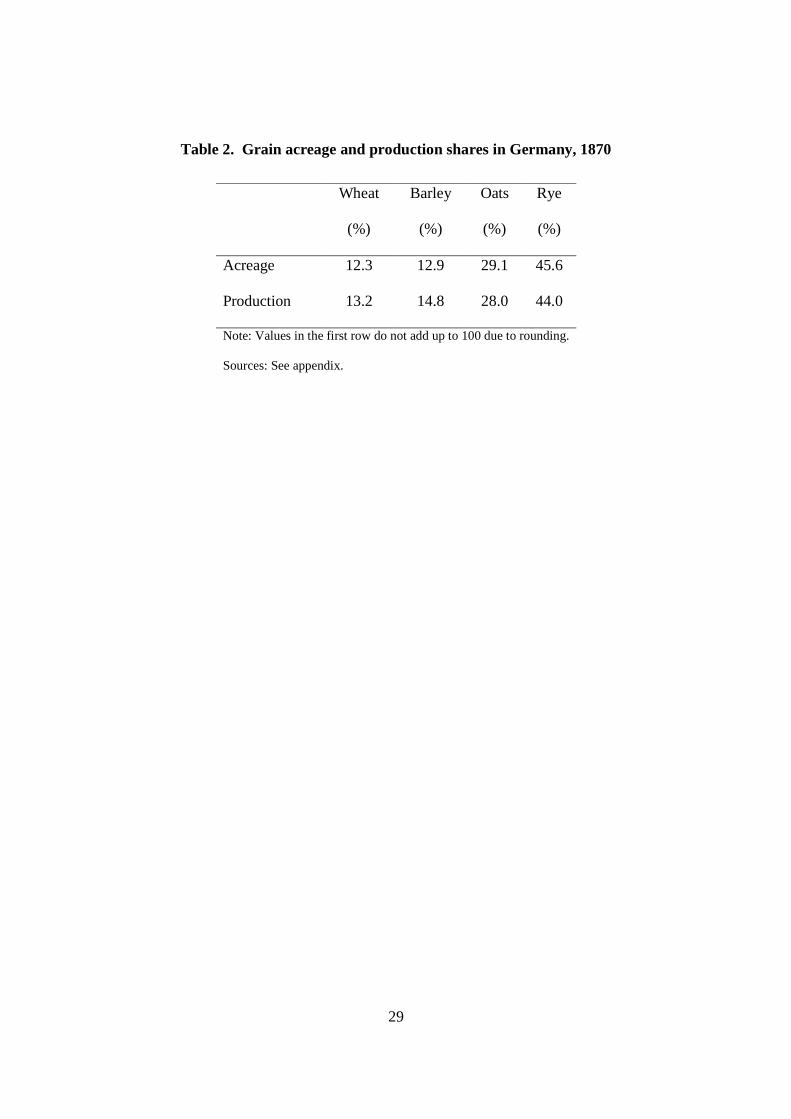
Germany at the start of the ‘grain invasion’? Table 2 answers this question by displaying
data for 1870 on the shares in land under cultivation and the shares in production of wheat,
barley, oats, and rye, the four most important grains in Germany. The table makes it very
clear that according to both criteria the most important grain was rye by far, followed by
oats, barley, and wheat.18
[Insert table 2 here]
It is now possible to estimate the counter-factual price shock that we set out to obtain
by combining the data on changes in European real (WPI deflated) grain prices with the
data on production shares of grain in Germany.19 As a reminder, this weighted grain price
change reflects the potential shock that German grain growers would have been subjected to
if the government had not imposed tariffs on grain. The counter-factual price shock turns
out to be positive: real grain prices would have increased by 0.08 percent per annum.20
Before moving ahead with analysis of real grain price behavior in Europe prior to the
adoption of the ‘iron and rye’ tariff, we need take into account the fact that following
Germany’s imposition of the ‘iron and rye’ tariff in 1879 there was an upward trend in
European tariffs on grain. As some of the countries imposing tariffs were relatively large
their actions must have generated a downward pressure on the international prices of grain.21
Hence there is a bias in favor of finding evidence of declining grain prices in Britain and18O’Rourke and Williamson (1999) use data on net (instead of gross) grain production to compute 1871
shares. The reported (Table 6.4, p. 111) shares in % are: wheat — 34.4, barley — 12.9, oats - 5.6, rye — 47.1.19European grain prices are proxied here by Danish grain prices. It was not possible to conduct this
exercise with British data due to the unavailability of British price data for rye, the most important grain
in German agriculture. Nevertheless it is reasonable to assume that using the British data would not have
changed the results qualitatively, as table 1 demonstrates the similarity between the behavior of grain prices
in Denmark and in Britain. Table 2 makes it clear that using the shares in land under cultivation instead of
the shares in production would not have changed the results qualitatively either.20Using the CPI and the GDP deflator instead of the WPI yielded very small price declines of 0.09% and
0.15% p.a., respectively. Using the O’Rourke-Williamson 1871 net production shares mentioned above with
the WPI deflated prices yielded a price increase of 0.03% p.a..21The magnitude of the decline in international grain prices depends in principle on the relative importance
7
Denmark during the period 1870-1913. If despite this bias no decline in real grain prices
was found, the conclusion that the ‘grain invasion’ argument lacks empirical support for
Germany seems even more warranted.
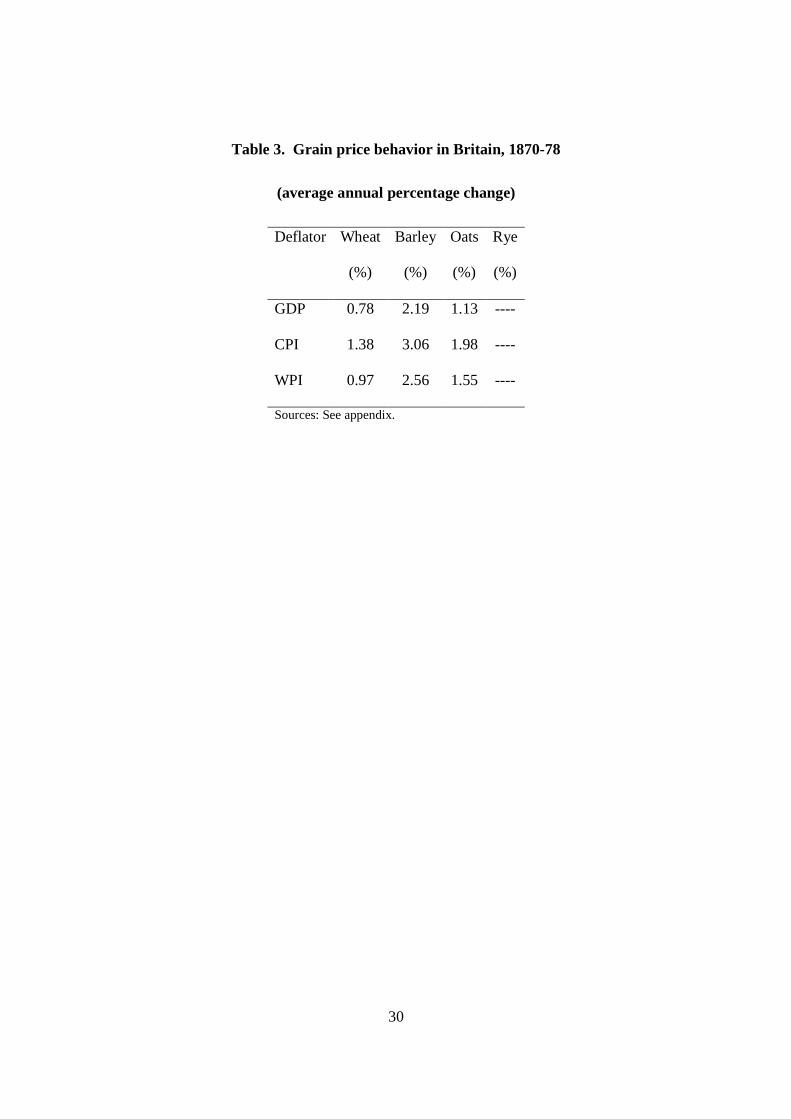
The surprising lack of evidence in support of the ‘grain invasion’ argument during the
entire 1870-1913 period implies that if there was a decline in the real price of grain immedi-
ately prior to the adoption of the ‘iron and rye’ tariff it must have been transitory. Table 3
displays data for this period. It establishes that during the period 1870-8 the real price of
all three grains increased in Britain, regardless of the choice of deflator.22
[Insert table 3 here]
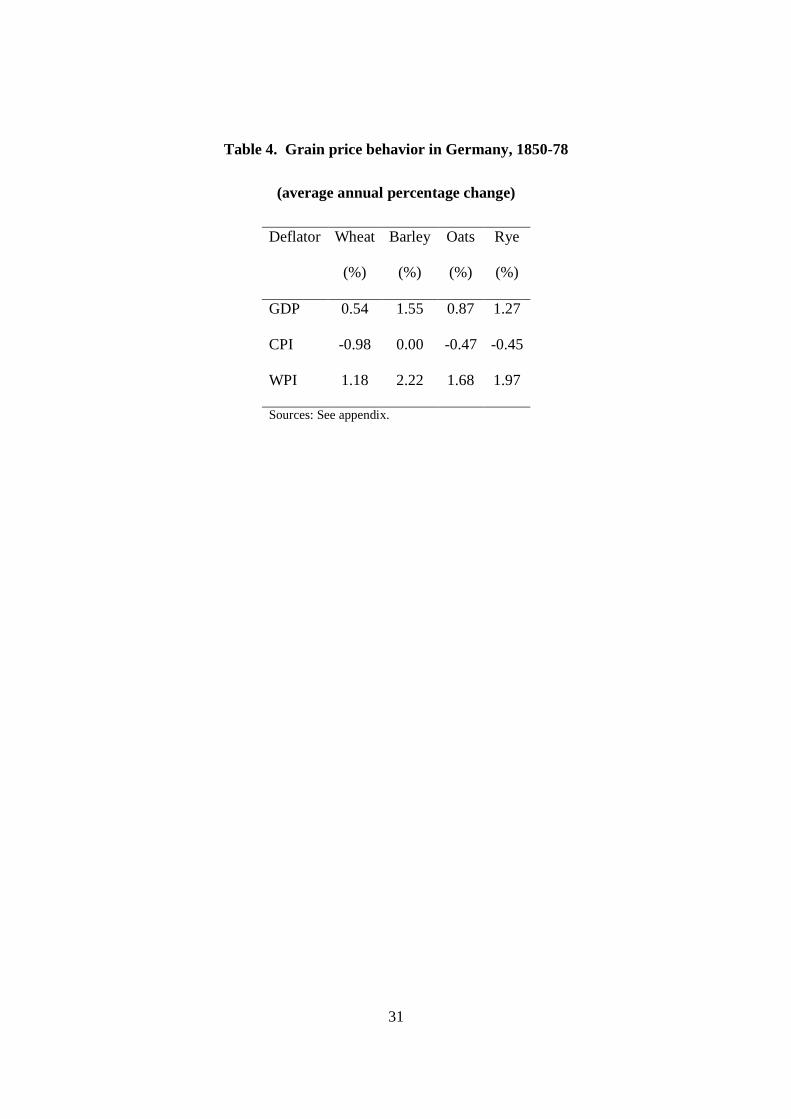
Taking again a longer view, table 4 examines German grain price data in the pre-‘iron
and rye’ tariff period 1850-78. It is again clear that the choice of deflator matters. The
results suggest that the relative price of non-tradables was rising in Germany during the
period under investigation. The WPI deflated grain price series are displayed in figure 3.
They do not exhibit a downward trend over time.
[Insert table 4 here]
[Insert figure 3 here]
In summary, examining both long-term and shorter-term grain price changes reveals that
there is little empirical support for the claim that a ‘grain invasion’ caused the adoption of the
1879 German tariff. The paper will now present and evaluate two other leading explanations
of the ‘iron and rye’ tariff that will be built upon in later sections.
An alternative demand-side explanation for the adoption of the 1879 tariff focuses on
macroeconomic developments in Germany. Specifically, the claim is that the economic slump
in Germany in the second part of the 1870s played a crucial role in the formation of the
protectionist coalition. Ivo Lambi, who wrote one of the most detailed accounts of the rise
of German protectionism in the 1870s, supports this view: ‘The economic crisis which broke
in the market of the tariff-imposing countries and the height of the tariffs imposed by them. The more
important the role of those countries in the market and the higher the tariffs, the lower the international
price would be.22Due to the data limitations mentioned above the corresponding figures were not computed for Denmark.
8
out in 1873 was the basic cause for the reversal of German tariff policy’.23 The argument
linking economic downturns and rising protectionism has been formalized in the literature,
an example being the work of Giulio Gallarotti.24 Gallarotti’s hypothesis is that there
exists an inverse relationship between movements in tariffs and the level of economic activity
within a nation: tariff levels will tend to increase during economic slumps and to decrease
during economic booms. The logic is that during an economic slump demand for protection
increases while the cost that the government has to bear for supplying it (in terms of political
support) falls, leading to protectionist legislation. The reverse is true for periods of economic
prosperity. Gallarotti statistically tests his theory on several countries, including Germany,
concentrating on the nineteenth century. He finds some support for the theory’s predictions
in the data.25 What is lacking in this line of argument is causality: what led to the economic
decline in the second part of the 1870? The next sections address this question.
A prominent line of research on the supply-side of the 1879 tariff emphasizes the role of
the tariff as an independent source of tax revenues for the German central government.26
The second German Reich, established in 1871, had a federal structure. According to its
constitution the federal government practically had only one independent source of revenues:
indirect taxes. These consisted of customs and excise taxes, of which the most important
were consumption taxes. Any shortfall in revenues from indirect taxes was covered by con-
tributions from the German states, which, on their part, mostly relied on direct taxation.
Bismarck was dissatisfied with this system of taxation mainly because it weakened the fed-
eral government’s position relative to the states. Thus he imposed the ‘iron and rye’ tariff23Lambi (1963, p. 73). It has to be noted that most authors, including Lambi, see the German slump as
a part of a larger depression in the international economy. This aspect of the German slump is discussed
below.24Gallaroti (1985).25Correlation between levels of protection and macroeconomic performance was found in other studies. For
example, Bohara and Kaempfer (1991) empirically investigated the tariff history of the United States and
found that tariffs were Granger-caused by unemployment, real-GNP and other macroeconomic variables.
Dornbusch and Frankel (1987) offer an interesting discussion of the connection between macroeconomic
performance and protection.26This argument is made most forcefully in Hobson (1997) and in Dawson (1904). See also Borchardt
(1991).
9
to provide the German federal government with an independent source of income.
An interesting point to note with respect to the tariff as a revenue source argument is
that, unlike the tariff as a protective instrument argument, it can only be valid for moderate
levels of protection. Moderate levels of tariffs offer both protection and revenues. In contrast,
very high levels of tariffs offer only protection but very little revenue if any. As will be seen
later, the 1879 tariff provided for very moderate rates of protection, a fact that is consistent
with both arguments.
What the tariff as a revenue source argument fails to address is the question of timing -
Why did Bismarck decide on adopting the tariff towards the end of 1870s and not earlier?
The German tax system was put in place by the 1871 constitution and according to several
accounts Bismarck was dissatisfied with it already then.27 Bismarck’s position was that an
indirect federal tax should be introduced, eliminating the dependence of the federal govern-
ment on states’ contributions. So why did he not act earlier? An answer to this question is
provided in the following sections. The analysis will demonstrate that the economic slump
in Germany in the second part of the 1870s, brought about by the Franco-Prussian War in-
demnity, not only increased demand for protection but also opened a window of opportunity
for Bismarck to further the federal government’s independence in terms of tax revenue.
3 Economic Consequences of the War Indemnity
In July 1870 a war broke out between Prussia and France. The Prussians won a swift victory
and in January 1871 the two sides signed an armistice agreement.28 The formal peace treaty,
ratified in Frankfurt in May 1871, stipulated that France had to pay a five billion francs war
indemnity. The treaty set up a payment schedule and conditioned the return to France of
land conquered by the Prussians on these payments. The French were eager to have the
conquered land returned to them and therefore finished paying the indemnity by September
1873, half a year ahead of schedule. Total monetary indemnity payments summed up to27See, for example, Hobson (1997) and Dawson (1904).28The same month saw the establishment of the Second German Reich.
10
about 1.2 billion francs in 1871, 1.8 billion francs in 1872, and 2 billion francs in 1873.29
From a macroeconomic perspective the war indemnity constituted a large capital inflow.
To appreciate the magnitude of the French indemnity in relation to the size of the German
economy at the early 1870s it can be compared to the capital inflows into Indonesia, Korea,
Malaysia, the Philippines, and Thailand in the second part of 1990s.30 The capital inflows
into these five Asian countries are frequently portrayed as having played a major role in
the severe balance of payments and economic crises from which these countries subsequently
suffered. Comparing the years 1871-3, in which the indemnity was received by Germany,
and the years 1994-6, the three years preceding the beginning of the Asian crisis, yields
the following result: the average share of annual inflows in output was 8.1 percent in the
German case, while the corresponding figure for the Asian case was only 4.5 percent. The
French indemnity inflows into Germany in the early 1870s were thus clearly of a substantial
magnitude.
The effects of capital inflows on a nation’s economy are not predetermined. They depend
on several factors, such as the exchange rate regime, the identity of the direct recipient and
the uses to which the money is put. Expecting to receive the large indemnity from France
(including a portion in gold), Germany adopted the gold standard in several stages from
1871 to 1873.31 This implied that prices and not the exchange rate had to adjust to the
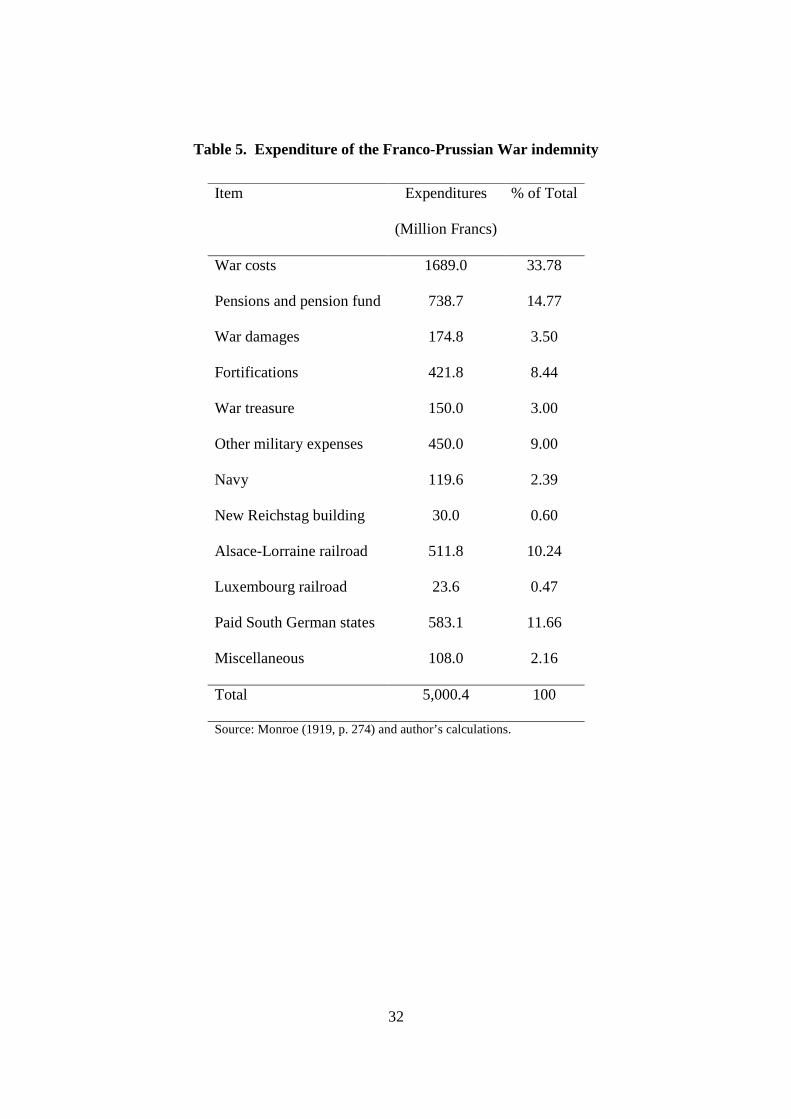
capital inflow. The German government was the direct recipient of the indemnity inflows.
Table 5 reports the way in which it allocated this windfall income.
[Insert table 5 here]
How did the indemnity inflows affect the German economy? The recent crises in emerging
markets yielded a large literature that deals with the economic consequences of large capital
inflows and can direct the analysis. According to this literature the typical initial effects29The story of the war indemnity is told in detail in Kindleberger (1993) and in Monroe (1919). Analysis
of the indemnity’s economic effects on the two countries can be found in the above mentioned sources and
in Angell (1913), Devereux and Smith (2007), Eagly (1967), Gavin (1997), and O’Farrell (1913). None of
these sources directly links the indemnity to the rise of protectionism in Germany.30See the appendix for sources.31Stolper (1967, pp. 18-20). See also Flandreau (1996).
11
of large capital inflows are acceleration of output growth, increase in the rate of inflation,
real exchange rate appreciation, increase in money supply, and rising stock market prices.
Frequently when the capital inflows stop or even change direction these patterns are reversed:
output growth slows down, deflationary pressures appear, the real exchange rate depreciates,
money growth slows down, and stock market prices decline.
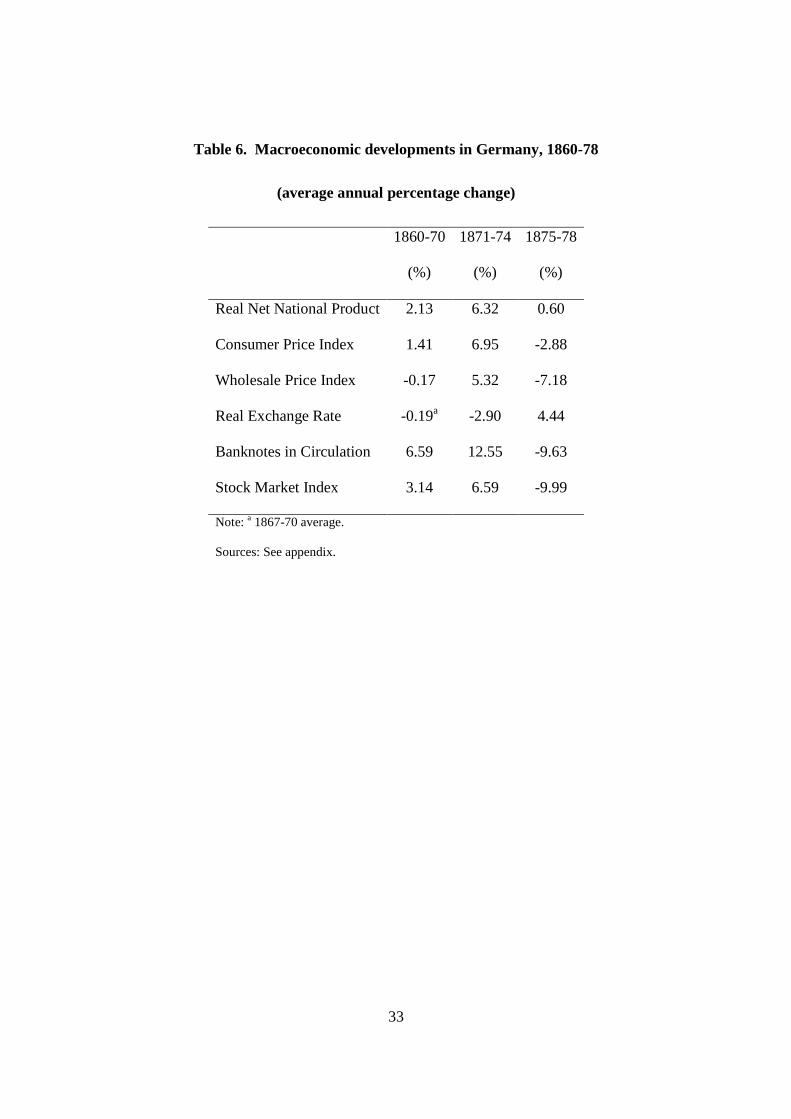
Indeed the German economy exhibited such patterns in the 1870s. Table 6 presents
data on the behavior of key macroeconomic indicators: real net national product, consumer
and wholesale price indices, real exchange rate, banknotes in circulation, and stock market
index. The table displays the average annual rates of change for these variables in three
time periods: the pre-inflow 1860-70 period, which serves as a benchmark for comparison,
the 1871-4 inflow period, and the post-inflow, pre-tariff, 1875-8 period.32
[Insert table 6 here]
Table 6 reveals that the German economy exhibited the typical symptoms of a boom-
bust cycle associated with large but temporary capital inflows. Net national product growth
accelerated from an average of about 2 percent per annum in the period 1860-70 to more
than 6 percent in the inflow period and then dropped sharply to less than 1 percent. There
was a burst of inflation followed by a deflationary process. Consumer price inflation went
up from an average of 1.5 percent per annum in the period 1860-70 to almost 7 percent
during the inflow episode and then turned into a rate of deflation of almost 3 percent in
the post-inflow period. A similar pattern characterizes the behavior of the wholesale price
index, although in this case the inflation rate was lower during the inflow period while the
deflation rate was higher during the post-inflow period.33
During the inflow episode the German trade weighted real exchange rate appreciated
by an average annual rate of almost 3 percent. Then it rebounded with an average annual32The ‘inflow period’ was extended to include 1874 in order to allow for lagged effects.33As will be recalled from the discussion in the previous section, this differential behavior of the WPI
and the CPI implies an increase in the relative price of non-tradables in both the inflow and the post-inflow
periods. The real exchange rate can be defined as the relative price of non-tradable goods, so the behavior
of the CPI and the WPI in the two sub-periods could be equivalently interpreted as real exchange rate
appreciation. Below I concentrate on a different measure of the real exchange rate that is more relevant for
the analysis of international competitiveness.
12
depreciation rate of more than 4 percent.34 Banknotes in circulation, a proxy for money
supply, exhibited a rapid rate of growth of 13 percent during the inflow episode and then
declined sharply at an average annual rate of 10 percent in the period 1875-8. A similar
boom-bust pattern is reflected in the movement of the stock market composite index. From
an annual rate of increase of 3 percent in the period 1860-70, it went up to more than 6
percent in the inflow period and then sharply decreased to a decline of 10 percent in the
post-inflow period.
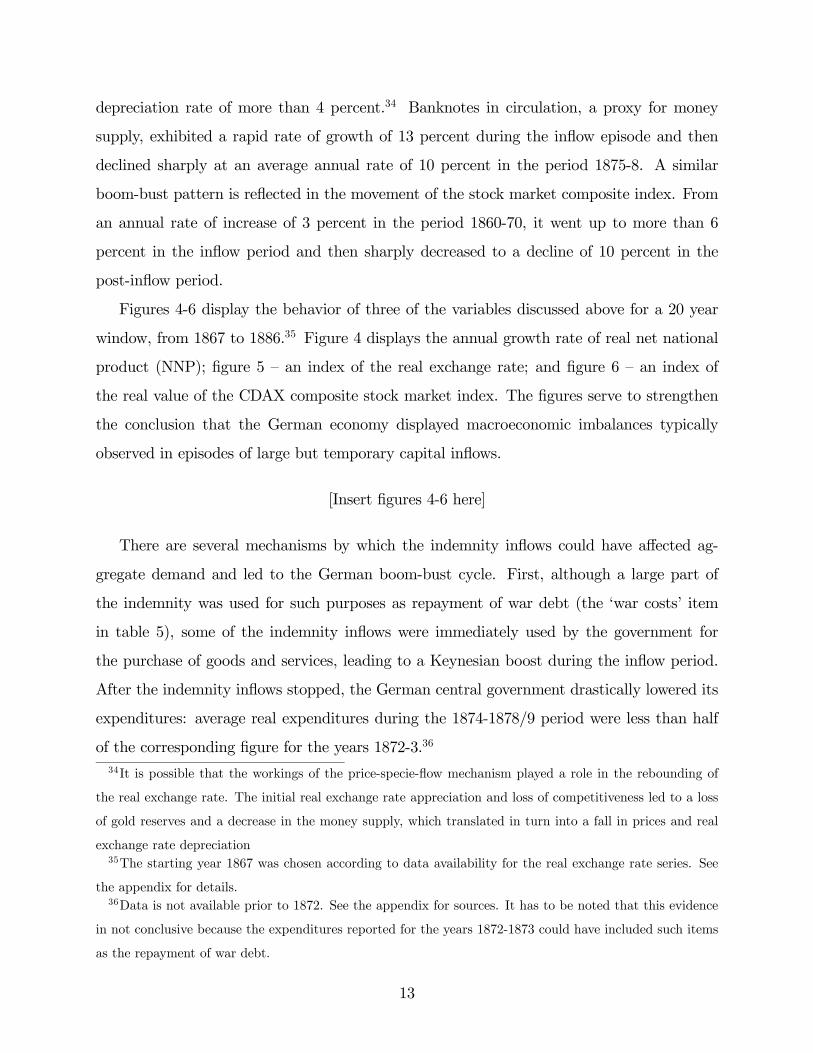
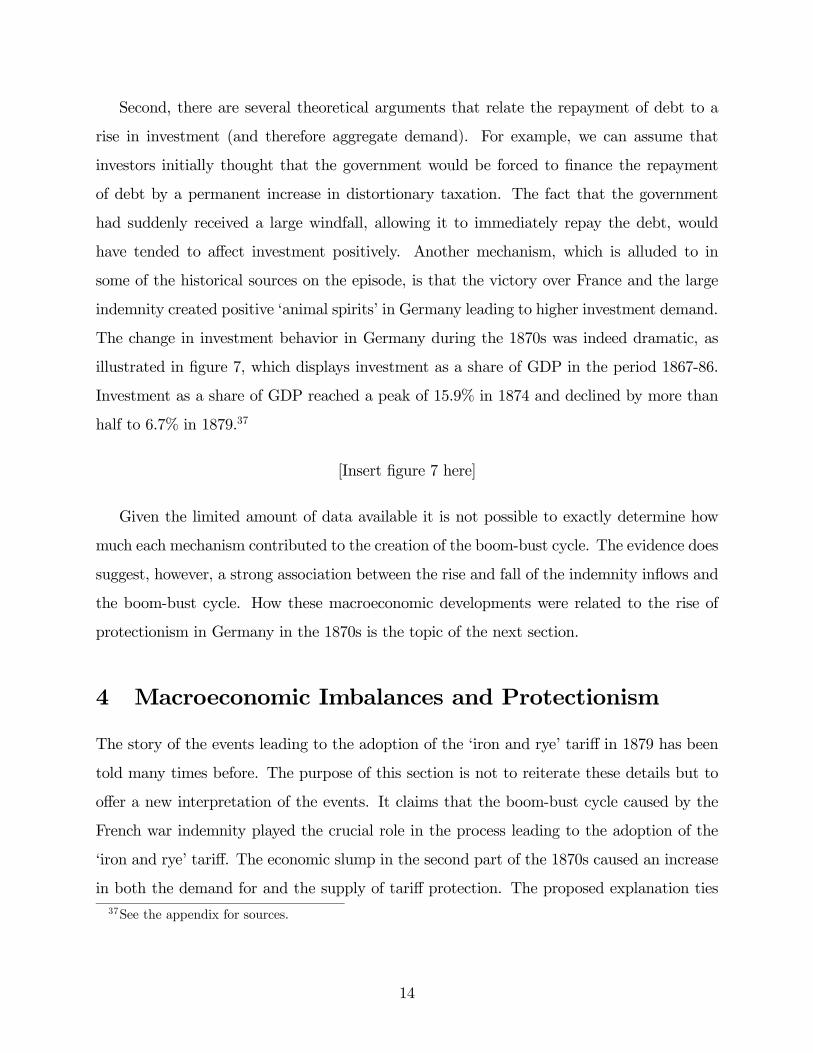
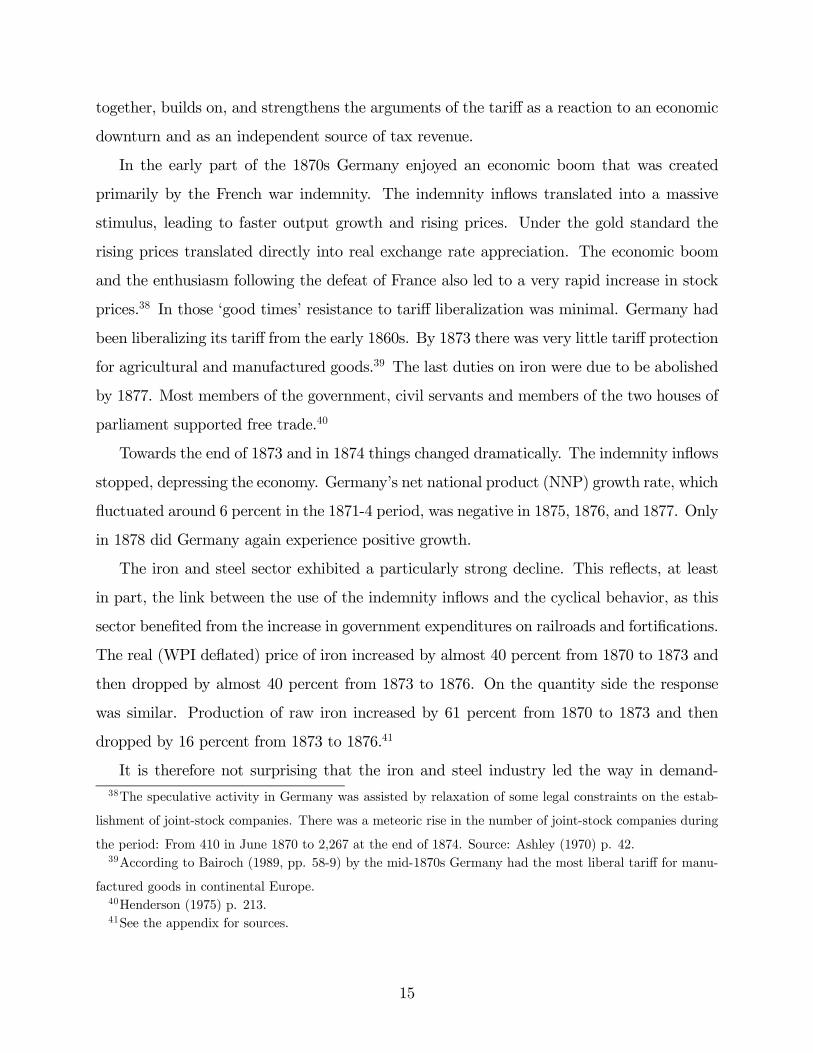
Figures 4-6 display the behavior of three of the variables discussed above for a 20 year
window, from 1867 to 1886.35 Figure 4 displays the annual growth rate of real net national
product (NNP); figure 5 — an index of the real exchange rate; and figure 6 — an index of
the real value of the CDAX composite stock market index. The figures serve to strengthen
the conclusion that the German economy displayed macroeconomic imbalances typically
observed in episodes of large but temporary capital inflows.
[Insert figures 4-6 here]
There are several mechanisms by which the indemnity inflows could have affected ag-
gregate demand and led to the German boom-bust cycle. First, although a large part of
the indemnity was used for such purposes as repayment of war debt (the ‘war costs’ item
in table 5), some of the indemnity inflows were immediately used by the government for
the purchase of goods and services, leading to a Keynesian boost during the inflow period.
After the indemnity inflows stopped, the German central government drastically lowered its
expenditures: average real expenditures during the 1874-1878/9 period were less than half
of the corresponding figure for the years 1872-3.36
34It is possible that the workings of the price-specie-flow mechanism played a role in the rebounding of
the real exchange rate. The initial real exchange rate appreciation and loss of competitiveness led to a loss
of gold reserves and a decrease in the money supply, which translated in turn into a fall in prices and real
exchange rate depreciation35The starting year 1867 was chosen according to data availability for the real exchange rate series. See
the appendix for details.36Data is not available prior to 1872. See the appendix for sources. It has to be noted that this evidence
in not conclusive because the expenditures reported for the years 1872-1873 could have included such items
as the repayment of war debt.
13
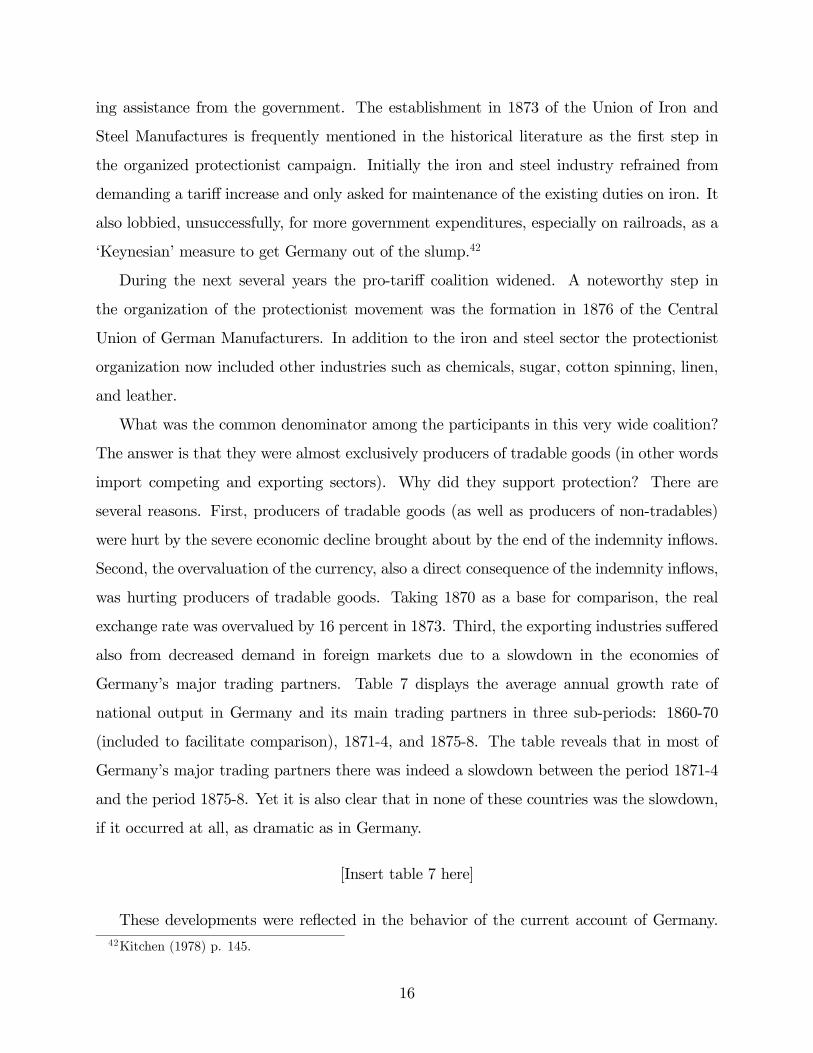
Second, there are several theoretical arguments that relate the repayment of debt to a
rise in investment (and therefore aggregate demand). For example, we can assume that
investors initially thought that the government would be forced to finance the repayment
of debt by a permanent increase in distortionary taxation. The fact that the government
had suddenly received a large windfall, allowing it to immediately repay the debt, would
have tended to affect investment positively. Another mechanism, which is alluded to in
some of the historical sources on the episode, is that the victory over France and the large
indemnity created positive ‘animal spirits’ in Germany leading to higher investment demand.
The change in investment behavior in Germany during the 1870s was indeed dramatic, as
illustrated in figure 7, which displays investment as a share of GDP in the period 1867-86.
Investment as a share of GDP reached a peak of 15.9% in 1874 and declined by more than
half to 6.7% in 1879.37
[Insert figure 7 here]
Given the limited amount of data available it is not possible to exactly determine how
much each mechanism contributed to the creation of the boom-bust cycle. The evidence does
suggest, however, a strong association between the rise and fall of the indemnity inflows and
the boom-bust cycle. How these macroeconomic developments were related to the rise of
protectionism in Germany in the 1870s is the topic of the next section.
4 Macroeconomic Imbalances and Protectionism
The story of the events leading to the adoption of the ‘iron and rye’ tariff in 1879 has been
told many times before. The purpose of this section is not to reiterate these details but to
offer a new interpretation of the events. It claims that the boom-bust cycle caused by the
French war indemnity played the crucial role in the process leading to the adoption of the
‘iron and rye’ tariff. The economic slump in the second part of the 1870s caused an increase
in both the demand for and the supply of tariff protection. The proposed explanation ties37See the appendix for sources.
14
together, builds on, and strengthens the arguments of the tariff as a reaction to an economic
downturn and as an independent source of tax revenue.
In the early part of the 1870s Germany enjoyed an economic boom that was created
primarily by the French war indemnity. The indemnity inflows translated into a massive
stimulus, leading to faster output growth and rising prices. Under the gold standard the
rising prices translated directly into real exchange rate appreciation. The economic boom
and the enthusiasm following the defeat of France also led to a very rapid increase in stock
prices.38 In those ‘good times’ resistance to tariff liberalization was minimal. Germany had
been liberalizing its tariff from the early 1860s. By 1873 there was very little tariff protection
for agricultural and manufactured goods.39 The last duties on iron were due to be abolished
by 1877. Most members of the government, civil servants and members of the two houses of
parliament supported free trade.40
Towards the end of 1873 and in 1874 things changed dramatically. The indemnity inflows
stopped, depressing the economy. Germany’s net national product (NNP) growth rate, which
fluctuated around 6 percent in the 1871-4 period, was negative in 1875, 1876, and 1877. Only
in 1878 did Germany again experience positive growth.
The iron and steel sector exhibited a particularly strong decline. This reflects, at least
in part, the link between the use of the indemnity inflows and the cyclical behavior, as this
sector benefited from the increase in government expenditures on railroads and fortifications.
The real (WPI deflated) price of iron increased by almost 40 percent from 1870 to 1873 and
then dropped by almost 40 percent from 1873 to 1876. On the quantity side the response
was similar. Production of raw iron increased by 61 percent from 1870 to 1873 and then
dropped by 16 percent from 1873 to 1876.41
It is therefore not surprising that the iron and steel industry led the way in demand-38The speculative activity in Germany was assisted by relaxation of some legal constraints on the estab-
lishment of joint-stock companies. There was a meteoric rise in the number of joint-stock companies during
the period: From 410 in June 1870 to 2,267 at the end of 1874. Source: Ashley (1970) p. 42.39According to Bairoch (1989, pp. 58-9) by the mid-1870s Germany had the most liberal tariff for manu-
factured goods in continental Europe.40Henderson (1975) p. 213.41See the appendix for sources.
15
ing assistance from the government. The establishment in 1873 of the Union of Iron and
Steel Manufactures is frequently mentioned in the historical literature as the first step in
the organized protectionist campaign. Initially the iron and steel industry refrained from
demanding a tariff increase and only asked for maintenance of the existing duties on iron. It
also lobbied, unsuccessfully, for more government expenditures, especially on railroads, as a
‘Keynesian’ measure to get Germany out of the slump.42
During the next several years the pro-tariff coalition widened. A noteworthy step in
the organization of the protectionist movement was the formation in 1876 of the Central
Union of German Manufacturers. In addition to the iron and steel sector the protectionist
organization now included other industries such as chemicals, sugar, cotton spinning, linen,
and leather.
What was the common denominator among the participants in this very wide coalition?
The answer is that they were almost exclusively producers of tradable goods (in other words
import competing and exporting sectors). Why did they support protection? There are
several reasons. First, producers of tradable goods (as well as producers of non-tradables)
were hurt by the severe economic decline brought about by the end of the indemnity inflows.
Second, the overvaluation of the currency, also a direct consequence of the indemnity inflows,
was hurting producers of tradable goods. Taking 1870 as a base for comparison, the real
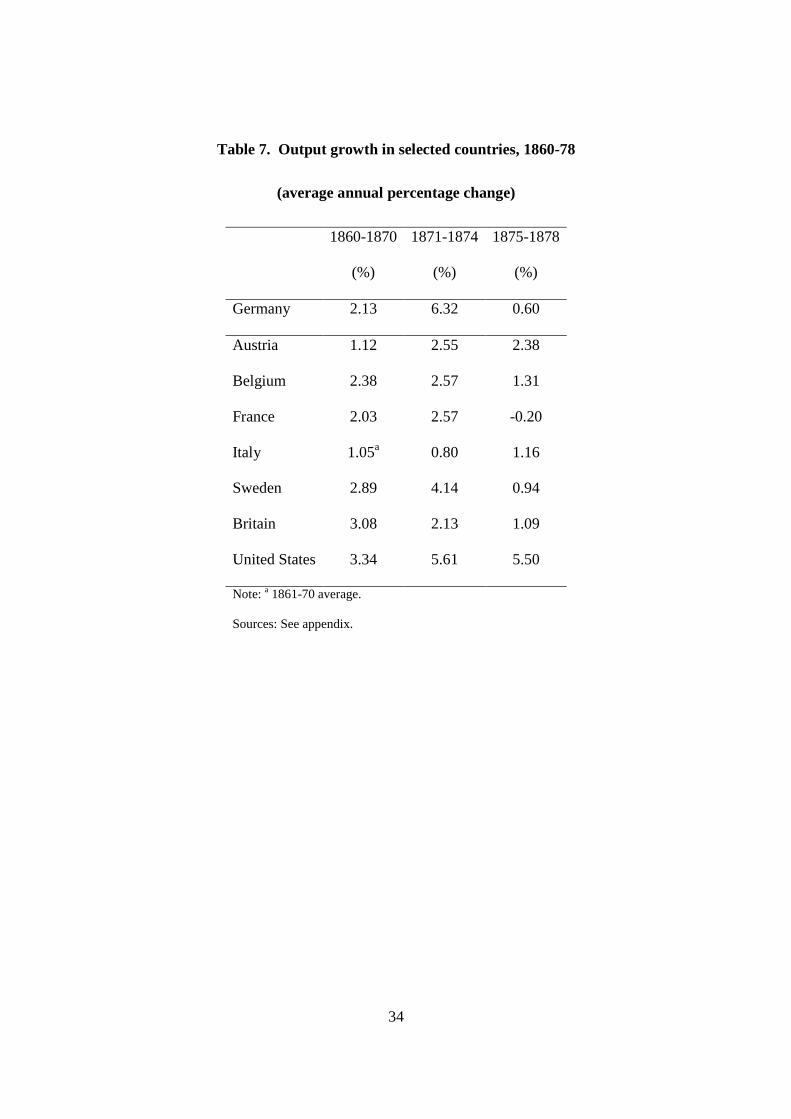
exchange rate was overvalued by 16 percent in 1873. Third, the exporting industries suffered
also from decreased demand in foreign markets due to a slowdown in the economies of
Germany’s major trading partners. Table 7 displays the average annual growth rate of
national output in Germany and its main trading partners in three sub-periods: 1860-70
(included to facilitate comparison), 1871-4, and 1875-8. The table reveals that in most of
Germany’s major trading partners there was indeed a slowdown between the period 1871-4
and the period 1875-8. Yet it is also clear that in none of these countries was the slowdown,
if it occurred at all, as dramatic as in Germany.
[Insert table 7 here]
These developments were reflected in the behavior of the current account of Germany.42Kitchen (1978) p. 145.
16
Figure 8 displays the behavior of the current account (excluding all gold flows) as a share of
gross domestic product in Germany from 1872 to 1886.43 Noteworthy in this figure are the
relatively low level of the current account in the mid-1870s (1873 being an exception) and
its gradual improvement in the late 1870s, which was likely associated with the slowdown in
growth and the rebounding of the real exchange rate (see figures 4 and 5).44
[Insert figure 8 here]
In short, macroeconomic developments adversely affected a wide spectrum of producers of
tradable goods and led them to seek tariff protection. Obviously, not all producers of tradable
goods were in the same position. Many factors influenced the attitudes in the various sectors,
such as the degree of decline in demand, the sector’s dependence on imported intermediate
goods and the perceived likelihood of foreign retaliation to the adoption of tariffs in Germany.
Yet, the width of the protectionist coalition leaves no doubt that it had very little to do with
changing patterns of comparative advantage and much to do with the adverse macroeconomic
circumstances.
Agriculture also suffered from the economic downturn. The Junkers and other agricul-
tural sub-sectors joined the protectionist coalition relatively late, around 1877, and half-
heartedly at that.45 It has to be noted that by the time agriculture joined the protectionist
coalition there were already signs that Bismarck was leaning more closely towards adopting
tariffs.46 One sign of this was the resignation/dismissal in April 1876 of Rudolph Delbruck,
the president of the Imperial Chancellery, who was the preeminent free-trading liberal in the
leadership circle. The stage was now set for Bismarck to make his decision.
The major reason behind Bismarck’s decision to support the cause of the protectionist
campaign was to gain an independent source of indirect taxation.47 Figure 9 offers some43This data is unavailable prior to 1872. See the appendix for sources.44Gavin (1997) analyzes the behavior of net exports in Germany in the 1870s and reaches a similar
conclusion.45Several authors point out that although the Junkers were concerned about the increasing competition
in the European grain market many were still quite reluctant to support tariffs in the late 1870s. Hobson
(1997, p. 26) even claims that ‘the Junkers were against tariffs on wheat and rye in 1879’.46See, for example, Lambi (1963) p. 145. Hobson (1997, p. 48) claims that the Junkers were simply
jumping at the last moment on the ‘already rolling protectionist bandwagon’.47Hobson (1997) and Dawson (1904).
17
evidence supporting this argument. It displays the behavior, during the 1872-1878/9 fiscal
years, of the federal government’s two main revenue sources: (1) Consumption tax and
customs and (2) Contributions from the states.48 The figure indicates that as revenues from
the consumption tax and customs dwindled in the second part of the 1870s, contributions
from the states increased.
[Insert figure 9 here]
Why did the federal government’s revenues from indirect taxes decrease during the second
part of the 1870s? The reason for the fall in indirect taxes was the slowdown in economic
growth brought about by the end of indemnity inflows. The need for higher contributions to
compensate for the shortfall in indirect taxes during the economic slump increased the burden
on the German states, which also suffered from the economic downturn.49 The increasing
burden on the states and the consequent rise in tension within the German federal structure
helped to motivate Bismarck to act when he did.
A letter from Bismarck reveals his desire to use the tariffs to replace states’ contributions.
This letter, dated December 1878, was addressed to a committee appointed to consider the
revision of the tariff.50 It claims that the financial object of the tariff reform was to reduce
direct and increase indirect taxation. Bismarck claimed that a tariff averaging 5 percent
ad-valorem would yield 70 million marks in revenue. As can be seen in figure 9, this sum is
very close to the value of the German states’ contributions in the fiscal year 1878/9.
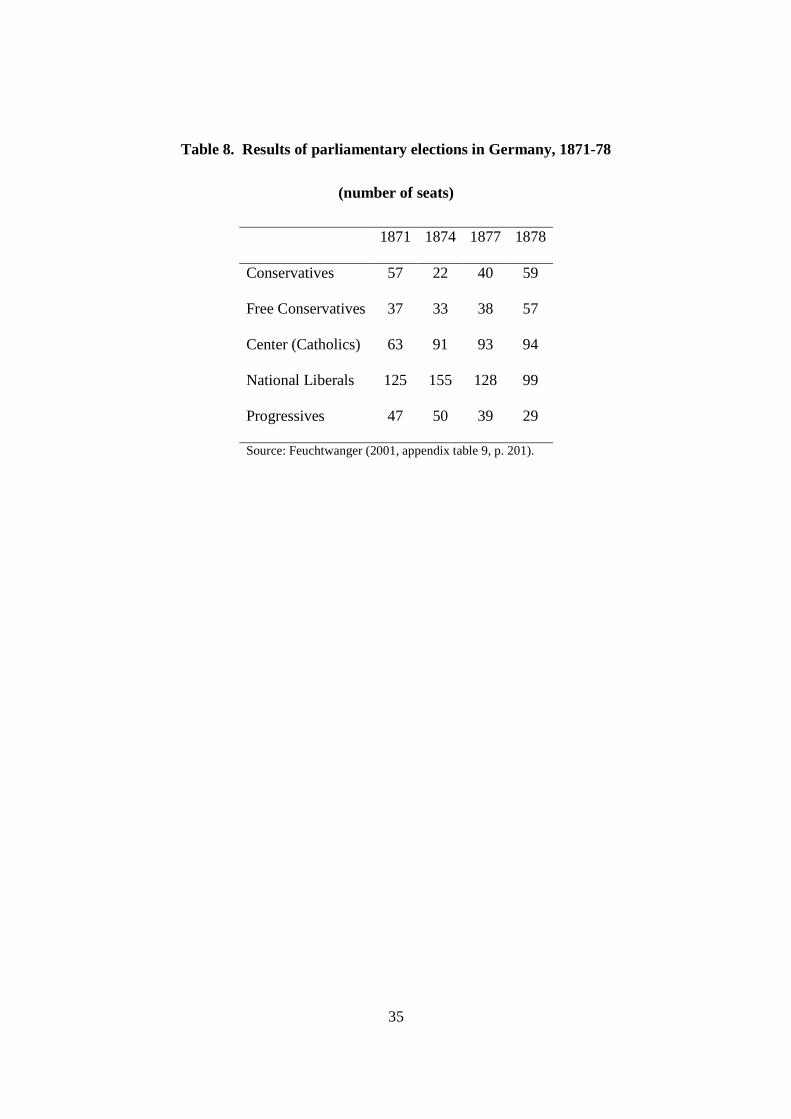
Table 8, which presents results of elections to the German parliament in the 1870s,
illustrates the dramatic shifts in German politics in the 1870s, a shift that mirrored economic
developments. During the boom years support for the liberal parties increased while support
for the conservative parties decreased. As the economic situation deteriorated during the
second part of the 1870s these trends were dramatically reversed.
[Insert table 8 here]48Data is not available prior to 1872. See the appendix for sources.49See Henderson (1975, p. 218) and Lambi (1963, p. 169).50Ashley (1970, pp. 44-45).
18
In May and June of 1878 there were two attempts to assassinate the Emperor, Wilhelm
I, which gave Bismarck the excuse to dissolve the parliament and to hold general elections.
Until the 1878 elections Bismarck relied on the support of the National Liberal and the Free
Conservative parties, which opposed protectionism. The 1878 elections led to the emergence
of a large pro-tariff coalition which consisted of representatives from the Conservative, Free
Conservative, the right wing of the National Liberals, and the Catholic (Center) parties.51
After the elections of 1878 conditions were ripe for Bismarck to make the final push for
adoption of the tariff. With the support of the government, the parliament approved the
‘iron and rye’ tariff in July 1879. Moderate levels of tariffs were imposed on various industrial
and agricultural goods.52 The tariff bill received Imperial assent on 7 July 1879, and was
fully implemented by 1 January 1880.53
5 Conclusion
The actions of Chancellor Bismarck begin and end this paper’s story. In 1871 Bismarck
imposed a war indemnity on France. In 1879 he levied the ‘iron and rye’ tariff. The war
indemnity, essentially a very large capital inflow, implied a massive stimulus to the economy
and led to an economic boom. When the indemnity inflows stopped, the boom turned into
a bust setting a protectionist campaign in motion. German producers of tradable goods
suffered from decreased domestic demand and exchange rate overvaluation. At the same
time, the fall in tax revenues due to the economic slump increased the tension within the51The importance of the 1878 elections is manifested by the fact that conservative coalitions remained in
power in Germany until after the First World War. See, for example, Craig (1978), Feuchtwanger (2001),
and Sturmer (2000).52The wide spectrum of goods covered by the tariff reflected the breadth of the protectionist coalition.
The tariff dealt with 43 groups of commodities. A partial list of items includes: wheat, rye, oats, barley,
maize, flour, meat, pigs, oxen, sheep, iron and steel goods and semi-manufactured goods, machinery, glass,
yarns and textiles. Exemption from tariff was given to some raw materials. The ad-valorem equivalents of
the specific tariff imposed were in the range of 5% to 7% for grain and somewhat higher for industrial goods.53Bismarck’s desire to gain financial independence for the federal government was eventually frustrated to
some extent by the ‘Frankenstein clause’ of 1879, which essentially determined that any excess of customs
revenue over a given threshold level was to be refunded by the federal government to the member states.
19
German federal system and Bismarck’s desire for an independent source of revenue. The
1879 tariff was thus the direct result of the increased demand for protection from a wide
spectrum of domestic producers and the increased willingness of Bismarck to supply it.
The return to protectionism in continental Europe that started with the 1879 German
tariff is considered by some as an example of a backlash against globalization. This paper
has shown that the German tariff itself was not adopted as a reaction to globalization but
was rather a consequence of a country-specific macroeconomic shock. Despite globalization,
during the period 1870-1913 European grain prices did not decline by much relative to the
prices of other tradable goods. This finding naturally raises the question of why other
countries adopted higher tariffs (in particular on grain) from 1880 until the outbreak of
the First World War. This article will not attempt to answer this question. Whatever the
answers to this question may be, it seems that the results presented in this paper contribute
to the literature by calling for some reconsideration of the traditional view of late nineteenth-
century European tariff history.
6 References
Angell, N., 1913. The Great Illusion: A Study of the Relation of Military Power to National
Advantage. Putnam, New York.
Ashley, P., 1970. Modern Tariff History: Germany-United States-France. Howard
Fertig, New York.
Bairoch, P., 1989. “European Trade Policy, 1815-1914.” In: Mathias P., Pollard S.
(Eds.), Cambridge Economic History of Europe, Vol. 8. Cambridge University Press, Cam-
bridge, pp. 1-160.
Balassa, B., 1964. “The Purchasing-Power-Parity Doctrine: A Reappraisal.” Journal
of Political Economy 72, pp. 584-96.
Barkin, K.D., 1970. The Controversy Over German Industrialization, 1890-1902. Uni-
versity of Chicago Press, Chicago.
Bohara, A. K., Kaempfer, W. H., 1991. “A Test of Tariff Endogeneity in the United
States.” American Economic Review 81, pp. 952-60.
20
Borchardt, K., 1991. Perspectives on Modern German Economic History and Policy.
Cambridge University Press, Cambridge.
Broomhall, G.J., 1904. The Corn Trade Yearbook. St Mary’s Chamber, London.
Craig, G.A., 1978. Germany, 1866-1945. Oxford University Press, New York.
Dawson, W.H., 1904. Protection in Germany: A History of German Fiscal Policy
During the Nineteenth Century. P.S. King & Son, London.
Devereux, M.B., Smith, W.S., 2007, “Transfer Problem Dynamics: Macroeconomics
of the Franco-Prussian War Indemnity.” Journal of Monetary Economics 54, pp. 2375-2398.
Dornbusch, R., Frankel, J.A., 1987. “Macroeconomics and Protection.” In Stern,
R.M. (Ed.), U.S. Trade Policies in a Changing World Economy. MIT Press, Cambridge,
MA, pp. 77-130.
Eagly, R.V., 1967. “Business Cycle Trends in France and Germany, 1869-79: A New
Appraisal.” Weltwirtschaftliches Archiv 99, pp. 90-106.
Feuchtwanger, E., 2001. Imperial Germany, 1850-1918. Routledge, New York.
Flandreau, M., 1996. “The French Crime of 1873: An Essay on the Emergence of the
International Gold Standard, 1870-1880.” Journal of Economic History 56, pp. 862-97.
Gallarotti, G.M., 1985. “Toward a Business-Cycle Model of Tariffs.” International
Organization 39, pp. 155-87.
Gavin, M., 1997. “Intertemporal Dimensions of International Economic Adjustment:
Evidence from the Franco-PrussianWar Indemnity.” In Komlos, J., Eddie, S. (Eds.), Selected
Cliometric Studies on German Economic History. Franz Steiner Verlag, Stuttgart, pp. 34-
44.
Gerloff, W., 1913, Die Finanz- und Zollpolitik des Deutschen Reiches, Gustav Fischer,
Jena.
Gerschenkron, A., 1943. Bread and Democracy in Germany. University of California
Press, Berkeley.
Gourevitch, P., 1986. Politics in Hard Times: Comparative Responses to International
Economic Crisis. Cornell University Press, Ithaca.
Henderson, W.O., 1975. The Rise of German Industrial Power, 1834-1914. Temple
Smith, London. 1975.
21
Hobson, J.M., 1997. The Wealth of States: A Comparative Sociology of International
Economic and Political Change. Cambridge University Press, Cambridge.
Hoffmann, W.G., 1965. Das Wachstum der Deutschen Wirtschaft seit der Mitte des
19. Jahrhunderts. Springer-Verlag, Berlin.
Jones, M.T., Obstfeld, M., 2001. “Saving, Investment, and Gold: A Reassessment
of Historical Current Account Data.” In Calvo, G.A., Dornbusch, R., Obstfeld, M. (Eds.),
Money, Capital Mobility, and Trade: Essays in Honor of Robert A. Mundell. MIT Press,
Cambridge, pp. 303-63.
Kindleberger, C.P., 1951. “Group Behavior and International Trade.” Journal of
Political Economy 59, pp. 30-46.
Kindleberger, C.P., 1975. “The Rise of Free Trade in Western Europe, 1820-1875.”
Journal of Economic History 35, pp. 20-55.
Kindleberger, C.P., 1993. A Financial History of Western Europe. Oxford University
Press, New York.
Kitchen, M., 1978. The Political Economy of Germany 1815-1914. Queen’s University
Press, Montreal.
Klug, A., 2001. “Why Chamberlain Failed and Bismarck Succeeded: The Political
Economy of Tariffs in British and German Elections.” European Review of Economic History
5, pp. 219-50.
Lambi, I.N., 1963. Free Trade and Protection in Germany, 1868-1879. Franz Steiner
Verlag, Weisbaden.
Maddison, A., 1991. Dynamic Forces in Capitalist Development: A Long-Run Com-
parative View. Oxford University Press, New York.
Mitchell, B.R., 1993a. International Historical Statistics: Europe, 1750-1988. Stockton
Press, New York.
Mitchell, B.R., 1993b, International Historical Statistics: The Americas, 1750-1988.
Stockton Press, New York.
Monroe, A.E., 1919. “The French Indemnity of 1871 and its Effects.” Review of
Economic Statistics 1, pp. 269-81.
O’Farrell, H.H., 1913. The Franco-German War Indemnity and its Economic Results.
22
Harrison & Sons, London.
O’Rourke, K.H., 1997. “The European Grain Invasion, 1870-1913.” Journal of Eco-
nomic History 57, pp. 775-801.
O’Rourke, K.H., Williamson, J.G., 1999. Globalization and History: The Evolution
of a Nineteenth-Century Atlantic Economy, MIT Press, Cambridge, MA.
Rogowski, R., 1989. Commerce and Coalitions: How Trade Affects Domestic Political
Alignments. Princeton University Press, Princeton.
Samuelson, P.A., 1964. “Theoretical Notes on Trade Problems.” Review of Economics
and Statistics 46, pp. 145-54.
Schonhardt-Bailey, C., 1998. “Parties and Interests in the ‘Marriage of Iron and
Rye’.” British Journal of Political Science 28, pp. 291-330.
Stolper, G., 1967. The German Economy, 1870 to the Present. Harcourt, Brace and
World, New York.
Sturmer, M., 2000. The German Empire. Weidenfeld & Nicolson, London.
23
24
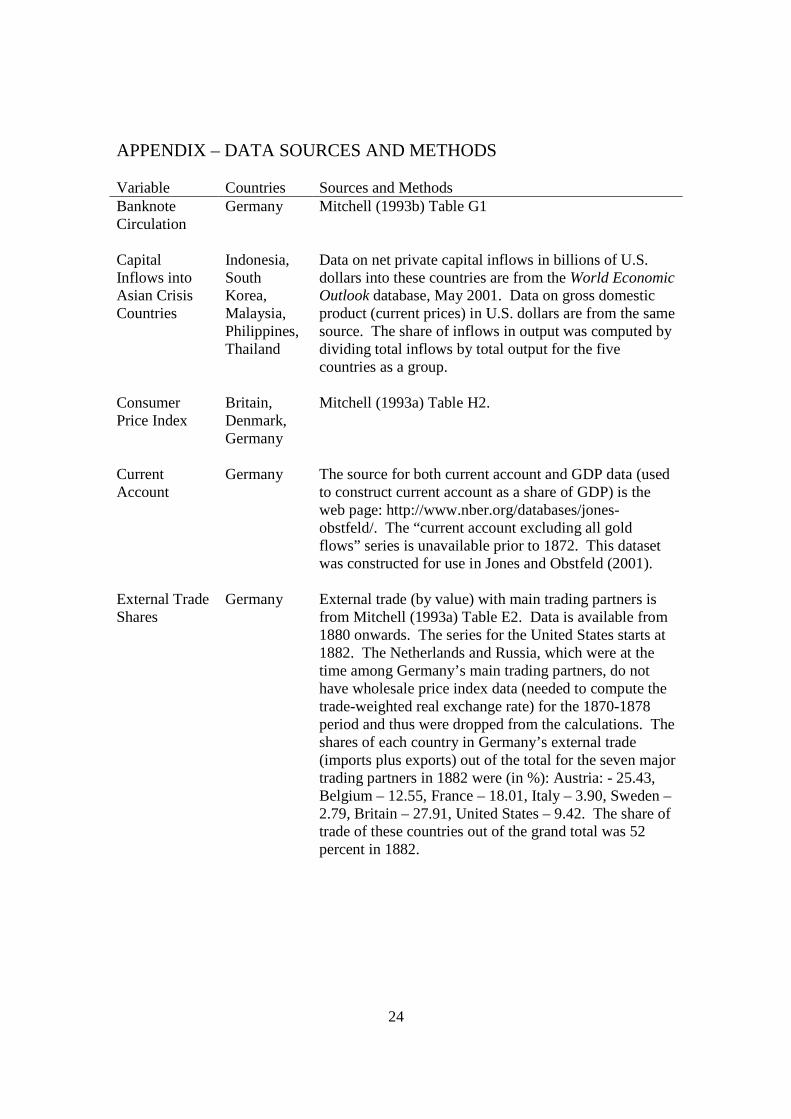
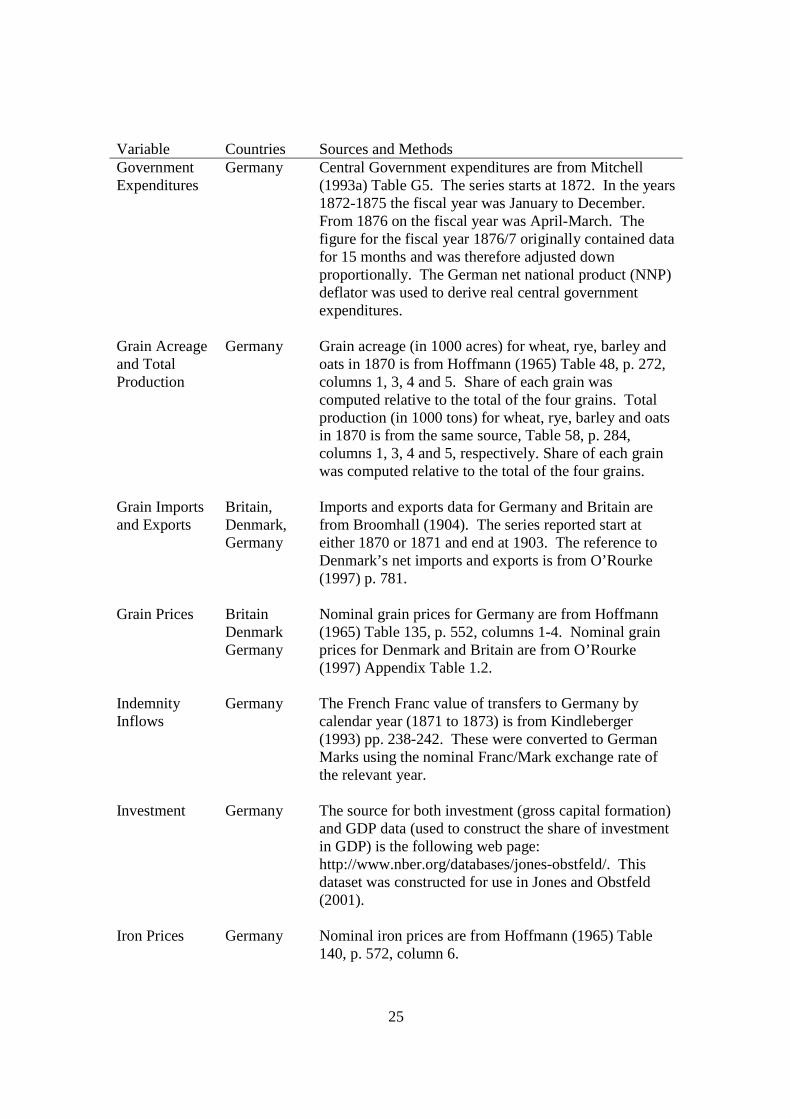
APPENDIX – DATA SOURCES AND METHODS Variable Countries Sources and Methods Banknote Circulation
Germany Mitchell (1993b) Table G1
Capital Inflows into Asian Crisis Countries
Indonesia, South Korea, Malaysia, Philippines, Thailand
Data on net private capital inflows in billions of U.S. dollars into these countries are from the World Economic Outlook database, May 2001. Data on gross domestic product (current prices) in U.S. dollars are from the same source. The share of inflows in output was computed by dividing total inflows by total output for the five countries as a group.
Consumer Price Index
Britain, Denmark, Germany
Mitchell (1993a) Table H2.
Current Account
Germany The source for both current account and GDP data (used to construct current account as a share of GDP) is the web page: http://www.nber.org/databases/jones-obstfeld/. The “current account excluding all gold flows” series is unavailable prior to 1872. This dataset was constructed for use in Jones and Obstfeld (2001).
External Trade Shares
Germany External trade (by value) with main trading partners is from Mitchell (1993a) Table E2. Data is available from 1880 onwards. The series for the United States starts at 1882. The Netherlands and Russia, which were at the time among Germany’s main trading partners, do not have wholesale price index data (needed to compute the trade-weighted real exchange rate) for the 1870-1878 period and thus were dropped from the calculations. The shares of each country in Germany’s external trade (imports plus exports) out of the total for the seven major trading partners in 1882 were (in %): Austria: - 25.43, Belgium – 12.55, France – 18.01, Italy – 3.90, Sweden – 2.79, Britain – 27.91, United States – 9.42. The share of trade of these countries out of the grand total was 52 percent in 1882.
25
Variable Countries Sources and Methods Government Expenditures
Germany Central Government expenditures are from Mitchell (1993a) Table G5. The series starts at 1872. In the years 1872-1875 the fiscal year was January to December. From 1876 on the fiscal year was April-March. The figure for the fiscal year 1876/7 originally contained data for 15 months and was therefore adjusted down proportionally. The German net national product (NNP) deflator was used to derive real central government expenditures.
Grain Acreage and Total Production
Germany Grain acreage (in 1000 acres) for wheat, rye, barley and oats in 1870 is from Hoffmann (1965) Table 48, p. 272, columns 1, 3, 4 and 5. Share of each grain was computed relative to the total of the four grains. Total production (in 1000 tons) for wheat, rye, barley and oats in 1870 is from the same source, Table 58, p. 284, columns 1, 3, 4 and 5, respectively. Share of each grain was computed relative to the total of the four grains.
Grain Imports and Exports
Britain, Denmark, Germany
Imports and exports data for Germany and Britain are from Broomhall (1904). The series reported start at either 1870 or 1871 and end at 1903. The reference to Denmark’s net imports and exports is from O’Rourke (1997) p. 781.
Grain Prices Britain
Denmark Germany
Nominal grain prices for Germany are from Hoffmann (1965) Table 135, p. 552, columns 1-4. Nominal grain prices for Denmark and Britain are from O’Rourke (1997) Appendix Table 1.2.
Indemnity Inflows
Germany The French Franc value of transfers to Germany by calendar year (1871 to 1873) is from Kindleberger (1993) pp. 238-242. These were converted to German Marks using the nominal Franc/Mark exchange rate of the relevant year.
Investment Germany The source for both investment (gross capital formation)
and GDP data (used to construct the share of investment in GDP) is the following web page: http://www.nber.org/databases/jones-obstfeld/. This dataset was constructed for use in Jones and Obstfeld (2001).
Iron Prices Germany Nominal iron prices are from Hoffmann (1965) Table
140, p. 572, column 6.
26
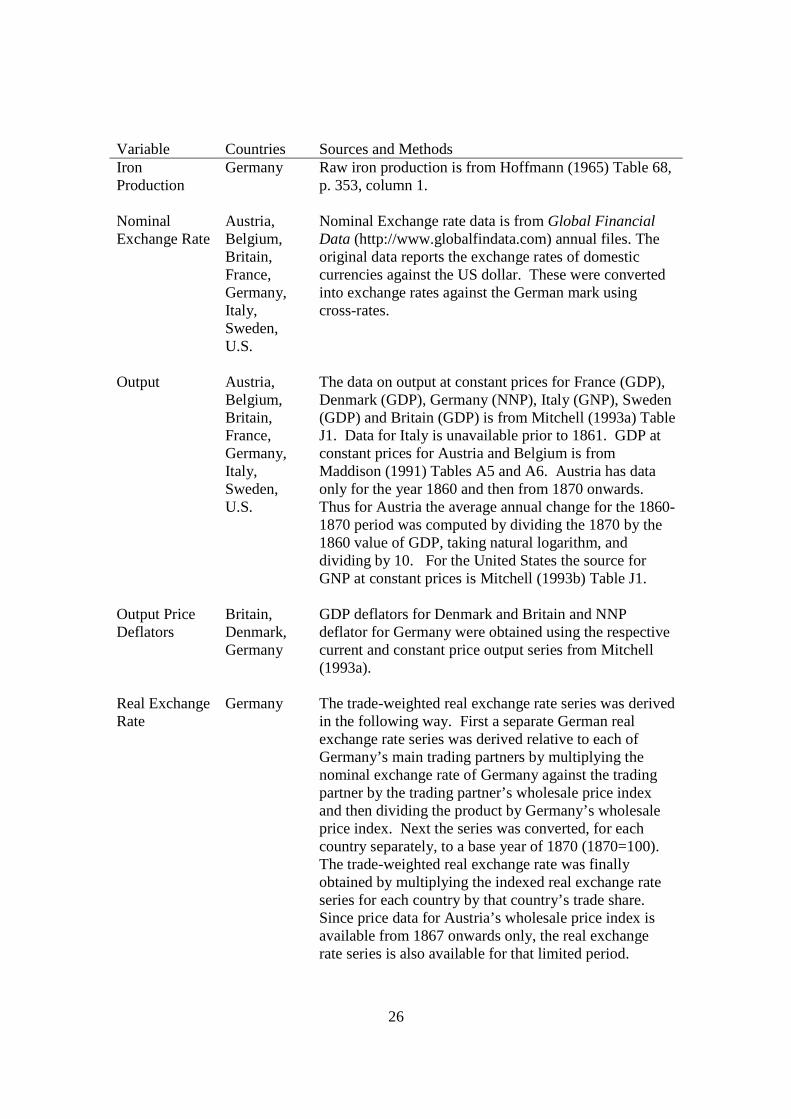
Variable Countries Sources and Methods Iron Production
Germany Raw iron production is from Hoffmann (1965) Table 68, p. 353, column 1.
Nominal Exchange Rate
Austria, Belgium, Britain, France, Germany, Italy, Sweden, U.S.
Nominal Exchange rate data is from Global Financial Data (http://www.globalfindata.com) annual files. The original data reports the exchange rates of domestic currencies against the US dollar. These were converted into exchange rates against the German mark using cross-rates.
Output Austria,
Belgium, Britain, France, Germany, Italy, Sweden, U.S.
The data on output at constant prices for France (GDP), Denmark (GDP), Germany (NNP), Italy (GNP), Sweden (GDP) and Britain (GDP) is from Mitchell (1993a) Table J1. Data for Italy is unavailable prior to 1861. GDP at constant prices for Austria and Belgium is from Maddison (1991) Tables A5 and A6. Austria has data only for the year 1860 and then from 1870 onwards. Thus for Austria the average annual change for the 1860-1870 period was computed by dividing the 1870 by the 1860 value of GDP, taking natural logarithm, and dividing by 10. For the United States the source for GNP at constant prices is Mitchell (1993b) Table J1.
Output Price Deflators
Britain, Denmark, Germany
GDP deflators for Denmark and Britain and NNP deflator for Germany were obtained using the respective current and constant price output series from Mitchell (1993a).
Real Exchange Rate
Germany The trade-weighted real exchange rate series was derived in the following way. First a separate German real exchange rate series was derived relative to each of Germany’s main trading partners by multiplying the nominal exchange rate of Germany against the trading partner by the trading partner’s wholesale price index and then dividing the product by Germany’s wholesale price index. Next the series was converted, for each country separately, to a base year of 1870 (1870=100). The trade-weighted real exchange rate was finally obtained by multiplying the indexed real exchange rate series for each country by that country’s trade share. Since price data for Austria’s wholesale price index is available from 1867 onwards only, the real exchange rate series is also available for that limited period.
27
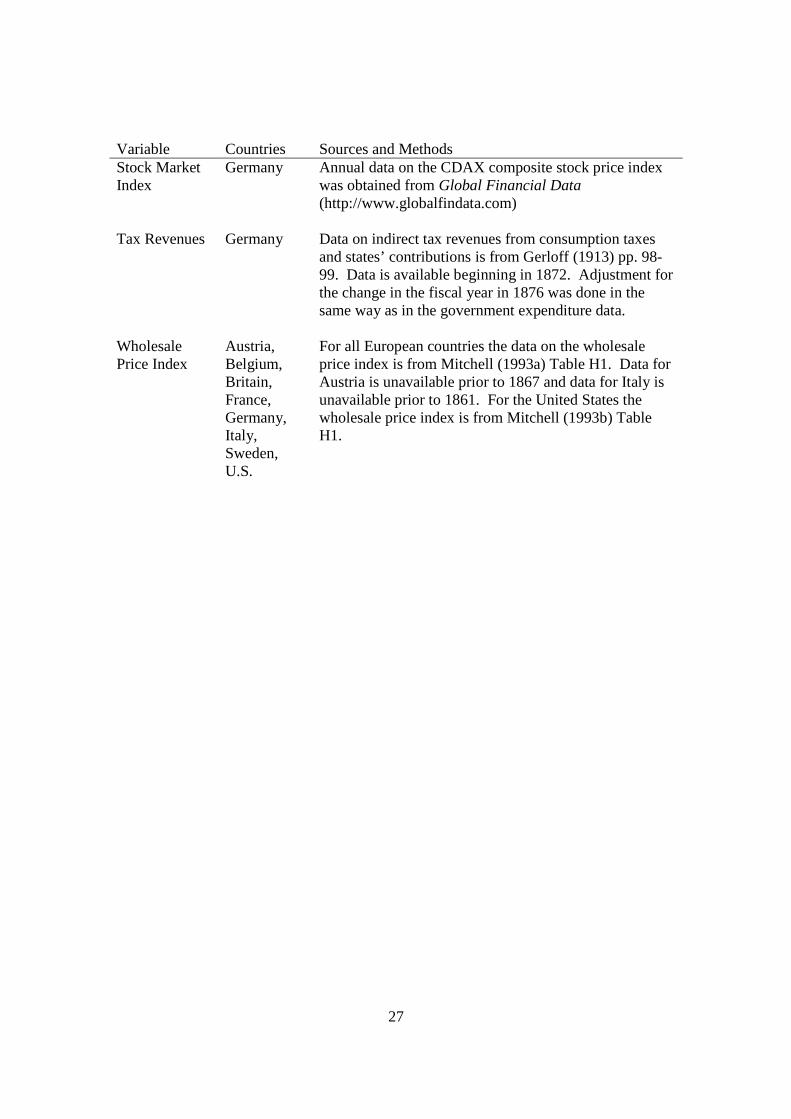
Variable Countries Sources and Methods Stock Market Index
Germany Annual data on the CDAX composite stock price index was obtained from Global Financial Data (http://www.globalfindata.com)
Tax Revenues Germany Data on indirect tax revenues from consumption taxes
and states’ contributions is from Gerloff (1913) pp. 98-99. Data is available beginning in 1872. Adjustment for the change in the fiscal year in 1876 was done in the same way as in the government expenditure data.
Wholesale Price Index
Austria, Belgium, Britain, France, Germany, Italy, Sweden, U.S.
For all European countries the data on the wholesale price index is from Mitchell (1993a) Table H1. Data for Austria is unavailable prior to 1867 and data for Italy is unavailable prior to 1861. For the United States the wholesale price index is from Mitchell (1993b) Table H1.
28
Table 1. Grain price behavior in Britain and Denmark, 1870-1913
(average annual percentage change)
Deflator Wheat
(%)
Barley
(%)
Oats
(%)
Rye
(%)
Britain, 1870-1913 GDP -0.43 -0.34 -0.21 ----
CPI -0.22 -0.04 0.07 ----
WPI -0.09 0.10 0.22 ----
Denmark, 1876-1913 GDP -0.47 -0.15 -0.20 -0.02
CPI -0.44 -0.08 -0.13 0.03
WPI -0.21 0.10 0.02 0.19
Sources: See appendix.
29
Table 2. Grain acreage and production shares in Germany, 1870
Wheat
(%)
Barley
(%)
Oats
(%)
Rye
(%)
Acreage 12.3 12.9 29.1 45.6
Production 13.2 14.8 28.0 44.0
Note: Values in the first row do not add up to 100 due to rounding.
Sources: See appendix.
30
Table 3. Grain price behavior in Britain, 1870-78
(average annual percentage change)
Deflator Wheat
(%)
Barley
(%)
Oats
(%)
Rye
(%)
GDP 0.78 2.19 1.13 ----
CPI 1.38 3.06 1.98 ----
WPI 0.97 2.56 1.55 ----
Sources: See appendix.
31
Table 4. Grain price behavior in Germany, 1850-78
(average annual percentage change)
Deflator Wheat
(%)
Barley
(%)
Oats
(%)
Rye
(%)
GDP 0.54 1.55 0.87 1.27
CPI -0.98 0.00 -0.47 -0.45
WPI 1.18 2.22 1.68 1.97
Sources: See appendix.
32
Table 5. Expenditure of the Franco-Prussian War indemnity
Item Expenditures
(Million Francs)
% of Total
War costs 1689.0 33.78
Pensions and pension fund 738.7 14.77
War damages 174.8 3.50
Fortifications 421.8 8.44
War treasure 150.0 3.00
Other military expenses 450.0 9.00
Navy 119.6 2.39
New Reichstag building 30.0 0.60
Alsace-Lorraine railroad 511.8 10.24
Luxembourg railroad 23.6 0.47
Paid South German states 583.1 11.66
Miscellaneous 108.0 2.16
Total 5,000.4 100
Source: Monroe (1919, p. 274) and author’s calculations.
33
Table 6. Macroeconomic developments in Germany, 1860-78
(average annual percentage change)
1860-70
(%)
1871-74
(%)
1875-78
(%)
Real Net National Product 2.13 6.32 0.60
Consumer Price Index 1.41 6.95 -2.88
Wholesale Price Index -0.17 5.32 -7.18
Real Exchange Rate -0.19a -2.90 4.44
Banknotes in Circulation 6.59 12.55 -9.63
Stock Market Index 3.14 6.59 -9.99
Note: a 1867-70 average.
Sources: See appendix.
34
Table 7. Output growth in selected countries, 1860-78
(average annual percentage change)
1860-1870
(%)
1871-1874
(%)
1875-1878
(%)
Germany 2.13 6.32 0.60
Austria 1.12 2.55 2.38
Belgium 2.38 2.57 1.31
France 2.03 2.57 -0.20
Italy 1.05a 0.80 1.16
Sweden 2.89 4.14 0.94
Britain 3.08 2.13 1.09
United States 3.34 5.61 5.50
Note: a 1861-70 average.
Sources: See appendix.
35
Table 8. Results of parliamentary elections in Germany, 1871-78
(number of seats)
1871 1874 1877 1878
Conservatives 57 22 40 59
Free Conservatives 37 33 38 57
Center (Catholics) 63 91 93 94
National Liberals 125 155 128 99
Progressives 47 50 39 29
Source: Feuchtwanger (2001, appendix table 9, p. 201).
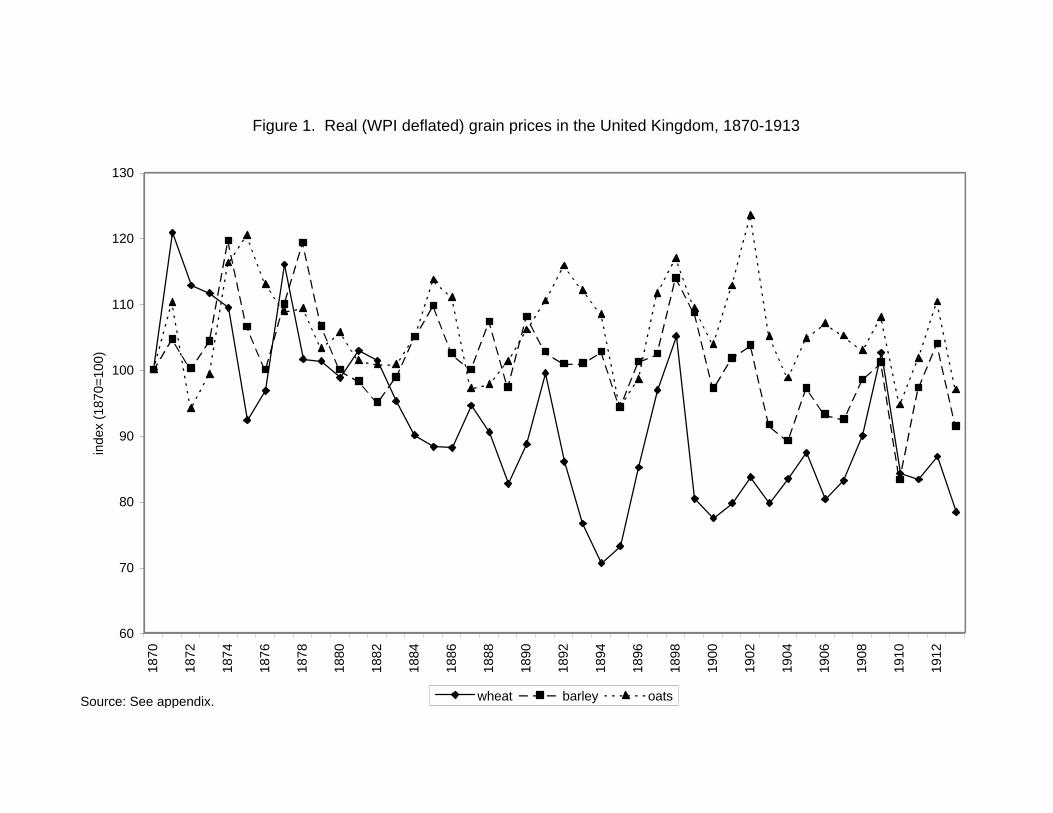
Figure 1. Real (WPI deflated) grain prices in the United Kingdom, 1870-1913
60
70
80
90
100
110
120
130
1870
1872
1874
1876
1878
1880
1882
1884
1886
1888
1890
1892
1894
1896
1898
1900
1902
1904
1906
1908
1910
1912
inde
x (1
870=
100)
wheat barley oatsSource: See appendix.
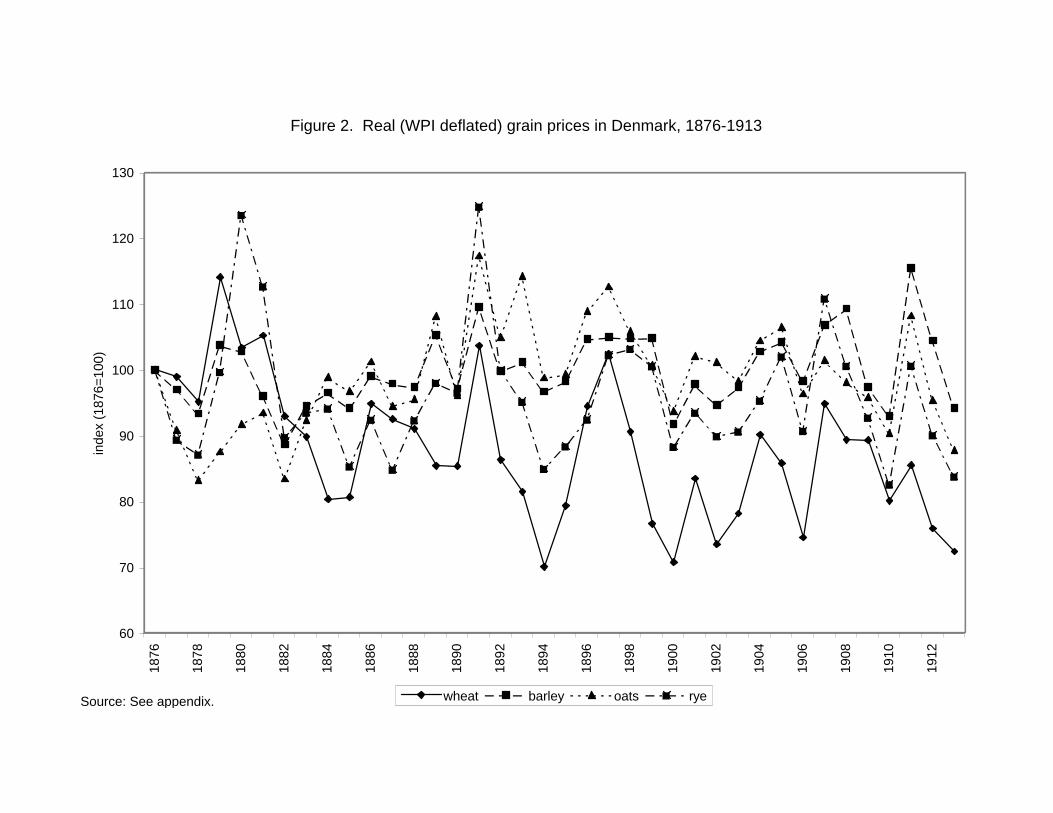
Figure 2. Real (WPI deflated) grain prices in Denmark, 1876-1913
60
70
80
90
100
110
120
13018
76
1878
1880
1882
1884
1886
1888
1890
1892
1894
1896
1898
1900
1902
1904
1906
1908
1910
1912
inde
x (1
876=
100)
wheat barley oats ryeSource: See appendix.
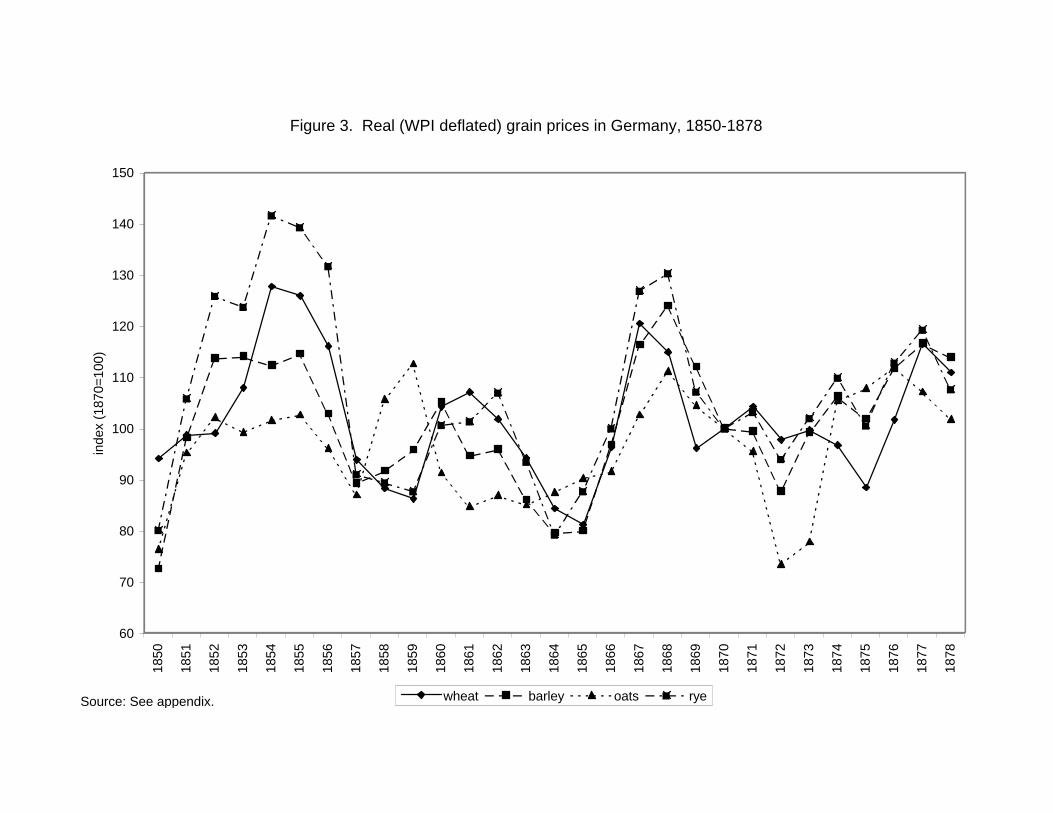
Figure 3. Real (WPI deflated) grain prices in Germany, 1850-1878
60
70
80
90
100
110
120
130
140
15018
50
1851
1852
1853
1854
1855
1856
1857
1858
1859
1860
1861
1862
1863
1864
1865
1866
1867
1868
1869
1870
1871
1872
1873
1874
1875
1876
1877
1878
inde
x (1
870=
100)
wheat barley oats ryeSource: See appendix.
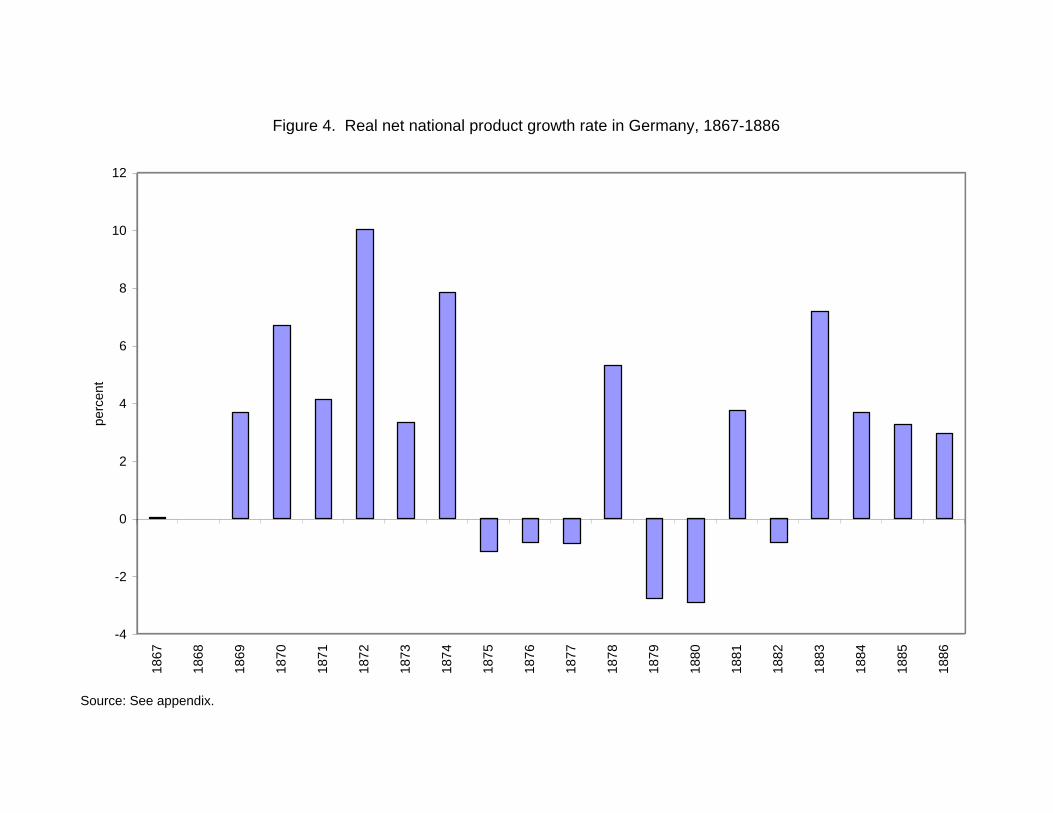
Figure 4. Real net national product growth rate in Germany, 1867-1886
-4
-2
0
2
4
6
8
10
1218
67
1868
1869
1870
1871
1872
1873
1874
1875
1876
1877
1878
1879
1880
1881
1882
1883
1884
1885
1886
perc
ent
Source: See appendix.
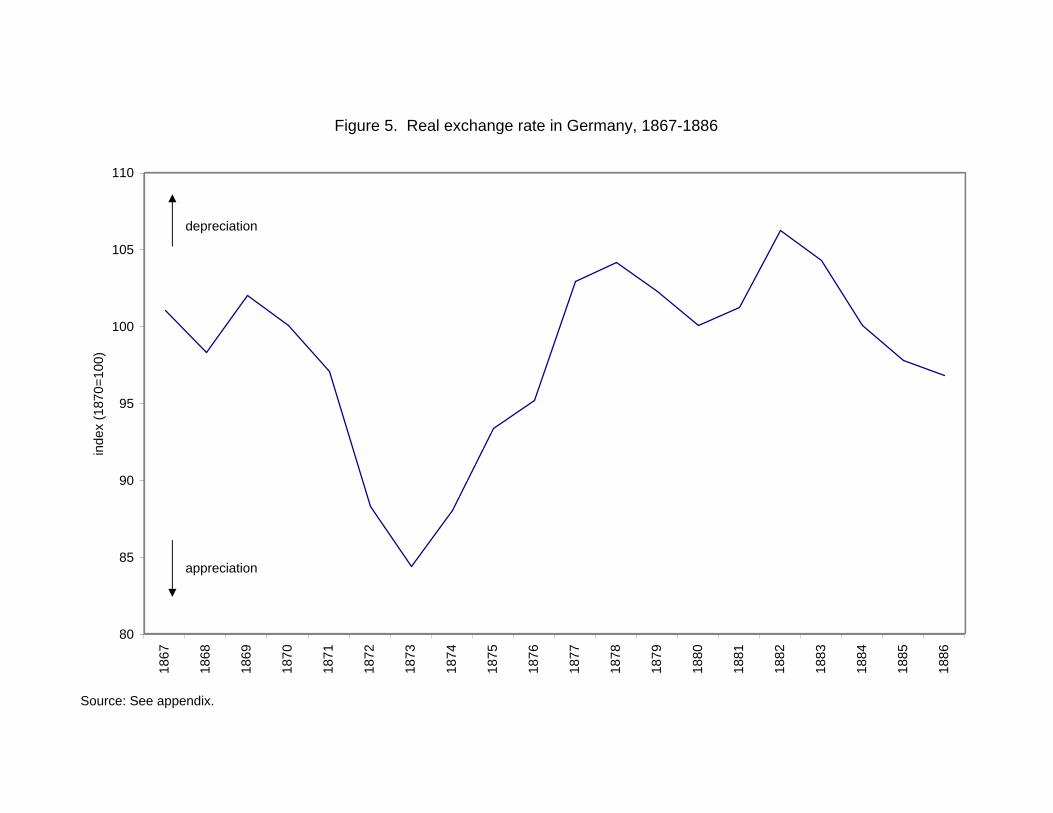
Figure 5. Real exchange rate in Germany, 1867-1886
80
85
90
95
100
105
11018
67
1868
1869
1870
1871
1872
1873
1874
1875
1876
1877
1878
1879
1880
1881
1882
1883
1884
1885
1886
inde
x (1
870=
100)
depreciation
appreciation
Source: See appendix.
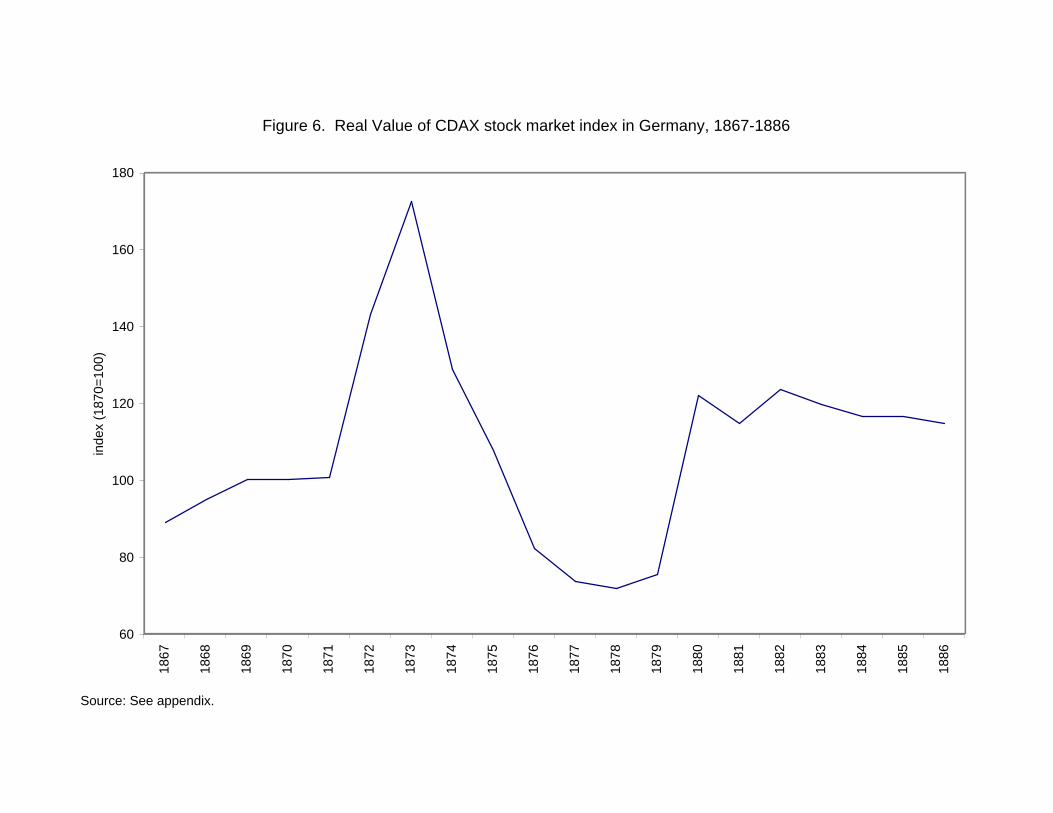
Figure 6. Real Value of CDAX stock market index in Germany, 1867-1886
60
80
100
120
140
160
18018
67
1868
1869
1870
1871
1872
1873
1874
1875
1876
1877
1878
1879
1880
1881
1882
1883
1884
1885
1886
inde
x (1
870=
100)
Source: See appendix.
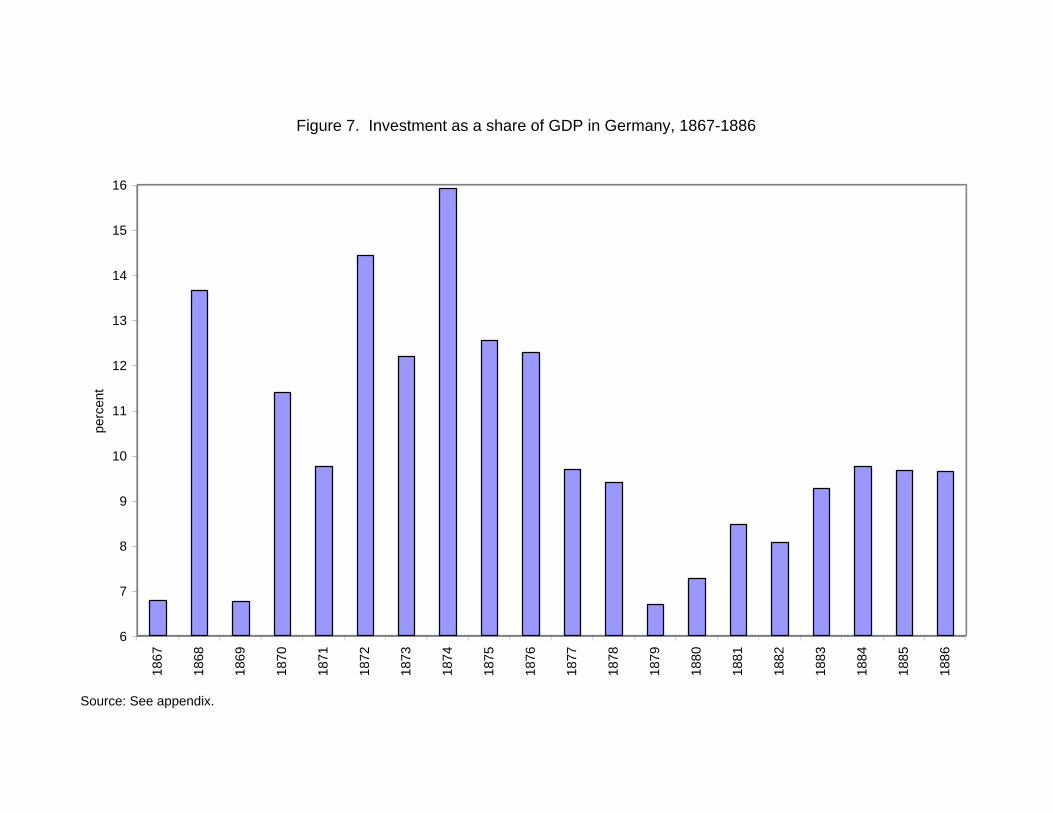
Figure 7. Investment as a share of GDP in Germany, 1867-1886
6
7
8
9
10
11
12
13
14
15
16
1867
1868
1869
1870
1871
1872
1873
1874
1875
1876
1877
1878
1879
1880
1881
1882
1883
1884
1885
1886
perc
ent
Source: See appendix.
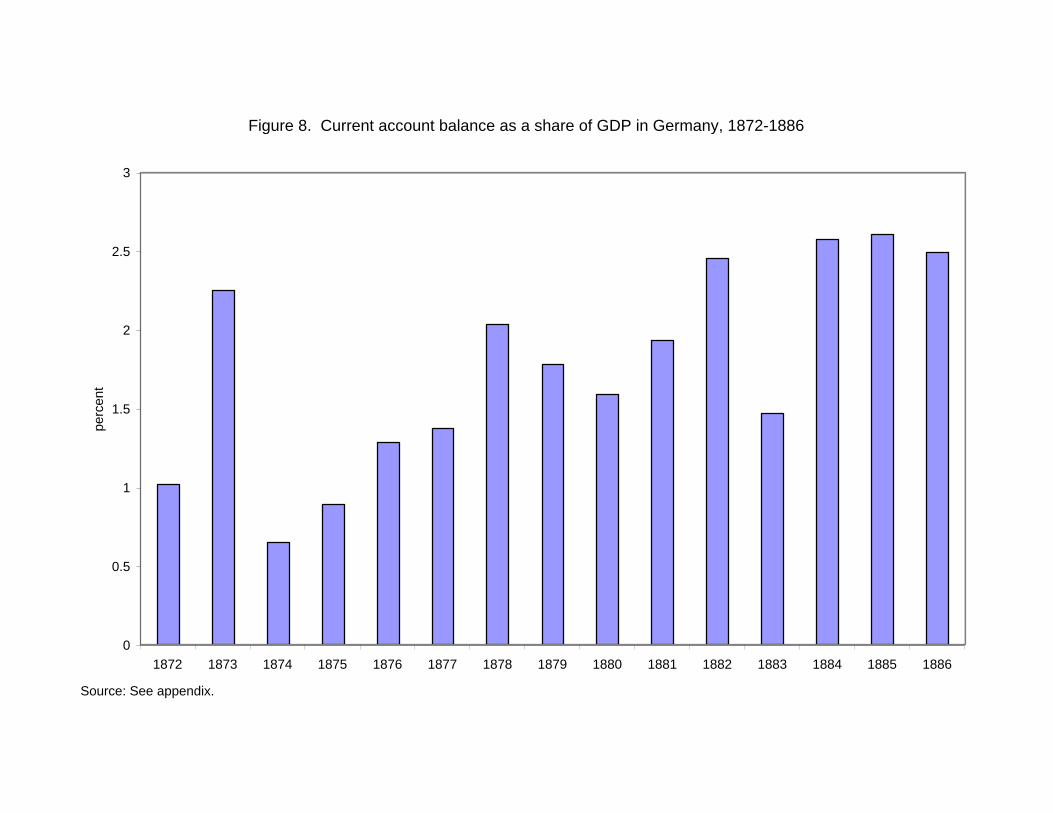
Figure 8. Current account balance as a share of GDP in Germany, 1872-1886
0
0.5
1
1.5
2
2.5
3
1872 1873 1874 1875 1876 1877 1878 1879 1880 1881 1882 1883 1884 1885 1886
perc
ent
Source: See appendix.
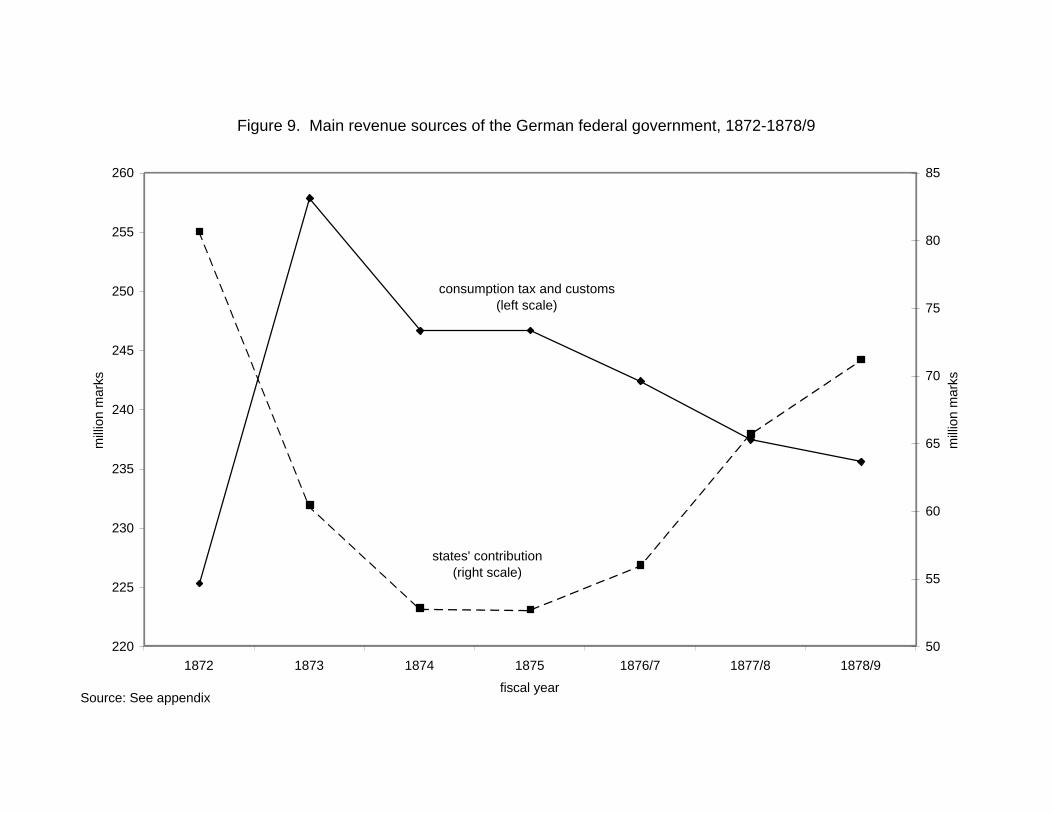
Figure 9. Main revenue sources of the German federal government, 1872-1878/9
220
225
230
235
240
245
250
255
260
1872 1873 1874 1875 1876/7 1877/8 1878/9
fiscal year
mill
ion
mar
ks
50
55
60
65
70
75
80
85
mill
ion
mar
ks
consumption tax and customs(left scale)
states' contribution(right scale)
Source: See appendix


