
The Innovation Revolution
Will Hutton
Innovation, Enterprise and the 2010s
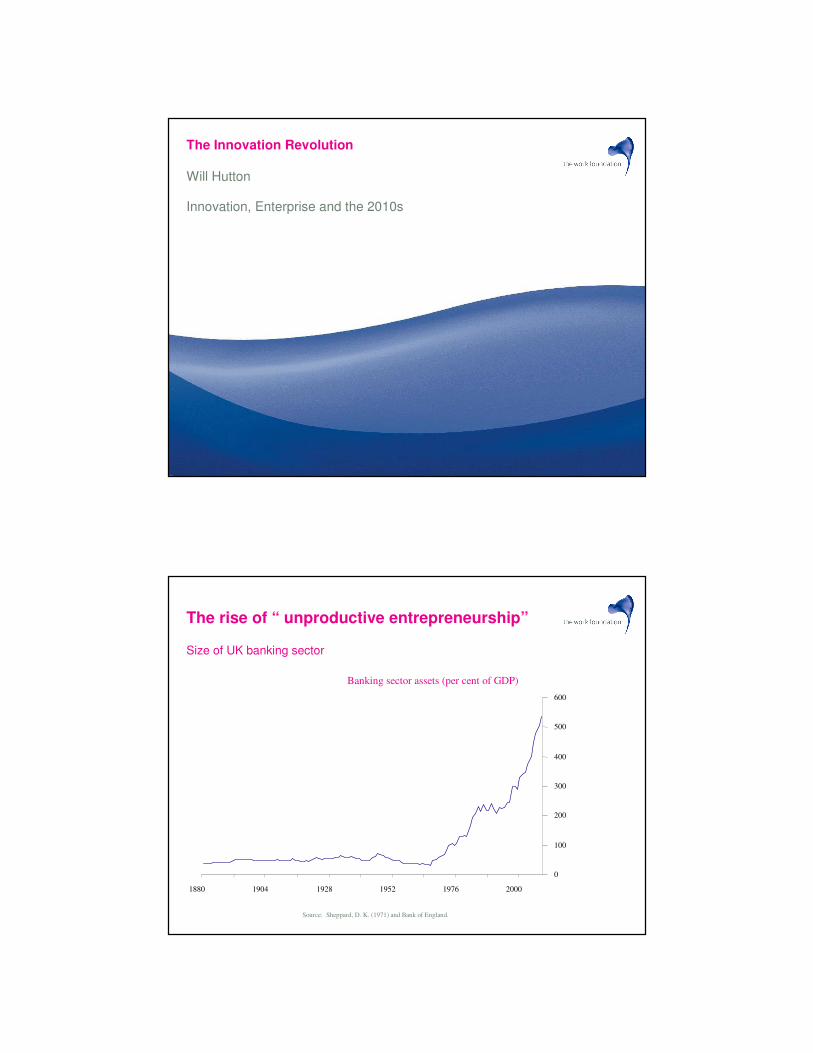
The rise of “ unproductive entrepreneurship”
Size of UK banking sector
UK banking sector assets
0
100
200
300
400
500
600
1880 1904 1928 1952 1976 2000
Banking sector assets (per cent of GDP)
Source: Sheppard, D. K. (1971) and Bank of England.
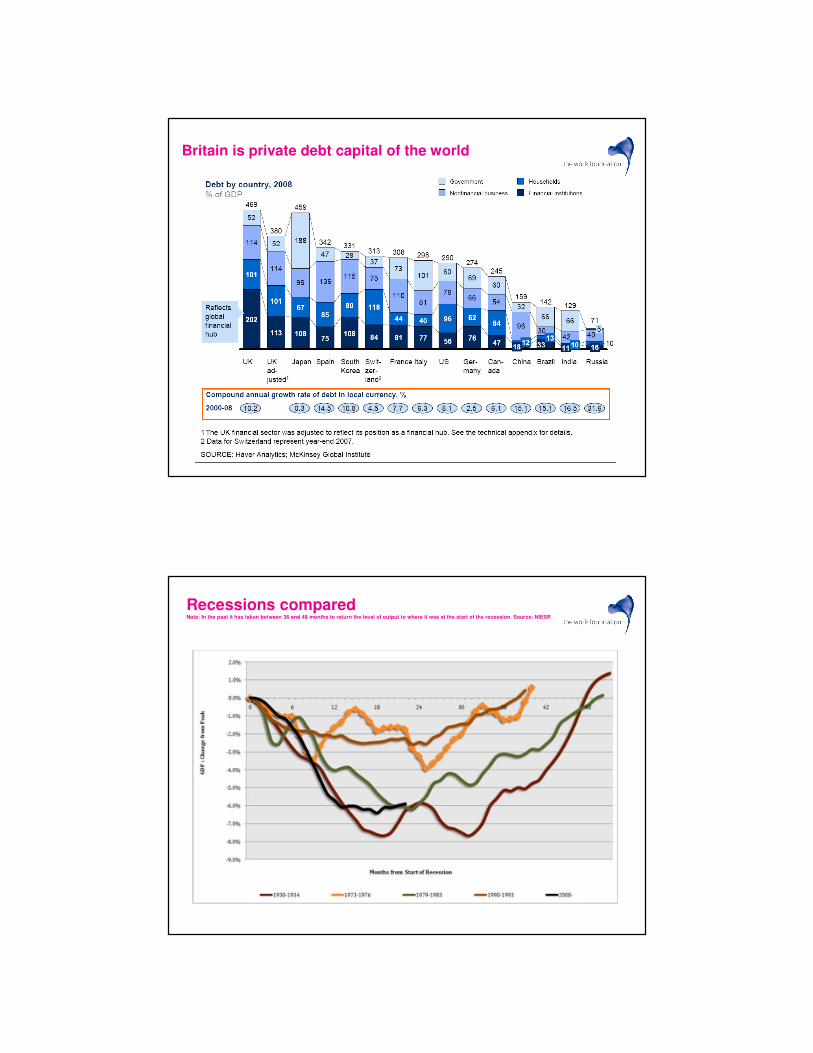
Britain is private debt capital of the world
Recessions comparedNote: In the past it has taken between 36 and 48 months to return the level of output to where it was at the start of the recession. Source: NIESR
The tough 2010s
• Minimum 5 per cent of GDP lost for ever. Loss could be as high as 10
per cent.
• Trend growth rate 1991 to 2009 ( trough to trough) was 2.0 per cent but
contained bubble effects. Note between 1997 and 2007 half GDP
growth financial services, property and construction.
• Barclays worst case forecast in IFS Green Budget is trend growth of
1.75 per cent
• There will be deleveraging and build up of saving
• Yet 3 million economically inactive, 2.8 million involuntarily idle and 2.45
million unemployed.
• Public sector has generated half jobs growth since 1997. Cannot be
repeated 2010-20.
…….Where are growth and jobs to come from in the 2010s?
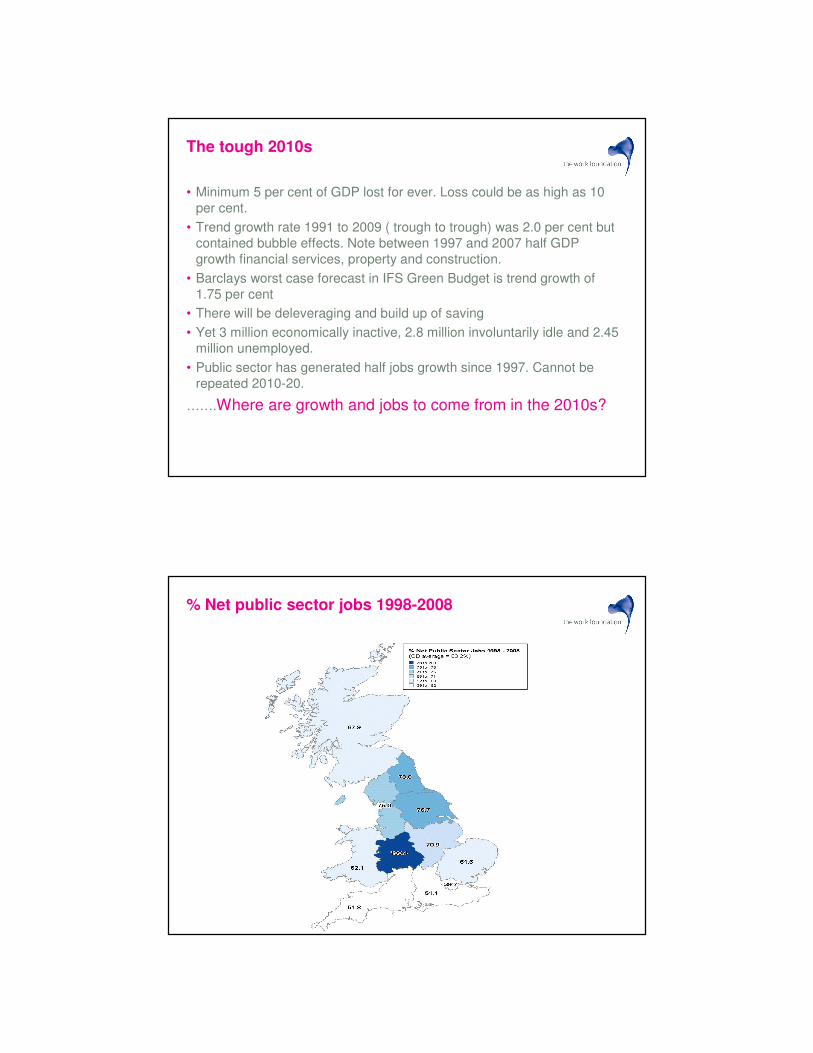
% Net public sector jobs 1998-2008
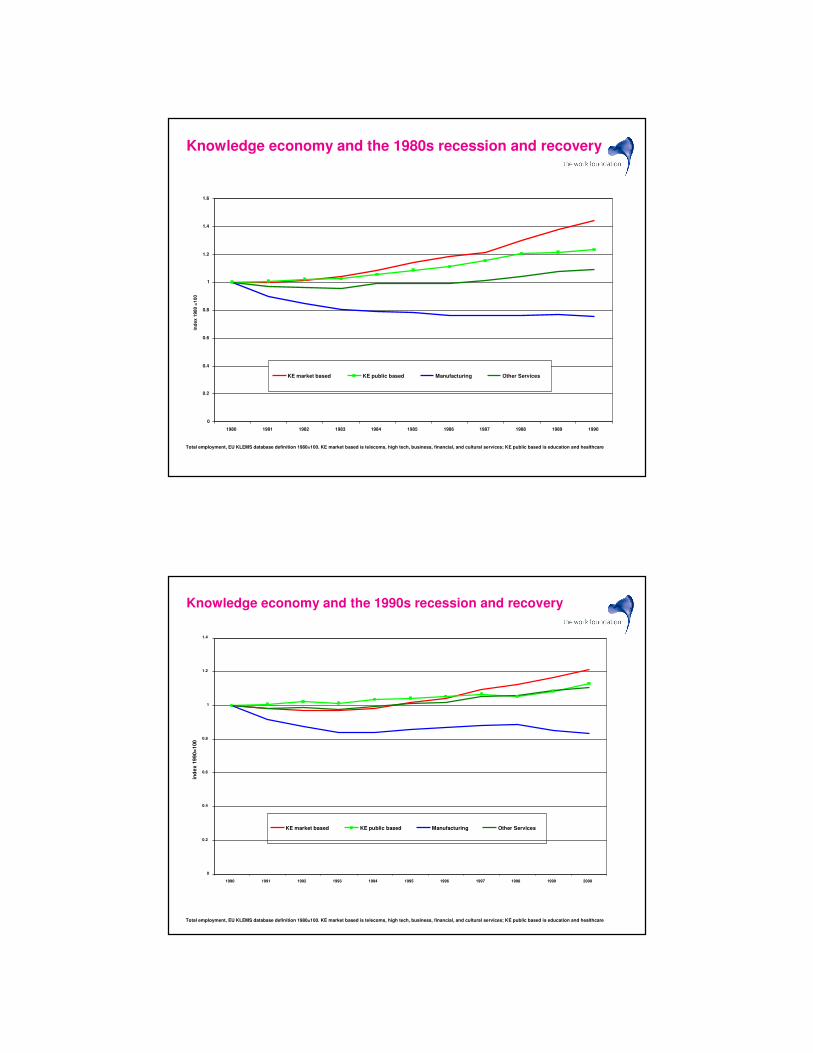
Knowledge economy and the 1980s recession and recovery
Total employment, EU KLEMS database definition 1980=100. KE market based is telecoms, high tech, business, financial, and cultural services; KE public based is education and healthcare
0
0.2
0.4
0.6
0.8
1
1.2
1.4
1.6
1980 1981 1982 1983 1984 1985 1986 1987 1988 1989 1990
ind
ex 1
980 =
100
KE market based KE public based Manufacturing Other Services
Knowledge economy and the 1990s recession and recovery
Total employment, EU KLEMS database definition 1980=100. KE market based is telecoms, high tech, business, financial, and cultural services; KE public based is education and healthcare
0
0.2
0.4
0.6
0.8
1
1.2
1.4
1990 1991 1992 1993 1994 1995 1996 1997 1998 1999 2000
ind
ex 1
99
0=
100
KE market based KE public based Manufacturing Other Services
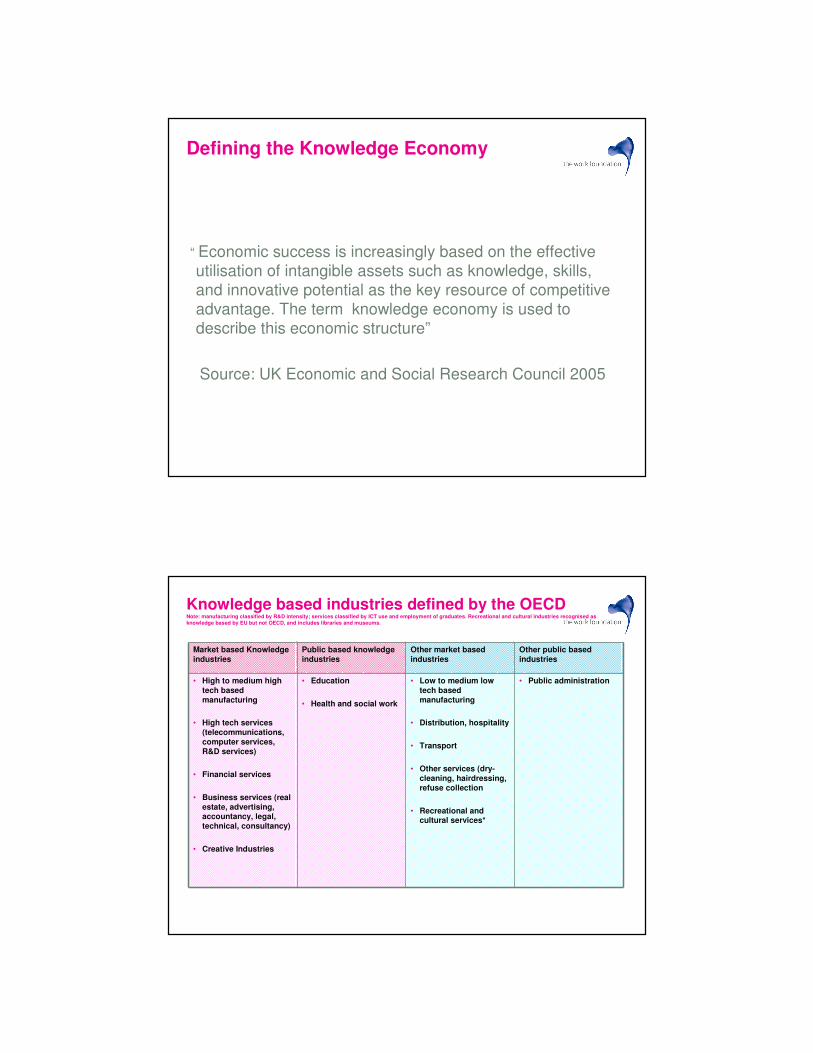
Defining the Knowledge Economy
“ Economic success is increasingly based on the effective
utilisation of intangible assets such as knowledge, skills,
and innovative potential as the key resource of competitive
advantage. The term knowledge economy is used to
describe this economic structure”
Source: UK Economic and Social Research Council 2005
Knowledge based industries defined by the OECDNote: manufacturing classified by R&D intensity; services classified by ICT use and employment of graduates. Recreational and cultural industries recognised as
knowledge based by EU but not OECD, and includes libraries and museums.
Market based Knowledge industries
Public based knowledge industries
Other market based industries
Other public based industries
• High to medium high tech based manufacturing
• High tech services (telecommunications, computer services, R&D services)
• Financial services
• Business services (real estate, advertising, accountancy, legal, technical, consultancy)
• Creative Industries
• Education
• Health and social work
• Low to medium low tech based manufacturing
• Distribution, hospitality
• Transport
• Other services (dry-cleaning, hairdressing, refuse collection
• Recreational and cultural services*
• Public administration
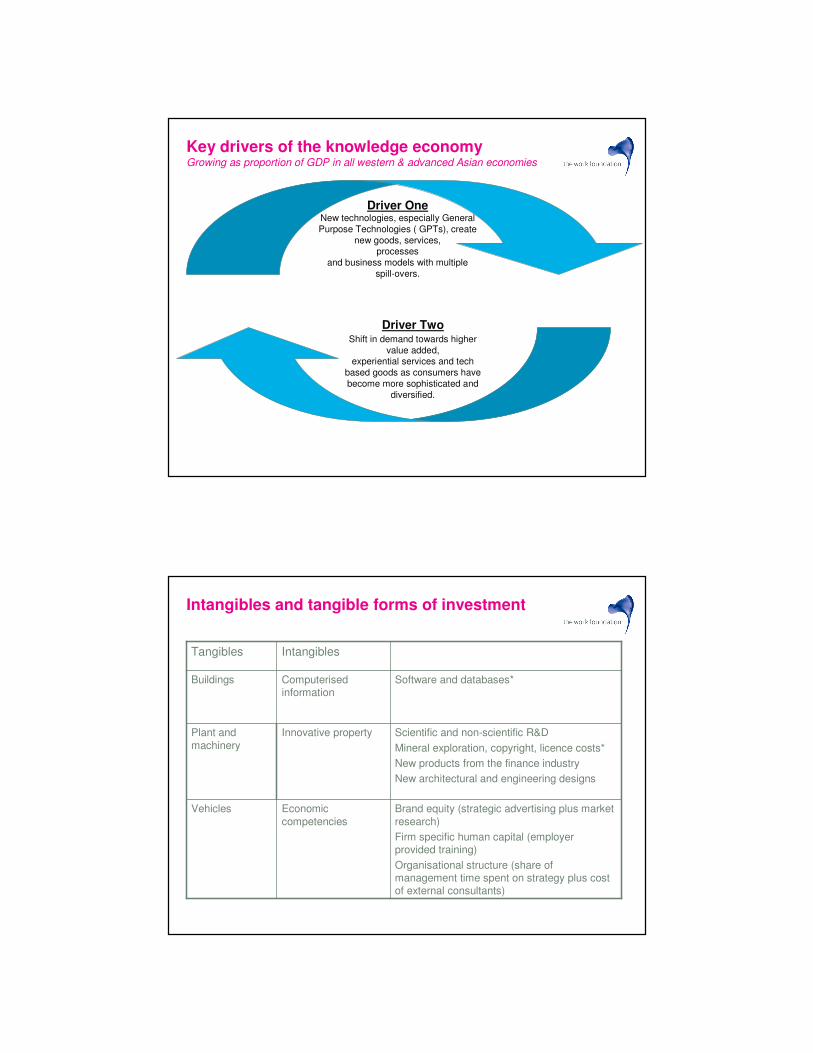
Key drivers of the knowledge economyGrowing as proportion of GDP in all western & advanced Asian economies
Driver TwoShift in demand towards higher
value added, experiential services and tech
based goods as consumers have
become more sophisticated and
diversified.
Driver OneNew technologies, especially General
Purpose Technologies ( GPTs), create
new goods, services, processes
and business models with multiple
spill-overs.
Intangibles and tangible forms of investment
Brand equity (strategic advertising plus market
research)
Firm specific human capital (employer provided training)
Organisational structure (share of management time spent on strategy plus cost of external consultants)
Economic
competencies
Vehicles
Scientific and non-scientific R&D
Mineral exploration, copyright, licence costs*
New products from the finance industry
New architectural and engineering designs
Innovative propertyPlant and
machinery
Software and databases*Computerised information
Buildings
IntangiblesTangibles
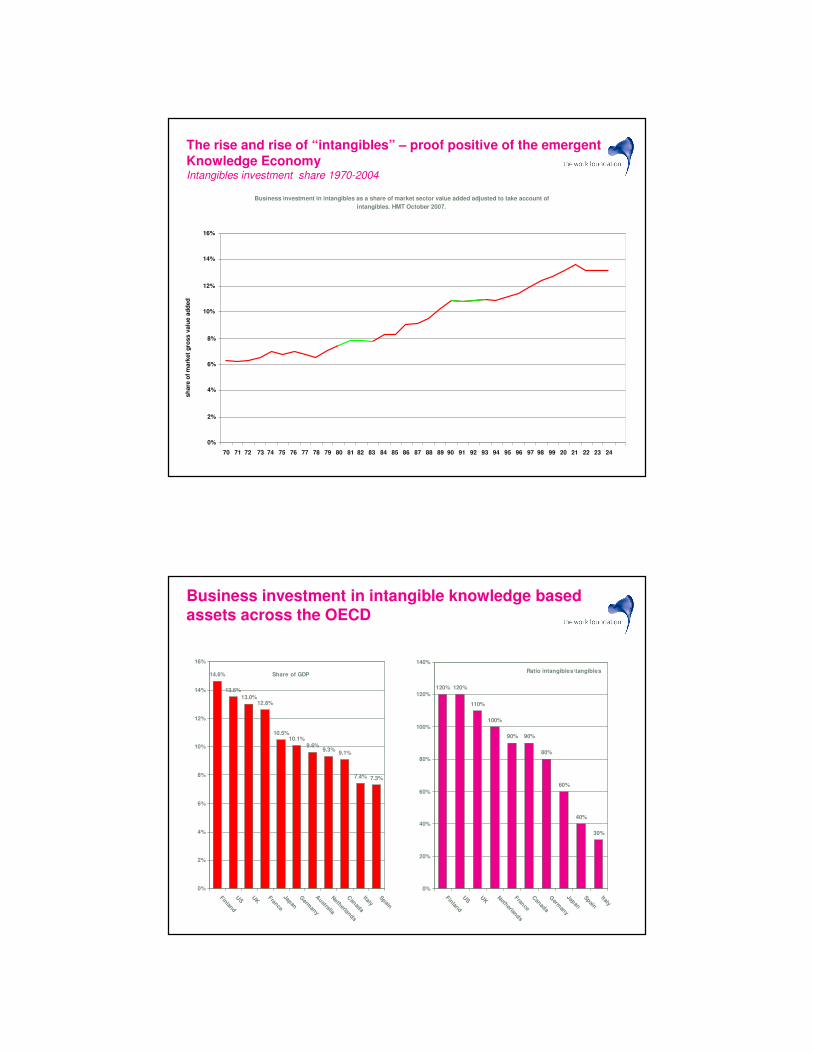
The rise and rise of “intangibles” – proof positive of the emergent
Knowledge EconomyIntangibles investment share 1970-2004
Business investment in intangibles as a share of market sector value added adjusted to take account of
intangibles. HMT October 2007.
0%
2%
4%
6%
8%
10%
12%
14%
16%
70 71 72 73 74 75 76 77 78 79 80 81 82 83 84 85 86 87 88 89 90 91 92 93 94 95 96 97 98 99 20 21 22 23 24
sh
are
of
mark
et
gro
ss v
alu
e a
dd
ed
Business investment in intangible knowledge based assets across the OECD
Share of GDP14.6%
13.5%
13.0%12.6%
10.5%10.1%
9.6%9.3%
9.1%
7.4% 7.3%
0%
2%
4%
6%
8%
10%
12%
14%
16%
Finland
US
UK
France
Japan
Germ
any
Australia
Netherlands
Canada
ItalySpain
Ratio intangibles\tangibles
120% 120%
110%
100%
90% 90%
80%
60%
40%
30%
0%
20%
40%
60%
80%
100%
120%
140%
Finland
US
UK
Netherlands
France
Canada
Germ
any
Japan
Spain
Italy
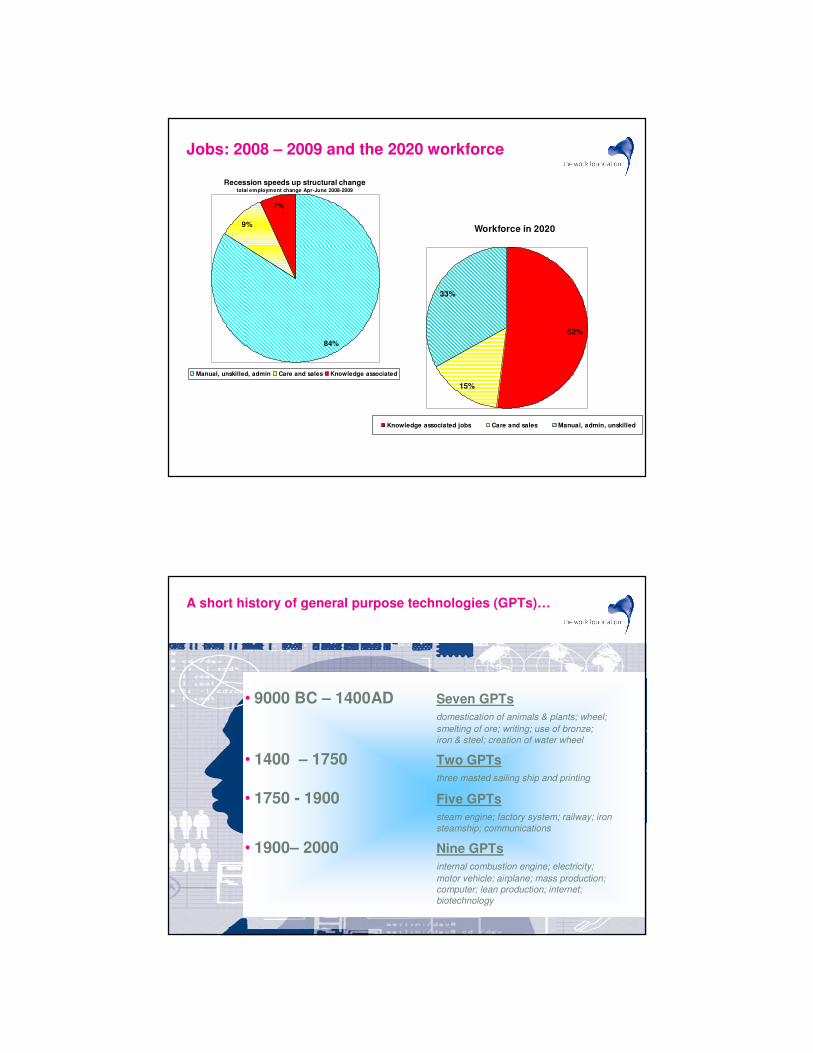
Jobs: 2008 – 2009 and the 2020 workforce
Recession speeds up structural changetotal employment change Apr-June 2008-2009
9%
7%
84%
Manual, unskilled, admin Care and sales Knowledge associated
Workforce in 2020
15%
33%
52%
Knowledge associated jobs Care and sales Manual, admin, unskilled
A short history of general purpose technologies (GPTs)…
• 9000 BC – 1400AD Seven GPTs
domestication of animals & plants; wheel;
smelting of ore; writing; use of bronze;
iron & steel; creation of water wheel
• 1400 – 1750 Two GPTs
three masted sailing ship and printing
• 1750 - 1900 Five GPTs
steam engine; factory system; railway; iron
steamship; communications
• 1900– 2000 Nine GPTs
internal combustion engine; electricity;
motor vehicle; airplane; mass production; computer; lean production; internet;
biotechnology
Twenty-first century prospects ? Grand Challenges for Engineering
• Nanotechnologies
• Energy from fusion
• Advanced materials
• Carbon sequestration
• Manage the nitrogen cycle
• Water
• Health informatics
• Durable customised infrastructure
• Customised medicine
• The brain
• Cyberspace security
• Enhance virtual reality
• Personalised learning
Why exponential growth of innovation
• Knowledge is a public good that constantly expands with each individual contribution to the pool of common knowledge from which others draw
• Multiple combinations of ideas ceaselessly growing
• As a result much invention and innovation happens simultaneously
• Research scientists report that their research anticipated by other teams
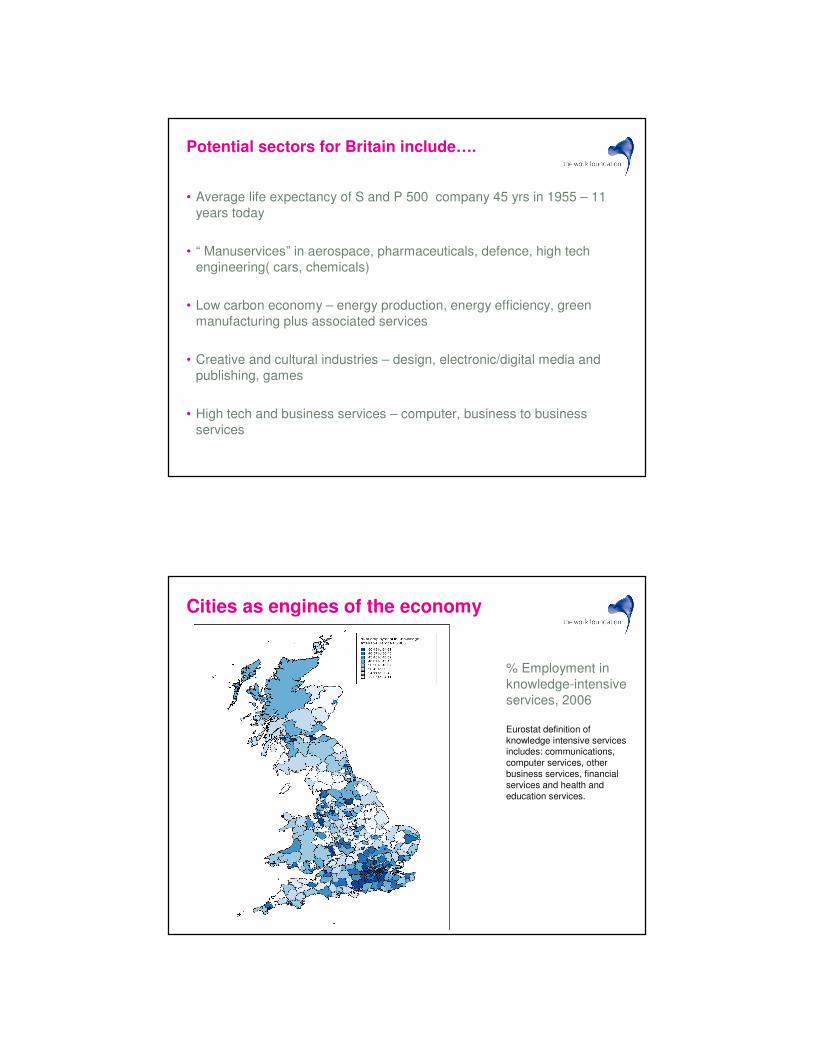
Potential sectors for Britain include….
• Average life expectancy of S and P 500 company 45 yrs in 1955 – 11
years today
• “ Manuservices” in aerospace, pharmaceuticals, defence, high tech
engineering( cars, chemicals)
• Low carbon economy – energy production, energy efficiency, green
manufacturing plus associated services
• Creative and cultural industries – design, electronic/digital media and
publishing, games
• High tech and business services – computer, business to business
services
Cities as engines of the economy
% Employment in
knowledge-intensive
services, 2006
Eurostat definition of
knowledge intensive services includes: communications,
computer services, other
business services, financial
services and health and
education services.
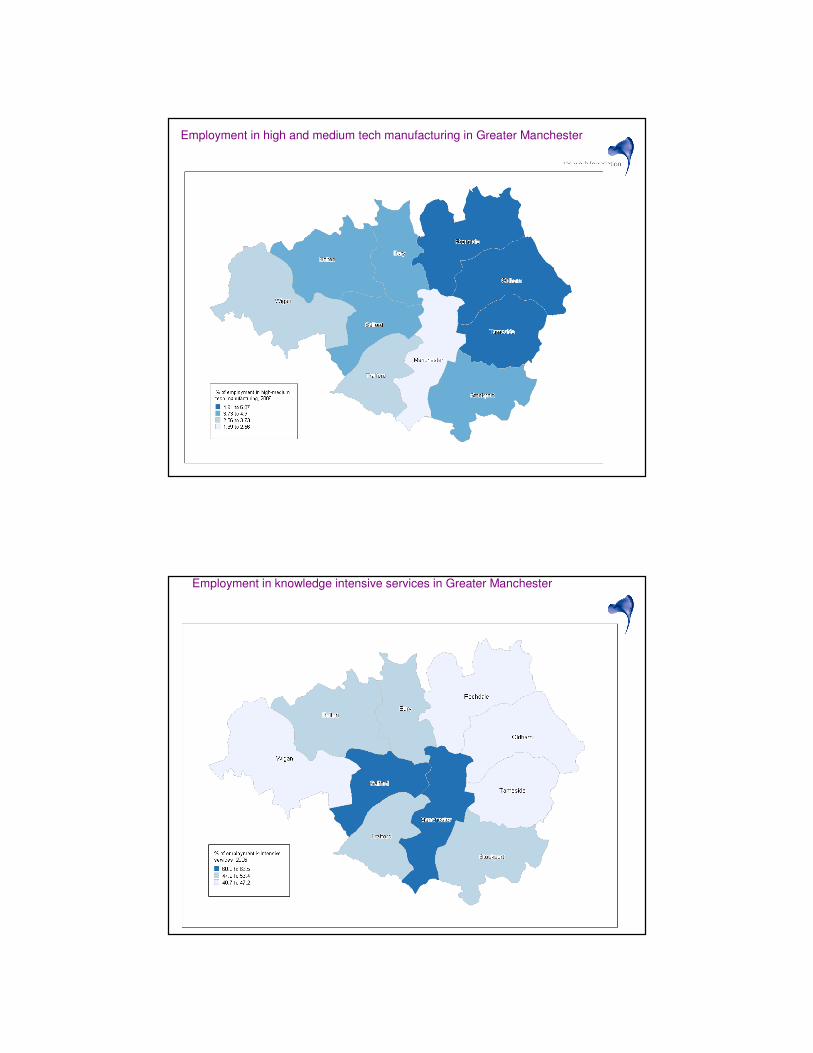
Employment in high and medium tech manufacturing in Greater Manchester
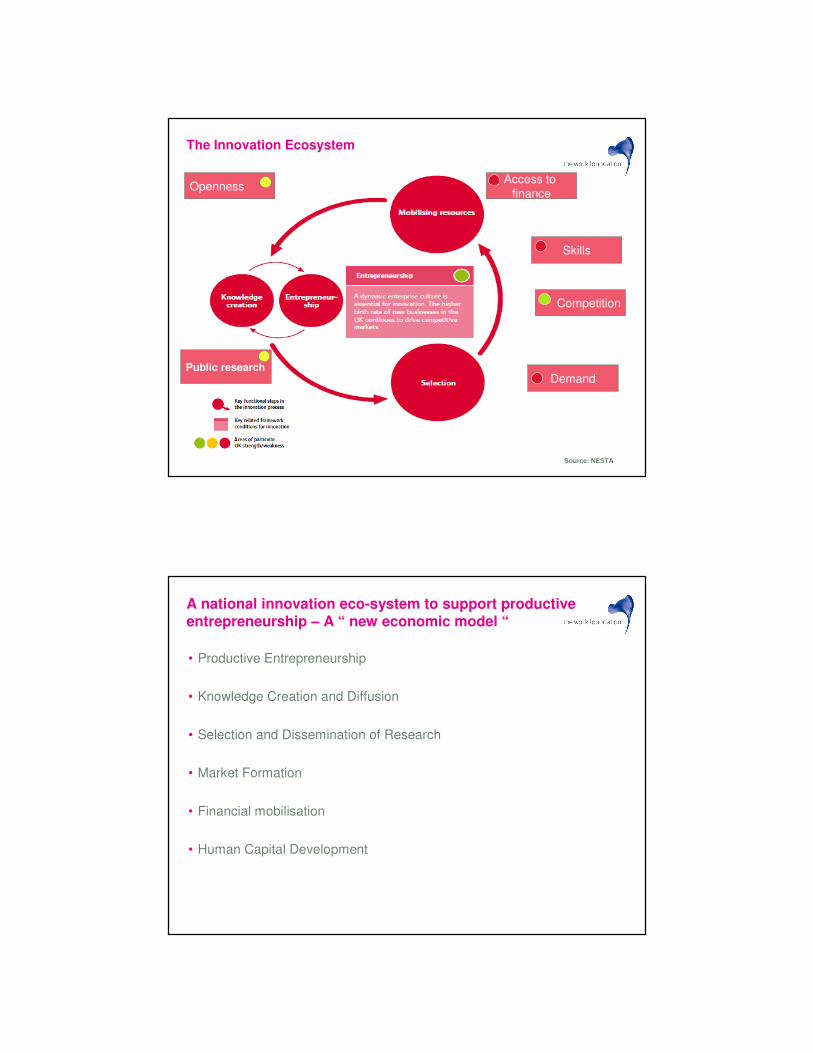
Employment in knowledge intensive services in Greater Manchester
The Innovation Ecosystem
Public research
OpennessAccess to
finance
Skills
Competition
Demand
Source: NESTA
A national innovation eco-system to support productive entrepreneurship – A “ new economic model “
• Productive Entrepreneurship
• Knowledge Creation and Diffusion
• Selection and Dissemination of Research
• Market Formation
• Financial mobilisation
• Human Capital Development
A new architecture of “ intermediate institutions”
• Russell Group Universities plus science
• British “ Fraunhofer” Institutes
• Creative hubs
• Network of intermediate financial institutions – Green Bank, Creative Industries Bank, Infrastructure Bank, new 3i
• Long term ownership, anchor companies
• Comprehensive lifelong learning
• Intermediate employment insurance mutuals, residential FE colleges, vocational academies to support flexi-security
• Cities with innovation “anchor” institutions
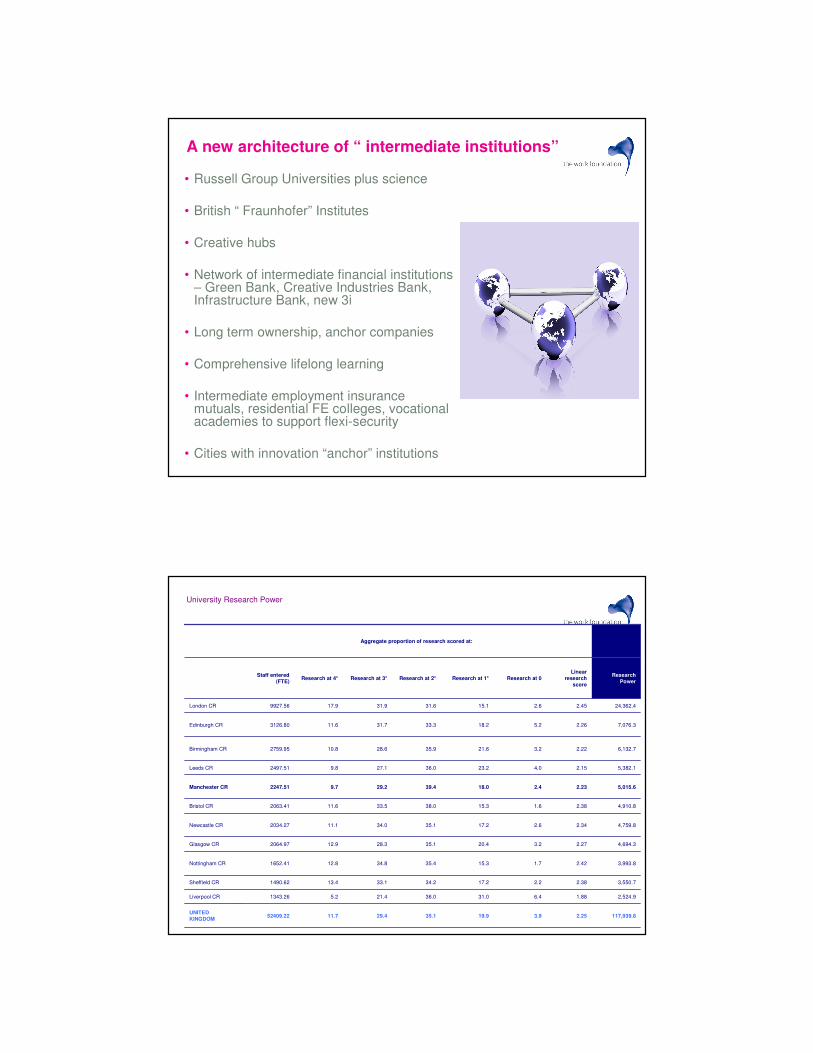
University Research Power
Source: RAE 2008
Aggregate proportion of research scored at:
117,939.82.253.919.935.129.411.752409.22UNITED
KINGDOM
2,524.91.886.431.036.021.45.21343.26Liverpool CR
3,550.72.382.217.234.233.113.41490.62Sheffield CR
3,993.82.421.715.335.434.812.81652.41Nottingham CR
4,694.32.273.220.435.128.312.92064.97Glasgow CR
4,759.82.342.617.235.134.011.12034.27Newcastle CR
4,910.82.381.615.338.033.511.62063.41Bristol CR
5,015.62.232.418.039.429.29.72247.51Manchester CR
5,382.12.154.023.236.027.19.82497.51Leeds CR
6,132.72.223.221.635.928.610.82759.95Birmingham CR
7,076.32.265.218.233.331.711.63126.80Edinburgh CR
24,362.42.452.615.131.631.917.99927.56London CR
Research
Power
Linear
research
score
Research at 0Research at 1*Research at 2*Research at 3*Research at 4*Staff entered
(FTE)
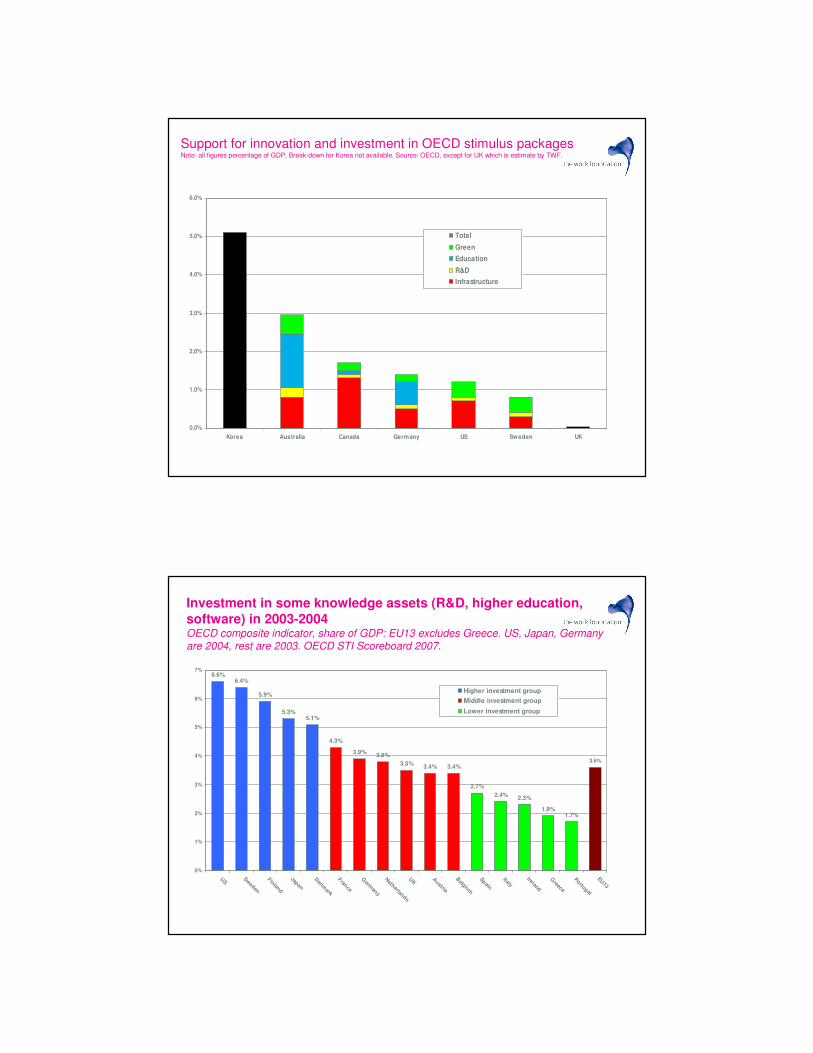
Support for innovation and investment in OECD stimulus packagesNote: all figures percentage of GDP. Break-down for Korea not available. Source: OECD, except for UK which is estimate by TWF.
0.0%
1.0%
2.0%
3.0%
4.0%
5.0%
6.0%
Korea Australia Canada Germany US Sweden UK
Total
Green
Education
R&D
Infrastructure
Investment in some knowledge assets (R&D, higher education,
software) in 2003-2004OECD composite indicator, share of GDP: EU13 excludes Greece. US, Japan, Germany are 2004, rest are 2003. OECD STI Scoreboard 2007.
6.6%6.4%
5.9%
5.3%5.1%
2.7%
2.4%2.3%
1.9%1.7%
4.3%
3.9%3.8%
3.5%3.4% 3.4%
3.6%
0%
1%
2%
3%
4%
5%
6%
7%
US
Sweden
Finland
Japan
Denm
ark
France
Germ
any
Netherlands
UK
Austria
Belgium
Spain
ItalyIreland
Greece
Portugal
EU13
Higher investment group
Middle investment group
Lower investment group
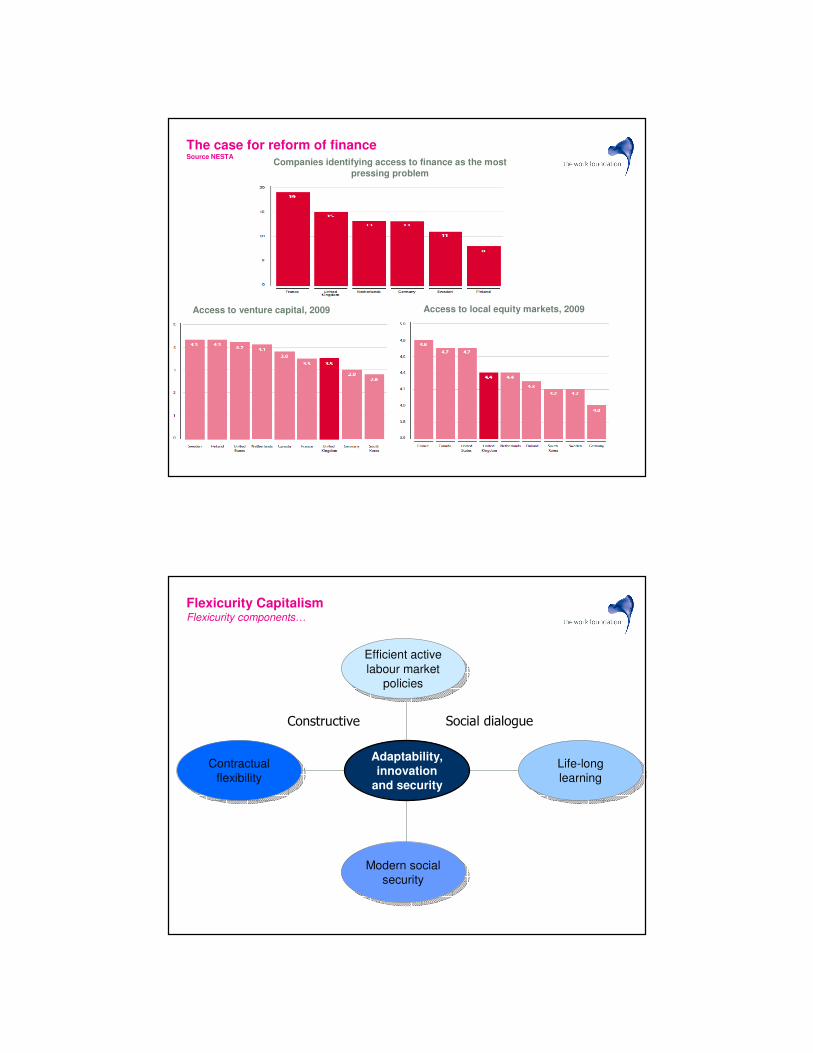
Companies identifying access to finance as the most
pressing problem
Access to venture capital, 2009 Access to local equity markets, 2009
The case for reform of financeSource NESTA
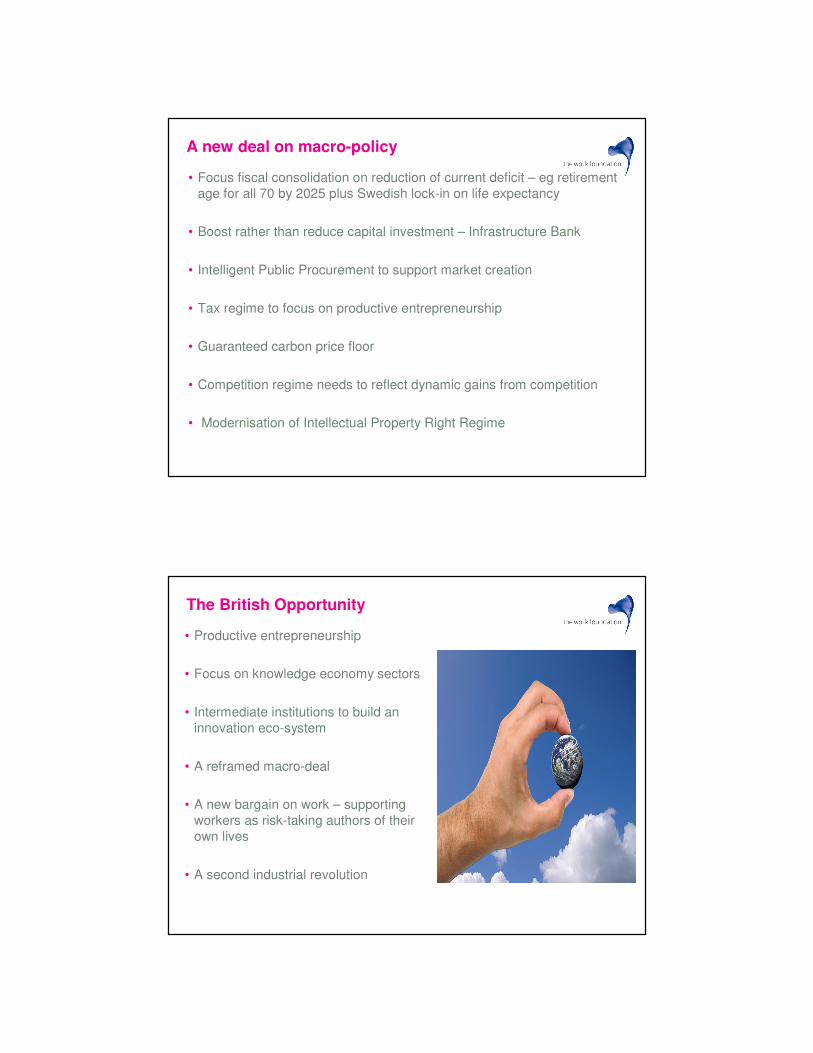
Constructive Social dialogue
Flexicurity CapitalismFlexicurity components…
Efficient active
labour market
policies
Efficient active
labour market
policies
Adaptability, innovation
and security
Life-long
learning
Life-long
learningContractual
flexibility
Contractual
flexibility
Modern social
security
Modern social
security
A new deal on macro-policy
• Focus fiscal consolidation on reduction of current deficit – eg retirement
age for all 70 by 2025 plus Swedish lock-in on life expectancy
• Boost rather than reduce capital investment – Infrastructure Bank
• Intelligent Public Procurement to support market creation
• Tax regime to focus on productive entrepreneurship
• Guaranteed carbon price floor
• Competition regime needs to reflect dynamic gains from competition
• Modernisation of Intellectual Property Right Regime
The British Opportunity
• Productive entrepreneurship
• Focus on knowledge economy sectors
• Intermediate institutions to build an
innovation eco-system
• A reframed macro-deal
• A new bargain on work – supporting
workers as risk-taking authors of their
own lives
• A second industrial revolution

Slides that follow are supplementary …
Knowledge Creation and Development
• Aggressive public investment in R and D, Russell Group Universities
and be tough on strategic priorities
• Establish “ University Consultancy” – JV with major PLCs professionally
to identify and network ideas for commercial exploitation
• Innovation prizes of up to £10 million
• US style tax incentives for universities who commercialise research
• Assign Design Council lead role co-ordinating British design and
applications
Selection and Dissemination of Research
• Centrality of Intellectual Property Right Regime. Renewal fees for patent and copyright to be much higher
• Launch British network of FraunhoferInstitutes – to horizon scan, screen, and assess technologies identifying companies who might be able to exploit them, especially SMEs.
• Reform or replace RDAs with City based Innovation Panels to manage City based Innovation Funds to support clusters and specific knowledge generation to support. Each City to have “ Total Innovation” strategy
Entrepreneurial Experimentation
• Competition policy to be much tougher on merging for scale and consolidation advantages so achieving static gains – instead emphasising dynamic gains from plural firms competing hard.
• Tax policy to favour small firm start ups and exits
• New 3i to finance start-ups
• Support large firm entrepreneurship via procurement, financing and R and D support
• Promote even more contractual flexibility in return for better unemployment benefit, employment insurance, lifelong learning, proactive career development and active labour market policies. “Flexi-curity.”
Market formation
• Understand market creation – from infancy to maturity
• Regulate to create markets
• Standard setting for “credence” goods
• Benchmark against best eg “Top Runner”
• Smart public procurement looking to co-innovate
• Procurement to target key sectors eg defence, pharma, life sciences,
ICT and Telecoms
Financial mobilisation – reducing casino bias of modern finance
• Innovation Bank to provide medium term finance for knowledge based companies. Super 3i?
• Infrastructure Bank to plug up to £500 billion financing gap over next decade
• Refocus City on “ productive entrepreneurship” – ban guaranteed bonuses, establish clawback mechanisms etc
• Break up too-big-to-fail super banks
• Shrink shadow banking system
• Bank of England to discount Innovation and Infrastructure Bank paper
• Corporate governance reform to encourage committed share ownership, including full disclosure
• FSA to regulate rather than promote financial services
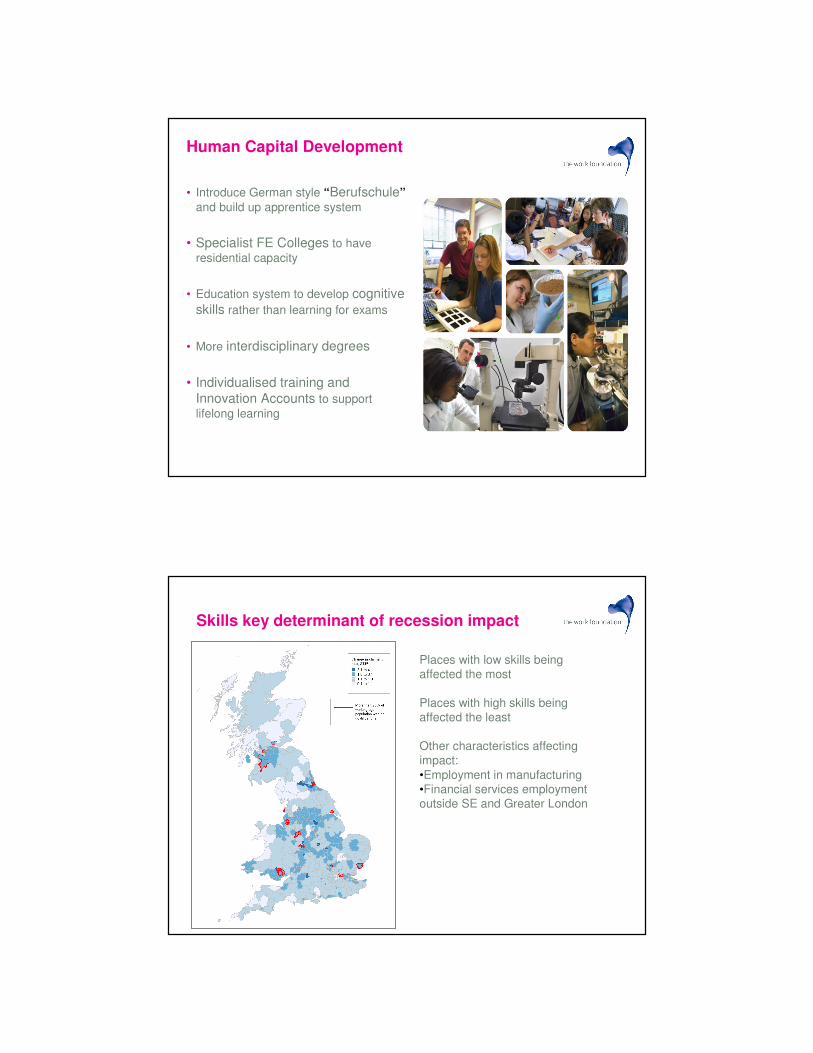
Human Capital Development
• Introduce German style “Berufschule”
and build up apprentice system
• Specialist FE Colleges to have
residential capacity
• Education system to develop cognitive
skills rather than learning for exams
• More interdisciplinary degrees
• Individualised training and
Innovation Accounts to support
lifelong learning
Skills key determinant of recession impact
Places with low skills being
affected the most
Places with high skills being
affected the least
Other characteristics affecting
impact:
•Employment in manufacturing
•Financial services employment
outside SE and Greater London
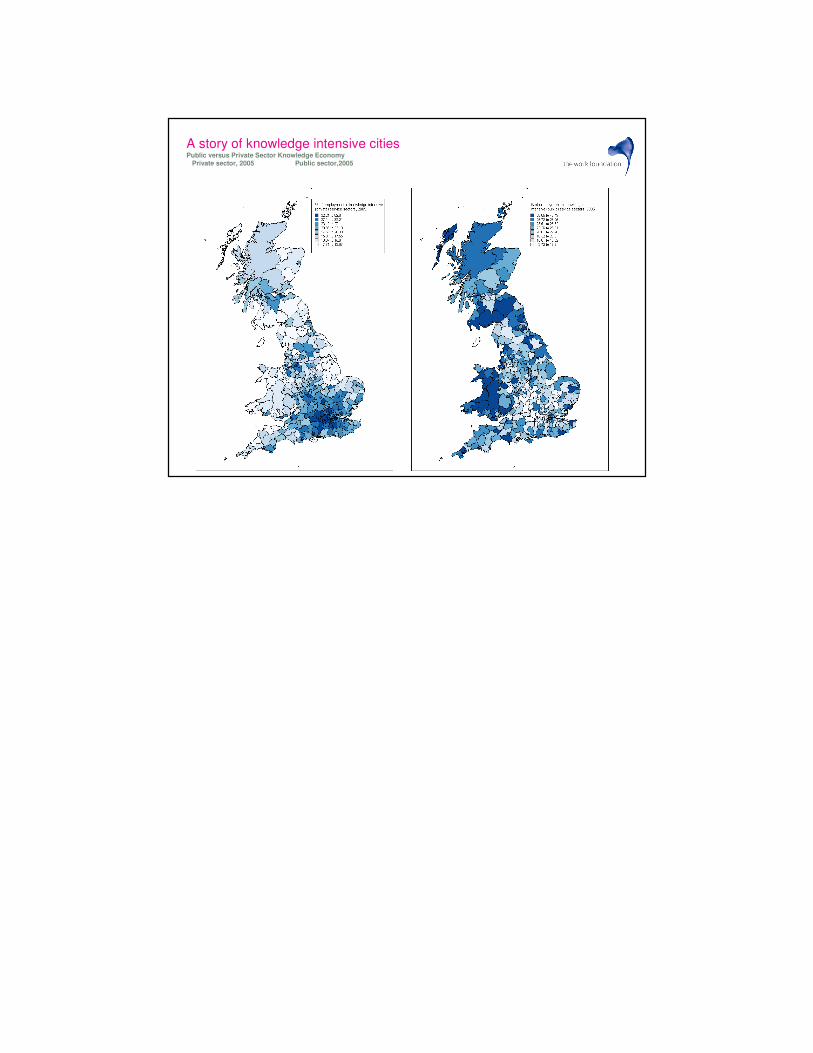
A story of knowledge intensive citiesPublic versus Private Sector Knowledge Economy
Private sector, 2005 Public sector,2005


