
The Role of CIL1 in Brassica carinata Lateral Meristem Development
A Thesis Submitted to the College of
Graduate Studies and Research
in Partial Fulfillment of the Requirements
for the Degree of Master of Science
in the Department of Biology
University of Saskatchewan
Saskatoon
By Shawn Gibson
© Copyright Shawn Gibson August 2005. All rights reserved

PERMISSION TO USE
In presenting this thesis in partial fulfillment of the requirements for a
postgraduate degree from the University of Saskatchewan, I agree that the libraries of this
university may make it freely available for inspection. I further agree that permission for
copying of this thesis in any manner, in whole or in part, for scholarly purposes may be
granted by the professor or professors who supervised my thesis work or, in their
absence, by the Head of the Department or the Dean of the College in which my thesis
work was done. It is understood that any copying, publication, or use of this thesis or
parts thereof for financial gain shall not be allowed without my written permission. It is
also understood that due recognition shall be given to me and to the University of
Saskatchewan in any scholarly use which may be made of any material in my thesis.
Requests for permission to copy or to make other use of material in this thesis in whole or
part should be addressed to:
Head of the Department of Biology
University of Saskatchewan
Saskatoon, Saskatchewan S7N 5E2
Canada
i

ABSTRACT
A cDNA sequence representing a Brassica carinata gene the expression of which
is induced by copper chloride treatment, was isolated from a library constructed with
mRNA from treated leaves, and designated CIL1 (COPPER CHLORIDE INDUCED in
LEAVES). A Basic Local Alignment Search Tool search revealed that CIL1 has
similarities to an auxin-induced gene, AIR12 from Arabidopsis thaliana. Southern blot
analysis of CIL1 in B. carinata, B. nigra and B. oleracea indicated that it is a member of
a small multigene family. Antisense CIL1 transgenic plants were generated to investigate
the function of CIL1, and the resulting transformants displayed increased secondary
branching suggesting that CIL1 has a role in regulating hormone content or plant
architecture. Results of induction studies indicate that the auxin analog α-naphthalene
acetic acid, the cytokinin 6-benzylaminopurine, and +/- abscisic acid increase expression
of CIL1. Seven CIL1 antisense lines were grown to the T4 generation and were
confirmed homozygous. Analysis of CIL1 expression using real-time quantitative RT-
PCR showed reduced expression in every examined line. Transgenic plants produced
many leaves at the lateral meristems indicating a release of apical dominance.
Additionally, the concentrations of auxins, cytokinins, and abscisic acid were altered in
the roots and stems of transgenic plants compared to non-transformed plants. Therefore,
CIL1 has a role in regulating hormone content that affects lateral meristem activity, apical
dominance, and leaf production.
ii

ACKNOWLEDGEMENTS
I would like to take this opportunity to thank everyone who helped me throughout
my Master’s Degree study. I would like to thank my supervisor, Dr. Janet Taylor, for
giving me this opportunity. I am grateful for her encouragement, financial support, and
excellent supervision over the course of my research. I also want to express my thanks to
Stephen Ambrose, who ran all of my samples for the phytohormone profiling portion of
my thesis, his expertise and knowledge were invaluable, and to Sheila Chiwocha and
Monica Lafond for help with the phytohormone extraction method. I appreciate the
efforts of my advisory committee Dr. Peta Bonham-Smith and Dr. Sawhney who
provided valuable input throughout the course of my research. I would also like to thank
Dr. Gray for agreeing to be the external examiner for my defence.
Janet Condie, Carla Barber, Karl Schrieber, Sarah Steinbach, and Devin Polichuk
were extremely helpful, both with assisting me with various techniques and interesting
conversation to pass the time.
Most importantly, I thank my parents, David and Lorraine Gibson, and the rest of
my family for financial support and putting up with my incessant ramblings regarding my
project. My girlfriend, Sharla Lozinsky, deserves special thanks, as she was always a
source of encouragement, love, support, and always believed in me.
iii

TABLE OF CONTENTS
PERMISSION TO USE..................................................................................................... i
ABSTRACT...................................................................................................................... ii
ACKNOWLEDGEMENTS.............................................................................................iii
TABLE OF CONTENTS................................................................................................. iv
LIST OF TABLES........................................................................................................... vi
LIST OF FIGURES ........................................................................................................vii
LIST OF ABBREVIATIONS.......................................................................................... ix
1. INTRODUCTION ..................................................................................................... 1
2. LITERATURE REVIEW ..........................................................................................3 2.1 General Overview .............................................................................................. 3 2.2 Plant Development and Phytohormones............................................................ 4
2.2.1 Auxin......................................................................................................6 2.2.2 Cytokinins ............................................................................................ 12 2.2.3 Abscisic Acid ....................................................................................... 16 2.2.4 Ethylene ............................................................................................... 18 2.2.5 Gibberellic Acid................................................................................... 19
2.3 Phytohormone Cross-talk................................................................................. 20 2.3.1 Auxin and Cytokinin............................................................................ 20 2.3.2 Auxin and Abscisic Acid ..................................................................... 23
2.4 Catecholamines ................................................................................................ 24 2.4.1 Catecholamines and Auxins................................................................. 25 2.4.2 Catecholamines and Cytokinins........................................................... 26 2.4.3 Catecholamine Interactions with Ethylene, Gibberellins, and Abscisic Acid ................................................................................ 27 2.4.4 Catecholamines and Flower Development .......................................... 27
3. MATERIALS AND METHODS............................................................................ 28
3.1 Plant Material and Growth............................................................................... 28 3.2 DNA and RNA Isolation.................................................................................. 30
3.2.1 Small Scale DNA Preparations............................................................ 31 3.2.2 RNA Sample Preparations ................................................................... 31 3.2.3 Quantification of DNA and RNA ........................................................ 31
3.3 Recombinant DNA Preparation ....................................................................... 32 3.3.1 PCR Amplification............................................................................... 34 3.3.2 Cloning of PCR Products..................................................................... 35
iv

3.4 Southern Blot Analysis .................................................................................... 35 3.5 Phytohormone Treatments and Expression Analysis ...................................... 37 3.6 Semi-Quantitative RT-PCR Analysis .............................................................. 38
3.6.1 Quantitation of Semi-Quantitative RT-PCR........................................ 39 3.6.2 Real-Time Quantitative RT-PCR Analysis.......................................... 39 3.6.3 Real-Time Quantitative RT-PCR Data Analysis ................................. 41
3.7 Senescence Bioassay........................................................................................ 44 3.8 Phenotypic Characterization ............................................................................ 44 3.9 Phytohormone Profiling................................................................................... 45
3.9.1 High Performance Liquid Chromatography Conditions...................... 46 3.9.2 Mass Spectrometry .............................................................................. 48
4. RESULTS ................................................................................................................ 51
4.1 Sequence Analysis of CIL1.............................................................................. 51 4.1.1 Catecholamine (CA) Binding Domain................................................. 52 4.1.2 Dopamine-β-Hydroxylase Similarities ................................................ 53
4.2 Analysis of CIL1 Copy Number ...................................................................... 55 4.3 Analysis of Organ Specificity of CIL1 Expression.......................................... 58 4.4 Effects of Phytohormone Treatments on CIL1 Expression ............................. 60 4.5 Copy Number Analysis of Selfed Antisense CIL1 Transgenic B. carinata Plants................................................................................................................ 64 4.6 Analysis of Senescence in Antisense CIL1 Transgenic B. carinata ................ 67 4.7 Phenotypic Characterization of Homozygous Antisense CIL1 Transgenic Plants................................................................................................................ 69 4.8 Real-Time Quantitative RT-PCR Analysis of Homozygous Antisense CIL1 Transgenic Plants ............................................................................................. 75
4.8.1 Test of Primer Efficiency..................................................................... 76 4.8.2 Analysis of Samples............................................................................. 76
4.9 Analysis of Phytohormones in Homozygous Antisense CIL1 Transgenic Plants………………………………………………………………………….80
4.9.1 Effect of the Antisense Transformation on the IAA:ZR Ratio ............ 87 5. DISCUSSION.......................................................................................................... 90
5.1 CIL1 Expression Analysis ............................................................................... 90 5.2 Catecholamine Binding Domain and Putative CIL1 Function ........................ 91 5.3 Possible Interactions of CIL1 with Phytohormones ........................................ 93 5.4 Phytohormone Profiling Error Sources and Problems..................................... 98 5.5 Possible Modes of Action of CAs/ CIL1 in Plants ........................................ 100 5.6 Comparison of Antisense CIL1 Plants to Plant Architecture Mutants .......... 101 5.7 Modulations of CIL1 Expression and Phytohormone Concentration in
Transgenic Plants ........................................................................................... 103 6. Conclusions............................................................................................................ 105 7. Future Directions ................................................................................................... 107 8. References.............................................................................................................. 109 9. Appendices............................................................................................................. 121
v

LIST OF TABLES
Table 3.1 List of primers used for PCR analysis ............................................................ 33
Table 3.2 Sample calculation of CIL1 expression using the ΔΔCT method ................... 43
Table 3.3 List of retention times and transitions of metabolites used for HPLC
and MS analysis of samples............................................................................ 49
Table 4.1 Ratio of IAA:ZR in non-transformed and transgenic antisense CIL1
Brassica carinata plants ................................................................................. 88
Table 9.1 Phytohormone values detected using HPLC-ESI MS/MS ....................127-130
Table 9.2 List of HPLC conditions ............................................................................... 131
vi

LIST OF FIGURES
2.1 Morphology of dicotyledonous plants ..................................................................... 4
3.1 Example of semi-quantitative RT-PCR data analysis............................................ 40
4.1 Nucleotide and deduced amino acid sequence of CIL1 cDNA.............................. 52
4.2 Alignment of Brassica carinata CIL1 sequence with possible catecholamine-
binding domain proteins ........................................................................................ 54
4.3 Phylogenetic tree of catecholamine binding proteins ............................................ 56
4.4 Southern blot of CIL1 gene arrangement in three Brassica species ...................... 57
4.5 Semi-quantitative RT-PCR analysis of CIL1 expression in untreated
non-transformed Brassica carinata ....................................................................... 59
4.6 Semi-quantitative RT-PCR analysis of CIL1 expression in non-transformed
plants after treatment with 1% Triton X-100......................................................... 61
4.7 CIL1 expression in non-transformed Brassica carinata after treatment with
racemic ABA .........................................................................................................63
4.8 Effects of phytohormone treatment on CIL1 expression in non-transformed
Brassica carinata ................................................................................................... 64
4.9 Southern blot of Brassica carinata T3 and T4 transgenic antisense
CIL1 copy number ................................................................................................. 66
4.10 Chlorophyll content in leaf discs of Brassica carinata non-transformed and
transgenic antisense CIL1 plants............................................................................ 68
4.11 Leaf surface area of non-transformed and transgenic antisense CIL1
Brassica carinata plants ........................................................................................ 70
vii

4.12 Comparison of lateral meristem development of non-transformed plants and
transgenic antisense CIL1 lines.............................................................................. 72
4.13 Transgenic antisense CIL1 line 6 demonstrating the “multiple leaf” phenotype... 73
4.14 Comparison of branching between non-transformed and transgenic antisense
CIL1 lines of Brassica carinata ............................................................................. 74
4.15 Leaf morphology and vasculature of non-transformed and transgenic antisense
Brassica carinata ................................................................................................... 75
4.16 Real-time quantitative RT-PCR primer efficiency ................................................ 78
4.17 Real-time quantitative RT-PCR analysis of CIL1 expression in transgenic
antisense CIL1 and non-transformed Brassica carinata........................................ 79
4.18 Indole-3-acetic acid present in organs of transgenic and non-transformed
Brassica carinata ................................................................................................... 81
4.19 Zeatin riboside present in organs of transgenic and non-transformed Brassica
carinata .................................................................................................................. 82
4.20 Abscisic acid present in organs of transgenic and non-transformed Brassica
carinata .................................................................................................................. 83
4.21 Dihydrophaseic acid present in organs of transgenic and non-transformed
Brassica carinata ................................................................................................... 84
9.1 Complete alignment of Brassica carinata CIL1 sequence with possible
catecholamine binding domain proteins .......................................................122-124
9.2 Typical Mass Spectra for IAA and DHZR ...................................................125-126
viii
LIST OF ABBREVIATIONS
α-NAA α-Napthaleneacetic Acid
2,4-D 2,4-Dichlorophenoxyacetic Acid
2iP 2-Isopentenyladenine
7’-OH-ABA 7’-Hydroxy-Abscisic Acid
ABA Abscisic Acid
ABA-GE Abscisic Acid-Glucose Ester
ARF Auxin Responsive Factor
ARE Auxin Response Element
BAP 6-Benzylaminopurine
BLAST Basic Local Alignment Search Tool
bp Base Pairs
CA Catecholamine
CB Cytochrome b561 Electron
Transport Domain
CID Collision Induced Dissociation
DA Dopamine
DoH Dopamine-β-Hydroxylase
DPA Dihydrophaseic Acid
DHZ Dihydrozeatin
DHZR Dihydrozeatin Riboside
dNTP Deoxynucleoside Triphosphate
E Epinephrine
ix

ESI-MS/MS Electrospray Ionization-Tandem Mass
Spectrometry
GA Gibberellic Acid
IAA Indole-3-Acetic Acid
IAAsp Indole-3-Aspartic Acid
IPA Isopentenyladenosine
LM Lateral Meristem
m/z Mass to charge ratio
MRM Multiple Reaction Monitoring
MS Mass Spectrometry
PA Phaseic Acid
PAT Polar Auxin Transport
PE Phenylethanolamine
PCR Polymerase Chain Reaction
qRT-PCR Real-Time Quantitative Reverse
Transcriptase-Polymerase Chain Reaction
RT Reverse Transcriptase
RAM Root Apical Meristem
SAM Shoot Apical Meristem
SDS Sodium Dodecyl Sulfate
SSC Sodium Chloride and Sodium Citrate
Tm Melting Temperature of PCR Primers
TAE Tris-Acetate-EDTA Buffer
x

Z Zeatin
ZOG Zeatin-O-Glucoside
ZR Zeatin Riboside
xi

1. INTRODUCTION
Brassica carinata, or Ethiopian mustard is an amphidiploid plant with the BB
genome derived from B. nigra and the CC genome from B. oleracea (Snowdon et al.,
1997). B. carinata has a number of traits that would make it useful as an oilseed crop for
the Canadian prairies including resistance to Leptosphaeria maculans, the causative agent
of blackleg disease, silique shattering resistance (Cohen and Knowles, 1983), high yield
(Ferreres et al., 1983), and high protein content in the seed (Rakow and Getinet, 1998).
B. carinata also has better tolerance to semi-arid conditions and drought stress compared
to B. napus (Alemayehu and Becker, 2001). Despite these positive attributes, B. carinata
is not appropriate for agricultural use at this time because of the high glucosinolate
(Alemayehu and Becker, 2001) and high linolenic acid (Alonso et al., 1991) content of
the seed and longer maturation time. Although, a B. carinata germplasm with low
linolenic acid and zero erucic acid was recently generated (Velasco et al., 2004), it still
takes 2-3 weeks longer to mature than B. napus resulting in underdeveloped seeds at the
time of harvest (Getinet et al., 1996). Therefore, transferring the genes involved in the
defense response of B. carinata to B. napus through marker-assisted breeding may be a
more viable approach for the generation of canola cultivars with greater disease
resistance (Marcroft et al., 2002).
The elucidation of the stress response pathways of B. carinata was the goal of a
previous project that led to the discovery of CIL1 (COPPER CHLORIDE INDUCED in
LEAVES) (Uchacz, 2000; Zheng et al., 2001). As the name implies, the cDNA
representing CIL1 was isolated from a library of clones derived from mRNA of copper
chloride treated B. carinata leaves. BLAST analysis of the CIL1 cDNA did not reveal
1
any similarity to genes of known function. To gain some insight into the function of
CIL1, a construct to express the gene in the antisense orientation was used to transform B.
carinata plants to reduce expression of the gene (Z. Zheng and T. Uchacz, unpublished).
Transformed plants displayed increased axillary branching during reproductive growth.
This observation led to the hypothesis that CIL1 influences hormone content, specifically
the auxin:cytokinin ratio in B. carinata. This study was undertaken to further
characterize CIL1 and compare the hormone content of homozygous antisense transgenic
plants to non-transformed plants.
2

2. LITERATURE REVIEW
2.1 General Overview
Organisms in the Kingdom Planta are ubiquitous throughout almost every
region of the planet, colonizing areas ranging from mountains to grasslands. Despite the
incredible diversity found in plants, they have a multitude of aspects common to their
growth and development. In dicotyledonous plants, after germination has occurred,
growth proceeds from the shoot apical meristem (SAM). In the SAM, new cells are
constantly being produced that subsequently differentiate to fulfill specific functions.
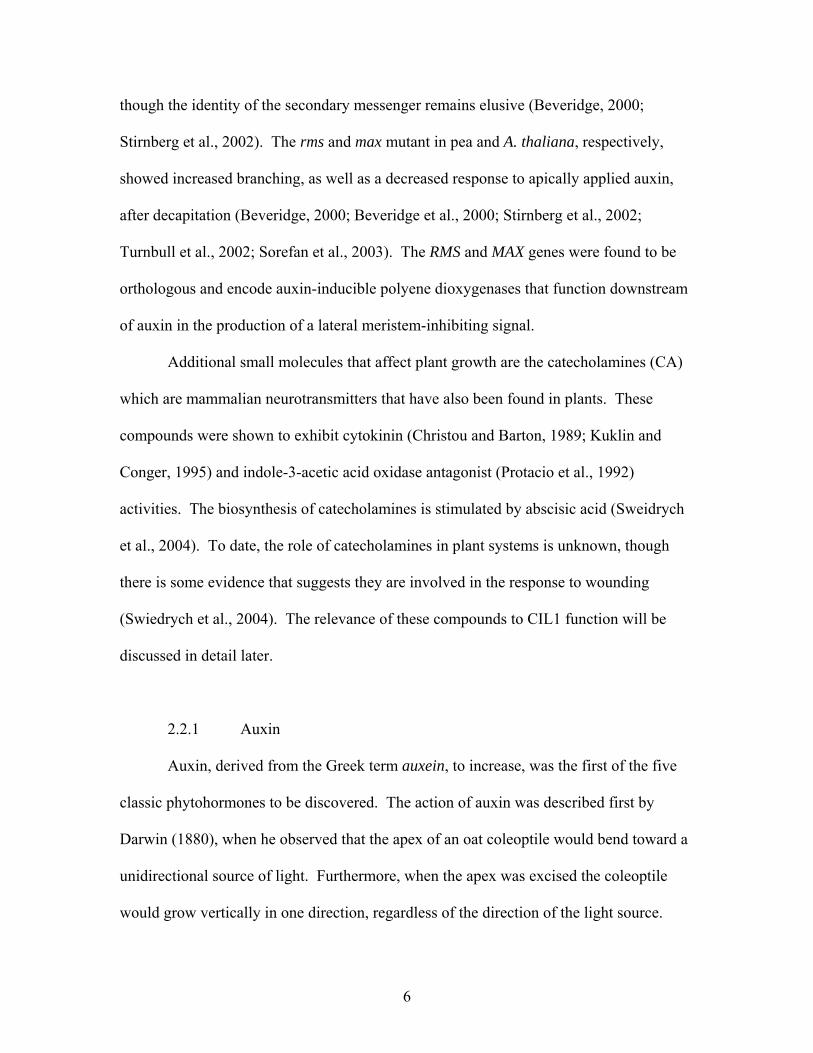
Generally, leaves are produced from the shoot apical meristem of plants (Figure
2.1). The number of leaves produced at a lateral meristem, in addition to the number of
nodes produced on a plant, is governed by both genetic and environmental controls. A
number of genes have been isolated that act as transcriptional regulators of lateral
meristem growth including LATERAL SUPPRESSOR (LS) (Williams, 1960) and BLIND
(BL) (Schmitz et al., 2002) from tomato, and REVOLUTA (REV) (Otsuga et al., 2001)
from Arabidopsis thaliana. A regulator of lateral organ size, ARGOS has also been
discovered (Hu et al., 2003). Additionally, a mutation, designated as supershoot (sps), in
a structural gene involved in cytokinin biosynthesis greatly enhanced the growth of
axillary branches during the reproductive stage of the life cycle of A. thaliana
(Tantikanjana et al., 2001).
3
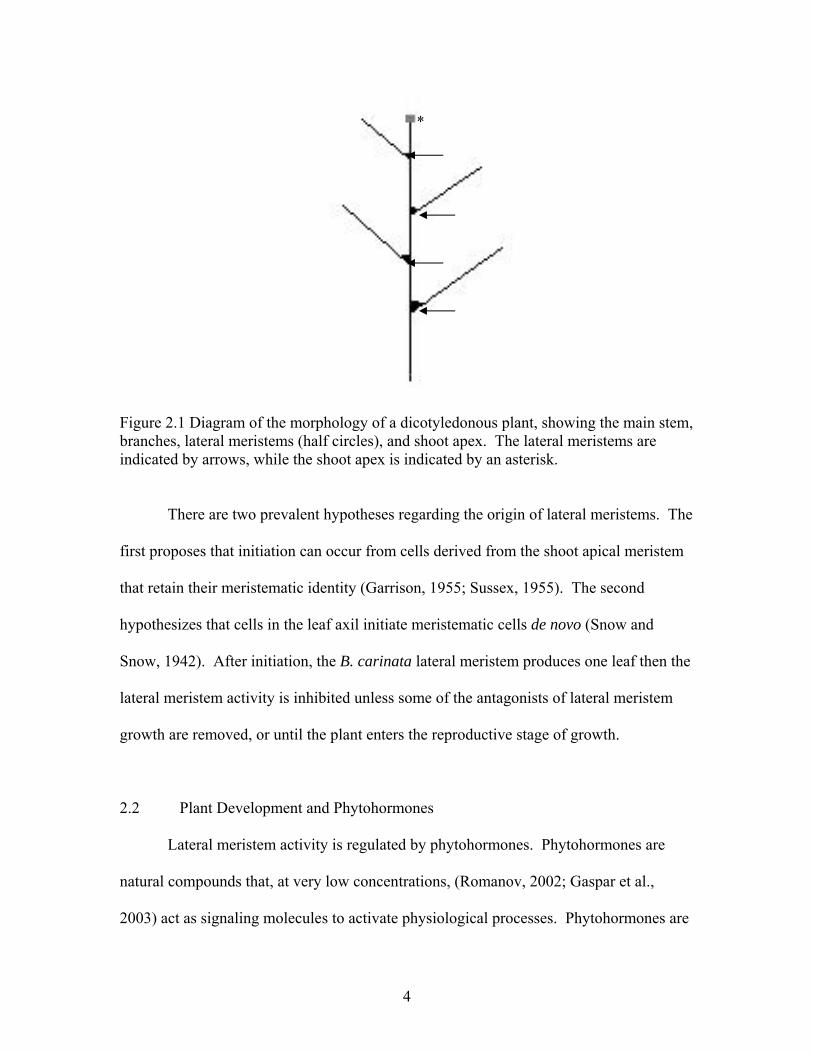
*
Figure 2.1 Diagram of the morphology of a dicotyledonous plant, showing the main stem, branches, lateral meristems (half circles), and shoot apex. The lateral meristems are indicated by arrows, while the shoot apex is indicated by an asterisk.
There are two prevalent hypotheses regarding the origin of lateral meristems. The
first proposes that initiation can occur from cells derived from the shoot apical meristem
that retain their meristematic identity (Garrison, 1955; Sussex, 1955). The second
hypothesizes that cells in the leaf axil initiate meristematic cells de novo (Snow and
Snow, 1942). After initiation, the B. carinata lateral meristem produces one leaf then the
lateral meristem activity is inhibited unless some of the antagonists of lateral meristem
growth are removed, or until the plant enters the reproductive stage of growth.
2.2 Plant Development and Phytohormones
Lateral meristem activity is regulated by phytohormones. Phytohormones are
natural compounds that, at very low concentrations, (Romanov, 2002; Gaspar et al.,
2003) act as signaling molecules to activate physiological processes. Phytohormones are
4

set apart from their mammalian counterparts for a number of reasons. Phytohormones
can be synthesized in any living cell in the plant, though there are generally specific
organs that synthesize the majority of a phytohormone (Gaspar et al., 2003), and
phytohormone activity can occur in the cell they are synthesized in, or after transport to a
target cell. Mammalian hormones, on the other hand, are synthesized in a specific organ,
usually endocrine glands, and travel through the blood to the target cell, which responds
to the hormone (Campbell et al., 1997).
Phytohormones are responsible for a wide range of phenomena that occur during
the growth, development, and reproduction of a vascular plant. Historically, there were
five classes of phytohormones: auxins, cytokinins, gibberellins, abscisic acid, and
ethylene (Taiz and Zeiger, 1998). Recent advances have lead to the identification of
several other signaling molecules present at low concentrations throughout the plant, such
as brassinosteroids, jasmonic acid, and salicylic acid (Taiz and Zeiger, 1998).
Lateral meristem activity can be both promoted and inhibited in the presence of
different phytohormones. Auxins inhibit the activity of the lateral meristem, however,
the inhibition decreases the farther a lateral meristem is from the shoot apex (Cline, 1996;
Leyser, 2002). Cytokinins, on the other hand, promote the growth of lateral meristems
(Taiz and Zeiger, 1998), and thus auxins and cytokinins act as antagonists during lateral
meristem development. Research has demonstrated that auxin does not directly affect the
growth of lateral meristems, and may act through a second messenger, possibly cytokinin
(Chatfield et al., 2000). However, this theory is tenuous, as cytokinin appears to
independently regulate lateral meristem growth (Chatfield et al., 2000). Genes likely
involved with perception or transduction of a secondary messenger have been isolated,
5
though the identity of the secondary messenger remains elusive (Beveridge, 2000;
Stirnberg et al., 2002). The rms and max mutant in pea and A. thaliana, respectively,
showed increased branching, as well as a decreased response to apically applied auxin,
after decapitation (Beveridge, 2000; Beveridge et al., 2000; Stirnberg et al., 2002;
Turnbull et al., 2002; Sorefan et al., 2003). The RMS and MAX genes were found to be
orthologous and encode auxin-inducible polyene dioxygenases that function downstream
of auxin in the production of a lateral meristem-inhibiting signal.
Additional small molecules that affect plant growth are the catecholamines (CA)
which are mammalian neurotransmitters that have also been found in plants. These
compounds were shown to exhibit cytokinin (Christou and Barton, 1989; Kuklin and
Conger, 1995) and indole-3-acetic acid oxidase antagonist (Protacio et al., 1992)
activities. The biosynthesis of catecholamines is stimulated by abscisic acid (Sweidrych
et al., 2004). To date, the role of catecholamines in plant systems is unknown, though
there is some evidence that suggests they are involved in the response to wounding
(Swiedrych et al., 2004). The relevance of these compounds to CIL1 function will be
discussed in detail later.
2.2.1 Auxin
Auxin, derived from the Greek term auxein, to increase, was the first of the five
classic phytohormones to be discovered. The action of auxin was described first by
Darwin (1880), when he observed that the apex of an oat coleoptile would bend toward a
unidirectional source of light. Furthermore, when the apex was excised the coleoptile
would grow vertically in one direction, regardless of the direction of the light source.
6
This coleoptile technique for detecting and observing curvature was perfected and refined
by other researchers, who demonstrated that the apex was responsible for sending a
chemical signal that directed growth, and that the signal would direct growth even in
complete darkness (Boysen-Jensen, 1913; Paal, 1919; Went, 1926).
The phytohormones auxin and cytokinin are different from the other
phytohormones in that they are an absolute requirement for viability (Taiz and Zeiger,
1998). To date, no mutants completely lacking either of these phytohormones have been
isolated.
The most recognizable role of auxin is the phenomenon of apical dominance.
Auxin synthesized in the apex of the plant is transported basipetally and acts on lateral
buds to inhibit their growth. It was demonstrated that when the SAM is removed, plants
begin to branch extensively. Auxin is also required for cell elongation, and has differing
effects depending on the organ in which it is present; it stimulates elongation in the shoot,
but inhibits it in the root (Taiz and Zeiger, 1998; Crozier et al., 2000). In addition to cell
elongation, auxin is also involved in photo- and gravitropism, the processes whereby a
plant grows toward light and gravity, respectively. Darwin demonstrated phototropism in
1880, while gravitropism was demonstrated later by Went (1926). Auxin also affects the
differentiation of vascular tissue and vascular patterning in leaves (Naderi et al., 1997;
Taiz and Zeiger, 1998). Recent research further suggests that auxin may be integral in
regulating embryogenesis and plant totipotency (Ribnicky et al., 2002).
The most abundant naturally occurring auxin in plants is indole-3-acetic acid
(IAA) (Bartel, 2001). IAA is synthesized by two main methods, tryptophan (Trp)-
dependent, which uses the amino acid as a precursor or Trp-independent biosynthesis,
7
which uses indole-3-glycerol phosphate as a precursor in an as yet unknown pathway to
IAA (Bartel, 2001; Coruzzi and Last, 2000; Crozier et al., 2000). The preferred method
of IAA biosynthesis in plants was found to depend on the ambient temperature. In
Lemna gibba at a temperature of 15 oC Trp-dependent IAA biosynthesis was favored,
while at a temperature of 30 oC Trp-independent biosynthesis was favored (Rapparini et
al., 2002). Further, Trp-dependent IAA biosynthesis occurs during periods of high auxin
demand such as seed germination, embryo growth, or the wounding response. A
sustained low amount of IAA is synthesized via the Trp-independent pathway during
vegetative growth (Normanly and Bartel, 1999; Bartel et al., 2001). Biosynthesis of IAA
in A. thaliana varies with the age of the plant, with the youngest organs having the
highest IAA synthetic capacity and the older organs that have ceased cell division having
the lowest capacity (Ljung et al., 2001). Although all parts of a young A. thaliana plant
can contribute to the auxin pool, the leaves that are less than 0.5 mm in length have the
highest synthetic capacity (Ljung et al., 2001).
After IAA is synthesized, it is transported throughout the plant by two methods:
polar auxin transport (PAT), and phloem transport (Friml and Palme, 2002). Phloem
transport is fast and non-directional. It is used to transport inactive auxin conjugates in
addition to physiologically active auxins (Nowacki and Bandurski, 1980). Conversely,
PAT is unidirectional, occurring in a cell-to-cell manner and is specific for active free
auxins moving in a basipetal or lateral direction from the auxin source (Friml and Palme,
2002; Friml, 2003). Auxin transport is important for flower development and proper
patterning of the vascular system in leaves (Naderi et al, 1997; Oka et al., 1999; Dengler
and Kang, 2001). Impeding PAT results in a wide range of phenotypic abnormalities.
8
These abnormalities range from flower aberrations, including petal fusion and reduction,
to whole plant effects, such as irregular shaped leaves with abaxial fusions to the adaxial
side, and development of additional cotyledons (Naderi et al., 1997; Oka et al., 1999;
Friml and Palme, 2002).
Metabolism of IAA occurs through catabolism or conjugation. Conjugated IAA
is a source of readily accessible IAA that can be used when required (Bialek and Cohen,
1989). In Lycopersicon esculentum, IAA is conjugated through the addition of a glucose
residue to the carboxyl group of the IAA side chain to form I-O- (indole-3-acetyl)-B-
glucose (Crozier et al., 2000; Tam et al., 2000). The glucose side chain can be removed
through the action of a β-glucosidase. Catabolism, which occurs through amino acid
intermediates, irreversibly inactivates IAA and as a result, decreases the total IAA pool
(Crozier et al., 2000). The rate of IAA turnover can be calculated through comparison of
the amount of IAA catabolites relative to IAA.
Despite its importance to plant growth and development, the mechanisms of auxin
response are only recently becoming elucidated through examination of the perception,
action, and outcome of auxin application. The full manner in which auxin is perceived is
still in question. However, both a membrane bound auxin binding protein (ABP1) and an
intracellular auxin uptake carrier (AUX1) have been discovered (Hertel et al., 1972;
Bennett et al., 1996). At this point, the purpose of multiple perception sites is not clear,
but the versatility and redundancy is advantageous should a mutation occur.
Auxin response factors (ARF) are transcription factors that bind to the auxin
response elements (ARE) present in the promoters of auxin-inducible genes (Ulmasov et
al., 1997a). Conversely, promoter binding is inhibited by ARF interaction with dimers of
9

the AUX/IAA protein (Ulmasov et al., 1997b; Guilfoyle et al., 1998; Liscum and Reed,
2002; Dharmasiri and Estelle, 2002). After auxin treatment or during periods of auxin-
induction, the ARF-AUX/IAA interaction is most likely disrupted through
phosphorylation of AUX/IAA (Dharmasiri and Estelle, 2002). Data suggest that auxin
regulates the degradation of AUX/IAA by AXR1 after dissociation from ARF (Leyser et
al., 1993; Zenser et al., 2001). AXR1 encodes a protein with similarity to an ubiquitin-
activating enzyme and multiple AXR genes are required for normal auxin function
(Berleth et al., 2004).
The molecular mechanisms for PAT are intricate and remain elusive. Carrier
proteins located in the plasma membrane facilitate the influx and efflux of auxin (Morris,
2000). A putative auxin influx carrier, AUX1, has been identified in A. thaliana. It has
similarity to a family of plant and fungal amino acid permeases, suggesting a transport
function (Bennett et al., 1996). The aux1 mutant was isolated in a screen for A. thaliana
plants with diminished root elongation (Maher and Martindale, 1980). The aux1 mutants
displayed a delayed response to inhibitory amounts of exogenously applied IAA
suggesting that uptake was affected (Evans et al., 1994). To examine this phenomenon in
greater detail, root growth in the mutants was measured after treatment with IAA, 2,4-
dichlorophenoxyacetic acid (2,4-D), and α-napthaleneacetic acid (α-NAA) (Yamamoto
and Yamamoto, 1998). Treatment with α-NAA rescued the agravitropic root growth of
aux1 plants because it, unlike IAA and the other auxin analogues, diffuses through the
plasma membrane (Marchant et al., 1999; Morris, 2000). Further examination of the
aux1 mutant revealed that it accumulated less than half the amount of 2,4-D as wild type
plants as opposed to accumulating the same amount of α-NAA (Marchant et al., 1999).
10

Since AUX1 is confined to the roots (Marchant et al., 1999; Swarup et al., 2001), other
auxin influx carriers must exist in the other parts of the plant, though none have been
isolated to date.
The auxin efflux carriers are much better understood than the influx carriers.
Auxin efflux research was facilitated by the discovery of auxin efflux inhibitors (Morris,
2000). Auxin efflux carriers are believed to be multi-component systems, consisting of
transport, catalytic, and regulatory domains (Morris, 2000). The first identified auxin
efflux carrier gene was AtPIN1 (A. thaliana PIN-FORMED) (Galweiler et al., 1998). In
pin1 mutants, PAT is perturbed in the inflorescences whose pinnate apices develop into
only a few, if any flowers. PIN1 was localized to the basipetal region of apical cells,
transporting auxin from leaves into the vascular bundle. Two other PIN genes were
found that function in different organs in A. thaliana. PIN2 was localized to meristematic
and elongating regions (Muller et al., 1998) while PIN3 was localized to the columella
initial cells of the root tip and on lateral membranes of endodermal cells in young stems
(Friml et al., 2002). Recent research showed that PIN protein location determines auxin
transport routes and that they are necessary for maintenance of the meristem zone in the
root (Blilou et al., 2005).
Recent discoveries are shedding light on how PIN proteins and PAT are regulated
in A. thaliana. It was found that PLT (PLETHORA) genes regulate the distribution of
PIN mRNA while PIN proteins inhibit the expression of PLT, thus demonstrating the
complexity of the interactions necessary for normal vascular patterning to occur.
Depending on the concentration of PID (PINOID), a protein kinase, the localization of
PIN switches at the intracellular level from basal to apical (Friml et al., 2004). Sub-
11
threshold amounts of PID result in basal localization of PIN while above-threshold
amounts result in apical deposition of PIN. This switching directs auxin transport from
cotyledons to either emerging primordia in the meristem or to the root for growth of the
root apical meristem (RAM) (Kaplinsky and Barton, 2004). The switching also directs
auxin from young leaves to emerging primordia or to the root, similar the cotyledons. In
the root, TINY ROOT HAIR 1 (TRH1) is a putative potassium carrier required for auxin
transport to root hairs (Vicente-Agullo et al., 2004). Plants with reduced TRH1 are
impaired in auxin efflux from the stele, resulting in an agravitropic phenotype (Vicente-
Agullo et al., 2004).
2.2.2 Cytokinins
A cytokinin, by definition, is a compound that induces cell division in plant tissue
cultures in the presence of optimal auxin concentration. The first compound isolated that
induced plant cytokinesis was derived from autoclaved herring sperm (Miller et al.,
1955). The compound was identified as 6-(furfuryl)aminopurine and named kinetin.
Kinetin promotes tobacco pith parenchyma differentiation in culture and stimulates
totipotent plant cell growth (Sieberer et al., 2003). However, kinetin is not found in plant
tissue and is likely the result of a rearrangement in heated DNA. The first naturally
occurring cytokinin, zeatin (Z), was isolated from coconut liquid endosperm. Zeatin
supports indefinite cell division in culture (Caplin and Steward, 1948). The first
synthetic cytokinin found to effect plant growth in a similar manner was 6-
benzylaminopurine (BAP), it is commonly used as a cytokinin in many studies
12

(http://www.chemicalland21.com/lifescience/agro/6-BENZYLAMINOPURINE.htm,
first accessed July 2005; Walker and Leonard, 1974; Rulcova and Pospilova, 2001).
Cytokinins, like auxins are essential for many plant developmental processes
(Taiz and Zeiger, 1998). These compounds enhance branching (Wang and Below, 1996),
delay senescence (Richmond, 1957), and promote chlorophyll biosynthesis (Kato et al.,
2002). To examine the effect of cytokinins on leaf senescence Richmond (1957)
incubated Xanthium pennsylvanicum leaves in a kinetin solution for 10 days and
compared their senescence to leaves incubated in water. He found that the kinetin-
incubated leaves remained green while the water-incubated leaves senesced. Further,
Gan and Amasino (1995) were able to delay senescence by transforming tobacco with a
senescence associated gene promoter (SAG12)::ISOPENTENYL TRANSFERASE
construct. The prolonged senescence was attributed to cytokinin biosynthesis occurring
after the induction of the SAG12 promoter by the senescence-signaling pathway. It was
shown that the cytokinin, zeatin-O-glucoside (ZOG), thought to be a storage form of Z,
promotes chlorophyll biosynthesis in the shoot of young Cucurbita maxima up to 100
times more effectively than either Z or zeatin riboside (ZR), (Kato et al., 2002).
Cytokinins also contribute to the growth and development of meristematic organs and
enhance shoot formation (Johnston and Jeffcoat, 1977; Wang and Below, 1996). In the
shoot, cytokinins act as positive regulators of SAM cell proliferation while acting as
negative regulators in the root apical meristem (Werner et al., 2003).
Cytokinins are synthesized de novo or via the tRNA pathway (Brzobohaty et al.,
1994; Crozier et al., 2000). The primary site of cytokinin biosynthesis is the root and the
majority of cytokinins are synthesized de novo using isoprene (dimethylallyl
13
diphosphate) and adenosine-5’-monophosphate as precursors (Taya et al., 1978; Chen
and Melitz, 1979; Crozier et al., 2000). The most physiologically active form of
cytokinin is zeatin. Zeatin riboside (ZR) is also physiologically active and is the form of
cytokinin that is transported from the roots to other regions of the plant (Taiz and Zeiger,
1998; Crozier et al., 2000). The intermediate forms of Z and ZR, isopentenyladenine
(2iP) and isopentenyladenosine (IPA), respectively, have limited cytokinin activity. The
two remaining naturally occurring cytokinins are dihydrozeatin (DHZ), and dihydrozeatin
riboside (DHZR). Both these compounds are less physiologically active than the other
cytokinins in most plants, except in some legumes, and are more difficult to metabolize
(Crozier et al., 2000).
Cytokinins are transported from the roots to the destination organs through the
xylem in the form of ZR (Nooden and Letham, 1993). At the destination organ,
hydrolysis of ZR yields Z that subsequently may be glycosylated to form zeatin-O-
glucoside (ZOG), a reversible form of Z (Taiz and Zeiger, 1998) that was thought to be
inactive.
Unlike auxin transport, very little is known about the mechanisms of cytokinin
transport. However, Burkle et al. (2003) discovered a family of purine transporters that
act as carriers of both adenine and cytokinins.
Similar to cytokinin transport our knowledge of the mechanisms of cytokinin
perception was, until recently, very limited. The situation began to change with the
discovery of the histidine kinase homolog CKI1 (CYTOKININ INDEPENDENT) in A.
thaliana (Kakimoto, 1996). Overexpression of CKI1 in A. thaliana induced cytokinin
responses, implying an interaction between CKI1 and cytokinins. CKI1 was proposed to
14
be a member of a two-component regulator. Two-component signal transduction
pathways sense a signal through a histidine kinase and react through a response regulator
(Hwang and Sheen, 2001). These two-component systems are present in both
prokaryotes and plants (Heyl and Schmulling, 2003). Subsequent attempts at detecting
cytokinin receptor activity from CKI1 were unsuccessful, so its role in cytokinin
perception remains unknown (Higuchi et al., 2004).
The first identified gene for a cytokinin receptor in A. thaliana was CRE1
(CYTOKININ RESPONSE 1), encoding a histidine kinase (Inoue et al., 2001). The cre1
mutants generated were insensitive to exogenously applied kinetin (Inoue et al., 2001).
Other groups also isolated this gene and designated it WOL (WOODEN LEG) and AHK4
(A. THALIANA HISTIDINE KINASE 4) (Mahonen et al., 2000; Ueguchi et al., 2001).
However, the function was not assessed until Inoue et al. (2001) discovered it as CRE1.
Two other histidine kinases, AHK2 and AHK3, have similarity to CRE1 (Inoue et al.,
2001; Higuchi et al., 2004). AHK2 and AHK3 function as cytokinin receptors in
different regions of the plant (Higuchi et al., 2004). Further, all three receptors have
overlapping roles in the regulation of shoot and root growth in A. thaliana (Nishimura et
al., 2004). A study examining the expression of CRE1, AHK2, and AHK3 in A. thaliana
revealed that CRE1 was highly expressed in the root, with lower expression in rosette
leaves, while AHK3 showed the opposite pattern (Higuchi et al., 2004). AHK2, however,
was expressed in both the roots and the rosette leaves at similar concentrations to AHK3
and CRE1, in the rosette leaves and roots, respectively. To assess the roles of the
receptors Higuchi et al. (2004) generated double and triple mutants. Callus cultures of
single mutants in ahk2 or ahk3 respond to exogenous cytokinin similar to wild type. The
15
cre1 callus cultures are smaller and have a reduced response to cytokinin compared to
wild type (Inoue et al., 2001; Ueguchi et al., 2001). Double and triple mutants of cre1,
ahk2, ahk3 showed further reduced responses, demonstrating the redundancy of the
cytokinin receptor genes (Higuchi et al., 2004). The triple mutants also displayed altered
root growth, suggesting that AHK3 and CRE1 are key regulators of adventitious root
growth in A. thaliana.
Soon after the discovery of the CRE1 gene in A. thaliana, additional components
of the cytokinin response pathway were found. Initial research by Brandstatter and
Kieber (1998) indicated that some ARR (A. THALIANA RESPONSE REGULATOR)
genes responded to cytokinin treatment. Later Sakai et al. (2000, 2001) discovered that
ARR1 and ARR2 act as transcriptional activators after cytokinin-receptor binding.
The model for cytokinin action begins with binding of the compound to a receptor
on the plasma membrane. This binding triggers phosphorylation of the receiver domain
of the receptor. Subsequently, histidine phosphotransfer proteins phosphorylate the
receiver domains of B-type ARR proteins and these transcription factors activate other
ARR gene expression (Heyl and Schmulling, 2003). The response is dependent on the
plant organ and developmental stage. For years, the pathway of cytokinin action was
unknown then the molecular mechanisms of cytokinin signaling went from being poorly
understood to one of the best-elucidated pathways in a very short time.
2.2.3 Abscisic Acid
Two groups simultaneously discovered the compound now known as abscisic acid
(ABA) in 1963. One group named the molecule “abscisin II” (Ohkuma et al., 1963) for
16
its putative role in leaf abscission, later disproved, and the other group named the
molecule “dormin” (Eagles et al., 1964) for its role in bud dormancy. Subsequently, the
name “abscisic acid” was given to this phytohormone, despite the fact that ABA has no
role in leaf abscission (Addicott et al., 1968). ABA has roles in dormancy, freezing
tolerance, drought tolerance, and water flux in the roots. Unlike auxins and cytokinins,
abscisic acid is not an absolute requirement for plant growth and development
(Koornneef et al., 1998). However, the loss of ABA sensitivity results in phenotypic
aberrations.
One of the most well characterised roles of ABA is negative regulation of
stomatal opening during periods of low water potential. Water flux in plants is perceived
in the roots (Mantyla et al., 1995; Taiz and Zeiger, 1998). Specifically, the interruption
in water uptake is sensed in lateral roots and root hairs and induces ABA transport
through the xylem to the photosynthetically active leaves (Hetherington, 2001; Schroeder
et al., 2001). The ABA concentration in the xylem sap increases from approximately 1-
15 nM to 3 μM (Schurr et al., 1992) in Helianthus annulus plants when water uptake is
interrupted. In leaves, ABA enters the guard cells and triggers a series of signal cascades
that lead to loss of turgor pressure and stomata closure (Schroeder et al., 2001).
Seed dormancy and desiccation tolerance are also influenced by ABA.
Determination of the ABA content in seeds from a dormant ecotype of A. thaliana, Cape
Verde Islands, demonstrated that ABA content was highest in dormant seeds and
subsequently decreased under seed-breaking conditions finally reaching a concentration
similar to non-dormant seeds (Ali-Rachedi et al., 2004).
17

2.2.4 Ethylene
Neljubow (1901) discovered that ethylene was the active ingredient of coal gas
that caused defoliation of plants. Later, Cousins (1910) found that plants themselves
produced ethylene. Ethylene has roles in fruit ripening, anaerobic stress response, leaf
and flower abscission, flower senescence, and the breaking of seed dormancy in cereals
(Doubt, 1917; Chang et al., 1993; Taiz and Zeiger, 1998 Vogel et al., 1998).
Ethylene, unlike all other plant hormones, is a gas under physiological conditions
(Chang et al., 1993; Rodrigues-Pousada et al., 1999) and has a simple structure. Plants
grown in darkness or in the presence of ethylene and light combined exhibit the “triple
response”. The triple response consists of diageotropism, inhibition of epicotyl
elongation, and lateral enlargement of the epicotyl (Vogel et al., 1998; Bleecker, 1999;
Crozier et al., 2000; Johri and Mitra, 2001). The triple response is a classical way of
examining the sensitivity of plants to ethylene. The more attenuated the response, the
less sensitive a plant is to ethylene. Complete attenuation of the triple response results in
seedlings that resemble light grown seedlings, as is seen in the etr1-1 (ethylene-resistant
1) mutant of A. thaliana (Chang et al., 1993). The gene was later found to encode an
ethylene receptor functioning at the very onset of ethylene signaling (Chang et al., 1993;
Bleecker, 1999).
Ethylene is synthesized from S-adenosyl-L-methionine through the intermediate
1-aminocylopropane-1-carboxylic acid (ACC). The initial reaction is catalyzed by ACC
synthase with subsequent conversion to ethylene through the action of ACC oxidase
(Crozier et al., 2000). Transgenic tomato plants expressing an antisense ACC oxidase
construct produced fruit that made only 5% of the amount of ethylene made by fruit from
18
non-transformed plants. As a result, the fruit ripened but did not over ripen
demonstrating the impact of ethylene (Crozier et al., 2000). Ethylene-insensitive plants,
on the other hand, produce fruit that never ripen because the ethylene sensing mechanism
is impaired.
2.2.5 Gibberellic Acid
Gibberellic acid (GA) was initially isolated from a culture of the fungal pathogen
of rice Gibberella fujikoroi (Yabuta and Sumiki, 1938). The first publications on isolation
of GA-like compounds from higher plants did not appear until the 1950’s (Mitchell et al.,
1951; Radley, 1956). Rice plants infected with G. fujikoroi grow very tall suggesting that
GAs stimulate plant growth. Thus the most notable action of GA on plant growth and
development is in stem elongation, however, GAs also influence a variety of other
developmental processes such as seed germination, floral initiation and sex determination
(Langridge, 1957; Taiz and Zeiger, 1997; Richards et al., 2001).
Gibberellins differ from other phytohormones in that there are over 100 identified
forms, although only a few are biologically active (Richards et al., 2001). The
biosynthesis of GA is very complex, involving a large number of intermediate forms
leading to the most commonly found biologically active form, GA3 (Phillips, 1998).
The role of GA in plant development has been investigated in a number of plants
including barley, rice, pea, and A. thaliana (Richards et al., 2001). In A. thaliana, a long-
day plant, it was found that two gibberellin mutants, gai (gibberellic acid insensitive),
and ga1-3, showed altered reproductive development (Koornneef and van der Veen,
1980; Wilson et al., 1992). The ga1-3 mutant never flowered under short-day conditions,
19

while the gai mutant flowered 20 days later than wild type A. thaliana Landsberg erecta.
Although the ga1-3 mutants never flowered in short-day conditions, with continual light
they flowered 11 days later than wild type A. thaliana. After treatment with GAs, in
continual light the ga1-3 mutants flowered at a time comparable to the wild type A.
thaliana, demonstrating that GA is required for the transition from vegetative to
reproductive growth in long-day plants. This result suggested that an additional
mechanism is involved in the transition from vegetative to reproductive growth.
2.3 Phytohormone Cross-Talk
Normal plant growth and development requires phytohormones to interact to
regulate the various processes. This interaction is termed “cross-talk”.
2.3.1 Auxin and Cytokinin
Skoog and Miller (1957) were the first to discover cross-talk when they observed
that the ratio of auxin:cytokinin influenced organogenesis in plant tissue culture. An
equal amount of auxin and cytokinin induced callus growth, while a higher
auxin:cytokinin ratio induced root growth, and a lower auxin:cytokinin ratio stimulated
shoot growth. Another plant response governed by the interaction of auxin and cytokinin
is gravitropism. Prior to a graviresponse, cytokinins accumulate within stratocytes,
resulting in decreased root elongation, while auxins, transported to the lateral roots by
PIN3, stimulate root elongation (Friml et al., 2002; Aloni et al., 2004). The antagonism
of the auxins and cytokinins in the roots results in differential growth. This differential
growth rate produces root curvature. These data indicated that auxins and cytokinins
20
were antagonists. Further evidence of auxin to cytokinin antagonism is seen in leaf
primordia in A. thaliana. Auxin-induced repression of KNOX (KNOTTED1-LIKE
HOMEOBOX) expression in leaf primordia is necessary for correct leaf initial growth
(Scanlon, 2003). The KNOX proteins may induce cytokinin biosynthesis (Ori et al.,
1999; Hay et al., 2004).
Auxin to cytokinin antagonism includes each hormone’s effects on the
concentration of the other (Palni et al., 1988; Nordstrom et al., 2004). Although Palni et
al. (1988) found that treating plants with α-NAA increased oxidative metabolism of ZR,
it was eventually shown that cytokinins and auxins regulate each other by decreasing the
rate of biosynthesis and transport rather than catabolism (Bangerth, 1994; Eklof et al.,
1997). However, conversion of the active cytokinins, zeatin (Z) and zeatin riboside (ZR)
in most plants to the inactive N-glycosylated forms is increased in the presence of auxin
(Blagoeva et al., 2004).
The relationship between auxin content and cytokinin biosynthesis was examined
in greater detail in A. thaliana plants treated with α-NAA. In a dose dependant manner,
the treatment caused a decrease in the amount of both ZR and its precursor by acting on
the isopentenyladenosine-5’-monophosphate independent pathway (Nordstrom et al.,
2004). Auxin perception by the AXR gene family mediates this effect on cytokinin
biosynthesis.
Unlike the fast reduction in cytokinin amounts seen after auxin treatment
(Bangerth, 1994), cytokinin repression of auxin occurs over a much longer period,
requiring up to 48 h (Nordstrom et al., 2004). These authors concluded that cytokinins
indirectly influence auxin content. Bangerth (1994) proposed that auxin to cytokinin
21
cross-talk was a two-sided feedback loop involving auxin transport from the SAM and
cytokinin transport from the root. Subsequent research by Bangerth (2000) and others
(Eklof et al. 1997; Haver et al., 2003) indicated that feedback inhibition of auxin and
cytokinin biosynthesis in the presence of high concentrations of the antagonist
phytohormone was due to a decrease of IAA biosynthesis in the shoot apex and cytokinin
biosynthesis in the root.
Auxin and cytokinin do not always act as antagonists. In very young organs, they
are thought to interact synergistically to control progression of the cell cycle. One of the
earliest studies on the roles of auxin and cytokinin in the cell cycle examined the effect of
the hormones on p34cdc2-like proteins; protein kinases activated when a cell is committed
to division (Choi et al., 1991). In tobacco pith, auxin induces biosynthesis of a p34cdc2-
like protein and cytokinin is required for activation of the protein (John et al., 1993). In
alfalfa leaf protoplast-derived cells, the absence of cytokinin completely abolished
cdc2MsA/B activity, preventing cell cycle progression from the G0-G1 phase to S phase
and from the G2 phase to mitosis. Further, in the absence of auxin, cyclin dependent
kinases could not be isolated from the cells (Pasternak et al., 2000). Sieberer et al. (2003)
obtained additional evidence for the interaction of auxin and cytokinin in cell cycle
control. The prz1-1 (proporz) mutant was isolated from a screen for seedlings showing
defective growth on auxin and cytokinin from a T-DNA-mutagenized population of A.
thaliana. When prz1-1 plants were grown in the presence of auxin and cytokinin
uncontrolled cell proliferation increased dramatically. PRZ1 appears to be a gene
involved in the switch from cell proliferation to cell differentiation. It is a putative
22

transcriptional adaptor protein involved in the transcription of a cell cycle control protein
(Sieberer et al., 2003).
Auxin and cytokinin also act synergistically to regulate cell differentiation. The
highest concentrations of auxin and cytokinins are seen in young leaves (Nordstrom et
al., 2004). The SAM was also found to contain high amounts of auxins and cytokinins,
both of which were necessary for SAM cell division (Werner et al., 2001). Cytokinin
rapidly induces expression of the A. thaliana response regulator ARR4 (Yamada et al.,
1998). In turn, ARR4 interacts with AtDBP1, a DNA binding protein (Alliotte et al.,
1988). The interaction between ARR4 and AtDBP1 is induced by exogenous auxin, as
part of an indirect, long-term auxin response (Yamada et al., 1998). This auxin- and
cytokinin-inducible interaction and activation is required for phosphorelay activity in the
cytokinin-responsive signaling pathway.
2.3.2 Auxin and Abscisic Acid
Cross-talk between auxin and ABA has not been studied as extensively as auxin
and cytokinin cross-talk. In 1990, Wilson et al. discovered that A. thaliana axr2 mutant
plants were resistant to auxin, ethylene and ABA, thus indicating an interaction among
these phytohormones. Additionally, drought induced rhizogenesis, the formation of
lateral roots that are short, tuberous, and lacking root hairs (Vartanian, 1981), was
decreased in both ABA insensitive mutants and in the auxin mutant axr1-3 (Vartanian et
al., 1994). A recent study examining the effect of drought on cross-talk between auxin
and ABA in two auxin mutants, axr1-3 and axr2-1, found that both of the mutants
23
displayed decreased ABA signaling (Bianchi et al., 2002). All these results suggest an
overlap in auxin and ABA signal perception.
The molecular mechanisms that mediate auxin and ABA signaling remain largely
unknown. Research at the molecular level has shown that abscisic acid and auxin have
antagonistic interactions. Auxin was shown to enhance the telomerase activity in
synchronized tobacco cells (Tamura et al., 1999). ABA treatment, however, abolished
the positive effect on telomerase activity induced by auxin and inhibited telomerase
activity in untreated cells (Yang et al., 2002). Further, ABA was shown to increase
transcription of ICK1 (INHIBITORs/INTERACTORs OF CDK), a cyclin-dependent
protein kinase inhibitor, suggesting that ABA can inhibit cell cycle progression (Wang et
al., 1997; Wang et al., 1998).
2.4 Catecholamines
Catecholamines (CAs) are a group of compounds characterized by a 3,4-
dihydroxysubstituted phenyl ring (Szopa et al., 2001). In mammalian systems, the CAs
dopamine (DA), epinephrine (E), and norepinephrine (NE) function as neurotransmitters
(Kuklin and Conger, 1995). These compounds plus their precursor tyramine are also
present in 44 plant families, including some plants grown commonly for human
consumption, such as potato, bean, and tobacco (Smith, 1977). Little is known about the
function of CAs in plants. They were found to induce an oxidative burst with a
subsequent increase in cytosolic Ca2+ as is commonly seen in the biotic and abiotic stress
response (Kawano et al., 2000). Addition of CAs to cell cultures produces varied
responses giving rise to speculation that they are involved with the regulation of
24

phytohormone activity (Christou and Barton, 1989), the biosynthesis of certain
phytohormones (Elstner et al., 1976), or the regulation of phytohormone catabolism
(Protacio et al., 1992).
2.4.1 Catecholamines and Auxins
Auxin, in the form of 2,4-D, was found to stimulate the biosynthesis of DA in cell
suspension cultures. The addition of 2,4-D to cultures also suppressed cell growth and
the accumulation of 3,4-dihydroxyphenyl-L-alanine (L-DOPA), a catecholic amino acid
(Wichers et al., 1993). It was hypothesized that the L-DOPA is decarboxylated to
dopamine after the addition of 2,4-D at high concentrations and that these catecholic
compounds are incorporated into tetrahydroisoquinolines by various plant species to be
used as insect or herbivore deterrents.
Protacio et al. (1992) discovered that DA inhibited IAA oxidase activity. Further,
DA inhibition of IAA oxidase activity required the presence of IAA, no effect was seen
when 2,4-D was used. However, the structure of the CA required for this effect is
apparently not as restrictive as the auxin. Lee et al. (1982) observed 99% inhibition of
IAA oxidase activity in the presence of a diphenol similar in structure to DA.
Additionally, synthetic dihydroxyphenols inhibited IAA oxidase and peroxidase activities
(Beffa et al., 1990). These studies provide the first evidence of a specific function for
CAs in plants and support the idea that IAA and CAs interact synergistically.
25

2.4.2 Catecholamines and Cytokinins
In much the same manner as auxin and CK are antagonists so are CAs and CKs.
Cytokinin activity was repressed in the presence of the CA phenylethylamine (PE)
(Christou and Barton, 1989). Repression of CK activity was also observed within min of
callus exposure to octopamine, a precursor to E, NE, and PE (Christou and Barton, 1989).
2.4.3 Catecholamine and Ethylene, Gibberellins, and Abscisic Acid
Little published information is available regarding the effect of CA on ethylene,
GAs, and ABA. DA, NE, and E all stimulated ethylene biosynthesis in potato cell
suspension cultures (Dai et al., 1993). Additionally, endogenous 1-aminocyclopropane-
1-carboxylic acid (ACC) biosynthesis was increased suggesting that ACC synthase
activity was stimulated by addition of CA. DA application was also shown to stimulate
the production of superoxide, which is thought to be a precursor to ethylene (Elstner et
al., 1976).
ABA activates the initial steps of CA biosynthesis in potato tubers (Swiedrych et
al., 2004) through the increase in activity of three CA biosynthetic enzymes. The authors
propose that CA and ABA may be involved in biotic and abiotic stress responses and
regulation of starch-sucrose conversion in plants.
As for GA and CA interaction, CA enhanced the GA effect on hypocotyl
elongation in lettuce seedlings. The CA effect resembled that of the similarly structured
dihydroconiferyl alcohol, acting as a synergist in GA-induced hypocotyl elongation
(Kamisaka et al., 1979).
26
2.4.4 Catecholamines and Flower Development
In addition to its influence on phytohormone activity, data suggests that CAs are
also involved in the induction of flowering in plants. Catecholamines likely have a role
in controlling cyclic AMP (cAMP) amount in long-day duckweed, Lemna gibba G3
(Oota, 1974). Oota (1974) concluded that flowering in L. gibba G3 was dependent on the
amount of cAMP and hypothesized that, similar to the mammalian system, CA regulated
cAMP (Oota and Kondo, 1974). Further research conducted on Lemna paucicostata
demonstrated that treatment with CA prior to flowering resulted in a greater number,
longer-lived and faster developing flowers (Khurana et al., 1987). Further, a flower-
inducing factor (FIF) was recently discovered in L. paucicostata that strongly induced
flowering when combined with NE or DA (Yamaguchi et al., 2001). Similar to the
FIF/CA system observed in L. paucicostata, FIF was identified in the short-day violet,
Pharbitis nil. When CA was applied to the cotyledons under a short-day photoperiod, an
increase in FIF production was detected in the cotyledons, but not in other organs (Suzuki
et al., 2003). The regulation of flowering by CA was also examined using CA inhibitors
in P. nil. Application of CA biosynthesis inhibitors suppressed flowering if application
commenced prior to or during a period of darkness, but had no effect if applied after a
dark period (Ueno and Shinozaki, 1999). Previous studies showed that E and NE are
only accumulated in the dark (Endress et al., 1984), implying that dark treatment
combined with catecholamines have a role in the regulation of flowering.
27
3. MATERIALS AND METHODS
3.1 Plant Material and Growth
The B. carinata breeding cultivar C90-1163 from Agriculture and Agri-Food
Canada Research Station (Saskatoon, Saskatchewan, Canada) was used as the non-
transformed and transformation recipient plant material. Z. Zheng (PBI/NRC) and T.
Uchacz (University of Saskatchewan) produced the antisense CIL1 transgenic plants.
Antisense expression was driven by the cauliflower mosaic virus duplicated-enhancer
35S-promoter (Kay et al., 1987) and leader sequence from alfalfa mosaic virus RNA4
(Datla et al., 1993). This construct was cloned into the plant binary vector RD400 (Datla,
et al., 1992) and was used to transform B. carinata, according to Babic et al. (1988).
Transgenic antisense lines 2, 3, 5, 6, 10, and 13 were used for experiments involving
transgenic plants. “Non-transformed” refers to a wild type Brassica carinata control for
the experiments involving the transgenic plants. The B. oleracea CrGc 3-1 rapid cycling
wild type cultivar from the Transgenic Plant Centre of the National Research Council
(Saskatoon, Saskatchewan, Canada), and B. nigra wild type cultivar from Agriculture and
Agri-Food Canada Research Station (Saskatoon, Saskatchewan, Canada) were also
utilized in this study.
Seeds were sown at a density of approximately 2 seeds/cm2 in Terra-Lite Redi-
Earth fortified with Nutricote 14-14-14 fertiliser (Chisso-Asahi, Nagasaki, Japan) and
grown in a Conviron PGV36 growth chamber with 50 % relative humidity. The
temperature and photoperiod in day/night were 21/17 oC and 16/8 h, respectively with a
light intensity of 216 μmol m-2 s-1 provided by Sylvania 40 W extended service
incandescent bulbs and Sylvania 215 W cool white fluorescent bulbs.
28

For experiments involving A. thaliana, three lines were used in this study: wild-
type Columbia, and the supershoot mutant (obtained from Dr. Sundaresan, Institute of
Molecular Agrobiology, The National University of Singapore, Singapore). For all lines,
seeds were sown at a density of 3 seeds/cm2 in Terra-Lite Redi-Earth and grown in a
Conviron C1010 growth chamber with a 16 h photoperiod, a light intensity of 102 μmol
m-2 s-1 and a constant temperature of 21oC. After germination, plants were thinned to 4
plants per pot, and grown until the plants senesced.
Prior to plating on selection media, transgenic B. carinata seeds were surface
sterilized in 10% (v/v) bleach for 30 min, and washed twice in deionized water for 5 min
each. After surface sterilization, transgenic seeds were imbibed in a solution of ½
Murashige & Skoog medium (MS, Gibco, Carlsbad, CA, USA), 1% (w/v) sucrose,
containing 50 mg/L kanamycin for 9 h, then transferred to plates containing ½ MS
(Gibco, Carlsbad, CA, USA), 1% (w/v) sucrose, 0.7% (w/v) Phytagar (Gibco, Carlsbad,
CA, USA) with 75 mg/L kanamycin. The plates were sealed with parafilm and placed in
a Conviron C1114 growth chamber, with a photoperiod of 16/8 h of day/night at a
constant temperature of 24 oC and a light intensity of 120 μmol m-2 s-1 during the day.
After approximately two weeks of growth, the first true leaf of the seedling emerged, and
the seedlings were transferred to soil in 15.3 cm diameter pots at approximately 4
seedlings per pot.
Seeds used to propagate transgenic lines by self-fertilisation were sown in 15.3
cm diameter pots at a density of approximately 1 seed/cm2. The plants were thinned to 2-
4 plants/pot prior to bolting, and after bolting had occurred, the plants were transferred to
21 cm diameter pots. Prior to floret opening, 22.8 x 76.2 cm bags were placed on each
29

individual plant to prevent cross-pollination with other plants. Seeds were harvested after
the plants senesced. Plants used for organ samples and time course experiments were
generally sown at approximately 2 seeds/cm2 in 15.3 cm diameter pots.
3.2 DNA and RNA Isolation
3.2.1 Small Scale DNA Preparations
Genomic DNA was isolated according to Dellaporta (1983) with slight
modifications. Approximately 200 mg fresh weight of leaf tissue was frozen in liquid N2
in a 1.5 mL microcentrifuge tube and ground with a pestle to a fine powder. The powder
was then homogenized in 500 μL extraction buffer (100 mM Tris-HCl pH 8.5, 50 mM
EDTA, 500 mM NaCl, 10 mM β-mercaptoethanol). Subsequently, 35 μL of 20 % (w/v)
SDS was added, the tube was inverted four times and incubated at 65 oC for 5 min, 160
μL of 5 M potassium acetate was added and the sample was mixed by inverting. The
sample was incubated on ice for 10 min, followed by centrifugation at 4 οC in a
microcentrifuge at 13,000 rpm. After centrifugation, the supernatant was transferred to a
clean 1.5 mL microcentrifuge tube and 100 μL of 3 M sodium acetate was added. The
DNA was precipitated with isopropyl alcohol, recovered by centrifugation and then
dissolved in TNE buffer (50 mM Tris-HCL pH 7.5, 140 mM NaCl, 5 mM EDTA). The
samples were treated with 15 μg RNAse A at 37 oC for 10 min. The reactions were
extracted with phenol/chloroform, pH 8.0, and the DNA was precipitated with isopropyl
alcohol. The DNA was recovered by centrifugation and washed once with 70% (v/v)
ethanol. After drying, the DNA was dissolved in sterile deionized H2O and stored at –20
oC.
30

3.2.2 RNA Sample Preparations
RNA isolation was done using Trizol (Invitrogen, Carlsbad, CA, USA) following
the manufacturer’s directions. The extractions were performed on 200 mg fresh weight
of plant material. The material was frozen in liquid N2 and ground with a pestle to a fine
powder before extraction. The RNA was dissolved in DEPC-treated H2O and stored at –
80 oC.
3.2.3 Quantification of DNA and RNA
Quantification of RNA and DNA was achieved using a GeneQuant RNA/DNA
Calculator spectrophotometric unit (Pfizer Inc., New York, NY, USA). Absorbances
were measured at 320, 280, 260 and 230 nm wavelengths.
3.3 Recombinant DNA Preparation
Primers used for polymerase chain reaction (PCR), semi-quantitative reverse
transcriptase polymerase chain reaction (RT-PCR), and real time quantitative reverse
transcriptase polymerase chain reaction (qRT-PCR) were designed using Primer Design
version 1.0 software (Scientific and Educational Software, 1990). The criteria for primer
design in the software was set to examine the CIL1 sequence for primers between 17 and
20 bp in length with a GC content between 40 and 50 %. The primers were also specified
to have a Tm between 50 and 65 oC. Primers containing runs of bases, secondary
structure, or primer interactions involving the 3’ end were discarded. Primer sequences
were checked using NetPrimer
31
(http://www.premierbiosoft.com/netprimer/netprlaunch/netprlaunch.html, first accessed
October, 2002). Prior to ordering, primer sequences were checked by BLASTN queries
to determine if there were any similarities to other plant genes. The DNA Technologies
unit at the National Research Council Plant Biotechnology Institute, Saskatoon,
Saskatchewan, Canada synthesized all the primers. The primers used for PCR are given
in Table 3.1.
3.3.1 PCR Amplification
The reactions for amplification of CIL1 products contained 5 pmol each forward
and reverse primer, 2 mM MgCl2, 1 X FastStart High Fidelity Reaction Buffer (Roche
Diagnostics Canada, Laval, Quebec, Canada) 0.20 mM each deoxyribonucelotide, 2.5 U
of Expand High Fidelity Enzyme Mix (Roche Diagnostics Canada, Laval, Quebec,
Canada), containing a mixture of Taq polymerase and Tgo polymerase which possesses
3’-5’ exonuclease activity, and 250 ng of genomic DNA. The reaction conditions
consisted of an initial denaturation at 94˚ C for 30 s, subsequently 35 cycles of 94˚ C for
30 s, 61˚ C for 1 min and 72˚ C for 2 min were performed. A final extension of 72˚ C for
1 min was followed by an indefinite hold at 4˚ C. The resultant fragment was
approximately 1030 bp in size, confirmed by sequencing.
32
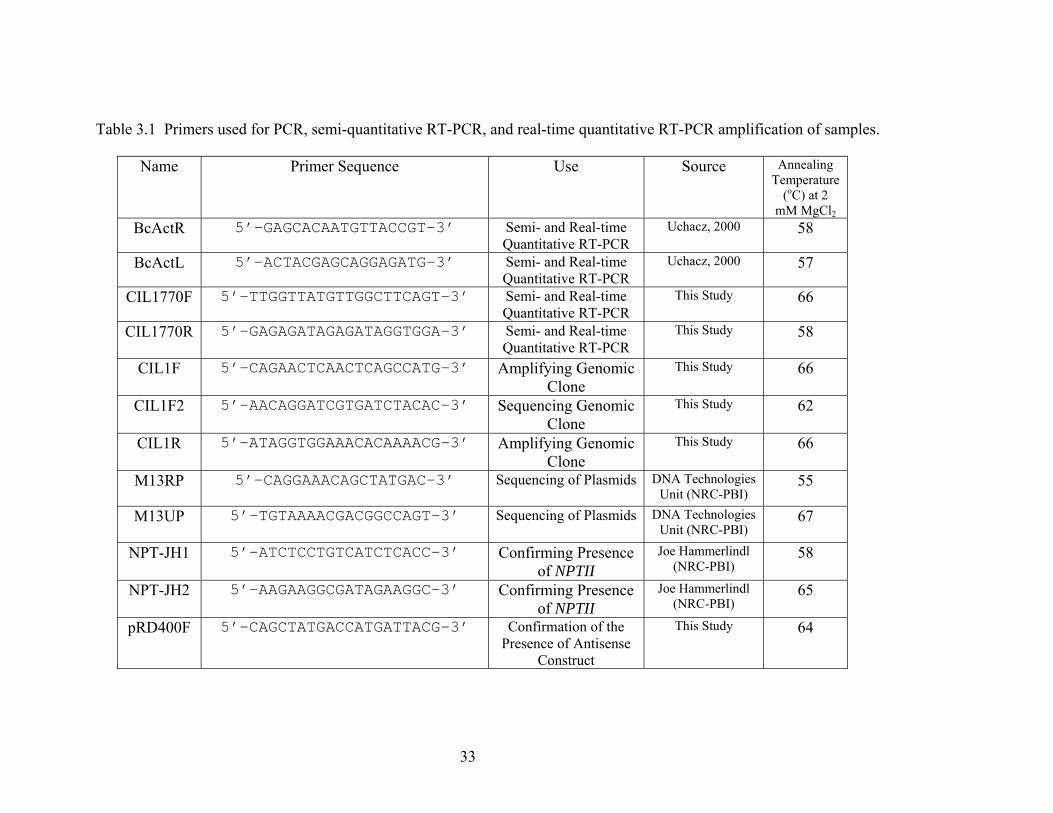
Table 3.1 Primers used for PCR, semi-quantitative RT-PCR, and real-time quantitative RT-PCR amplification of samples.
Name Primer Sequence Use Source Annealing Temperature
(oC) at 2 mM MgCl2
5’-GAGCACAATGTTACCGT-3’ BcActR 58 Semi- and Real-time Quantitative RT-PCR
Uchacz, 2000
5’-ACTACGAGCAGGAGATG-3’ BcActL 57 Semi- and Real-time Quantitative RT-PCR
Uchacz, 2000
5’-TTGGTTATGTTGGCTTCAGT-3’ CIL1770F 66 Semi- and Real-time Quantitative RT-PCR
This Study
5’-GAGAGATAGAGATAGGTGGA-3’ CIL1770R 58 Semi- and Real-time Quantitative RT-PCR
This Study
5’-CAGAACTCAACTCAGCCATG-3’ CIL1F Amplifying Genomic Clone
66 This Study
5’-AACAGGATCGTGATCTACAC-3’ CIL1F2 Sequencing Genomic Clone
62 This Study
5’-ATAGGTGGAAACACAAAACG-3’ CIL1R Amplifying Genomic Clone
66 This Study
5’-CAGGAAACAGCTATGAC-3’ M13RP 55 Sequencing of Plasmids DNA Technologies Unit (NRC-PBI)
5’-TGTAAAACGACGGCCAGT-3’ M13UP 67 Sequencing of Plasmids DNA Technologies Unit (NRC-PBI)
5’-ATCTCCTGTCATCTCACC-3’ NPT-JH1 Confirming Presence of NPTII
58 Joe Hammerlindl (NRC-PBI)
5’-AAGAAGGCGATAGAAGGC-3’ NPT-JH2 Confirming Presence of NPTII
65 Joe Hammerlindl (NRC-PBI)
5’-CAGCTATGACCATGATTACG-3’ pRD400F 64 Confirmation of the Presence of Antisense
Construct
This Study
3333
The reactions for PCR amplification of neomycin phosphotranferase (NPTII)
consisted of 5 pmol each forward (JH1) and reverse (JH2) primers, 4 mM MgCl2, 1 X
PCR buffer (Invitrogen, Mississauga, ON, list components), 0.20 mM each
deoxyribonucleotide, 1.0 U Taq polymerase and 250 ng genomic DNA. The reaction
conditions consisted of an initial denaturation at 94˚ C for 30 s, subsequently 30 cycles
were performed of 94˚ C for 30 s, 62.9˚ C for 1 min and 72˚ C for 30 s. A final extension
of 72˚ C for 1 min was followed by an indefinite hold at 4˚ C for a resultant PCR
fragment of approximately 400 bp.
The PCR amplifications were carried out in either a PTC-200 thermal cycler (MJ
Research, Waltham, MA, USA) or in a GeneAmp PCR system 2400 (Perkin Elmer,
Boston, MA). Aliquots of the PCR amplifications were analyzed on 0.7% (w/v) agarose,
1 X TAE, ethidium bromide gel (Sambrook and Russell, 2001).
3.3.2 Cloning of PCR Products
Cloning of PCR products was accomplished using the Topo TA cloning system
(Invitrogen, Carlsbad, CA, USA) following the manual’s directions. Either chemically
competent or electrocompetent Escherichia coli TOP10 strain with genotype - F-
mcrAΔ(mrr-hsdRMS-mcrBC) Φ80lacZDM15 ΔlacX74 recA1 araD139Δ (ara-lea)7679
galU galK rpsL (StrR) endA1 nupG were used for transformation. For electroporation,
the Gene Pulser (Bio-Rad, Hercules, CA, USA) was set at 25 μFarad capacitance, 200
ohms resistance, and delivered a 12.50 kV/cm pulse. For chemical transformation, the
directions from the manufacturer were followed (Invitrogen, Carlsbad, CA, USA).
Plasmid DNA was recovered from clones using the QIAprep miniprep kit (Qiagen,
34
Hilden, Germany) according to manufacturer’s instructions. Restriction enzyme analysis
and DNA sequencing were used to verify the identity of the PCR products. The DNA
was submitted for sequencing to the DNA Technologies Unit (NRC-PBI), sequenced
with universal primer, and reverse primer using an ABI Prism 377 DNA Sequencer
(Applied Biosystems, Foster City, CA, USA). Sequences were analysed using the
Editseq program (DNASTAR Inc., Madison, WI, USA).
3.4 Southern Blot Analysis
Southern blot analysis was used to estimate the copy number of the CIL1 gene in
three Brassica species: B. carinata, B. nigra, and B. oleracea. DNA was extracted from
first leaves of 3-week old plants using the method previously described. To confirm the
concentration of the genomic DNA determined by A260, 4 μL of each sample was loaded
alongside 4 μL of High DNA Mass Ladder (1 – 10 kb fragments, 20 – 200 ng DNA)
(Invitrogen, Carlsbad, CA, USA). Approximately 10 μg of genomic DNA was digested
with either 60 U of BamHI, 60 U of EcoRI or 100 U of HindIII (New England Biolabs,
Beverly, MA). The digested DNA was separated on a 0.7% (w/v) agarose, 1 X TAE,
ethidium bromide gel and the results photographed. The DNA was transferred to
Hybond-N+ nylon membrane (Amersham, Little Chalfont, Buckinghamshire, UK) by
capillary action (Sambrook and Russell, 2001).
Southern blots were also used to analyse the copy number of the antisense cassette
in transgenic plants. In this case, genomic DNA was extracted from first leaves of 3-
week old transgenic B. carinata lines 2, 3, 5, 6, 10, and 13. Five micrograms of genomic
DNA from each transgenic line was digested with 25 U of NheI and PacI to excise the
35
antisense cassette and electrophoresed alongside amounts of the plasmid clone of
antisense CIL1/NPTII cassette equivalent to 1, 5, 10 and 20 copies. The gel
electrophoresis and Southern blot were carried out as described above.
Probes for Southern blot hybridization were prepared as follows: 1) plasmid DNA
was restriction enzyme digested to release the insert, 2) the fragment corresponding to the
insert was excised and purified from the gel using the QIAEX II (Qiagen, Strasse 1,
Hilden, Germany) system following the instructions in the manual and, 3) the DNA
fragment was labeled with 32P-dCTP (3000 Ci/mmole) utilizing the Random Primers
DNA Labeling System (Invitrogen, Carlsbad, CA, USA) following the manufacturer’s
directions.
Hybridization was done using QuikHyb hybridization solution (Stratagene, La
Jolla, CA, USA) according to manufacturer’s directions. Membranes were prehybridized
in roller bottles at 65 oC for 30 min then hybridized with the probe for 1 h. Following
hybridization, the membrane was removed, and washed twice for 15 min at room
temperature with 2 X SSC buffer and 0.1% (w/v) SDS wash solution. After the second
wash, membranes were scanned using a Geiger counter. If the counts were too high to
discern regions containing genomic DNA from background, an additional wash for 30
min at 60 oC with a 0.1 X SSC buffer and 0.1% (w/v) SDS wash solution was performed
(Sambrook and Russell, 2001). Hybridized membranes were exposed to Kodak X-
OMAT AR film at –80 oC.
36
3.5 Phytohormone Treatments and Expression Analysis
Plants were grown as previously described and the time of sampling for both
phytohormone and gene expression analysis were standardized to avoid discrepancies in
the data caused by fluctuations of transcript and phytohormone amounts over the course
of the photoperiod.
Samples used for expression analysis included the 3rd lateral meristem (counted
apically from the most basal lateral meristem), the shoot apical meristem, the 1st leaf, the
stem (from the epicotyl apically to, but not including, the shoot apical meristem), and the
entire root. First leaves were collected once the second leaf began to expand. All other
samples were taken once plants had reached the fourth leaf stage, after approximately 4
weeks of growth. All gene expression analysis experiments were conducted in triplicate.
Samples were collected at 0, 1, 2, 4, 6, 8, 12, 16, 24 h after the start of the time course
and CIL1 expression was analysed using RT-PCR and the CIL1770F/R primer set.
For CIL1 expression analysis after phytohormone treatment, the 3rd lateral
meristems were treated with 200 μL of hormone solution containing 0.1% (v/v) Triton X-
100. Each sample was collected from a separate plant. The concentrations of hormone
solutions used were 50 μM α-napthaleneacetic acid (α-NAA) (Sigma-Aldrich, Oakville,
Ontario, Canada) (Neuteboom et al., 1999), 5 μM 6-benzylaminopurine (BAP) (Caisson
Laboratories Inc, Rexburg, Idaho, USA) (Crosby et al., 1981; Fei and Vessey, 2004), or
10 μM +/- abscisic acid (ABA) (Sigma-Aldrich, Oakville, Ontario, Canada) (Zheng et al.,
2001). To minimize variability, the time course analyses all began at the same time of
day after the same stage of growth had been reached.
37
In the case of real-time quantitative RT-PCR, the samples were collected at the
same time of day in all cases. After plants had reached the 4th-leaf stage of growth,
samples were collected from the basally 3rd lateral meristem, the shoot apical meristem,
the basally 3rd leaf, the stem, and the entire root.
3.6 Semi-Quantitative RT-PCR Analysis
Semi-quantitative RT-PCR was used to analyse the expression of CIL1 in treated
and untreated B. carinata organs. The RT-PCR protocol presented was found to produce
the optimal results. Prior to the RT reaction, 200 ng RNA was treated with 1 U of
RNase-free DNase I (Amersham, Little Chalfont, Buckinghamshire, UK) and 40 U of
RNase OUT (Invitrogen, Carlsbad, CA, USA) in the presence of 10 μl of 5X first-strand
buffer (Invitrogen, Carlsbad, CA, USA) at 37 oC for 15 min. Reverse transcription was
carried out using Superscript II (Invitrogen, Carlsbad, CA, USA) according to supplier's
directions. Subsequently, 500 nL of the RT reaction was added to the corresponding
PCR amplification. The PCR amplifications contained: 2 pmol each of the actin primers,
5 pmol each of the CIL1 primers, 2 mM MgCl2, 1X PCR buffer (Invitrogen, Carlsbad,
CA, USA), 0.20 mM dNTP, and 1.0 U of Taq polymerase (Invitrogen, Carlsbad, CA,
USA). The samples were electrophoresed on a 2% (w/v) agarose 1 X TAE gel and a
photograph of the gel was taken using a Bio-Rad Gel Doc 2000 with the Quantity One
software (Bio-Rad, Hercules, CA, USA).
38

3.6.1 Quantitation of Semi-Quantitative RT-PCR
Photographs of gels were analysed using the Gel-Pro Analyser software (Media
Cybernetics, San Diego, CA, USA). To analyse the gel photo, the lane size was defined
manually, both automatic and manual designation was used for fragment location. On the
lane profile graph, created for each individual lane, the region of the band to be analysed
was specified, and the optical densities were re-calculated. The maximum optical density
(OD) value was recorded, and calculations were carried out to obtain a semi-quantitative
value for CIL1 expression at the time point examined. To obtain the expression value or,
“relative intensity” at each time point, the maximum OD of the CIL1 PCR fragment was
divided by the value for the BcAct PCR fragment. An example of the results used for
calculation is presented in Figure 3.1, the BcAct OD value was 65.21 while the CIL1770
OD value was 73.45 for the 0 hour time point in an untreated lateral meristem time
course. Using the calculation outlined above, 73.45/65.21 yields a relative intensity of
1.13. Using this method, the BcAct value normalizes the values for the time course. The
mean, standard deviation and standard error were calculated for the corrected intensity
values of the replicates. The results of the time courses were graphed using Microsoft
Excel, in histogram format.
3.6.2 Real Time Quantitative RT-PCR Analysis
Samples were collected from both transgenic and non-transformed B. carinata
from the basally 3rd lateral meristem; shoot apical meristem, basally 3rd leaf, stem, and
whole root. Samples were collected from homozygous antisense transgenic lines 2, 3, 5,
39

0 1 2 4
65.21 112.45 69.63 71.81
BcAct 250 bp
150 bp CIL1770 73.45 168.64 94.45 42.27
Figure 3.1. Semi-Quantitative RT-PCR analysis of CIL1 expression in lateral meristems. Optical densities were determined using Gel-Pro Analyser software (Media Cybernetics). Each time point’s corrected intensity was calculated by dividing the PCR fragment optical density for CIL1 by the fragment optical density for actin. The top numbers represent the time of sampling in h while the numbers directly below them represent the OD of the BcAct PCR product for the corresponding time point. The numbers below the photo represent the OD of the CIL1770 samples for the corresponding time point. An example calculation involving the 1 h time point would result in: 168.44/112.45 = 1.49. All samples were calculated using this method.
40

6, 10, and 13. All samples were collected at the same time of day, and were collected
after the plants had reached the 4th-leaf stage of growth.
Quantitative RT-PCR analysis was performed using the QuantiTect SYBR Green
RT-PCR kit (Qiagen, Strasse 1, Hilden, Germany) according to the instructions in the
handbook with the following modifications. Prior to the RT-PCR reactions, 1.25 μg of
RNA was digested with 2 U of RNase free DNase I (Amersham, Little Chalfont,
Buckinghamshire, UK) for 10 min at 37 oC in 1 X first strand buffer (Invitrogen,
Carlsbad, CA, USA). Subsequently, each reaction was made up to contain 1X SYBR
Green Master Mix, 0.5 μM each CIL1770F and R or 0.5 μM BcActL and R, 0.5 μL
QuantiTect RT Mix, 1X fluorescein, and RNase-free water to 48 μL per sample. The RT
reaction was carried out at 50 oC for 30 min. After the RT reaction was completed, the
samples were transferred to a 96-well plate designed for use with the iCycler (Bio-Rad,
Hercules, CA, USA). The cycling conditions used for the PCR amplification step were as
follows, an initial PCR denaturation step at 95 oC for 15 min followed by 40 cycles of 15
s at 94 oC, 30 s at 58 oC, and 30 s at 72 oC. After the 40 cycles were completed, a melt
curve was generated by holding the samples at 58 oC for 30 s and increasing the
temperature by 0.5 oC every cycle for 74 times, with a final measurement at 92 oC.
3.6.3 Real Time Quantitative RT-PCR Data Analysis
The results of the real-time RT-PCR were analysed using a Microsoft Excel
macro that calculates data using the ΔΔCT formula, where “CT” is the threshold cycle
when the sample being amplified by PCR enters the log stage of replication (Pfaffl, 2001;
Livak and Schmittgen, 2001). Using the ΔΔCT method, the gene of interest can be
41
compared with a constitutively expressed gene, under the conditions of this experiment,
such as actin to calculate relative expression. The ΔΔCT method utilizes two genes to
calculate relative quantitative expression, and the genes must amplify with a similar
efficiency. In that case, an efficiency of “2” can be assigned to them, and this number is
used in the equation: Amount of target = 2-(SΔCT-CΔCT). The amount of target is normalized
to an endogenous reference, in this case the B. carinata actin gene, with the CIL1
transcript amount in non-transformed B. carinata plants as the control to which
everything is normalized. The efficiency of the primers can be tested by RT-PCR
amplifying a series of dilutions of an aliquot of RNA with both primer sets, analysing
them using the ΔΔCT calculation, and then graphing them. If the primers amplify with a
similar efficiency, the slope of the line will be close to zero. This experiment was
completed prior to analysing any samples for the gene expression study. An example of
the data used for the ΔΔCT calculation is presented in Table 3.2. The standard error
calculation was performed according to Vandesompele et al. (2002). In some cases,
outlier biological replicates were removed from the sample set because their values were
vastly different from the other two values. The data were graphed using Microsoft Excel,
in histogram format.
42

Table 3.2 Real-Time Quantitative RT-PCR Data Analysis
Sample CIL1 CT Mean
CIL1 CT
BcAct CT Mean BcAct CT
Relative Expression ΔCT SΔCT-CΔCT
CΔCTψ
1 23.0 21.9*
2
23.6
16.2
Non-transformed
23.2 16.7 23.26 16.45 0 1.00 6.8 3 SΔCT
1 23.2 16.8
2
22.8
16.2
Line 2
23.2 16.2 23.06 16.40 -0.15 1.11 6.6 3 1
25.1 15.9
2
25.0 16.1 Line 6
25.8 16.0 25.30 16.0 9.3 2.48 0.18 3
CT = Cycle threshold of the PCR amplification ΔCT = Mean CIL1 CT – Mean BcAct CT SΔCT-CΔCT = Sample ΔCT-control ΔCT Relative Expression = 2-( SΔCT-CΔCT) * = Outlier value ignored ψ = For calculation of the relative expression of the non-transformed line, it is both the sample and the control.
4343
3.7 Senescence Bioassay
Plants were grown to the 4th-leaf stage, at which point 0.6 cm diameter discs were
cut from the distal regions of young leaves, generally the 3rd and 4th leaves. Chlorophyll
was extracted according to Burkhanova et al. (2001) with modifications. Approximately
15 leaf discs were collected per replicate, with 3 biological replicates per line. The leaf
discs were placed on filter paper pre-wetted with deionized water in Petri plates, sealed,
and placed in the dark at 23 oC for 72 h. The discs were then homogenized in 80% (v/v)
acetone using a mortar and pestle, centrifuged in a microcentrifuge at 13,000 rpm for 10
min, and the supernatant was transferred to a cuvette. The absorbance was measured at
645 and 663 nm, to determine the content of chlorophyll A and B. Chlorophyll content is
expressed as mg/L = 20.2 * A645 + 8.02 * A663 (Jeffrey and Humphrey, 1975).
3.8 Phenotypic Characterization
Two studies were conducted to compare the plant height and leaf surface area of
non-transformed and antisense T4 CIL1 transgenic plants. The first study compared
transgenic lines 2, 3, 5, 10, and 13 to the non-transformed line; transgenic line 6 was
included in the second study. Measurements were taken from eight plants for each
transgenic line and from four non-transformed plants and the means were determined.
Measurements were taken every 4 days after the appearance of two true leaves and
continued until the plants bolted. Leaf location was recorded and the length was
measured from the petiole to the most distal region of the leaf blade while width was
measured at the approximate centre of the leaf. Plant height was measured from the
cotyledonary node to the shoot apical meristem.
44
3.9 Phytohormone Profiling
The 1st leaves were collected when the plants had reached the 2nd-leaf stage of
growth. The basally 3rd lateral meristem, the shoot apical meristem, the stem, and the
entire root were collected when the plants reached the 4th-leaf stage. All samples were
collected at the same time of day to minimize any variation due to environment. The
samples were frozen in liquid nitrogen and held at –80 oC until they were freeze-dried in
a Labconco Freezone 4.5 (Labconco Corp., Kansas City, MI, USA) for 3 days.
The phytohormone analysis was carried out, with modifications, as described by
Chiwocha et al. (2003). The plant organs were divided into three 50 mg samples in
skirted 2 mL tubes with an o-ring closure. A 6.35 mm ceramic bead was added, and the
tube was placed in a FastPrep FP120 (Bio101 Savant, Irvine CA, USA). The samples
were homogenized in the FastPrep for 15 seconds at speed setting 5. If the sample was
not completely homogenized after the initial 15 seconds, the samples were shaken for an
additional 10 seconds at speed 5. The samples were transferred to 15 mL conical bottom
centrifuge tubes containing 3 mL of the extraction solution (80% v/v isopropyl alcohol,
1% v/v glacial acetic acid). Twenty nanograms of each deuterated internal standard was
added to each of the sample tubes. Master mixes were made, containing non-deuterated
analytes and deuterated internal standards at concentrations of 1 ng/μL. Deuterated
internal standards included in the samples, quality control (QC; contained non-deuterated
and deuterated standards), and internal standard mixture (IS; contained deuterated
standards) were: d2 GA1 and GA4; d3 DPA, PA, neo-PA, DHZ, and DHZR; d4 7’OH-
ABA and ABA; d5 ABA-GE, ZOG, and IAA, and d6 2iP and IPA. The QC also included
non-deuterated standards 2iP, 7’OH-ABA, ABA, ABA-GE, DHZ, DHZR, DPA, GA1,
45
GA3, GA4, GA7, IAA, IAAsp, IPA, neo-PA, Z, ZOG, and ZR. All chemicals, both
deuterated and non-deuterated were obtained from Dr. Sheila Chiwocha at the NRC Plant
Biotechnology Institute (Saskatoon, Saskatchewan, Canada).
Samples were extracted in the dark at 4 oC in an orbital shaker at 300 rpm for 24
h, centrifuged at 290 x g for 10 min, the supernatant was transferred to a new tube. The
remaining pellets were re-suspended in 500 μL extraction solution, centrifuged for 10
more min and the supernatants were combined. Extracts were evaporated to dryness in a
Speed-Vac (Bio101 Savant, Irvine CA, USA), then re-suspended in 1 mL of 99:1
isopropyl alcohol:glacial acetic acid, vortexed vigorously for 10 min, sonicated in a
Branson 2210 Ultrasonic Cleaner (Branson, Danbury, CT, USA) for 10 min and finally,
centrifuged at 13,000 rpm for 10 min in a microcentrifuge. Supernatant were transferred
to a new tube and evaporated to dryness in a Speed-Vac. Extracts were reconstituted in
50 μL 99:1 methanol:glacial acetic acid using vortexing and sonication for 10 min.
Following the reconstitution, 500 μL of a 1% (v/v) glacial acetic acid aqueous solution
was added to each sample, and mixed by vortexing. One millilitre of n-hexanes was
added to each sample, vortexed vigorously for 2 min until an emulsion was formed and
incubated at room temperature for 30 min to allow phase separation. The samples were
centrifuged at 13,000 rpm for 2 min in a microcentrifuge, and the upper solvent phases
were removed. A second hexane extraction was performed. Aqueous phases were then
evaporated to dryness in a Speed-Vac, and each extract was reconstituted with 1 mL of
methanol:water:glacial acetic acid (80:19:1). The extracts were applied to C18 Sep-Pak
(Waters, Milford, MA, USA) columns and eluted with 500 μL methanol:water:glacial
acetic acid (80:19:1). Twenty nanogram of d6-ABA was added as a recovery standard to
46

each sample extract, quality control (QC), and internal standard (IS). Extracts,
evaporated to dryness in a Speed-Vac were reconstituted with 80 μL 99:1
methanol:glacial acetic acid, and mixed by vortexing. After the residue was dissolved,
120 μL 1% (v/v) glacial acetic acid was added, the samples were vortexed for 30
seconds, sonicated for 10 min, and centrifuged at 13,000 rpm for 10 min. The extracts
were transferred to low volume HPLC tubes and capped.
3.9.1 High-performance liquid chromatography
High-performance liquid chromatography (HPLC) was used to separate
phytohormones in the plant extracts. The Alliance 2695 separation module (Waters,
Milford, MA, USA) was outfitted with a 100 mm x 2.1 mm, 4-μm Genesis C18 HPLC
column (model FK10960EJ, Jones Chromatography, Hengoed, UK). A solvent system
composed of acetonitrile (A), de-ionized water (B), 5% v/v glacial acetic acid in de-
ionized water (C), and 100% methanol (D) was used for the chromatography. A 1.0 mm
Opti-Guard C18 HPLC column, violet (Optimize Technologies Inc # 10-02-00007,
ChromSpec distribution # M100200007, OR, USA) was used to remove particulate
matter in the sample to ensure optimal performance of the Genesis C18 column. The
chromatography was performed using a gradient of increasing acetonitrile concentration
and a constant glacial acetic acid concentration of 7 mM (pH 3.4) with an initial flow rate
of 0.200 mL min-1. The gradient was linearly increased from 2.0% (v/v) A, 94.2% (v/v)
B, 0.8% (v/v) C, 3.0% (v/v) D to 60.0% (v/v) A, 0.0% (v/v) B, 0.8% (v/v) C, 39.2% (v/v)
D over 46 min and held for 3 min with an increased flow rate of 0.350 mL min-1. After 1
min of holding, the initial conditions of the chromatography were restored, and the
47

column was equilibrated for 8 min, yielding a gradient program with a 57-minute
duration and a sample turnaround of 60 min in total (Table 9.2).
3.9.2 Mass Spectrometry
The determination of precursor-to-product ion fragmentation was required prior to
mass spectrometric analysis of phytohormone samples. For the selection of the ion
transitions, 10 mM standards for the deuterated and non-deuterated analytes were infused
individually using ESI-MS/MS with a Harvard Apparatus Pump II at a flow rate of 20 μL
min-1 into a quadrupole tandem mass spectrometer (Quattro Ultima, Micromass,
Manchester, UK) outfitted with an electrospray ion source. The electrospray and cone
voltages were adjusted to optimal conditions for the production of the precursor ions in
negative or positive ionization mode. IAA, IAAsp, ABA, 7’-OH-ABA, neo-PA, PA,
DPA, ABA-GE, GA1, GA3, GA4, GA7, and their respective internal standards were
analysed in negative ion mode, while the cytokinins Z, ZR, 2iP, and IPA and their
respective internal standards were analysed in positive ion mode. The transition parent to
daughter ion is shown in Table 3.3. Argon gas was used in the collision cell to cause
collision-induced dissociation (CID) of the precursor ions. Once the precursor-to-product
transition had been determined, a mixture containing all the deuterated and non-
deuterated analytes, the QC, a mixture containing the deuterated analytes, the IS, the
samples, prepared as outlined above, and the solvent blanks, were separated by reversed-
phase HPLC and analysed by tandem mass spectrometry with multiple reaction
monitoring (MRM). Analysis of variance (ANOVA) was performed on all organs for all
treatments. ANOVA results were considered significant if ρ ≤ 0.05.
48
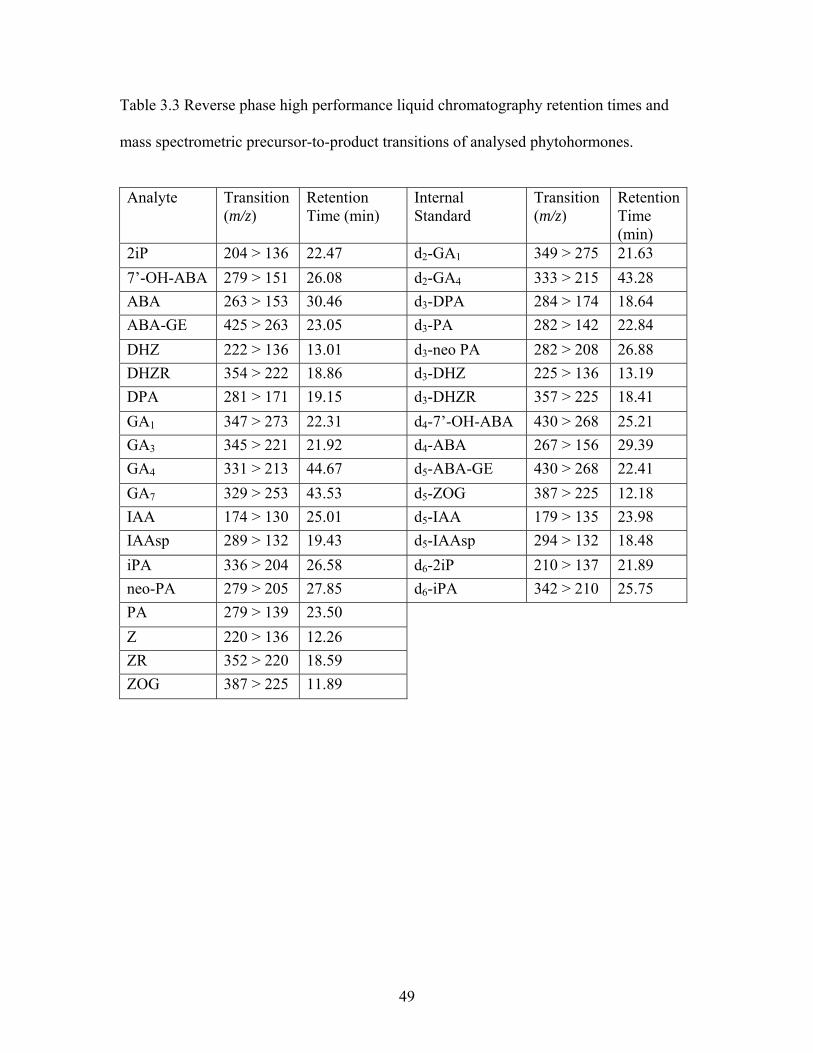
Table 3.3 Reverse phase high performance liquid chromatography retention times and
mass spectrometric precursor-to-product transitions of analysed phytohormones.
Analyte Transition
(m/z) Retention Time (min)
Internal Standard
Transition (m/z)
Retention Time (min)
2iP 204 > 136 22.47 d2-GA1 349 > 275 21.63 7’-OH-ABA 279 > 151 26.08 d2-GA4 333 > 215 43.28 ABA 263 > 153 30.46 d3-DPA 284 > 174 18.64 ABA-GE 425 > 263 23.05 d3-PA 282 > 142 22.84 DHZ 222 > 136 13.01 d3-neo PA 282 > 208 26.88 DHZR 354 > 222 18.86 d3-DHZ 225 > 136 13.19 DPA 281 > 171 19.15 d3-DHZR 357 > 225 18.41 GA1 347 > 273 22.31 d4-7’-OH-ABA 430 > 268 25.21 GA3 345 > 221 21.92 d4-ABA 267 > 156 29.39 GA4 331 > 213 44.67 d5-ABA-GE 430 > 268 22.41 GA7 329 > 253 43.53 d5-ZOG 387 > 225 12.18 IAA 174 > 130 25.01 d5-IAA 179 > 135 23.98 IAAsp 289 > 132 19.43 d5-IAAsp 294 > 132 18.48 iPA 336 > 204 26.58 d6-2iP 210 > 137 21.89 neo-PA 279 > 205 27.85 d6-iPA 342 > 210 25.75 PA 279 > 139 23.50 Z 220 > 136 12.26 ZR 352 > 220 18.59 ZOG 387 > 225 11.89
49

The ZR data were transformed logarithmically to stabilize the variance, and analysed by
ANOVA.
50

4. RESULTS
4.1 Sequence Analysis of CIL1
The CIL1 cDNA was selected from a clone library derived from mRNA isolated
from leaves of B. carinata 12 h after they were sprayed with 5 mM CuCl2 (Uchacz,
2000). The full-length 1030 bp cDNA was obtained using the GeneRacer kit (Invitrogen,
Carlsbad, USA) and encoded an open reading frame of 810 bp. The cDNA and derived
amino acid sequence are shown in Figure 4.1. The amino acid sequence consists of 269
residues with an estimated molecular weight of 27,331 Daltons and pI of 7.14. No
introns were detected in the PCR product of B. carinata genomic DNA after
amplification with a high fidelity polymerase and primers derived from the cDNA
sequence. No significant similarities to the CIL1 nucleotide sequence other than AIR12
were found in the nucleotide BLAST database. However, BLAST searching with the
derived amino acid sequence did reveal several other similar sequences. The most similar
(59% identity) sequence was the A. thaliana AIR12, which is encoded by a gene that is
expressed during auxin-induced lateral root formation. Analysis of AIR12 and CIL1
sequences suggests they are attached to the plasma membrane by
glycosylphosphatidylinositol (GPI) anchors.
51

1 - CCAGAACTCAACTCAGCCATGGCTTCAAACGCTTCTCTCACTCTTGTCCTAGCCGTTGCT M A S N A S L T L V L A V A 61 – TGCTTCGTCTCTCTTATCTCACCGGCGATTTCACAGACGTGCTCTACGCAGAACGTCACC C F V S L I S P A I S Q T C S T Q N V T 121 – GGCGACTTCAAGAATTGCATGGACCTCCCCGTACTCGATTCCTTCCTCCACTACACATAC G D F K N C M D L P V L D S F L H Y T Y 181 – GACGCAGCCAACTCATCCCTCTCCGTCGCTTTCGTCGCTACTCCGCCTCGTTCCGGCGAC D A A N S S L S V A F V A T P P R S G D 241 – TGGGTCGCTTGGGGTATCAACCCCACGGGGACTAAAATGATCGGCTCTCAGGCGTTCGTC W V A W G I N P T G T K M I G S Q A F V 301 – GCCTACAGTCCTCGAGCCGGTGCGCGTCCCGAGGTGAACACGTACAACATCAGCAGCTAC A Y S P R A G A R P E V N T Y N I S S Y 361 – AGCCTCAGCGCAGGAAGGCTCACCTTCGACTTCTGGAACCTACGCGCTGAATCCATGGCC S L S A G R L T F D F W N L R A E S M A 421 – GGTAACAGGATCGTGATCTACACGTCGGTTAAGGTTCCGGCGGGAGCTGACAGCGTGAAC G N R I V I Y T S V K V P A G A D S V N 481 – CAGGTGTGGCAGATCGGCGGGAATGTGACTGGCGGTCGTCCGGGACCGCATCCTATGACT Q V W Q I G G N V T G G R P G P H P M T 541 – CCGGCGAACTTGGCCTCTACGAGGATGTTGAGATTGACTGGCTCCGACGCTCCGAGCTCT P A N L A S T R M L R L T G S D A P S S 601 – GCTCCAGGCTCCGCTCCGAGCTCTGGTCCGGGGTCTGCTCCAAGCTCTGGTCCGGGGTCT A P G S A P S S G P G S A P S S G P G S 661 – GCTCCAGGGTCTGTTCCAGGGTCTGCTGAGGGGCCGACCACTCCTGATGCCTCGACCACT A P G S V P G S A E G P T T P D A S T T 721 – CCTGGACAGGCGGGTAGTCCAGGGAACGCGGGTTCGATGACGACTAGCGTAAATTTCGGG P G Q A G S P G N A G S M T T S V N F G 781 – GTCAATTTTGGAATTTTGGTTATGTTGGCTTCAGTTTTCATATTCTGAGTATGATTTCAT V N F G I L V M L A S V F I F * 841 – CTTCTTCACATTCCTTTTTTGGTGTTGCATAATAATGGAGTTACATACTGTTTGTTTTAT 901 – CGTTTTAGTACTAGTCTTTAGAGTCATTTACTCGTTTTGTGTTTCCACCTATCTCTATCT 961 – CTCTCTCCACATTATTCTGAGTTATTAATATTGGATTGTATGGACCACTAAAAAAAAAAA 1021 - AAAAAAAAAA - 1030 Figure 4.1 cDNA and derived amino acid sequence of Brassica carinata CIL1
52
4.1.1 Catecholamine (CA) Binding Domain
A search of the Conserved Domain Database (Marchler-Bauer et al., 2003) was
conducted with CIL1 and a high similarity to a possible CA-binding domain was found
(Figure 4.2). It is a predominantly beta-sheet domain present as a regulatory N-terminal
domain in dopamine beta-hydroxylase, mono-oxygenase X and SDR2. Its function
remains unknown at present. The conserved domain length is 148 residues, 98.6% of the
catecholamine-binding domain aligned with the CIL1 amino acid sequence. The
similarity score for CIL1 is 78.2 and the probability that this degree of similarity could
occur by chance is 9e-16. The domain model also has relationships to two other conserved
domains: pfam03351, a DOMON domain (dopamine β-monooxygenase N-terminal)
thought to mediate extracellular interactions. The second relationship is to a family of
uncharacterized plant proteins, DUF568.
4.1.2 Dopamine-β-Hydroxylase Homologies
Vereslt and Asard (2004) performed alignments of the regulatory N-terminal
domain of dopamine beta-hydroxylase (DoH) and related proteins, such as AIR12, with
and without an associated cytochrome b561 electron transport domain (CB), from a
variety of monocot and dicot plants. To investigate the relationship between CIL1 and
the proteins reported by Vereslt and Asard (2004), an alignment was performed using
ClustalW (Figure 9.1). The amino acid sequences used originated from four different
plants: The CIL1 amino acid sequence from B. carinata, the CAC37356 amino acid
sequence from Solanum tuberosum, the BAC01247 amino acid sequence from Oryza
sativa, and the AAC62613 (AIR12), BAB09428, AAL57706, NP_199564, AAM64730,
53
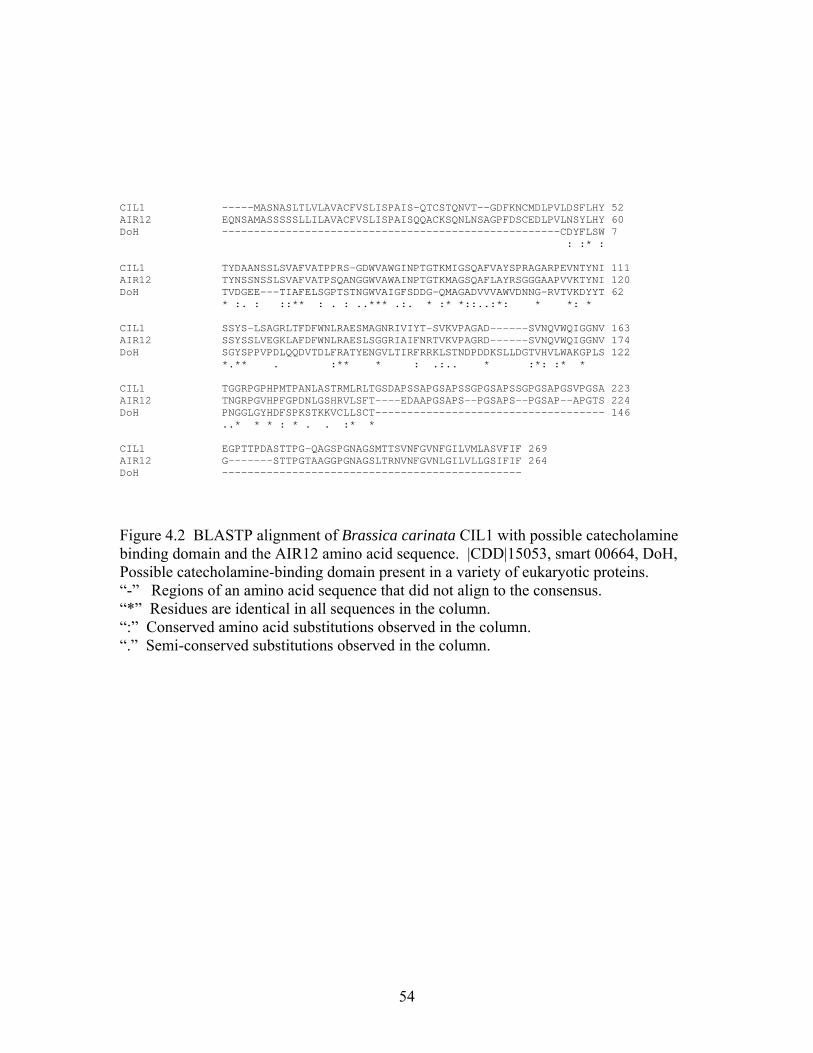
CIL1 -----MASNASLTLVLAVACFVSLISPAIS-QTCSTQNVT--GDFKNCMDLPVLDSFLHY 52 AIR12 EQNSAMASSSSSLLILAVACFVSLISPAISQQACKSQNLNSAGPFDSCEDLPVLNSYLHY 60 DoH -----------------------------------------------------CDYFLSW 7 : :* : CIL1 TYDAANSSLSVAFVATPPRS-GDWVAWGINPTGTKMIGSQAFVAYSPRAGARPEVNTYNI 111 AIR12 TYNSSNSSLSVAFVATPSQANGGWVAWAINPTGTKMAGSQAFLAYRSGGGAAPVVKTYNI 120 DoH TVDGEE---TIAFELSGPTSTNGWVAIGFSDDG-QMAGADVVVAWVDNNG-RVTVKDYYT 62 * :. : ::** : . : ..*** .:. * :* *::..:*: * *: * CIL1 SSYS-LSAGRLTFDFWNLRAESMAGNRIVIYT-SVKVPAGAD------SVNQVWQIGGNV 163 AIR12 SSYSSLVEGKLAFDFWNLRAESLSGGRIAIFNRTVKVPAGRD------SVNQVWQIGGNV 174 DoH SGYSPPVPDLQQDVTDLFRATYENGVLTIRFRRKLSTNDPDDKSLLDGTVHVLWAKGPLS 122 *.** . :** * : .:.. * :*: :* * CIL1 TGGRPGPHPMTPANLASTRMLRLTGSDAPSSAPGSAPSSGPGSAPSSGPGSAPGSVPGSA 223 AIR12 TNGRPGVHPFGPDNLGSHRVLSFT----EDAAPGSAPS--PGSAPS--PGSAP--APGTS 224 DoH PNGGLGYHDFSPKSTKKVCLLSCT------------------------------------ 146 ..* * * : * . . :* * CIL1 EGPTTPDASTTPG-QAGSPGNAGSMTTSVNFGVNFGILVMLASVFIF 269 AIR12 G-------STTPGTAAGGPGNAGSLTRNVNFGVNLGILVLLGSIFIF 264 DoH -----------------------------------------------
Figure 4.2 BLASTP alignment of Brassica carinata CIL1 with possible catecholamine binding domain and the AIR12 amino acid sequence. |CDD|15053, smart 00664, DoH, Possible catecholamine-binding domain present in a variety of eukaryotic proteins. “-” Regions of an amino acid sequence that did not align to the consensus. “*” Residues are identical in all sequences in the column. “:” Conserved amino acid substitutions observed in the column. “.” Semi-conserved substitutions observed in the column.
54
AAM65781, NP_566763, NP_191466, AAM61181, NP_191734, and NP_566313 amino
acid sequences from A. thaliana. Of the A. thaliana amino acid sequences used,
AAC62613 and BAB09428 are similar to DoH proteins, while all other A. thaliana
amino acid sequences are similar to DoH-CB proteins. A phylogenetic tree was
constructed using the GeneBee Graphical Phylogenetic Tree software
(http://www.genebee.msu.su/clustal/basic.html, first accessed December, 2004) with the
default settings, tree output set to “phylogenetic” and bootstrap values enabled (Figures
4.3 and 9.1). The phylogram indicates that the AIR12, CIL1, and BAB09428 proteins are
more closely related to each other than to the other A. thaliana amino acid sequences, the
Solanum tuberosum amino acid sequence, or the Oryza sativa amino acid sequence used
in the alignment. The existence of genes such as CIL1 with similarity to only the N
terminal domain of DoH suggests that the enzyme arose as the product of a fusion
between genes encoding a dopamine-binding domain and a cytochrome b561 electron
transport domain.
4.2 CIL1 Copy Number
Southern blot analysis was used to estimate the copy number of CIL1 in three
Brassica species, B. carinata, B. oleracea, and B. nigra. B. carinata is an amphidiploid
with the BBCC genome, n=34. Therefore, its most closely related diploid relatives are B.
nigra (BB) and B. oleracea (CC). Genomic DNA from the three species was digested
singly with the restriction enzymes BamHI, EcoRI or HindIII, the fragments were
separated by gel electrophoresis and the Southern blot was hybridized to a radioactively
labeled CIL1 probe (Figure 4.4). The hybridization patterns for the Bam HI digests of B.
55

Figure 4.3. Phylogram generated using ClustalW version 1.87 software at http://www.genebee.msu.su/clustal/basic.html. AIR12 accession number AAC62613. Arabidopsis thaliana proteins – NP_191734, NP_566313, AAL57706, NP_199564, AAM64730, AAM65781, NP_566763, NP191466, AAM61181, BAB09428; Solanum tuberosum protein CAC37356, Oryza sativa protein BAC01247, and Brassica carinata CIL1 protein were included in the phylogram, and bootstrap values were calculated. Bootstrap values indicating support for the arrangement of amino acid sequences appear to the left of their respective group.
56

cB cE cH nB nE nH oB oE oH
12,000 bp 5,000 bp 4,000 bp 3,000 bp 2,000 bp 1,650 bp 500 bp 400 bp 300 bp 200 bp
Figure 4.4 Southern blot analysis of CIL1 gene arrangement in three Brassica species: B. carinata, B. oleracea, and B. nigra. Five micrograms of genomic DNA were used for restriction enzyme digests in each sample. The first letter in each lane represents the Brassica species that was examined while the second letter in each lane represents the restriction enzyme used to digest the sample: c= B. carinata; n = B. nigra; o = B. oleracea; B = BamHI; E = EcoRI; H = HindIII.
57

carinata and B. nigra suggested incomplete digestion, however, subsequent digests with
greater amounts of enzyme did not alter the results. These DNA samples may have
contained enzyme activity inhibitors. In the BamHI digest of B. oleracea DNA, the CIL1
hybridization was seen in an apparent single fragment of greater than 12,000 bp. In the
EcoRI digest of B. carinata genomic DNA the strongest hybridization signals were from
fragments of approximately 12,000 bp and 7,000 bp with a fainter hybridization to a
4,000 bp fragment. In B. nigra, a single EcoRI fragment of greater than 12,000 bp
hybridized to CIL1 while in B. oleracea two fragments greater than 12,000 bp showed
hybridization. The HindIII digested DNA of B. carinata displayed the strongest
hybridization to fragments of ~10,000 and 1800 bp with weaker hybridization to a 2700
bp fragment. In B. nigra, the strongest hybridization was present on a ~10,000 bp
HindIII fragment and possibly some hybridization to a 2200 bp fragment. The most
complex pattern of CIL1 hybridization was observed in the HindIII digest of B. oleracea.
Here, the most intensely hybridizing DNA fragments were 2200 and 2000 bp while
moderate hybridization was seen at 3700 and 3000 bp and weak hybridization at 12,000
and 9,000 bp. Overall, the data indicate that there are multiple copies of CIL1 in B.
carinata and that there is a similarity in the CIL1 genome arrangement between B.
carinata and B. nigra.
4.3 Organ Specificity of CIL1 Expression
The expression of CIL1 in various organs over a 24 h period was examined using
semi-quantitative RT-PCR (Figure 4.5). The plants were sampled at the fourth-leaf stage
of growth. The optical density of the ethidium bromide stained CIL1 RT-PCR product
58

0
0.1
0.2
0.3
0.4
0.5
0.6
0.7
0.8
0.9
0 1 2 4 6 8 12 16 24Sampling Time Point (Hours after start of time course)
Rel
ativ
e Ex
pres
sion
Leaves Roots Lateral Meristems Shoot Apical Meristems
Figure 4.5 Expression of CIL1 in third leaves, whole roots, lateral meristems and shoot apical meristems of Brassica carinata. The RNA was extracted from plants at the fourth leaf growth stage at 1 h time intervals for 24 h and used for semi-quantitative RT-PCR. The relative expression of CIL1 was determined through comparison of the optical density of ethidium bromide stained PCR products of CIL1 with actin. The bar below the graph represents periods of light and darkness. Each organ at each time point was analysed in triplicate. Error bars represent the standard error of the mean.
5959

was compared to that of actin to determine relative expression. The CIL1 transcript was
found in third leaves, whole roots, lateral meristems and apical meristems. Variation in
the transcript amounts over the 24 h period was evident in each organ. The leaves
displayed the highest degree of variation over the entire time course with a 3.5 fold
difference in relative expression between the maximum at 4 h and the minimum at 6 h.
Root expression also varied, though not to the same degree as in the leaves. By the 2-
hour time point, 2.5 times the amount of CIL1 transcript was present in the root compared
to the 0-hour point, with expression decreasing thereafter. The amount of transcript in
lateral meristems also varied by 2.5 fold with a maximum at 1 h and minimum at 16 h
after sampling commenced. The apical meristem showed slightly less variation in CIL1
transcript amount over the time course with a 2.2 fold difference between the maximum
at 2 h and minimum at 8 h. Overall, the lateral meristems showed high expression and
maintained fairly consistent amounts of CIL1 mRNA throughout the time course
compared to the other organs examined.
4.4 Effects of Phytohormone Treatment on CIL1 Expression
The lateral meristems were chosen for the study of the effects of phytohormone
treatment on CIL1 expression since they displayed the most prominent antisense
phenotype and highest, most consistent amount of CIL1 mRNA. Adherence of the
phytohormone solutions to these meristems required the incorporation of 1% (v/v) Triton
X-100. To evaluate the effect of Triton X-100, if any, on CIL1 expression the third
lateral meristems of wild type plants were treated with Triton X-100 solution at the fourth
leaf stage of growth (Figure 4.6). The relative expression of CIL1 in the lateral
60
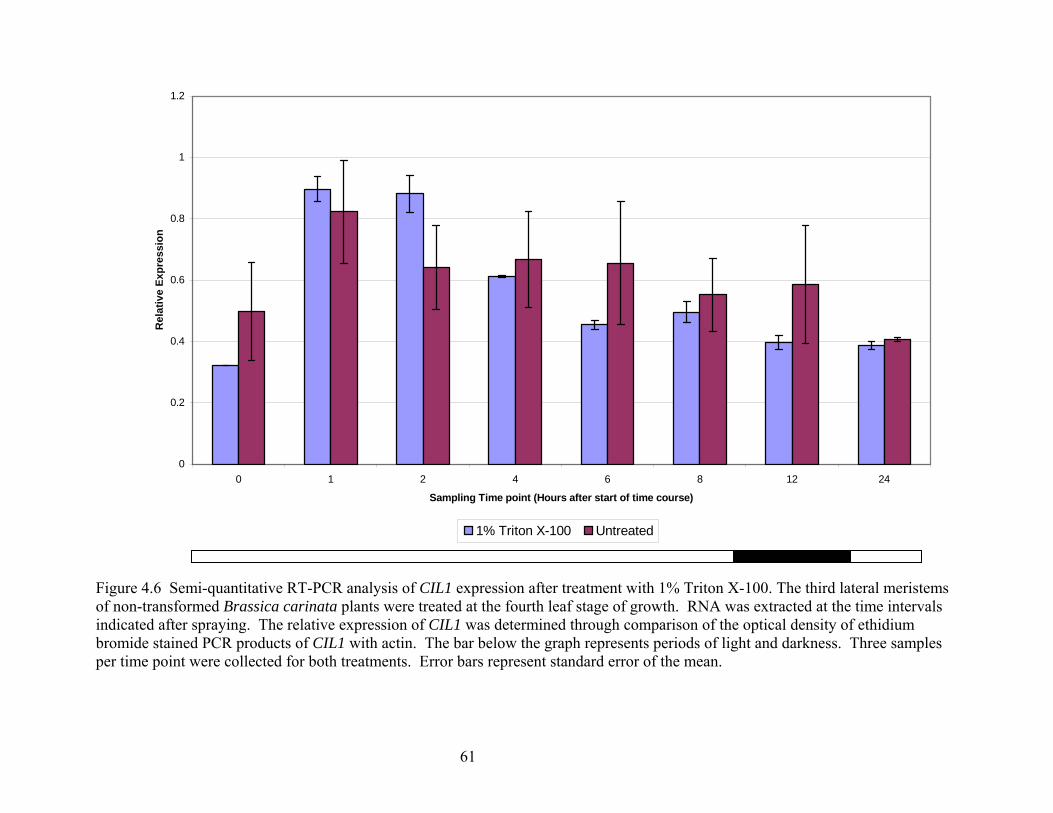
Figure 4.6 Semi-quantitative RT-PCR analysis of CIL1 expression after treatment with 1% Triton X-100. The third lateral meristems f non-transformed Brassica carinata plants were treated at the fourth leaf stage of growth. RNA was extracted at the time intervals
indicated after spraying. The relative expression of CIL1 was determined through comparison of the optical density of ethidium romide stained PCR products of CIL1 with actin. The bar below the graph represents periods of light and darkness. Three samples
per time point were collected for both treatments. Error bars represent standard error of the mean.
0
0.2
0.4
0.6
0.8
1
0 1 2 4 6 8 12 24
Sampling Time point (Hours after start of time course)
Rel
ativ
e Ex
pres
sion
1.2
1% Triton X-100 Untreated
o
b
6161

meristems did not vary greatly from untreated plants afte atment. The
selection of BAP and α-NAA concentrations wa evious studies (Crosby et
al., 1981; Neuteboom et al., 1999; Fei and Vessey, 2004). However, the optimal
treatment concentration for +/- ABA was determ ally (Figure 4.7).
Differences in CIL1 expression correlating to the - ABA concentrations used
to treat the organs were observed one hour after +/- ABA application. At that time point,
the 10 μM concentration showed the largest effect and, therefore, that concentration was
used in the subsequent time course study.
The rd plants were treated with
either 5 μM BAP, 50 μM α-NAA, or 10 μM +/- IL1 expression was
analysed using semi-quantitative RT-PCR (Figure 4.8). Expression of CIL1 increased
nearly three-fold one hour after BAP treatment; thereafter it decreased but rem ined
largely above untreated amounts. At six hours of darkness, the amount of CIL1 mRNA
had dropped to 0 h amounts, but increased again by 24 h after treatment. These results
indicate that BAP treatment induces either direc a rapid and sustained
increase in CIL1 expression. The decreased CIL ted at 6 h of darkness
suggests that the effect of BAP is modulated by the photoperiod.
The amount of CIL1 transcript increased one hour after the α-
NAA treatment, thereafter returning to 0 h amou similar to BAP, there
appeared to be a further decrease of expression coinciding with 6 h of darkness, and the
effect was reversed with light. The data show that auxin induces a rapid but very
transient increase in CIL1 expression.
r the Triton tre
s based on pr
ined empiric
different +/
med B. carinata
ABA and the C
tly or indirectly,
1 expression no
significantly by
nts. However,
3 lateral meristems of non-transfor
a
62
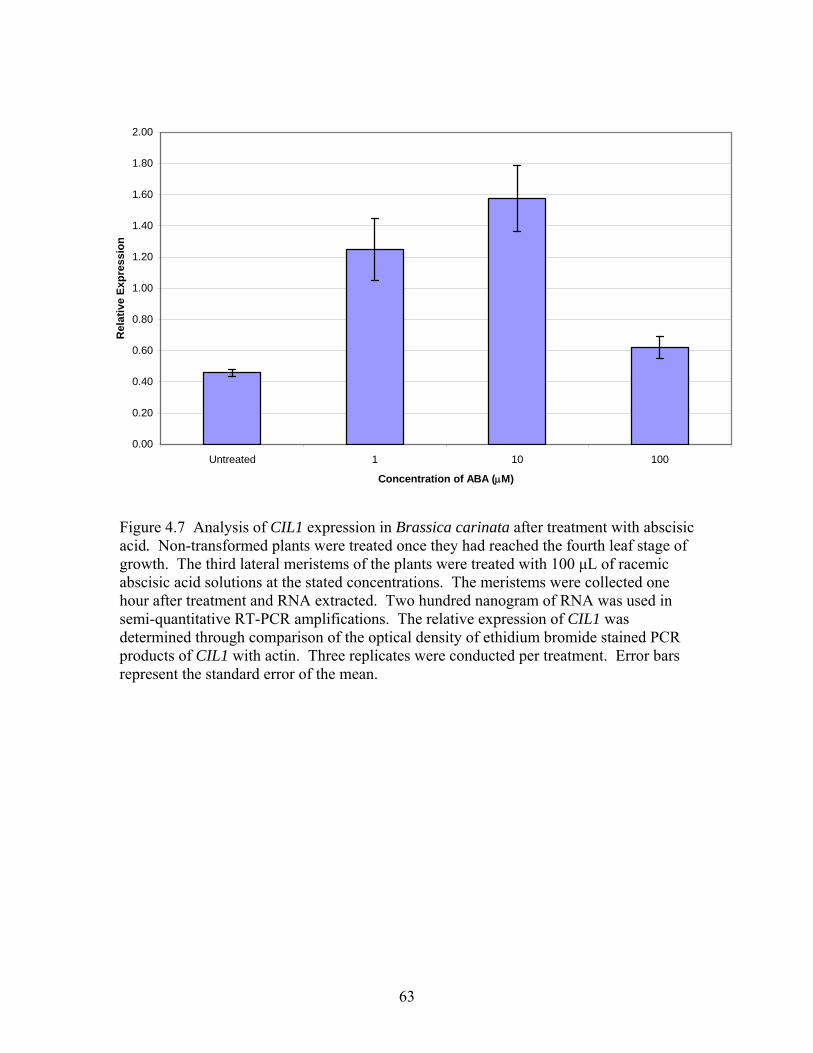
63
Figure 4.7 Analysis of CIL1 expression in Brassica carinata after treatment with abscisic
s
acid. Non-transformed plants were treated once they had reached the fourth leaf stage ofgrowth. The third lateral meristems of the plants were treated with 100 μL of racemic abscisic acid solutions at the stated concentrations. The meristems were collected one hour after treatment and RNA extracted. Two hundred nanogram of RNA was used in semi-quantitative RT-PCR amplifications. The relative expression of CIL1 was determined through comparison of the optical density of ethidium bromide stained PCR products of CIL1 with actin. Three replicates were conducted per treatment. Error barrepresent the standard error of the mean.
0.00
0.20
Concentration of ABA (μM)
0.40
1.60
1.80
Untreated 1 10 100
Rel
ativ
e Ex
pres
sion
0.60
0.80
1.00
1.20
1.40
2.00
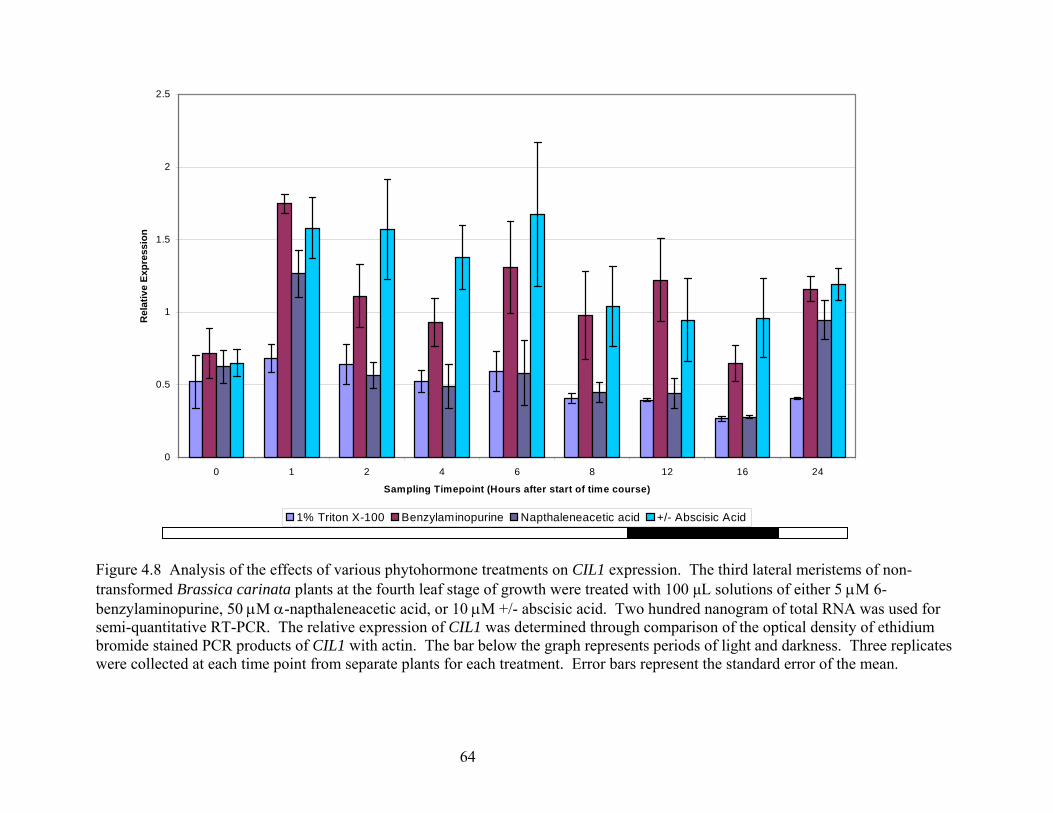
Figure 4.8 Analysis of the effects of various s on CIL1 expression. The third lateral meristems of non-transformed Brassica carinata plants at the f h were treated with 100 μL solutions of either 5 μM 6-benzylaminopurine, 50 μM α-napthaleneacet scisic acid. Two hundred nanogram of total RNA was used for semi-quantitative RT-PCR. The relative exp rmined through comparison of the optical density of ethidium bromide stained PCR products of CIL1 periods of light and darkness. Three replicates were collected at each time point from separa ts ent. Error bars represent the standard error of the mean.
0
0.5
1
1.5
2
0 1
2.5
8 12 16 24
r start of time course)
Rel
ativ
e Ex
pres
sion
2 4 6
Sampling Timepoint (Hours afte
1% Triton X-100
phytohormone treatmentourth leaf stage of growtic acid, or 10 μM +/- abression of CIL1 was dete
with actin. The bar below the graph represents te plan for each treatm
Benzylaminopurine Napthaleneacetic acid
64
+/- Abscisic Acid
64

Similar to BAP and α-NAA, treatment with +/- ABA induced a rapid increase in
CIL1 expression. The transcript amounts remained above 0 h amounts throughout the 24-
hour period examined. Unlike the BAP and α-NAA treatments, there was no significant
decrease in CIL1 expression during darkness. These data revealed th
any of these three phytohormones induced a rapid increase in CIL1 expression. However,
the response to α-NAA was transient, whereas the responses elicited
were more sustained.
4.5 Copy Number Analysis of Selfed Antisense CIL1 Transgenic
Southern blot analysis was used to determine the copy numb f
the CIL1 antisense construct in the T3 and T4 generations of the trans
Genomic DNA from the transgenic plants was digested with NheI an
electrophoresed and the resulting fragments were transferred to a ny e
Southern blot was hybridized with a probe to the neomycin phospho )
gene that had been used as the transformation selection marker (Figu
hybridization signal of the DNA from the transgenic lines 2, 3, 6, 10, and 13 displayed a
similar intensity to the single copy NPT II hybridization signal. The
hybridization signal from line 5 suggests that it could contain f
cassette and line 11 likely contains between 5-7 copies of the cassett
the hybridization signal in the transgenic plant samples on the blot appears to be slightly
different than the plasmid controls. This is likely due to the much la A
that was loaded in these lanes and/or impurities in the samples. However, although the
hybridization signal for transgenic line 10 is weak, it appears to be lo
at treatment with
by BAP and ABA
B. carinata Plants
er of the insertion o
formed plants.
d PacI,
lon membrane. Th
transferase (NPT II
re 4.9A). The
intensity of the
ive copies of the
e. The location of
rger amount of DN
cated at a much
up to
65
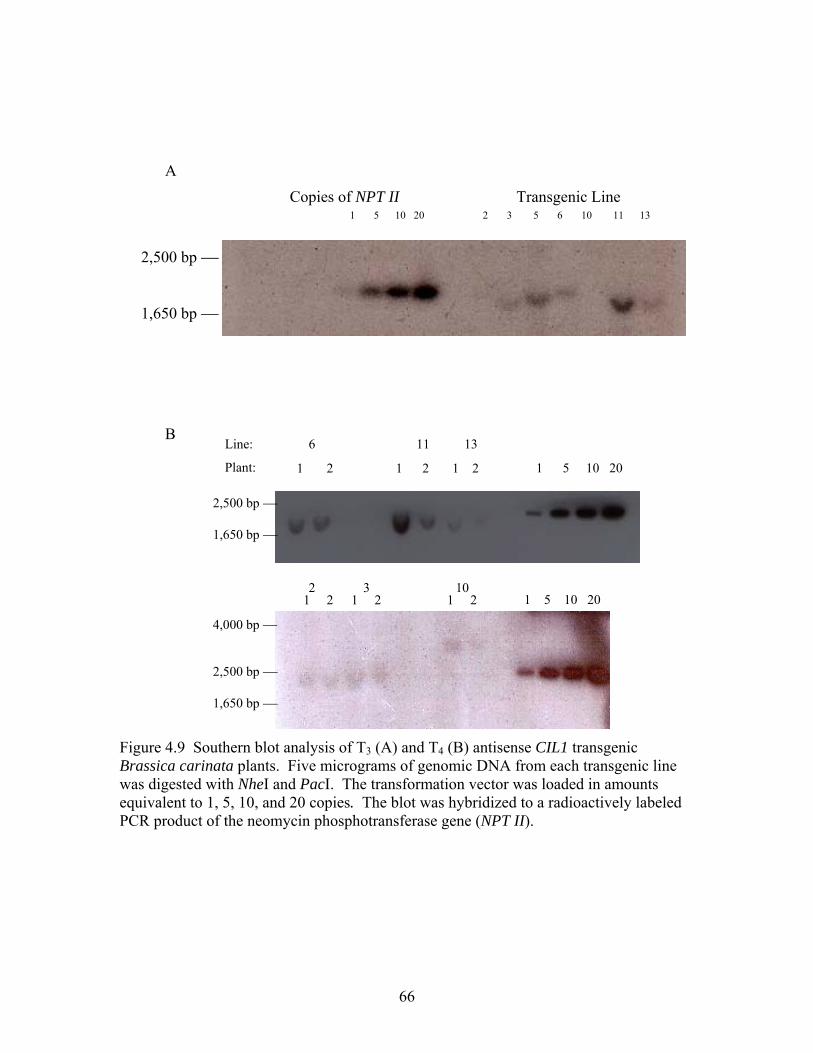
Figure 4.9 Southern blot analysis of T (A) and T (B) antisense CIL1 transgenic Brassica carinata plants. Five micrograms of genomic DNA from each transgenic line was digested with NheI and PacI. The transformation vector was loaded in amounts equivalent to 1, 5, 10, and 20 copies. The blot was hybridized to a radioactively labeled PCR product of the neomycin phosphotransferase gene (NPT II).
3 4
1 5 10 20 2 3 5 6 10 11 13
2,500 bp ⎯
A Copies of NPT II Transgenic Line
1,650 bp ⎯
Line:
Plant:
6 11 13
1 5 10 20 1 2 1 2 1 2 2,500 bp ⎯
4,000 bp
1,650 bp ⎯
⎯
2,500 bp ⎯ 1,650 bp ⎯
2 3 101 5 10 20 1 2 1 2 1 2
B
66

higher molecular size than the control or the other transgenic lines. This result suggests
at a rearrangement of the insert has occurred in this line.
ese data indicate that lines 2, 3, 6, 10, and 13 are possibly homozygous for the
IL antisense cassette in the T3 ge
nt e occurred in the progeny of the T3 plants, another Southern blot was
on ucted on DNA isolated from two T4 plants. The data from this Southern blot (Figure
.9B ly confirmed that transgenic lines 2, 3, 6, 10 and 13 were homozygous
r single copy insertion events. The higher molecular size of the DNA fragment
ybridizing to the probe in transgenic line 10 is more evident in this blot than the
reviou It app at tran nic line 11 was still s egating, showing one plant that
ontained appr ly 5 f the ca nd ther pl copies.
Therefore, the s single-insert transgenic lines 2, 3, 6, 10 and 13 were used for
all further analyses.
4.6 Analysis of Senescence in Antisense CIL1 Transgenic B. carinata
Initial visual observations suggested that the antisense CIL1 plants were slower to
senesce than the non-tr med plants. To examine this phenomenon in greater detail,
a senescence bioassay was conducted to measure the chlorophyll content of leaf discs
ttle difference in the chlorophyll breakdown was observed among the non-transformed
nd the antisense CIL1 transformed lines. Slightly elevated chlorophyll decay was
th
Th
C 1 neration. To confirm that no segregation of the
a isense cassett
c d
4 ) qualitative
fo
h
p s. ears th sge egr
c oximate copies o ssette a the o ant having 1-3
homozygou
ansfor
after a period of darkness (Figure 4.10). The bioassay was conducted twice, with three
biological replicates per line analysed each time. With the exception of transgenic line 3,
li
a
67

Figure 4.10 Chloroph
0
10
40
50
60
70
80
transformed
Tota
l Chl
orop
hyll
Con
tent
(mg/
L)
20
30
90
Non- 2 3 5 6 10 13
Line Examined
yll content in leaf discs of Brassica carinata non-transformed and antisense CIL1 transgenic plants. Leaf discs were incubated at room temperature in the
ark for 72 h prior to extraction. Three biological replicates were collected from each line, and two experiments were conducted for a total of 6 measurements per line. Error
d
bars represent the standard error of the mean.
68
observed in transgenic line 3. These results suggest that the observation of slower
enescence was not due to higher chlorophyll content in leaves.
.7 Phenotypic Characterization of Homozygous Antisense CIL1 Transgenic Plants
Initial observations also suggested that transgenic plants had larger leaves than the
on-transformed plants over the entire vegetative life cycle. To examine this
henomenon in greater deal, the phenotype was characterized by measuring the surface
rea of the leaves at various stages during the life cycle of the plants. Two experiments
ere conducted and eight biological replicates were taken during the first experiment,
nd four during the second (Figure 4.11). In the first experiment (Figure 4.11 A) at 5
ays after germination the leaves of the antisense transgenic line 2 showed little surface
rea difference compared to the non-transformed. In contrast, leaf surface area of
ained so for the remainder of the
experiment. The mean leaf surface area of transgenic line 5 remained smaller than that of
the non-transformed line throughout the experiment. Transgenic lines 3 and 10 mean leaf
surface areas were less than the non-transformed line at all measurements except the final
one, 20 days after germination, where they were comparable to non-transformed mean
leaf surface area. In the second experiment (Figure 4.11 B), the mean leaf surface area of
the transgenic lines was less than the non-transformed at 12 days after germination but
s
4
n
p
a
w
a
d
a
transgenic lines 3, 5, 10, and 13 were smaller than the non-transformed. Five days later
the trend was unchanged for lines 2, 3, 5 and 10. The mean leaf surface area of lines 2
and 13 was similar to non-transformed and rem
69

0
600
70
100
200
0
1 5 10 15 20
Days After Germination
L
30
40
500
Mea
nea
f Sur
face
(cm
2 )
0
Are
a
Non-transformed 2 3 5 10 13
0
200
1000
1200
1400
1 4 12 15 18 23 28
Lrf
ace
Are
a (c
m2 )
400
600
800
Days After Germination
Mea
nea
f Su
Non-transformed 2 3 5 6 10 13
Figure 4.11 Analysis of leaf surface area of non-transformed and transgenic antisense
4.11 B
CIL1 Brassica carinata plants. Leaf surface area was measured for each leaf for each plant, the results were summed, and a mean for the replicates was calculated. A. First experiment examining leaf size, with 8 biological replicates per line. B. Second experiment examining leaf size, with 4 biological replicates per line. Error bars represent the standard error of the mean.
4.11 A

was nearly comparable 3 days later and remained so for another 8 days. At that time
transgenic lines 2, 6 and 13 started to show slightly greater mean leaf surface area than
the leaves of the non-transformed and continued so throughout the rest of the experiment.
A large degree of variation of leaf mean surface area was observed over the two
experiments (Figure 4.11 A, B), despite using the same growth conditions, soil, and seed
for each experiment. The cause of the initial observation of significantly greater leaf
surface area for the transgenic lines is unknown, however, it may be attributable to
planting density. The transgenic plants produced larger leaves and exhibited a
pronounced release of apical dominance with a plant density less than 3 seeds/cm2, while
the non-transformed plants were unaffected by plant density.
Additional phenotypic variations of antisense CIL1 transgenic plants in
comparison to non-transformed were observed; plants of all transgenic lines produced
multiple leaves at one node demonstrating a release of apical dominance (Figure 4.12),
formed true leaves at the cotyledon axils (Figure 4.13), and generated lateral florets at
any node on the plant, down to the soil level (Figure 4.14). In contrast, the non-
transformed B. carinata plants did not exhibit any of these phenotypes. All the
homozygous transgenic lines exhibited these phenotypes to varying degrees, although
line 6 produced these phenotypes at the greatest frequency and to the highest degree.
While line 10 produced very elongated, ovate first leaves at 15 days after germination
(Figure 4.15). Additional leaf production was observed to be dependent on plant density.
Lateral meristem leaf growth, but not lateral inflorescence growth in transgenic plants
was inhibited at a planting density of greater than 3 seeds/cm2. The planting density of
71
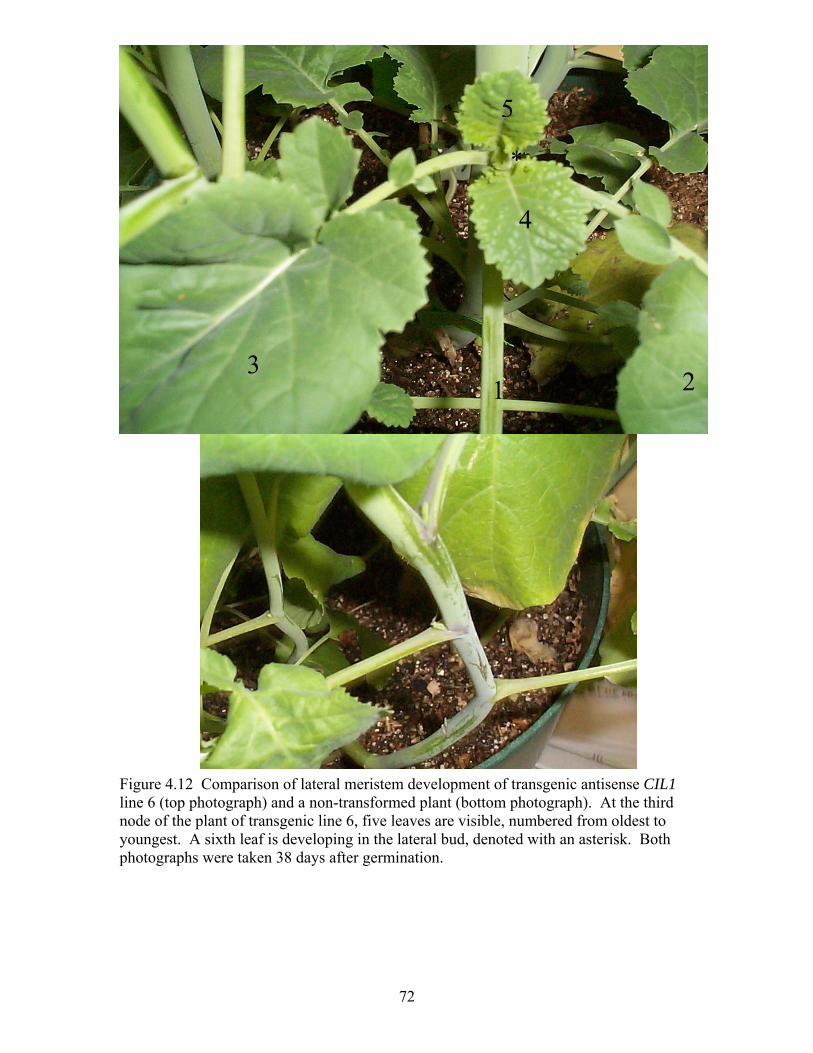
72
Figure 4.12 Comparison of lateral meristem development of transgenic antisense CIL1
node of the plant of transgenic line 6, five leaves are visible, numbered from oldest to
photographs were taken 38 days after germination.
line 6 (top photograph) and a non-transformed plant (bottom photograph). At the third
youngest. A sixth leaf is developing in the lateral bud, denoted with an asterisk. Both
1 3
4
2
5
*

**
Figure 4.13 Photograph of a plant from transgenic antisense CIL1 line 6 demonstrating a release of apical dominance, as well as the differentiation of true leaves at the cotyledon xils. The cotyledon axils are marked with asterisks while the additional leaf present is enoted with an arrow. A senescent cotyledon is visible just below the left true leaf at the otyledon axil.
adc
73

Figure 4.14 Comparison of branching of transgenic antisense CIL1 line 2 (left
photograph) and non-transformed Brassica carinata (right photograph). The arrow on the left panel marks the basal-most lateral inflorescence, while the arrow on the right panel shows the absence of any inflorescences at the same position on the non-transformed plant.
74

Figure 4.15 Comparison of leaf m nd vasculature unique to transgenic antisense CIL1 line 10 (left photograph) with a non-transformed plant (right photogra ormal first leaves from line 10 are marked with asterisks, while the non-transformed first leaves are denoted with 15 days after germination.
*
*
*
*
*
orphology aph). The abn
a “0”. Photographs were taken
75
0 0
0
0
75

the non-transformed plants did not affect lateral meristem leaf growth, or lateral
inflorescence growth. Brassica carinata produces leaves with rnate phyllotaxy,
and this phyllotaxy was maintained in the production of additional leaves by the antisense
CIL1 transgenic lines. Although NPTII hybridization was not observed in the T4 plants of
transgenic line 5 using Southern blot analysis, the line displaye ansgenic
phenotype, and was positive for the presence of the NPTII and se CIL1 genes as
determined by PCR analyses.
A comparison was made between the phenotype of the antisense CIL1
transformed B. carinata and the A. thaliana cytokinin mutant supershoot. The
supershoot mutant displayed an increase in axillary leaf production during the vegetative
stage and a vast increase in secondary inflorescence proliferati the reproductive
phase. However, in contrast to the antisense CIL1 transformed ta, the
homozygous supershoot plants were small, infertile, and senes later than wild
type Columbia A. thaliana (Personal Observation).
4.8 Real-Time Quantitative RT-PCR Analysis of Homozygous Antisense CIL1
Transgenic Plants
Real-time quantitative RT-PCR (qRT-PCR) was used to analyse the expression of
CIL1 in homozygous antisense plants. Multiplex reactions cou performed since
only one dye was used to track the products of the qRT-PCR re herefore, the
CIL1 and actin (BcAct) primer sets were used in separate ampl actions.
an alte
d the tr
antisen
on during
B. carina
ced much
ld not be
actions. T
ification re
76

4.8.1 Test of Primer Efficiency
To calculate expression, the ΔΔCT method was used. This method combines the
data from two different data sets (CIL1 and BcAct) and compares the change in the
threshold cycle to a normalized threshold cycle (the non-transformed samples).
One caveat of this method is that the primers must amplify with a similar efficie
(Livak and Schmittgen, 2001).
Primer efficiencies were
ncy
tested with RNA from 31-day old non-transformed roots.
at the
igure 4.17. It is evident that not
nly does the effect of the antisense construct vary from one transgenic line to another
ic
rly 1.8-fold more CIL1 transcript, respectively, than the
imilar to leaves, in the lateral meristems of lines 6 and 13 the expression of CIL1 was
ss than in non-transformed plants. The greatest effect of the antisense construct on
As seen in Figure 4.16 the slope of the line was negative 1.4x10⁻³, indicating th
primers amplified with very similar efficiencies.
Based on the recommendation in the QuantiTect SYBR Green RT-PCR Kit
(Qiagen, Hilden, Germany) 250 ng of RNA was used in all the reactions.
4.8.2 Analysis of Samples
The results of the qRT-PCR are presented in F
o
but also from one plant organ to another. The leaves of 31-day old plants from transgen
lines 3 and 10 had 4-fold and nea
non-transformed plants. However, transgenic lines 6, 13 and possibly 5 had slightly less
and line 2 nearly the same amount of CIL1 mRNA as in leaves of the non-transformed
plants. Greater expression of CIL1 in comparison to non-transformed plants was also
found in the lateral meristems of 29-day old plants of transgenic lines 2, 5, and 10.
S
le
77
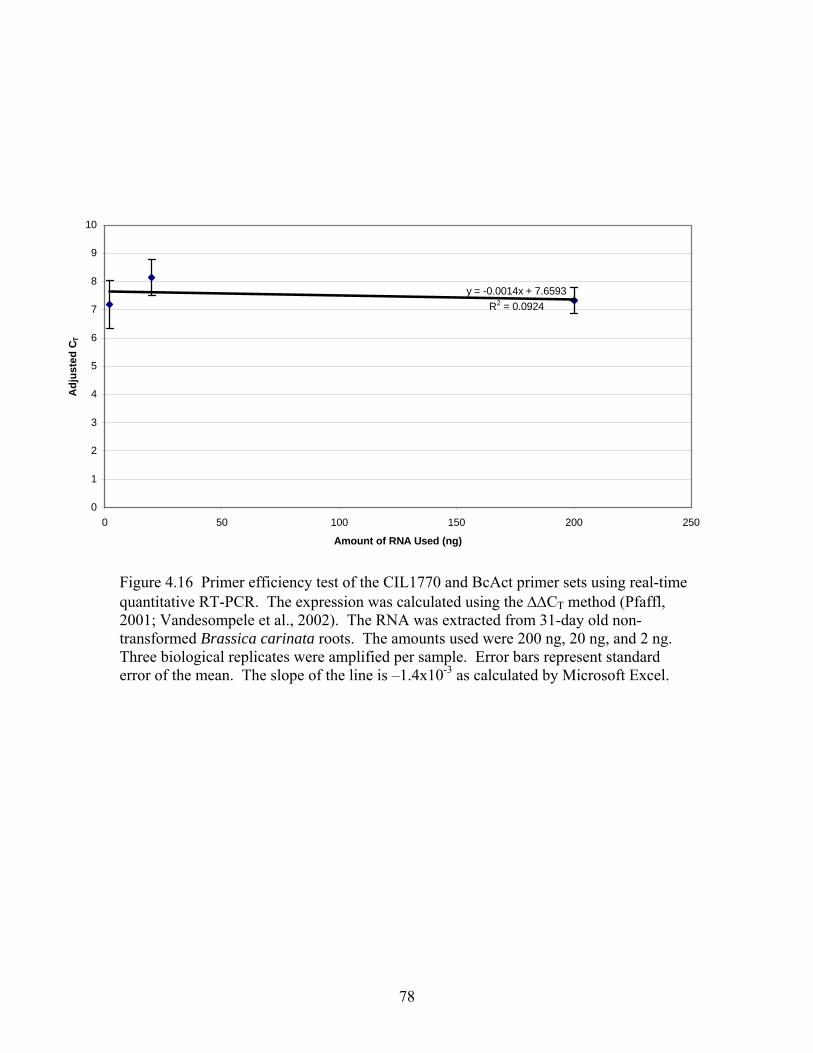
y = -0.0014x + 7.6593R2 = 0.0924
0
1
2
3
4
5
6
7
8
9
10
0 50 100 150 200 250
Amount of RNA Used (ng)
Adj
uste
d C T
Figure 4.16 Primer efficiency test of the CIL1770 and BcAct primer sets using real-tim
2001; Vandesompele et al., 2002). The RNA was extracted from 31-day old non-
Three biological replicates were amplified per sample. Error bars represent standard -3
e quantitative RT-PCR. The expression was calculated using the ΔΔCT method (Pfaffl,
transformed Brassica carinata roots. The amounts used were 200 ng, 20 ng, and 2 ng.
error of the mean. The slope of the line is –1.4x10 as calculated by Microsoft Excel.
78
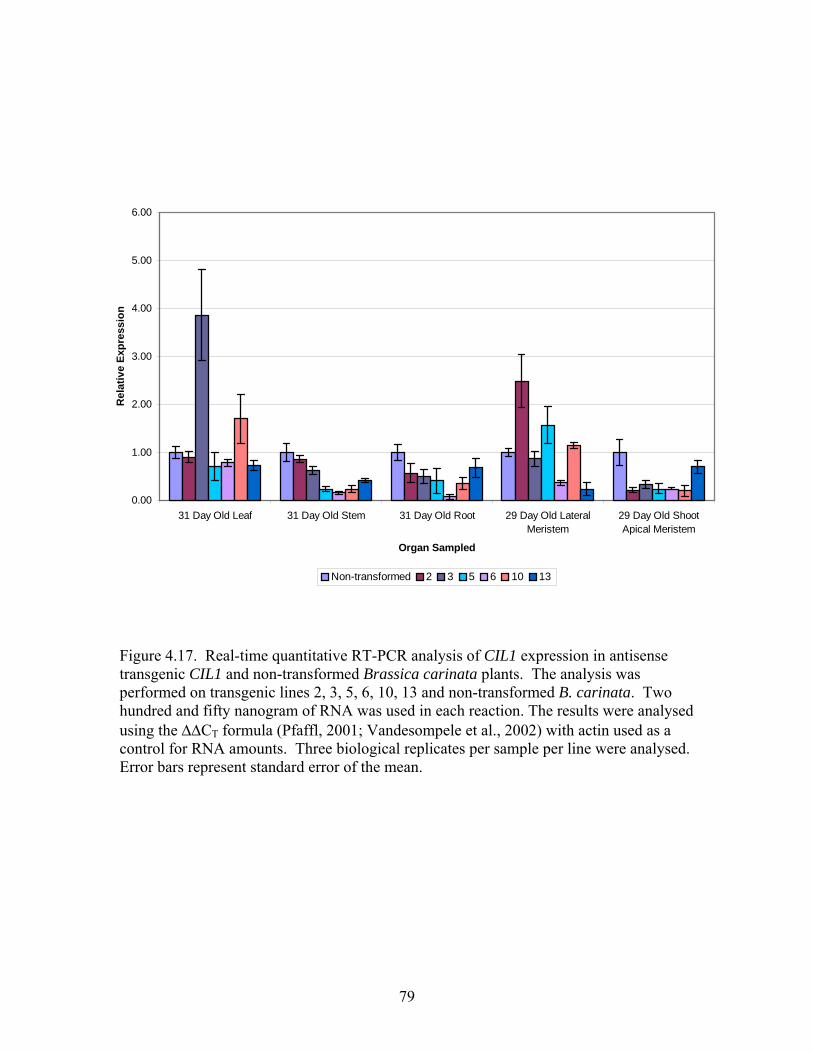
Figure 4.17. Real-time quantitative RT-PCR analysis of CIL1 expression in antisensetransgenic CIL1 and non-transformed Brassica carinata plants. The analysis was
0.00
1.00
2.00
3.00
4.00
5.00
6.00
31 Day Old Leaf 31 Day Old Stem 31 Day Old Root 29 Day Old LateralMeristem
29 Day Old ShootApical Meristem
Organ Sampled
Rel
ativ
e Ex
pres
sion
Non-transformed
erformed on transgenic lines 2, 3, 5, 6, 10, 13 and non-transformed B. carinata. Two hundred and fifty nanogram of RNA was used in each reaction. The results were analysed
sing the ΔΔCT formula (Pfaffl, 2001; Vandesompele et al., 2002) with actin used as a control for RNA amounts. Three biological replicates per sample per line were analysed.
rror bars represent standard error of the mean.
p
u
E
2 3 5 6 10 13
79
transcript amount in transgenic lines was observed in the shoot apical meristem with
pproximately 5-fold reductions for all but line 13. Correlating with the degree of
ansgenic phenotype observed, the 29-day old lateral meristem from transgenic line 6
ad the least amount of CIL1 transcript. However, the greatest reduction in transcript in
is line was seen in the root with 8% CIL1 mRNA present compared to non-transformed
lants. In the 31-day old stem, lines 3, 5, 6, 10, and 13 all had smaller amounts of CIL1
mRNA compared to line 2 and the non-transformed line. In the shoot apical meristem, all
the transgenic lines except for line 13 had a vast reduction in CIL1 mRNA amount, while
line 13 was slightly reduced in comparison to the non-transformed line.
.9 Analysis of Phytohormones in Homozygous Antisense CIL1 Transgenic Plants
Reversed phase HPLC with tandem MS coupled with electrospray ionisation was
sed to analyse the phytohormones present in non-transformed and antisense CIL1
ansgenic B. carinata. For these analyses, three biological replicates of the root, stem,
rst leaf, lateral meristem, and shoot apical meristem were analysed. Lateral meristem
,
OH-ABA, ABA-GE, PA, DPA, and neo-
PA. For the plant material examined, only IAA (Figure 4.18), ZR (Figure 4.19), ABA
(Figure 4.20), and DPA (Figure 4.21) were quantified with reproducible results. For the
other phytohormones examined, either the amounts were below the limit of detection, or
quantification, or they were very inconsistent among the replicates.
a
tr
h
th
p
4
u
tr
fi
samples collected from transgenic plants were phenotypically equivalent to non-
transformed plants and were collected prior to the development of the “multiple leaf”
phenotype. The phytohormones examined over the course of this experiment were IAA
IAAsp, Z, ZR, 2iP, IPA, DHZ, DHZR, ZOG, 7’-
80
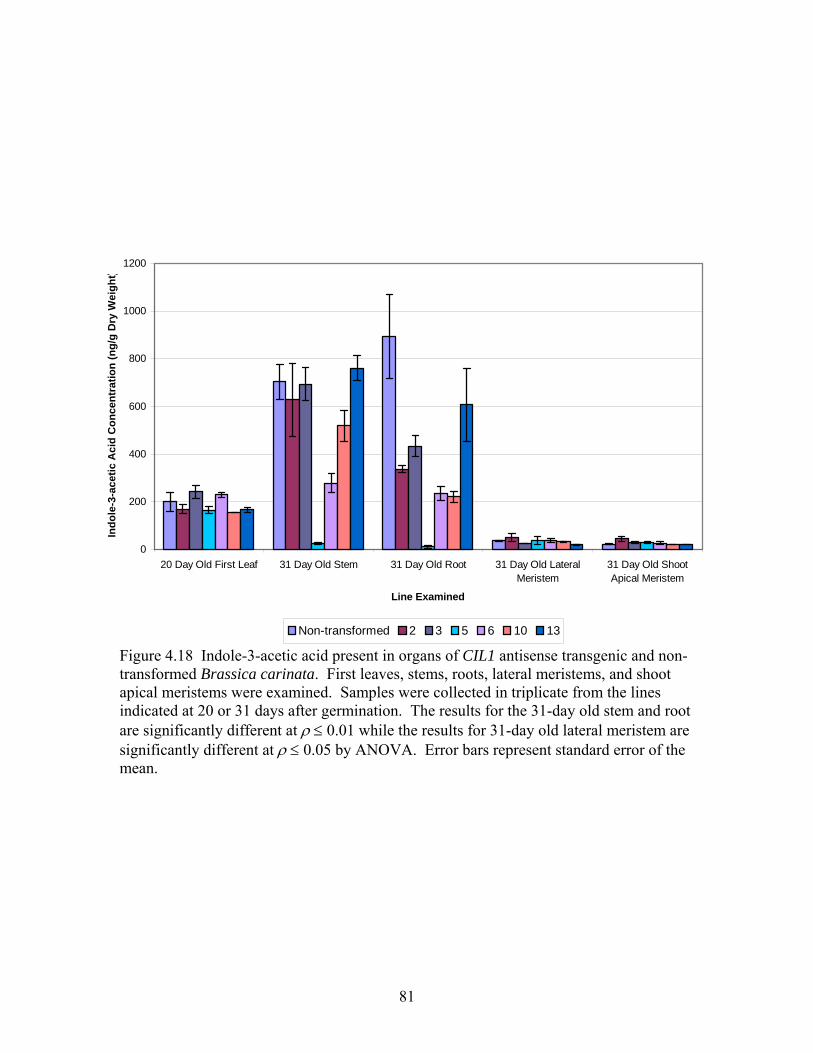
Figure 4.18 Indole-3-acetic acid present in organs of CIL1 antisense transgenic a
apical meristems were examined. Samples were collected in triplicate from the lines
are significantly different at ρ ≤ 0.01 while the results for 31-day old lateral meristem are
mean.
nd non-transformed Brassica carinata. First leaves, stems, roots, lateral meristems, and shoot
indicated at 20 or 31 days after germination. The results for the 31-day old stem and root
significantly different at ρ ≤ 0.05 by ANOVA. Error bars represent standard error of the
0
Meristem Apical Meristem
200
400
1000
20 Day Old First Leaf 31 Day Old Stem 31 Day Old Root 31 Day Old Lateral 31 Day Old Shoot
Line Examined
Indo
le-3
-ace
tic A
cid
Con
cent
ratio
n (n
g/g
Dry
Wei
ght
600
800
1200
)
Non-transformed 2 3 5 6 10 13
81

igure 4.19. Zeatin riboside present in organs of transgenic antisense CIL1 and non-
transformed Brassica carinata. First leaves, stems, roots, lateral meristems, and shoot pical meristems were examined. Samples were collected in triplicate from the lines
indicated at 20 or 31 days after germination. The data were logarithmically adjusted to
al
0
5
1
1.5
2
5
3
5
4
5
5
21-Day Old First Leaf 30-Day Old Stem 30-Day Old Root 30-Day Old LM 30-Day Old SAM
Organ Examined
Loga
rithm
ical
ly A
djus
ted
Zeat
in R
ibos
ide
Con
cent
ratio
n
4.
3.
(ng/
g D
ry W
eigh
t)
2.
0.
Non-transformed
F
a
stabilise the variance. The results for 20-day old first leaf, 31-day old stem, and 31-day old root are significantly different at ρ ≤ 0.01 while the results for 31-day old shoot apicmeristem are significantly different at ρ ≤ 0.05 by ANOVA. The data for 31-day old lateral meristem were not significantly different among the samples using ANOVA. Error bars represent standard error of the mean.
2 3 5 6 10 13
82

Figure 4.20 Abscisic acid present in organs of transgenic antisense CIL1 and non-transformed Brassica carinata. First leaves, stems, roots, lateral meristems, and shoot apical meristems were examined. Samples were collected in triplicate from the lines indicated at 20 or 31 days after germination. Data from the 20-day old first leaf, 31-day old root and lateral meristem are significantly different at ρ ≤ 0.01 while the stem datasignificantly different at ρ ≤ 0.05 by ANOVA. Error bars represent standard error of mean.
0
500
1000
1500
2000
2500
3000
3500
20 Day Old First Leaf 31 Day Old Stem 31 Day Old Roots 31 Day Old LateralMeristem
31 Day Old ShootApical Meristem
Line Examined
Abs
cisi
c A
cid
Con
cent
ratio
n (n
g/g
Dry
Wei
ght)
Non-transformed 2 3 5 6 10 13
is the
83

Figure 4.21 Dihydrophaseic acid present in organs of transgenic antisense CIL1 and non-transformed Brassica carinata. First leaves, stems, roots, lateral meristems, and shoot
s
tly t
apical meristems were examined. Samples were collected in triplicate from the lineindicated at 20 or 31 days after germination. Data from the 20-day old first leaves is significantly different at ρ ≤ 0.01 while the 30-day old stem and root data is significandifferent at ρ ≤ 0.05 using ANOVA. Data from the 31-day old lateral meristem and shooapical meristem samples were not significantly different among the samples using ANOVA. Error bars represent standard error of the mean.
0
2000
4000
6000
8000
10000
12000
14000
16000
18000
20000
20 Day Old First Leaf 31 Day Old Stem 31 Day Old Root 31 Day Old LateralMeristem
31 Day Old ShootApical Meristem
Line Examined
Dih
ydro
phas
eic
Aci
d C
once
ntra
tion
(ng/
g D
ry W
eigh
t)
Non-transformed 2 3 5 6 10 13
84

Only small differences in IAA concentration that were not statistically significant as
etermined by ANOVA were observed in the first leaves among the non-transformed and
e antisense transgenic lines (Figure 4.18). A significantly lesser concentration of IAA
ρ ≤ 0.01) was present in the stem in transgenic lines 5, 6, and 10 compared to the non-
transformed plants. These data are proportional to the CIL1 expression data (Figure
4.17). The IAA concentration in roots was also significantly less (ρ ≤ 0.01) in transgenic
lines 2, 3, 5, 6, and 10 compared to non-transformed plants. Similar to the stem, these
data directly correlated to CIL1 expression observed in roots of transgenic versus non-
transformed plants. In lateral meristems, transgenic lines 3 and 13 had significantly
(ρ ≤ 0.05) less IAA than the non-transformed plants. The IAA concentration in the shoot
apical meristem appeared greater in transgenic lines 2, 3, and 5 compared to the non-
ansformed plants while it was slightly less in lines 10 and 13. These data did not
orrelate with the highly reduced CIL1 expression observed in the shoot apical meristem
in the
rst leaf did differ significantly (Figure 4.19) with ANOVA (ρ ≤ 0.01). Transgenic lines
, 5 and 6 had slightly greater amounts while lines 3, 10 and 13 had lesser amounts than
e non-transformed plants. The amount of ZR in 31-day old stems was highly variable
mong the transgenic lines. In comparison to the non-transformed, the ZR concentration
transgenic lines 2, 3, 6 and 10 was significantly (ρ ≤ 0.01) less, in line 5 it was slightly
less and in line 13 it was slightly greater. In 31-day old roots, all the transgenic lines had
d
th
(
tr
c
in the transgenic plants (Figure 4.17).
There was a large degree of variation in the ZR data that interfered with the
ANOVA. Therefore, the ZR data were transformed to logarithmic values and ANOVA
was used to determine the significance within the data. The amount of ZR present
fi
2
th
a
in
85

significantly less ZR (ρ ≤ 0.01) compared to the non-transformed plants. In 31-day o
lateral meristems, the observed differences in ZR concentration were not found to be
significant by ANOVA. In the shoot apical meristem the ZR content was dramatically
increased (ρ ≤ 0.05) in all the transgenic lines compared to the non-transformed plants.
The ABA content in the first leaf, with the exception of transgenic line 6, was
significantly less in the antisense CIL1 lines compared to the non-transformed line. The
results were more variable for the ABA content measured in 31-day old stems.
Transgenic lines 5 and 6 had similar concentrations to the non-transformed line, line 3
had much less ABA, while lines 2, 10 and 13 had more ABA in the stems than the no
transformed line (Figure 4.20). These differences were statistically significant (ρ≤ 0.05).
The pattern of ABA content was more consistent in the roots of the transgenic plants
was seen in the stems. Here the amount of ABA was significantly less (ρ≤ 0.01) in a
transgenic lines compared to the non-transformed plants. With the exception of
transgenic line 5, the ABA content was
ld
n-
than
ll the
also significantly less (ρ≤ 0.01) in the lateral
eriste cal
-
m ms of the transgenic lines compared to the non-transformed. In the shoot api
meristem, the concentration of ABA was less in all transgenic lines compared to the non
transformed line, however, the differences were not statistically significant by ANOVA.
The amount of the ABA metabolite, dihydrophaseic acid (DPA), present in the
first leaves of the antisense CIL1 transgenic lines was not consistent (Figure 4.21).
Transgenic line 6 had significantly less DPA while transgenic lines 3 and 10 had more
(ρ≤ 0.01) and lines 2, 5 and 13 had approximately the same amount as the non-
transformed plants. In the stem, with the exception of line 5, all the transgenic lines had
significantly less (ρ≤ 0.05) DPA than the non-transformed. Considerably less DPA was
86
also found in the roots of all of the transgenic lines (ρ≤ 0.05) compared to the non-
transformed. These results correlate well with the CIL1 expression data. For the later
meristems, only transgenic line 10 had a consistently higher amount of DPA compared t
the non-transformed plants. Much the same results were seen for the shoot apical
m m, with only transgenic line 13 having a consistently greater amount of DPA th
the non-transformed line. However, the differences observed in the lateral and shoot
meristems were not statistically significant by ANOVA.
4.9.1 Effect of the Antisense Transformation on the IAA:ZR Ratio
To compare the change in auxin:cytokinin in the transgenic plants versus the
non-transformed plants, the IAA:ZR concentration ratio was calculated in each organ
(Table 4.1). In the first leaf, the transgenic lines 2, 5 and 13 had slightly reduced IAA:ZR
ratios while lines 3, 6 and 10 had greater ratios than non-transformed plants. The
results roughly correlate with CIL1 expression observed in this organ (Figure 4.17). I
the 31 day-old stem, transgenic lines 2, 6, and 10 had a ratio of IAA:ZR of 8, 7, and 5
times as large as the non-transformed ratio, respectively, while lines 3 and 13 were
similar to the non-transformed in IAA:ZR ratio. Line 5, on the other hand, had a ratio 21
al
o
eriste an
se
n
mes s
with
was
ti maller than the non-transformed IAA:ZR ratio. All the transgenic lines had
reduced IAA:ZR ratios in the root compared to the non-transformed correlating well
the reduced CIL1 expression observed there. In the lateral meristem, transgenic lines 3,
5, 6 and 13 had slightly reduced IAA:ZR ratios, line 10 was the same and line 2
slightly greater than the non-transformed plants. Similar to the root, consistant reductions
in the transgenic shoot apical meristem IAA:ZR ratio were also observed with reductions
87
Table 4.1 Ratio of IAA:ZR in non-transformed and transgenic antisense CIL1
Brassica carinata plants.
IAA
(ng/g Dry Weight)
First Leaf Stem Root Lateral Shoot
Meristem Concentration Meristem Apical
Non-Transformed 199 703 895 38.2 23.3 Line 2 170 628 338 50.9 46.0 Line 3 243 694 434 24.9 29.5 Line 5 165 25.7 12.5 39.2 29.8 Line 6 230 278 236 38.5 27.0 Line 10 154 519 220 32.7 22.9 Line 13 166 761 607 20.6 22.3
ZR Concentration (ng/g Dry Weight)
Non formed 8.59 140 14.1 13.5 10.1 -Trans
Line 2 9.35 15.1 8.50 10.8 118
Line 3 8.15 228 20.2 15.6 195 Line 5 9.16 111 5.00 22.3 347 Line 6 8.71 8.00 12.0 22.3 172 Line 10 4.00 20.0 11.2 11.5 154 Line 13 9.07 203 16.3 10.0 201 Ratio of IAA:ZR Non-Transformed 23:1 5:1 63:1 3:1 2:1 Line 2 18:1 41:1 40:1 5:1 0.4:1 Line 3 29:1 3:1 21:1 2:1 0.15:1 Line 5 18:1 0.23:1 3:1 2:1 0.08:1 Line 6 26:1 35:1 20:1 2:1 0.16:1 Line 10 38:1 26:1 20:1 3:1 0.15:1 Line 13 18:1 4:1 37:1 2:1 0.11:1
88

ranging from twice as small in line 2 to 25 times as small in line 5.
89

5. DISCUSSION
The cDNA representing CIL1 of B. carinata was discovered in a screen for genes
expression of which was induced by copper chloride. Copper chloride is an abiotic
elicitor of the plant defense response. High concentrations of copper ions were shown to
increase membrane permeability, lipid peroxidation and cause breakdown of chlorophyll
and carotenoids (De Vos et al., 1992; De Vos et al., 1993; Luna et al., 1994). Copper
ions were also found to catalyze the production of active oxygen species and increase the
expression of antioxidant genes (De Vos et al., 1993; Luna et al., 1994; Baker and
Orlandi, 1995). Therefore, CIL1 may be involved with plant defense.
BLASTP analysis of the CIL1 cDNA ORF did not reveal high similarity to any
gene of known function. However, similarity to putative catecholamine binding domains
was found. The potential significance of this similarity will be discussed later. Since
similarity searching did not reveal a likely function for CIL1, an antisense construct was
made and used to transform B. carinata. Here it was discovered that decreasing CIL1
expression altered normal plant development. Specifically, some abnormal leaf
morphology and multiple leaf development from lateral meristems were observed. The
present study was undertaken to gain some understanding of the function of CIL1.
5.1 CIL1 Expression Analysis
CIL1 was constitutively expressed in all organs examined. This observation
suggests that the gene may have cellular maintenance as well as stress response functions.
90

Further, since the gene’s expression is not limited to meristematic tissue, a function
beyond shoot growth regulation is impl
t
A
thways of these
hormon n
oH
s
e and
epinephrine. These animal hormones are involved in the rapid response to stress.
plies a similarity between plants and animals in the
compo
However, no essential metabolic functions for CAs in plants have been assigned.
ied.
Although CIL1 was expressed constitutively, increases in expression correlated
with auxin, cytokinin and ABA treatment. Therefore, it may have a role in
interconnecting hormone response pathways. However, the pattern of gene induction
differed among the hormone treatments. The gene expression responded rapidly but
transiently to auxin. This observation may indicate that CIL1 must “reset” for frequen
response to changes in auxin content. Alternatively, the protein turnover rate may be
slow. The rapid and sustained induction of CIL1 expression after cytokinin and AB
treatment indicates that the gene also has a role early in the response pa
es. However, either its role in these pathways is more sustained than in the auxi
response pathway or the protein turnover rate may be faster under these circumstances.
5.2 Catecholamine Binding Domain and Putative CIL1 Function
The alignment conducted comparing the CIL1 amino acid sequence to DoH
amino acid sequences showed that CIL1 has similarities to these proteins. The D
domains are believed to bind or respond to CA. CAs are aromatic amines and among thi
group of compounds are the mammalian neurotransmitters dopamine, norepinephrin
Therefore, the induction of CIL1 im
unds that are involved in some stress responses.
Forty-four plant families are reported to contain CA (Smith, T.A. 1977).
91
Nonetheless, epinephrine and norepinephrine were found to promote flowering in
duckweed (Khurana et al., 1987), increase root length in Vigna unguiculata (Kaur and
Thurkr
o stimulate
it
etermination of the bovine dopamine-β-hydroxylase found that the N- and C- termini
within two interior
domain 69
IL1
t architecture and that it affects
ormon art of a
al, 1990), and promote growth in tobacco thin cell layer cultures (Protacio et al.,
1992). Additionally, epinephrine in micromolar concentrations was shown t
somatic embryogenesis in orchardgrass (Schenk and Hildebrandt, 1972). These data
provide precedent for the observation of altered plant development in antisense CIL1
transgenic lines.
Simple protein modeling of AIR12 by Verelst and Asard (2004) indicated that
may consist of a single membrane spanning domain at the N-terminus, with a DoH
domain on the outside of the plasma membrane at the C-terminal end. Further, AIR12 is
anchored to the membrane by glycosylphosphatidylinositol (Borner et al., 2003). The
similarity of CIL1 to AIR12 suggests that it has a similar structure. Structural
d
exist close to one another and are extracellular while the active site is
s stabilized by disulfide bonds (Robertson et al., 1994). Since CIL1 is only 2
amino acids (aa) in length compared to the 603 aa of bovine DoH, it is doubtful that C
has the same function. CIL1, AIR12, and BAB09428 all lack the CB, which enables the
conversion of DA to E. The absence of the CB likely limits these proteins to interactions
with CAs. However, although there is no precedent for CA binding and CB being
separately encoded, it is possible.
It is clear that CIL1 has a role in determining plan
h e content. CIL1 may be a CA sensor located in the plasma membrane as p
signal transduction pathway that ultimately connects to hormone pathways. Prior
92
research on the interactions between CAs and phytohormones has demonstrated tha
can influence one another.
5.3 Possible Interactions of CIL1 with Hormones
Peroxidase assays that examined the effect of CAs on IAA activity showed tha
they inhibit IAA degradation by the enzyme IAA oxidase (Protacio et al., 1992). In th
IAA profile of the
t they
t
e
antisense CIL1 plants at least half of the transgenic lines had less IAA
the f
this
A
oughly
predominant control of the oxidase activity resides in
effect
in irst leaf, stem, roots, and lateral meristems then the non-transformed plants. If
reduced CIL1 expression results in reduced CA perception than one consequence of
might be increased IAA oxidase activity. It would follow that IAA content would
decrease as was seen in the transgenic lines. The transgenic line-to-line variation in IA
content seen in first leaf, stem, roots and to a lesser extent in lateral meristems r
parallels CIL1 expression data. The exception to this trend was the apical meristem
where despite a drastic reduction in CIL1 expression in the transgenic lines there was
little difference in IAA content compared to non-transformed plants. These results
suggest that the rate and control of IAA biosynthesis in the shoot apical meristem could
be compensating for any increase in IAA oxidase activity. Alternatively, if the
catecholamines are synthesized and retained in the cells of the meristem, no external
sensor may be required. However, in that case what is the function of CIL1 in these
cells? Alternatively, it may be that
proteins other than CIL1 in the apical meristem.
The interaction of CAs with cytokinins is less clearly defined. Christou and
Barton (1989) found that octopamine was toxic to normal tobacco callus but had no
93
on crown gall tissues. The survival of the crown gall tissue was attributable to the
presence of isopentenyl transferase, the enzyme that catalyzes the first step in cytokinin
iosynthesis. In turn, addition of cytokinins to the callus before octopamine treatment
cytokinins and CAs are
,
R
that
d
d to
6
R
lt in increased or unchanged
b
prevented necrosis. The authors’ conclusion was that
antagonists. Therefore, if CA perception is decreased in antisense CIL1 transgenic lines
the amount of cytokinin might increase. Unfortunately, in this study the only reliably
detected cytokinin was ZR. Zeatin riboside is the main form of transported cytokinin
through the stem (Taiz and Zeiger, 1998). In the SAM, there was a large increase in Z
content in all transgenic lines compared to non-transformed plants. This inverse
relationship between CIL1 expression and ZR content would support the hypothesis
CA and cytokinins are antagonists. A very slight suggestion of an inverse relationship
between CIL1 expression and ZR content was also found in the first leaf. CIL1
expression in the leaves of transgenic lines 3 and 10 was greater than non-transforme
while the ZR content in line 10 was significantly less and in line 3 it appeared to be
slightly less. In turn, those transgenic lines with decreased CIL1 expression appeare
have slightly more ZR content. In stems, only line 13 showed an inverse relationship of
CIL1 expression and ZR concentration while in the lateral meristems lines 3 and
displayed this inverse relationship. No suggestion of antagonism between CIL1 and Z
content was found in roots. The similarity in ZR content between non-transformed roots
and transgenic lines 3, 6, 10, and 13 was not surprising given the lower IAA content also
observed in this organ, which might be expected to resu
cytokinin content. Overall, the results do not strongly support a role for CIL1 in
94

mediating CA and cytokinin antagonism. However, the relationship between CIL1
mRNA and protein amounts is unknown at this time.
There is little information available in the literature regarding interactions
between ABA and CAs, though one study showed that treatment with ABA act
initial steps of CA biosynthesis in potato tubers (Swiedrych et al., 2004). This result
implies a synergistic relationship between CAs and ABA. If this were the case one
would expect that decreased CA perception might correspond to decreased ABA conte
In first leaf, all but one of the transgenic lines did show reduced ABA content compared
to non-transformed. However, the qRT-PCR had indicated that CIL1 expression
3 and 10 was greater than in non-transformed plants at 31 days. Therefore, a conclusion
that CIL1 expression and ABA content are positively correlated in this organ cannot be
made. A similar case was seen in the lateral meristem. In stems, no correlation
expression and ABA content was observed. In the roots of transgenic plants the
reduction of CIL1 expression correlated well with reduced ABA content, suggesting
synergism. Alternatively, this result may have been due to the reduced IAA content also
seen in this organ. The auxin axr mutant displays reduced ABA signaling (Bianchi et al.,
2002). However, there was also a correlation of reduced CIL1 expression and reduc
ABA content observed in shoot apical meristem. Since the IAA content in this organ did
not differ significantly from transgenic to non-transformed plants, the alteration in ABA
cannot be attributed to it. Therefore, CAs and ABA may interact synergistically in some
plant organs.
Abscisic acid undergoes two forms of metabolism (Hirai et al., 2003). On
ivated the
nt.
in lines
of CIL1
ed
e
metabolic pathway involves a conjugation that can be either reversible or irreversible
95
(Kleczkowski and Schall, 1995). The other pathway for ABA metabolism involves
hydroxylation followed by spontaneous rearrangemen
an 8’
t to form PA and subsequent
plants.
d
, the antisense construct was not effective in significantly decreasing CIL1
express s
reduction to DPA. This metabolism was assessed in the antisense CIL1 transgenic
In first leaves, the DPA content was greater in transgenic lines 3 and 10 than in non-
transformed plants. These are also lines that had greater expression of CIL1 than non-
transformed. The implication of these data is that increased CA perception stimulate
ABA metabolism in this organ, suggesting CA and ABA antagonism. The DPA amounts
in the first leaf of the transgenic lines 3, 6 and 10 were also inversely correlated to ABA
amounts, which may infer that this was the predominant pathway for ABA metabolism in
the leaf. With the exception of transgenic line 5, DPA content in stems and roots of
transgenic lines was much reduced in comparison to non-transformed plants. Again the
results parallel the CIL1 expression data. No correlation of CIL1 expression and DPA
content was observed in lateral or apical meristems. Indeed, little variation from the DPA
content in non-transformed plants was observed in these organs in transgenic plants.
These inconsistencies preclude making any conclusion about an interaction of CIL1 and
ABA metabolism.
An overall examination of the relationship between CIL1 expression and ABA
concentration favors a view that there is synergism between CIL1 mRNA amount and
ABA biosynthesis.
Assessing the results on an organ-to-organ basis a number of conclusions can be
drawn. Firstly
ion in first leaf or lateral meristem. Therefore, it is not surprising that there i
little change in hormone content in these organs from transgenic to non-transformed.
96

Then the question arises as to why the phenotype associated with antisense CIL1 involves
the lateral meristem. The apparent contradiction may be attributable to the plant ma
selected for analysis. To obtain equivalent material from transgenic and non-transformed
plants, lateral meristems were excised before development of further leaves. Future
analysis should involve a time course study of hormone content to observe changes in t
material as secondary branching develops. The picture is equally confusing in the stem
and apical meristem. In stems, the three transgenic lines with the greatest reduction in
CIL1 expression only consistently showed reduced IAA. These data link CIL1 closest to
the auxin response pathway and suggest that a threshold exists above which increases in
CIL1 expression have little effect. The most logical conclusion is that CA perception
affects only the cell-to-cell transport of auxin and not its transport through phloem. The
most significant reduction in CIL1 expression was observed in the shoot apical meristem
The roots also displayed a consistent reduction in CIL1 expression, and this correlated
with a reduction in IAA, ZR, ABA, and DPA. Interestingly, no readily observable
phenotype accompanied this hormone reduction. Further, the ratio of IAA:ZR in various
organs of the transg
terial
he
.
enic lines varied widely from the non-transformed yet, with the
excepti
957) and support Eklöf et al.’s (1997) conclusion that individual
hormon ,
on of the secondary branching and some cotyledon distortion, the plants were
normal and fertile. These results run counter to the auxin:cytokinin ratio hypothesis of
Skoog and Miller (1
es may induce developmental pathways if critical values are exceeded. However
since our hormone profiling experiments did not detect all the types of auxin and
cytokinin molecules, we cannot conclusively state that the ratios of total auxins and
cytokinins differed significantly.
97

5.4 Phytohormone Profiling Error Sources and Problems
Tandem mass spectrometry utilizes two mass analysers to examine a previously
determined precursor ion that is mass-selected so that its ionization can be investigated
without interference from other ions formed during the ionization (Polce and
Wesdemiotis, 2002). This mass spectrometry utilizes three quadrupole mass analysers,
each with different roles. The first quadrupole mass analyser detects the parent ion,
examining a particular mass to charge ratio (m/z). Ions matching the predetermined m/z
pass through to the second quadrupole, which acts as the collision cell. In the collision
cell, the parent ions are subjected to CID by bombardment with the inert gas, argon. The
bombardment fragments the parent ion into daughter ions that proceed to the third
quadrupole mass analyser. In the third quadrupole the daughter ions matching the
predetermined m/z pass through the quadrupole and are detected with a photomultiplier
detector. Multiple reaction monitoring was utilized in this study. In this technique the
transition from parent to daughter ion is observed, greatly increasing the accuracy an
reproducibility of the equipment when impure samples are used (Waters, 2003).
The method of phytohormone profiling used in this study represents a power
technique that is flexible enough to measure a wide range of metabolites while retainin
specificity, accuracy, and precision (Chiwocha et al., 2003). Although this is a powerfu
technique, it is in its infancy, and is prone to several failings that affected the results in
this study. The method was initially designed to optimize extraction of ABA and its
metabolites in A. thaliana and Lactuca sativa seedlings. To facilitate the extractio
quantification of cytokinins and auxins, the aqueous content of the extraction solutio
HPLC conditions were adjusted, h
d
ful
g
l
n and
n and
owever, only 1 out of the 7 possible forms of cytokinin
98
could be quantified consistently. Recovery standards for ABA were used to determine
f
are not
move
ed
n
hree-
t
use
s
the accuracy and precision of detection of the phytohormones. The use of recovery
standards in conjunction with the internal standards allowed for an accurate calculation o
the extraction efficiency of samples. Unfortunately, as yet, recovery standards
available for cytokinins, auxins, or gibberellins. Additionally, it was found that
components in the Brassica extracts suppressed the MS signal from a number of the
phytohormones. Some success in dealing with the interference was achieved when the
chromatography time was increased from 40 min to 60 min resulting in an increase in
chromatography resolution. Further, a higher aqueous concentration was used to increase
the resolution of the polar cytokinins and a hexane-partitioning step was added to re
non-polar compounds. However, the hexane partitioning may have in itself decreas
phytohormone recovery with losses in the interfacial layer. The extraction method needs
to be modified further to optimize recovery of the auxins and cytokinins.
The lateral meristem and shoot apical meristem samples were analysed later tha
the first leaf, stem, and root. Equipment failure and scheduling problems led to a t
month delay in sample analysis. The long-term storage may have caused the loss of
signal from the deuterated internal standards since only 1/20 of the originally added
amount was detected. Consequently, a large degree of sensitivity was lost and in most
cases, the signal was too small to generate reliable results. The only phytohormones tha
could be quantified with reliable results were IAA, ZR, ABA, and DPA. Through the
of calibration standards an estimate of the amounts of phytohormones in these organs wa
calculated. Thus, the results presented for the lateral and shoot apical meristems
99
represent an extrapolation of the data based on the calibration curve. More precise results
will require the preparation of new samples.
5.5 Possible Modes of Action of CAs/ CIL1 in Plants
As discussed earlier, CAs inhibit IAA oxidase activity, therefore, CIL1 as
sensor could have a role in maintaining auxin content. Consequently, CIL1 would ha
role in suppressing leaf development. Additionally, exogenous application of dopamine
was found to stimulate ethylene biosynthesis (Elstner et al., 1976). Ethylene is propose
to have a role in inhibiting development of leaf primordia through reducing the
expression of the KNAT2 transcription factor (Vandenbussche and Van Der Straeten,
2004). In higher planting densities the multiple leaf phenotype of the CIL1 antisense
transgenic lines was suppressed. Perhaps under these conditions an above threshold
amount of ethylene was accumulated.
a CA
ve a
d
t
sts.
Further, he demonstrated that the membrane-binding constants for CAs were similar to
However, Kamisaka (1979) found that epinephrine acted synergistically with GA
to stimulate hypocotyl elongation. The suggestion of these combined findings is that
CAs are another component of the complex and finely-tuned network of pathways tha
control plant development.
There are several publications that provide evidence for the existence of CA
receptors in plants. In 1987, Khurana et al. reported that the β-adrenergic blocking agent,
propranolol, inhibited flowering in duckweed. The inhibition could be relieved with
epinephrine. Later, Roshchina (1989, 1990) found that dopamine, epinephrine and
norepinephrine regulated ion permeability and photophosphorylation of chloropla
100

known adrenoreceptors in mammals. In the mouse telencephalon, dopamine and its’
receptors D1 and D2 have roles in controlling cell proliferation and differentiation.
opamine apparently exerts this control through modulating the cell cycle (Ohtani et al.,
opamine binds, the G1 to S-
phase t n
lo et al.,
es
considered the equivalent of D1 and D2-type
recepto
e
centrations at which they act must be established.
nt
nd
D
2003). Interestingly, dependent on the receptor to which d
ransition is either inhibited (D1) or stimulated (D2). Therefore, it is the distributio
of the two receptors that determines the response of the cell. Binding of dopamine to the
D1 receptor on cells in the ventricular zone decreases DNA synthesis and promotes
neuronal differentiation, while binding to the D2 receptor on cells in the subventricular
zone increases DNA synthesis and stimulates glial precursor proliferation (Popo
2004). A similar model might be suggested for plants with CIL1 functioning in
maintaining meristematic tissue. Analysis of the A. thaliana genome revealed two gen
consisting only of putative CA-binding domains, AIR12 and BAB09428 (Verelst and
Asard, 2004). These proteins could be
rs. If this scenario is correct than CAs in plants have a direct role in determining
plant architecture rather than simply mediating phytohormone responses, in which cas
they themselves should be considered to be phytohormones. However, organ sensitivity
to CAs and endogenous con
5.6 Comparison of Antisense CIL1 Plants to Plant Architecture Mutants
The antisense CIL1 transgenic plants have similarities to several auxin-deficie
mutants. The dad1-1 mutant of petunia has greatly increased secondary branching a
like antisense CIL1 plants develops branches at the cotyledon axil (Napoli, 1996).
However, dad1-1 mutants also display the additional mutant traits of delayed onset of
101
flowering, shortened internodes, propensity for adventitious root formation and mild l
chlorosis. None of these traits were observed in the antisense CIL1 transgenic plant
The IAA-deficient bushy mutant in pea has short, thin stems, very small leaves and
increased branching (Symons et al., 2002). The phenotype of the antisense CIL1
transgenic plants is similar to these auxin-deficient mutants but does not exactly match
any of them.
Alternatively, overproduction of Z-type cytokinins also results in profuse
secondary branching. The supershoot (sps) mutant, with a 3 to 9-fold increase in
cytokinins, produces inflorescences at every leaf axil on the plant (Tantikanjana et al.,
2001). Seeds from the sps line were grown to determine if there was any resemb
phenotype to that of the transgenic antisense CIL1 plants. Unlike wild type A. thaliana,
sps plants produced a prolific amount of leaves from a large number of branches.
Further, upon reaching the reproductive stage of development, the sps plants formed
great number of inflorescences that were generally smaller than the wild type
inflorescences and were largely sterile. In comparison, the antisense CIL1 transgenic
plants had increased branching in both vegetative and reproductive growth phases and
initiated leaves or inflorescences at any axil, depending on the phase of growth
eaf
s.
lance in
a
. The
ntisense CIL1 plants were also comparable in size and fertility to non-transformed B.
n
UTA,
a
carinata.
Only a few genes with roles in regulating lateral meristem development have bee
isolated. The majority of these genes encode transcription factors such as the LATERAL
SUPPRESSOR gene, a member of the GRAS family (Greb et al., 2003), and REVOL
a member of the homeodomain leucine-zipper gene family (Otsuga et al., 2001). An
102

exception is the tomato arabinogalactan protein-1 (AGP-1), which, like CIL1, is a
glycosylphosphatidylinositol-anchored protein (Sun et al., 2004). However,
distinguishing it from CIL1, over-expression of LeAGP-1 produced plants of shorter
stature with more branches and more flower buds. Further, most of the flowers di
mature and seeds in the fruits that did develop were significantly smaller than normal
seeds. Unlike
d not
CIL1 whose expression is induced by auxin, cytokinin and ABA, AGP-1
express
ic
s 4.19 and
nd decreases in the IAA:ZR ratio in the 20 day-old first leaf over the
transge
ion is induced by cytokinin but inhibited by auxin and ABA.
5.7 Modulations of CIL1 Expression and Phytohormone Concentration in Transgen
Plants
The ratio of auxin:cytokinin has been shown to influence plant development in
some cases, where in other cases, absolute amounts of phytohormones influence
development (Eklof et al., 1997; Eklof et al., 2000). The transgenic plants showed wide
variation in the degree of alteration of both IAA and ZR concentration (Figure
4.20). Noticeable differences also existed in the IAA:ZR ratio (Table 4.1). Least
effected by the reduction of CIL1 expression in the transgenic lines were the 20 day-old
first leaf and 31-day old lateral meristem. The lateral meristem IAA:ZR ratio in the
transgenic lines were nearly identical to the non-transformed line, while there were small
increases a
nic lines compared to the non-transformed line. These data correlate well with the
CIL1 expression data (Figure 4.17), demonstrating that the development of the phenotype
in the transgenic plants does not likely involve the first leaf. However, the same
103
conclusion cannot be made about the lateral meristem since the hormone content w
analysed before development of the multiple leaf phenotype.
The shoot apical meristem displayed a consistant reduction in the IAA:ZR rati
compared to the non-transformed line. The large increase in ZR concentration coupled
with the unchanged IAA concentration greatly altered the ratio. This result suggests th
the loss of apical dominance might be attributable to the IAA:ZR ratio rather than the
absolute amount of IAA.
as
o
at
Alternatively, the stems and roots of the transgenic lines had the largest alterations
ions between CIL1, CA, and IAA oxidase may reduce the IAA available for
transpo
in IAA:ZR ratio. Increased IAA metabolism in the transgenic plants as a result of the
interact
rt. Thus the degree of apical dominance exerted at the lateral meristems would
also be decreased in the transgenic plants.
104

6. CONCLUSIONS
Many questions about the function of CIL1 in plant development remain to be
answer
stem, lateral and apical meristem. CIL1 expression is induced
by mul
f
t driven by the 35S promoter alters
xpression of the gene in leaf, root, stem, lateral and apical meristem. However, the
effect of the antisense construct on CIL1 expression varied widely from organ-to-organ,
reducing gene expression to the greatest extent in apical meristem and to the least extent
in first leaf. The reduction of CIL1 expression was accompanied by the formation of
multiple leaves from lateral meristems. Therefore, CIL1 has a role in determining plant
architecture. That role likely involves interaction, either directly or indirectly, with
several phytohormones. The largest and most consistent reduction of CIL1 expression
was observed in the shoot apical meristem. This expression data correlated with an
increase in ZR concentration, a decrease in the IAA:ZR ratio and a decrease in ABA
concentration. A fairly consistent reduction in CIL1 expression was also observed in the
root. Again, this was accompanied by a decrease in the IAA:ZR ratio. Therefore, it is
ed. However, the following conclusions are possible based on sequence
comparison and the results of this study. CIL1 does not have introns and is a member of
a small gene family in Brassica species. Gene duplication of CIL1 appears to have
occurred in B. oleracea but not in B. carinata or B. nigra. The gene is expressed
constitutively in leaf, root,
tiple signals including copper chloride, α-NAA, BAP and ABA. Translation of
the CIL1 ORF yielded a putative protein of 269 amino acids with an approximate
molecular weight of 27,332 Daltons. The protein is predicted to have a N-terminal
transmembrane domain and putative catecholamine-binding domain. Transformation o
B. carinata with an antisense CIL1 construc
e
105

likely that CIL1 plays a role in con okinin ratio in plants. However,
the me
trolling the auxin:cyt
chanism of this control remains to be elucidated. Hopefully, further
characterization of CIL1 will help define the role of catecholamines in plants.
106
7. FUTURE DIRECTIONS
This study comprised a thorough examination of the CIL1 copy num
genomic location, the coding region composition, the gene’s expression pattern
ber and
, and
response to hormone treatment. However, it represents only the initial stages of the
functional characterization of CIL1. Much remains to be learned about the role of CIL1
in plant growth and development. Firstly, given the identification of a putative CA
binding domain in CIL1, the CA content of the antisense transgenic plants should be
compared to non-transformed B. carinata. Further, the hormone profiling of the lateral
meristems and shoot apical meristem needs to be repeated encompassing additional
developmental stages. Additional hormone profiling may also include a wider variety of
organs, such as the inflorescence stem, flower buds, young and mature seeds, senescing
material, cauline leaves, and leaves from plants in flower.
While the hormone profiling of the antisense transgenic plants should add much
to our knowledge of the role of CIL1 in plant development, biochemical analyses are also
required. Those analyses will be aimed at elucidating the location of CIL1, ligand
binding, post-translational processing and interactions with other proteins.
Immunolocalization will determine if, as predicted, CIL1 is membrane bound. Protein
crystallization followed by X-ray crystallography or 2D-NMR of CIL1 in the presence of
CAs should determine ligand binding. Microscopic study of a fusion of the N-terminal
end of CIL1 with green fluorescent protein can determine if, as predicted, the C-terminus
is cleaved to release that end of the protein into the apoplast. Finally, employing yeast
two-hybrid or immunoprecipitation to detect interacting proteins may reveal if CIL1 is
107

part of a signal transduction pathw ile to generate CIL1
over-ex
ay. It would also be worthwh
pressing lines to examine the effect on B. carinata growth and development.
108
8. REFERENCES
Addicott FT, Lyon JL, Ohkuma K, Thiessen WE, Carns HR, Smith OE, Cornforth JW, Milborrow BV, Ryback G, and Wareing PF, 1968. Abscisic acid: a new name for abscisin II (dormin). Science 159:1493.
lemayehu N and Becker HC, 2001. Variation and inheritance of erucic acid content in Brassica carinata germplasm collections from Ethiopia. Plant Breeding 120:331-335.
Ali-Rachedi S, Bouinot D, Wagner M, Bonnet M, Sotta B, Grappin P, and Jullien M, 2004. Changes in endogenous abscisic acid levels during dormancy release and maintenance of mature seeds: studies with the Cape Verde Islands ecotype, the dormant model of Arabidopsis thaliana. Planta 219:479-488.
Alliotte T, Engler TG, Peleman J, Caplan A, van Montagu M, and Inze D, 1988. An auxin-regulated gene of Arabidopsis thaliana encodes a DNA-binding protein. Plant Physiol 89:743–753.
Aloni R, Langhans M, Aloni E, and Ullrigh CI, 2004. Role of cytokinin in the regulation of root gravitropism. Planta 220:177-182.
Alonso LC, Fernandez-Serrano O, and Fernandez-Escobar J, 1991. The outset of a new oilseed crop: Brassica carinata with low erucic acid content. International Consultative Group on Rapeseed Congress A-21:170-176.
Babic V, Datla RS, Scoles GJ, and Keller WA, 1998. Development of an efficient Agrobacterium-mediated transformation system for Brassica carinata. Plant Cell Rep 17:183-188.
Baker CJ and Orlandi EW, 1995. Active oxygen in plant pathogenesis. Annu Rev Phytopathol 33:299-321.
Bangerth F, 1994. Response of cytokinin concentration in the xylem exudate of bean (Phaseolus vulgaris L.) plants to decapitation and auxin treatment, and relationship to apical dominance. Planta 194:439-442.
Bartel B, LeClere S, Magidin M, and Zolman BK, 2001. Inputs to the active indole-3-acetic acid pool: de novo synthesis, conjugate hydrolysis, and indole-3-butyric acid β-oxidation. J Plant Growth Regul 20:198-216.
Beffa R, Martin HV, and Pilet P, 1990. In vitro oxidation of indoleacetic acid by soluble auxin-oxidases and peroxidases from maize roots. Plant Physiol 94:485-491.
Bennett MJ, Marchant A, Green HG, May ST, Ward SP, Millner PA, Walker AR, Schulz B, and Feldmann KA, 1996. Arabidopsis AUX1 gene: a permease-like regulator of root gravitropism. Science 273:948-950.
Berleth T, Krogan NT, and Scarpella E, 2004. Auxin signals – turning genes on and turning cells around. Curr Op in Plant Biol 7:553-563.
Beveridge CA, 2000. Long-distance signaling and a mutational analysis of branching in pea. Plant Growth Regul 32:193-203.
Beveridge CA, Symons GM, and Turnbull CGN, 2000. Auxin inhibition of decapitation-induced branching is dependent on graft-transmissible signals regulated by genes Rms1 and Rms2. Plant Physiol 123:689-697.
Bialek K and Cohen JD, 1989. Free and conjugated indole-3-acetic acid in developing bean seeds. Plant Physiol 91:775-779.
A
109
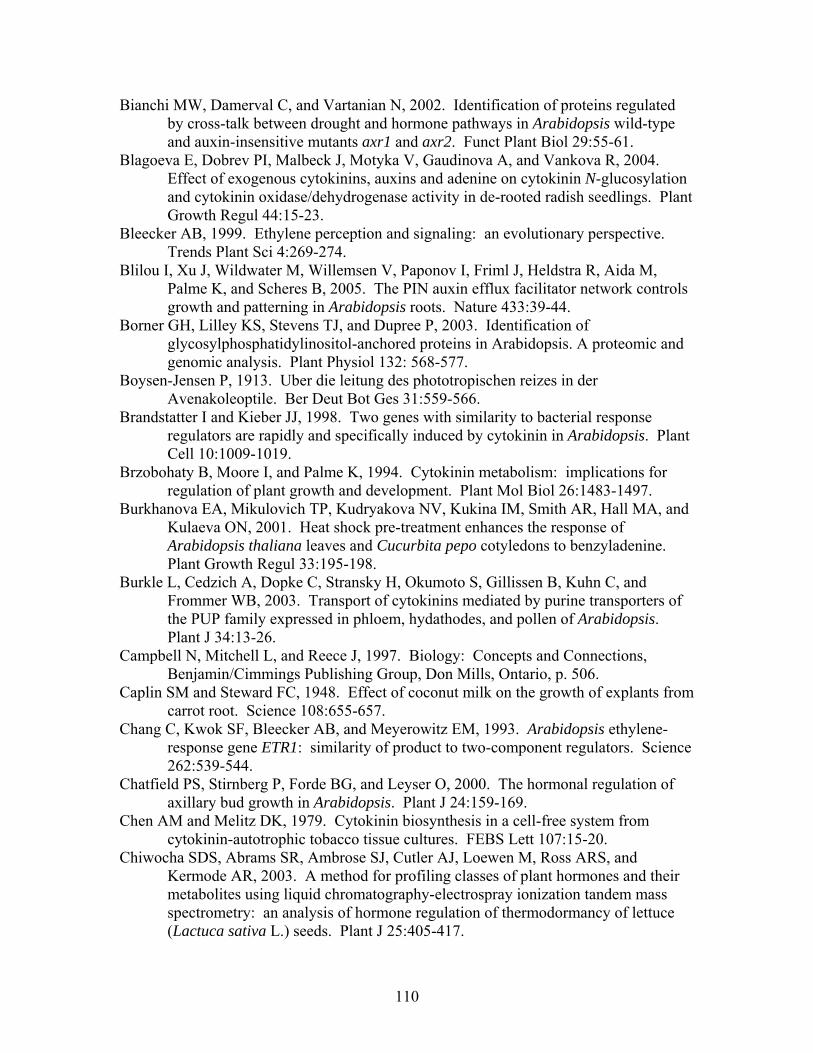
Bianchi MW, Damerval C, and Var ntification of proteins regulated by cross-talk between drought and hormone pathways in Arabidopsis wild-type
Blagoed adenine on cytokinin N-glucosylation
Bleeck , 1999. Ethylene perception and signaling: an evolutionary perspective.
Blilou s
d ysiol 132: 568-577.
-566.
Plant
or
Burkhanova EA, Mikulovich TP, Kudryakova NV, Kukina IM, Smith AR, Hall MA, and
s and Cucurbita pepo cotyledons to benzyladenine.
Burkle L, Cedzich A, Dopke C, Stransky H, Okumoto S, Gillissen B, Kuhn C, and by purine transporters of
Campb pts and Connections,
Caplin rom
Chang two-component regulators. Science
Chatfie hormonal regulation of
Chen A synthesis in a cell-free system from
Chiwoclasses of plant hormones and their
egulation of thermodormancy of lettuce (Lactuca sativa L.) seeds. Plant J 25:405-417.
tanian N, 2002. Ide
and auxin-insensitive mutants axr1 and axr2. Funct Plant Biol 29:55-61. va E, Dobrev PI, Malbeck J, Motyka V, Gaudinova A, and Vankova R, 2004. Effect of exogenous cytokinins, auxins anand cytokinin oxidase/dehydrogenase activity in de-rooted radish seedlings. PlantGrowth Regul 44:15-23. er ABTrends Plant Sci 4:269-274. I, Xu J, Wildwater M, Willemsen V, Paponov I, Friml J, Heldstra R, Aida M, Palme K, and Scheres B, 2005. The PIN auxin efflux facilitator network controlgrowth and patterning in Arabidopsis roots. Nature 433:39-44.
Borner GH, Lilley KS, Stevens TJ, and Dupree P, 2003. Identification of glycosylphosphatidylinositol-anchored proteins in Arabidopsis. A proteomic angenomic analysis. Plant Ph
Boysen-Jensen P, 1913. Uber die leitung des phototropischen reizes in der Avenakoleoptile. Ber Deut Bot Ges 31:559
Brandstatter I and Kieber JJ, 1998. Two genes with similarity to bacterial response regulators are rapidly and specifically induced by cytokinin in Arabidopsis. Cell 10:1009-1019.
Brzobohaty B, Moore I, and Palme K, 1994. Cytokinin metabolism: implications fregulation of plant growth and development. Plant Mol Biol 26:1483-1497.
Kulaeva ON, 2001. Heat shock pre-treatment enhances the response of Arabidopsis thaliana leavePlant Growth Regul 33:195-198.
Frommer WB, 2003. Transport of cytokinins mediated the PUP family expressed in phloem, hydathodes, and pollen of Arabidopsis. Plant J 34:13-26. ell N, Mitchell L, and Reece J, 1997. Biology: ConceBenjamin/Cimmings Publishing Group, Don Mills, Ontario, p. 506. SM and Steward FC, 1948. Effect of coconut milk on the growth of explants fcarrot root. Science 108:655-657. C, Kwok SF, Bleecker AB, and Meyerowitz EM, 1993. Arabidopsis ethylene-response gene ETR1: similarity of product to262:539-544. ld PS, Stirnberg P, Forde BG, and Leyser O, 2000. The axillary bud growth in Arabidopsis. Plant J 24:159-169. M and Melitz DK, 1979. Cytokinin biocytokinin-autotrophic tobacco tissue cultures. FEBS Lett 107:15-20. ha SDS, Abrams SR, Ambrose SJ, Cutler AJ, Loewen M, Ross ARS, and Kermode AR, 2003. A method for profiling cmetabolites using liquid chromatography-electrospray ionization tandem mass spectrometry: an analysis of hormone r
110
Choi T, Aoki F, Makoto M, Yamashita M, Nagahama Y, and Kohmoto K, 1991. Activation of p34cdc2 protein kinase activity in meiotic and mitotic cell cycles in mouse oocytes and embryos. Development 113: 789-795.
Christou P and Barton KA, 1989. Cytokinin antagonist activity of substituted phenethylamines in plant cell cultures. Plant Physiol 89:564-568. G, 1996. Exogenous auxin effects on lateral bud outgrowth in decapitated
shoots. Ann Bot 78:255-2Cline M
66.
Cong, Paris, France, 17-19 May 1983, pp. 282-287.
Crosbye max (L.) Merr. Genotypes.
Crozier osynthesis of hormones and
Plant Physioloists.
nt
DarwinDatla R .
oreign gene expression in plants using an AMV
Datla, R
.
e
De Vos chat H, and De Kok LJ, 1993. Effect of er
Dellapo J, and Hicks JB, 1983. A plant DNA minipreparation: version II.
Dengle Curr Op in Plant
Dharm in auxin
Doubt Eagles
Cohen DB and Knowles PF, 1983. Evaluation of Brassica species in California. In: GCIRC Proc 6th Int Rapeseed
Coruzzi G and Last RL, 2000. Amino acids. In BB Buchanan, W Gruissem, and RL Jones (Eds.), Biochemistry and molecular biology of plants (pp.358-401), Rockville, USA: American Society of Plant Physiologists.
Cousins HH, 1910. Jamaica Dept Agr Annual Report, 7. KE, Aung LH, and Buss GR, 1981. Influence of 6-benzylaminopurine on fruit-set and seed development in two soybean GlycinPlant Physiol 68:985-988. A, Kamiya Y, Bishop G, and Yokota T, 2000. Bielicitor molecules. In BB Buchanan, W Gruissem, and RL Jones (Eds.), Biochemistry and molecular biology of plants (pp. 850-901), Rockville, USA: American Society of
Dai Y, Michaels PJ, and Flores HE, 1993. Stimulation of ethylene production by catecholamines and phenylethylamine in potato cell suspension cultures. PlaGrowth Regul 12:219-222. CR, 1880. The power of movement in plants. London: Murray. SS, Bekkaoui F, Hammerlindl JK, Pilate G, Dunstan DI, and Crosby WL, 1993Improved high-level constitutive fRNA4 untranslated leader sequence. Plant Sci 94:139-149. SS, Hammerlindl JK, Panchuk B, Pelcher LE, and Keller W, 1992. Modified
binary plant transformation vectors with the wild-type gene encoding NPTII. Gene 122:383-384
De Vos CHR, Vonk MJ, Vooijs R, and Schat H, 1992. Glutathione depletion due tocopper induced phytochelatin synthesis causes oxidative stress in Silencucubalus. Plant Physiol 98:853-858. CHR, Bookum WMT, Vooijs R, Scopper on fatty acid composition and peroxidation of lipids in the roots of copptolerant and sensitive Silene cucubalus. Plant Physiol Biochem 31:151-158. rta SL, Wood Plant Mol Biol Rep 1:19-21. r NG and Kang J, 2001. Vascular patterning and leaf shape.
Biol 4:50-56. asiri S and Estelle M, 2002. The role of regulated protein degradation response. Plant Mol Biol 49:401-409. SL, 1917. The response of plants to illuminating gas. Bot Gaz 63:209-224. CF, and Wareing PF, 1964. The role of growth substances in the regulation of bud dormancy. Physiol Plant 34:201–203.
111

Eklof S, Astot C, Blackwell J, Moritz T, Olsson O, and Sandberg G, 1997. Auxin-cytokinin interactions in wild-type and transgenic tobacco. Plant Cell Physiol 38:225-235.
Eklof S, Astot C, Sitbon F, Moritz T, Olsson O, and Sandberg G, 2000. Transgtobacco plants co-expressing Agrobacterium iaa and ipt genes have
enic wild-type
ypes.
eet
Endres the l 115:291-295.
les of auxin and cytokinin in
Friml J, 2003. Auxin transport – shaping the plant. Curr Opin Plant Biol 6:7-12.
Friml J ropism in Arabidopsis. Nature 415:806-
Friml J rk Hooykaas PJJ, Palme K, and Offringa R, 2004. A
g directs auxin
Galweibidopsis vascular
Gan S nin. Science 270:1986-1987.
. Gaspar and
n plant hormone action. In Vitro Cell Dev
Getinet
ERAL SUPPRESSOR gene in Arabidopsis reveals a
.
ive transcription. Cell Mol Life Sci
e ratio of auxin to cytokinin. J Plant
Growth Regul 21:459-468.
hormone levels but display both auxin- and cytokinin-overproducing phenotPlant J 23:279-284.
Elstner EF, Konze JR, Selman BR, and Stoffer C, 1976. Ethylene formation in sugar bleaves: evidence for the involvement of 3-hydroxytyramine and phenoloxidase after wounding. Plant Physiol 58:163-168. s R, Jager A, and Kreis W, 1984. Catecholamine biosynthesis dependent ondark in betacyanin-forming Portulaca callus. J Plant Physio
Fei H and Vessey JK, 2004. Further investigation of the rothe NH4
+-induced stimulation of nodulation using white clover transformed withthe auxin-sensitive reporter GH3:gusA. Physiol Plant 121:674-681.
Friml J and Palme K, 2002. Polar auxin transport – old questions and new concepts? Plant Mol Biol Rep 49:273-284. , Wisnlewska J, Benkova E, Mendgen K, and Palme K, 2002. Lateral relocationof auxin efflux regulator PIN3 mediates t809. , Yang X, Michniewicz M, Weijers D, Quint A, Tietz O, Benjamins R, OuwerkePBF, Ljung K, Sandberg G, PINOID-dependent binary switch in apical-basal PIN polar targetinefflux. Science 306:862-865. ler L, Guan C, Muller A, Wisman E, Mendgen K, Yephremov A, and Palme K, 1998. Regulation of polar auxin transport by AtPIN1 in Aratissue. Science 282:2226-2229.
and Amasino RM, 1995. Inhibition of leaf senescence by autoregulated production of cytoki
Garrison R, 1955. Studies in the development of axillary buds. Am J Bot 42:257-266 TH, Kevers C, Faivre-Rampant O, Crevecoeur M, Penel CL, Greppin H, Dommes J, 2003. Changing concepts iBiol-Plant 39:85-106. A, Rakow G, and Downey RK, 1996. Agronomic performance and seed quality of Ethiopian mustard in Saskatchewan. Can J Plant Sci 76:387-392.
Greb T, Clarenz O, Schafer E, Muller D, Herrero R, Schmitz G, and Theres K, 2003. Molecular analysis of the LATconserved control mechanism for axillary meristem formation. Gene Dev 17:1175-1187
Guilfoyle TJ, Ulmasov T, and Hagen G, 1998. The ARF family of transcription factorsand their role in plant hormone-respons54:619-627.
Haver DL, Schuch UK, and Lovatt CJ, 2003. Exposure of petunia seedlings to ethylenedecreased apical dominance by reducing th
112
Hay A, Barkoulas M, and Tsiantis M, 2004. PINning down the connections:transcrfactors and hormones in leaf morphogenesis. Curr Opin Plant Biol 7:575-581. R, Thomson K
iption
Hertel -St, and Russo VEA, 1972. In-vitro auxin binding to particulate
HetherHeyl A
0-488.
s cytokinin receptor family. Proc Natl
Hirai N
Hu Y, RGOS
9.
dopsis. 409:1060-1063.
Johnston GFS and Jeffcoat B, 1977. Effects of some growth regulators on tiller bud
John Pcycle progres-sion, the switch between division
auxin and
Kakim stidine kinase homolog implicated in cytokinin signal
Kamisa nduce
Kato Clant
40:949-954.
259-
cell fractions from corn coleoptiles. Planta 107:325-340. ington AM, 2001. Guard cell signaling. Cell 107:711-714. and Schmulling T, 2003. Cytokinin signal perception and transduction. Curr Opin Plant Biol 6:48
Higuchi M, Pischke MS, Mahonen AP, Miyawaki K, Hashimoto Y, Seki M, Kobayashi M, Shinozaki K, Kato T, Tabata S, Helariutta Y, Sussman MR, and Kakimoto T,2004. In planta functions of the ArabidopsiAcad Sci USA 101:8821-8826. , Kondo S, and Ohigashi H, 2003. Deuterium-labeled phaseic acid and dihydrophaseic acids for internal standards. Biosci Biotechnol Biochem 67:2408-2415.
Xie Q, and Chua N-H, 2003. The Arabidopsis auxin-inducible gene Acontrols lateral organ size. Plant Cell 15:1951-1961.
Hwang I and Sheen J, 2001. Two-component circuitry in Arabidopsis cytokinin signaltransduction. Nature 413:383-38
Inoue T, Higuchi M, Hashimoto Y, Seki M, Kobayashi M, Kato T, Tabata S, Shinozaki K, and Kakimoto T, 2001. Identification of CRE1 as a cytokinin receptor from Arabi
Jeffrey SW and Humphrey GF, 1975. New spectrophotometric equations for determining chlorophylls a, b, c1 and c2 in higher plants, algae, and natural phytoplankton. Biochem Biophys Phlanz 167:191-194.
elongation in cereals. New Phytol 79:239-245. CL, Zhang K, Dong C, Diederich L and Wightman F, 1993. P34 cdc2 related proteins in control of cell and differentiation in tissuedevelopment, and stimulation of division by cytokinin. Aust. J. Plant Physiol. 20:503–526
Johri MM and Mitra D, 2001. Action of plant hormones. Curr Sci 80:199-202. Kaplinsky NJ and Barton MK, 2004. Plant acupuncture: sticking PINs in the right
places. Science 306:822-823. oto T, 1996. CKI1, a hitransduction. Science 274:982-985. ka S, 1979. Catecholamine stimulation of the gibberellin action that ilettuce hypocotyl elongation. Plant Cell Physiol 20:1199-1207. , Kato H, Asami T, Yoshida S, Noda H, Kamada H, and Satoh S, 2002. Involvement of xylem sap zeatin-O-glucoside in cucmber shoot greening. PPhysiol Biochem
Kaur A and Thurkral AK, 1990. Effect of animal hormones on the growth, protein and sugar contents of Vigna unguiculata L. seedlings. Indian J Plant Physiol 33:261.
Kawano T, Pinontoan R, Uozumi N, Miyake C, Asada K, Kolattukudy PE, and Muto S, 2000. Aromatic monoamine-induced immediate oxidative burst leading to an
113

increase in cytosolic Ca2+ concentration in tobacco suspension culture. Plant Cell Physiol 41:1251-1258.
Kay R, Chan A, Daly M, and McPherson J, 1987. Duplication of CaMV 35S promotersequences creates a strong enhancer for plant genes. Scien
ce 236:1299-1302.
Role of
ysiol 85:10-12.
Koornn (L.) Heynh. Theor Appl Genet 58:257-263.
he
ction in Arabidopsis. Plant Physiol Biochem 36:83-89.
64. -
f auxin
Livak KMethods 25:402-408.
wth and
Luna CM, González CA, and Trippi VS, 1994. Oxidative damage caused by an excess of
Maher EP and Martindale SJB, 1980. Mutants of Arabidopsis with altered responses to
Mahon lariutta Y, 2000. sis of the
Mantyla E, Lang V, and Palva ET, 1995. Role of abscisic acid in drought-induced
Marchant A, Kargul J, May ST, Muller P, Delbarre A, Perrot-Rechenmann C, and
Khurana JP, Tamot BK, Maheshwari N, and Maheshwari SC, 1987.catecholamines in promotion of flowering in a short-day duckweed, Lemna paucicostata 6746. Plant Ph
Kleczkowsi K and Schell J, 1995. Phytohormone conjugates: nature and function. Crit Rev Plant Sci 14:283-298. eef M, van der Veen, JH, 1980. Induction and analysis of gibberellin sensitive mutants in Arabidopsis thaliana
Koornneef M, Leon-Kloosterziel KM, Schwartz SH, and Zeevaart JAD, 1998. Tgenetic and molecular dissection of abscisic acid biosynthesis and signal transdu
Kuklin AI and Conger BV, 1995. Catecholamines in plants. J Plant Growth Regul 14:91-97.
Langridge J, 1957. Effect of day-length and gibberellic acid on the flowering of Arabidopsis. Nature 180:36-37.
Lee TT, Starratt AN, and Jevnikar JJ, 1982. Regulation of enzymic oxidation of indole-3-acetic acid by phenols: structure-activity relationships. Phytochemistry 21:517-523.
Leyser HM, Lincoln CA, Timpte C, Lammer D, Turner J, and Estelle M, 1993. Arabidopsis auxin-resistance gene AXR1 encodes a protein related to ubiquitin-activating enzyme E1. Nature 364:161-1
Leyser O, 2002. Molecular genetics of auxin signaling. Annu Rev Plant Biol 53:377398.
Ljung K, Bhalerao RP, and Sandberg G, 2001. Sites and homeostatic control obiosynthesis in Arabidopsis during vegetative growth. Plant J 28:465-474. J and Schmittgen TD, 2001. Analysis of relative gene expression data using real-
time quantitative PCR and the 2-ΔΔC(T) method. Liscum E and Reed JW, 2002. Genetics of Aux/IAA and ARF action in plant gro
development. Plant Mol Biol 49:387–400.
copper in oat leaves. Plant Cell Physiol 35:11-15.
auxins and gravity. Biochem Genet 18:1041-1053. en AP, Bonke M, Kauppinen L, Riikonen M, Benfey PN, and HeA novel two-component hybrid molecule regulates vascular morphogeneArabidopsis root. Gene Dev 14:2938-2943.
freezing tolerance, cold acclimation, and accumulation of LT178 and RAB18 proteins in Arabidopsis thaliana. Plant Physiol 107:141-148.
Bennett MJ, 1999. AUX1 regulates root gravitropism in Arabidopsis by facilitating auxin uptake within root apical tissues. EMBO J 18:2066-2073.
114
Marchl Jacobs AR, Lanczycki CJ, 2003. CDD: A curated
. Marcro i
der nt of
ic acid. J Am Chem Soc 77:1392. in
olar
Müller y G, Bennett M, ot
m control. Embo J 17:6903-6911.
/lifescience/agro/6-
er-Bauer A, Anderson JB, DeWeese-Scott C, Fedorova ND, Geer LY, He S, Hurwitz DI, Jackson JD,Entrez database of conserved domain alignments. Nucleic Acids Res 31:383-387ft SJ, Purwantara A, Salisbury PA, Potter TD, Wratten N, Khangura R, BarbettMJ, and Howlett BJ, 2002. Reaction of a range of Brassica species unAustralian conditions to the fungus, Leptosphaeria maculans, the causal ageblackleg. Aust J Exp Agric 42:587-594.
Miller CO, Skoog F, von Saltza MH, and Strong FM, 1955. Kinetin, a cell division factor from deoxyribonucle
Mitchell JW, Skaggs DP and Anderson WP, 1951. Plant growth stimulating hormones immature bean seeds. Science 114:159-161.
Morris DA, 2000. Transmembrane auxin carrier systems — dynamic regulators of pauxin transport. Plant Growth Regul 32:161-172.
A, Guan C, Gälweiler L, Tänzler P, Huijser P, Marchant A, ParrWisman E, and Palme K, 1998. AtPIN2 defines a locus of Arabidopsis for rogravitropis
N6-benzylaminopurine (cytokinin b). <http://www.chemicalland21.comBENZYLAMINOPURINE.htm>, viewed July, 2005.
M, Caplan A, and Berger PH, 1997. Phenotypic characterization of a tobacmutant impai
Naderi co red in auxin polar transport. Plant Cell Rep 17:32-38.
ersed by
Neljub er stengel von Pisum sativum und
Neuteb W, Ng JMY, Kuyper M, Clijdesdale OR, Hooykaas PJJ, and van der Zaal
Mol
Nishim tidine
rabidopsis. Plant Cell 16:1365-1377.
in Arabidopsis thaliana: a
Normanly J and Bartel B, 1999. Redundancy as a way of life – IAA metabolism. Curr
Nowac d
-
Ohtani in the lateral ganglionic eminence. J Neurosci 23:2840-2850.
Napoli C, 1996. Highly branched phenotype of the petunia dad1-1 mutant is revgrafting. Plant Physiol 111:27-37.
ow DN, 1901. Uber die horizontale nutation deiniger anderen. Pflanzen Beitrage und Botanik Zentralblatt 10:128-139. oom LBJ, 1999. Isolation and characterization of cDNA clones corresponding with mRNAs that accumulate during auxin-induced lateral root formation. PlantBiol 39:273-287. ura C, Ohashi Y, Sato S, Kato T, Tabata S, and Ueguchi C, 2004. Hiskinase homologs that act as cytokinin receptors possess overlapping functions in the regulation of shoot and root growth in A
Nooden LD and Letham DS, 1993. Cytokinin metabolism and signaling in the soybean plant. Aust J Plant Physiol 20:639-653.
Nordstrom A, Tarkowski P, Tarkowska D, Norbaek R, Astot C, Dolezal K, and SandbergG, 2004. Auxin regulation of cytokinin biosynthesis factor of potential importance for auxin—cytokinin-regulated development. Proc Natl Acad Sci USA 101:8039-8044.
Opin Plant Biol 2:207-213. ki J and Bandurski RS, 1980. Myo-inositol esters of indole-3-acetic acid as seeauxin precursors of Zea mays L. Plant Physiol 65:422–427.
Ohkuma K, Lyon JL, Addicott FT, and Smith OE, 1963. Abscisin II, an abscissionaccelerating substance from young cotton fruit. Science 142:1592–1593.
N, Goto T, Waeber C, and Bhide PG, 2003. Dopamine modulated cell cycle
115
Oka M, Miyamoto K, Okada K, and Ueda J, 1999. Auxin polar transport and flowerformation in Arabidopsis thaliana transformed with indoleacetamide hydrola(iaaH) gene. Plant Cell Physiol 40:231-237.
se
Oota Yeatment. Plant Cell Physiol 15:403-411.
omeobox gene
lant J 25:223-236.
Palni L:231-234.
Meszaros T, Dudits D, and Feher A, 2000. f CDKs and cell division in egul 32:129-141.
T-
Polce M uction to mass spectrometry of polymers. In:
l
Protacio CM, Dai Y, Lewis EF, and Flores HE, 1992. Growth stimulation by
Radley
goire T and Monteiro A.
Ribnick e TJ, 2002. An auxin surge following
of gibberellin
Richmo d
Oota Y, 1974. Removal of the sugar inhibition of flowering in Lemna gibba G3 by catecholamines. Plant Cell Physiol 15:63-68. and Kondo T, 1974. Removal by cyclic-AMP of the inhibition of duckweed flowering due to ammonium and water-tr
Ori N, Juarez MT, Jackson D, Yamaguchi J, Banowetz GM, and Hake S, 1999. Leafsenescence is delayed in tobacco plants expressing the maize hknotted1 under the control of a senescence-activated promoter. Plant Cell 11:1073-1080.
Otsuga D, DeGuzman B, Prigge MJ, Drews GN, and Clark SE, 2001. REVOLUTA regulates meristem initiation at lateral positions. P
Paal A, 1918. Uber phototropische. Reizleitung Jahrb Wiss Bot 58:406-458. MS, Burch L, and Horgan R, 1988. The effect of auxin concentration on cytokinin stability and metabolism. Planta 174
Pasternak T, Miskolczi O, Ayaydin F, Exogenous auxin and cytokinin dependent activation oleaf protoplast-derived cells of alfalfa. Plant Growth R
Pfaffl MW, 2001. A new mathematical model for relative quantification in real-time RPCR. Nucl Acids Res 29:2003-2007.
Phillips AL, 1998. Gibberellins in Arabidopsis. Plant Physiol Biochem 36:115-124. J and Wesdemiotis C, 2002. Introd
Mass spectrometry of polymers. Montaudo G and Lattimer RP (eds.). CRC Press, Boca Raton, Florida, USA.
Popolo M, McCarthy DM, and Bhide PG, 2004. Influence of dopamine on precursor celproliferation and differentiation in the embryonic mouse telencephalon. Dev Neurosci 26:229-244.
catecholamines in plant tissue/organ cultures. Plant Physiol 98:89-96. M, 1956. Occurrence of substances similar to GA in higher plants. Nature 178:1070-1071.
Rakow G and Getinet A, 1998. Brassica carinata an oilseed crop for Canada. Proc Int Symp on Brassicas, pp 419-426, Eds Gre
Rapparini F, Tam YY, Cohen JD, and Slovin JP, 2002. Indole-3-acetic acid metabolism in Lemna gibba undergoes dynamic changes in response to growth temperature. Plant Physiol 128:1410-1416. y DM, Cohen JD, Hu W-S, and Cookfertilization in carrots: a mechanism for regulating plant totipotency. Planta 214:505-509.
Richards DE, King KE, Ait-ali T, and Harberd NP, 2001. How gibberellin regulates plant growth and development: a molecular genetic analysissignaling. Annu Rev Plant Physiol Plant Mol Biol 52:67-88. nd AE, 1957. Effect of kinetin on protein content and survival of detacheXanthium leaves. Science 125:650-651.
116
Robertson JG, Adams GW, Medzihradszky KF, Burlingame AL, and Villafranca JJ, 1994. Complete assignment of disulfide bonds in bovine dopamine β-hydroxylase. Biochemistry 33:11563-11575.
Roshchina VV, 1989. Biomediators in chloroplasts of higher plants. 1. The interactiwith photosynthetic membranes. Photosynthet
on ica 23:197–206.
M,
ental dent manner. Physiol Plant 105:312-320.
ean
2-560.
:703-711. , a
or, New York, USA: Cold Spring Harbor
ns in
9-
e tomato ion of
Schroeder JI, Allen GJ, Hougovieux V, Kwak JM and Waner D, 2001. Guard cell signal
Schurr in relation to
als f cell proliferation. Curr Biol 13:837-842.
Smith T hytochemistry
Snow M f axillary buds. New Phytol 41:13-22.
Roshchina VV, 1990. Biomediators in chloroplasts of higher plants. 4. Reception byphotosynthetic membranes. Photosynthetica 24:539–549.
Rodrigues-Pousada R, Caeneghem WV, Chauvaux N, Van Onckelen H, Van Montaguand Van Der Straeten D, 1999. Hormonal cross-talk regulates the Arabidopsisthaliana 1-aminocyclopropane-1-carboxylate synthase gene 1 in a developmand tissue-depen
Rulcova J and Pospisilova J, 2001. Effect of benzylaminopurine on rehydration of bplants after water stress. Biol Plantarum 44(1):75-81.
Romanov GA, 2002. The phytohormone receptors. Russ J Plant Physiol 49:55Sakai HS, Aoyama T, and Oka A, 2000. Arabidopsis ARR1 and ARR2 response
regulators operate as transcriptional activators. Plant J 24Sakai H, Honma T, Aoyama T, Sato S, Kato T, Tabata S, and Oka A, 2001. ARR1
transcription factor for genes immediately responsive to cytokinins. Science 294:1519-1521.
Sambrook J and Russell DW, 2001. Molecular cloning: a laboratory manual. (pp. 5.12-5.17; pp. 6.39-5.68), Cold Spring HarbLaboratory Press.
Scanlon MJ, 2003. The polar auxin transport inhibitor N-1-napthylphthalamic acid disrupts leaf initiation, KNOX protein regulation, and formation of leaf margimaize. Plant Physiol 133:597-605.
Schenk RU and Hildebrandt AC, 1972. Medium and techniques for induction and growth of monocotyledonous and dicotyledonous plant cell cultures. Can J Bot. 50:19204.
Schmitz G, Tillmann E, Carriero F, Fiore C, Cellini F, and Theres K, 2002. ThBlind gene encodes a MYB transcription factor that controls the formatlateral meristems. Proc Natl Acad Sci USA 99:1064-1069.
transduction. Annu Rev Plant Physiol Plant Mol Biol, 52:627-658. U, Gollan T, Schulze E-D, 1992. Stomatal response to soil drying changes in the xylem sap composition of Helianthus annuus. II. Stomatal sensitivity to abscisic acid imported from the xylem sap. Plant Cell Environ 15:561–567.
Sieberer T, Hauser M, Seifert GJ, and Luschnig C, 2003. PROPORZ1, a putative Arabidopsis transcriptional adaptor protein, mediates auxin and cytokinin signin the control o
Skoog F and Miller CO, 1957. Chemical regulation of growth and organ formation inplant tissues cultured in vitro. Symp Soc Exp Biol 11:118-130. A, 1977. Phenethylamine and related compounds in plants. P16:9-18. and Snow R, 1942. The determination o
117
Snowdon RJ, Kohler W, Friedt W, and Kohler A, 1997. Genomic in situ hybridizatioBrassica amphidiploids and interspecific hybrids. Theor Appl Genet 91324.
n in 5:1320-
S1 are s
Sun Wpers reproductive
Sussex pical structure and
, etol
er
Swarup hant A, Ljung K, Sandberg G, Palme K, and Bennett M, 2001.
Szopa zynski G, Fiehn O, Wenczel A, and Willmitzer L, 2001. Identification and
Taiz L s, USA: Sinauer
Tam Y gates in
Tamuraacco telomerase. J Biol Chem 274:20997-21002.
rg G,
v 15:1577-1588. in
nce signaling in Arabidopsis. Plant J 32:255-262.
Brassica carinata. MSc thesis. University of Saskatchewan.
Sorefan K, Booker J, Haurogne K, Goussot M, Bainbridge K, Foo E, Chatfield S, Ward S, Beveridge C, Rameau C, and Leyser O, 2003. MAX4 and RMorthologous dioxygenase-like genes that regulate shoot branching in Arabidopsiand pea. Gene Dev 17:1469-1474.
Stirnberg P, van de Sande K, and Leyser HMO, 2002. MAX1 and MAX2 control shoot lateral branching in Arabidopsis. Development 129:1131-1141.
, Kieliszewski MJ, and Showalter AM, 2004. Overexpression of tomato LeAGP-1 arabinogalactan-protein promotes lateral branching and hamdevelopment. Plant J 40:870-881. IM, 1955. Morphogenesis in Solanum tuberosum L.: adevelopmental pattern of the juvenile shoot. Phytomorphology 5:253-273.
Suzuki M, Yamaguchi S, Iida T, Hashimoto I, Teranishi H, Mizoguchi M, Yano FTodoroki Y, Watanabe N, and Yokoyama M, 2003. Endogenous α-klinolenic acid levels in short day-induced cotyledons are closely related to flowinduction in Pharbitis nil. Plant Cell Physiol 44:35-43. R, Friml J, MarcLocalization of the auxin permease AUX1 suggests two functionally distinct hormone transport pathways operate in the Arabidopsis root apex. Genes Dev 15:2648-2653.
Sweidrych A, Lorenc-Kukula K, Skirycz A, and Szopa J, 2004. The catecholamine biosynthesis route in potato is affected by stress. Plant Physiol Biochem 42:593-600.
Symons GM, Ross JJ, and Murfet IC, 2002. The bushy pea mutant is IAA-deficient. Physiol Plant 116:389-397.
J, Wilcquantification of catecholamines in potato plants (Solanum tuberosum) by GC-MS. Phytochemistry 58:315-320. and Zeiger E, 1998. Plant Physiology, 2nd ed., MassachusettAssociates. Y, Epstein E, and Normanly J, 2000. Characterization of auxin conjuArabidopsis. Low steady-state levels of indole-3-acetyl-glutamate, and indole-3-acetyl-glucose. Plant Physiol 123:589-595. K, Liu H, and Takahash H, 1999. Auxin induction of cell cycle regulated activity of tob
Tantikanjana T, Yong JWH, Letham DS, Griffith M, Hussain M, Ljung K, Sandbeand Sundaresan V, 2001. Control of axillary bud initiation and shoot architecture in Arabidopsis through the SUPERSHOOT gene. Gene De
Taya Y, Tanakay Y, and Nishimura S, 1978. 5’-AMP is a direct precursor of cytokininDictyostelium discoidum. Nature 271:545-547.
Turnbull CG, Booker JP, and Leyser HM, 2002. Micrografting techniques for testinglong-dista
Uchacz TM, 2000. Isolation and characterization of induced defense genes from
118
Ueguchi C, Sato S, Kato T, and Tabata S, 2001. The AHK4 gene involved in the cytokinin-signaling pathway as a direct receptor molecule in Arabidopsis thaliana. Plant Cell Physiol 42:751-755.
. J
Ulmasov T, Hagen G, and Guilfoyle TJ, 1997a. ARF1, a transcription factor that binds to
Ulmaso eins repress
Vandenbussche F and Van Der Straeten D, 2004. Shaping the shoot: a circuitry that
Vandes data
:1-11. Vartan
-
Velasco L, Nabloussi A, De Haro A, and Fernandez-Martinez M, 2004. Allelic variation ion
37-140.
romes b561 and potentially involved in
Vicente-Agullo F, Rigas S, Desbrosses G, Dolan L, Hatzopoulos P, and Grabov A, 2004. for auxin transport in Arabidopsis roots.
Vogel oeste K, Brandstatter I, and Kieber JJ, 1998. Isolation and
Walker orporation of 6-benzylaminopurine on.
Wang H lin-
by abscisic acid. Plant J 15:501-
Wang H nt kinase inhibitor
Ueno E and Shinozaki M, 1999. Effects of the inhibitors of biosynthesis and degradationof catecholamines on photoperiodic induction of flowering in Pharbitis nilPlant Physiol 155:332-337.
auxin response elements. Science 276:1865-1868. v T, Murfett J, Hagen G and Guilfoyle TJ, 1997b. Aux/IAA protexpression of reporter genes containing natural and highly active synthetic auxin response elements. Plant Cell 9:1963-1971.
integrates multiple signals. Trends Plant Sci 9:499-506 ompele J, De Preter K, Pattyn F, Poppe B, Van Roy N, De Paepe A, and Speleman F, 2002. Accurate normalization of real-time quantitative RT-PCRby geometric averaging of multiple internal control genes. Genome Biol 3
ian N, 1981. Some aspects of structural and functional modifications induced by drought in root systems. Plant and Soil 63:83-92.
Vartanian N, Marcotte L, and Giraudat J, 1994. Drought Rhizogenesis in Arabidopsis thaliana. Differential responses of hormonal mutants. Plant Physiol 104:761767.
in linolenic acid content of high erucic acid Ethiopian mustard and incorporatof the low linolenic acid trait into zero erucic acid germplasm. Plant Breeding 123:1
Verelst W and Asard H, 2004. Analysis of an Arabidopsis thaliana protein family, structurally related to cytochcatecholamine biochemistry in plants. J Plant Physiol 161:175-181.
Potassium carrier TRH1 is requiredPlant J 40:523-535.
JP, Schuerman P, Wcharacterization of Arabidopsis mutants defective in the induction of ethylenebiosynthesis by cytokinin. Genetics 149:417-427. GC and Leonard NJ, 1974. The mode of incinto tobacco callus transfer ribonucleic acid: A double labeling determinatiPlant Physiol 54(5):737-743.
Wang X and Below FE, 1996. Cytokinins in enhanced growth and tillering of wheat induced by mixed nitrogen source. Crop Sci 36:121-126. , Qi Q, Schorr P, Cutler AJ, Crosby WL, and Fowke LC, 1998. ICK1, a cyc
dependent protein kinase inhibitor from Arabidopsis thaliana interacts with both Cdc2a and CycD3, and its expression is induced 510. , Fowke LC, and Crosby WL, 1997. A plant cyclin-depende
gene. Nature 386: 451-452.
119
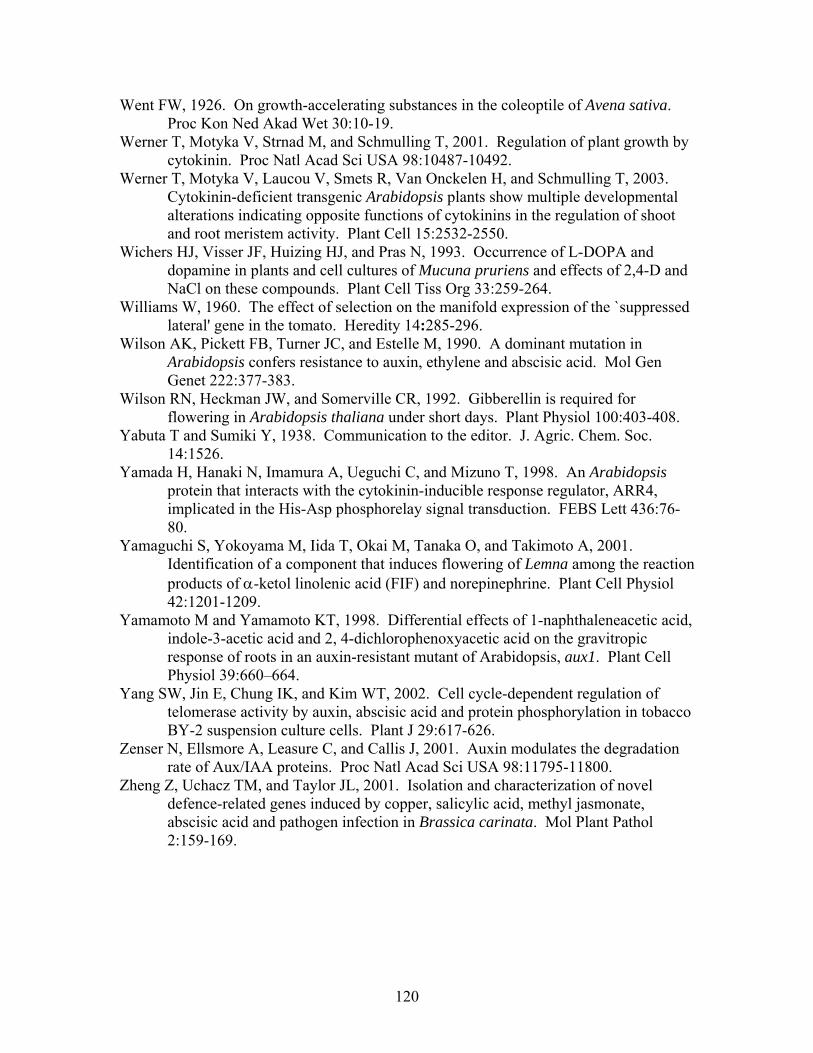
Went FW, 1926. On growth-accelerating substances in the coleoptile of Avena saProc Kon Ned Akad Wet 30:10-19. T, Motyka V, Strnad M, and Schmulling T
tiva.
Werner , 2001. Regulation of plant growth by
Werner ic Arabidopsis plants show multiple developmental
0.
rg 33:259-264. sed
. Plant Physiol 100:403-408.
Yamada H, Hanaki N, Imamura A, Ueguchi C, and Mizuno T, 1998. An Arabidopsis
Yamaguchi S, Yokoyama M, Iida T, Okai M, Tanaka O, and Takimoto A, 2001. ction
ll Physiol
n auxin-resistant mutant of Arabidopsis, aux1. Plant Cell
Yang Sein phosphorylation in tobacco
Zenser
ethyl jasmonate,
cytokinin. Proc Natl Acad Sci USA 98:10487-10492. T, Motyka V, Laucou V, Smets R, Van Onckelen H, and Schmulling T, 2003.Cytokinin-deficient transgenalterations indicating opposite functions of cytokinins in the regulation of shoot and root meristem activity. Plant Cell 15:2532-255
Wichers HJ, Visser JF, Huizing HJ, and Pras N, 1993. Occurrence of L-DOPA and dopamine in plants and cell cultures of Mucuna pruriens and effects of 2,4-D and NaCl on these compounds. Plant Cell Tiss O
Williams W, 1960. The effect of selection on the manifold expression of the `suppreslateral' gene in the tomato. Heredity 14:285-296.
Wilson AK, Pickett FB, Turner JC, and Estelle M, 1990. A dominant mutation inArabidopsis confers resistance to auxin, ethylene and abscisic acid. Mol Gen Genet 222:377-383.
Wilson RN, Heckman JW, and Somerville CR, 1992. Gibberellin is required for flowering in Arabidopsis thaliana under short days
Yabuta T and Sumiki Y, 1938. Communication to the editor. J. Agric. Chem. Soc. 14:1526.
protein that interacts with the cytokinin-inducible response regulator, ARR4, implicated in the His-Asp phosphorelay signal transduction. FEBS Lett 436:76-80.
Identification of a component that induces flowering of Lemna among the reaproducts of α-ketol linolenic acid (FIF) and norepinephrine. Plant Ce42:1201-1209.
Yamamoto M and Yamamoto KT, 1998. Differential effects of 1-naphthaleneacetic acid, indole-3-acetic acid and 2, 4-dichlorophenoxyacetic acid on the gravitropic response of roots in aPhysiol 39:660–664. W, Jin E, Chung IK, and Kim WT, 2002. Cell cycle-dependent regulation of telomerase activity by auxin, abscisic acid and protBY-2 suspension culture cells. Plant J 29:617-626.
N, Ellsmore A, Leasure C, and Callis J, 2001. Auxin modulates the degradation rate of Aux/IAA proteins. Proc Natl Acad Sci USA 98:11795-11800.
Zheng Z, Uchacz TM, and Taylor JL, 2001. Isolation and characterization of novel defence-related genes induced by copper, salicylic acid, mabscisic acid and pathogen infection in Brassica carinata. Mol Plant Pathol 2:159-169.
120

9. APPENDICES
121

AAC62613 -EQNSAMASSSSSLLILAVACFVSLISPAISQ------------QACKSQNLNSAGPFDS 47 CIL1 ------MASNASLTLVLAVACFVSLISPAIS-------------QTCSTQNVT--GDFKN 39 AAM65781 -------MDSSYLRISLSFLFWALLLSPAVSQS-----------SSCSSQTFSGVKSYPH 42 NP_566763 ------MSSSSSVRISLSFIFLALLISPAVSQT-------------CKSQTFSGDKTYPH 41 BAB09428 ----MFLSSRTIFVGLCFLFVLAPCFTRATTNE---------VQVSCDSHNFNNGKHFRS 47 NP_191466 ----MSLSSRATLVVLCCLFMLIPSFTTAATEQGLH------ARSRCESYSFNNGKSFRS 50 AAL57706 MSNHMSIMKFLNQILCLSLILSISMTTLSFAQT-------------CSKYKFSSNNVFDS 47 NP_199564 ----MAISS--NLLLCLSLFIFI-ITKSALAQK-------------CSNYKFSTNRLFES 40 AAM64730 ----MD-RTQSPKTALFAVLATLLVLTVNGQSL-------------CNTHRFTNNLAFAD 42 CAC37356 ----MDTKLLTSNLVLFSSILLTLFTFSYGQN--------------CSTHQFTNNNLFST 42 AAM61181 ---------MATLILSFLLLLLATKLPESLAG---------------HCTTTTATKSFEK 36 BAC01247 -MARAG--AVLVVVLAAASVLLAPWAATAQTSSCD---------DALPP-ALAGNYSGLA 47 NP_191734 -MKTLVGFYILCFLIGQDLPFLAADDVNVINDSTQNLCFANRLSDFLPP-PYSNISDNMP 58 NP_566313 -MKLYSVSIIIFVLIALSTIVNAQQAA---TDSCN---------STLPLNDLTFNTSLLQ 47 AAC62613 CEDLPVLNSYLHYTYNSSNSSLSVAFVATPSQANGGWVAWAINPTG-TKMAGSQAFLAYR 106 CIL1 CMDLPVLDSFLHYTYDAANSSLSVAFVATPPRS-GDWVAWGINPTG-TKMIGSQAFVAYS 97 AAM65781 CLDLPDLKAILHYSYDASNTTLAVVFSAPPSKP-GGWIAWAINPKS-TGMAGSQALVASK 100 NP_566763 CLDLPQLKAFLHYSYDASNTTLAVVFSAPPAKP-GGWIAWAINPKA-TGMVGSQTLVAYK 99 BAB09428 CVDLPVLDSFLHYSYVRETGVLEVAYRHTNIES-SSWIAWGINPTS-KGMIGAQTLLAYR 105 NP_191466 CTDLLVLNSYLHFNYAQETGVLEIAYHHSNLES-SSWISWAINPTS-KGMVGAQALVAYR 108 AAL57706 CNDLPFLDSFLHYTYESSTGSLHIAYRHTKLTS-GKWVAWAVNPTS-TGMVGAQAIVAYP 105 NP_199564 CNDLPVLDSFLHYTYDSSSGNLQIAYRHTKLTP-GKWVAWAVNPTS-TGMVGAQAIVAYP 98 AAM64730 CSDLSALGSFLHWTYNEQNGTVSIAYRHPGTSA-SSWVAWGLNPSS-TQMVGTQALVAFT 100 CAC37356 CNPLPVLNSFLHWTYHPDNHTVDLAYRHGGVTE-SSWVAWALNLDG-TGMAGCQSLIAFR 100 AAM61181 CISLPTQQTSIAWTYHPHNATLDLCFFGTFISP-SGWVGWGINPDSPAQMTGSRVLIAFP 95 BAC01247 CRPVWN--NFVLRYAQGKDNVLRVVISSMYSTG---WVGMGFSKDG--MMVGSSAMVGWV 100 NP_191734 CTPLWN--TFVLRYSENRDNVMTIIVSALYTTG---WVGIGFSKEG--RMVGSSAMIGWI 111 NP_566313 CTEAWTPQNFILRYARTAENTWSFILSAPDSSA---FIGIGFSTNG--QMIGSSAIVGWI 102 * : . ::. ... . * * ::. AAC62613 SGGGAAPVVKTYNISSYSS-LVEGKLA--FDFWNLRAESLS--GGRIAIFNR-----TVK 156 CIL1 PRAGARPEVNTYNISSYS--LSAGRLT--FDFWNLRAESMA--GNRIVIYT------SVK 145 AAM65781 DPSTGVASVTTLNIVSYSS-LVPSKLS--FDVWDVKAEEAANDGGALRIFA------KVK 151 NP_566763 DPGNGVAVVKTLNISSYSS-LIPSKLA--FDVWDMKAEEAARDGGSLRIFA------RVK 150 BAB09428 NSTSGFMRAYTSSINGYTPMLQEGPLS--FRVTQLSAEYLN---REMTIFA------TMV 154 NP_191466 NSTSGVMRAYTSSINSYSPMLQESPLS--LRVTQVSAEYSN---GEMMIFA------TLV 157 AAL57706 QSDG-TVRVYTSPIRSYQTSLLEGDLS--FNVSGLSATYQN---NEIVVLA------SLK 153 NP_199564 QSDG-TVRAYTSPISSYQTSLLEAELS--FNVSQLSATYQN---NEMVIYA------ILN 146 AAM64730 NTTTNQFQAYTSSVSSYGTRLERSSLS--FGVSGLSATLVS---GEVTIFA------TLE 149 CAC37356 NSSG-QIHAYTSPIAGYGTTLTEGALS--FGVPRISAEFVR---SEMIIFA------TLE 148 AAM61181 DPNSGQLILLPYVLDSSVKLQKGPLLSRPLDLVRLSSSSASLYGGKMATIRNGASVQIYA 155 BAC01247 GKTG-LSHVKQFSLRGKTPSQVVADEG---FLQSKDHDHTVVVQQAKIYLA--------- 147 NP_191734 SKKG-HAKIKQYYLQGTERDQVVPDQG---ELQLQKVPPVVALHGAMIYLA--------- 158 NP_566313 PSDGGSGTVKPYLLGGKSPGEVNPDQG---DLTIVNGSLKIESVSSRLYMR--------- 150 : . . AAC62613 VPAGRDS---VNQVWQIGGNVT-NGRPGVHPFGPDNLGSHRVLSFT----EDAAPGSAPS 208 CIL1 VPAGADS---VNQVWQIGGNVT-GGRPGPHPMTPANLASTRMLRLTGSDAPSSAPGSAPS 201 AAM65781 VPADLAASGKVNQVWQVGPGVS-NGRIQAHDFSGPNLNSVGSLDLTGTTPGVPVSGGGGA 210 NP_566763 VPADLVAKGKVNQVWQVGPELGPGGMIGRHAFDSANLASMSSLDLKGDNSGGTISGGD-E 209 BAB09428 WP---SNTTVVNHLWQDGPLKE-GDRLGMHAMSGNHLKSMANLDLLS-GQVMTTKAA--- 206 NP_191466 LP---PNTTVVNHLWQDGPLKE-GDRLGMHAMSGDNLKSMASLDLLS-GQVTTTKSV--- 209 AAL57706 LAQDLGNGGTINTVWQDGSMS--GNSLLPHPTSGNNVRSVSTLNLVS-GVS-AAAGG-AG 208 NP_199564 LP--LANGGIINTVWQDGSLS--GNNPLPHPTSGNNVRSVSTLNLVS-GASGSTSTG-AG 200 AAM64730 LS---PNLITANQLWQVGPVV--NGVPASHQTSGDNMRSSGRIDFRT-GQASAGGGG--- 200 CAC37356 LP---INRTSFTQVWQNGQVS--EQALRVHQTSGDNMRSVGTVDFAS-GQTSAGAGGGIS 202 AAM61181 SVKLSSNNTKIHHVWNRGLYVQ-GYSPTIHPTTSTDLSSFSTFDVTSGFATVNQNSG--- 211 BAC01247 FQLRFQSPLRRQQVLLAFGNA--IPVN--DRLTEHQGKTSFTFDFTTGS--SSGSSY--- 198 NP_191734 FQVKFAVRVPRRAVILAFSTA--YPSKL-GRLTKHDDKTTVIVDFSKASGATSIKTT--- 212 NP_566313 FQL--TATLPRQSLLYAVGPAGFFPSSPDFRLREHRFVTTTTINYNTGSQSVVKVSP--- 205 : : . AAC62613 --PGSAPS--PGSAP--------------------------------APGTSG------- 225 CIL1 SGPGSAPSSGPGSAPGS------------------------------VPGSAEGPTTPDA 231 AAM65781 GNSRIHKRNIHGILNAVSWGLLFPIGAMIARYMRIFESADPAWFYLHVSCQFSAYAIGVA 270 NP_566763 VNAKIKNRNIHGILNAVSWGILFPIGAIIARYMRVFDSADPAWFYLHVSCQFSAYVIGVA 269 BAB09428 NDNMLLVKSIHGLVNAVCWGIFIPIGVMAARYMRTYKGLDPTWFYILIL----------- 255 NP_191466 NRNMLLVKQIHAIVNALSWGILMPIGVMAARYMKNYEVLDPTWFYIHVVCQTTGYFSGLI 269 AAL57706 GSSKLRKRNIHGILNGVSWGIMMPLGAIIARYLRVAKSADPAWFYIHVFCQASAYIIGVA 268
122
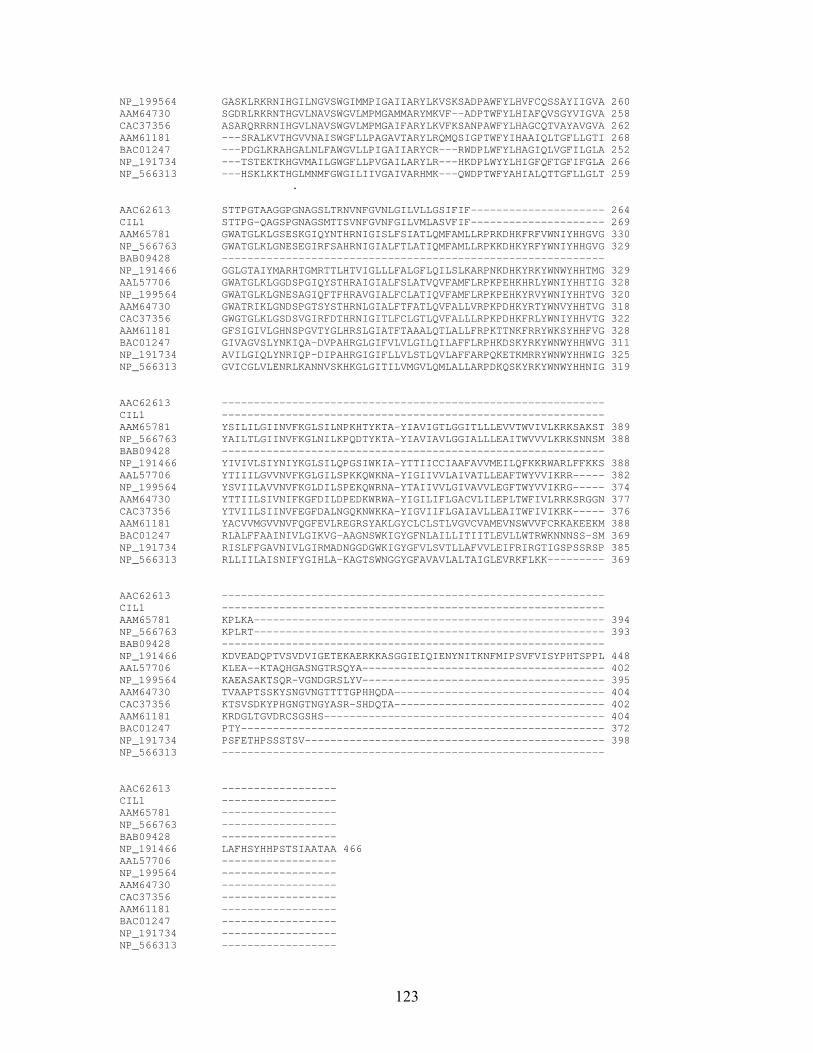
NP_199564 GASKLRKRNIHGILNGVSWGIMMPIGAIIARYLKVSKSADPAWFYLHVFCQSSAYIIGVA 260 AAM64730 SGDRLRKRNTHGVLNAVSWGVLMPMGAMMARYMKVF--ADPTWFYLHIAFQVSGYVIGVA 258 CAC37356 ASARQRRRNIHGVLNAVSWGVLMPMGAIFARYLKVFKSANPAWFYLHAGCQTVAYAVGVA 262 AAM61181 ---SRALKVTHGVVNAISWGFLLPAGAVTARYLRQMQSIGPTWFYIHAAIQLTGFLLGTI 268 BAC01247 ---PDGLKRAHGALNLFAWGVLLPIGAIIARYCR---RWDPLWFYLHAGIQLVGFILGLA 252 NP_191734 ---TSTEKTKHGVMAILGWGFLLPVGAILARYLR---HKDPLWYYLHIGFQFTGFIFGLA 266 NP_566313 ---HSKLKKTHGLMNMFGWGILIIVGAIVARHMK---QWDPTWFYAHIALQTTGFLLGLT 259 . AAC62613 STTPGTAAGGPGNAGSLTRNVNFGVNLGILVLLGSIFIF--------------------- 264 CIL1 STTPG-QAGSPGNAGSMTTSVNFGVNFGILVMLASVFIF--------------------- 269 AAM65781 GWATGLKLGSESKGIQYNTHRNIGISLFSIATLQMFAMLLRPRKDHKFRFVWNIYHHGVG 330 NP_566763 GWATGLKLGNESEGIRFSAHRNIGIALFTLATIQMFAMLLRPKKDHKYRFYWNIYHHGVG 329 BAB09428 ------------------------------------------------------------
29NP_191466 GGLGTAIYMARHTGMRTTLHTVIGLLLFALGFLQILSLKARPNKDHKYRKYWNWYHHTMG 3 AAL57706 GWATGLKLGGDSPGIQYSTHRAIGIALFSLATVQVFAMFLRPKPEHKHRLYWNIYHHTIG 328 NP_199564 GWATGLKLGNESAGIQFTFHRAVGIALFCLATIQVFAMFLRPKPEHKYRVYWNIYHHTVG 320 AAM64730 GWATRIKLGNDSPGTSYSTHRNLGIALFTFATLQVFALLVRPKPDHKYRTYWNVYHHTVG 318 CAC37356 GWGTGLKLGSDSVGIRFDTHRNIGITLFCLGTLQVFALLLRPKPDHKFRLYWNIYHHVTG 322 AAM61181 GFSIGIVLGHNSPGVTYGLHRSLGIATFTAAALQTLALLFRPKTTNKFRRYWKSYHHFVG 328 BAC01247 GIVAGVSLYNKIQA-DVPAHRGLGIFVLVLGILQILAFFLRPHKDSKYRKYWNWYHHWVG 311 NP_191734 AVILGIQLYNRIQP-DIPAHRGIGIFLLVLSTLQVLAFFARPQKETKMRRYWNWYHHWIG 325 NP_566313 GVICGLVLENRLKANNVSKHKGLGITILVMGVLQMLALLARPDKQSKYRKYWNWYHHNIG 319 AAC62613 ------------------------------------------------------------ CIL1 ------------------------------------------------------------ AAM65781 YSILILGIINVFKGLSILNPKHTYKTA-YIAVIGTLGGITLLLEVVTWVIVLKRKSAKST 389 NP_566763 YAILTLGIINVFKGLNILKPQDTYKTA-YIAVIAVLGGIALLLEAITWVVVLKRKSNNSM 388 BAB09428 ------------------------------------------------------------
88 NP_191466 YIVIVLSIYNIYKGLSILQPGSIWKIA-YTTIICCIAAFAVVMEILQFKKRWARLFFKKS 3AAL57706 YTIIILGVVNVFKGLGILSPKKQWKNA-YIGIIVVLAIVATLLEAFTWYVVIKRR----- 382 NP_199564 YSVIILAVVNVFKGLDILSPEKQWRNA-YTAIIVVLGIVAVVLEGFTWYVVIKRG----- 374 AAM64730 YTTIILSIVNIFKGFDILDPEDKWRWA-YIGILIFLGACVLILEPLTWFIVLRRKSRGGN 377 CAC37356 YTVIILSIINVFEGFDALNGQKNWKKA-YIGVIIFLGAIAVLLEAITWFIVIKRK----- 376 AAM61181 YACVVMGVVNVFQGFEVLREGRSYAKLGYCLCLSTLVGVCVAMEVNSWVVFCRKAKEEKM 388 BAC01247 RLALFFAAINIVLGIKVG-AAGNSWKIGYGFNLAILLITIITLEVLLWTRWKNNNSS-SM 369 NP_191734 RISLFFGAVNIVLGIRMADNGGDGWKIGYGFVLSVTLLAFVVLEIFRIRGTIGSPSSRSP 385 NP_566313 RLLIILAISNIFYGIHLA-KAGTSWNGGYGFAVAVLALTAIGLEVRKFLKK--------- 369 AAC62613 ------------------------------------------------------------ CIL1 ------------------------------------------------------------ AAM65781 KPLKA------------------------------------------------------- 394 NP_566763 KPLRT------------------------------------------------------- 393 BAB09428 ------------------------------------------------------------
48 NP_191466 KDVEADQPTVSVDVIGETEKAERKKASGGIEIQIENYNITKNFMIPSVFVISYPHTSPPL 4AAL57706 KLEA--KTAQHGASNGTRSQYA-------------------------------------- 402 NP_199564 KAEASAKTSQR-VGNDGRSLYV-------------------------------------- 395 AAM64730 TVAAPTSSKYSNGVNGTTTTGPHHQDA--------------------------------- 404 CAC37356 KTSVSDKYPHGNGTNGYASR-SHDQTA--------------------------------- 402 AAM61181 KRDGLTGVDRCSGSHS-------------------------------------------- 404 BAC01247 PTY--------------------------------------------------------- 372 NP_191734 PSFETHPSSSTSV----------------------------------------------- 398 NP_566313 ------------------------------------------------------------ AAC62613 ------------------ CIL1 ------------------ AAM65781 ------------------ NP_566763 ------------------ BAB09428 ------------------ NP_191466 LAFHSYHHPSTSIAATAA 466 AAL57706 ------------------ NP_199564 ------------------ AAM64730 ------------------ CAC37356 ------------------ AAM61181 ------------------ BAC01247 ------------------ NP_191734 ------------------ NP_566313 ------------------
123
Figure 9.1 Multiple sequence alignment (ClustalW) of possible dopamine binding number , ces
IL1 amino
domains, based on the publication of Verelst and Asard (2004). AIR12 accession AAC62613. The NP_191734, NP_566313, AAL57706, NP_199564, AAM64730AAM65781, NP_566763, NP191466, AAM61181, BAB09428 amino acid sequenfrom , the CAC37356 amino acid sequence from
berosum, the BAC01247 amino acid sequence from Oryza sativa, and the CArabidopsis thaliana Solanum
tuacid sequence from Brassica carinata were compared in the alignment. “-“ Regions of an amino acid sequence that did not align to the consensus. “*” Residues are identical in all sequences in the column. “:” Conserved amino acid substitutions observed in the column. “.” Semi-conserved substitutions present in the column.
124

125
06-Aug-2004 20:18:546:2 3-1 y. root
23.00 24.00 25.00 26.00 27.00 28.00Time4
%
100
8
100
%
US06SG04_30 Sm (Mn, 1x2) 11: MRM of 2 Channels ES- 178.8 > 134.7
7.48e4Area
24.2920007
US06SG04_30 Sm (Mn, 1x2) 11: MRM of 2 Channels ES- 173.8 > 129.7
6.89e4Area
24.5419539
IAA
d5-IAA
06-Aug-2004 20:18:546:2 3-1 y. root
17.00 17.50 18.00 18.50 19.00 19.50Time11
100
%
1
100
%
US06SG04_30 Sm (Mn, 1x1) 4: MRM of 3 Channels ES+ 356.8 > 224.8
3.29e5Area
18.5868656
US06SG04_30 Sm (Mn, 1x1) 4: MRM of 3 Channels ES+ 351.8 > 219.8
2.14e4Area
18.423817
ZR
d3-dhZR
A.

08-Aug-2004 09:01:44QC
24.00 25.00 26.00 27.00 28.00Time1
100
%
2
100
%
B. US06SG04_66 Sm (Mn, 1x2) 11: MRM of 2 Channels ES-
178.8 > 134.73.07e5
24.3394157
Area
d5-IAA
US06SG04_66 Sm (Mn, 1x2) 11: MRM of 2 Channels ES- 173.8 > 129.7
2.64e524.6283038
Area
IAA
08-Aug-2004 09:01:44QC
17.00 17.50 18.00 18.50 19.00 19.50Time0
100
%
0
100
%
US06SG04_66 Sm (Mn, 1x1) 4: MRM of 3 Channels ES+ 356.8 > 224.8
1.20e618.58
254827Area
US06SG04_66 Sm (Mn, 1x1) 4: MRM of 3 Channels ES+ 351.8 > 219.8
1.20e618.42
249321Area
ZR
d3-dhZR
Figure 9.2 Chromatograms demonstrating typical mass spectra for d5-IAA, IAA (upper panels in A, B) and for d3-DHZR, DHZR in both 31 day-old root samples or quality control samples.
126

Table 9.1 Values used to construct the phytohormone profiling graphs. All values were measured ng/g dry weigh
Indole-3-acetic acid Mean STDEV SE
t.A.
Non-transformed 1st leaf 199.33 71.06 41.03 Stem 703.67 129.83 74.96 Root 895.67 303.65 175.32 LM 38.21 3.60 2.08 SAM 23.25 2.00 1.15
Line 2 34.12 19.70 1st leaf 170.00 267.87 154.66 Stem 628.33 Root 338.33 28.02 16.18 LM 50.90 31.93 18.44 SAM 45.96 14.30 10.11
Line 3 1st leaf 243.00 46.70 26.96 Stem 694.33 119.14 68.79 Root 434.00 78.26 45.18 LM 24.94 0.00 0.00 SAM 29.54 5.04 3.56
Line 5 1st leaf 165.00 26.85 15.50 Stem 25.77 7.83 5.54 Root 12.52 7.98 5.64 LM 39.18 23.46 16.59 SAM 29.78 4.48 3.17
Line 6 1st leaf 230.00 19.67 11.36 Stem 278.33 67.52 38.98 Root 236.33 48.58 28.05 LM 38.54 13.94 9.86 SAM 27.01 10.37 7.34
Line 10 1st leaf 154.00 0.00 0.00 Stem 519.00 113.21 65.36 Root 220.67 42.19 24.36 LM 32.73 4.28 2.47 SAM 22.92 0.00 0.00
Line 13 1st leaf 166.67 16.77 9.68 Stem 761.00 88.61 51.16 Root 607.00 267.28 154.31 LM 20.61 4.84 2.79 SAM 22.34 1.81 1.05
127
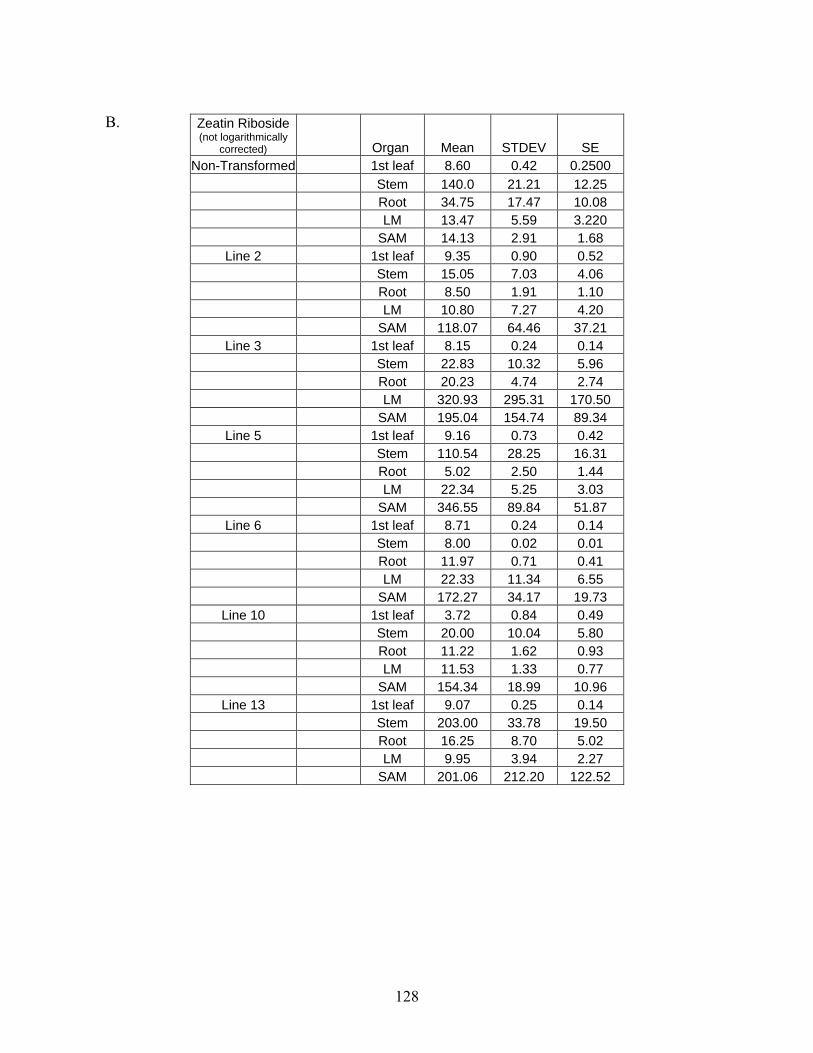
B. Zeatin Riboside (not logarithmically
Organ Mean STDEV SE corrected) Non-Tr rmed 1st leaf 0.2500 ansfo 8.60 0.42
Stem 140.0 21.21 12.25 Root 34.75 17.47 10.08 LM 13.47 5.59 3.220 SAM 14.13 2.91 1.68
Line 2 1st leaf 9.35 0.90 0.52 Stem 15.05 7.03 4.06 Root 8.50 1.91 1.10 LM 10.80 7.27 4.20 SAM 118.07 64.46 37.21
Line 3 1st leaf 8.15 0.24 0.14 Stem 22.83 10.32 5.96 Root 20.23 4.74 2.74 LM 320.93 295.31 170.50 S 154.74 AM 195.04 89.34
Line 5 1st leaf 9.16 0.73 0.42 Stem 110.54 28.25 16.31 Root 5.02 2.50 1.44 LM 22.34 5.25 3.03 SAM 346.55 89.84 51.87
Line 6 1st leaf 8.71 0.24 0.14 Stem 8.00 0.02 0.01 Root 11.97 0.71 0.41 LM 22.33 11.34 6.55 S AM 172.27 34.17 19.73
Line 10 1st leaf 3.72 0.84 0.49 Stem 20.00 10.04 5.80 Root 11.22 1.62 0.93 LM 11.53 1.33 0.77 S AM 154.34 18.99 10.96
Line 13 1st leaf 9.07 0.25 0.14 Stem 203.00 33.78 19.50 Root 16.25 8.70 5.02 LM 9.95 3.94 2.27 S 212.20 AM 201.06 122.52
128
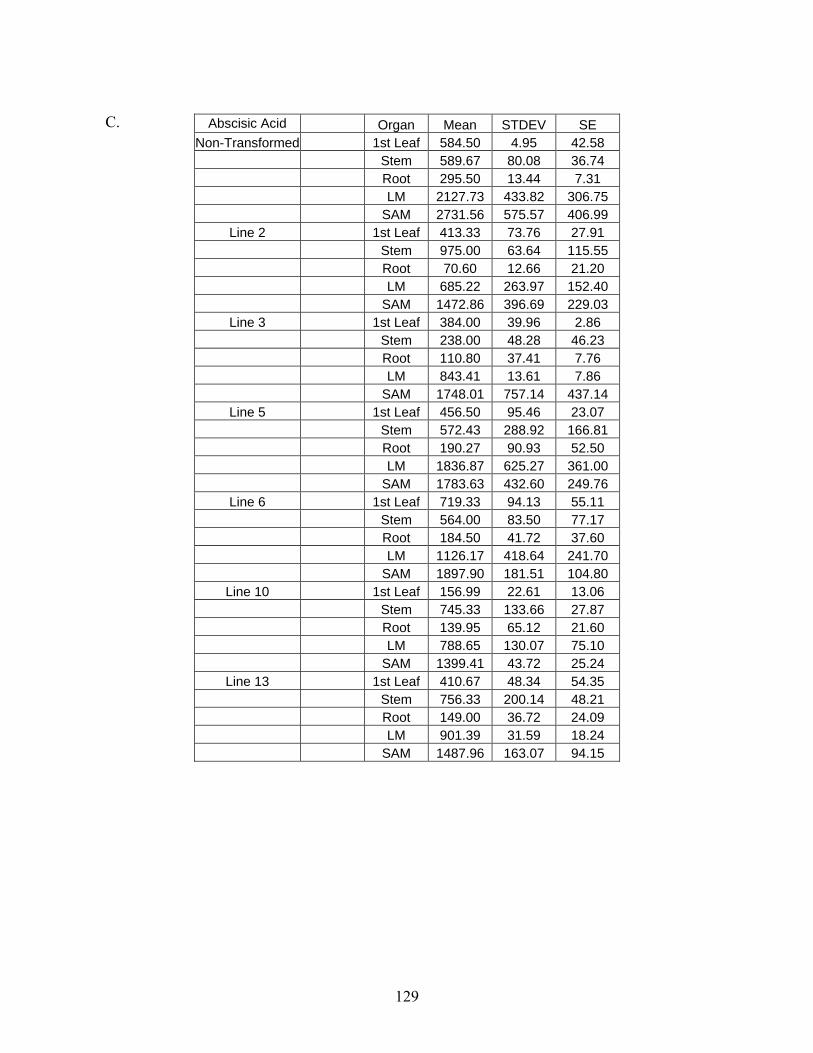
Organ Mean STDEV SE C. Abscisic Acid
Non-Transformed 42.58 1st Leaf 584.50 4.95 589.67 Stem 80.08 36.74 Root 295.50 13.44 7.31 LM 2 3127.73 433.82 06.75 SAM 2 575.57 4731.56 06.99
Line 2 1st Leaf 2 413.33 73.76 7.91 Stem 975.00 115.55 63.64 Root 70.60 12.66 21.20 LM 685.22 263.97 152.40 SAM 1 396.69 229.03 472.86
Line 3 1st Leaf 384.00 39.96 2.86 Stem 238.00 448.28 6.23 Root 110.80 37.41 7.76 LM 843.41 13.61 7.86 SAM 1748.01 757.14 437.14
Line 5 1st Leaf 456.50 95.46 23.07 Stem 572.43 288.92 166.81 Root 190.27 90.93 52.50 LM 1 7 625.27 361.00 836.8 SAM 1 432.60 249.76 783.63
Line 6 1st Leaf 719.33 94.13 55.11 Stem 564.00 783.50 7.17 Root 184.50 341.72 7.60 LM 1 418.64 241.70 126.17 SAM 1 104.80 897.90 181.51
Line 10 1st Leaf 156.99 22.61 13.06 Stem 745.33 133.66 27.87 Root 139.95 265.12 1.60 LM 788.65 130.07 75.10 SAM 1 2399.41 43.72 5.24
Line 13 1st Leaf 410.67 48.34 54.35 Stem 756.33 200.14 48.21 Root 149.00 36.72 24.09 LM 901.39 131.59 8.24 SAM 1 6 163.07 9487.9 4.15
129

D
STDEV ihydrophaseic
Acid Organ Mean SE D. Non-Tra 1 nsformed st Leaf 1129.67 155.73 89.91
Stem 6823.33 1 814.23 410.30 Root 2786.67 991.68 572.55 LM 2553.28 200.89 142.05 SAM 8255.73 1 1 910.58 350.98
Line 2 1st Leaf 1097.33 139.00 80.25 Stem 3 646.67 427.82 247.00 Root 643.00 371.94 214.74 LM 2701.57 314.10 222.10 SAM 1 4 2 0180.73 586.18 647.83
Line 3 1st Leaf 1886.67 400.04 230.96 Stem 1800.00 304.47 175.78 Root 1836.67 476.48 275.10 LM 4308.01 2944.18 1699.83 SAM 7921.23 2 1 326.84 343.40
Line 5 1st Leaf 1080.00 186.82 107.86 Stem 8995.52 4 2 898.93 828.40 Root 539.86 558.35 394.81 LM 4921.94 4027.39 2325.21 SAM 1 7 4 2957.12 539.50 352.93
Line 6 1st Leaf 640.33 130.22 75.18 Stem 1833.33 388.12 224.08 Root 1315.00 289.91 167.38 LM 3348.28 1460.60 843.28 SAM 7779.03 3 1 422.23 975.83
Line 10 1st Leaf 3421.31 194.65 137.64 Stem 2113.33 340.34 196.50 Root 1373.00 717.01 413.96 LM 3828.59 22.45 15.88 SAM 8070.81 5 3 622.38 246.08
Line 13 1st Leaf 1003.00 405.46 234.09 Stem 1463.33 219.39 126.67 Root 1425.00 388.91 224.54 LM 3097.17 1114.31 787.94 SAM 13516.00 485.93 343.60
IAA = Indole-3-acetic ZR = Zeatin riboside ABA = Abscisic acid DPA = Dihydrophaseic acid 1st Leaf = 21-day old first leaf Stem = 31-day old stem Root = 31-day old root LM = 31-day old lateral meristem SAM = 31-day old shoot apical meristem
130

Table 9.2 High Performance Liquid Chromatography conditions used in phytohormone xperiments
Compound
Acetonitrile
2O
acid
a
e
.
H Gl ial Acetic Meth nol Ac 5% H O 2
Time (min.) % % ow (mL
min-1) A% B C% D Fl
0.00 .0 .2 .0 0.200 2 94 0.8 3 2.00 .0 .2 .0 0.200 2 94 0.8 3 10.00 .3 .9 .0 0.200 5 85 0.8 8 10.10 .9 .3 0.200 8.0 85 0.8 5 14.50 .2 .2 .8 0.200 13 73 0.8 12 36.75 .4 .2 .6 0.200 26 55 0.8 17 45.75 .1 .5 . 0.200 34 42 0.8 22 6 45.95 .0 .0 . 0.350 60 0 0.8 39 2 48.95 .0 .2 0.350 60.0 0 0.8 39 49.15 .0 .2 .0 0.200 2 94 0.8 3 57.15 .0 .2 .0 0.200 2 94 0.8 3
131


