
A study for the International Food Policy Research Institute
The role of corporate social responsibility in reducing
greenhouse gas emissions from agriculture and food
Donal Murphy-Bokern
Kroge-Ehrendorf, Germany
and
Linda Kleemann
Kiel Institute for the World Economy, Kiel, Germany
www.murphy-bokern.com
The role of corporate social responsibility in reducing greenhouse gas emissions from agriculture and food.
Draft for public consultation
2
Acknowledgements
This study was funded by the International Food Policy Research Institute. It was initiated
by Dr Alex de Pinto who is thanked for his contribution which was always positive. The
authors also thank the following individuals for the time they gave in discussion and
comments in the planning of the project: Dr Gail Smith, Unilever; Dr Kate Ringham, Oxford
Brookes University; Ms Carole Romero, Aid by Trade Foundation; Dr Tara Garnett,
University of Oxford; and Mr Cornel Kuhrt, Tchibo. We are also grateful for the efforts
firms made in commenting on an early draft of this report.
Disclaimer
The information presented here has been thoroughly researched and is believed to be
accurate and correct. However, the authors cannot be held legally responsible for any
errors. There are no warranties, expressed or implied, made with respect to the
information provided. The authors will not be liable for any direct, indirect, special,
incidental or consequential damages arising out of the use or inability to use the content of
this publication. This version is a draft for public consultation published on 30 July 2015.
Copyright
© All rights reserved. Reproduction and dissemination of material presented here for
educational or other non-commercial purposes are authorized without any prior written
permission from the copyright holder (Dr Donal Murphy-Bokern) provided the source is
fully acknowledged. Reproduction of material for resale or other commercial purposes is
prohibited.
Additional background information
Further details of the evidence used in the research reported here are available from
Donal Murphy-Bokern.
Citation
Please cite this as follows:
Murphy-Bokern, D and Kleemann, L. 2014. The role of corporate social responsibility in
reducing greenhouse gas emissions from agriculture and food. Draft for public
consultation. A study for the International Food Policy Research Institute published by
Donal Murphy-Bokern. www.murphy-bokern.com
June 2014, revised in July 2015.
The role of corporate social responsibility in reducing greenhouse gas emissions from agriculture and food.
Draft for public consultation
3
“Companies still thinking about the environment as a social responsibility rather
than a business imperative are living in the dark ages”
Carter Roberts, President of the World Wildlife Fund (WWF)
“We start from the core belief that this (sustainability) is pre-competitive space and
we will only move to a competitive position if there is a really good argument for
doing so.”
Mr Barry Parkin, Chief Sustainability Officer, Mars Inc.
September 2013 at the UN Global Compact Leaders’ Summit.

The role of corporate social responsibility in reducing greenhouse gas emissions from agriculture and food.
Draft for public consultation
4
CONTENTS
PREFACE .................................................................................................................................................................... 6
1. EXECUTIVE SUMMARY ..................................................................................................................................... 7
1. INTRODUCTION .............................................................................................................................................. 13
SOME BACKGROUND .......................................................................................................................................................... 13
DEFINITIONS AND DRIVERS .................................................................................................................................................. 14
APPROACH ...................................................................................................................................................................... 17
2. EMISSIONS AND THEIR MITIGATION .............................................................................................................. 19
LAND USE CHANGE ............................................................................................................................................................ 21
Beef and soy ............................................................................................................................................................ 23
Palmoil .................................................................................................................................................................... 24
Reducing land use change for beef, soy and palm oil production ........................................................................... 25
PRE-FARM EMISSIONS ........................................................................................................................................................ 26
Fertiliser manufacture ............................................................................................................................................. 26
Planting media and compost................................................................................................................................... 27
Biocides (pesticides and pharmaceuticals) manufacture ........................................................................................ 28
EMISSIONS FROM AGRICULTURAL PRODUCTION ....................................................................................................................... 28
Nitrogen .................................................................................................................................................................. 30
Methane .................................................................................................................................................................. 31
Land use emissions .................................................................................................................................................. 31
On-farm energy use ................................................................................................................................................. 32
MITIGATING AGRICULTURAL EMISSIONS ................................................................................................................................. 32
Reduced tillage ........................................................................................................................................................ 33
Increasing the return of organic matter .................................................................................................................. 34
Restoring natural vegetation and wetlands ............................................................................................................ 34
Reducing nitrogen emissions ................................................................................................................................... 34
Reducing methane emissions .................................................................................................................................. 35
Farming system changes ......................................................................................................................................... 36
POST-FARM PROCESSING, MANUFACTURE AND RETAIL .............................................................................................................. 37
CONSUMPTION PHASE ....................................................................................................................................................... 39
3. CORPORATE SOCIAL RESPONSIBILITY STRATEGIES .......................................................................................... 42
POSITION AND OPERATION OF STRATEGIES WITHIN THE FOOD SYSTEM ......................................................................................... 42
Firms interacting with consumers in relation to specific products and supply chains ............................................. 42
Firms interacting with consumers over a wide range of products and supply chains ............................................. 43
Firms not interacting directly with consumers – commodity traders and processors ............................................. 44
CORPORATE SOCIAL RESPONSIBILITY MEASURES ....................................................................................................................... 44
Agri-food certification ............................................................................................................................................. 46
Carbon certification ................................................................................................................................................. 48
Carbon off-setting ................................................................................................................................................... 49
Farm management and agricultural practices (in addition to certification schemes) ............................................ 51
Technical efficiency in processing, manufacture and retail ..................................................................................... 51
Sectoral cooperation, partnerships, platforms, and roundtables ........................................................................... 51
Restoration of ecosystems ...................................................................................................................................... 51
Investment in research ............................................................................................................................................ 52

The role of corporate social responsibility in reducing greenhouse gas emissions from agriculture and food.
Draft for public consultation
5
Influencing consumer choice and demand .............................................................................................................. 52
4. THE IMPLEMENTATION OF GREENHOUSE GAS MITIGATION ACTIVITIES ............................................................ 53
SELECTION OF CORPORATE SOCIAL RESPONSIBILITY STRATEGIES FOR STUDY ................................................................................... 53
A QUANTITATIVE AND QUALITATIVE OVERVIEW OF MITIGATION-RELATED MEASURES ...................................................................... 55
Agri-food certification ............................................................................................................................................. 56
Carbon certification, carbon offsetting and trading ................................................................................................ 56
Cooperation and partnerships ................................................................................................................................. 56
Protection of ecosystems ........................................................................................................................................ 57
Influencing farm practices ....................................................................................................................................... 59
Investing in research ............................................................................................................................................... 59
Technical supply chain measures: transport, energy use, waste management, packaging and recycling ............. 59
Consumption change ............................................................................................................................................... 60
ALIGNMENT OF ACTIVITIES AND CLIMATE PROTECTION CHALLENGES ............................................................................................ 60
FIRMS’ CHARACTERISTICS AND THEIR USE OF GREENHOUSE GAS MITIGATION MEASURES .................................................................. 65
5. IMPACTS OF CORPORATE SOCIAL RESPONSIBILITY ON GREENHOUSE GAS EMISSIONS ........................................ 67
FOOD AND CLIMATE CHANGE: A CHALLENGE FOR MARKETS AND FOOD SYSTEMS ............................................................................ 67
IMPACTS OF CORPORATE SOCIAL RESPONSIBILITY ON THE MAJOR SOURCES OF GREENHOUSE GAS EMISSIONS IN THE FOOD SYSTEM ........... 68
Land use change ...................................................................................................................................................... 68
Reducing emissions from pre-farm activities .......................................................................................................... 70
Emissions from agriculture ...................................................................................................................................... 71
Emissions from processing, food manufacturing and retail .................................................................................... 71
Consumption ........................................................................................................................................................... 73
THE AMBITION OF CORPORATE SOCIAL RESPONSIBILITY STRATEGIES ............................................................................................. 73
Strategic ambition and reach within the food system ............................................................................................ 73
6. OUTLOOK AND RECOMMENDATIONS ................................................................................................................. 76
FARMING AND FOOD: A SECTOR IN TRANSFORMATION .............................................................................................................. 76
What are the drivers and will these be sustained? ................................................................................................. 76
RECOMMENDATIONS ......................................................................................................................................................... 80
Maintain momentum .............................................................................................................................................. 80
Reduce fragmentation ............................................................................................................................................ 81
Review and tighten certification standards ............................................................................................................ 81
Use innovative market-based mechanisms ............................................................................................................. 81
Support more fundamental change to climate-responsible farming ...................................................................... 81
Support fundamental change in the food system ................................................................................................... 82
Extend efforts to emerging markets ........................................................................................................................ 82
Work with public policy ........................................................................................................................................... 82
ANNEX 1. CORPORATE CLIMATE RESPONSIBILITY ACTIVITIES ................................................................................ 83

The role of corporate social responsibility in reducing greenhouse gas emissions from agriculture and food.
Draft for public consultation
6
PREFACE
This study was conducted in 2013 and 2014 to examine the effect of corporate social
responsibility (CSR) strategies and programmes on greenhouse gas emissions (GHG)
from agriculture and food.
Climate protection is subject to a profound market failure and this raises questions about
the true commitment that can be made to climate protection in CSR strategies and the real
effectiveness of resulting measures. An extensive academic literature on CSR exists,
much of it using disciplines such as behavioural economics to examine the evolution,
drivers and consequences of CSR. The effect of CSR on the corporate world, on
consumer behaviour, on the role of governments, and even on democracy is debated. Our
purpose is not to contribute to debate about the principles of CSR. Instead, this study
addresses a practical question: are agri-food sector CSR programmes making an impact
on greenhouse gas emissions?
Firms’ own reports provide our primary evidence base, augmented by academic reports of
mitigation approaches and progress. The challenge of reconciling the need to generate
profit with the cost of reducing greenhouse gas emissions from food raises a number of
practical questions that this study addressed: What type of corporate responsibility
strategies are operating in the agriculture and food sector which are relevant to climate
protection? How do the resulting measures impact on primary production (farming) where
a very large number of suppliers are in competition with each other in commodity markets?
How do these strategies impact on direct supply chain carbon dioxide emissions? How
do these strategies impact on other GHG emissions, especially nitrous oxide and
methane? What effect has CCR on land use change?
In addition to examination of the reports cited, the firms studied were consulted on the
early draft of this report. We are very grateful for the time companies took to examine our
findings and to provide additional data and comments. The results however remain our
considered and completely independent assessment based on our observation of the
evidence cited.
Dr Donal Murphy-Bokern and Dr Linda Kleeman

The role of corporate social responsibility in reducing greenhouse gas emissions from agriculture and food.
Draft for public consultation
7
1. EXECUTIVE SUMMARY
The aim of the research reported here is to examine how corporate social responsibility
(CSR) strategies in the agri-food sector address the causes of greenhouse emissions from
the agri-food sector. We analysed the CSR strategies of a sample of 40 firms and from
this we provide an assessment of how CSR addresses GHG emissions. This was
achieved in three steps. First, we assessed to what extent CSR activities target relevant
emission sources. Second, we analysed their ambition and reach in terms of change
envisaged and their contribution to climate protection. Third, we considered the drivers
behind the development of CSR to mitigate greenhouse gas emissions, which we term as
‘corporate climate responsibility (CCR)’, to estimate the longevity and likely future ambition
of these activities.
The analyses show that CCR has grown significantly in the agri-food sector in the last
decade and that this trend is robust. Our overall conclusion is that considering the
commercial constraints and the obligations of firms to shareholders, CCR is contributing to
climate protection. These private sector efforts alone are not sufficient to achieve the far
reaching change necessary if the agri-food sector is to contribute to climate protection in
proportion to its contribution to emissions and the emission reductions required across the
economy for climate stabilisation. However, the extent of CSR activities, their very rapid
growth, and in particular recent efforts to standardize certification across whole sectors or
countries combined with synergies with public sector regulatory activity means that CSR is
now an important component of wider climate protection efforts.
The CCR effort extends across the whole agri-food sector. These efforts are still new in
many of the firms we sampled, with many firms now reporting just the early phases of
efforts to reduce GHG emissions. The development of these strategies and activities
continued during the global financial crisis of 2007 to 2010. From this and our examination
of firms’ strategy documents, we conclude that the drivers behind CCR are central to firms’
strategies and not marginal or passing activities. Many current strategies set out plans to
extend current activities. This growth is particularly clear in terms of the use of certified
produce with targets to reach 100% by 2020 common. Similarly, reductions in energy use
in operations of up to 20% by 2020 are also common.
Differences between firms in commitment as indicated by the number of mitigation
activities undertaken cannot be attributed to differences in forms of business ownership or
to the differences in terms of where firms are head-quartered or registered. Firms that are
hardly visible to consumers are as committed as firms with valuable consumer brands.
Greater recognition is required of the need to support collaboration across sectors,
including with public policy development, can support climate-responsible supply chains
and in particular add to disincentives for irresponsible production.

The role of corporate social responsibility in reducing greenhouse gas emissions from agriculture and food.
Draft for public consultation
8
Approach: We have ranged widely in terms of the various forms of corporate social
responsibility strategies, related mechanisms and supporting instruments. We took two
parallel approaches independent of each other: we qualitatively examined the corporate
social responsibility schemes operated by 40 organisations (39 companies and one
association) in the food system. Parallel to this, and independently, we examined the
financial and other data that we could obtain about these firms. This provided the
evidence we used for our analysis. In addition to examining the strategies as presented by
firms, we examine the instruments used and how these interact with the processes driving
greenhouse gas emissions in the food value chain.
The challenge: We start with a description of corporate social responsibility as it operates
in the food sector, together with some historical background and social context. This is
followed by an overview of emission processes. The food system is a major source of
emissions, comparable with transport. Primary production activities (farming) are
dominant in terms of emission sources, with emissions largely independent of energy use
and linked to fundamental biological processes in the soil and in animals. Beyond the farm
gate, refrigeration is an important source of emissions.
The corporate social responsibility response: The firms we examined ranged from the
world’s largest food company (Nestle) to a micro-brewery in the Netherlands. The sample
covers the supply chain from the supply of planting media through to high-value catering.
We identified a total of 166 individual measures operated through the sample. The
average number of measures operated at firm level in the sample was 18. Large
international food firms commonly operate in excess of 30 measures each. The focus of
most of these is primary production through agri-food certification, setting farm practice,
and providing training or technical support. The major focus in processing, manufacture
and distribution is energy consumption.
In broad terms, corporate climate responsibility (CCR) activities focus on the most
important emission sources, particularly primary production. Food manufacturing is also
well represented. Significant emission sources which are not the focus of CCR activities
include fertiliser manufacture, transport, and food storage and preparation in the home.
Many of these apparent gaps are due to the lack of influence firms have in these areas.
Where quantifiable, the targets set by firms are generally ambitious and their reports also
indicate solid progress against targets over the last five years. There is also a rapid
growth in commitment to agri-food certification in major traded commodities such as soy,
palmoil, coffee and cocoa.
The level of commitment to CCR was similar across types of company ownership and
governance (publicly listed, private or mutual). However we did observe a pattern linked to
the country of origin of firms. In our sample, the American- and British-based firms support
on average more activities that firms in our sample based in continental Europe.

The role of corporate social responsibility in reducing greenhouse gas emissions from agriculture and food.
Draft for public consultation
9
Significantly, firms such as commodity traders in our sample that are not visible to
consumers are just as committed as firms with highly visible consumer brands.
Impacts on emissions: Impacts vary along the value chain. Starting with land use
change, the evidence that corporate social responsibility alone is impacting on global land
use change emissions is weak. This is not due to a lack of commitment and effort. It is
due to the fragmented nature of effects on land-use decisions and ‘shunting’ within
markets for resources. The ‘shunting’ effect is when commodity rejected by climate
responsible firms is purchased by firms not operating climate responsibility schemes.
However, there is rapid growth in the demand for certified produce and also the success of
associated measures such as the ABIOVE moratorium on soy from recently cleared land.
Deforestation is a difficult problem to address. Companies should not be discouraged by a
lack of highly visible progress. They are contributing to a wider effort to deal with
deforestation and deforestation rates have dropped significantly.
On the farm side, we conclude that measures aimed at reducing farm emissions are
having a wide range of diffuse benefits arising from a general improvement in production
efficiency benefits of training, awareness and networking of producers. There is little direct
emphasis on the major emission processes: nitrous oxide emissions from soils, methane
emissions from livestock production, and the loss of carbon from soils. For example,
increasing the efficiency of nitrogen use within farming systems is rarely mentioned.
However, even if activities are not directly impacting on major emission processes, this
technical support is generally beneficial in terms of greenhouse gas emissions. Some
measures enable farmers to estimate farm-level greenhouse gas emissions, such as the
provision of the Cool Farm Tool. This has the potential to significantly raise farmers’
awareness of the effect of their decisions on emissions and to achieve reductions through
technical improvement in the longer term. It is significant that private sector interest in
corporate social responsibility has stimulated public sector measures such as the Origin
Green programme run by the Irish Food Board. This public sector-wide approach to
production certification is evidence of far-reaching impact of corporate social responsibility
approaches.
The most focused activities can be found in the post-farm side: processing, manufacture
and retail where energy use is the major target. A very wide range of energy saving
technologies have been adopted and there is also evidence of some investment in system
changes, such as transferring freight from road to rail.
We identified no corporate social responsibility activities that explicitly support
consumption change for the purpose of climate protection. The lack of attention to
consumption even extends to businesses with strong plant-based food brands that could
benefit. Similarly, the growth in the market for frozen or chilled ready-made meals and
similar food products is not challenged.

The role of corporate social responsibility in reducing greenhouse gas emissions from agriculture and food.
Draft for public consultation
10
The ambition: Overall, the majority of firms in our sample (24 from 40) are focused mostly
on incremental product or process improvement. Programmes that support more radical
change are confined largely to companies in niche areas, particularly those associated
with the organic sector. 14 firms are classified as making significant efforts to improve
whole supply chains, 5 firms are focused on radically new products and processes, and 4
firms exhibit features of both these and tend towards changing the business model.
Outlook and recommendations: Our study reveals an agri-food sector in transformation.
Almost all of the firms we examined have introduced their corporate climate responsibility
strategies and activities in the last decade. We identified four types of responses on the
part of firms: cost reduction; brand enhancement; support partnerships; and pioneering
investment. Patterns are difficult to identify because corporate climate responsibility is
predominantly added on to existing strategies originally focused on social and other
environmental goals.
Maintain momentum
Corporate climate responsibility in the food sector is relatively new. It has grown rapidly
over the last decade, building largely on existing corporate social responsibility activities
aimed at social and wider environmental outcomes. Even though this activity is still in its
infancy, there is evidence of a widespread change in business culture operating through
supply chains. The proportions of major internationally traded commodities now certified
are significant. However, there is still little evidence that they have reached a level that
gives clear disincentives to minimum standard production, given the buffering effects of
other growing markets. Premia for certified produce remain low. The priority for climate
responsible firms must be to grow and consolidate the market for climate-responsible
produce. The sector must support measures to identify produce that is not associated with
land-use change and generate clear farm-level financial incentives for its responsible
production. We recommend that companies with corporate climate responsibility
programmes should redouble efforts to grow the market for responsible produce.
Consumers can be confident that responding positively to these activities is
beneficial.
Reduce fragmentation
The agri-food sectors climate responsibility efforts are fragmented. The foundations of
pre-competitive collaboration to address this have been laid in various fora such as the
Sustainable Agricultural Initiative. The climate-responsible agri-food sector should
work to reduce fragmentation of efforts and to consolidate activities.
Review and tighten certification standards
Agri-food certification, particularly commodity certification, is controversial. NGOs argue
that many standards relevant to greenhouse gas emissions, particularly land use change,
are too lax. Linked to pre-competitive collaboration, the agri-food sector should
tighten certification standards to achieve zero land-use change from certified food.

The role of corporate social responsibility in reducing greenhouse gas emissions from agriculture and food.
Draft for public consultation
11
Use innovative market-based mechanisms
The challenge of sourcing and tracing supplies from responsible producers is one of the
barriers to developing corporate climate responsibility. This is particularly challenging in
commodity markets where segregation and distinguishing between batches of bulk
commodity from different sources is difficult. Trade in certificates rather than in physically
segregated material enables food business to rapidly grow demand for certified produce
and to transmit premiums to certified growers effectively. This mechanism could be an
important component of pre-competitive efforts to create critical mass in the demand and
rewards for climate responsible production. The food industry needs to work
collectively to develop the trade in certificates and understanding of the benefits.
This may require efforts in explaining the impact of an effective and rewarding
certified produce credits to consumers.
Support more fundamental change to climate-responsible farming
Biological processes on farms are a major source of greenhouse gas emissions. Tackling
these requires addressing the emissions at source by reducing the loss of soil carbon, the
intensity of the nitrogen cycle, and methane from ruminants and manure. Generally,
corporate social responsibility at this level is focused on promoting good general farm
practice but there is relatively little effort to impact fundamentally on emission processes at
the system level. This would involve investment changing land use in some cases to
reverse the decline in soil organic matter levels, efforts to increase nitrogen use efficiency
at a range of scales, and efforts to raise the efficiency of ruminant whole herds and flocks.
We recommend that existing programmes of technical support to farmers be
examined for their impact on basic emission processes and revised if scope for
greater impact is found. In particular, efforts to raise the efficiency of nitrogen and
protein use should be supported. Much of this is pre-competitive activity which
could be done in conjunction the public research base and with regulation (for
example the regulation of fertiliser and manure use.)
Support fundamental change in the food system
The case for changing ‘western’ diets to simultaneously improve public health and climate-
related outcomes is compelling. With the exception of Barilla and Provamel that are
specialised in products with small carbon footprints, and Tesco which is providing carbon
footprint data on many of its products, we identified no serious efforts to support dietary
change to lower carbon-footprint diets. We recommend that food industry actors that
are serious about corporate climate responsibility work to facilitate dietary change
towards lower carbon footprint diets in developed economies in line with relevant
public health recommendations.
Extend efforts to emerging markets
The drivers behind land-use change will remain in place as long as commodity producers
associated with land-use change find ready markets. The relevant expanding markets are
in Russia and China, and a wide range of developing economies for palm oil. Even if all

The role of corporate social responsibility in reducing greenhouse gas emissions from agriculture and food.
Draft for public consultation
12
markets in developed western economies focused entirely on climate-responsible produce,
the trade with these emerging markets can provide adequate outlets for uncertified
production. We recommend that the food sector together works to increase the
market for certified produce in these emerging markets. This is a long term effort,
but it will send a signal to producers that irresponsible production practices
compromise access to global market position in the long term.
Work with public policy
Governments ultimately bear the responsibility for levelling the competitive playing field,
ensuring public welfare, and protecting public goods. Parallel to cross-sector pre-
competitive collaboration, the food sector can actively support public policy development
and regulation to add to the incentives for climate-responsible supply chains and in
particular to add to disincentives for irresponsible production. The success of ABIOVE soy
moratorium shows how this can work, and the public sector Origin Green initiative in
Ireland is a sector-wide semi-state approach. Working together, the food industry
operating at farm level and local regulators can achieve a great deal to create advantage
for responsible producers. Corporate social responsibility strategies should place
much greater emphasis in supporting the development and enforcement of
regulation and public policy to support climate-responsible production

The role of corporate social responsibility in reducing greenhouse gas emissions from agriculture and food.
Draft for public consultation
13
1. INTRODUCTION
There has been huge growth in the number and scope of corporate social responsibility
strategies and activities operating in the food sector over the last 15 years. Consumers
are now frequently presented with the opportunity to purchase products and services that
producers, manufacturers and retailers claim are produced with special attention given to
minimising negative social and environmental impacts, additional to those required by law.
Global brands and household names such as Coca-Cola, McDonald’s and Nestle have
corporate social responsibility (CSR) strategies that, amongst other objectives, aim to
reduce greenhouse gas emissions. The question addressed by the research reported
here is how are such corporate social responsibility strategies and measures affecting
greenhouse gas emission from the agriculture and food sector? We refer to this aspect of
corporate social responsibility (CSR) as ‘corporate climate responsibility (CCR)’.
Some background
Food is estimated to be directly and indirectly responsible for 20-30% of global
greenhouse gas emissions.1 2 In terms of consumers’ carbon footprints in developed
economies, food ranks as high as other major categories of consumption such as home
heating and private transport. The processes behind emissions from food production are
more complex than from the energy sector. The effects of consumer choice on agricultural
and food greenhouse emissions, along with other impacts of the food system, are widely
debated.3 4
Who is responsible for emissions from the food sector? There are two ways of addressing
this question. One is to use the approach taken by national emission inventory systems
and attribute emissions to economic sectors. For food, this approach implies that
responsibility rests with producers, processors and other actors at each stage of the food
chain. The second is to allocate the emissions to food products at the point of use and to
quantify those product-related emissions using life-cycle assessment (LCA). With LCA,
1 IPCC. 2007. Climate Change 2007: Synthesis Report. Intergovernmental Panel on Climate Change,
Geneva. 2 Smith P., M. Bustamante, H. Ahammad, H. Clark, H. Dong, E.A. Elsiddig, H. Haberl, R. Harper, J. House,
M. Jafari, O. Masera, C. Mbow, N.H. Ravindranath, C.W. Rice, C. Robledo Abad, A. Romanovskaya, F. Sperling, and F. Tubiello, 2014: Agriculture, Forestry and Other Land Use (AFOLU). In: Climate Change 2014: Mitigation of Climate Change. Contribution of Working Group III to the Fifth Assessment Report of the Intergovernmental Panel on Climate Change [Edenhofer, O., R. Pichs-Madruga, Y. Sokona, E. Farahani, S. Kadner, K. Seyboth, A. Adler, I. Baum, S. Brunner, P. Eickemeier, B. Kriemann, J. Savolainen, S. Schlömer, C. von Stechow, T. Zwickel and J.C. Minx (eds.)]. Cambridge University Press, Cambridge, United Kingdom and New York, NY, USA. 3 Streck, M and Draf, S. 2010. Der Preis ist billig, aber das Fleisch ist schwach. Stern 27.05.2010. 32-44.
4 Garnett, T. 2008. Cooking up a storm. Food, greenhouse gas emissions and our changing climate. The
Food and Climate Research Network.

The role of corporate social responsibility in reducing greenhouse gas emissions from agriculture and food.
Draft for public consultation
14
environmental burdens and their impacts are explicitly allocated to the product or service
consumed (the so-called ‘functional unit’). This helps all involved in the supply chain,
including consumers, identify the effects of their decisions and activities. This LCA-based
approach can have a profound effect on how consumers think about the causes of
environmental problems. Instead of attributing environmental impacts to the processes
such as ‘farming’ or ‘industry’ that directly give rise to them, LCA focuses thinking on the
consumption decisions by linking the decision to use a product or service to environmental
impacts arising from its production.
The implication of the use of LCA and other emission calculation techniques in public
debate is that consumers can influence environmental outcomes through their decisions.
Assuming good and correct consumer information and a significant share of consumers
value low-emission food and agricultural products, the cumulative effect of millions of such
informed consumption decisions would be an improvement in the relevant environmental
conditions brought about by decisions made within the supply chains involved. In these
circumstances, a significant share of firms will act to reduce emissions in production and
create new environmental friendly products. The development of this industrial ecology
approach to consumption decisions, the goal of which is the evolution of the world’s
industrial activity into a sustainable and environmentally benign system5, is an important
part of the context of the development of corporate climate responsibility.
Definitions and drivers
The term "corporate social responsibility" (CSR) is associated with or at least related to
terms such as triple-bottom line, corporate ethics, and creating shared value. The
common theme of CSR and related goals is commercial firms’ consideration of their
impact on wider societal interests, particularly their social and environmental impacts.6
The modern understanding of corporate social responsibility stems from the 1800s,
although the concept first took widespread hold in the forms we see today in the 1950s.7
The Civil Rights movement, the Women’s Movement, and the Environmental Movement all
contributed to the development the concepts that took hold and impacted on the corporate
world into the 1990s.8
5 Socolow, R., Andrews, F., Berkhout, F. and Thomas, V. 1994. Industrial ecology and global change.
Cambridge University Press. 6 Abagail, M. and Donald, S. 2001. Corporate social responsibility: a theory of the firm’s perspective.
Academy of Management. The Academy of Management Review 26 (1): 117-127 7 Visser, W. 2010. The Evolution of Corporate Social Responsibility. In: Responsible Business: How to
Manage a CSR Strategy Successfully. Eds: Pohl, M. and Tolhurst N., Wiley. 8 Wokutch, R.E. 1990. Corporate Social Responsibility Japanese Style. The Executive, 4 (2) 56-74

The role of corporate social responsibility in reducing greenhouse gas emissions from agriculture and food.
Draft for public consultation
15
While approaches to CSR vary, there are a number of international guidelines that support
a common understanding and approach. These are particularly relevant to large
international companies operating in different markets. These include OECD Guidelines
for Multinational Enterprises; the ten principles of the United Nations Global Compact; the
ISO 26000 Guidance Standard on Social Responsibility; the ILO Tri-partite Declaration of
Principles Concerning Multinational Enterprises and Social Policy; and the United Nations
Guiding Principles on Business and Human Rights. A number of working definitions and
descriptions are used. These tend to reflect the background business and political
cultures in the various countries concerned. The definition of CSR is the subject of
academic enquiry.9 In the USA, the Harvard Kennedy School of Government defines CSR
as a firm’s approach to making profit, rather than just to what they do with profits.10 This
focuses on the internal business processes that lead to profit and emphasises that efforts
must go beyond philanthropy (which is a feature of US firms) and compliance with the law.
It focuses attention on how companies manage their economic, social, and environmental
impacts in the workplace, the marketplace, the supply chain, and the wider the community.
The European Commission defines corporate social responsibility as “the responsibility of
enterprises for their impacts on society”. To fully meet their social responsibility,
enterprises “should have in place a process to integrate social, environmental, ethical
human rights and consumer concerns into their business operations and core strategy in
close collaboration with their stakeholders”.11 In line with the Harvard definition, the
German Federal Ministry of Labour and Social Affairs emphasises the efforts beyond legal
minima and says that CSR means voluntary commitments that go beyond what is required
by law.12
There is a long tradition of corporate social responsibility in Japan. Responsibility towards
employees is a major underlying driver, particularly with regard to health and safety.13
Environmental responsibility is also strong in the Japanese approach. Public policy
actively supports voluntary environmental protection in business and environmental
responsibility is seen as aligned with financial goals with emphasis on resource
conservation. In other Asian countries, for example South Korea, CSR has developed as
part of the response to financial challenges. There is a focus on financial responsibility
and corporate governance.14
9 Dahlsrud, A. (2008). How corporate social responsibility is defined: an analysis of 37 definitions. Corp.
Soc. Responsib. Environ. Mgmt 15: 1-13. 10
Harvard Kennedy School. The initiative defining Corporate Social Responsibility. http://www.hks.harvard.edu/m-rcbg/CSRI/init_define.html 11
European Commission 2011. A renewed EU strategy 2011-14 for Corporate Social Responsibility. Communication from the European Commission. 12
Bundesministerium für Arbeit und Soziales. 2012. CSR Made in Germany. 13
Wokutch, R.E. 1990. Corporate Social Responsibility Japanese Style. The Executive, 4 (2) 56-74 14 Wokutch, R.E. 1990. Corporate Social Responsibility Japanese Style. The Executive, 4 (2) 56-74
The role of corporate social responsibility in reducing greenhouse gas emissions from agriculture and food.
Draft for public consultation
16
This study was conducted in a period of rapid growth in CSR activity. According to KPMG,
in 2005, 90 percent of Japanese companies, 71 percent of UK companies and 32
percent of US companies participated in CSR reporting. According to KPMG15 16, in
2011 CSR reporting had increased to involve 95 percent of the 250 largest
companies in the world. Becchetti et al.17 identify globalisation as an underlying driver of
modern corporate social responsibility arguing that as consumption becomes more
distanced from production, the quest for assurance that production in distant countries
complies with consumers’ values increases. They also identify national differences in
deep rooted legal traditions as contributing to the differences in emphasis in corporate
social responsibility, particularly the difference between legal systems based on civil law in
the Anglo-Saxon tradition and the common law traditions of continental Europe. They
argue that CSR complements the Anglo-Saxon legal tradition in particular. In effect, it
represents private sector efforts prevent a ‘race-to-the-bottom’ where legal systems give
priority to protecting private interests. This has supported a tradition of corporate
philanthropy which in turn has seeded interest in CSR in North America and the United
Kingdom in particular.
A large literature exists from research about the development and consequences of CSR.
Much of it deals with matters outside the scope of this study, for example the range of
corporate strategic motives and effects of CSR. For the purposes of this study we can
deduce several drivers from the literature. These can be categorised as:
1. company values and personal values of the owners and management;
2. strategy and competitiveness;
3. brand and reputation; and
4. avoiding or shaping regulation.
With respect to climate change, the second driver in the form of cost savings, new
business opportunities and consumer preferences were found to be by far the most
important.18 Brand and reputational benefits are also important. Avoiding or influencing
15 KPMG Global Sustainability Services, 2005, KPMG International Survey of Corporate Responsibility
Reporting, downloadable at http://www.kpmg.de/docs/CSR_Reporting_2005.pdf 16
KPMG, 2011, International Survey of Corporate Responsibility Reporting, downloadable at
http://www.kpmg.com/PT/pt/IssuesAndInsights/Documents/corporateresponsibility2011.pdf 17
Becchetti, L., Ciciretti, R. and Conzo, P. 2013. The legal origins of corporate social responsibility. CEIS
Tor Vergata Research Paper Series. Vol. 11 (12), No. 291. October 2013. 18
Varnäs, A., Vulturius, G., Benzic, M., Carson, M. and Davies, M. Broadening Horizons: Business
Engagement with climate change in 2007 and today. 3C/SEI Final report. Stockholm Environment Institute,
Sweden

The role of corporate social responsibility in reducing greenhouse gas emissions from agriculture and food.
Draft for public consultation
17
regulation may also be a driver 19 although there are examples of firms encouraging
regulation from a CSR standpoint.
Approach
The study is used three strands of investigation: a study of relevant academic and
technical or commercial literature; a quantitative analysis of data from 40 agri-food firms
that engage in corporate social responsibility activity; and a qualitative assessment of
material published by these 40 firms. The quantitative and qualitative assessments of
information from firms were done independent of each other.
The research began with an internet search of firms involved in agriculture and food that
have CSR strategies or reports. A sample of 40 of these firms was taken and these
provided the foundation of the data used in the study.
The quantitative analysis of information from these firms concentrated on identifying
patterns in the quantitative data gathered for the 40 firms from their reports (Table 1).
These data relate to the number of activities they supported that are relevant to reducing
greenhouse gas emissions, firm size, sector, capital intensity, country of origin and
consumer linkages. In particular, we describe and classify certifications used and carbon
targets set.
Our quantitative analysis revealed the limitations to assessing corporate social
responsibility activities on the basis of firms’ data. Complementing it, and independent of
the quantitative analysis, CSR documents published by the 40 firms were examined to
identify how relevant measures are used and how the firms describe the interaction
between these and emission processes.
Based on these three steps we classify corporate social responsibility programmes and
activities in relation to their potential impact on greenhouse gas emissions and their
potential for inducing larger change processes in the food sector.
19 Kitzmueller, M., and Shimshack, J. (2012). Economic Perspectives on Corporate Social Responsibility.
Journal of Economic Literature, 50(1): 51–84.

The role of corporate social responsibility in reducing greenhouse gas emissions from agriculture and food.
Draft for public consultation
18
Table 1. Sources of information on firms’ approaches to CSR used in this report.
Firm Source documents used (latest available at the time of the research) Associated British Foods Measuring our responsibility – corporate responsibility 2010 Archer Daniels Midland Corporate responsibility overview 2011; Our commitment to sustainable cocoa
(2011) Alfred Ritter GmbH Verantwortung ist bunt – Nachhaltigkeit bei Ritter Sport (2011) Arla Foods Sustainable Agriculture Factsheet (2011), Climate Change Factsheet (2010).
General statement on Arla Foods´ position on carbon offsetting. Barilla Good for you, sustainable for the planet … in other words our way of doing
business 2011 Barry Callebaut Corporate social responsibility and sustainability 2011/12 (2011) Cargill 2012 Corporate responsibility report – Our responsibility in a changing world CocaCola 2011/12 Sustainability report, 2011/12 GRI report COOP Group Sustainability Report 2012 Del Monte Del Monte corporate website 04.03.2013 Danone Sustainability Report 2012 Ferrero Sharing values to create value - Corporate Social Responsibility report 2012 General Mills General Mills Website 22.02.2013 Glanbia Our journey of growth and sustainability 2012; Website 20.02.2013 Gulpener Bier Firm website 04.03.2013. European Commission (2003) Responsible
entrepreneurship: A collection of good practice cases among small and medium-sized enterprises across Europe.
H. J. Heinz Company Corporate Social Responsibility Report 2011 Hershey 2013 Corporate social responsibility report Hipp Nachhaltigkeitsbericht 2012 John Lewis Partnership Sustainability Report 2012 Kelloggs 2012 Corporate Responsibility Report and website 04.03.2013 Klasmann Deilmann Sustainability Report 2013 Kraft Foods Our progress in 2011 – creating a more delicious world Marks and Spencer How we do business report 2012 Mars Putting our principles into action to make a difference
to people and the planet through our performance 2011 (published 2012) McCain Food Corporate social responsibility benchmark report 2009 and website 26.02.2013 McDonald’s Corporate social responsibility and sustainability report 2012- 2013 Morrisons Corporate responsibility review 2011 Nestlé Creating shared value and meeting our commitments 2012 Peeze Coffee Website 11.10.2013 PepsiCo Performance with a purpose 2012, website on 08.04.2013 and 19.03.2013 PHW Group Website 26.02.2013 Provamel Website 07.03.2013 Sainsburys Our 20 commitments to help us all Live Well For Less - Our progress so far
2013 Starbucks 2012 Global Responsibility Report, Café practices, Supplier standards Stora Enso Global Responsibility Report 2012 SRA
a Website 07.03.2013
Tesco Corporate Responsibility Review 2012 Tchibo Sustainability Report 2011 update, Tchibo Nachhaltigkeitsbroschüre (undated) Unilever Unilever Sustainable Living Plan, Progress Report 2012. Promoting Sustainable
Biofuels (undated); Sustainable Agriculture Code (undated); Sustainable Water (undated)
Walmart Global Responsibility Report 2012

The role of corporate social responsibility in reducing greenhouse gas emissions from agriculture and food.
Draft for public consultation
19
2. EMISSIONS AND THEIR MITIGATION
To consider the effect of agriculture and food-oriented corporate social responsibility
schemes on the greenhouse emissions, we need first to consider the sources and
magnitude of relevant emissions and how they might be mitigated. Mitigation is defined
by the IPPC as a technological change or substitution which reduces GHG emissions or
enhances carbon sinks.20
Global estimates identify food as a category of consumption with one of the highest carbon
footprints. One global study, which reflects consensus in the scientific community,
estimates that food (excluding land-use change) is responsible for 27% of global
greenhouse gas emissions compared with 26% for heating, cooling and lighting, and 20%
for transport.21 In the recent Fifth Assessment Report of the Intergovernmental Panel on
Climate Change, agriculture, forestry and other land uses is estimated to be directly and
indirectly responsible for one quarter of global GHG emissions.22 Because food is a
necessity, the absolute level of emissions is relatively stable in relation to consumers’
expenditure.23 The animal-based component of the food system is a major source of these
emissions. A FAO report estimates that emissions from livestock account for 18% of
global emissions.24 Another study estimates that livestock account for about 12% to global
anthropogenic GHG emissions.25
National and regional studies support these global assessments. The Food Climate
Research Network reported that the UK food chain (production, processing and retail, but
20 Smith, P., D. Martino, Z. Cai, D. Gwary, H. Janzen, P. Kumar, B. McCarl, S. Ogle, F. O’Mara, C.
Rice, B. Scholes, O. Sirotenko, 2007: Agriculture. In Climate Change 2007: Mitigation. Contribution of Working Group III to the Fourth Assessment Report of the Intergovernmental Panel on Climate Change [B. Metz, O.R. Davidson, P.R. Bosch, R. Dave, L.A. Meyer (eds)], Cambridge University Press, Cambridge, United Kingdom and New York, NY, USA. 21
Hertwich, E. G. and G. P. Peters. (2009). Carbon footprint of nations: a global, trade-linked analysis. Environmental Science & Technology 43(16): 6414-6420. 22
Smith P., M. Bustamante, H. Ahammad, H. Clark, H. Dong, E.A. Elsiddig, H. Haberl, R. Harper, J. House, M. Jafari, O. Masera, C. Mbow, N.H. Ravindranath, C.W. Rice, C. Robledo Abad, A. Romanovskaya, F. Sperling, and F. Tubiello, 2014: Agriculture, Forestry and Other Land Use (AFOLU). In: Climate Change 2014: Mitigation of Climate Change. Contribution of Working Group III to the Fifth Assessment Report of the Intergovernmental Panel on Climate Change [Edenhofer, O., R. Pichs-Madruga, Y. Sokona, E. Farahani, S. Kadner, K. Seyboth, A. Adler, I. Baum, S. Brunner, P. Eickemeier, B. Kriemann, J. Savolainen, S. Schlömer, C. von Stechow, T. Zwickel and J.C. Minx (eds.)]. Cambridge University Press, Cambridge, United Kingdom and New York, NY, USA. 23
UNEP (2010) Assessing the Environmental Impacts of Consumption and Production: Priority Products and Materials, A Report of the Working Group on the Environmental Impacts of Products and Materials to the International Panel for Sustainable Resource Management. Hertwich, E., van der Voet, E., Suh, S., Tukker, A., Huijbregts M., Kazmierczyk, P., Lenzen, M., McNeely, J., Moriguchi, Y. 24
Steinfeld, H, Gerber, P, Wassenaar, T, Castel, V, Rosales, M and C de Hann. 2006. Livestock’s long shadow. Food and Agriculture Organisation of the United Nations (FAO). 25
Westhoek, H. et al (2011). The Protein Puzzle. Netherland Environmental Assessment Agency

The role of corporate social responsibility in reducing greenhouse gas emissions from agriculture and food.
Draft for public consultation
20
excluding land-use change) accounts for 19% of UK consumption GHG emissions.26 The
UK Cabinet Office27 reported that 18% of UK greenhouse gas emissions can be attributed
directly to food with just under half of this attributed to UK farming and fishing. Another
analysis of the UK food system shows that livestock products account for a little less than
one third of the dietary energy supply but account for nearly two-thirds of production (farm)
emissions.28 For Western Europe as a whole, the EU Environmental Impact of Products
(EIPRO) study29 identified food as responsible for 20-30% of most categories of
environmental burdens, including greenhouse gas emissions. For greenhouse gas
emissions, this 20-30% attributable to food comprises 4-12% for meat, 2-4% for dairy
products, and about 1% for cereal products.
The estimates cited above cover the whole of the food system comprising five major
stages: pre-farm; on-farm (agriculture); post-farm processing, manufacture and retail; and
the consumption phase. They generally exclude land use change which, if included,
would increase the proportion of emissions attributed to food further. To assess the
effectiveness of CCR activities, some insight into the role of these different stages in the
supply chain is needed.
There is consensus that pre-farm and on-farm emissions account for half or more of total
direct supply chain emissions in developed food economies that have high levels of
livestock product consumption. In most of the studies, the production phase (agriculture
and fisheries) is responsible for more than half of the life-cycle emissions (excluding land-
use change) up to the point of consumption (Figure 1).
26 Garnett, T. 2008. Cooking up a storm. Food, greenhouse gas emissions and our changing climate. The
Food and Climate Research Network. 27
Cabinet Office. 2008. Food matters. Towards a strategy for the 21st century. The Cabinet Office Strategy Unit, UK. 28 Audsley, E., Brander, M., Chatterton, J., Murphy-Bokern, D., Webster, C., and Williams, A. (2009). An assessment of greenhouse gas emissions from the UK food system and the scope for reduction by 2050. How low can we go?. WWF-UK and the FCRN. www.murphy-bokern.com 29 Tukker, A, Huppes, G, Guinée, J, Heijungs, R, de Koning, A, van Oers, L, Suh, S, Geerken, T, Van Holderbeke, M, Jansen, B and P Nielsen. 2006. Environmental Impact of Products (EIPRO). Analysis of the life cycle environmental impacts related to the final consumption of the EU-25. Main report IPTS/ESTO project.

The role of corporate social responsibility in reducing greenhouse gas emissions from agriculture and food.
Draft for public consultation
21
0%
10%
20%
30%
40%
50%
60%
70%
80%
90%
100%
Alcoholic and non alcoholic
beverages
Cereal products
Milk products
Fish Vegetables Meat
End of life
Consumer use
Storage
Transportation
Packaging
Processing
Primary production
Figure 1. The allocation of life cycle stage global warming impacts for selected food
groups to different stages in the production cycle.30
Land use change
Agricultural land generally, and cropped land in particular, almost always carries a lower
stock of carbon in the soil compared with the same land in its wild state. Therefore, the
clearance of land for agriculture is a large source of greenhouse gas emissions, which
continue for decades after clearance until a lower soil carbon steady-state level is reached.
The same is true when permanent grassland is converted to arable. These emissions are
known as land-use change (LUC) emissions.
From 1960 to 2011, agriculture gained almost 500 million ha from other land uses. This
growth in the agricultural area was driven largely by increasing demands for food from a
growing population.31 Over the period 1980 to 2000, it is estimated that about 80% of new
30 Sonigo, P, Bain, J., Tan, A., Johansson, L. Murphy-Bokern, D. Shields, L., Aiking , H., Erb, K., and Kastner, T. (2012). The resource use efficiency of the European food cycle. Report for the European Commission. BIOIS Paris. 31
Smith, P., D. Martino, Z. Cai, D. Gwary, H. Janzen, P. Kumar, B. McCarl, S. Ogle, F. O’Mara, C. Rice, B. Scholes, O. Sirotenko, 2007: Agriculture. In Climate Change 2007: Mitigation. Contribution of Working Group III to the Fourth Assessment Report of the Intergovernmental Panel on Climate Change [B.

The role of corporate social responsibility in reducing greenhouse gas emissions from agriculture and food.
Draft for public consultation
22
land for crops and pastures came from replacing forests, particularly in the tropics.32 This
trend is projected to continue into the future. It is estimated that about 70% of the growth
in agricultural output required to 2050 will come from increases in yield on existing
agricultural land and the remaining 30% will come from conversion of land to agriculture.
About 120 million ha of additional crop land will be used.33
The estimate made for the Intergovernmental Panel on Climate Change (IPCC) is that land
use and land-use change in total accounted for 17% of global greenhouse gas emissions
in 2004.34 There is a great deal of uncertainty about the size of this emission and
estimates range from 8 to 20%.35 About 75% of deforestation and forest degradation can
be attributed to agriculture36 and 58% of deforestation has been attributed to commercial
agriculture connected to international trade.37 Of relevance to this study is the increasing
role of corporate agriculture as a driver.38
The causes of land use change can be classified as direct and indirect. The indirect
causes are changes that drive a general expansion in agricultural land. For example, the
increased demand for rapeseed oil in Europe to produce biodiesel may cause an increase
in vegetable oil prices generally. This indirectly drives expansion of palm oil production.
Expansion in commodity production at the place where land-use change is taking place is
a direct cause. Analyses of land-use change data and corresponding data on agricultural
trade identifies three commodities that are directly associated with a large proportion of
land-use change, particularly deforestation: beef, soy and palm oil. There are other
Metz, O.R. Davidson, P.R. Bosch, R. Dave, L.A. Meyer (eds)], Cambridge University Press, Cambridge, United Kingdom and New York, NY, USA. 32
Gibbs HK, Ruesch AS, Achard F, Clayton MK, Holmgren P, et al. 2010. Tropical forests were the
primary sources of new agricultural land in the 1980s and 1990s. Proc. Natl. Acad. Sci. USA 107:16732–37. 33
FAO. 2006. World agriculture: towards 2015/30. Rome: Food and Agricultural Organization of the United Nations. 34
Barker T., I. Bashmakov, L., Bernstein, J. E. Bogner, P. R. Bosch, R. Dave, O. R. Davidson, B. S. Fisher, S. Gupta, K. Halsnæs, G.J. Heij, S. Kahn Ribeiro, S. Kobayashi, M. D. Levine, D. L. Martino, O. Masera, B. Metz, L. A. Meyer, G.-J. Nabuurs, A. Najam, N. Nakicenovic, H. -H. Rogner, J. Roy, Sathaye, R. Schock, P. Shukla, R. E. H. Sims, P. Smith, D. A. Tirpak, D. Urge-Vorsatz, D. Zhou, 2007: Technical Summary. In: Climate Change 2007: Mitigation. Contribution of Working Group III to the Fourth Assessment Report of the Intergovernmental Panel on Climate Change [B. Metz, O. R. Davidson, P. R. Bosch, R. Dave, L. A. Meyer (eds)], Cambridge University Press, Cambridge, United Kingdom and New York, NY, USA. 35
van der Werf GR,MortonDC, DeFries RS, Olivier JGJ, Kasibhatla PS, et al. 2009. CO2 emissions from forest loss. Nat. Geosci. 2:737–38. 36
Blaser J, Robledo C. 2007. Analysis on the mitigation potential in the forestry sector. Intercooperation Rep. for Secr. UN Framew. Conv. Clim. Change, Bern. 37
Audsley, E., Brander, M., Chatterton, J., Murphy-Bokern, D., Webster, C., and Williams, A. (2009). An assessment of greenhouse gas emissions from the UK food system and the scope for reduction by 2050. How low can we go?. WWF-UK and the FCRN. 38
DeFries RS, Rudel T, Uriarte M, Hansen M. 2010. Deforestation driven by urban population growth and agricultural trade in the twenty-first century. Nat. Geosci. 3:178–81.

The role of corporate social responsibility in reducing greenhouse gas emissions from agriculture and food.
Draft for public consultation
23
commodities directly associated with land use change such as coffee, tropical and citrus
fruit, and maize for livestock feed and biofuels.
In policy terms, deforestation (and other types of destruction of natural vegetation such as
peatland drainage and use) is attributable to due to the valuable private goods generated
by conversion (private land title, timber, and food commodities) compared with the low
economic value of the public goods provided by the forest land. The corporate sector can
address direct land use change by managing or influencing supply chains, for example
through commodity Round Tables and certification. Raising the efficiency with which
existing agricultural land is used can contribute to the reduction in the forces driving
indirect land use change. The opposite effect can also occur if the application of
technology that increases productivity also increases the agricultural value of recently or
illegally cleared land close to the remaining forest. The literature indicates that the
marginal expansion of production, for example in the Amazon biome or countries such as
Indonesia, is heavily dependent on surges in global demand for food and the boom in
commodity prices.
Beef and soy
Brazil is the leading country in recent decades in terms of agricultural expansion as global
food markets grow. Brazil ranks highest in the world in beef production and export, soy
production and export, and in recent decades land-use change (particularly deforestation
of tropical forest and savannah). The effects of beef and soy on tropical deforestation are
interlinked, particularly in Brazil.39 The increased international trade in soy for feeding
livestock in Europe and Asia has driven conversion of savannah and agricultural grassland
to soy production in the Cerrado of Brazil. With the associated changes in land values,
this has resulted in cattle production moving northwards into the Amazon, as well a more
clearance of land in the Cerrado itself. Clearance rates reached unprecedented levels in
2007 when global food prices were rising rapidly. Chomitz40 sets out a model of the
agricultural frontier which identifies the rent from agricultural land as affected by proximity
to food markets as the key driver behind deforestation. Corporate social responsibility will
ultimately be a driver of reduced deforestation of it supports differences in produce value
or market access and ultimately differences in land values between farm businesses that
are not based on recently converted land and those that are. Nepstad et al.41 present
convincing evidence relating to the value of agricultural land. The net present value of
Amazon land for cattle is about $500 per hectare throughout much of the Amazon. This
39 Kaimowitz, D., Mertens, B., Wunder, S. and Pacheco, P. (2004). Hamburger connection fuels Amazon
destruction: Cattle ranching and deforestation in Brazil’s Amazon. Center For International Forestry Research http://www.cifor.cgiar.org/publications/pdf_files/media/Amazon.pdf 40
Chomitz, K. (2007). At loggerheads? Agricultural expansion, poverty reduction, and environment in the tropical forests. The World Bank. 41
Nepstad, D., Almeida, O., Rivero, S., Soares-Filho, B. and Nilo, Jose (2008). Assessment of agriculture and livestock sectors in the Amazon and recommendations for action. Draft Internal WWF Report, 25 January, 2008.

The role of corporate social responsibility in reducing greenhouse gas emissions from agriculture and food.
Draft for public consultation
24
rises to about $1000 per hectare where there is access to export markets. Most of the
Amazon is not (yet) suitable for soy production but where it is, net present land values can
exceed $10,000 per hectare.
Palmoil
Indonesia, Malaysia, Columbia and Papua New Guinea are central to the international
palm oil trade and oil palm is the dominant traded agricultural crop in South-east Asia.
Between 2002 and 2012, which is a period when corporate social responsibility developed
rapidly world-wide, palm oil production nearly doubled from 26 million tonnes to 50 million
tonnes. Indonesia is now the biggest producer with about 24 million tonnes per year
followed by Malaysia with about 19 million tonnes (FAOSTAT). Indonesian production in
particular has grown rapidly over the last decade when agricultural land grew from 46
million ha to 56 million ha and the forest area declined from 99 million ha to 94 million ha.
In Malaysia, the agricultural area remained stable at 8 million ha but the forest area
declined from 22 to 20 million ha.
The Indonesian Government plans to expand oil palm plantations to about 10 million ha by
2020, representing a ten-fold increase in 25 years. This is driven by biodiesel production
as well as food. The social costs of this plantation expansion are huge.42 The world price
of palm oil reached a peak of about $1,100 per tonne in 2008 equating to about $1 per litre
for diesel. A mineral oil price of about $140 dollars per barrel ($0.88/litre) which was
reached in mid-2008 suggesting that the price of palm oil is linked to the price of crude oil
as suggested by Lewis.43
Recent studies try to document land use change in Malaysia and Indonesia.44 From 1990
to 2010 oil palm plantations in Malaysia, Indonesia and Papua New Guinea increased by
approximately 10 Million hectares.45 On the Malaysian peninsula alone total land use
change accounts for 2.7 million hectares from 2006 to 2009.46
42 Marti, S. 2008. Losing ground. The human impacts of palmoil expansion. FOE.
43 Lewis, L. (2008). Biofuels and banquets put pressure on stocks of palm oil. The Times, 9 January.
44 Timothy J. Killeen, T. J. and Goon, J. (2013). Reports from the Technical Panels of the 2nd Greenhouse Gas Working Group of the Roundtable on Sustainable Palm Oil (RSPO). Available online at: http://www.rspo.org/en/reports_from_the_technical_panels_of_rspos_2nd_greenhouse_gas_working_group. 45 Gunarso, P., Hartoyo, M.E., Agus, F. and Killeen, T.J. (2013). Oil Palm and Land Use Change in Indonesia, Malaysia and Papua New Guinea. In: Reports from the Technical Panels of the 2nd Greenhouse Gas Working Group of the Roundtable on Sustainable Palm Oil (RSPO). 46
Timothy J. Killeen, T. J. and Goon, J. (2013). Reports from the Technical Panels of the 2nd Greenhouse Gas Working Group of the Roundtable on Sustainable Palm Oil (RSPO). Available online at: http://www.rspo.org/en/reports_from_the_technical_panels_of_rspos_2nd_greenhouse_gas_working_group.

The role of corporate social responsibility in reducing greenhouse gas emissions from agriculture and food.
Draft for public consultation
25
Reducing land use change for beef, soy and palm oil production
The evidence presented by Jaccoud et al47 suggests that the influence of the final
consumer on the production chain can be strong, especially with respect to expansion in
the transitional lands. The impact that a moratorium in Brazil on soy from recently
deforested areas has had provides useful insight into the potential effects of market
measures. In 2006, the Brazilian Soy Producers Association (ABIOVE) and its member
companies pledged on July 24 2006 not to trade soy originating from land cleared in the
Amazon biome. This was extended for a further year in June 2008, and remained in place
in 2013. Recent research using remote sensing concludes that associated with this
moratorium, soybeans are no longer playing an important role in the deforestation of the
Amazon. The moratorium period saw the lowest deforestation rates in the Legal Amazon
in an historic series of 24 years.48 This ‘moratorium’ is a valuable first step in collectively
addressing the threats to forests but its success in tackling deforestation in Brazil depends
of much wider measures, including measures in the beef sector.
Separate from the ABIOVE moratorium, The Round Table on Responsible Soy (RTRS)
operates a certification programme that enables food and feed industry purchasers of soy
to support soy certified by the RTRS. RTRS certification is controversial and a wide range
of environmental NGOs claim that it is ineffective in reducing deforestation.49 Crucially for
the purposes of this report, there is little evidence that farmers complying with RTRS
standards are rewarded with higher prices compared with uncertified producers. The
premium paid to farmers for certified production is only about 2 to 5 USD.50 In 2013, the
RTRS certified only 1.1 million tonnes or less than 0.5% of global production. Pro Terra,
which focuses on certifying non-GM soy for Europe certified 2.9 million tonnes in 2013.
According to Garret et al. 51 , the premium paid by Pro Terra to farmers is 4 USD/tonne, (in
addition to the premium for non-GM. This compares to their estimate of only 1.5 USD for
RTSO soy.
Consumer driven market mechanisms can complement top-down regulation of land use
change.52 Successful negotiation of social and environmental performance criteria and an
associated system of certification that enhances returns to agriculture on land that does
47 Jaccoud, D’ A., Lemos de Sa, R., Richardson, S. (2003). Sustainability assessment of export-led growth
in soy production in Brazil. WWF. 48
Rudorff, B.F.T., Adami, M., Aguiar, D.A., Moreira, M.A., Mello, M.P., Fabiani, L., Amaral, D.F., Pires, B.M. The soy moratorium in the Amazon biome monitored by remote sensing images. Remote Sensing, v.3, p.185-202, 2011. 49
Friends of the Earth 2012. Roundtable on Responsible Soya – the certifying smoke screen. 50
Information provided to the authors by the RTRS on 17.12.2013. 51
Garrett, R. D., Rueda, X. and Lambin, E.F. (2013). Globalization’s unexpected impact on soybean production in South America: linkages between preferences for non-genetically modified crops, eco-certifications, and land use. Environ. Res. Lett. 8 (2013) 044055 (11pp) doi:10.1088/1748-9326/8/4/04405 52
Nepstad, D.C., Stickler, C.M. and Almeida, O.I. (2006). Globalisation of the Amazon soy and beef industries: opportunities for conservation. Conservation Biology 20: 1595-1603.

The role of corporate social responsibility in reducing greenhouse gas emissions from agriculture and food.
Draft for public consultation
26
not threaten sensitive habitats is a potentially powerful instrument. Efforts to encourage
efficient production in suitable agro-ecological zones could lead to a scenario where
greater market access combined with effective and enforceable policies to manage
expanded production brings mutual reinforcement of economic, environmental and social
benefits.53
The driver behind beef-related deforestation is the difference in the value of forest and
deforested land used for grassland. The forest is worth more dead than alive even though
the resulting grassland is not particularly valuable or productive. Tipping the balance
towards retention of the forest might be achieved by awarding an economic return for the
ecosystem services, for instance through REDD or the Clean Development Mechanism,
provided by the standing forest, by higher prices for selectively harvested (sustainable
logged) timber, and/or market discrimination against food commodities delivered from
newly or illegally cleared forest. Mechanisms to deliver these are developing and could be
applied concurrently to deliver synergistic effects and to avoid unintended consequences
associated with the transfer of agriculture to other forest frontiers.
Pre-farm emissions
Fertiliser manufacture
The pre-farm emissions include emissions from the manufacture of fertilisers and
pesticides. The major source of pre-farm emissions is fertiliser production, particularly the
production of nitrogenous fertiliser. Fertiliser accounts for 37% of all energy expenditure
in US agriculture.54 An analysis of existing LCAs55 of nitrogen fertilisers showed that the
primary energy use in their production ranged from 41 to 49 MJ/kg N with a GWP of 3.0 to
7.4 kg GHGe/kg N in Europe. Some reports suggest that energy use in fertiliser
manufacture outside Europe is higher56 with an average of 65-101 MJ/kg N. The total
amount of nitrogen fertiliser manufactured and used as fertiliser is estimated to be 101
million tonnes in 2009.57 In addition, the total use of phosphorus and potassium is 19
million tonnes and 25 million tonnes respectively. The energy requirement of phosphorus
and potassium is estimated to be 15 and 8 MJ/kg respectively.
53 Jaccoud, D’ A., Lemos de Sa, R., Richardson, S. (2003). Sustainability assessment of export-led growth
in soy production in Brazil. WWF. 54
Lang, T., Barling, D., & Caraher, M. (2009). Food policy: Integrating health, environment & society. Oxford, UK: Oxford University Press. p. 193 55
Williams, A.G., Audsley, E. and Sandars, D.L. (2006) Determining the environmental burdens and resource use in the production of agricultural and horticultural commodities. Main Report. Defra Research Project IS0205. Bedford: Cranfield University and Defra. 56
Bellarby J, Foereid B, Hastings A, Smith P. 2008. Cool Farming: Climate Impacts of Agriculture and
Mitigation Potential. Amsterdam, Neth.: Greenpeace Int. 57
FAOSTAT (website accessed in 12.06.2013).
The role of corporate social responsibility in reducing greenhouse gas emissions from agriculture and food.
Draft for public consultation
27
Based on the emission factors presented by Ballerby et al. and fertiliser production data
for 2009 from the FAO, we estimate that the total greenhouse gas emissions from the
manufacture and distribution of fertilisers to range from 348 to 704 million tonnes CO2e.
This equates to 0.71 to 1.44% to total global emissions. These are dominated by nitrogen
fertilisers which account for 332 to 665 million tonnes GHG equivalent or 0.67 to 1.35 of
total emissions.
The emissions from the production of non-nitrogenous fertiliser are due to the energy used
in mining, transport and processing. These emissions are mitigated as these processes
become more efficient. The situation with nitrogen fertilisers is more complex. The
emission arises from energy use in the process (particularly from natural gas use) and
from emissions of nitrous oxide as a trace product of the reactions.58 Nitrogen fertiliser
production is the largest source of industrial emissions of N2O59 and technical measures
can reduce these by up to 90%. Despite the availability of these measures, it is estimated
that 80% of the world’s nitric acid production is not fitted with this mitigation technology.60
Planting media and compost
The production of planting media for protected cropping is a pre-farm activity that accounts
for a proportion of the impact of the relevant products, e.g. greenhouse-grown salad
crops. It is analogous to fertiliser production for open-field production. The two major raw
materials are peat and mineral fibre (e.g. “Rockwool”).
The production of peat-based media causes loss of peat reserves. In terms of the
emission process, the loss of carbon from degrading peat is the same as any other
emission from long-term carbon stores.
For agriculture or peat extraction, peatland must first be drained and this contributes to the
land-use change emissions discussed earlier. Globally, the carbon dioxide emissions from
drained peatlands (including emissions from peat fires) amount to two gigatonnes per
year61 and represent almost 25 percent of the greenhouse gas emissions from land use,
land use change and forestry sector (LULUCF).62 The proportion of this loss directly
attributable to peat extraction is small. Further, the proportion of extracted peat used for
58 Wood S. and Cowie A. (2004). A review of greenhouse gas emission factors for fertiliser production. IEA
Bioenergy Task 38. 59
United States Environment Protection Agency. 60
Intergovernmental Panel on Climate Change (IPCC) 2000 Good Practice Guidance and Uncertainty Management in National Greenhouse Gas Inventories: N2O Emissions from Adiphic Acid and Nitric Acid Production. London, U.K. 61
Joosten, H. 2009. The Global Peatland CO2 Picture. Peatland status and emissions in all countries of the World. Ede, Wetlands International. 10 pp. (available at: http://tinyurl.com/yaqn5ya ) 62
Canadell, P. 2011. The Global Carbon Budget and the Role of Forests and Peatlands. Presentation
Workshop on Tropical Wetland Ecosystems of Indonesia, Bali, April 11–14, 2011. (available at:
http://www.forestsclimatechange.org/fileadmin/tropicalworkshop/Overview_Session/1P_
CanadellP_GCP.pdf

The role of corporate social responsibility in reducing greenhouse gas emissions from agriculture and food.
Draft for public consultation
28
food production is smaller still. The abstraction of peat for planting media is geographically
concentrated and therefore has significant local impacts. In this study, one of the 40
corporate social responsibility strategies examined comes from Klasmann Deilmann, a
company specialised in producing peat-based planting media.
For protected cropping food production, stonewool and nutrient film technologies are now
much more widely used than compost in modern production systems. Stonewool
production is energy intensive. However, in a LCA of tomato production, the difference
between using stonewool and other nutrient film technologies was reported to be trivial
compared with the other inputs into the tomato production system.63
Biocides (pesticides and pharmaceuticals) manufacture
Ever since the publication of Silent Spring by Rachel Carson in 1962, the use of pesticides
has been the focus of much public, policy and scientific debate. This is reflected in the
strong emphasis on crop protection measures in farm and farm produce certification.
Compared with fertiliser production, the production of pesticides is a comparatively low
GHG emitter estimated to be 30-140 million tonnes CO2e per year.64 The quantities of
veterinary pharmaceutical products used are lower than pesticides and thus they are also
not a large source of greenhouse gas emissions.
Emissions from agricultural production
The IPCC 5th Assessment Report65 estimates that emissions from agriculture, forestry and
other land use (AFOLU) amounts to ca 12 GtCO2e/year in 2010 or 24% of all
anthropogenic greenhouse gas emissions (Figure 2). The IPCC 4th Assessment Report66
estimates that direct emissions from farming activities accounted for an estimated
emission of 5.1 to 6.1 GtCO2e/year in 2004 (10-13% of total global anthropogenic
emissions of greenhouse gases). The greatest proportion of direct emissions comprise
63 Williams, A.G., Audsley, E. and Sandars, D.L. (2006) Determining the environmental burdens and
resource use in the production of agricultural and horticultural commodities. Main Report. Defra
Research Project IS0205. Bedford: Cranfield University and Defra. 64
Bellarby J, Foereid B, Hastings A, Smith P. 2008. Cool farming: Climate impacts of agriculture and mitigation potential. Amsterdam, Neth.: Greenpeace Int. 65
IPCC, 2014: Summary for Policymakers. In: Climate Change 2014: Mitigation of Climate Change.
Contribution of Working Group III to the Fifth Assessment Report of the Intergovernmental Panel on Climate
Change [Edenhofer, O., R. Pichs-Madruga, Y. Sokona, E. Farahani, S. Kadner, K. Seyboth, A. Adler, I.
Baum, S. Brunner, P. Eickemeier, B. Kriemann, J. Savolainen, S. Schlömer, C. von Stechow, T. Zwickel and
J.C. Minx (eds.)]. Cambridge University Press, Cambridge, United Kingdom and New York, NY, USA. 66
Smith, P., D. Martino, Z. Cai, D. Gwary, H. Janzen, P. Kumar, B. McCarl, S. Ogle, F. O’Mara, C. Rice, B. Scholes, O. Sirotenko, 2007: Agriculture. In Climate Change 2007: Mitigation. Contribution of Working Group III to the Fourth Assessment Report of the Intergovernmental Panel on Climate Change [B. Metz, O.R. Davidson, P.R. Bosch, R. Dave, L.A. Meyer (eds)], Cambridge University Press, Cambridge, United Kingdom and New York, NY, USA.

The role of corporate social responsibility in reducing greenhouse gas emissions from agriculture and food.
Draft for public consultation
29
nitrous oxide (N2O) from nitrogen cycle processes in the soil and methane (CH4) emitted
from the digestive system of cattle and sheep and from manure stores (Figure 3).
Figure 2. Total anthropogenic GHG emissions (GtCO2eq/yr) by economic sectors. Inner circle shows direct
GHG emission shares (in % of total anthropogenic GHG emissions) of five economic sectors in 2010.
Source: IPCC 67
In relation to the total amount of these gases emitted, agriculture accounts for about 60%
of N2O and about 50% of CH4. These emissions occur independent of fossil fuel use and
are intrinsic to the biological processes involved in growing crops and producing animals.
The indirect emissions comprise CO2 from land use and land use change.
67 IPCC, 2014: Summary for Policymakers. In: Climate Change 2014: Mitigation of Climate Change.
Contribution of Working Group III to the Fifth Assessment Report of the Intergovernmental Panel on Climate Change [Edenhofer, O., R. Pichs-Madruga, Y. Sokona, E. Farahani, S. Kadner, K. Seyboth, A. Adler, I. Baum, S. Brunner, P. Eickemeier, B. Kriemann, J. Savolainen, S. Schlömer, C. von Stechow, T. Zwickel and J.C. Minx (eds.)]. Cambridge University Press, Cambridge, United Kingdom and New York, NY, USA.

The role of corporate social responsibility in reducing greenhouse gas emissions from agriculture and food.
Draft for public consultation
30
Figure 3. a) Global annual emissions of anthropogenic GHGs from 1970 to 2004. (b) Share of different
anthropogenic GHGs in total emissions in 2004 in terms of GHG-eq. (c) Share of different sectors in total
anthropogenic GHG emissions in 2004 in terms of CO2-eq. (Forestry includes deforestation). Source:
IPCC.68
Nitrogen
Nitrogen is the major ‘GHG nutrient’.69 Nitrous oxide (N2O), a trace gas and a potent GHG,
is a product of the nitrogen cycle. Rockstöm et al.70 ranked environmental processes in
relation to the transgression of limits and concluded that nitrogen pollution ranks at the
global scale as one of the top 3 threats to biodiversity.
The intensity of the nitrogen cycle is raised in agro-ecosystems directly or indirectly by the
use of synthetic nitrogen fertilisers or by biological fixation in legume crops such as pea
and soy. This addition of reactive nitrogen by man has increased ten-fold since 1860 to
68 Solomon, S., D. Qin, M. Manning, R.B. Alley, T. Berntsen, N.L. Bindoff, Z. Chen, A. Chidthaisong, J.M.
Gregory, G.C. Hegerl, M. Heimann, B. Hewitson, B.J. Hoskins, F. Joos, J. Jouzel, V. Kattsov, U. Lohmann, T. Matsuno, M. Molina, N. Nicholls, J. Overpeck, G. Raga, V. Ramaswamy, J. Ren, M. Rusticucci, R. Somerville, T.F. Stocker, P. Whetton, R.A. Wood and D. Wratt, 2007: Technical Summary. In: Climate Change 2007: The Physical Science Basis. Contribution of Working Group I to the Fourth Assessment Report of the Intergovernmental Panel on Climate Change. Cambridge University Press, Cambridge, United Kingdom and New York, NY, USA. 69
Williams, A., Audsley, E. and Sandars, D. 2006. Determining the environmental burdens and resource use in the production of agricultural and horticultural commodities. Defra project report IS0205. 70
Rockström, J., W. Steffen, K. Noone, Å. Persson, F. S. Chapin, III, E. Lambin, T. M. Lenton, M. Scheffer, C. Folke, H. Schellnhuber, B. Nykvist, C. A. De Wit, T. Hughes, S. van der Leeuw, H. Rodhe, S. Sörlin, P. K. Snyder, R. Costanza, U. Svedin, M. Falkenmark, L. Karlberg, R. W. Corell, V. J. Fabry, J. Hansen, B. Walker, D. Liverman, K. Richardson, P. Crutzen, and J. Foley. 2009. Planetary boundaries: exploring the safe operating space for humanity. Ecology and Society 14(2): 32.

The role of corporate social responsibility in reducing greenhouse gas emissions from agriculture and food.
Draft for public consultation
31
more than 150 million tonnes, with two thirds (100 million tonnes) of this due to fertiliser
manufacture.71 72 73 About a further 32 million tonnes is added in the cultivation of legumes.
This fixation ultimately intensifies nitrogen fluxes in the environment, including the losses
of nitrate, ammonia and nitrous oxide (N20). Consequently, N2O concentrations in the
atmosphere have increased from a pre-industrial level of 270 ppb to a current level of 319
ppb. The losses and impacts of nitrogen cascade through supply chains. Despite some
recycling of manures back to the soil, more than 4 kg nitrogen is lost to the environment for
each kg nitrogen recovered in the product. Tackling GHG emissions from agriculture
involves addressing these losses at each stage of the production cycle.
Methane
Methane (CH4) is a potent greenhouse gas (GHG), which makes it a significant contributor
to climate change, especially in the near term (i.e. 10–15 years). Though methane is
emitted into the atmosphere in smaller quantities than CO2, its global warming potential
(i.e., the ability of the gas to trap heat in the atmosphere) is 23 times greater in 100 years
after emission. Ruminants account for 29% of all methane emissions which is the largest
single source.74
The importance of methane is increased when the effect of timescale is considered.
Conventionally, the greenhouse gas effect of methane is expressed as that in 100 years –
this is the effect of an emission today in 100 years, i.e. 23 times that of CO2. Methane
degrades, and so the greenhouse gas effect of a given emission declines with time. The
corresponding effect over 20 years is 72. This means that reducing methane emissions
has a large effect and particularly relevant if rapid mitigation is required, which is the case
in contemporary climate policy.
Land use emissions
In many situations, the use of agricultural land causes emissions of CO2 as soil organic
matter is broken down. These are land use emissions and usually grouped together with
LUC. The extent of these carbon loss processes depends on how close soil organic
matter contents are to the steady-state level for the land management practices being
used. Soils used for arable crop production that are high in organic matter because of
past management practices or recent conversion from grassland and soils on drained peat
are usually net emitters of CO2. These emissions are particularly high where peatland is
71 Enquete Commission (1994). Protecting our green earth. Enquete Commission of the German
Bundestag. Economica Verlag. 72
Jenssen, T.K. and G. Kongshaug (2003) Energy consumption and greenhouse gas emissions in fertiliser production, Proceedings No. 509, International Fertiliser Society, York, UK, 28 pp. 73
Braun, E. 2007. Reactive nitrogen in the environment. UNEP. 74
Global Methane Initiative (undated). Global methane emissions and mitigation opportunities.

The role of corporate social responsibility in reducing greenhouse gas emissions from agriculture and food.
Draft for public consultation
32
drained and used for agriculture. Drained peatland is estimated to emit 1,298 million
tonnes of carbon dioxide per year, which equates to about 1% of total emissions.75
On-farm energy use
The other major source of farm GHG emissions is on-farm energy use. Estimating this is
difficult as the use of diesel fuel in crop production varies hugely. Bellarby et al. provide
an estimate of 0.16 GT GHG per year.76 On-farm fuel use is a relatively minor source of
emissions.
Mitigating agricultural emissions
There is consensus that the greatest scope for mitigating agricultural emissions (excluding
land use change) lies in soil management. As well as reducing emissions, soils can be
managed to be net sinks for carbon.
Smith et al.77 estimate that agriculture has the technical potential to reduce emissions by
6,000 million t CO2e/year (Figure 4). The main mechanism is increasing soil carbon: soil
carbon sequestration. This represents the greatest mitigation potential in agriculture.78
Managing agricultural land to increase soil carbon has a mitigation potential of 5,340
million tonnes CO2e/year. Much of this mitigation effort has an economic cost and they
estimated that this technical potential equates to an economic potential of 4,300 million t
CO2e/year at a carbon price of 100 USD t CO2e. 89% of this mitigation potential lies in
soil carbon sequestration, and the remaining 11% arises from reducing emissions of
methane (9%) and nitrous oxide (2%). Much relates to the restoration of natural
vegetation on crop land. Restoring wetlands and peatland can provide even larger carbon
sinks. In total, restoration of land to nature has the potential to mitigate about 4,600
million t CO2e per year.
75 Joosten, H. 2009. The Global Peatland CO2 Picture. Peatland status and emissions in all countries of the
World. Ede, Wetlands International. 10 pp. 76
Bellarby J, Foereid B, Hastings A, Smith P. 2008. Cool farming: Climate impacts of agriculture and mitigation potential. Amsterdam, Neth.: Greenpeace Int. 77
Smith, P., D. Martino, Z. Cai, D. Gwary, H. Janzen, P. Kumar, B. McCarl, S. Ogle, F. O’Mara, C. Rice, B. Scholes, O. Sirotenko, 2007: Agriculture. In Climate Change 2007: Mitigation. Contribution of Working Group III to the Fourth Assessment Report of the Intergovernmental Panel on Climate Change [B. Metz, O.R. Davidson, P.R. Bosch, R. Dave, L.A. Meyer (eds)], Cambridge University Press, Cambridge, United Kingdom and New York, NY, USA. 78
Bellarby J, Foereid B, Hastings A, Smith P. 2008. Cool farming: Climate impacts of agriculture and mitigation potential. Amsterdam, Neth.: Greenpeace Int.

The role of corporate social responsibility in reducing greenhouse gas emissions from agriculture and food.
Draft for public consultation
33
Figure 4. Greenhouse gas mitigation potentials in agriculture as affected by the
carbon price or willingness to pay (IPCC 2007). 79
Reduced tillage
Modified tillage, particularly a switch to reduced cultivations, is widely regarded as a
means of increasing soil carbon sequestration. However, the consequences of reduced
tillage for soil carbon are not straight-forward. Detailed assessment of evidence
concluded that conservation tillage “has little effect on soil organic matter, other than
altering its distribution in the profile”.80 More recently, Baker et al.81 concluded that the
widespread belief that reduced tillage favours carbon sequestration may simply be an
artefact of sampling methodology with reduced tillage resulting in a concentration of soil
79 Smith, P., D. Martino, Z. Cai, D. Gwary, H. Janzen, P. Kumar, B. McCarl, S. Ogle, F. O’Mara, C. Rice, B.
Scholes, O. Sirotenko, 2007: Agriculture. In Climate Change 2007: Mitigation. Contribution of Working
Group III to the Fourth Assessment Report of the
Intergovernmental Panel on Climate Change [B. Metz, O.R. Davidson, P.R. Bosch, R. Dave, L.A. Meyer
(eds)], Cambridge University Press, Cambridge, United Kingdom and New York, NY, USA 80
Powlson, D.S., Jenkinson, D.S., 1981. A comparison of the organic matter, biomass, adenosine triphosphate and mineralizable nitrogen contents of ploughed and direct-drilled soils. J. Agric. Sci. 97: 713–721. 81
Baker, J.M., Ochsner, T.E., Venterea, R.T., and Griffis, T.J. 2007. Tillage and soil carbon sequestration – what do we really know. Agriculture, Ecosystems and Environment 118: 1-5.

The role of corporate social responsibility in reducing greenhouse gas emissions from agriculture and food.
Draft for public consultation
34
organic matter in the upper soil layer rather than a net increase through the soil. This is
relevant to some corporate social responsibility measures.
Increasing the return of organic matter
Switching from an agri-ecosystem that supports a low soil carbon content to one that
supports high levels of soil carbon, for example a switch from intensive arable cropping to
perennial agro-forestry or permanent grassland will deliver net carbon sequestration in
depleted soils until a new steady state is achieved – a process which can last several
decades and even centuries. It can be assumed that sequestration will be greatest in the
soils most depleted compared to their natural ecosystem state. The means for achieving
this include avoiding bare fallow and growing crops such as ‘catch’ crops for incorporation
into the soil.
Natural grassland can also be managed to increase the carbon stock and this is estimated
to have a potential of 1,350 million tonnes CO2e/year. This involves improved
management to reduce erosion and reducing the incidence of fire.82
Restoring natural vegetation and wetlands
If changing land use from natural vegetation to agriculture is a major source of emissions,
then the opposite process is potentially an important mitigation measure. This measure
has a high mitigation potential. The re-wetting of drained wetlands is analogous to
restoring native grassland or forest. This has a mitigation potential of 2,000 million tonnes
CO2e.
Reducing nitrogen emissions
Due to the role of nitrous oxides in agricultural emissions, reducing man’s intervention in
the nitrogen cycle through raising the efficiency of nitrogen use in agriculture is central to
the mitigation of greenhouse gas emissions from farming. Increasing the efficiency of
nitrogen use by the growing high yielding crops is the first step in the mitigation of direct
emissions.
The efficiency of nitrogen use has improved in Europe. According to the European
Environment Agency83 and the OECD, the surplus of nitrogen fertiliser applied over the
quantity removed in produce has dropped significantly in Europe. In 2000 the gross
nitrogen balance ranged from 37 kg ha-1 (Italy) to 226 kg ha-1 (the Netherlands). Most
national gross nitrogen balances show a decline in estimates of the gross nitrogen balance
between 1990 and 2000. The general decline in nitrogen surpluses is due to a small
decrease in nitrogen input (-1.0%) and a significant increase in nitrogen output (10%).
Nitrogen use efficiency has increased through increased output.
82 Bellarby J, Foereid B, Hastings A, Smith P. 2008. Cool farming: Climate impacts of agriculture and
mitigation potential. Amsterdam, Neth.: Greenpeace Int. 83
EPA, 2011. Agriculture: nitrogen balance

The role of corporate social responsibility in reducing greenhouse gas emissions from agriculture and food.
Draft for public consultation
35
The largest nitrogen loses in agriculture occur from animal wastes. About half of the
nitrogen entering the pig production system (and even more in other systems) is lost from
manures or the soil during or after manure application. Making the most efficient use of
the N in organic manures is essential. Technologies such as slurry injection, manure
treatment, and accurate rate and timing of manure application are all important. Losses of
up to 80% of mineral nitrogen in slurry through ammonia emissions when broadcasting
slurry are common damaging sensitive ecosystem downwind of application. Reducing
these emissions conserves nitrogen within the soil/plant system and offers the opportunity
of establishing a virtuous circle of ammonia reductions, nitrogen conservation, and
reduced fertiliser inputs.
Anaerobic digestion (AD) for biogas is worthy of mention here. The by-product of AD is
‘digestate’, a liquid in which the nitrogen and phosphorus from the feedstock (e.g. manure,
crop material and food waste) is conserved in a plant available form. The use of anaerobic
digestion within integrated crop/animal systems has the potential to improve the nitrogen
efficiency of the whole system if the feedstock is based on manure or food wastes and the
digestate is used to effectively replace synthetic fertiliser nitrogen.
Using technology to reduce nitrous oxide and methane emissions directly from the food
chain has an important role to play with a total potential of about 20% of food chain
emissions. Inhibitors of the conversion of ammonium to nitrate in soil (nitrification
inhibitors) were developed several decades ago but adoption has been hindered by their
cost compared with the direct yield benefits. However, there is now renewed interest in
their use to obtain the associated reductions in nitrous oxide emissions. Substantial
reductions (in the region of 50%) in nitrous oxide emissions from agricultural soils have
been recorded. Audsley et al.84 estimate their use would reduce emissions from primary
production by 11%. This approach to conserving reactive nitrogen in the soil/plant system
is highly complementary with increasing production efficiency.
Reducing methane emissions
Developing and applying technical measures to reduce methane emissions is challenging.
Most of the emissions come from microbes in the rumen. Antibiotic-based approaches
were commercialised in the 1980s and raised animal performance by altering rumen
microbes to produce less methane. Regulations now ban the use of these antibiotics in
this way in many countries.
Anaerobic digestion technology (biogas) can be used to generate and capture methane
from manure and slurry. Its use to capture the majority of emissions of methane from
manure would require very significant capital investment. In the UK only about a quarter of
84 Audsley, E., Brander, M., Chatterton, J., Murphy-Bokern, D., Webster, C., and Williams, A. (2009). An
assessment of greenhouse gas emissions from the UK food system and the scope for reduction by 2050. How low can we go?. WWF-UK and the FCRN.

The role of corporate social responsibility in reducing greenhouse gas emissions from agriculture and food.
Draft for public consultation
36
the theoretical UK potential is technically available.85 Like other measures, the anaerobic
digestion is highly compatible with production efficiency measures if the by-product
(digestate) is used as an effective fertiliser to reduce losses from the nitrogen cycle.
Biogas fuelled by bioenergy crops, (e.g. maize), which is common in Germany, increases
agricultural greenhouse gas emissions directly and indirectly and is not considered further
here because it is not part of the food system.
Increasing efficiency in livestock production also reduces methane emissions principally by
reducing the number of animals required to produce a given level of output. Some very
significant reductions have been claimed. Garnsworthy reported that restoring the fertility
of dairy cows to 1995 levels combined with further increases in milk yield per cow would
reduce methane emissions from milk production by 24% by reducing the number of young
female animals raised to replace the dairy herd and the number of lactating cows in the
herd.86 In considering the effect of efficiency increases, care is needed in considering all
the outputs of complex interconnected systems, for example meat and milk from the cattle
herd. Using sophisticated modelling approaches, Del Predo and Scholefield87 estimate
that measures to increase the fertility of dairy cows would reduce methane emissions by
3%. Gerber et al. 88 show that at the level of national average yields, the mitigating effect
of increases in milk yield level off at about 3,000 litres per year. At a global level, Havlik et
al. draw attention to the potential to reduce emissions from livestock production by
improving feeding in extensive traditional systems.89 They assess the effects of improved
production efficiency that facilitates land-sparing effects and thus reduced deforestation.
Farming system changes
Much of the effort to improve the nitrogen use efficiency in whole agricultural systems
relies on the re-coupling of crop and livestock production and the efficient use of the
nutrients emitted by animals in crop production. Public policy can have profound effects.
For example, the reduction of transport subsidies for Canadian wheat stimulated the use of
wheat for animal feed on the prairies re-coupling crop and animal production with
environmental benefits.90
85 Defra. 2006. Assessment of methane management and recovery options for livestock and slurries. Defra
research project AC0402. 86
Garnsworthy, PC. 2004. The environmental impact of fertility in dairy cows: A modelling approach to predict methane and ammonia emissions. Animal Feed Science and Technology, 112, 211–223. 87
Defra. 2008. New integrated dairy production systems: specification, practical feasibility and ways of implementation. Defra project report IS0214. 88
Gerber, P.J., Vellinga, T., Opio, C. & Steinfeld, H. 2011. Productivity gains and greenhouse gas intensity in
dairy systems. Livestock Science, 139: 100–108 89
Havlík, P., Valin, H., Herrero, M., Obersteiner, M., Schmid, E., Rufino, M.C., Mosnier, A., Thornton P.,
Boettcher, H., Conant R.T., Frank, S., Fritz, S., Fuss, S., Kraxner, F., Notenbaert, A. (2014). Climate change
mitigation through livestock system transitions. Proceedings of the National Academy of Sciences. 90
Doan, D. and Paddock, B. (2003). Grain Transportation Policy and Transformation in Western Canadian Agriculture. Agriculture and Agri-food Canada
The role of corporate social responsibility in reducing greenhouse gas emissions from agriculture and food.
Draft for public consultation
37
One of the system change options that is directly relevant to corporate social responsibility
and consumer-based action is organic farming. Consumers who purchase organic
produce supporting the effects of organic farming, which may include greenhouse gas
mitigation. One of the first applications of life-cycle assessment techniques to agriculture91
showed that there are no consistent difference between conventional and organic
production in terms of energy use and direct greenhouse gas emissions. This conclusion
was confirmed in 2006 in a much more detailed study92 which reported only small
differences between organic and conventional production in the UK in terms of commodity
life-cycle emissions. A recent meta-analysis supports this conclusion.93
Post-farm processing, manufacture and retail
When indirect land use and land-use change emissions are factored in, post-farm activities
are estimated to account for 10 – 17% of total global food system emissions.94 The two
major sources are energy use and loss of refrigerants as follows (Mt CO2e): refrigeration,
490; storage, packaging and transport, 396; retail activities, 224; primary and secondary
processing, 192; food preparation, 160; and waste disposal, 72. There are however great
uncertainties in these global data.
In an examination of the UK food system, Audsley et al.95 estimated that the post-farm part
of the food chain accounted for 26% of emissions when emissions for land-use change
were accounted for. At the country level, the emissions from food processing,
manufacture and retailing are greatly affected by the carbon intensity of electricity in
particular. Therefore, studies of the Swedish food system and products for example show
lower levels of electricity-related emissions due to the high use of nuclear and hydro-
electricity.
91 Murphy, D.P.L., Roever, M. and Heinemeyer, O. (Editors) (1998). Bewertung der Verfahren der
ökologischen und konventionellen landwirtschaftlichen Produktion im Hinblick auf den Energieeinsatz und bestimmte Schadgasemissionen. Evaluation of the conventional and organic agricultural production in terms of primary energy consumption and pollution gas emissions. Landbauforschung Völkenrode ISBN 3-933140-33-1(Refereed monograph, 206pp). 92
Williams, A., Audsley, E. and Sandars, D. 2006. Determining the environmental burdens and resource use in the production of agricultural and horticultural commodities. Defra project report IS0205. 93
Tuomisto, H., Hodge, I.D., Riordan, P., and Macdonald, D.W. (2012). Does organic farming reduce
environmental impacts – a meta-analysis. Of European research. Journal of Environmental Management.
112: 309-320. 94
Vermeulen, S., Cambell, B.M., and Ingram, J.S.I. 2012. Climate change and food systems. Annual Review of Environmental Resources 37:195-222. 95
Audsley, E., Brander, M., Chatterton, J., Murphy-Bokern, D., Webster, C., and Williams, A. (2009). An assessment of greenhouse gas emissions from the UK food system and the scope for reduction by 2050. How low can we go?. WWF-UK and the FCRN.

The role of corporate social responsibility in reducing greenhouse gas emissions from agriculture and food.
Draft for public consultation
38
Sonigo et al.96 provide an overview of the results of a meta-analysis of relevant evidence
identifying the differences in the role of various stages in the supply chain for a range of
product types (Figure 5). If the total GWP impacts of the respective food groups are
weighted by the proportions of these in consumption, an estimation of proportion of total
GWP impact of food supply in Europe per lifecycle stage, is as follows (excluding land-use
change): agriculture 55%; processing 4%; packaging 7%; transportation 5%; distribution
11%; consumer use 1%; end of life 1%. A number of post-farm processes and activities
that are widely acknowledged as important causes of greenhouse gas emissions were
identified. The two most notable are refrigeration and transport.
Refrigeration can be regarded as a ‘hot-spot’ of emissions. Refrigeration creates
greenhouse gases both because of the energy used to operate the equipment and
because of the global warming potential (GWP) of the refrigerant gases. Garnett
estimated that food refrigeration accounts directly for 2.4% of UK greenhouse gas
emissions.97 Audsley et al.98 estimated that refrigerants alone account for the equivalent
of 5.9 million tonnes of CO2 equivalent in the UK (or nearly 4% of direct emissions from the
food system). In addition, energy used in refrigeration was estimated to account for 13
million tonnes of CO2 (or about 9% of food emissions). Garnett99 estimates that the cool
chain as a whole is responsible for 15% of food chain emissions. This large role of
refrigeration has implications for the design and prioritisation of corporate social climate
responsibility measures.
In the UK, food-related transport accounts for 1.8% of total UK emissions with 87% of this
emission occurring up to the retail outlet.100 While this shows that transport is a
substantial source of emissions, the option of replacing imported food with home-produced
food is not a straight-forward solution. The disadvantages of long-distance transport can
be outweighed by the effects of lower emissions from food imported from places where
production is efficient, for example because the production is in-season.101 In addition,
long distance transport by sea or rail is energy efficient.
96 Sonigo, P, Bain, J., Tan, A., Johansson, L. Murphy-Bokern, D. Shields, L., Aiking , H., Erb, K., and
Kastner, T. (2012). The resource use efficiency of the European food cycle. Report for the European Commission. BIOIS Paris. 97
Garnett, T. (2007) Food refrigeration: What is the contribution to greenhouse gas emissions and how might emissions be reduced? A working paper produced as part of the Food Climate Research Network. 98 Audsley, E., Brander, M., Chatterton, J., Murphy-Bokern, D., Webster, C., and Williams, A. (2009). An assessment of greenhouse gas emissions from the UK food system and the scope for reduction by 2050. How low can we go?. WWF-UK and the FCRN. 99
Garnett, T. (2007) Food refrigeration: What is the contribution to greenhouse gas emissions and how might emissions be reduced? A working paper produced as part of the Food Climate Research Network. 100
AEA Technology (2005). The validity of food miles as an indicator of sustainable development: Final report to Defra. 101
Williams, AG, Pell E, Webb J, Tribe E, Evans D, Moorhouse E., Watkiss P. (2008) Comparative life cycle assessment of food commodities procured for UK consumption through a diversity of supply chains. Final Report for Defra Project FO0103.

The role of corporate social responsibility in reducing greenhouse gas emissions from agriculture and food.
Draft for public consultation
39
All the post-farm CO2 emissions arise from the use of energy and the full range of energy
efficiency and conservation measures are relevant to corporate social responsibility
strategies addressing greenhouse gas emissions. Many of these are under the direct
control of the firms operating in the food system and are therefore relatively easy to
address. Some important factors are outside the control of firms. In particular, the
emission intensity of processes is strongly influenced by the electricity mix in the country
concerned. Transport infrastructure is also an important factor, as is local policy on energy
conservation generally.
Consumption phase
A significant proportion of the refrigeration energy referred to above is used in the home.
Two other consumer-related activities have significant impacts: cooking and transport.
Audsley et al. (2009) 102 estimate that cooking accounts for about 10% of direct emissions
from the UK food system but other sources indicate the role of food preparation in supply
chain emissions is a good deal lower.103 The role of consumers’ shopping-related travel is
significant. It accounts for half of all food-related vehicle movements in the UK and
emissions equal to that from air-freighting of food and from long-distance shipping.
As referred to earlier, Audsley et al (2009). reported that in the UK livestock products
account for one third of food calorie intake and nearly two-thirds of food-related emissions.
The IMPRO study104 proposed alternative diets with positive health impacts with low intake
of livestock products (dairy and meat). In Europe, the GGELS105 project provided detailed
product-based estimates of emissions from the livestock sector in the EU-27 according to
animal species, animal products and livestock systems following a food chain approach.
It concluded that 29% of GHG emissions are from beef production (approx. 6% by
weight), 29% from bovine milk production (approx. 70% by weight) and 25% from pork
production (approx. 13% by weight), while all other animal products together do not
account for more than 17% of total emission (approx. 11% by weight). Importantly, it
showed that low emissions in Austria (14.2 kg GHG-eq. per kg of beef) could be attributed
to a high self-sufficiency in feed production and a high share of grass in the diet, whereas
emissions from production in the Netherlands (17.4 kg GHG-eq. per kg of beef) is also
relatively low due to efficient and industrialised production structure with strict
environmental regulations.
102 Audsley, E., Brander, M., Chatterton, J., Murphy-Bokern, D., Webster, C., and Williams, A. (2009). An
assessment of greenhouse gas emissions from the UK food system and the scope for reduction by 2050. How low can we go?. WWF-UK and the FCRN. 103
Munoz, I., Mila i Canals, L., Fernandez-Alba, A. (2010). Life cycle assessment of the average Spanish diet including human excretions. Int. J. Life Cycle Assessment 15:794-805. 104
JRC-IPTS (2008), IMPRO Environmental Improvement potential of meat and dairy products 105
Leip A., et al (2010). Evaluation of the livestock sector's contribution to the EU greenhouse gas emissions (GGELS) -final report, European Commission, Joint Research Centre

The role of corporate social responsibility in reducing greenhouse gas emissions from agriculture and food.
Draft for public consultation
40
At the product level, there are large variations between LCA results for a given commodity
reflecting differences in the approach of studies and also differences between production
systems. Figure 5 shows data for global warming potential (GHG emissions) from a
review of LCA results conducted for the European Commission.106 These variations
between production systems have implications for corporate social responsibility
programmes in that they show that a given commodity can vary greatly in its carbon
footprint depending on its origin and production and this provides a basis for exercising
preference to reduce emissions from supply chains.
To date, few guidelines combine health and environmental perspectives and those that
exist vary greatly in terms of reporting method, choice of indicators and scope. In a report
from the Health Council of the Netherlands107 ‘win-win’ guidelines were identified, which,
apart from health benefits, deliver environmental benefits in terms of land use and GHG
emissions. These centre on reducing meat and dairy consumption compensated for by
increased whole-grain products and pulses, fruit and vegetables and a reduction in energy
intake in cases of over-weight. A study on the link between consumption and the
nitrogen cycle in Europe showed that a reduction in the consumption of livestock products
in line with current public health guidelines would have a major effect on the nitrogen cycle
reducing all related emissions, the use of arable land, and the need for imported soy.108 A
50% reduction in livestock product consumption would reduce the need for soy by 75%.
This has very significant direct and indirect consequences for the global demand for
cropland.
106 Sonigo, P, Bain, J., Tan, A., Johansson, L. Murphy-Bokern, D., Shields, L., Aiking, H., Erb, K., and
Kastner, T. (2012). The resource use efficiency of the European food cycle. Report for the European
Commission Report for the European Commission
(http://ec.europa.eu/environment/eussd/pdf/foodcycle_Final%20report_Dec%202012.pdf ) 107
Health Council of the Netherlands. Guidelines for a healthy diet: the ecological perspective. The Hague: Health Council of the Netherlands, 2011; publication no. 2011/08E. 108
Westhoek, H., Lesschen, J., Rood, T., Wagner, S., De Marco, A., Murphy-Bokern, D., Leip, A., van
Grinsven, H., Sutton, M., Oenema, O. (2014). Food choices, health and environment: effects of cutting
Europe’s meat and dairy intake. Global Environmental Change 26: 196-205.

The role of corporate social responsibility in reducing greenhouse gas emissions from agriculture and food.
Draft for public consultation
41
0.00
5.00
10.00
15.00
20.00
25.00
30.00
35.00
40.00
45.00
50.00
Glo
bal
Wa
rmin
g P
ote
nti
al G
WP
to
tal p
er
un
it p
rod
uct
we
igh
t ((k
g C
O2
eq/k
g)
Figure 5. The global warming potential of greenhouse gas emissions arising from the production of various
food commodities (kg GHG eq. per kg product weight). The blue dots are individual results, average values
of these are indicated with an ‘X’ and median values are indicated with a ‘—‘ (Source: BIOIS Paris109
).
109 Pierre Sonigo, P, Bain, J., Tan, A., Johansson, L. Murphy-Bokern, D., Shields, L., Aiking , H., Erb, K.,
and Kastner, T. (2012). The resource use efficiency of the European food cycle. Report for the European
Commission. BIOIS Paris.
(http://ec.europa.eu/environment/eussd/pdf/foodcycle_Final%20report_Dec%202012.pdf )

The role of corporate social responsibility in reducing greenhouse gas emissions from agriculture and food.
Draft for public consultation
42
3. CORPORATE SOCIAL RESPONSIBILITY STRATEGIES
Defining and managing corporate social responsibility in conventional industrial sectors is
relatively easy. Materials are usually traceable and their production is in the hands of a
relatively small number of large commodity suppliers or manufacturers whose activities
can be monitored. In the case of agriculture and food, the primary resources are land and
water, and the suppliers are almost always millions of farmers competing in open
commodity markets. Because of this, corporate social responsibility in farming and food
extends well beyond the activities of the operating firms to include their suppliers. The
measures used include semi-private and private certification schemes and associated
standards covering large numbers of farmers and/or commodities. Corporate social
responsibility strategies can encompass large parts of the complex relationships shown in
Error! Reference source not found. or cover a small portion such as land use or specific
parts of processing.
Position and operation of strategies within the food system
Here we describe corporate social responsibility strategies and measures which impact or
potentially impact on the greenhouse gas emissions from the food system. In the context
of position in supply chains and related market drivers relevant to CSR, we have identified
three categories of firms:
1. Firms interacting with consumers in relation to specific products and supply chains,
typically food product manufacturers that are known to consumers through their brands
such as Heinz or Alfred Ritter.
2. Firms interacting with consumers over a wide range of products and supply chains,
such as retailers.
3. Firms not interacting directly with consumers, typically commodity traders and
commodity processors.
This categorisation helps examine underlying economic and market drivers relevant to
corporate social responsibility, particularly brand protection, and influencing consumer
preferences and responses.
Firms interacting with consumers in relation to specific products and supply chains
These firms with branded products generally have a relatively high degree of control of
their supply chains. These brands, which often relate to specific supply chains (e.g.
Flora, Heinz, Walls Ice-cream, Mars) are valuable. This means additional costs arising
from investment in corporate social responsibility measures can be offset by an indirect
economic return through the strengthening of the brand. When operated down to the
level of farmer suppliers, there may be further internal benefits arising from security and
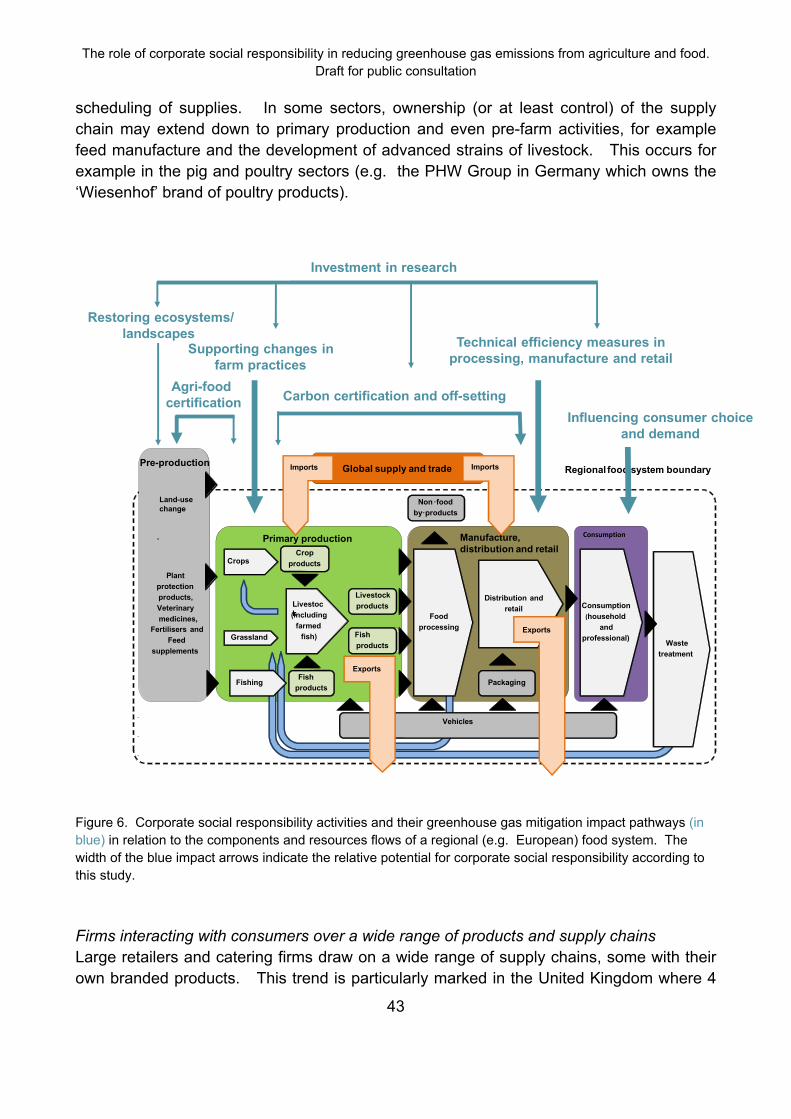
The role of corporate social responsibility in reducing greenhouse gas emissions from agriculture and food.
Draft for public consultation
43
scheduling of supplies. In some sectors, ownership (or at least control) of the supply
chain may extend down to primary production and even pre-farm activities, for example
feed manufacture and the development of advanced strains of livestock. This occurs for
example in the pig and poultry sectors (e.g. the PHW Group in Germany which owns the
‘Wiesenhof’ brand of poultry products).
Primary production Manufacture, distribution and retail
Consumption
Vehicles
Global supply and trade
CropsCrop
products
Livestock
products
Fish
products
Livestock (including
farmed
fish)
Fishing
Imports
Fish
products
Exports
Food
processing
Distribution and
retail Consumption
(household
and
professional)
Non -food
by-products
Packaging
Waste
treatment
Exports
Imports
Plant
protection
products,
Veterinary
medicines,
Fertilisers and
Feed
supplements
Regional food system boundaryPre-production
-
Grassland
-
-
-
Land-use change
Agri-food certification
Carbon certification and off-setting
Supporting changes in farm practices
Technical efficiency measures in processing, manufacture and retail
Restoring ecosystems/landscapes
Investment in research
Influencing consumer choice and demand
Figure 6. Corporate social responsibility activities and their greenhouse gas mitigation impact pathways (in
blue) in relation to the components and resources flows of a regional (e.g. European) food system. The
width of the blue impact arrows indicate the relative potential for corporate social responsibility according to
this study.
Firms interacting with consumers over a wide range of products and supply chains
Large retailers and catering firms draw on a wide range of supply chains, some with their
own branded products. This trend is particularly marked in the United Kingdom where 4
The role of corporate social responsibility in reducing greenhouse gas emissions from agriculture and food.
Draft for public consultation
44
multiple retailers control 75% of the grocery market110 and where ‘own-brand’ accounts for
nearly half of food sales.111 From a corporate social responsibility perspective, it is similar
to classical product-based approaches, but ownership is with the retailer/restaurant chain
and extends across a wide range of food products. Therefore the scope for supporting
change at the food system level is greater. Retailers’ brands are prominent, valuable and
vulnerable to reputational damage. As for product-based strategies, enhancing the
reputation of the brand provides the rationale for bearing the additional costs they may
entail.
Firms not interacting directly with consumers – commodity traders and processors
A number of firms influence and even control key parts of supply chains but are largely
invisible to consumers. These firms are active in commodity processing and trading.
Typically, they interact intensively with farmers or local commodity traders, process and
store commodity, and then transport commodities over long distances. Some of these
commodities such as soy are inputs into other supply chains, so the link to consumer
markets is particularly weak.
These firms operate in a particularly competitive commodity trading environment, where
the scope for branding and product differentiation is limited. There is little or no
opportunity for distinguishing commodity in terms of user or process quality, except
through segregation.
Corporate social responsibility measures
Regardless of the type of corporate social responsibility strategy, its owners, and its profile
with consumers, the impact of corporate climate on greenhouse gas emissions depends
on the effects of the measures used on the supply-chain activities and processes that
cause greenhouse gas emissions. An overview of the measures and the way they are
used by types of corporate social responsibility strategies is provided in Table 2.
110 Kantar Worldpanel 2013. Over half the UK now shops in a discounter (17.12.2013).
http://www.kantarworldpanel.com/Global/News/Over-half-UK-now-shops-in-a-discounter 111
Gibbons, L. 2012. Own-label food to continue gains over branded: Kantar. http://www.foodmanufacture.co.uk/Business-News/Own-label-foods-to-continue-gains-over-branded-Kantar

The role of corporate social responsibility in reducing greenhouse gas emissions from agriculture and food.
Draft for public consultation
45
Table 2. Overview of corporate social responsibility measures relevant to greenhouse gas mitigation in
agriculture and food
Measures Use in corporate social responsibility programmes
Farm certification Used as a foundation of some wider certification schemes.
Supply-chain certification Assured farm produce (e.g. Red Tractor) and organic produce certification are typical examples. There are also firm standards for own-brand products.
Commodity certification Widely used for imported commodities such as palm oil, soy, cocoa, coffee, sugar and tea.
Carbon certification This is a third party process which enables the use of a carbon label. It is used for products, production processes or on firm level. Sub-classifications are carbon rating, carbon intensity, carbon reduction and carbon neutral certification.
Carbon offsetting Offsetting of carbon emissions is often used in transport and manufacturing, sometimes as part of a carbon certification.
Farm management and
agricultural practices (in addition
to certification schemes)
Food manufacturers, retailers and commodity traders commonly support technical change on farms, particularly for fresh produce. The overall effect is increases in yield or quality for a give level of inputs such as fertiliser.
Technical efficiency measures in
processing, manufacture, and
retail
These form the foundation of many corporate social responsibility strategies. They are focused on raising internal resource use efficiency in processing, manufacturing, transport and retailing.
Sectoral cooperation,
partnerships, platforms and
roundtables
Many of these are closely related to product certification. It is
possible for firms to support these without committing to the
purchase of associated certified produce. Such membership has
awareness-raising effects and there are benefits from shared
insights and information.
Restoring ecosystems In the context of climate change mitigation, this is largely about
restoring soil carbon stocks through for example re-wilding of
farmed land, restoring forests or grassland, or rewetting drained
peatland.
Investment in research The agri-food sector has a record of investing in research and
development to improve overall system performance, particularly
farming. Much of this research has a pre-competitive character.
Influencing consumer choice and
demand
Such measures would actively support consumers who want to reduce the carbon footprint of their diets.

The role of corporate social responsibility in reducing greenhouse gas emissions from agriculture and food.
Draft for public consultation
46
Agri-food certification
Voluntary certification of food and agricultural products have increased in number and
importance in recent years. In 2010, the EU found more than 400 different certification
systems in the agri-food sector.112
Certification of agricultural production may focus on the whole-farm business, a supply-
chain certification over several commodities, or certification of specific commodity supply
chains. There are combinations of these approaches and some certification schemes
incorporate several. The following categorisation of approaches to agri-food certification is
not precise. It is provided to help appreciate the range of approaches used.
Farm certification focuses on primary production on a whole-farm basis. The farm unit is
the subject of the certificate. The certification schemes themselves, particularly those
specialised in farm certification, are sometimes owned and run mutually by farmers. The
recently developed Origin Green scheme in Ireland is owned and operated by a semi-state
body (Bord Bia) and aims to provide coverage of all dairy farms in the Irish Republic. With
farm certification generally, the production processes operating in each farm business are
externally monitored and the farm as a whole is certified as reaching varying levels of
environmental and social performance (incl. animal welfare). The required production
standards range from rigorous adherence to the law (e.g. LEAF) through to organic
farming standards that are distinctly different from ‘conventional’ production and defined as
such in international law. The relevant farm certification schemes include LEAF (UK),
Global G.A.P., Conservation Grade farming, UTZ, Origin Green (Ireland), Rainforest
Alliance, and the organic farming certification schemes. Rainforest Alliance and UTZ aim
to link land-use practices, business practices and consumer behaviour in the production of
tropical crops, including coffee, bananas, cocoa, oranges, cut flowers, ferns, tea and
palmoil.
Supply chain certification is closely related to farm certification and there is overlap
between these (e.g. Rainforest Alliance, UTZ, Origin Green). Terms such as ‘assured
farm produce’, or ‘certified produce’ are sometimes used to describe supply chain
certification. The distinction between supply chain certification and farm certification is the
certification applies to a specific product, generally up to the point of retail sale, rather than
just the farm. At the farm level, this form of certification covers the relevant commodity or
produce and does not necessarily require certification of other parts of the farm business,
for example on a mixed dairy and arable farm, to operate to analogous standards.
Assured Food Standards is one of the most widely used supply-chain certification
schemes in the UK, and the driver for its development came largely from the farm sector.
112 European Commission (2010): Commission Communication — EU best practice guidelines for voluntary
certification schemes for agricultural products and foodstuffs. Official Journal of the European Union. 16.12.2010

The role of corporate social responsibility in reducing greenhouse gas emissions from agriculture and food.
Draft for public consultation
47
Food products meeting the standard are entitled to carry the Red Tractor logo. There is
evidence in the literature that supply-chain assurance schemes are particularly strong in
the UK where for example assured produce accounted for 60-90% of UK production by
about 2005.113
Organic certification is also a form of supply chain certification that uses a strong
component of farm certification. Most certified organic produce comes from farm
businesses that are themselves certified as entirely organic.
Some of the best-known international certification bodies such as UTZ and Fairtrade are
mainly certifiers of supply chains. Fairtrade is particularly focused on the social
performance of supply chains and so addresses conditions in processing and trading
businesses as well as on farms.
Commodity certification operates within specific commodity-based sectors and
addresses the particular challenges of supporting certified production through large bulk-
traded commodity supply chains. The context is the very open and large-scale commodity
production systems and markets operating for example in soybeans and palmoil.
These schemes are based the identification of commodity produced to higher
environmental, resource protection or social standards than that of commodity produced to
the minimum local regulations. Food traders, manufacturers and retailers supporting this
higher standard can claim to be using ‘sustainable’ sources. The certification itself may be
based on assessments made at the individual farm level as it is in the case of soy, or at
the level of the first processor, for example a palm oil mill linked directly to specific
plantations.
A feature of commodity certification is their ownership and management by Roundtables.
These bring stakeholders related to a specific commodity supply chain together. These
include environmental NGOs who often play a leading role, retailers, food processors, and
commodity traders and shippers. Membership of these roundtables is a feature of many
relevant corporate social responsibility strategies. This membership may or may not come
with a commitment to support certified production.
The Round Table on Responsible Soy (RTRS) is a multi-stakeholder initiative that certifies
soy produced in compliance with defined social and environmental standards. The
standards include adherence to good agricultural and soil management practices,
standards of employee and community welfare, and avoidance of land recently converted
from native forest. Soy is traded in large bulk lots within long supply chains. Keeping soy
from certified production segregated is technically challenging and so the RTRS offers the
113 Garcia, M. 2007. Economic analysis of food quality assurance schemes. The Red Tractor Scheme.
European Commission.

The role of corporate social responsibility in reducing greenhouse gas emissions from agriculture and food.
Draft for public consultation
48
opportunity to support certified production on a mass-balance basis or by purchasing
credits. With mass balance, the RTRS undertakes to ensure that an equivalent quantity of
certified soy has been produced for the soy actually purchased. In the case of credits, the
purchaser buys credits with the soy which are passed on to certified producers. In this
way the certified production is rewarded without the complexity of commodity segregation.
The principal objective of the Roundtable for Sustainable Palmoil is “to promote the growth
and use of sustainable palm oil through co-operation within the supply chain and open
dialogue between its stakeholders”.114 It was the first Roundtable to be established (in
2001) with a leading role played by Unilever and the WWF. The instruments used are
similar to those used by the RTRS, including for example the opportunity to purchase
Green Palm certificates.
Carbon certification
Carbon labels offer companies the possibility of communicating their performance in terms
of GHG emissions to the customer. Their use is increasing with the development of more
sophisticated carbon measurement systems.
Carbon certification is based on an estimate of emissions applied to products, processes
or firms. Some certification schemes concentrate on estimates only. This is the case for
carbon intensity and rating labels. Others require firms to take action to reduce emissions
by reducing actual emissions or buying carbon credits (carbon offsetting). This is the case
for low carbon and carbon reduction labels.
114 RSPO 2013. How to be RSPO certified. http://www.rspo.org/en/how_to_be_rspo_certified accessed on
5 December, 2013.

The role of corporate social responsibility in reducing greenhouse gas emissions from agriculture and food.
Draft for public consultation
49
Carbon off-setting
Carbon neutral labels additionally require carbon off-setting or compensation schemes
(Table 3). Offsetting can be done through voluntary or compulsory schemes. Compulsory
schemes are the clean development mechanism (CDM), or the EU emission trade and
joint implementation scheme (UNFCCC). Voluntary schemes include amongst others the
Gold, CarbonFix and VER plus Standards.
Table 3. Categorisation of carbon labels (from Walter und Schmidt)115
115 Walter, S. und Schmidt., M. (2008): Carbon Footprints und Carbon Label – eine echte Hilfe bei der
Kaufentscheidung? UWF Umweltwirtschaftsforum Vol. 16(3): 175-181. DOI: 10.1007/s00550-008-0082-3.
Carbon Intensity Label Indicates the amount of carbon emitted in a product’s supply chain.
Carbon Rating Label Used by products within certain product categories. These products
give rise to low emissions through in their value chains.
Low Carbon Label Indicates companies that implement measures to reduce greenhouse
gas emissions or products with small carbon footprints.
Carbon Reduction Label Indicates the reduction of carbon emissions within a value chain.
Carbon Neutral Label Used by products whose value-chain emissions are off-set by
purchasing carbon credits derived from climate protection projects.

The role of corporate social responsibility in reducing greenhouse gas emissions from agriculture and food.
Draft for public consultation
50
Table 4. List of available carbon standards (April 2013)
Standard type Labels Certification body What it does Focus in food sector
Carbon Intensity Carbon Label Carbon Trust Analysis Product
Carbon Neutral Atmosfair Stiftung Zukunftsfähigkeit Analysis and compensation
Transport
Carbon Neutral TÜV NORD CERT TÜV NORD CERT Analysis, reduction and compensation
Supply chain
Carbon Neutral CarbonFree Certified Carbonfund.org Foundation
Analysis, reduction and compensation
Product
Carbon Neutral CarbonFree® Partner programme/events
Carbonfund.org Foundation
Analysis and CO2-compensation
Product
Carbon Neutral Carbon Neutral The CarbonNeutral Company
Analysis, reduction and compensation
Whole supply chain
Carbon Neutral Climate Neutral myclimate (Swiss foundation)
Analysis and CO2-compensation
Whole supply chain
Carbon Neutral Climate performance myclimate (Swiss foundation)
Analysis, reduction and compensation
Firm
Carbon Neutral CO2 neutral production process
Provamel Analysis, reduction and compensation
Carbon Neutral CO2OL Forest Finance Group Analysis, reduction and compensation
Product
Carbon Neutral Green Index rating Analysis, reduction and compensation
Carbon Neutral KlimaINVEST Investment company KlimaINVEST
Analysis, reduction and compensation
Whole supply chain
Carbon Neutral National Carbon Offset Standard
Low Carbon Australia Analysis, reduction and compensation
Firmfirm
Carbon Neutral No CO2 Certification Program
Carbon Reduction Institute
Analysis, reduction and compensation
Whole supply chain
Carbon Neutral Stop Climate Change AGRA-TEG Agrar- und Umwelttechnik
Analysis, reduction and compensation
Firm
Carbon Neutral SwissClimate "CO2 Neutral"
Swiss Climate AG Analysis, reduction and compensation
Firm
Carbon Neutral Certification "Carbon negative"
Green Tick Certification Limited
Analysis, reduction and compensation
Firm
Carbon Neutral Certification "Carbon neutral"
Green Tick Certification Limited
Analysis, reduction and compensation
Firm
Carbon Rating Climatop Climatop Association Analysis Firm
Carbon Reduction Carbon Reduction Label Carbon Trust Analysis and reduction Product
Carbon Reduction Carbon Trust Standard Carbon Trust Analysis and reduction Firm
Carbon Reduction Climate certification for the food chain
KRAV Swedish Seal/Svenskt Sigill
Reduction Product
Carbon Reduction ABCERT Standard ABCERT AG Analysis and reduction Whole supply chain
Carbon Reduction Soil & More Soil & More International Analysis and reduction Whole supply chain
Carbon Reduction SwissClimate "CO2 optimized"
Swiss Climate AG Analysis and reduction Firm
Low Carbon Label Corporate Carbon Footprint
TÜV NORD CERT Analysis Whole supply chain
Low Carbon Label SwissClimate " CO2 footprint"
Swiss Climate AG Analysis Firm

The role of corporate social responsibility in reducing greenhouse gas emissions from agriculture and food.
Draft for public consultation
51
Farm management and agricultural practices (in addition to certification schemes)
Many agri-food firms support on-farm measures outside agri-food certification schemes
that could affect greenhouse gas emissions or pressurise or support their suppliers to do
so. These include measures such as supporting conservation tillage, planting improved
varieties, integrated pest management, precision irrigation, and innovation in feeding
practice. It also includes awards and financial incentives for meeting certain
environmental criteria, promoting the sharing of best practices among suppliers,
supporting suppliers in implementing their own carbon assessment schemes, and raising
awareness among suppliers of environmental issues. Some corporate social responsibility
strategies include investment in farmer training directly and such actions are particularly
relevant to strategies operated by food manufacturers who have tight links with farm
suppliers, especially in sourcing fresh produce such as milk and vegetables. This is in
addition to certification requirements on training.
Companies may also provide knowledge-based aids and tools. For example, the Cool
Farm Tool is a farm-level greenhouse gas calculator for estimating net GHG emissions
from agriculture that was developed by the University of Aberdeen with support from
Unilever. It can be used as an incentive scheme because it allows simulating emission
changes resulting from changes in agricultural practices on farm-level.
Technical efficiency in processing, manufacture and retail
Most corporate social responsibility strategies include technical measures to reduce the
consumption of energy and other resources within the post-farm supply chain. These
include energy conservation measures, use of renewable energy, reducing and optimising
transport, reducing packaging, reducing and reusing waste. These efficiency measures
have obvious internal benefits and give rise to cost reductions for the firms involved.
Sectoral cooperation, partnerships, platforms, and roundtables
In addition to managing commodity certification, many roundtables, fora, platforms and
partnerships bring together people from several industries involved in the same food area.
Depending on the type of institution and the level of individual engagement, activities
range from contributing to exchange platforms and lobbying partnerships to establishing
commitments among their members. Many are initiated by NGOs. The WWF and a
number of leading food brand owners (e.g. Unilever, Nestle, Danone and Mars) have
played a leading role in these.
Restoration of ecosystems
In the context of climate change mitigation, this is largely about restoring soil carbon
stocks through for example re-wilding of farmed land, restoring forests or grassland, or
rewetting drained peatland. These activities may be embedded in farm or commodity
certification or may be incentivised indirectly through carbon off-setting. The overall effect
in terms of greenhouse gas emissions is analogous to the reversal of changing land-use to
agriculture

The role of corporate social responsibility in reducing greenhouse gas emissions from agriculture and food.
Draft for public consultation
52
Investment in research
A number of large firms invest in research relevant to the goals of their CSR strategies.
This includes research to improve agricultural production, including research in pre-farm
activities such as plant breeding. There is also a wide range of research activities around
carbon foot-printing and assessment at various levels.
Some research activities go beyond the direct interests of firms and extend to wider public
interest topics such as climate change in general, diet and health, and general agricultural
improvement.
Influencing consumer choice and demand
The carbon footprint at the consumer level is largely determined by diet, particularly the
quantity and type of protein as determined by the intake of livestock products. Relevant
measures could include marketing activities directed at supporting consumers in reducing
the intake of carbon-intensive foods and low-impact local or seasonal food.

The role of corporate social responsibility in reducing greenhouse gas emissions from agriculture and food.
Draft for public consultation
53
4. THE IMPLEMENTATION OF GREENHOUSE GAS MITIGATION ACTIVITIES
Chapter 2 of this report examines the sources of agri-food greenhouse gas emissions and
options for their mitigation. Chapter 3 describes activities supported in corporate climate
responsibility strategies relevant to reducing greenhouse gas emissions from the food
system. This chapter examines the use of these corporate social responsibility activities
using a sample of firms operating in agriculture and food. This provides the basis of an
integrated assessment of the impact of corporate social responsibility in Chapter 5.
Selection of corporate social responsibility strategies for study
This study uses a purposive sample of firms with corporate social responsibility strategies
and supporting instruments that potentially affect greenhouse gas emissions. Only firms
in the agricultural and food sector in a wider sense, including processing (e.g. Arla) and
catering (e.g. McDonald’s) were sampled. The sampling strategy was based on a
structured search process. Short interviews with industry experts were conducted to help
identify firms that are involved in corporate social responsibility activities relevant to
reducing greenhouse gas emissions. Reports by international governmental and
nongovernmental agencies were also examined with the same aim. We then drew up a
list of candidate firms and used size, type of firm and country of origin as criteria for
inclusion in the sample. 40 firms were identified and included in the study (Table 4). This
sample includes several of the major players such as Unilever, but also medium-sized
firms such as Arla. The large players have significant market power and are thus
particularly relevant for the global scale. Among the smaller companies we included
companies from all stages of the supply chain. The information we used was obtained
from these firms’ corporate sustainability and corporate social responsibility reports and
any related information from the company websites.

The role of corporate social responsibility in reducing greenhouse gas emissions from agriculture and food.
Draft for public consultation
54
Table 5. The country of origin or base, the category of firm according to its position in supply chains, the
number of greenhouse gas mitigation measures undertaken, and the type of ownership (publicly traded,
private and mutually owned). Category 1 is firms with specific branded consumer products (e.g. Heinz).
Category 2 covers firms that interact with consumers over a wide range of products in the retail and food
services sector. Category 3 is commodity processors and traders. The ownership models are publicly
traded private, and mutually owned. a The SRA (Sustainable Restaurant Association) represents a group of
restaurants and does not easily fit into the categorisation.
Firm Base Category Activities Ownership
Associated British Food
UK
1 28
Publicly traded
Archer Daniels Midland USA 3 25 Publicly traded
Alfred Ritter GmbH Germany 1 5 Private
Arla Foods Denmark 1 22 Mutual
Barilla Italy 1 17 Private
Barry Callebaut Switzerland 3 15 Publicly traded
Cargill USA 3 75 Private
CocaCola USA 1 22 Publicly traded
COOP Switzerland 2 22 Mutual
Danone France 1 8 Publicly traded
Del Monte USA 1 12 Private
Ferrero Italy 1 18 Private
General Mills USA 3 18 Publicly traded
Glanbia Ireland 3 13 Publicly traded
Gulpener Bier Netherlands 1 3 Private
H. J. Heinz Company USA 1 16 Private
Hershey USA 1 9 Publicly traded
Hipp Germany 1 13 Private
John Lewis Partnership UK 2 34 Mutual
Kelloggs USA 1 19 Publicly traded
Klasmann Deilmann Germany 3 2 Private
Kraft Foods USA 1 20 Publicly traded
Marks and Spencer UK 2 33 Publicly traded
Mars USA/UK 1 14 Private
McCain Foods Canada 1 26 Private
McDonald’s USA 2 25 Publicly traded
Morrisons UK 2 25 Publicly traded
Nestlé Switzerland 1 35 Publicly traded
Peeze Coffee Netherlands 1 5 Private
PepsiCo USA 1 48 Publicly traded
PHW Group Germany 1 7 Private
Provamel Netherlands 1 11 Private
Sainsburys UK 1 26 Publicly traded
Starbucks USA 2 20 Publicly traded
Stora Enso Finland 3 6 Publicly traded
SRAa
UK NA 6 NA
Tesco UK 2 12 Publicly traded
Tchibo Germany 2 25 Private
Unilever UK/Netherlands 2 32 Publicly traded
Walmart USA 2 22 Publicly traded

The role of corporate social responsibility in reducing greenhouse gas emissions from agriculture and food.
Draft for public consultation
55
We took two approaches to our analysis: qualitative and quantitative. These were
conducted independent of each other. The qualitative examination of corporate social
responsibility reports and related documents was done to examine commitment and
effectiveness of corporate social responsibility activities in reducing greenhouse gas
emissions. The activities identified are provided in Annex 1.
The quantitative assessment examined firms’ published financial and other business data
for relationships between firms’ characteristics and their use of activities relevant to
reducing greenhouse gas emissions. We recorded the number of GHG-related corporate
social responsibility activities per firm and examined other criteria such as firm size and
turnover in order to find out if certain characteristics of firms are correlated with corporate
social responsibility efforts to reduce greenhouse gas emissions from the food system.
A quantitative and qualitative overview of mitigation-related measures
The 40 firms are supporting a total of 166 individual measures. The number of activities
per firm is presented in Table 5. There are two caveats with this table. The activities of
large firms may be under-represented because local activities operated by branches of the
company may be overlooked in corporate reporting. Counter to this, large firms may have
more sophisticated overall corporate social responsibility reporting and report more than
smaller firms. We nevertheless believe that the data presented give a reliable general
overview of engagement of firms in corporate climate responsibility.
Fourteen types of activities were identified. The number times the activities in these
categories was recorded as used by the 40 sample firms was computed. The result is
shown in Figure 7.

The role of corporate social responsibility in reducing greenhouse gas emissions from agriculture and food.
Draft for public consultation
56
Figure 7. The number of cases of the implementation of greenhouse gas mitigation activities by the 40 firms
in relation to mitigation areas or activities. The use of each of the 166 activities (Annex 1) identified is
allocated to one of 14 mitigation areas or mitigation activities.
Agri-food certification
The use certified produce or commodities is common in our sample of firms, with firms
supporting three certification-type activities on average. These include purchasing
produce directly from certified farms; using organic or Fairtrade ingredients; purchasing
certified commodities; and purchasing credits for certified production. The most widely
used commodity certification is that for palm oil from the Roundtable on Sustainable Palm
Oil with 23 of the 40 firms using it. Fairtrade is used by 19 of the 40 firms and is the most
widely used commodity certification used. Certification by Rainforest Alliance is also
widely used, as are a range of other certification schemes such as UTZ.
Carbon certification, carbon offsetting and trading
A wide variety of carbon certification schemes are used by 22 of the 40 firms. The Carbon
Trust standard is the most popular with 5 firms reporting using it. Measuring the firm’s own
carbon footprint is common with 32 of the 40 firms engaging in it, either for single products
or for the business as a whole. All of these firms also have a carbon reduction aim. 20
firms purchase carbon offsets or invest in carbon offsetting projects.
Cooperation and partnerships
We identified 57 examples of the use of cooperation, partnership and networking across
the sample of 40 firms. A cooperation or partnership is defined here as an explicit
arrangement with another firm or NGO for a specific purpose. They are often ‘Round

The role of corporate social responsibility in reducing greenhouse gas emissions from agriculture and food.
Draft for public consultation
57
Tables’ and trust-based voluntary peer groups. NGOs such as the WWF and a number of
leading food brand owners (e.g. Unilever, Nestle, Danone and Mars) have played a
leading role in these. Activities range from knowledge exchange to establishing
commitments among their members. These round table initiatives are also used for pre-
competitive collaboration to address strategic goals. Membership has awareness-raising
effects and there are benefits from shared insights and information. Round table
organisations also operate certification programmes. It is possible to purchase or
otherwise support certified produce without being a member of the relevant round table,
and vice versa.
Protection of ecosystems
In the context of climate change mitigation, restoring ecosystems is largely about restoring
soil carbon stocks through, for example, re-wilding of land, restoring forests or grassland,
or rewetting drained peatland.116 A few firms are involved in several activities and the
majority involved in none at all. Those involved include large companies such as Nestlé
and companies directly linked to forest ecosystems such as Del Monte and Stora Enso.
116 Smith P., M. Bustamante, H. Ahammad, H. Clark, H. Dong, E.A. Elsiddig, H. Haberl, R. Harper, J. House,
M. Jafari, O. Masera, C. Mbow, N.H. Ravindranath, C.W. Rice, C. Robledo Abad, A. Romanovskaya, F. Sperling, and F. Tubiello, 2014: Agriculture, Forestry and Other Land Use (AFOLU). In: Climate Change 2014: Mitigation of Climate Change. Contribution of Working Group III to the Fifth Assessment Report of the Intergovernmental Panel on Climate Change [Edenhofer, O., R. Pichs-Madruga, Y. Sokona, E. Farahani, S. Kadner, K. Seyboth, A. Adler, I. Baum, S. Brunner, P. Eickemeier, B. Kriemann, J. Savolainen, S. Schlömer, C. von Stechow, T. Zwickel and J.C. Minx (eds.)]. Cambridge University Press, Cambridge, United Kingdom and New York, NY, USA.

The role of corporate social responsibility in reducing greenhouse gas emissions from agriculture and food.
Draft for public consultation
58
Table 6. List of available carbon standards (April 2013)
Label type Labels Certification body What it does Focus
Carbon Intensity Carbon Label Carbon Trust Analysis Product
Carbon Neutral Atmosfair Stiftung Zukunftsfähigkeit Analysis and compensation
Transport
Carbon Neutral TÜV NORD CERT TÜV NORD CERT Analysis, reduction and compensation
Supply chain
Carbon Neutral CarbonFree Certified Carbonfund.org Foundation
Analysis, reduction and compensation
Product
Carbon Neutral CarbonFree® Partner programme/events
Carbonfund.org Foundation
Analysis and CO2-compensation
Product
Carbon Neutral Carbon Neutral The CarbonNeutral Company
Analysis, reduction and compensation
Whole supply chain
Carbon Neutral Climate Neutral myclimate (Swiss foundation)
Analysis and CO2-compensation
Whole supply chain
Carbon Neutral Climate performance myclimate (Swiss foundation)
Analysis, reduction and compensation
Firm
Carbon Neutral CO2 neutral production process
Provamel Analysis, reduction and compensation
Carbon Neutral CO2OL Forest Finance Group Analysis, reduction and compensation
Product
Carbon Neutral Green Index rating Analysis, reduction and compensation
Carbon Neutral KlimaINVEST Investment company KlimaINVEST
Analysis, reduction and compensation
Whole supply chain
Carbon Neutral Label
National Carbon Offset Standard
Low Carbon Australia Analysis, reduction and compensation
Firmfirm
Carbon Neutral Label
No CO2 Certification Program
Carbon Reduction Institute
Analysis, reduction and compensation
Whole supply chain
Carbon Neutral Label
Stop Climate Change AGRA-TEG Agrar- und Umwelttechnik
Analysis, reduction and compensation
Firm
Carbon Neutral Label
SwissClimate "CO2 Neutral"
Swiss Climate AG Analysis, reduction and compensation
Firm
Carbon Neutral Label
Certification "Carbon negative"
Green Tick Certification Limited
Analysis, reduction and compensation
Firm
Carbon Neutral Label
Certification "Carbon neutral"
Green Tick Certification Limited
Analysis, reduction and compensation
Firm
Carbon Rating Climatop Climatop Association Analysis Firm
Carbon Reduction Label
Carbon Reduction Label Carbon Trust Analysis and reduction Product
Carbon Reduction Label
Carbon Trust Standard Carbon Trust Analysis and reduction Firm
Carbon Reduction Label
Climate certification for the food chain
KRAV Swedish Seal/Svenskt Sigill
Reduction Product
Carbon Reduction Label
ABCERT Standard ABCERT AG Analysis and reduction Whole supply chain
Carbon Reduction Label
Soil & More Soil & More International Analysis and reduction Whole supply chain
Carbon Reduction Label
SwissClimate "CO2 optimized"
Swiss Climate AG Analysis and reduction Firm
Low Carbon Label Corporate Carbon Footprint
TÜV NORD CERT Analysis Whole supply chain
Low Carbon Label SwissClimate "CO2 footprint"
Swiss Climate AG Analysis Firm

The role of corporate social responsibility in reducing greenhouse gas emissions from agriculture and food.
Draft for public consultation
59
Influencing farm practices
This is effort to support or require technical change on farms through the provision of
training, technical support or the setting of practice guidelines that supplier farms have to
follow, and even direct implementation of on-farm technical improvements. These
activities of seek to improve technical efficiency with measures such as supporting
conservation tillage, the adoption of new varieties, integrated pest management, precision
irrigation, and innovations in feeding practice. Firms may require that their suppliers
change specific practices or they may create awards and financial incentives for meeting
certain environmental criteria. They may promote the sharing of best practices among
farmers, support suppliers in implementing their own carbon assessment schemes, and in
general raise awareness among suppliers of environmental issues.
The setting or implementation of standards or definition of key environmental performance
indicators for suppliers; issuing supplier guides or best practice charta, toolboxes and the
carbon assessment of suppliers/farmers are common. There are cases of the public
sector stepping in to provide publicly-owned certification schemes which would support all
relevant food industry players, for example Origin Green developed by the Irish Food
Board which is a state-sponsored body in Ireland. Supporting the gathering of
environmental data and promoting the sharing of best practices between suppliers are also
mentioned frequently, whereas direct financial incentives and rewards for desired activities
are not common.
There is a high correlation (0.75) between the use of different measures to influence
agricultural practice and the use of training. These are also both positively correlated with
certification, signifying that support of certification and training are often linked.
Investing in research
We recorded 61 cases of firms investing in research. Most support carbon assessment
and foot-printing methodologies and improved agricultural practices. Generally, research
activities are directly related to or support other measures. The research supported is
often pre-competitive. One such example is the Cool Farm Tool from the University of
Aberdeen which is used to estimate emission changes resulting from changes in
agricultural practices on farm-level. Several firms have plant breeding programmes (e.g.
Heinz and Del Monte) which may also involve pre-competitive research activity. Some
research activities extend to wider public interest topics such as climate change in general,
diet and health, and general agricultural improvement.
Technical supply chain measures: transport, energy use, waste management, packaging
and recycling
Technical supply chain efficiency measures are focused on raising resource (in particular
energy) use efficiency in processing, manufacturing, transport and retailing and optimising
transport, reducing packaging, reducing and reusing waste.

The role of corporate social responsibility in reducing greenhouse gas emissions from agriculture and food.
Draft for public consultation
60
All firms in the sample reported efforts to reduce energy use but many did not specify in
detail how they achieve this. Own energy generation, mostly from waste, is mentioned by
21 firms. Other examples include installing solar panels (4 cases), improving cooling,
heating or processing systems (5 cases).
15% of firms mention the use of recycled or environmental friendly materials and 20 %
mention converting by-products or waste into feed. The use of FSC certified packaging
material is by far the most common activity accounting for 59% of all cases. The relative
infrequent mentioning of waste management, packaging and recycling may be to some
extent due to the role of regulations in determining practices.
We recorded only 20 instances of measures focused on transport, implemented mainly by
the large processors and retailers. This may be partly due to companies not reporting
transport changes as part of CSR. Of the measures reported, reducing transport distance
and moving from road to rail or ship dominated.
Consumption change
Measures influencing consumer choice and demand raises awareness among consumers
or actively supports consumers in reducing the intake of foods that give rise to high GHG
emissions in production. Firms may also engage in consumer education about waste
reduction and prevention.
19 firms were identified as involved in activity related to consumption including promoting
seasonal, organic, vegetarian food and educational activities around climate change,
waste and food storage and environment in general. In our sample, this type of mitigation
activity is supported mainly by retailers, caterers and firms with strong consumer brands.
Alignment of activities and climate protection challenges
We now turn to the question of the alignment of the corporate climate responsibility
activities identified in these 40 firms and the sources of emissions in the food system (set
out in Chapter 2). By assessing activities in relation to their relevance to the various
stages in the supply chain, we can consider how well corporate climate responsibility
activities are focused on the most important sources of emissions. For this we take the
results of the study from Garnett of sizes and sources of emissions from the UK food
system the UK117 reported in Chapter 2 (these do not include an estimate for land use
change). From our insight into the literature, we are confident that the results of this
assessment of the UK food system are reasonably representative of food systems in
developed economies. We allocated each use of a measure for each firm to one of the
117 Garnett, T. 2008. Cooking up a storm. Food, greenhouse gas emissions and our changing climate. The
Food and Climate Research Network.

The role of corporate social responsibility in reducing greenhouse gas emissions from agriculture and food.
Draft for public consultation
61
nine supply chain areas and summed these for the whole sample. The allocation of these
to each supply chain stage as a percentage of the total is shown in Figure 1 in relation to
the percentage of supply-chain emissions from each stage according to Garnett. This
shows that generally the emphasis of corporate climate responsibility efforts match the
importance of emission sources, with a strong emphasis on primary production (farming).
This however is a rough estimate since the allocation of activities to sources of emissions
is not straightforward, and there are some exceptions to this conclusion. We found no
examples of firms addressing food-related emissions from activities in the home, for
example refrigeration and cooking. In addition some activities such as supporting
certification may address several sources. Fertiliser manufacture, which is the largest
source of pre-farm supply chain emissions, is not addressed directly by any firm in our
sample.
In addition to the above analysis of alignment of measures to sources of emissions, the
data set we assembled enabled us to examine stated targets and progress against them
for most of the firms. The results of this are shown in Table 7.
It is important to note that these data are not suitable for comparing firms because the
basis for the measurement of emissions as well as their scope varies widely. It is not a
league table. Some firms account only for emissions from a certain product or production
stage, or only from energy use. Others account for emissions from specific plants or
factories. Some firms go as far as taking their complete emissions including indirect
emissions, e.g. from land use change, into account for their emission reduction aims.

The role of corporate social responsibility in reducing greenhouse gas emissions from agriculture and food.
Draft for public consultation
62
Figure 8. The proportion (%) of food-related greenhouse gas emissions from successive stages of the food
chain (excluding land-use change – from Garnett 2008118
) and the corresponding proportion (%) measures’
targets in the firm sample.
118 Garnett, T. 2008. Cooking up a storm. Food, greenhouse gas emissions and our changing climate. The
Food and Climate Research Network.

The role of corporate social responsibility in reducing greenhouse gas emissions from agriculture and food.
Draft for public consultation
63
Table 7. Summary of direct GHG emission aims and achievements as reported by the firms in the study
sample (only firms for which aims were recorded in the database).
Firm Emission reduction aim
Period Achievements (where reported)
Basis of measurement and scope of emissions
ABF 22% carbon emission reduction 2009/10
varies with sub-firm
ADM 15% 2010 - 2020 2010-2012: 2.6% reduction in emissions; 4.3% reduction in energy use.
Operating energy use and emissions on per unit of production
Alfred Ritter GmbH & Co. KG
6,800 t CO2 reductions yearly since 2002 through own energy production
Arla Foods 25% 2005 - 2020 Operating emissions per unit milk
Barilla 55%; 30% for plants and main offices
2014 for plants and main offices
20% or 21% compared with 2008-2011, 19% in 2009-2011
Greenhouse gas emissions per t of finished product (for the 21%achievement), unclear for the target
Barry Callebaut 20% 2008/9-2013/4 19% carbon emission reductions 2008-2011
Operating emissions per unit of production
Cargill 5% 2010-2015 4.9% reduction to 2012 Operating emissions (firm)
Coca-Cola Zero growth in emissions with output increasing
2004-2015 3% increase in 2011 compared to 2004
Operating emissions for the company (detailed analysis on transport, etc. level)
COOP Carbon neutral by 2023
2008-2023 15% reduction from 2008-2012
Direct and indirect operations emissions
Danone 30% 2008-2012 35% reduction achieved Company operating emissions
Del Monte Processing 10%, transport 7%, packaging 11%
2007 - 2016 (2007 - 2011 packaging)
11% reduction in processing (2007-2011)
Company operating emissions
Ferrero 40% 2007 - 2020 12% reduction in per unit product emissions in 2010-2012
Company operating emissions
General Mills 20% 2005 - 2015 9% reduction in emissions per unit product
Company operating emissions
Glanbia 25% -2020 Dairy supply chain
H.J. Heinz Company
20% 2005 - 2015 13.2% per unit of production Direct emissions from operations
Hershey 13% 2009 – 2015 22% reduction 2009-2013, new target 15% (2013-2017), offset emissions for corporate and sales fleet in 2014
Company operating emissions
Hipp Carbon neutrality 21% energy saving 1999-2011. Carbon neutrality achieved in Germany and Switzerland
John Lewis Partnership (Waitrose)
15% 2010-2020 On target in 2012. Company operating emissions
Marks and Spencer
35% 2006/7 - 2012/15
All stores, offices and warehouses in the UK and Ireland were carbon neutral by 2012. Gross CO2e emissions down by 22% by
Company operating emissions

The role of corporate social responsibility in reducing greenhouse gas emissions from agriculture and food.
Draft for public consultation
64
2012.
Mars 25% overall. Eliminate GHG emissions from factories & offices (2040)
2007-2015, 2040
5% between 2007 and 2011 Company operating emissions
McDonald’s “aspirational” goal 20% increase in energy efficiency
2013-2020 Energy from company operations and company-owned restaurants in top nine markets.
Morrisons 30% 2005 - 2020 15% reduction in operational emissions 2005 – 2011
Company operating emissions
Nestlé 35% 2005-2015 Emissions declined 24% during 2002 – 2012
Operating emissions per tonne of product
PepsiCo Stable emissions with business growth
Total operating emissions
PHW group 50% by 2020 Product life-cycle emissions
Provamel Production process is carbon neutral since 2010
Sainsbury's 30 % absolute 65 % relative 50 % in food carbon footprints
2005 - 2020 3.7 % absolute reduction from direct and indirect sources from 2010/11 to 2011/12; 48,000 tonnes of carbon since 2007 through Farmer Development Groups.
Operational carbon emissions – absolute and relative to output; own brand products
Stora Enso 35% 2006-2025 Direct and indirect fossil CO2 emissions from pulp paper and board production facilities reduced 26% from 2008-2012
Fossil CO2 emissions per saleable tonne of pulp, paper and board
Tchibo 30% by 2012 2006 to 2011: 30 % (transport, direct)
Transport emissions adjusted for sales and tonnage
Tesco 50% reduction in buildings’ emissions by 2020. Zero carbon for internal emissions by 2050
2006-2020 Generally on or ahead of energy and emission targets
Operational emissions
Unilever Energy emissions in manufacturing: at or below 2008 levels Manufacturing: reduction of 40% per tonne of production.
2008-2020 32% reduction in 2008-2013 in manufacturing sites (manufacturing accounts for 5% of value chain emissions). the total GHG impacts including consumer use, has increased by 5% since 2010.
Energy in manufacturing, manufacturing Revision of strategy ongoing
Walmart 20% 2005-2012 13% absolute reduction in GHG emissions in 2005.
Applies to a subset of facilities.

The role of corporate social responsibility in reducing greenhouse gas emissions from agriculture and food.
Draft for public consultation
65
Firms’ characteristics and their use of greenhouse gas mitigation measures
To identify patterns in the sample, we examined correlations between the firms’
characteristics and their use of GHG mitigation measures. Relevant characteristics
include the country or region in which firms are based or head-quartered, firm age, sector,
ownership type, turnover, number of employees, or turnover per employee. The clearest
observation is that firms with high turnover per employee tend to have fewer activities.
Figure 9. Number of firm CCR activities plotted against annual turnover per employee (left); number of
activities in relation to the type of ownership (right). The line shows median, boxes represent 50% of data,
whiskers represent 95%.
Labour intensity is typically high in the retail and food services sectors. These firms such
as Walmart and McDonald’s that address a wide range of supply chains interact
intensively with consumers, and have valuable brands. As CSR is relevant to brand
protection119 there is a clear rationale for investment.
Differences in commitment to activities cannot be attributed to ownership models or to the
differences in climate protection policy in the countries where firms were founded or are
based. There is no statistically significant difference in our sample between different types
of ownership in terms of number of activities (Figure 9, right). It might be expected that
mutually-owned firms or publicly traded companies would be more active because they are
under stronger public scrutiny, but our data for this sample do not support this supposition.
Firms’ region of origin or base appears to play a slightly stronger role. Within our sample,
UK-based companies engaged in a particularly high number of activities (Figure 10). In
contrast, the firms based in France and Germany are characterised by engagement in
119 Kitzmueller, M., and Shimshack, J. (2012). Economic Perspectives on Corporate Social Responsibility.
Journal of Economic Literature, 50(1): 51–84.

The role of corporate social responsibility in reducing greenhouse gas emissions from agriculture and food.
Draft for public consultation
66
relatively few activities and this means that the average number of activities of companies
registered in continental Europe is lower than those registered in the UK and Ireland and
this difference is significant (p-value 0.04).
Figure 10. Number of CCR activities in relation to firms’ country of origin or base (left) and their type of
ownership (right). Line shows median, boxes 50% of data, whiskers 95%.
We also looked at the number of activities as affected by the relationship companies have
with final consumers (Figure 10). This showed that the companies in Category 2 (Table 1)
with direct contact to consumers over a wide range of products (in particular retailers and
food service firms) engage in the largest number of activities. However, the difference
between the categories of firms is not significant, and it is notable that Category 3
companies (commodity traders such as Cargill that are not visibly present in consumer
markets) also support many CSR activities.

The role of corporate social responsibility in reducing greenhouse gas emissions from agriculture and food.
Draft for public consultation
67
5. IMPACTS OF CORPORATE SOCIAL RESPONSIBILITY ON GREENHOUSE GAS
EMISSIONS
Food and climate change: a challenge for markets and food systems
The UK government’s Review on the Economics of Climate Change (The Stern Review)
identifies climate change as the greatest and widest-ranging market failure ever seen.120
Stern’s assessment sums up the fundamental challenge facing those seeking to reduce
greenhouse gas emissions through corporate responsibility. A stable climate is a global
public good impacted on by emissions that have the same global impact regardless of
origin or cause. With such profound market failure, it is difficult to justify private investment
in mitigation, particularly for in agriculture where many emissions are not directly related to
internal costs such as energy use. This lack of a link to internal energy-related processes
(compared with other parts of the economy) is a particular feature of emissions from food
production due to the dominance of emissions from carbon dioxide from land use change,
and nitrous oxide and methane from the underlying biological processes.
A feature of the challenge of climate responsibility in the food sector is the complex nature
of the causes of greenhouse gas emissions in the food system, compared with for
example the steel industry. There are complex interactions between biological processes,
land use and consumption choices. Sonigo et al.121 present a model of the impact of
measures to improve the resource use efficiency of food systems as affected by time and
the hierarchy of levels of change – product and process improvement, technology change,
and system change. They make the point that the greatest improvements require system
change over long time periods (Figure 12).
120 Stern, N. (2006). Stern Review on The Economics of Climate Change. HM Treasury, London.
121 Sonigo, P, Bain, J., Tan, A., Johansson, L. Murphy-Bokern, D. Shields, L., Aiking , H., Erb, K., and
Kastner, T. (2012). The resource use efficiency of the European food cycle. Report for the European Commission Report for the European Commission.

The role of corporate social responsibility in reducing greenhouse gas emissions from agriculture and food.
Draft for public consultation
68
Re
sou
rce
eff
icie
ncy
im
pro
vem
en
t p
ote
nti
al
Time / Degree of change
Product and process and
improvement
Technology change
System innovation
Figure 12. Resource efficiency improvement potential at different levels of system change
over time.
This chapter provides an integrated and largely qualitative assessment of how corporate
social responsibility in the agri-food sector addresses these challenges. First we
summarise effects on each stage of the food system. Then we examine the ambition and
reach of the corporate social responsibility strategies. Lastly, we provide an assessment
of how the balance of investment in public and private goods and the financial strength of
firms.
Impacts of corporate social responsibility on the major sources of greenhouse gas
emissions in the food system
Here we make an integrated assessment of the effect of corporate social responsibility on
the major sources of emissions on a life-cycle basis: land use change; pre-farm;
agricultural production; post-farm processing, manufacture and retail; and consumption.
Land use change
This is a large source of emissions, comparable with the total direct emissions from the
growing of crops and the production of livestock. There is interaction between the direct
and indirect forces driving land use change. The critical question is what effects have
corporate social responsibility activities had on the underlying forces causing land use
change, particularly at the frontier between farmland and the forest. CSR addresses the
drivers behind land use change through four major measures:
The role of corporate social responsibility in reducing greenhouse gas emissions from agriculture and food.
Draft for public consultation
69
1. the purchase of segregated produce such as soybean and meal, and palmoil from
‘sustainable’ production;
2. encouragement of sustainable production through purchasing ‘sustainable’ commodity
on a mass balance basis;
3. supporting sustainable production through purchasing credits; and
4. promoting good agricultural practice to increase productivity thereby reducing pressure
on agricultural expansion.
The first three depend on commodity, produce and farm certification. The overall effect at
farm level is the provision of higher or more stable economic returns to ‘responsible’
producers than is provided by the open uncertified commodity market. The acid test of this
can be summarised in three questions:
do corporate social responsibility activities result in a disincentive to ‘irresponsible’
production, for instance a disincentive to produce on recently or illegally cleared land?
is there a significant premium for the certified produce of ‘responsible’ producers
compare with produce from those not certified as responsible?
is the demand for certified commodity and produce large enough to support significant
change in land use?
The evidence that these questions can be answered positively is, in general, weak. For
soy, certified production remains a small proportion of the total soy output (about 2%).
The situation with palm oil is somewhat better in terms of market share with RSPO
certification accounting for 18% of global production122 and a steadily rising commitment on
the part of the food industry to certified production. However the palmoil certification effort
is criticised for weak standards in relation to land use change.123
Unlike soy, which has concentrated markets for international trade in China and Europe,
the market for palmoil is dispersed and influenced by demand in developing economies
such as in Africa and India. Furthermore, while Europe (which is responsible for about
16% of the palmoil market) leads in terms of supporting certification, it is particularly
important that certification impacts on markets in developing economies. The efforts of
members of the Roundtable on Sustainable Palmoil such as Cargill to influence Chinese
customers is particularly significant in this context to overcome commodity swapping that
can undermine the effect of certification on land use change in particular.
For both soy and palmoil, there is little evidence of significant premia being paid for
sustainable produce so the direct incentive for producers to join certification schemes and
122 Sustainable Palm Oil Platform (http://www.sustainablepalmoil.org/ ) accessed in June 2015.
123 How the Palm Oil Industry is Cooking the Climate" (2007).greenpeace.org. Greenpeace International.

The role of corporate social responsibility in reducing greenhouse gas emissions from agriculture and food.
Draft for public consultation
70
meet their standards is low.124 However, these commodity certification schemes provide
technical support to producers raising yields, reducing costs, and improving conditions for
workers. In addition, small-scale certified producers are networked and this provides
mutual support in improving their production practices. These less tangible benefits have
two effects on greenhouse gas emissions: they are indirect rewards for producers who
avoid the most damaging land-use change and they increase productivity reducing land
use change pressures in the longer-term. UTZ, which certifies coffee, tea and cocoa,
emphasises these benefits.
In assessing impacts on land use change, commodity and produce certification should not
be considered in isolation from other measures. Recent developments in Brazil indicate
that a quasi-regulatory approach in the form of the ABIOVE moratorium on soy from land
which has been illegally cleared in the Amazon biome125 has had a significant impact on
deforestation. Instead of certifying ‘responsible’ produce, this moratorium approach blocks
access to markets. Since the moratorium was introduced in 2006, deforestation in the
relevant regions has declined significantly. It is noteworthy that the moratorium included
two important flanking measures: the collaboration with public authorities in supporting the
acceptance and enforcement of the Brazilian Forest Code, and technical support of
producers. In considering this it must be remembered that some of the moratorium
partners have key positions in these remote parts of the supply chains and unlike in most
other supply chains, they can deny producers access to transport and processing
infrastructure and thus all markets. There is some empirical evidence emerging that the
combination of controls on deforestation, certification in CSR and improvements in farm
practice are associated with very significant reductions in deforestation in Brazil, which is
the major source of soy for Europe.126
Reducing emissions from pre-farm activities
Pre-farm activities account for 1-2% of total greenhouse gas emissions, and these
emissions are dominated by the manufacture of nitrogen fertiliser. There are differences in
efficiencies in production with the low emissions per unit nitrogen output recorded in
Europe. This study has not identified any examples of direct efforts to reduce pre-farm
emissions. All measures that increase farm efficiency have this effect indirectly,
particularly those aimed at increasing nitrogen use efficiency. Even here, CSR measures
on nitrogen use efficiency and reducing the impact of agriculture on the nitrogen cycle are
124 Garrett, R. D., Rueda, X. and Lambin, E.F. (2013). Globalization’s unexpected impact on
soybean production in South America: linkages between preferences for non-genetically modified crops, eco-certifications, and land use. Environ. Res. Lett. 8. 125
Cargill (undated). Responsible soy production. Ensuring responsible soy production in the Amazon. 126
Macedo, M. N., de Fries, R., Morton, D.C. Stickler, C.M., Galford, G.L. and Shimabukuro, Y.E. (2012). Decoupling of deforestation and soy production in the southern Amazon during the late 2000s. PNAS 109 (4) 1341-1346

The role of corporate social responsibility in reducing greenhouse gas emissions from agriculture and food.
Draft for public consultation
71
rare. The Irish farm assurance system Origin Green gives attention to nitrogen use
efficiency but it is noteworthy that this is an industry-wide public sector initiative.
Emissions from agriculture
Emissions from agriculture are dominated by loss of carbon from soils in cultivation,
nitrous oxide from agricultural soils elevated by nitrogen fertilisation and by methane from
ruminants and livestock manures. The size of these emissions in a food system as a
whole is strongly related to the reliance of the system on animal-based products.
Our analysis shows that corporate social responsibility strategies focus on on-farm
activities. They are the primary focus of the full range of certification schemes and also of
direct interaction with farmers. The requirement to use practices that optimise responses
to inputs used within the legal framework (especially plant protection products) and the
provision of technical support is a major component of almost all these activities. These
seek to increase production efficiency and reduce local environmental impacts. Corporate
measures that target underlying emission processes directly: the loss of soil organic
matter; the efficiency of the nitrogen cycle; animal feeding, and system changes that
reduce emissions over and above legal requirements are rare. As with the effect of
certification on land-use change, the improvement in the technical performance of farms
has indirect effects on greenhouse gas emissions by raising resource use efficiency and
yield. Even if activities are not directly impacting on major emission processes, some of
this technical support includes technology to enable farmers estimate farm-level
greenhouse gas emissions, such as the provision of the Cool Farm Tool. This type of
support has the potential to significantly raise farmers’ awareness of the effect of their
decisions on emissions and to achieve reductions through technical improvement in the
longer term.
Emissions from processing, food manufacturing and retail
This covers emissions that arise directly from the operations of the firms we studied. So
the firms have direct influence over these emissions. They typically account for 30 to 50%
of food system emissions (excluding land use change).
Energy use is by far the greatest source of these emissions and so mitigation is directly
coupled to potential cost reductions. Reducing these emissions through improving energy
efficiency and installing renewable energy technology into systems and buildings is part of
all corporate social responsibility strategies we have examined. Targets to reduce
emissions by 10 – 20% over 5 – 10 years are typical (Table 9). Above these targets
relating to internal technical change, some companies also use carbon certification to off-
set emissions further.
Our study indicates that corporate social responsibility is associated with significant
reductions in energy use across the companies we have looked at. A very wide range of
energy saving technologies have been adopted and there is also evidence of some

The role of corporate social responsibility in reducing greenhouse gas emissions from agriculture and food.
Draft for public consultation
72
investment in system changes, such as transferring freight from road to rail. Energy
efficiency has been factored into long-term investments such as the LEED green building
certification.127 The emphasis on energy efficiency is common to all types of companies
we examined regardless of size and where they are registered. However, it is notable that
companies based in Germany and Switzerland that have relatively ambitious energy
policies and tend to report more progress in reducing energy-related emissions.
Product life-cycle assessment (LCA) is now widely used by companies to monitor
performance and communicate this to consumers. In the context of corporate social
responsibility in the food system, this is most widely seen in the carbon foot-printing of
food products. There is a risk that some reports of emission reductions arise merely from
methodology, particularly assumptions on the allocation of emissions to co-products and
system boundaries. The PHW Group uses LCA to monitor the progress of its corporate
social responsibility strategy and aims to reduce the life-cycle emissions from poultry
production by 50% by 2020. They already report low levels of emissions per unit of poultry
meat, compared to the academic literature. This is due in part to the assumption that a
switch to electricity procured over the public network under green tariffs eliminates
electricity-related emissions from processing. It is also assumed that the plant nutrients in
the manure from the growing poultry offset manufactured fertiliser nutrients. Regardless of
the discussion about these allocations, the use of life-cycle assessment over a supply
chain in this way is an example of a valuable strategic and systems-level approach.
Some of the strategies we have examined incorporate quite far-reaching measures to
reduce these emissions, most notably large retailers in Europe. The British retailers John
Lewis, Marks and Spencer, Morrison and Tesco all have ambitious programmes to reduce
emissions from their operations with investment in energy saving technologies, more
efficient refrigeration, more efficient transport, and renewal of the building stock. The
Marks and Spencer Plan A Programme (which incorporates the whole supply chain) is one
of the more far reaching of these and it is now reported to delivering financial benefits to
the business.128 Because of the high visibility of these businesses to consumers, these
activities may have impact outside their own supply networks and extend to raising
awareness of climate protection generally.
However, even the companies with the ambitious efforts rarely go beyond technical
change to existing supply systems. We found no example of efforts to change the food
systems fundamentally. For example, the chilled and frozen food supply and consumption
system is resource, energy and greenhouse gas intensive.129 There are no efforts to
127 US Green Building Council.
128 Marks and Spencer, 2013. Your M&S Plan A Report.
129 Garnett, T. 2007. Food refrigeration: what is the contribution to greenhouse gas emissions and how
might emissions be reduced? A working paper produced as part of the Food Climate Research Network. April 2007.

The role of corporate social responsibility in reducing greenhouse gas emissions from agriculture and food.
Draft for public consultation
73
dampen the expansion of this sector in favour of fresh food or food preserved in other
ways.
Consumption
A large body of evidence has emerged over the last decade that shows how changes in
consumption are a robust approach to reducing global greenhouse gas emissions from the
food system.130 The two main components of such consumption change would be a switch
to a more plant-based diet and reduced use of refrigeration.
Our study identified no corporate social responsibility activities that would support such
change. This extends to businesses that have little or no stake in particular types of
consumption, for example retailers who sell all types of food. Some retailers emphasise
their support for locally supplied food, and this may be interpreted as a potential
contribution to mitigation. However, there is consensus that reducing ‘food miles’ is not
an effective mitigation measure. In the case of British retailers such as John Lewis,
promotion of local food means promoting the consumption of British meat and dairy
products.
The lack of attention to consumption even extends to businesses with strong plant-based
food brands. Similarly, the growth in the market for frozen or chilled ready-made meals
and similar food products is not challenged in any way by corporate social responsibility.
The ambition of corporate social responsibility strategies
The system-nature of the challenge in the food system is due to many interacting
processes and many potential points of intervention where emissions of greenhouse gases
can be addressed. There are “win-wins” for investment in mitigation in many cases and
measures leading to these are more likely to be adopted in corporate social responsibility
schemes compared with measures that bring only external benefits.
Strategic ambition and reach within the food system
We classified the corporate social responsibility strategies according to two dimensions to
assess their ambition to reduce emissions. The first is the potential of the activities to
drive fundamental change. Here we assess how far schemes aim at radically redesigning
production processes, developing new products, and encouraging consumption change
compared with incremental improvement of existing processes or products. The second
dimension is the scope of activities. Here we ask whether the sample firms’ corporate
social responsibility strategies cover single products or processes or whether they are
inclined to address whole firm activities and value chains, including their suppliers and
130 Scarborough, P., Allender, S., Clarke, D., Wickramasinghe, K. and Rayner, M. 2012. Modelling the
health impact of environmentally sustainable dietary scenarios in the UK. European Journal of Clinical Nutrition. 66:710-715.

The role of corporate social responsibility in reducing greenhouse gas emissions from agriculture and food.
Draft for public consultation
74
customers. We assessed each firm’s approach in a qualitative way based on publicly
available information on firms’ websites and in their corporate social responsibility
reporting. We placed each firm in relation to the two scales described above to identify
the location of each firm in relation to four spaces (Figure 10). Only clear commitments
were taken into account.
The position along the X axis reflects the efforts made to change agri-food systems in a
fundamental way. We can use three examples from outside the food sector to describe
cases of companies moving to the right. Some energy companies are moving from the
mere delivery of fuels to the provision of energy services which opens up opportunities to
invest in radical energy saving approaches. The second example is the clothing company
Patagonia which has a “natural growth” programme which advocates buying less. The
third example is from Marks & Spencer which has a clothing re-use programme called
Shwopping.
Box schemes in which suppliers deliver fresh produce directly to consumers is radical
business model in that it re-orientates consumers onto what is available with the producer
leading on choice. Parts of the organic sector represent a radical re-shaping of the food
system in the exclusion of most external inputs and the reorienting of resource flows.
This classification results in four types of corporate climate responsibility programmes
illustrated in Figure 11. It must be emphasised that Figure 11 should not be regarded in
any competitive sense. Comparisons between firms on the basis of position in this matrix
should be avoided. The message that can be drawn is that overall in our judgement the
majority of firms in our sample are focused mostly on incremental product or process
improvement. Corporate climate responsibility programmes that have the potential to
initiate radical change are confined largely to companies in niche areas, for example those
associated with the organic sector. Because of the niche character of these firms and
because they are driven by other aspirations (e.g. expansion of organic food) which are
not necessarily well aligned to reducing greenhouse gas emissions, the potential impact of
these more radical programmes on greenhouse emissions is generally low.
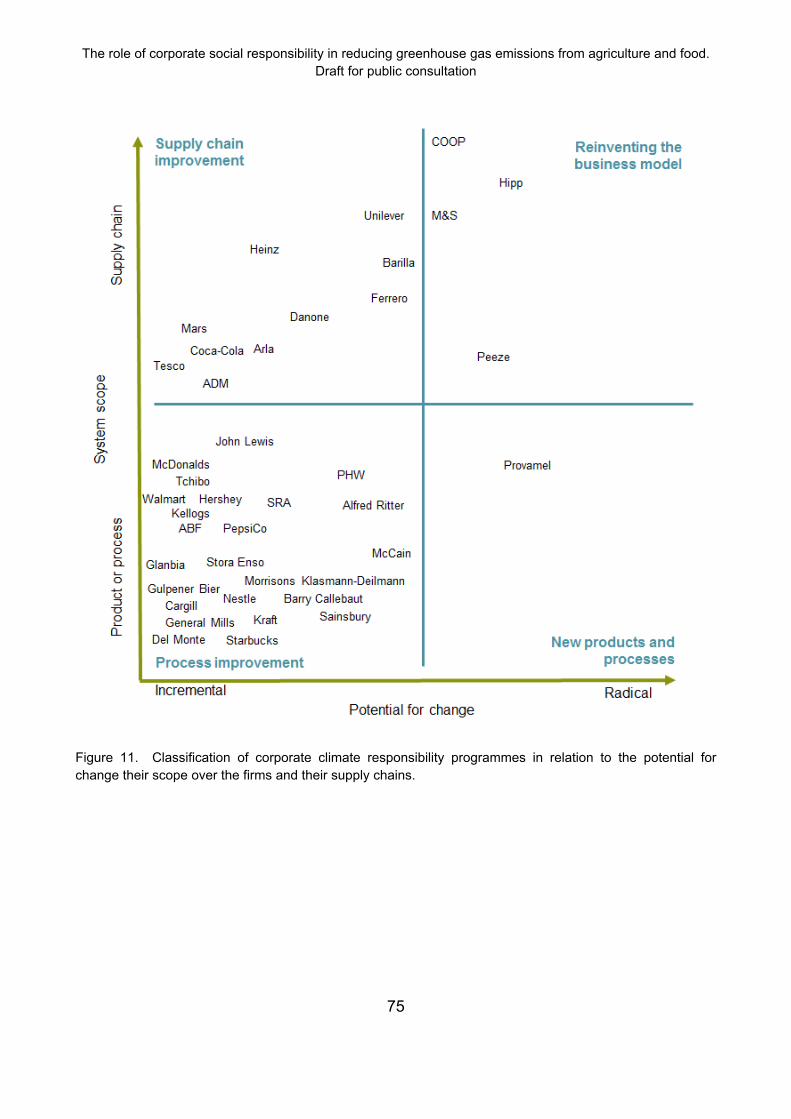
The role of corporate social responsibility in reducing greenhouse gas emissions from agriculture and food.
Draft for public consultation
75
Figure 11. Classification of corporate climate responsibility programmes in relation to the potential for
change their scope over the firms and their supply chains.

The role of corporate social responsibility in reducing greenhouse gas emissions from agriculture and food.
Draft for public consultation
76
6. OUTLOOK AND RECOMMENDATIONS
Farming and food: a sector in transformation
With respect to corporate social responsibility, our study reveals a global agri-food sector
in transformation. Almost all of the firms we examined have introduced corporate climate
responsibility strategies and activities in the last decade. These efforts are still new, with
many firms now reporting just the early phases of efforts to reduce greenhouse gas
emissions. Here we examine the prospects for sustaining these developments and
provide thoughts on bringing corporate climate responsibility forward.
What are the drivers and will these be sustained?
It is remarkable that the development of these strategies and activities continued during
the global financial crisis of 2007 to 2010. From this and our examination of firms’ strategy
documents, we conclude that the drivers behind corporate social responsibility are central
to firms’ strategies and not marginal or passing activities. Many current strategies set out
plans to extend current activities. This growth is particularly clear in terms of the use of
certified produce with targets to reach 100% by 2020 common. Similarly, reductions in
energy use in operations of up to 20% by 2020 are also common.
Our analysis reveals few patterns. Differences in firms’ commitment to activities cannot be
attributed to ownership models or to the differences in the political consensus in the
countries where firms are strongest or registered. Our observations confirm the view of
that corporate social responsibility relevant to greenhouse gas emissions is strongly rooted
in Anglo-American business culture.131 The British-based companies in our sample are
particularly committed and this may be related to some measures that have emerged in
the UK such as the Assured Farm Produce certification scheme that accounts for 70% of
British farm produce consumed in Britain. It is also associated with the sector-wide efforts
in sustainable development that emerged after the BSE crisis of the 1990s.132 133 The
British government’s response to past crises included a substantial role for partnerships in
the private sector. British-based companies such as Unilever and Mark & Spencer have
strong corporate social responsibility programmes. US-based companies with a strong
presence in the UK such as Mars are also characterised by engagement in a wide range
of activities.
131 Becchetti, L., Ciciretti, R. and Conzo, P. 2013. The legal origins of corporate social responsibility. CEIS
Tor Vergata Research Paper Series. Vol. 11 (12), No. 291. October 2013. 132
The Policy Commission on the future of farming and food. (The Curry Report). 2002. The future of farming and food. 133
Defra 2002. Strategy for stainable farming and food.

The role of corporate social responsibility in reducing greenhouse gas emissions from agriculture and food.
Draft for public consultation
77
While there are some marked differences between companies, we can identify two main
drivers behind food-based corporate responsibility: internal cost reduction and brand
enhancement. Efforts are also driven by moral codes which seek peace of mind. By
‘peace of mind’ we mean efforts which go beyond explicit management of specific risks to
include a more general and positive engagement with best or better practice with
immediate wide ranging benefits in supply chains. The relations between these are set out
schematically in Error! Reference source not found..
Cost reduction, profit generation
Moral codes,public pressure
Public policy
Technical efficiency
Brand value
‘Peace of mind’
Climate protection
Cost reduction
Brand enhancement
Partnership
Pioneering investment
Risk management
Commercial responses
Private and public outcomes
Private and public drivers
Private gains/goods Public gains/goods
Figure 12. A schematic of external drivers, firms’ drivers and outcomes governing the development and
delivery of corporate social responsibility strategies relevant to greenhouse gas emissions.
We have identified four types of responses on the part of firms: cost reduction; brand
enhancement; support of mutuality and partnerships; and pioneering investment. There is
no way of categorising firms clearly in relation to the four levels of response. Patterns in
the support of climate-related corporate social responsibility are also difficult to identify
because corporate climate responsibility is predominantly added on to existing strategies
originally focused on social and other environmental goals. However, we can try to
identify some patterns in a qualitative way.

The role of corporate social responsibility in reducing greenhouse gas emissions from agriculture and food.
Draft for public consultation
78
Cost reduction. All the firms in our sample pursue corporate climate responsibility to the
level justified by cost controlling. We observe that this is particularly common in Germany
where firms have brigaded and framed their economically rational responses to local
regulation and their responses to subsidised renewable energy in terms of corporate
climate responsibility. The PHW Group factors the production of subsidised electricity
from photovoltaic panels mounted on the farm buildings it uses into its corporate social
responsibility position. Similarly it highlights its use of biodiesel derived from the poultry fat
arising in its processes. PHW also uses life-cycle assessment (using specific
assumptions) to quantify and communicate the effects of these resource management
practices and assumptions to stakeholders. It identifies nitrogen use as a key component
of emissions providing the foundations of the further development of supply chains.
Similarly for Klasmann Deilmann regulations governing the exploitation of peatland has
influenced their corporate climate responsibility efforts, supported by investment in energy
efficiency. They too pioneered the use of life-cycle assessment in their sector. Alfred
Ritter GmbH is heavily focused on the use of renewable energy and energy conservation
to the extent that the company is prepared to invest up to a point that involves 15% higher
overall energy costs at current prices.
Brand enhancement. Corporate climate responsibility efforts that go beyond internal
efficiencies can be largely justified by brand protection and brand enhancement. This
includes the management of reputational risks. Brands are therefore the primary
economic driver. While this driver is felt directly by those firms with highly visible and
therefore valuable and vulnerable consumer brands, our study indicates that this is passed
effectively along the supply chain to commodity traders such as ADM, Cargill and Barry
Callebaut. The result is that retailers (who all now have strong own-brand food products),
manufacturing firms with branded products, and firms that are not known by consumers
are active to a similar degree in corporate climate responsibility.
Commodity certification and the sourcing traceable supplies are closely connected with
each other. Security of supply of high quality produce is therefore a second driver behind
supply-chain management activities closely associated with certification. The major food
manufacturers such as Nestle, Unilever, Kraft and Heinz all engage in supply chain
management activities that are closely related to certification. These are partly and
increasingly driven by long-term quality and security of supply considerations. These link
informed self-interest, brand enhancement and mutuality and partnership as
interconnected drivers.
Partnership. A wide range of firms claim to strive for mutual benefits. Partnerships
address pre-competitive targets that are central to ambitious corporate climate
responsibility. The framework for mutual cooperation to address pre-competitive targets is
developing in the food sector. Much of this is based on commodity Roundtables which
also manage certification schemes. Here we must distinguish between supporting certified
production by purchasing certified produce or certificates from membership of the

The role of corporate social responsibility in reducing greenhouse gas emissions from agriculture and food.
Draft for public consultation
79
associated roundtables. It is possible to purchase certified produce without being a
member of the relevant round table, and vice versa.
These fora and partnership activities are developing with different degrees of ambition with
the Roundtable for Sustainable Palm oil now reaching a position where its members could
collectively influence land use in the major exporting countries. The Sustainable
Agriculture Initiative complements the Roundtables providing a platform for 50 global food
companies with a focus on arable and vegetables crops, beef, coffee, fruit, and water in
agriculture. So far, the Initiative is focused on cooperation to promote good farm practices.
The Initiative is strongest in the dairy sector where its members claim to be involved in
85% of global commercial milk production.
Pioneering investment. Pioneering investments have a pre-competitive character in the
sense that they have a potential for long-term impact on emissions but bring no immediate
benefit for the individual firm. A combination of firms’ internal moral codes and external
public pressure has supported the pioneering work of companies that have a long tradition
in corporate social responsibility. We found many individual examples of pioneering pre-
competitive activity but it is difficult to identify these pioneering firms as a distinct group.
Companies such as Mars support mutual development (‘shared value’) within the business
and along their supply chains. This has helped place Mars at the forefront of developing
sector-wide pre-competitive activities to advance public agendas. Cargill, operating in
competitive commodity markets might not be expected to be a leader in climate-relevant
corporate responsibility. However, Cargill too has actively participated in pre-competitive
activity through for example the ABIOVE moratorium on soy associated with deforestation
in Brazil. Barilla has supported pre-competitive research and communication on healthy
eating that could indirectly reduce food-related greenhouse gas emissions. A range of
food companies are also involved in plant breeding which is generally an activity that is
subject to significant market failure. Marks & Spencer is a pioneer in its sector in
launching Plan A which was regarded as pioneering at that time of launch. Marks and
Spencer now report that implementing Plan A is now cost neutral and economically
beneficial to the company in the long term.
In an interview to the Guardian newspaper given while attending the UN Global Compact
Leaders’ Summit in 2013, Mr Barry Parkin of Mars provided a vision of the way forward in
corporate social responsibility for sustainable development.134 He sets out the Mars
position which he argues should be a position adopted across the food industry. The
starting point for Mars is the core belief that this is a pre-competitive space and that Mars
would only move to a competitive position if there is a really good argument for doing so.
134 Parkin, B. (2013). Interview with Jo Confino. Mars CSO: sustainability should be a pre-competitive issue
- video http://www.theguardian.com/sustainable-business/video/sustainability-a-pre-competitive-issue

The role of corporate social responsibility in reducing greenhouse gas emissions from agriculture and food.
Draft for public consultation
80
He argues that the current situation with numerous initiatives and many operating in a
competitive context is highly inefficient because many parts of the industry are still fixed to
the business model that firms must compete on everything. A new model with
sustainability at the core built around different competitive principles is needed. He points
out that the challenges are global and the science is the same across the industry so the
logic for pre-competitive collaboration is extremely strong. There have been 120 initiatives
in cocoa over the last 15 years alone and the result is many millions of dollars spent in
fragmented efforts. Barry Parkin: “The net effect is no significant change. So we are
making no difference. Pre-competitive collaboration will lead to cross-sector credibility and
the scale of the impact will be greater. In moving to a sustainable economy, we (the agri-
food sector) are still in the adolescence phase.”
Pre-competitive activity and public policy are closely related. Our analysis of the position
of the firms in our sample indicate that while there is a lot being done by individual firms,
few companies have worked with public policy to support regulation that would advance
the climate protection in a fundamental way. The ABIOVE moratorium on unsustainable
soy is a good example of a successful quasi-regulatory approach and this underscores the
need for cooperation with public policy. Another example that is not relevant to climate
change is recent calls in Germany for public policy to support minimum wages across
Europe in the meat sector. Our assessment revealed few examples of firms supporting
sector-wide regulation and for the most part, regulators and industry leaders operate in
separate spaces with regard to climate protection.
Recommendations
Maintain momentum
Corporate climate responsibility in the food sector is relatively new. It has grown rapidly
over the last decade, building largely on existing corporate social responsibility activities
aimed at social and wider environmental outcomes. Even though this activity is still in its
infancy, there is clear evidence of a widespread change in business culture operating
through supply chains. The proportions of major internationally traded commodities now
certified are significant. However, there is still little evidence that they have reached a
level that gives clear disincentives to minimum standard production, given the buffering
effects of other growing markets. Premia for certified produce remain low. The priority for
climate responsible firms must be to grow and consolidate the market for climate-
responsible produce. The sector must support measures to identify produce that is not
associated with land-use change and generate clear farm-level financial incentives for its
responsible production. We recommend that companies with corporate climate
responsibility programmes should redouble efforts to grow the market for
responsible produce. Consumers can be confident that responding positively to
corporate social responsibility activities is beneficial.

The role of corporate social responsibility in reducing greenhouse gas emissions from agriculture and food.
Draft for public consultation
81
Reduce fragmentation
The agri-food sectors climate responsibility efforts are fragmented. The foundations of
pre-competitive collaboration to address this have been laid in various fora such as the
Sustainable Agricultural Initiative. The climate-responsible agri-food sector should
work to reduce fragmentation of efforts and to consolidate activities.
Review and tighten certification standards
Agri-food certification, particularly commodity certification, is controversial. NGOs argue
that many standards relevant to greenhouse gas emissions, particularly land use change,
are too lax. Linked to pre-competitive collaboration, the agri-food sector should
tighten certification standards to achieve zero land-use change from certified food.
Use innovative market-based mechanisms
The challenge of sourcing and tracing supplies from responsible producers is one of the
barriers to developing corporate climate responsibility. This is particularly challenging in
commodity markets where distinguishing between batches of bulk commodity from
different sources is difficult. Trade in certificates rather than in physically segregated
material enables food business to rapidly grow demand for certified produce and to
transmit premiums to certified growers effectively. This mechanism could be an important
component of pre-competitive efforts to create critical mass in the demand and rewards for
climate responsible production. The food industry needs to work collectively to
develop the trade in certificates and understanding of the benefits. This may
require efforts in explaining the impact of an effective and rewarding certified
produce credits to consumers.
Support more fundamental change to climate-responsible farming
Biological processes on farms are a major source of greenhouse gas emissions. Tackling
these requires addressing the emissions at source by reducing the loss of soil carbon, the
intensity of the nitrogen cycle, and methane from ruminants and manure. Generally,
corporate social responsibility at this level is focused on promoting good general farm
practice but there is relatively little effort to impact fundamentally on emission processes at
the system level. This would involve investment changing land use in some cases to
reverse the decline in soil organic matter levels, efforts to increase nitrogen use efficiency
at a range of scales, and efforts to raise the efficiency of ruminant whole herds and flocks.
We recommend that existing programmes of technical support to farmers be
examined for their impact on basic emission processes and revised if scope for
greater impact is found. In particular, efforts to raise the efficiency of nitrogen and
protein use should be supported. Much of this is pre-competitive activity which
could be done in conjunction the public research base and with regulation (for
example the regulation of fertiliser and manure use.)

The role of corporate social responsibility in reducing greenhouse gas emissions from agriculture and food.
Draft for public consultation
82
Support fundamental change in the food system
The case for changing ‘western’ diets to simultaneously improve public health and climate-
related outcomes is compelling. With the exception of Barilla and Provamel that are
specialised in products with small carbon footprints, and Tesco which is providing carbon
footprint data on many of its products, we identified no serious efforts to support dietary
change to lower carbon-footprint diets. We recommend that food industry actors that
are serious about corporate climate responsibility work to facilitate dietary change
towards lower carbon footprint diets in developed economies in line with relevant
public health recommendations.
Extend efforts to emerging markets
The drivers behind land-use change will remain in place as long as commodity producers
associated with land-use change find ready markets. The relevant expanding markets are
in Russia and China, and a wide range of developing economies for palm oil. Even if all
markets in developed western economies focused entirely on climate-responsible produce,
the trade with these emerging markets can provide adequate outlets for uncertified
production.
We recommend that the food sector together works to increase the market for
certified produce in these emerging markets. This is a long term effort, but it will
send a signal to producers that irresponsible production practices compromise
access to global market position in the long term.
Work with public policy
Governments ultimately bear the responsibility for levelling the competitive playing field
and ensuring public welfare, and protecting public goods Parallel to cross-sector pre-
competitive collaboration, the food sector can actively support public policy development
and regulation to add to the incentives for climate-responsible supply chains and in
particular to add to disincentives for irresponsible production. The success of ABIOVE soy
moratorium shows how this can work, and the public sector Origin Green initiative in
Ireland is a sector wide semi-state approach. Working together, the food industry
operating at farm level and local regulators can achieve a great deal to create advantage
for responsible producers.
Corporate social responsibility strategies should place much greater emphasis in
supporting the development and enforcement of regulation and public policy to
support climate-responsible production.
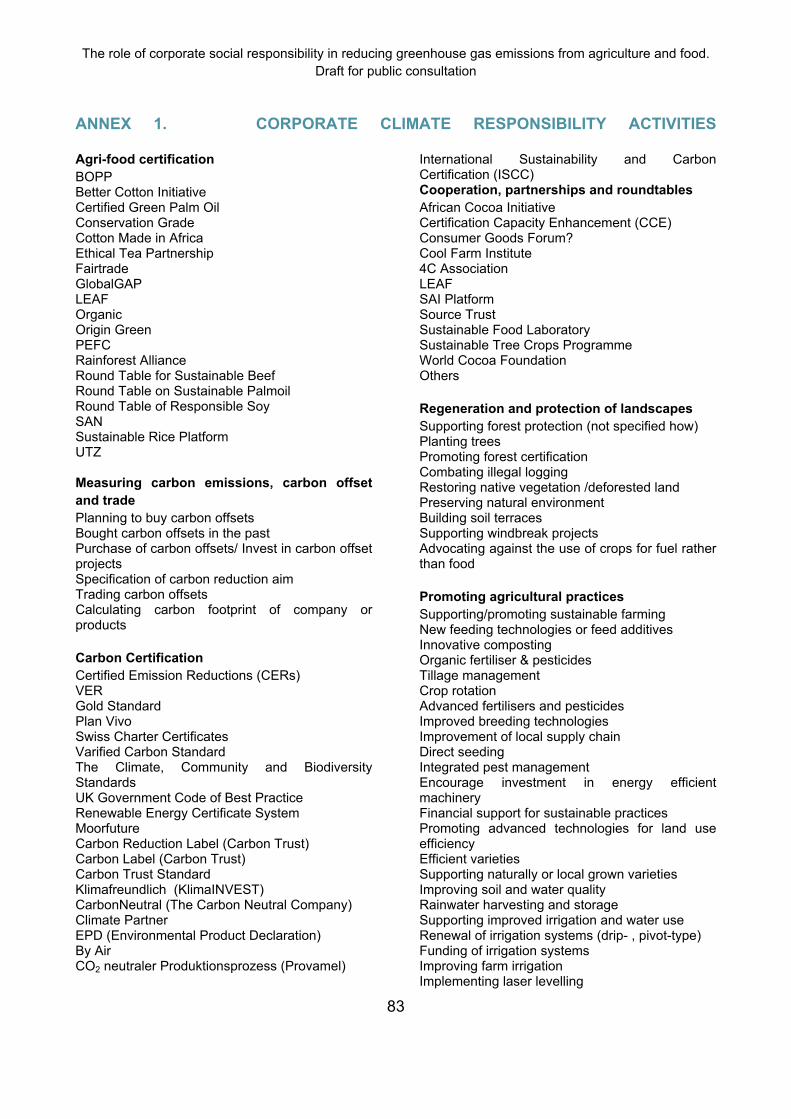
The role of corporate social responsibility in reducing greenhouse gas emissions from agriculture and food.
Draft for public consultation
83
ANNEX 1. CORPORATE CLIMATE RESPONSIBILITY ACTIVITIES
Agri-food certification
BOPP Better Cotton Initiative Certified Green Palm Oil Conservation Grade Cotton Made in Africa Ethical Tea Partnership Fairtrade GlobalGAP LEAF Organic Origin Green PEFC Rainforest Alliance Round Table for Sustainable Beef Round Table on Sustainable Palmoil Round Table of Responsible Soy SAN Sustainable Rice Platform UTZ Measuring carbon emissions, carbon offset
and trade
Planning to buy carbon offsets Bought carbon offsets in the past Purchase of carbon offsets/ Invest in carbon offset projects Specification of carbon reduction aim Trading carbon offsets Calculating carbon footprint of company or products
Carbon Certification
Certified Emission Reductions (CERs) VER Gold Standard Plan Vivo Swiss Charter Certificates Varified Carbon Standard The Climate, Community and Biodiversity Standards UK Government Code of Best Practice Renewable Energy Certificate System Moorfuture Carbon Reduction Label (Carbon Trust) Carbon Label (Carbon Trust) Carbon Trust Standard Klimafreundlich (KlimaINVEST) CarbonNeutral (The Carbon Neutral Company) Climate Partner EPD (Environmental Product Declaration) By Air CO2 neutraler Produktionsprozess (Provamel)
International Sustainability and Carbon Certification (ISCC) Cooperation, partnerships and roundtables
African Cocoa Initiative Certification Capacity Enhancement (CCE) Consumer Goods Forum? Cool Farm Institute 4C Association LEAF SAI Platform Source Trust Sustainable Food Laboratory Sustainable Tree Crops Programme World Cocoa Foundation Others
Regeneration and protection of landscapes
Supporting forest protection (not specified how) Planting trees Promoting forest certification Combating illegal logging Restoring native vegetation /deforested land Preserving natural environment Building soil terraces Supporting windbreak projects Advocating against the use of crops for fuel rather than food
Promoting agricultural practices
Supporting/promoting sustainable farming New feeding technologies or feed additives Innovative composting Organic fertiliser & pesticides Tillage management Crop rotation Advanced fertilisers and pesticides Improved breeding technologies Improvement of local supply chain Direct seeding Integrated pest management Encourage investment in energy efficient machinery Financial support for sustainable practices Promoting advanced technologies for land use efficiency Efficient varieties Supporting naturally or local grown varieties Improving soil and water quality Rainwater harvesting and storage Supporting improved irrigation and water use Renewal of irrigation systems (drip- , pivot-type) Funding of irrigation systems Improving farm irrigation Implementing laser levelling

The role of corporate social responsibility in reducing greenhouse gas emissions from agriculture and food.
Draft for public consultation
84
Introducing water saving technologies Landscaping with drought-resistant species
Training on farm
Sustainable agricultural practices Certification standards Animal feeding Pesticides Fertilizer, crop nutrients Pasture management Integrated pest management Tillage farming Composting Biodiversity Crop rotation Shade trees Forest protection Soil/natural habitat restoration Soil fertility Water management incl. Irrigation Energy use Forest carbon markets Train the trainer
Technical requirements to suppliers
Award environmentally friendly and sustainable practices Financial incentives to meet specific farming criteria Share best practices between suppliers Produce grower programme Supplier guides, best practice charta or toolboxes Define key performance indicators for suppliers Assess and audit standards Carbon assessment, collate emission data of supplier Support the measuring of key indicators
Research
Animal Feed Crop & animal breeding Energy use Carbon sequestration Soil fertility Biodiversity Crop rotation Fertilizer, pesticides Footprinting models, carbon assessment on farm/for supplier Agricultural practices, development of improved methods
New varieties & plants Assessing agricultural practices Climate change in general (Sustainable) agriculture in general Consumer behaviour
Transport
Reduce transport distance Centralize or localize storage or manfacturing facilities Train/ship instead of truck Evaluate ship performance Support extension of railways
Energy use related to food production
Produce energy from waste or by-products Improve cooling, heating or roasting systems Install solar-reflective roofs Reduce energy use (not specified)
Waste use and reduction
Convert by-products or waste into feed Produce fertilizer by anaerobic digestion of food waste Provide waste for compost or fertilizing Use bruised food and vegetables in restaurants
Packaging and recycling
FSC certified material PFEC certified material Sustainable Forest Initiative certified material Environmental-friendly/recycled/-able materials
Consumer related activities
Environmental education Education on food production Help in waste management Education on best food storage Education on climate change Remove "best before" label Promoting recycling or smaller packages Promoting local food Promoting seasonal food Promoting "ugly" food Promoting vegetarian alimentation Organic assortment Collecting ideas from customers Introducing sustainability labels


