
The South African Automotive
Industry
September 2010
Roger Pitot

Evolution of the SA Passenger & LCV Market 1950 to 2009
1950 1960 1970 1980 1981 1990 2000-2003 2004 2005 2006 2007 2008 2009 2010 FC
Passenger 36,758 98,779 201,854 277,058 301,528 209,608 246,386 327,651 419,868 481,558 434,653 329,262 258,129 295,000
LCV 7,676 20,385 95,719 127,708 152,013 125,171 110,128 132,405 170,132 199,677 204,386 169,466 118,159 134,500
Total 44,434 119,164 297,573 404,766 453,541 334,779 356,514 460,056 590,000 681,235 639,039 498,728 376,288 429,500
Source: NAAMSA
+ 91% - 45%
- 25% +14%

April 2010
60 Marques
1,187 models
January 1994
17 Marques
192 Models
Passenger Car Market Makes & Models : 1994 to April 2010
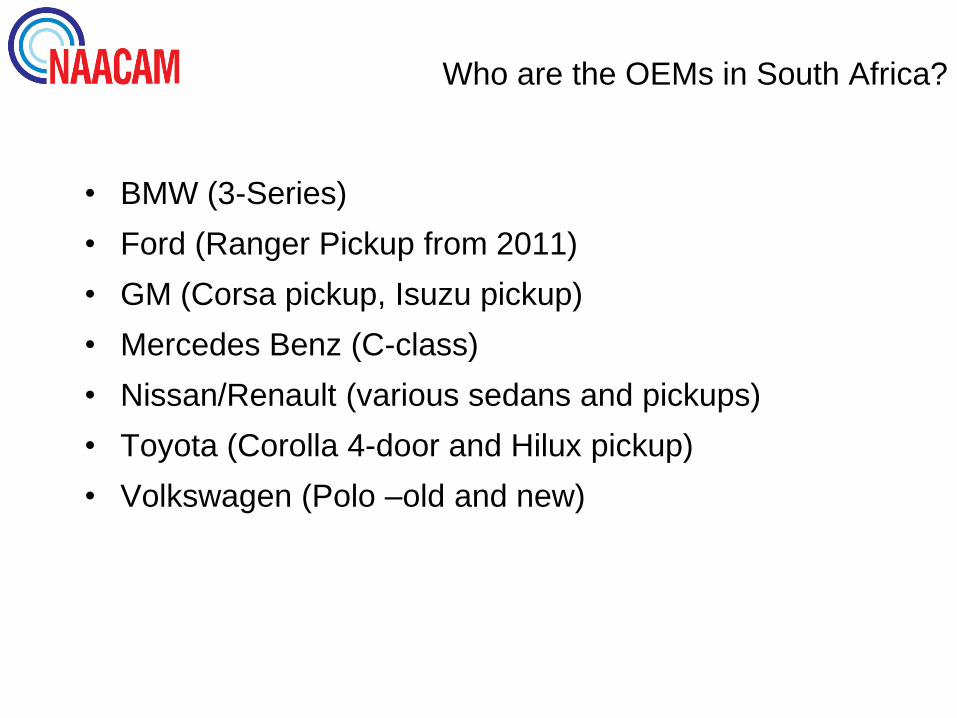
Who are the OEMs in South Africa?
• BMW (3-Series)
• Ford (Ranger Pickup from 2011)
• GM (Corsa pickup, Isuzu pickup)
• Mercedes Benz (C-class)
• Nissan/Renault (various sedans and pickups)
• Toyota (Corolla 4-door and Hilux pickup)
• Volkswagen (Polo –old and new)

FBU Import Duty
MIDP introduced 1 September 1995
EU preferential duty rate introduced end 2006
2006: minus 2%
2007: minus 4%
2008: minus 5%
2009: minus 6%

Industry Performance Since 2000SA vehicle production vs. global production
2000 2006 2008 2009
% change
2009/2008
Global Vehicle
Production
58,40
million
69,33
million
70.52
million
60.99
million
- 13.5%
SA Vehicle
Production
0,357
million
0,588
million
0,563
Million
0,374
Million
- 33.6%
SA Share of
Global
Production
0,61% 0,85% 0,80% 0,61% - 23.8%

Industry Performance Since 1991Export Trends (R millions)
US$ 11.5bn
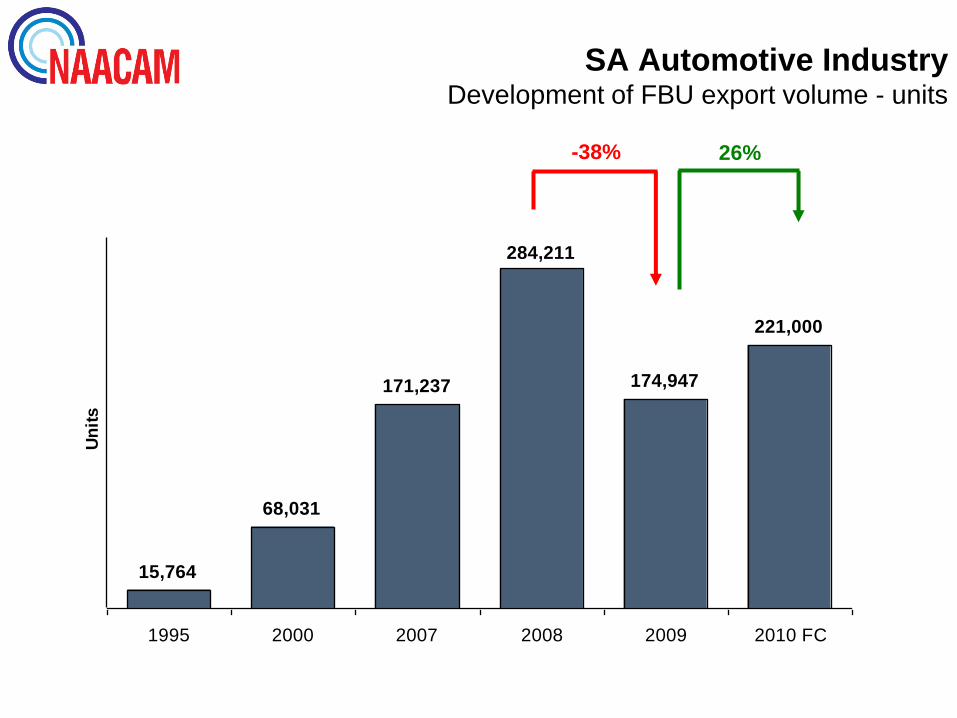
SA Automotive IndustryDevelopment of FBU export volume - units
15,764
68,031
171,237
284,211
174,947
221,000
1995 2000 2007 2008 2009 2010 FC
Un
its
26%-38%

Source: NAAMSA
15,76411,553
19,56925,896
59,71668,031
108,293
125,306
126,661
110,507
139,912
179,859
171,237
284,211
174,947
221,800
282,000
0
50,000
100,000
150,000
200,000
250,000
300,000
1995 1996 1997 1998 1999 2000 2001 2002 2003 2004 2005 2006 2007 2008 2009 2010 2011
SA Motor vehicle Export Trends (units)
What do we expect in 2010/2011
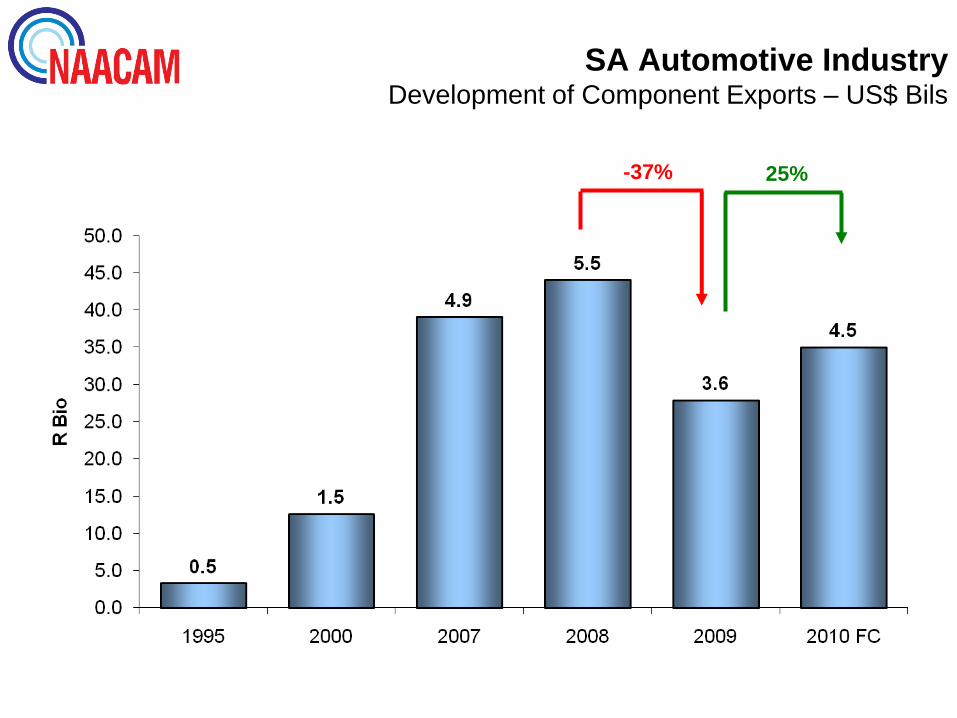
SA Automotive IndustryDevelopment of Component Exports – US$ Bils
-37% 25%
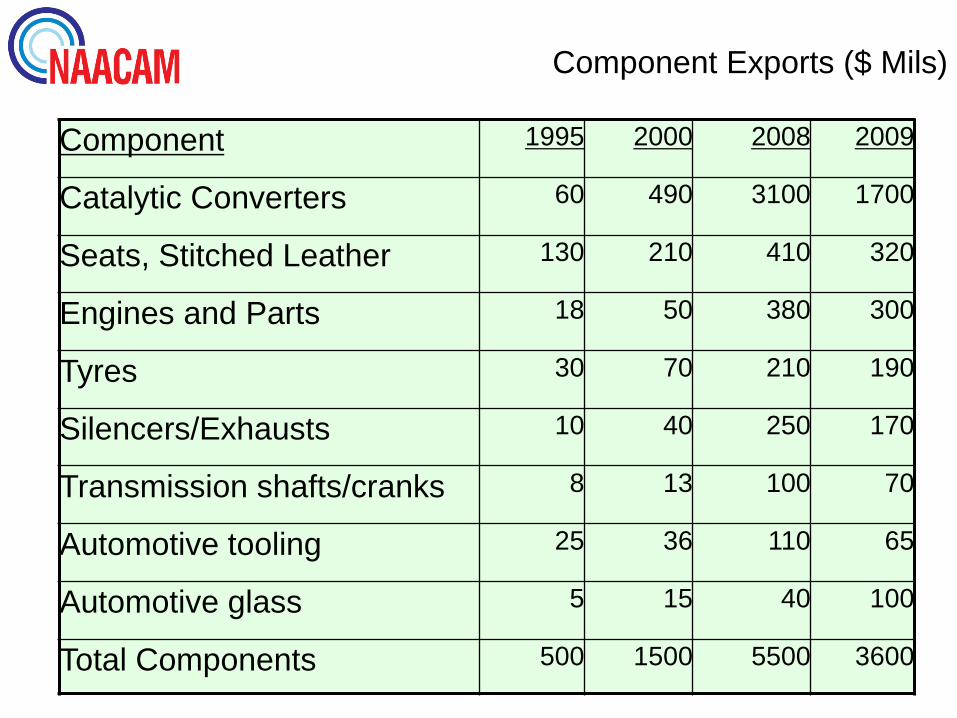
Component Exports ($ Mils)
Component 1995 2000 2008 2009
Catalytic Converters 60 490 3100 1700
Seats, Stitched Leather 130 210 410 320
Engines and Parts 18 50 380 300
Tyres 30 70 210 190
Silencers/Exhausts 10 40 250 170
Transmission shafts/cranks 8 13 100 70
Automotive tooling 25 36 110 65
Automotive glass 5 15 40 100
Total Components 500 1500 5500 3600

How Important are the Auto Sector Exports to SA?
YEAR 1995 2000 2008
Total SA Exports(R bn)
102,1 210,4 655,8
Total Automotive Exports(R bn)
4,2 23,4 96,1
Total Gold Exports(R bn)
21,5 27,8 48,5
Automotive Exports as % of Total SA Exports
4,1% 11,1% 14,7%
Ratio of Automotive: Gold Exports
0,2:1 0,8:1 2,0:1

New Vehicle Manufacturing Industry
SA Capital Expenditure
Av 1996
-2000 2001 2002 2003 2004 2005 2006 2007 2008 2009 2010 FC
Prod. Facilities 1155 1800 2311 1989 1816 2805 5058 2459 2808 2216 4068
Land and Building 81 33 152 142 130 512 758 382 329 179 381
OEM Support Structure 129 245 262 194 274 259 399 254 153 74 176
Total 1366 2078 2726 2325 2220 3576 6215 3095 3290 2469 4625
Source: NAAMSA
US$ 850m

SA OEMs – Employment
Yearly Averages
Source: NAAMSA
Un
its
pe
r e
mp
loye
e An
nu
al H
ead
co
un
t

Snapshot of the Component Sector
• Over 150 Tier 1 suppliers and 300 Tier
2/3
• Employment peaked at 83,000 in 2008
• Turnover was over $10 billion
• Current levels are 20% below the peak,
but gradually recovering.

Motor Industry Development Programme (MIDP):
Objectives
Introduced 1995 - Key Objectives:
• To improve SA automotive industry’s international competitiveness
• To improve vehicle affordability in the domestic market
• To encourage growth in vehicle and component manufacturing, particularly through exports
• To stabilise employment levels in the industry
• To create a better industry foreign exchange balance
Industry Performance:1995-2009International competitiveness
• Significant improvement in quality and productivity.Progressive economies of scale with local platformsdown from 42 to 17
• Increase in number of vehicles produced peremployee from less than 10 vehicles per annum toaround 15 vehicles by 2006.
• Significant rationalization and economies of scaleproduction has reduced complexity for domesticcomponent suppliers and enhanced efficiencies
• Huge improvements in quality resulting from strictercontrols necessary for sophisticated export markets
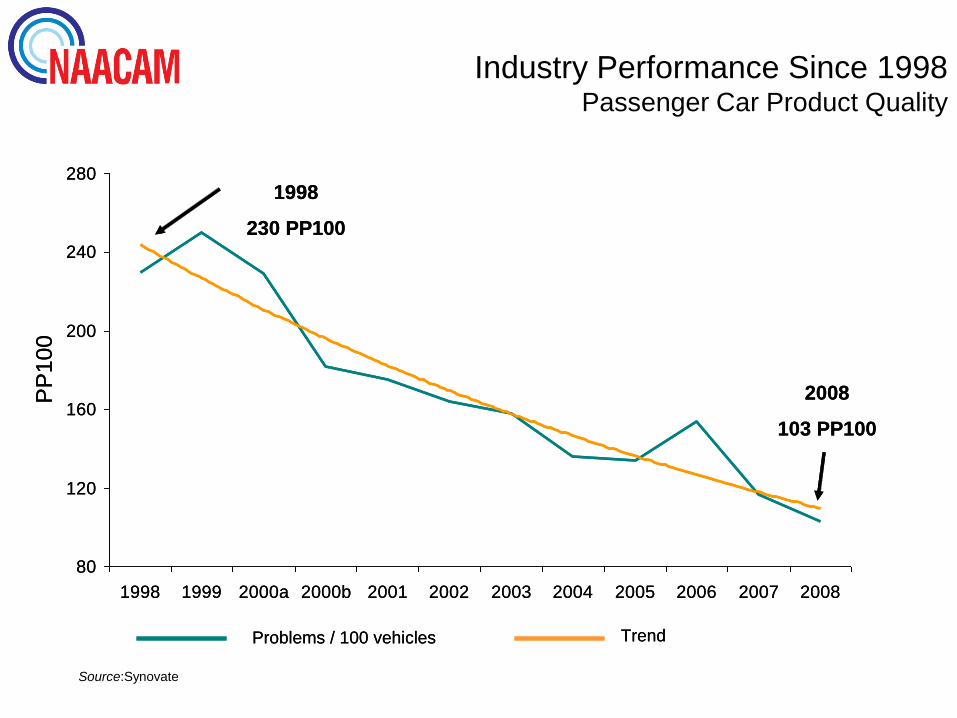
Industry Performance Since 1998Passenger Car Product Quality
Source:Synovate
Problems / 100 vehicles Trend
80
120
160
200
240
280
1998 1999 2000a 2000b 2001 2002 2003 2004 2005 2006 2007 2008
PP
10
0
1998
230 PP100
2008
103 PP100
Problems / 100 vehicles Trend
80
120
160
200
240
280
1998 1999 2000a 2000b 2001 2002 2003 2004 2005 2006 2007 2008
PP
10
0
1998
230 PP100
2008
103 PP100

Industry Performance:1995-2009Other key performance benchmarks
• Affordability – New vehicle prices below inflation for 11 out of 15 years. Above inflation increases in 2009 (13,8%). For 2010, projection is between 5% and 6%.
• Exceptional growth in industry exports through end 2008 and significant growth in domestic market through 2007
• Massive drop in local sales from mid 2006 to end 2009.
• Through 2008, relatively stable aggregate industry employment. Since 4th quarter, 2008 employment losses accelerated but have remained stable since mid 2009.
• Trade deficit has narrowed substantially during 2008. Slight increase experienced in 2009.
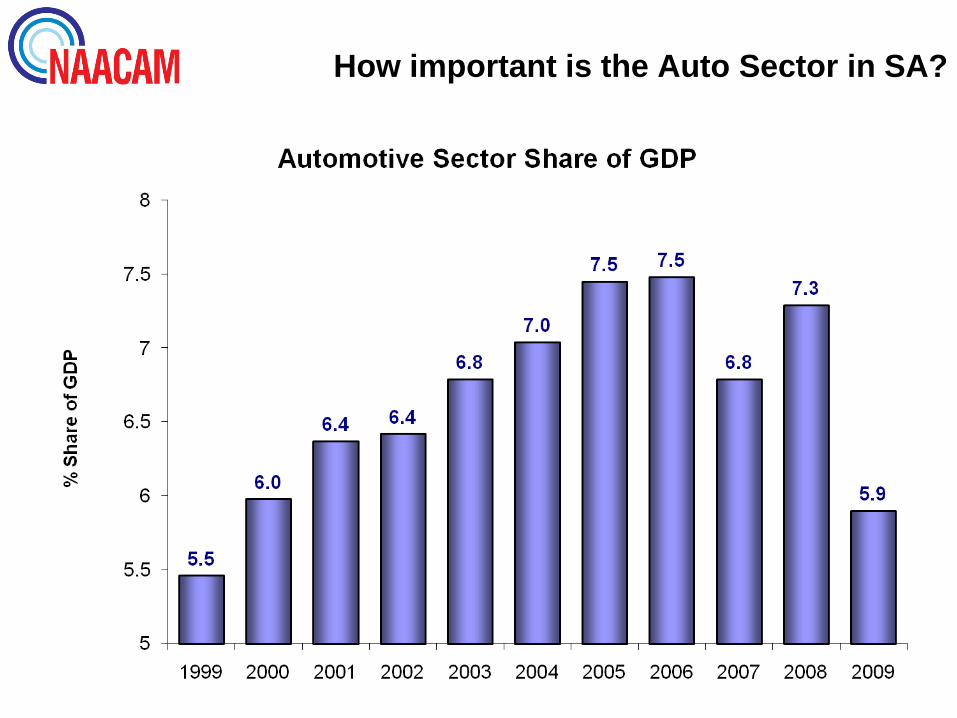
How important is the Auto Sector in SA?
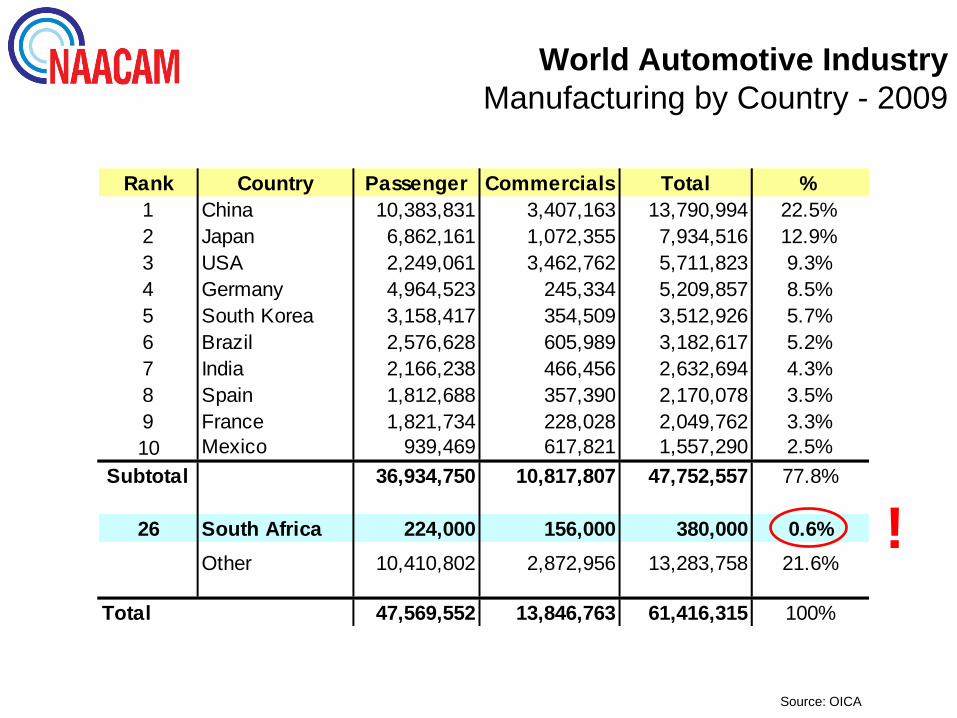
World Automotive Industry
Manufacturing by Country - 2009
Source: OICA
Rank Country Passenger Commercials Total %
1 China 10,383,831 3,407,163 13,790,994 22.5%
2 Japan 6,862,161 1,072,355 7,934,516 12.9%
3 USA 2,249,061 3,462,762 5,711,823 9.3%
4 Germany 4,964,523 245,334 5,209,857 8.5%
5 South Korea 3,158,417 354,509 3,512,926 5.7%
6 Brazil 2,576,628 605,989 3,182,617 5.2%
7 India 2,166,238 466,456 2,632,694 4.3%
8 Spain 1,812,688 357,390 2,170,078 3.5%
9 France 1,821,734 228,028 2,049,762 3.3%
10 Mexico 939,469 617,821 1,557,290 2.5%
Subtotal 36,934,750 10,817,807 47,752,557 77.8%
26 South Africa 224,000 156,000 380,000 0.6%
Other 10,410,802 2,872,956 13,283,758 21.6%
Total 47,569,552 13,846,763 61,416,315 100%
!

SA Automotive Industry
What are the Prospects for 2010 and 2011?
-25%+14%
+15% -38%
+26%
+16%
Passenger & LCV Market FBU Exports

Challenges for the South African
Automotive Industry
Source: NAAMSA

Negative Impact on Trade balance
Source: NAAMSA

Source : NAACAM
Car Imports - Share of market
40.00%
50.00%
60.00%
70.00%
80.00%
2005 2006 2007 2008 2009 2010
Car Imports % of market

Electrical / Electronic
Chassis and Drive-train
Body
Exterior
Interior
XX%: % of total component cost YY%: true local content as % of total component cost
19%
15%
33%
23%
10%
14%
•Axles
•Differentials
•Drive shafts
•Brakes
•Harnesses
•Starter motors
•Alternators
•Wiper
systems
•HVAC
•Glass
•Paint
•Bumpers
•Mirrors
•Cockpit
•Seats
•Door panels
•Carpets
•Bonnets
•Bootlids
•Sideframes
•Doors
6%
5%
3%
7%
Current Typical Local Content levels in SA
Automotive Industry far too low

Brazil102
W. Europe100Mexico
83
Russia113
Thailand92
E. Europe98
Cz. Rep98
India88
RSA110
China85
Supplier cost index in 2010 vs. Western Europe at 100
Local Content Competitiveness
Malaysia94
NB: Consensus of OEMs

0
20
40
60
80
100
Average productivity (Moves/hr)
Source : AIDC Port Benchmarking Study
• SA’s ports are far behind global standards
• Low productivity exacerbates OEM cost penalties
Benchmarking of Port Productivity
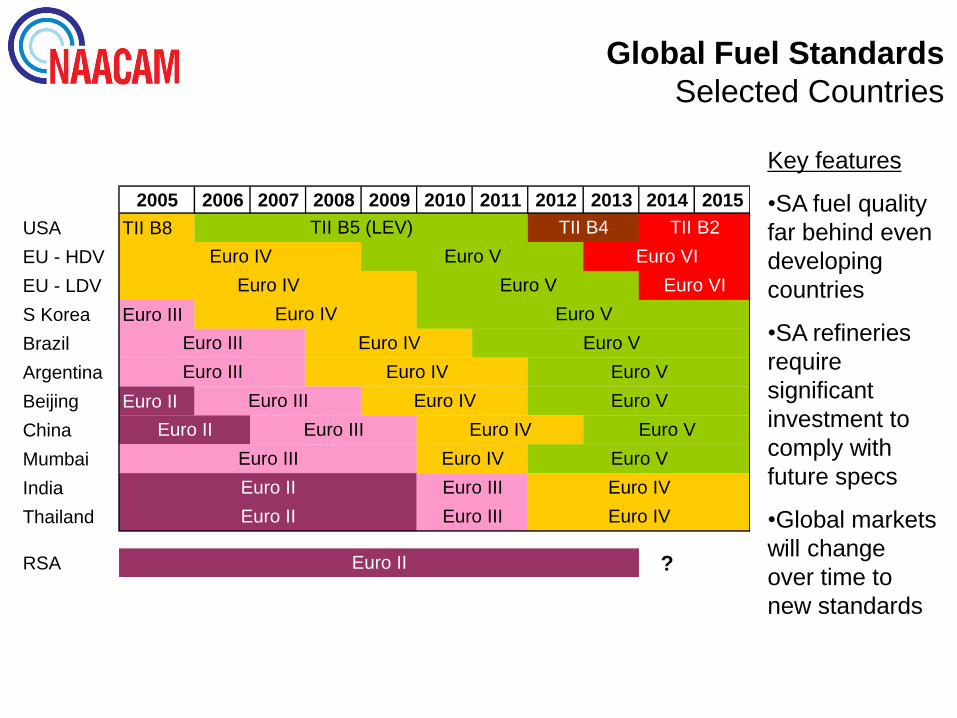
Global Fuel Standards
Selected Countries
2005 2006 2007 2008 2009 2010 2011 2012 2013 2014 2015
USA TII B8
EU - HDV
EU - LDV
S Korea Euro III
Brazil
Argentina
Beijing Euro II
China
Mumbai
India
Thailand
RSA ?
Euro II
Euro II
Euro II
Euro II
Euro V
Euro V
Euro V
Euro V
Euro V Euro VI
Euro V
Euro V
Euro IV
Euro IV
Euro IV
Euro III
Euro III
Euro IV
Euro IV
Euro III
Euro III
Euro III
Euro III
Euro III
Euro IV
Euro IV
Euro IV
Euro IV
Euro IV
TII B5 (LEV) TII B4 TII B2
Euro V Euro VI
Key features
•SA fuel quality
far behind even
developing
countries
•SA refineries
require
significant
investment to
comply with
future specs
•Global markets
will change
over time to
new standards

What are the “Silver Bullets” for the SA Auto Manufacturing Industry?
• Average produced volumes per platform p.a. need to increase to >50
000 p.a. (Ideally 75 000 to 100 000 units p.a.)
• Local Content levels need to increase from <40% to >70%.
• Supplier Competitiveness has to improve to Index 100 to W. Europe as
a minimum within next 2/3 years.
• A major “Industrialisation Strategy” is required in the supplier industry.
The supply chain needs to increase manufacturing depth (2nd and 3rd
Tier suppliers).
• Productivity to improve dramatically from <20 cars to >30 cars per
employee per annum.
• Massive investment needed in Training and Skills development at all
levels - Operator
- Specialist / Engineer
- Leadership
SA Automotive Industry
Background and Objectives of the 2013
Automotive Production and Development Program
(APDP)
• Production increase to 1.2 million vehicles per
annum by 2020 with associated deepening of the
components industry.
• Provide appropriate levels of support for these
ambitious targets.
• Achieve better balance between domestic and export
sales to supply growing domestic demand.
• Ensure consistency with WTO rules.
32
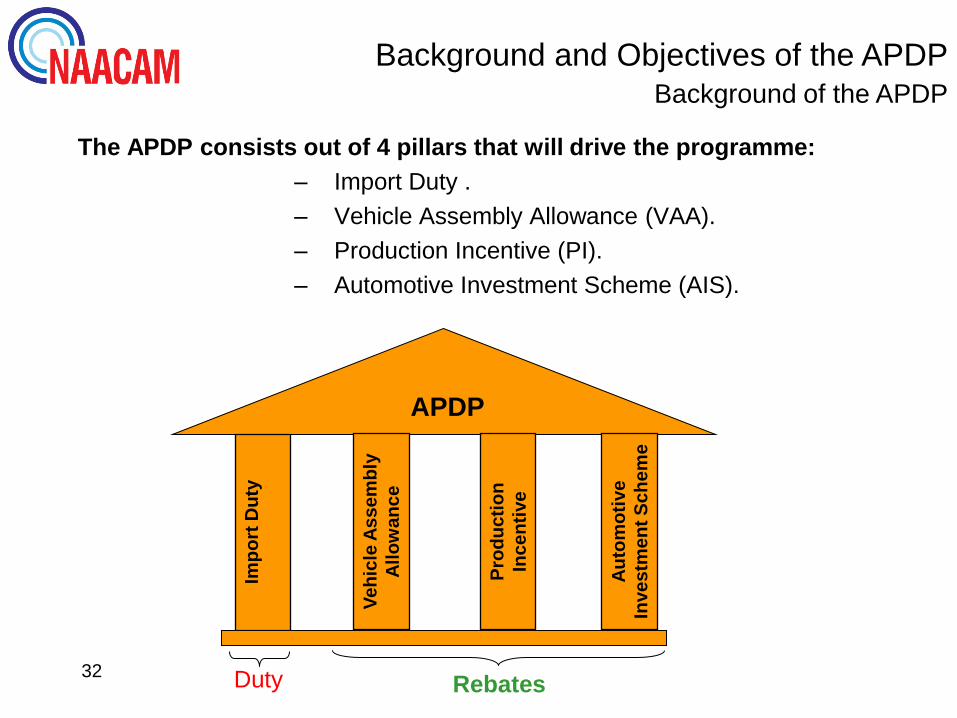
Background of the APDP
The APDP consists out of 4 pillars that will drive the programme:
– Import Duty .
– Vehicle Assembly Allowance (VAA).
– Production Incentive (PI).
– Automotive Investment Scheme (AIS).
APDP
Imp
ort
Du
ty
tax
ati
on
Ve
hic
le A
ss
em
bly
All
ow
an
ce
Pro
du
cti
on
Inc
en
tive
Au
tom
oti
ve
Inve
stm
en
t S
ch
em
e
Background and Objectives of the APDP
Duty Rebates

36%
25%25% 25%
29%
24%
18%18%18%
10%
15%
20%
25%
30%
35%
40%
'04 '05 '06 '07 '08 '09 '10 '11 '12 '13 '14 '15 '16 '17 '18 '19 '20
FBU Import Duty FBU Import Duty (EU Pref Rate)
20%
24%
20%20%
28%
10%
15%
20%
25%
30%
35%
40%
'04 '05 '06 '07 '08 '09 '10 '11 '12 '13 '14 '15 '16 '17 '18 '19 '20
CKD Import Duty Rate
The New APDP will have stable, moderate import tariffs from 2013:
• 25% for Completely Built Up Vehicles (CBUs).
• 18% for CBU’s out of Europe via the EU preferential rate.
• 20% for CKD components used by vehicle assemblers.
FBU Import Duty Rate CKD Import Duty Rate
Background and Objectives of the APDPImport Duty
MIDP APDP MIDP APDP
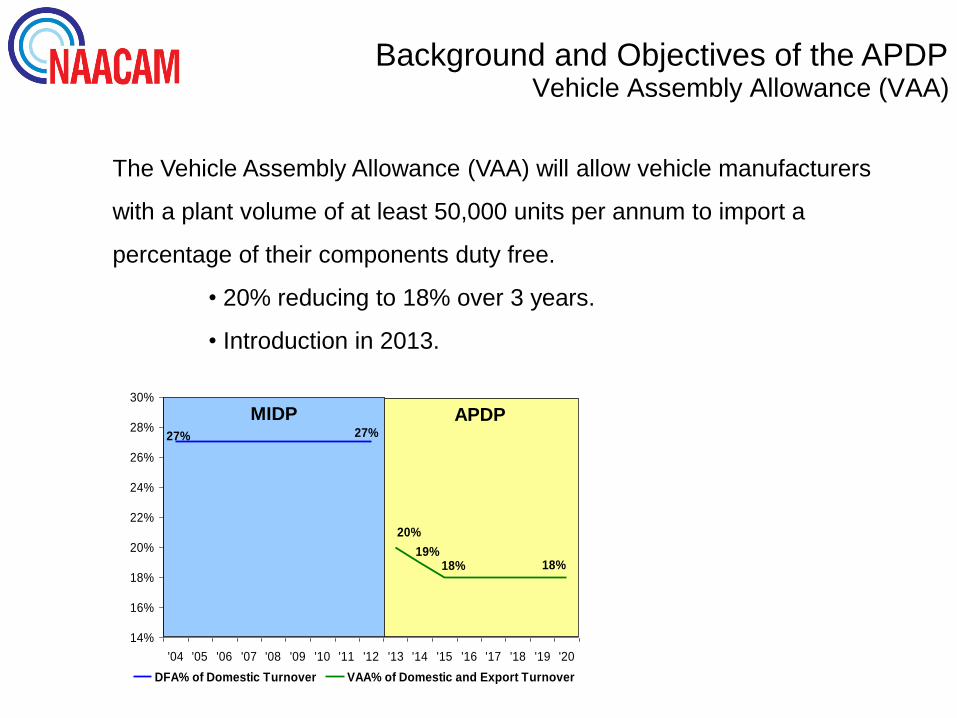
The Vehicle Assembly Allowance (VAA) will allow vehicle manufacturers
with a plant volume of at least 50,000 units per annum to import a
percentage of their components duty free.
• 20% reducing to 18% over 3 years.
• Introduction in 2013.
27% 27%
19%18%18%
20%
14%
16%
18%
20%
22%
24%
26%
28%
30%
'04 '05 '06 '07 '08 '09 '10 '11 '12 '13 '14 '15 '16 '17 '18 '19 '20
DFA% of Domestic Turnover VAA% of Domestic and Export Turnover
Background and Objectives of the APDPVehicle Assembly Allowance (VAA)
MIDP APDP
35
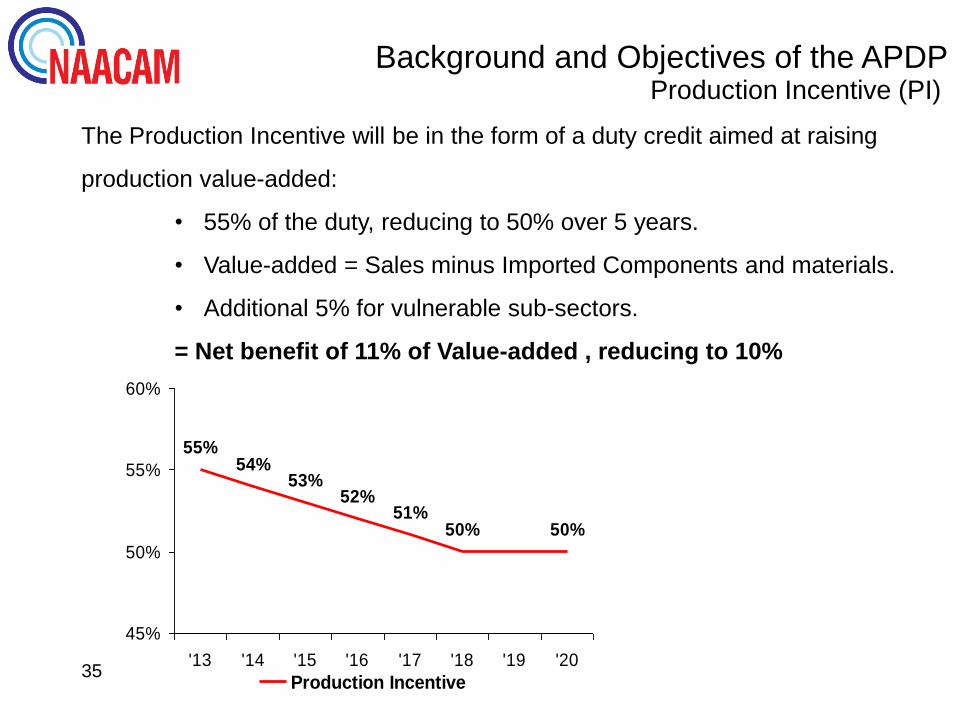
The Production Incentive will be in the form of a duty credit aimed at raising
production value-added:
• 55% of the duty, reducing to 50% over 5 years.
• Value-added = Sales minus Imported Components and materials.
• Additional 5% for vulnerable sub-sectors.
= Net benefit of 11% of Value-added , reducing to 10%
55%
52%
50%50%51%
54%53%
45%
50%
55%
60%
'13 '14 '15 '16 '17 '18 '19 '20
Production Incentive
Background and Objectives of the APDPProduction Incentive (PI)

Background and Objectives of the APDPAutomotive Investment Scheme (AIS)
The Automotive Investment Scheme will be in the form of a
Direct Cash Grant to support investments:
• 20% of a projects value paid over 3 years.
• 5% - 10% additional support providing certain requirements
are fulfilled, including additional local production, tooling
support, R and D.
• Introduction of the AIS was 1st July 2009. (Retroactive
Legislation)
Thank you!
Roger Pitot
Executive Director, NAACAM
www.naacam.co.za


