

The Synthesis of Nano TiO2 Particles
Using a DC Transferred Arc Plasma
Reactor
A Thesis by Xiaohong Liao, B.Sc.
Department of Chemical Engineering
McGill University
Under the Supervision of Prof. Richard.J. Munz
Submitted to the Faculty of Graduate Studies and Research of McGill University in partial
fulfillment of the requirements for the degree of Master in Chemical Engineering
©Xiaohong Liao, April 2011

TO MY MOTHER,
MY HUSBAND,
MY SON,
MY DAUGHTER
AND IN MEMORY OF MY FATHER
Xiaohong Liao, M.Eng. Thesis
i
ABSTRACT
The effect of quench conditions on the properties of titanium dioxide produced using a
transferred arc process was studied. Rutile phase TiO2 in the form of micron sized powder was
decomposed and vaporized in a continuous feed DC transferred arc system. The hot gas stream
exiting the reactor contained a mixture of the decomposition products of titania including
titanium suboxides (TiO, Ti2O3), argon (Ar), and oxygen (O2). Rapid quenching of this gas
stream with dry air resulted in the production of a titania aerosol. Collection of the product took
place in the filtration system. The quench conditions studied included pre-quench
temperature, 1T , quench rate, qR , residence time, , and operating power, torchP . The
characterization of particles includes phase identification, phase content calculation, size
distribution analysis, elemental composition analysis, and morphology examination.
The range of quench conditions studied were as follows, 1300< 1T <1700K,
8000< qR <18000K/s, 50< <80ms, 7.6< torchP <12.0kW. In general, high quench rate produced
small size and high surface area products. Residence time had no obvious effect on product size
and crystal phase formation. Low operating power produced a high anatase fraction product. In
all cases, spherical particles of a polymorphous mixture of anatase and rutile with no evidence of
sintering were produced. Particle size ranged from less than 10 to 300nm. A representative
sample has the mode of 22.3nm, median of 28.1nm and geometric standard deviation of 1.6nm.
ii
RÉSUMÉ
L'effet des conditions de trempe sur les propriétés du dioxyde de titane produit par un
procédé à arc transféré a été étudié. Des poudres de TiO2 de la phase rutile et de taille
micrométrique ont été alimentées en continu dans un arc à courant continu (CC), décomposées et
vaporisées. Le flux de gaz chauds sortant du réacteur contenait un mélange de produits de
décomposition : notamment de l'oxyde de titane (TiO), du Ti2O3, de l'argon (Ar) et de l'oxygène
(O2). Une trempe rapide de cet écoulement de gaz avec de l'air sec a abouti à la production d'un
aérosol d'oxyde de titane qui fût ensuite récupéré avec l'aide d'un système de filtration. Les
conditions opératoires étudiées comprenaient la température initiale avant la trempe, 1T , la
vitesse de trempe, qR , le temps de résidence, , et la puissance de l'arc,
torchP . La phase, la
teneur de la phase, la distribution de taille, la composition élémentaire ainsi que la morphologie
des poudres produites ont été obtenus.
La gamme de conditions de trempe étudiées était la suivante : 1300 < 1T <1700 K, 8000
<qR <18000 K/s, 50 < <80 ms, 7.6 < torchP <12.0 kW. En général, les taux de trempe élevés ont
généré des poudres de petite taille et surface spécifique élevée. Le temps de résidence n'a eu
aucun effet évident sur la taille des poucres ainsi que sur la formation de la phase cristalline. Une
faible puissance d'opération de la torche mène à la formation de poudres ayant une forte
proportion de la phase anatase. Dans tous les cas, des poudres sphériques constituées d'un
mélange polymorphe d'anatase et de rutile, sans apparence de frittage, ont été produites. La taille
charactéristique des poudres varie de 10 à 300 nm. Un échantillon représentatif a montré un
mode de 22.3 nm, une médiane de 28.1 nm et une écart type géométrique de 1.6 nm.
Xiaohong Liao, M.Eng. Thesis
iii
ACKNOWLEDGMENTS
First and foremost I want to thank my supervisor Prof. Richard Munz. It has been an
honor to be his last master student. I hope he will enjoy the retirement life as he enjoys helping
his students fulfill their potential as a successful scientist and professor for so many years. He
has taught me, both consciously and un-consciously, how good research is done. I very much
appreciate all his contributions of time, ideas and funding to make my M.Eng. experience
productive and stimulating. The joy and enthusiasm he has for his research was contagious and
motivational for me, even during tough times in the M.Eng. pursuit.
The members of the Munz group have contributed immensely to my personal and
professional time at McGill. I am especially grateful to visiting scholar Dr. J.-W. Wang for his
assistance of the experiments and for the preparation of TiO2 pellets by his research group in
China. I appreciate to M.Eng. R. Pristavita and Dr. F. Marion for their advice and helpful insight
on many of the problems encountered during this study. I would like thanks summer student F.
Imami who worked with us.
I would like to acknowledge McGill technicians Dr. X.-D. Liu, M. Riendeau, H.
Campbell, L. Mongeon for the trainings on TEM, XRD, SEM and SEM-EDS analysis,
respectively; and R. Roy, A. Golsztain for their help in the characterization of the titanium
dioxide powder.
I would like to thank the members of the Chemical Engineering non-academic staff, in
particular to L. Cusmich, F. Caporuscio, L. Miller-Aspin, E. Musqrave, J.A. Gadsby, and M.
Gorman.

iv
I also extend my thanks to N. Mendoza and Dr. S. Coulombe for helping me with the
French translation of the Abstract.
I want to thank the Natural Sciences and Engineering Research Council (NSERC) for
their contribution via the Collaborative Research and Development grant. For my scholarships, I
want to thank the Department of Chemical Engineering of McGill University for the Eugenie
Ulmer Lamother Award and Graduate school of McGill University for the McGill Provost's
Graduate Fellowship.
Xiaohong Liao, M.Eng. Thesis
v
TABLE OF CONTENTS
ABSTRACT ..................................................................................................................................... i
RÉSUMÉ ........................................................................................................................................ ii
ACKNOWLEDGMENTS ............................................................................................................. iii
TABLE OF CONTENTS ................................................................................................................ v
LIST OF FIGURES ...................................................................................................................... vii
LIST OF TABLES ......................................................................................................................... xi
NOMENCLATURE ..................................................................................................................... xii
Chapter 1 Introduction ............................................................................................................... 1
1.1 Properties of Nano Titania ................................................................................. 2
1.2 Titania Photo Catalytic Activity ........................................................................ 3
1.3 Objectives .......................................................................................................... 5
Chapter 2 Literature Review..................................................................................................... 7
2.1 Sol-Gel Process.................................................................................................. 7
2.2 Flame Hydrolysis Process ................................................................................. 9
2.3 Plasma Process ................................................................................................ 10
Chapter 3 Apparatus ................................................................................................................ 20
3.1 Plasma Reactor ................................................................................................ 20
3.2 Measurement Techniques and Instrumentation ............................................... 28
Chapter 4 Experimental Procedure .......................................................................................... 31
4.1 Material ............................................................................................................ 31
4.2 Preparation of Reactor ..................................................................................... 31
4.3 Experiments ..................................................................................................... 31
Chapter 5 Analytical Methods ................................................................................................. 33
5.1 Instrumental Analysis ...................................................................................... 33
5.2 Calculation of Operating Parameters ............................................................... 38
Chapter 6 Results and Discussion .......................................................................................... 43

vi
6.0 Summary of Experimental Conditions ............................................................ 43
6.1 General Observations and Discussion ............................................................. 45
6.2 Experimental Problems.................................................................................... 50
6.3 Product Characterization ................................................................................. 53
Chapter 7 Conclusions ............................................................................................................. 84
Chapter 8 Suggestions for Future Work .................................................................................. 86
REFERENCES ............................................................................................................................. 88
APPENDIX ................................................................................................................................... 95
Appendix A: XRD Phase Identification .................................................................................... 95
Appendix B: SEM-EDS Analysis ............................................................................................. 97
Appendix C: Temperature Profile of the Experiment ............................................................. 104
Appendix D: Experimental Procedure .................................................................................... 106
vii
LIST OF FIGURES
Figure 1: Crystalline structure of rutile and anatase (Gaffet, 2007). .............................................. 1
Figure 2: Comparison of fumed and precipitated TiO2 powder by TEM analysis (Bankmann, et
al., 1992) ......................................................................................................................................... 4
Figure 3: Schematic diagram for the synthesis of TiO2 powder by a sol-gel method .................... 8
Figure 4: The basic steps of particle formation and growth by gas-to particle conversion adapted
from (Pratsinis, 1998) ..................................................................................................................... 9
Figure 5: Classification of plasmas. .............................................................................................. 11
Figure 6: Transferred arc configuration (left) and non-transferred arc configuration (right) ....... 13
Figure 7: The experimental setups for transverse injection (a) and counter-flow injection (b) of
quench gases (Li, et al., 2007) ...................................................................................................... 16
Figure 8: Drawing of the basic reactor, where segmented torch is connected to the injection-
section, nozzle combination (Kakati, et al., 2007) ........................................................................ 17
Figure 9: Transferred arc plasma reactor configuration (Addona, 1993) ..................................... 21
Figure 10: Transferred arc plasma reactor cut view (Altenhoff, 2009) ........................................ 23
Figure 11: Torch assembly............................................................................................................ 24
Figure 12: Arc ignition and transfer arc system; the upper drawing is for ignition while the lower
is for transferred arc operation (Addona, 1993) ............................................................................ 25
Figure 13: Schematic drawing of the filter baghouse.. ................................................................. 26
Figure 14: Filter cartridge and retainer disc of Model 30 housing (Dow11). ............................... 27
Figure 15: Terminal assignment of I-7019R model (Use11). ....................................................... 29
Figure 16: TriStar 3000 surface area and porosimetry analyzer (Adapted from micromeritics
home page). ................................................................................................................................... 36
viii
Figure 17: The schematic outline of a TEM (Pri11). .................................................................... 38
Figure 18: Schematic drawing identifying the sites of pressure and temperature measurement in
the plasma rector system. .............................................................................................................. 39
Figure 19: Calibration curve for anatase and rutile ratio calculation. ........................................... 42
Figure 20: System operating power versus pre-quench temperature. ........................................... 48
Figure 21: Crucible and chamber after experiment xl-19. ............................................................ 49
Figure 22: Crucible and chamber after 5 min reaction without feeding. ...................................... 52
Figure 23: XRD spectra of products compared with P25. ............................................................ 55
Figure 24: Peak list of powder produced in run xl-19 with reference peak list of anatase and
rutile. ............................................................................................................................................. 56
Figure 25: Peak list of powder produced in run xl-17 with reference peak list of anatase, rutile
and graphite. .................................................................................................................................. 56
Figure 26: Average crystallite sizes calculated from XRD spectra with the error bars based on
standard deviation. ........................................................................................................................ 58
Figure 27: Crystallite size of the samples versus quench rate with geometric standard deviation.
....................................................................................................................................................... 60
Figure 28: Average particle size based on BET measurement with deviation (sum of
measurement error and geometric standard deviation). ................................................................ 62
Figure 29: TEM images used for particle size calculation (a)Mag. 122 000X (b)Mag. 162 000X.
....................................................................................................................................................... 63
Figure 30: Size distribution histogram of titania particle obtained from TEM with the lognormal
fitting and the corresponding cumulative distribution function. ................................................... 64
Figure 31: SEM images of representative runs (Mag. 50 000 X). ................................................ 66
Xiaohong Liao, M.Eng. Thesis
ix
Figure 32: SEM images of representative runs (Mag. 110 000 X). .............................................. 67
Figure 33: TEM image of xl-19 (Mag. 29 600X) and P25 (Mag. 41 000 X) ............................... 68
Figure 34: TEM image of sample xl-23 and xl-24 (Mag. 380 000X). .......................................... 69
Figure 35: SEM-EDS mapping of the sample xl-24 over the SEM electron image (site 1). ........ 72
Figure 36: SEM-EDS mapping of the sample xl-24 over the SEM electron image (site 2). ........ 73
Figure 37: SEM-EDS mapping of the sample xl-24 inside the red rectangle SEM electron image
(site 3). .......................................................................................................................................... 74
Figure 38: TEM-EDS elemental composition analysis of sample xl-23 of region A (top) and B
(bottom) in the upper TEM image. ............................................................................................... 77
Figure 39: Anatase fraction of the product versus residence time. ............................................... 80
Figure 40: Anatase fraction of the product versus quench rate of the system. ............................. 80
Figure 41: The anatase fraction of the produce versus operating power. ..................................... 81
Figure A-1: XRD line spectrum of run xl-23 shows the rutile and anatase crystalline phase with
the best matched reference code. .................................................................................................. 95
Figure A-2: XRD line spectrum of run xl-24 shows the rutile and anatase crystalline phase with
the best matched reference code. .................................................................................................. 95
Figure A-3: XRD line spectrum of Degussa P25 showing the crystalline phase of anatase and
rutile only. ..................................................................................................................................... 96
Figure A-4: XRD line spectrum of residue in the reactor showing compounds of TiO, Ti2O3 and
TiC ................................................................................................................................................ 96
x
Figure B-1: SEM-EDS mapping of raw TiO2 material over the whole SEM electron image
showed the trace amount of V, S and Zn present in the sample. .................................................. 97
Figure B-2: SEM-EDS mapping of the refractory material showed the resource of Si and P
contamination. ............................................................................................................................... 98
Figure B-3: SEM-EDS mapping of the Teflon coated filter bag woven glass fiber showed
contamination resource of Si and Ca. ........................................................................................... 99
Figure B-4: SEM-EDS mapping of inline filter cartridge material showed the contamination
resource of Si, K, Na, Al and Ca. ................................................................................................ 100
Figure B-5: SEM-EDS line scan of the sampel xl-24. The scan line crossed a glass fiber
contaminant.The spectrum after 100μm showed the content of glass fiber and the particles on the
surface of the glass fiber. Carbon is originated from the adhesive carbon tape. ........................ 101
Figure B-6: SEM-EDS mapping of xl-19 inside the marked areas where the nano powder present,
respectively. (The minor contaminants like K, Na, and Al are mainly from inline cartridge filter
material. ...................................................................................................................................... 103
Figure C-1: Temperature profile of xl-24 shows that the pseudo-steady state achieved from 40 to
55 min. ........................................................................................................................................ 104
Figure C-2: Temperature profile of xl-23 shows that the pseudo-steady state achieved from 48 to
65 min. ........................................................................................................................................ 104
Figure C-3: Temperature profile of xl-19 shows that the pseudo-steady-state achieved from 42 to
55min. ......................................................................................................................................... 105
Xiaohong Liao, M.Eng. Thesis
xi
LIST OF TABLES
Table 1: Properties of P25 and DT51 ............................................................................................. 4
Table 2: Summary of successful experiments .............................................................................. 44
Table 3: The summary of experiment results ............................................................................... 54
Table 4: Size distribution calculated from XRD spectra .............................................................. 60
Table 5: Comparison of diameter calculated from TEM and XRD particle size analysis ............ 65
Table 6: Comparison of pre-quench, quench temperature with the anatase fraction.................... 83

xii
NOMENCLATURE
Abbreviations
BET Brunauer, Emmett, and Teller technique
CVD Chemical Vapor Deposition
DAS Data Acquisition System
DC Direct Current
EDS Energy Dispersive X-ray Spectroscopy
FE-SEM Field Emission Scanning Electron Microscope
FWHM Full Width at Half Maximum
ICP Inductively Coupled Plasma
I.D. Inside Diameter
lpm Litres Per Minute
O.D. Outside Diameter
RF Radio Frequency
SEM Scanning Electron Microscope
slpm Standard Litres Per Minute (20 ºC, 101.3kPa)
TEM Transmission Electron Microscope

Xiaohong Liao, M. Eng. Thesis
xiii
XRD X-ray Diffraction
Roman Letters
A Surface area (m2)
DA Average particle diameter (surface based diameter) from BET surface area measurement
(nm)
Dv Average particle diameter(volume base diameter) from XRD spectrum measurement (nm)
fa Fraction of TiO2 anatase
fr Fraction of TiO2 anatase
I Current (A)
Ia XRD spectra intensity of anatase signal (counts)
Ir XRD spectra intensity of rutile signal (counts)
lq Length of quench region (cm)
n Total molar flow rate (mole/m)
P Pressure (psi)
Ρtorch Power of the torch(kW)
Q Volumetric flow rate (slpm)
Qair Volumetric flow rate of quench air (slpm, at 1 atm, 298K,)

xiv
Qf Volumetric argon flow rate of feeder (slpm, at 1 atm, 298K,)
Qpq Volumetric argon flow rate before quench (slpm)
Qt Volumetric argon flow rate of torch (slpm, at 1 atm, 298K)
Qv0 Volumetric gas flow rate (slpm, at 1 atm, 298K)
Qvi Volumetric gas flow rate at ith
thermocouple location along the quench pipe (slpm)
Qw Volumetric argon flow rate of observation window (slpm, at 1 atm, 298K)
R Gas constant (8.314 J·K-1
mol-1
)
Rq Quench rate (K/s)
r Pearson‟s correlation coefficient
r* Critical radius (m)
t Time (s)
T Temperature (ºC)
Tm Melting temperature (ºC)
T1 Pre-quench temperature (ºC)
T2 Quench temperature (ºC)
T3 Growth zone point 3 temperature (ºC)
T4 Growth zone point 4 temperature (ºC)
Xiaohong Liao, M. Eng. Thesis
xv
T5 Temperature of the gas entering the filter bag (ºC)
V Voltage (V)
v Velocity of gas flow (m/s)
Greek letters
ΔG* Free energy formation of critical radius(J)
ΔHs Enthalpy of sublimation(KJ·mol-1
).
ΔT Change of temperature (K)
θ The diffraction angle (˚)
ρ Density (g/cm3)
ρa Density of TiO2 anatase (g/cm3)
ρp True density of TiO2 mixture particle (g/cm3)
ρr Density of TiO2 rutile (g/cm3)
σ Surface tension(N/m)
τ Residence time (ms)

xvi
This page is intentionally left blank.
Xiaohong Liao, M. Eng. Thesis
1
Chapter 1 Introduction
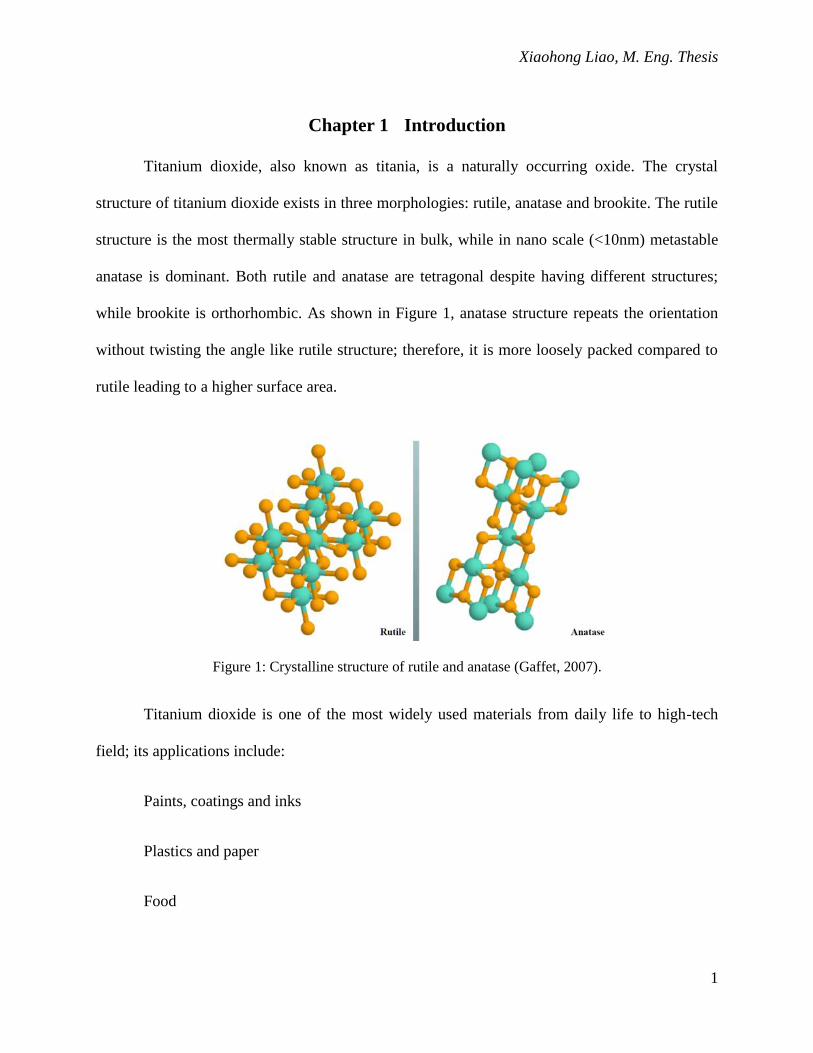
Titanium dioxide, also known as titania, is a naturally occurring oxide. The crystal
structure of titanium dioxide exists in three morphologies: rutile, anatase and brookite. The rutile
structure is the most thermally stable structure in bulk, while in nano scale (<10nm) metastable
anatase is dominant. Both rutile and anatase are tetragonal despite having different structures;
while brookite is orthorhombic. As shown in Figure 1, anatase structure repeats the orientation
without twisting the angle like rutile structure; therefore, it is more loosely packed compared to
rutile leading to a higher surface area.
Figure 1: Crystalline structure of rutile and anatase (Gaffet, 2007).
Titanium dioxide is one of the most widely used materials from daily life to high-tech
field; its applications include:
Paints, coatings and inks
Plastics and paper
Food
Chapter 1 Introduction
2
Medicine
Cosmetics
Construction
Semi-conductor materials
Energy production
Waste water remediation
The most noteworthy application of the titanium dioxide rutile structure is as the white
pigment in a micron sized powder form. Due to its high refractive index, it provides the
whiteness and opacity. Since 1916, commercial production of titanium dioxide pigments has
been pioneered by KRONOS Worldwide, Inc. and its predecessors using the sulfate method. The
company developed the chloride process to reduce the environmental impact of the sulfate
process and the first chloride process plant was commissioned in 1970‟s. Nowadays, two thirds
of pigments are produced by the chloride process.
1.1 Properties of Nano Titania
With the development of nanotechnology, nano-scale titanium dioxide attracts great
attention in the photochemical field and the photoelectrical field. Titania, either as a catalyst
support or catalyst itself, has been extensively studied in recent years, (Anopo, 2004) (Arabatzis,
2003) (Gao, et al., 1999) (Herrmann, et al., 1997) (Chun, et al., 2009) (Jung, et al., 2005)
(Bankmann, et al., 1992). Titania thin film coating on outdoor building materials such as glass,
tile and stone has drawn a great deal of attention; and now these products are commercially
available and referred to as self-cleaning products. The self-cleaning effect originated from the
Xiaohong Liao, M. Eng. Thesis
3
nano effect properties. Nanoscale titania can decompose organic contamination by the oxidation
process under ultraviolet irradiation; and due to its hydrophilic behavior, it can sheet water to
wash off any debris and dust. Furthermore, nano titania reflects the harmful UV light by about
98%, which means these self-cleaning products can also act as a UV filter providing necessary
protection from UV hazards. Thus, it is extensively applied to various products like lamps, anti-
fogging mirrors, tents, car windows and car bodies etc. Efforts have been made to shift the
photocatalytic activity of nano titania under visible light irradiation for indoor applications. By
doping with atoms like nitrogen and transition metal ions, this goal can be achieved effectively
(Asahi, et al., 2001). In recent years, titania has been considered for the production of renewable
energy. Nanocrystalline titania was found to be one of the valuable media to convert sunlight
into electrical energy in the development of solar cells (Ito, et al., 2006).
1.2 Titania Photo Catalytic Activity
Another environmentally important application of nano titania is to use nanocrystalline
titanium dioxide to treat waste water by suspending the nanopowder in waste water and exposing
it to sunshine. Research showed that anatase titanium dioxide has significantly higher efficiency
than the rutile form in terms of decomposition rate of organic compounds due to the higher
surface to volume ratio and larger conducting band gap.
To our knowledge, two types of nano sized titania, which have surface area greater than
50 m2/g, are commercially available. Degussa‟s P25 TiO2 is fumed titania through the flame
hydrolysis of TiCl4 (Kloepfer, 1953) and Rhône-Poulenc‟s DT51 TiO2 is precipitated titania
produced by the sulfate route. The properties of these two types are listed in Table 1 (Bankmann,
et al., 1992). As shown in the table, the purity of Degussa‟s P25 is greater than 95% and 32% of particles
are in the range of 2nm to 30nm. The surface area is about 55 m2/g in crystalline phase of about 20-30 %
Chapter 1 Introduction
4
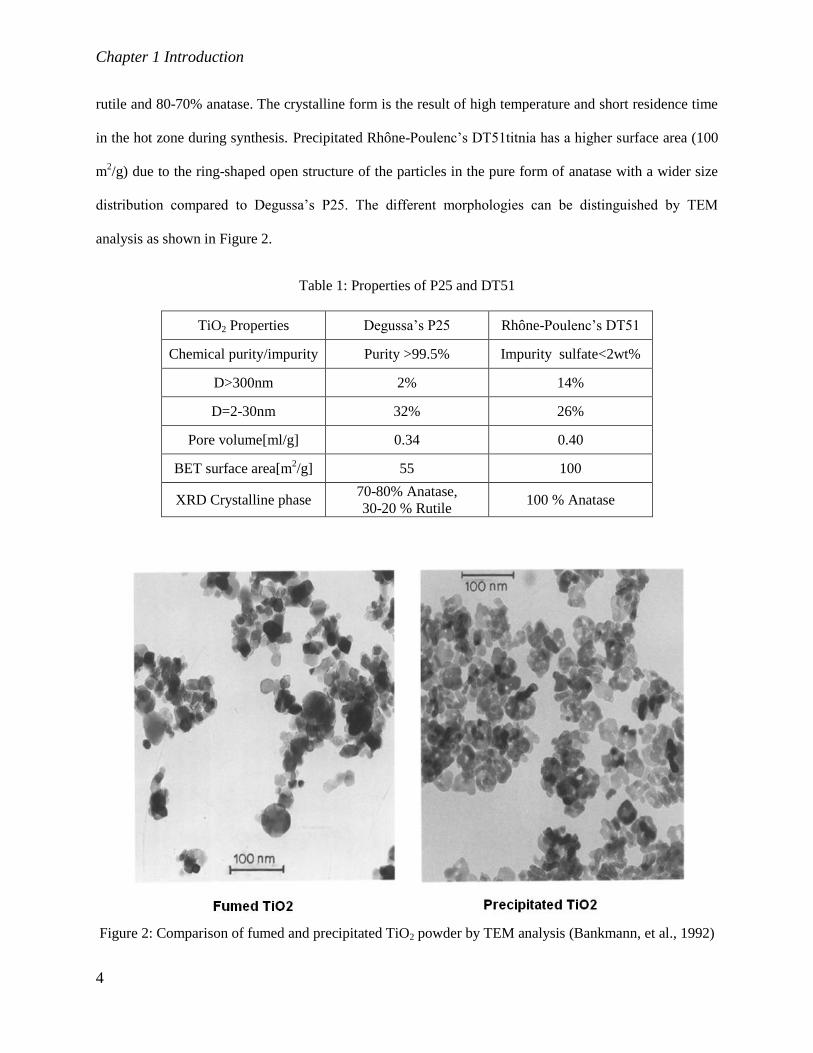
rutile and 80-70% anatase. The crystalline form is the result of high temperature and short residence time
in the hot zone during synthesis. Precipitated Rhône-Poulenc‟s DT51titnia has a higher surface area (100
m2/g) due to the ring-shaped open structure of the particles in the pure form of anatase with a wider size
distribution compared to Degussa‟s P25. The different morphologies can be distinguished by TEM
analysis as shown in Figure 2.
Table 1: Properties of P25 and DT51
TiO2 Properties Degussa‟s P25 Rhône-Poulenc‟s DT51
Chemical purity/impurity Purity >99.5% Impurity sulfate<2wt%
D>300nm 2% 14%
D=2-30nm 32% 26%
Pore volume[ml/g] 0.34 0.40
BET surface area[m2/g] 55 100
XRD Crystalline phase 70-80% Anatase,
30-20 % Rutile 100 % Anatase
Figure 2: Comparison of fumed and precipitated TiO2 powder by TEM analysis (Bankmann, et al., 1992)
Xiaohong Liao, M. Eng. Thesis
5
To decompose the organic waste effectively, the uniform suspension of a photo catalyst is
preferred to provide the maximum contact surfaces, which speeds up the chemical reactions.
However, titania tends to aggregate in water; as a result, the surface area is reduced and the
efficiency of photo catalytic activity will be lost or reduced significantly. A simple way to solve
this problem is to coat the titania with a thin layer of silica (Mchida, et al., 1999) (Yang, et al.,
2009). It is simple and economical, however, difficult to recycle the suspended catalysts. Liao et
al. tried to use nanometer-sized Fe3O4 as the support to make a hybrid titania catalyst that has
good magnetic properties for recovery; the experimental results showed a great improvement of
recycling efficiency (Liao, et al., 2004).
1.3 Objectives
This research project is a continuation of Altenhoff‟s work (Altenhoff, 2009) under the
supervision of Prof. Munz (McGill University Plasma group). He demonstrated the technical
feasibility of making nano TiO2 using transferred arc plasma technology in a batch mode..
However, he was not able to study the effect of the operating parameters to the product
properties.
In the present work, the primary goal is to demonstrate the feasibility to synthesize nano
titania continuously using DC transferred arc plasma reactor and to optimize the reaction
parameters, like operating voltage, current, feeding rate, quench rate, and quench temperature, to
maximize content of anatase phase nano titania under steady state while minimize the
contaminations.
The second goal is to produce SiO2 coated nano titania as the photocatalyst by
introducing the SiCl4 vapor in the quench gas. The influence of operating parameters, such as
Chapter 1 Introduction
6
quench temperature and quench rate of SiCl4, to the resulting TiO2/SiO2 composition will be
focused under the optimized condition obtained from the production of pure anatase titania in the
first experiments. However, due to the Si contamination present in the produce, addition of SiCl4
is not necessary.
The third goal is to characterize the powder produced and their properties. The
morphology of products will be analyzed using scanning electron microscopy (SEM) and
transmission electron microscopy (TEM); the phase formation and composition will be analyzed
using X-ray diffraction (XRD); the surface area will be analyzed by specific area measurements
(BET); and the elemental composition will be analyzed by energy dispersive X-ray spectroscopy
(EDS or EDX). Correlation of the effect of operating conditions with product properties and
comparison of the results with the properties of AEROXIDE TiO2 P25, a commercial product of
Degussa, should be completed.
Xiaohong Liao, M. Eng. Thesis
7
Chapter 2 Literature Review
This section gives a brief review of the various synthesis methods of nano titania powder.
Synthesis includes gas phase and liquid phase methods. The liquid phase method is dominated
by the gel-sol method. Gas phase methods include flame hydrolysis process and plasma
processes. The flame hydrolysis process is a widely used and efficient method that belongs to
chemical vapor deposition (CVD) process. The plasma approach includes CVD and simple
physical evaporation corresponding to liquid/gas precursor and solid phase precursor,
respectively. However, since plasma has higher energy than flame, it can offer two extreme
reaction conditions for evaporation and super-cooling, which leads to ultrafine particles.
2.1 Sol-Gel Process
More attention was paid to the solution–based synthesis of nano particles in the last
decade, since it can produce a smaller size, a narrower size distribution and about twice the
surface area of the flame hydrolysis method. As mentioned before, the surface area is almost two
times larger than the flame method because the product from this process has an open ring
structure. It normally starts from titanium containing organic compounds and passes through a
series of reactions to produce an amorphous or low crystalline intermediate; then through careful
heat treatments the intermediate is converted to the desired crystalline nano powder. The main
drawback is that the heating process will cause a significant coagulation of initially extremely
fine particles. Furthermore, the wet chemical process is not suitable for large scale production in
the sense of requiring expensive treatments of the waste and having potential environmental
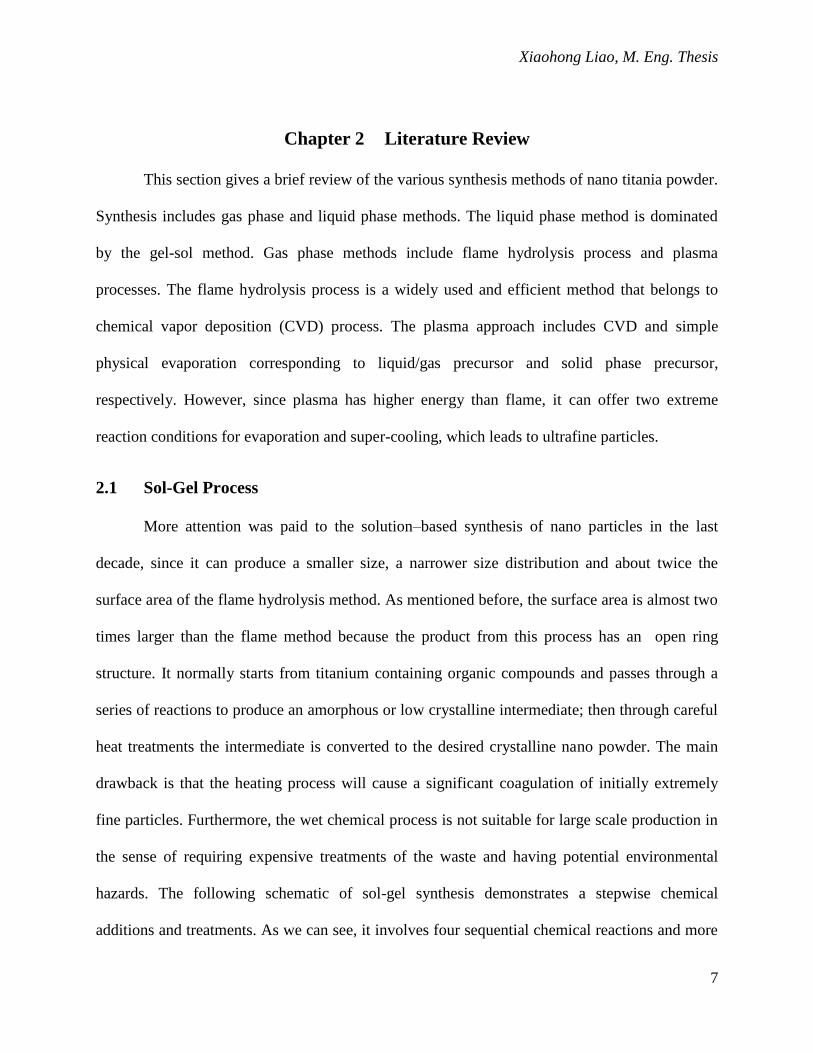
hazards. The following schematic of sol-gel synthesis demonstrates a stepwise chemical
additions and treatments. As we can see, it involves four sequential chemical reactions and more
Chapter 2 Literature Review
8
than two days to get the final product. Every single step will introduce potential contamination
resulting in poor yield or poor purity of product. In industry, more steps also mean more labor
costs and less daily output. Another drawback of the gel-sol method is the starting material.
Since it is an organic complex, other issues, like safety, environment compact, and cost, will be
considered.
Figure 3: Schematic diagram for the synthesis of TiO2 powder by a sol-gel method
(Pookmanee, et al., 2009).

Xiaohong Liao, M. Eng. Thesis
9
2.2 Flame Hydrolysis Process
The main process used industrially to produce fumed titania is the flame hydrolysis
process, also known as the Aerosil® process. The overall reaction in the process is,
)(2)()()( 2224 gClgTiOgOgTiCl (1)
Figure 4: The basic steps of particle formation and growth by gas-to particle conversion adapted from
(Pratsinis, 1998)
The method was first employed by Degussa in 1942. The precursor is introduced into
hydrogen-oxygen diffusion flame forming molecular or cluster compounds in the gas phase.

Chapter 2 Literature Review
10
Shown in Figure 4 are the particle formation mechanisms in the flame hydrolysis method. As the
aerosol stream leaves the hot temperature zone and cools down, particles are formed through
homogeneous nucleation from supersaturated vapor. On the way to the collection zone, particles
continuously grow through condensation, surface reactions, and coagulation and aggregation
mechanisms. Post-processing like the calcination stage is performed before product collection
due to chlorine gas absorption by titania. Finally, particles are collected in a baghouse filter,
electrostatic precipitator or cyclone separator. Serious operational problems can exist during
transport: for example, the particles can be removed from the process stream by diffusion and
thermophoresis to the reactor walls, (Pratsinis, 1998). The flame synthesis normally results in
micron sized particles, thus careful controls and post treatments are required to get nano particles.
That makes it not practical in industry.
2.3 Plasma Process
2.3.1 Introduction of Plasma
Plasma, also called the forth state of matter, represents greater than 99% of the mass of
the universe. The term plasma was first defined by Langmuir. He wrote “Except near the
electrodes, where there are sheaths containing very few electrons, the ionized gas contains ions
and electrons in about equal numbers so that the resultant space charge is very small. We shall
use the name plasma to describe this region containing balanced charges of ions and electrons
(Langmuir, 1928).” The definition accurately stated the electrical quasi-neutrality of plasma;
furthermore, because of these free charged particles, a plasma gas is distinguished from an
ordinary gas in term of its high electrical conductivity. Furthermore, the high energy content of
the plasma makes it an ideal source for processing.

Xiaohong Liao, M. Eng. Thesis
11
Processing plasma can be either thermal or non-thermal in terms of the electron
temperature. When the temperature of heavy atoms is equal to the temperature of electrons, in
other words, they are in the kinetic equilibrium state; we call this type of plasma thermal plasma.
Thermal plasma technology is widely used in the fields like: plasma deposition, plasma synthesis
of fine powders, plasma decomposition, plasma metallurgy, plasma densification and plasma
welding and cutting, where high temperature is desired. In contrast, plasmas with strong
deviations from kinetic equilibrium are called non-thermal plasma. For instance, in non-thermal
plasma, the temperature of electrons can be greater than 1eV (11 600K), while the temperature of
heavy atoms remains in the room temperature range. This property has a great advantage for the
treatment of temperature sensitive materials where only the high temperature of electrons is
desired to process chemical reactions. Therefore, it is widely used in the field like surface
cleaning or sterilization, surface modification by ion implantation and diffusion, thin–film
deposition by evaporative condensation and sputtering, plasma chemical vapor deposition and
plasma etching.
Figure 5: Classification of plasmas.
Chapter 2 Literature Review
12
In thermal plasma, the DC plasma and RF plasma are classified by the different torch
types. In DC plasma, torch designs can further classified to transferred arc and non-transferred
arc types according to the usage of electrodes. The position of the transferred arc reactor
employed in this project in the classification of plasma device is shown in Figure 5.
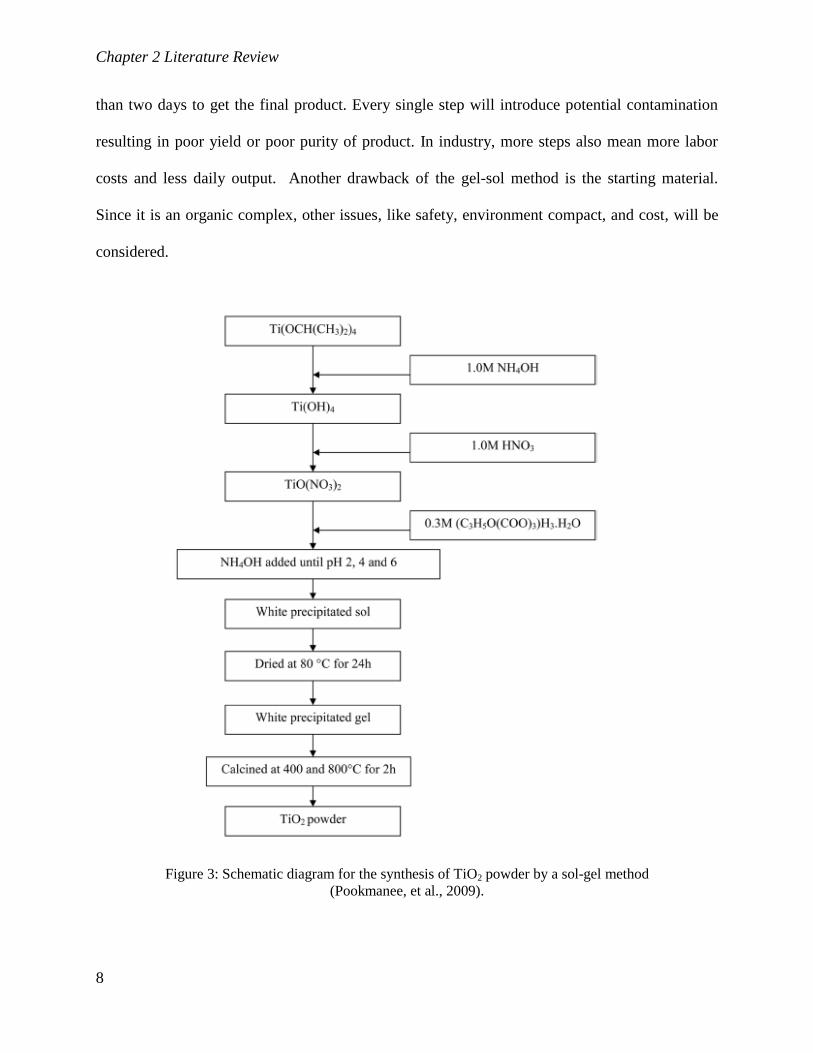
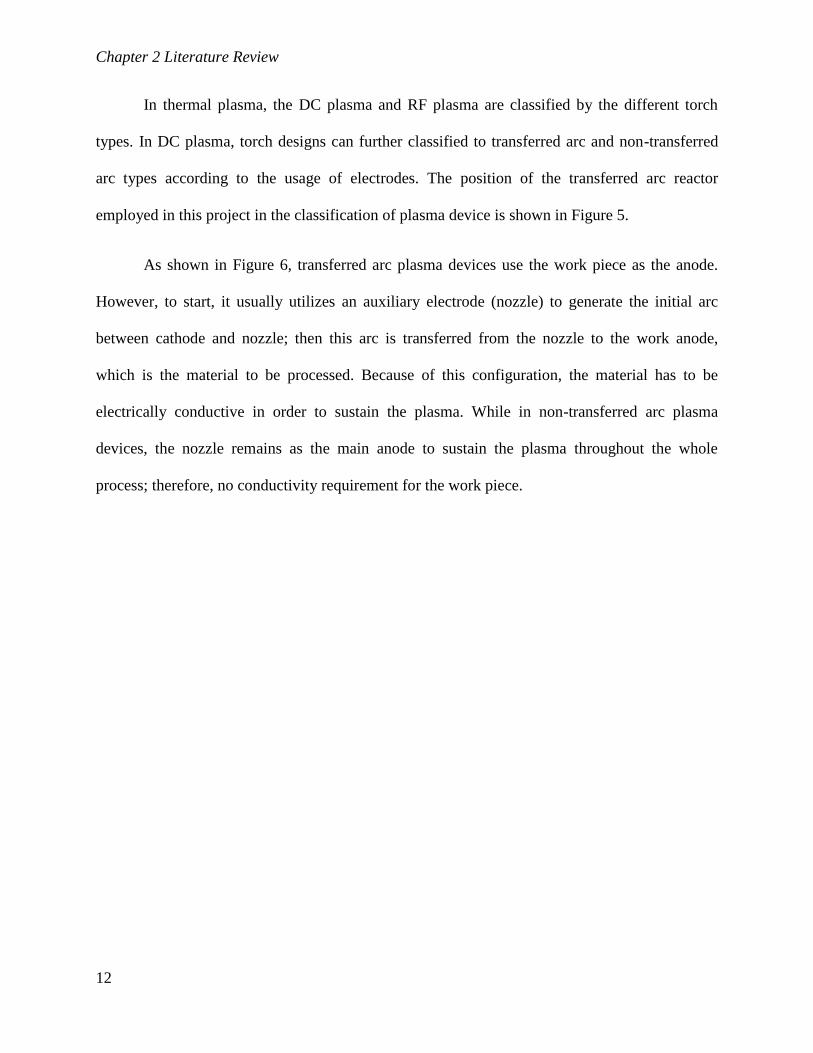
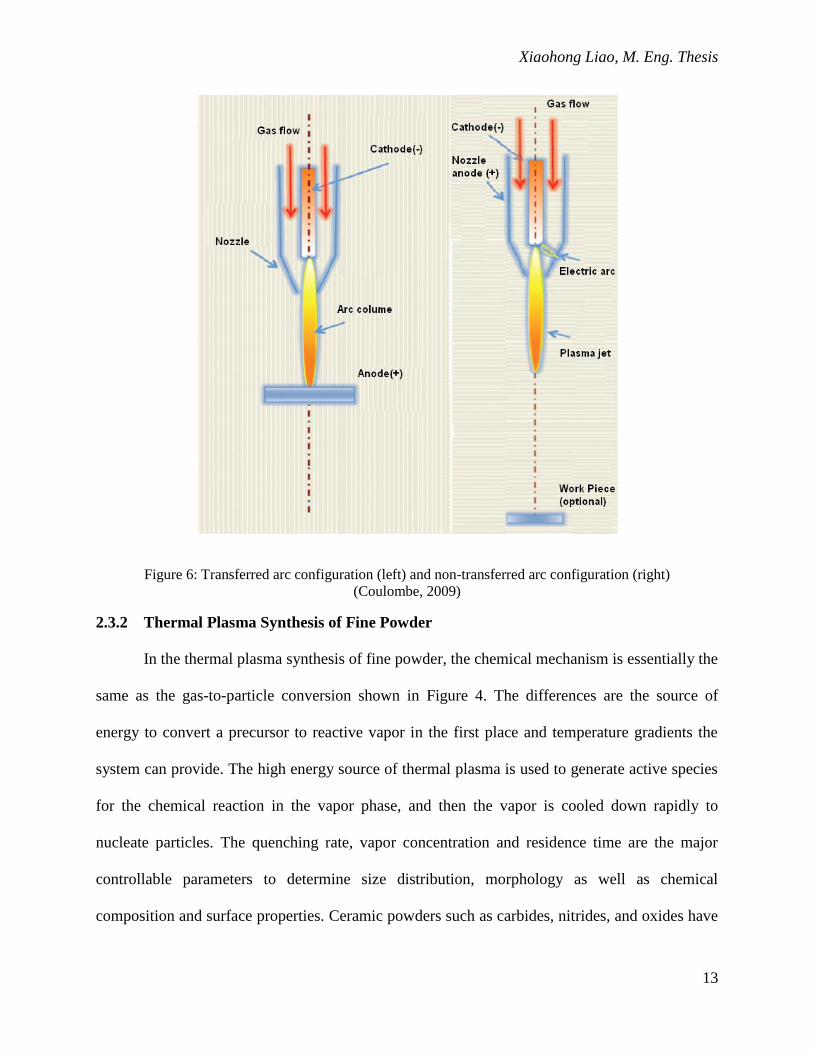
As shown in Figure 6, transferred arc plasma devices use the work piece as the anode.
However, to start, it usually utilizes an auxiliary electrode (nozzle) to generate the initial arc
between cathode and nozzle; then this arc is transferred from the nozzle to the work anode,
which is the material to be processed. Because of this configuration, the material has to be
electrically conductive in order to sustain the plasma. While in non-transferred arc plasma
devices, the nozzle remains as the main anode to sustain the plasma throughout the whole
process; therefore, no conductivity requirement for the work piece.
Xiaohong Liao, M. Eng. Thesis
13
Figure 6: Transferred arc configuration (left) and non-transferred arc configuration (right)
(Coulombe, 2009)
2.3.2 Thermal Plasma Synthesis of Fine Powder
In the thermal plasma synthesis of fine powder, the chemical mechanism is essentially the
same as the gas-to-particle conversion shown in Figure 4. The differences are the source of
energy to convert a precursor to reactive vapor in the first place and temperature gradients the
system can provide. The high energy source of thermal plasma is used to generate active species
for the chemical reaction in the vapor phase, and then the vapor is cooled down rapidly to
nucleate particles. The quenching rate, vapor concentration and residence time are the major
controllable parameters to determine size distribution, morphology as well as chemical
composition and surface properties. Ceramic powders such as carbides, nitrides, and oxides have
Chapter 2 Literature Review
14
been successively synthesized in thermal plasma reactors. Research in thermal plasma synthesis
of fine powder has concentrated on designing novel reactors and processes to enhance the
powder quality. These novel designs include the RF-DC hybrid reactor, the reactive submerged
arc (RSA), multiple plasma jets, and counter flow liquid-injection plasma reactors, (Pfender,
1999).
The great advantages of thermal plasma are its very high temperatures and steep
temperature gradients, which provide the huge driving force for particle condensation
(homogeneous nucleation) resulting in very fine particles due to the degree of supersaturation of
the vapor species. Compared with the liquid method, the plasma method produces nano powders
by one-step process and without post-processing.
The challenge of synthesis of nano particle like titania using plasma relies on a few
controllable parameters, for instance, quenching rate, quenching gas injection, quenching gas,
residence time, non-equilibrium electron population etc. The plasma temperature gradient is a
function of the plasma gas, plasma flame stability, pressure inside the reactor, as well as the
design of the torch. In some plasma devices, the particle formation starts at the tail of the plasma
flame. Thus, synthesis of nano-particles using thermal plasma is really limited by the chemical
and physical properties of precursors and products themselves.
Again, the chemical mechanism of plasma synthesis of nano titania is very similar to
flame hydrolysis method, but with more efficient vaporization and ionization process in the
plasma flame than in a combustion flame. The residence times of precursor and temperatures of
plasma flame are roughly two to three times greater than those found in the hottest combustion
flames (acetylene/nitrous oxide ) leading to total atomization and ionization (Skoog, et al., 1998).
Xiaohong Liao, M. Eng. Thesis
15
These active species in the vapor phase at high temperatures leads to high reaction rates even in
the case of very endothermic processes. The gas exiting the flame is then quenched rapidly.
Because of the large drop in temperature, the vaporous product becomes supersaturated and
nucleates out of the vapor phase homogeneously. This causes the formation of very fine particles
in one step with the desired crystalline structure while in the Gel-sol method as shown in Figure
3, the initial product of titania is suspended in the solution. Through drying, the solution is
converted into gel. Following the calcination at the proper temperature, the nano anatase powder
is obtained. However, during the calcination, the initial fine powder inevitably aggregates.
Furthermore, the initial formation of titania crystalline is rutile; it is impossible to directly use for
photo catalysis without calcination.
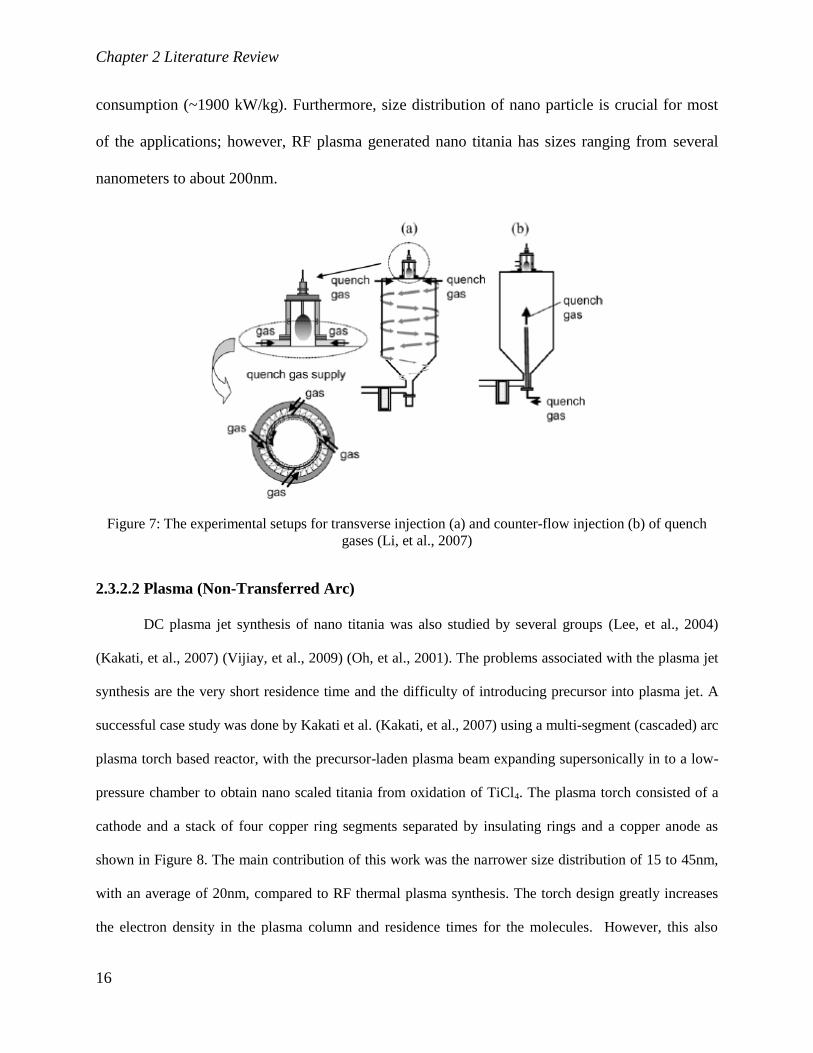
2.3.2.1 RF Induction Plasma
Ishigaki, et al. investigated RF plasma synthesizes TiO2 from liquid precursors or solid
starting materials, (Li, et al., 2006) (Li, et al., 2007) (Oh, et al., 2005) (Ishigaki, et al., 2007) (Li,
et al., 2004). They demonstrated the feasibility of synthesizing nano titania from inorganic TiN,
TiC and TiCl4, organic mixtures of titanium butoxide and diethanolamine solution. Experimental
results showed that the direction of quench gas and the type of quench gas had effects in
controlling the particle size. Transverse argon gas injection (Figure 7) of 100 l/min produced a
d50 value of ~52nm; while, with the same injection, Ar counter-flow produced a significantly
finer powder d50 value of ~34nm. Experimental setups for these two injections are shown in
Figure 7. Helium possesses a higher thermal conductivity than argon in the temperature range
1500-3000K, where the nucleation and particle growth occur; it can enhance the rapid quenching
to obtain smaller particles. Nevertheless, their studies were not practical in term of relatively
expensive powder materials or complicated preparation of liquid precursors and the high power
Chapter 2 Literature Review
16
consumption (~1900 kW/kg). Furthermore, size distribution of nano particle is crucial for most
of the applications; however, RF plasma generated nano titania has sizes ranging from several
nanometers to about 200nm.
Figure 7: The experimental setups for transverse injection (a) and counter-flow injection (b) of quench
gases (Li, et al., 2007)
2.3.2.2 Plasma (Non-Transferred Arc)
DC plasma jet synthesis of nano titania was also studied by several groups (Lee, et al., 2004)
(Kakati, et al., 2007) (Vijiay, et al., 2009) (Oh, et al., 2001). The problems associated with the plasma jet
synthesis are the very short residence time and the difficulty of introducing precursor into plasma jet. A
successful case study was done by Kakati et al. (Kakati, et al., 2007) using a multi-segment (cascaded) arc
plasma torch based reactor, with the precursor-laden plasma beam expanding supersonically in to a low-
pressure chamber to obtain nano scaled titania from oxidation of TiCl4. The plasma torch consisted of a
cathode and a stack of four copper ring segments separated by insulating rings and a copper anode as
shown in Figure 8. The main contribution of this work was the narrower size distribution of 15 to 45nm,
with an average of 20nm, compared to RF thermal plasma synthesis. The torch design greatly increases
the electron density in the plasma column and residence times for the molecules. However, this also

Xiaohong Liao, M. Eng. Thesis
17
means the corrosion of torch will be extremely high. Other limitations of this study are the complex
reactor set-up and operating procedures. It requires a carefully controlled vacuum chamber, high speed
pumps, and desired shock patterns at different stages of reaction.
Figure 8: Drawing of the basic reactor, where segmented torch is connected to the injection-section,
nozzle combination (Kakati, et al., 2007)
2.3.2.3 DC Plasma (Transferred Arc)
Transferred arc DC plasma reactor design by Munz et al. of McGill University was
Chapter 2 Literature Review
18
extensively used for synthesis of nano particles like fumed silica and aluminum nitride; and the
quality of those products were comparable to commercial grades.
The synthesis process includes three major steps: the evaporation step, the quenching step,
and the sample collection step. The design of this device enables completely separated regions
for evaporation and quenching (see section 3.1 for details), which provides the possibility of
controlling the chemical reactions or particle formations by adjusting the quench rates, vapor
concentrations, or by changing quench gases or vapors. The operation of this reactor is simple
and economical. The gas flow can be very small compared to the RF plasma device or plasma jet
device. The reactor is operated under the atmospheric pressure; therefore, no expensive vacuum
pump and no strict sealing are required. Furthermore the reactor can be easily scaled up by
increasing the current for large quantity production. The transferred arc plasma reactor has other
advantages in common with all other transferred arc devices. For example, the high temperature
of the arc root (>10 000K) can evaporate the starting material without any problem, since the arc
strikes directly on the materials. Secondly, the energy efficiency for transferred arc system can
be extremely high. In theory, the energy losses can be limited under 5 percent at the cathode only;
other energy losses within the anode will evaporate the work material (Munz, et al., 1999). With
the proper insulation, the convective heat losses to the reactor wall can be limited to a negligible
level. However, efficiency is not the only concern. Material limitations for building up the
devices are the major drawback for all the thermal plasma devices. Electrode erosion is a serious
problem leading to the contamination of product, short life time of electrodes, sheathing gas
restriction etc. In the transferred arc plasma reactor, the anode is the processing material, thus
anode contamination and corrosion can be eliminated in the continuous synthesis system at the
steady state, when evaporation rate and feeding rate are equal. At such conditions, arc always
Xiaohong Liao, M. Eng. Thesis
19
strikes only on the surface of the molten material. The surface material evaporates rapidly, which
is desirable, the loss is balanced by the feed, and the graphite crucible under the molten material
remains intact. The transferred arc configuration relies on the material‟s electrical conductivity at
the process condition, since work piece itself will be one of work electrodes. A potential problem
in working with most metal oxides is that they are electrical insulators at low temperatures and
thus a special method is needed to start the system. Turner, et al. (2000) have patented an
ignition method to solve this problem. Once the titania is molten at high temperature it has a
good conductivity. Previous experiments done by Altenhoff (2009) using the transferred arc
plasma reactor showed the feasibility of using the transferred arc plasma to produce nano
titanium from micrometer scaled titania. This micron sized pigment grade rutile titanium powder
is cheap and safe to handle. It is also clean to the environment without hazardous by-products to
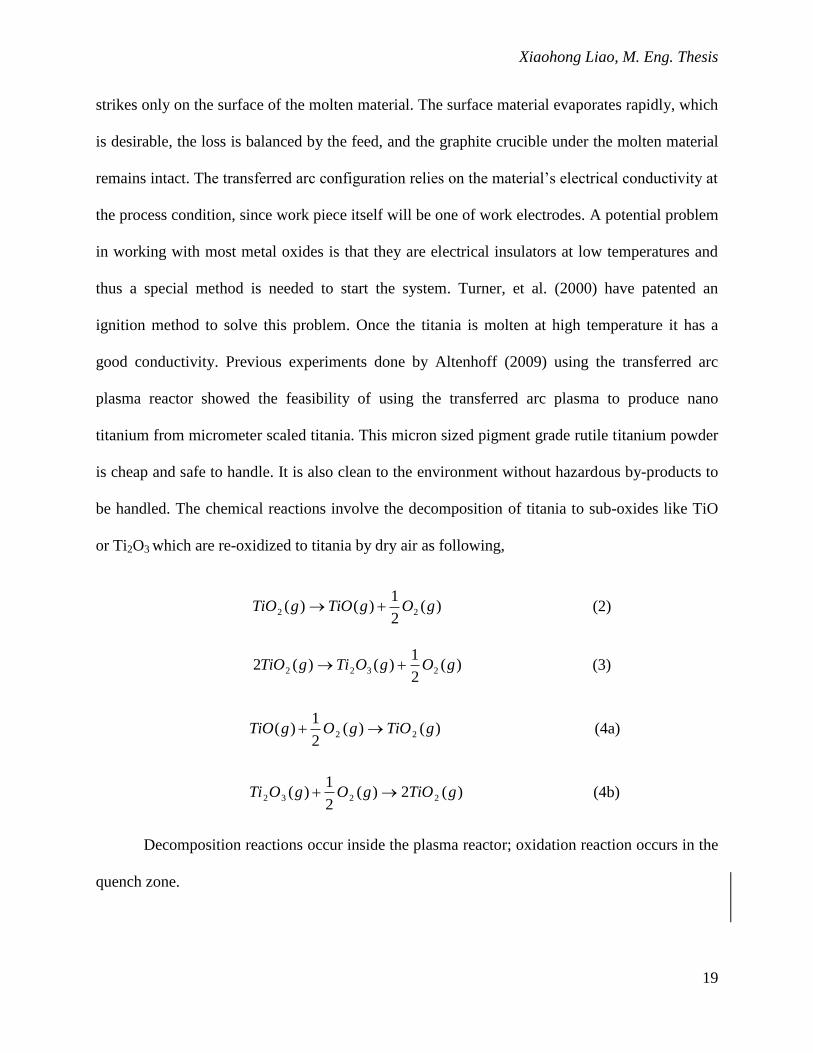
be handled. The chemical reactions involve the decomposition of titania to sub-oxides like TiO
or Ti2O3 which are re-oxidized to titania by dry air as following,
)(2
1)()( 22 gOgTiOgTiO (2)
)(2
1)()(2 2322 gOgOTigTiO (3)
)()(2
1)( 22 gTiOgOgTiO (4a)
)(2)(2
1)( 2232 gTiOgOgOTi (4b)
Decomposition reactions occur inside the plasma reactor; oxidation reaction occurs in the
quench zone.

Chapter 3 Apparatus
20
Chapter 3 Apparatus
3.1 Plasma Reactor
The transferred arc plasma reactor used in this project is the same as the one Addona used
for his Master‟s degree; the detailed design can be found in his thesis (Addona, 1993). The whole
system configuration with power supply is shown in Figure 9. The main components consisted of
the following:
1. Power supply and control console
2. Arc ignition and transfer system
3. Plasma gas flow instrumentation
4. Cooling water flow instrumentation
5. Transferred arc plasma torch
6. Reactor assembly
7. Feeding vibration chute
8. Quench manifold
9. Baghouse filter
10. Inline cartridge filter
11. Vacuum pump
12. Data collecting instrumentation
Xiaohong Liao, M. Eng. Thesis
21
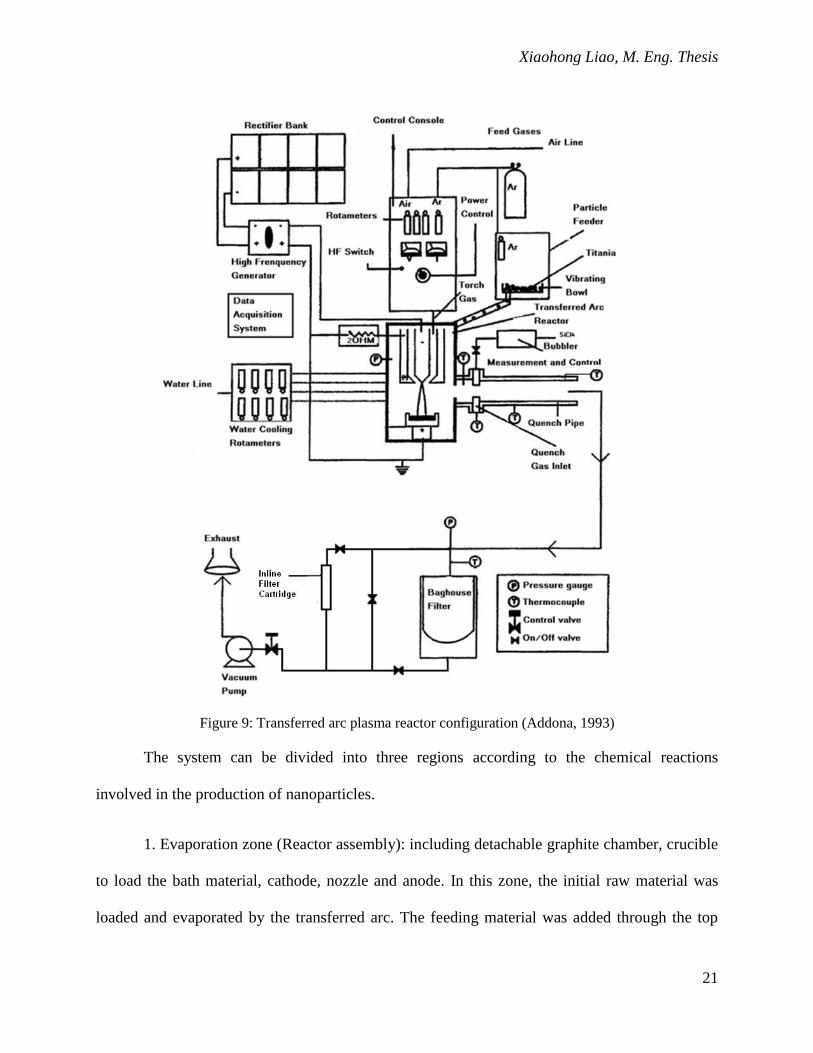
Figure 9: Transferred arc plasma reactor configuration (Addona, 1993)
The system can be divided into three regions according to the chemical reactions
involved in the production of nanoparticles.
1. Evaporation zone (Reactor assembly): including detachable graphite chamber, crucible
to load the bath material, cathode, nozzle and anode. In this zone, the initial raw material was
loaded and evaporated by the transferred arc. The feeding material was added through the top
Chapter 3 Apparatus
22
flange of the reactor. By gravity, the feeding pellets fall into the crucible to maintain the
consistent molten level.
2. Quench zone: including quench gas inlets, water cooling zone, air cooling zone and
thermo-couples at different sites along the quench zone to monitor temperature profiles of the
reaction. The hot gas stream left the reactor towards the quench zone, passing through the
radially injected cold quench gas, further cooled by the water and air cooled tube wall in
sequence. Thermocouples were located at different tube sites to monitor the temperature profile
of process.
3. Sample collection zone: including air inlet for further cooling to the temperature that is
safe to the filter, by-pass path of baghouse filter for the undesired exhaust, baghouse to hold the
filter bag, inline filter cartridge, and vacuum pumps at the end of exhaust line to avoid building
up pressure in the system and back flow of air into plasma reactor chamber.
As the temperature of thermal plasma is high enough to melt the construction pieces,
water cooling is heavily employed for all the parts that are exposed to heat flux, for example,
reactor wall, starting section of quench tube, cathode, nozzle, anode and window.
Reactor Chamber Assembly
The complete reactor assembly is shown in Figure 10. The reactor wall is made of
stainless steel to give durability and electron magnetic interference shielding. Inside the wall,
silica cloth (UC100-28, Armil C.F.S. Inc.) and alumina layers (blanket type ASB-2600, Zircar
Fibrous Ceramics; blanket type RS-3000, Zircar Refractory Composites, Inc.) give both
electrical and heat insulation. Further inside the reactor chamber, graphite felt (grade GFA10,
SGL Carbon Corp.) and graphite chamber (grade HLM extrude, SGL Carbon Corp.) provide
Xiaohong Liao, M. Eng. Thesis
23
additional isolation to minimize the heat loss thus increase the energy efficiency.
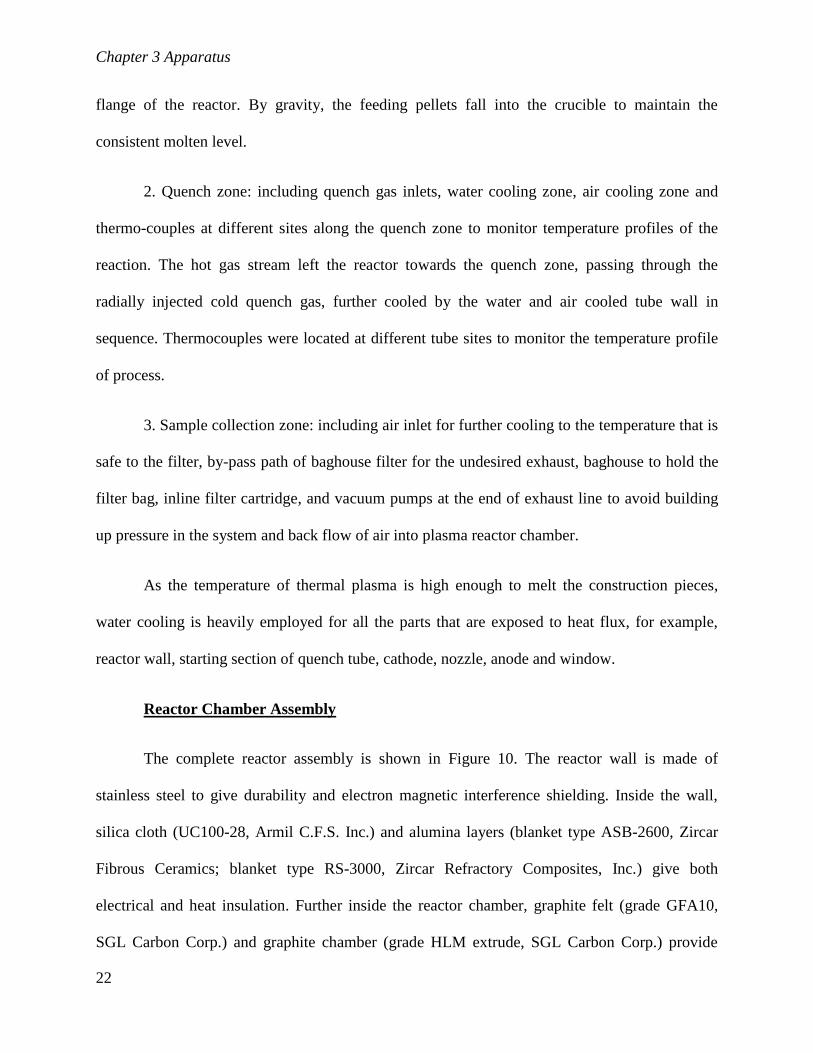
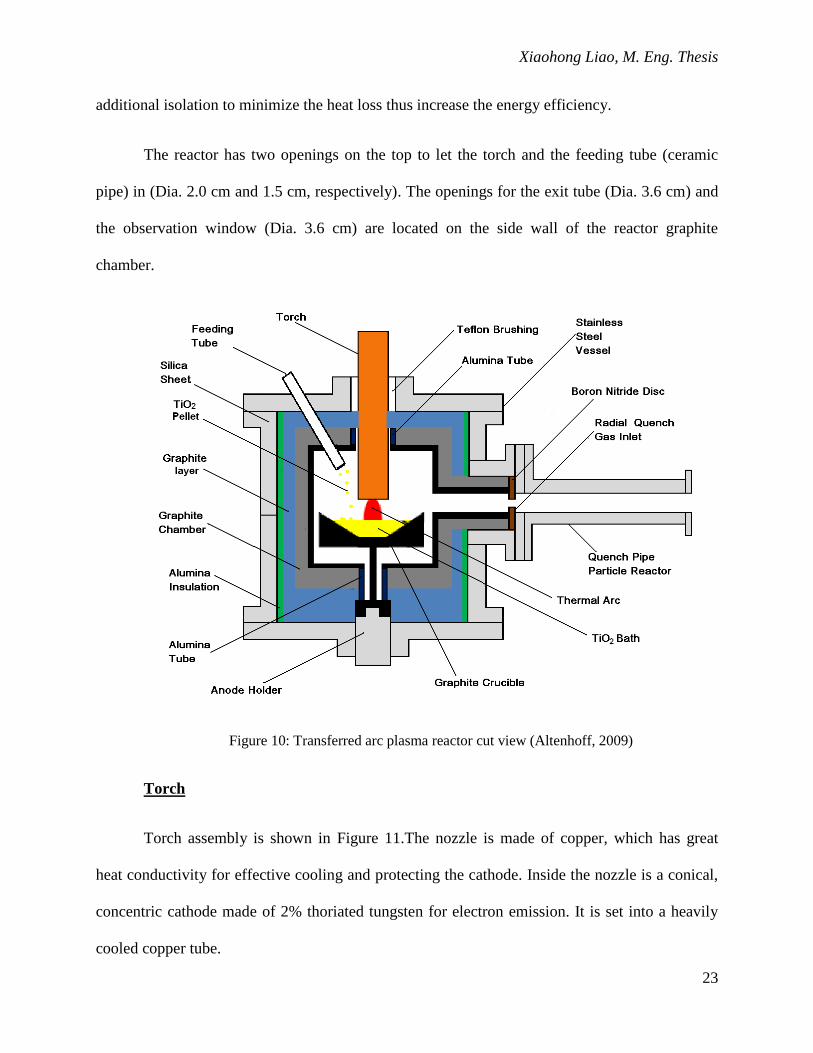
The reactor has two openings on the top to let the torch and the feeding tube (ceramic
pipe) in (Dia. 2.0 cm and 1.5 cm, respectively). The openings for the exit tube (Dia. 3.6 cm) and
the observation window (Dia. 3.6 cm) are located on the side wall of the reactor graphite
chamber.
Figure 10: Transferred arc plasma reactor cut view (Altenhoff, 2009)
Torch
Torch assembly is shown in Figure 11.The nozzle is made of copper, which has great
heat conductivity for effective cooling and protecting the cathode. Inside the nozzle is a conical,
concentric cathode made of 2% thoriated tungsten for electron emission. It is set into a heavily
cooled copper tube.

Chapter 3 Apparatus
24
Figure 11: Torch assembly
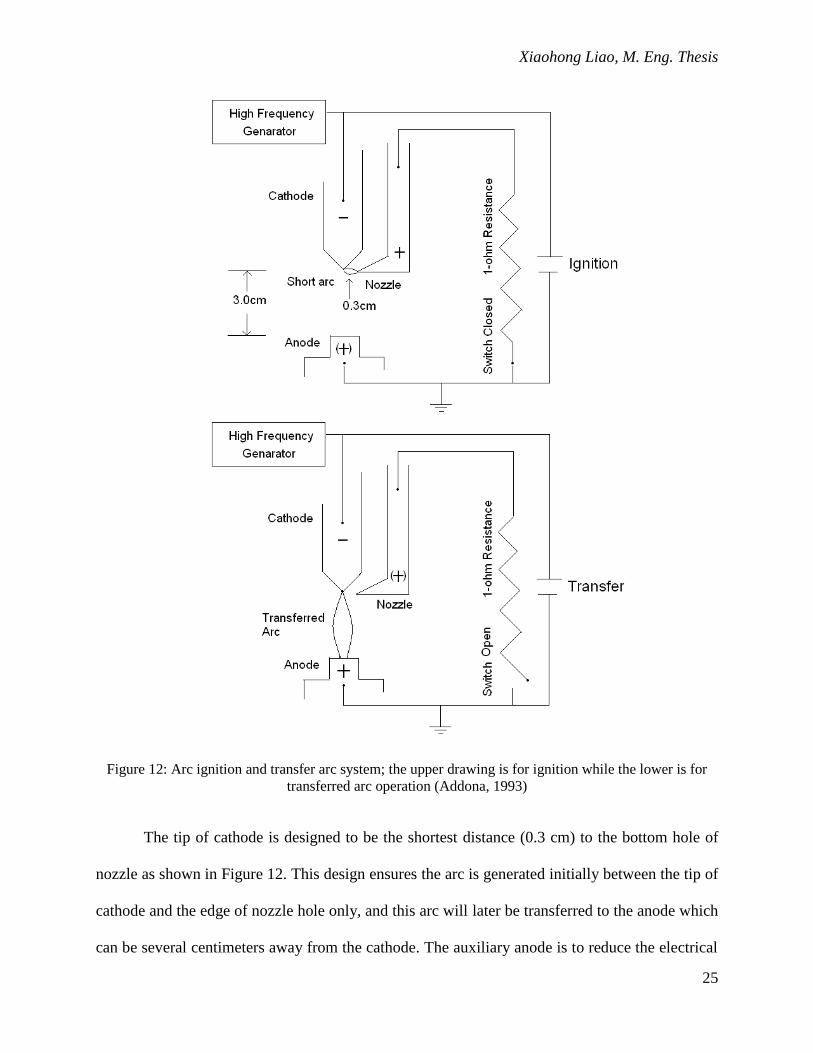
Arc Ignition and Transfer System
The arc ignition and transfer system is shown schematically in Figure 12. The system
consists of a high frequency generator, a high current 1 ohm resistor and a switch to open and
close the circuit. Once activated, the generator could supply a high voltage spark.
Xiaohong Liao, M. Eng. Thesis
25
Figure 12: Arc ignition and transfer arc system; the upper drawing is for ignition while the lower is for
transferred arc operation (Addona, 1993)
The tip of cathode is designed to be the shortest distance (0.3 cm) to the bottom hole of
nozzle as shown in Figure 12. This design ensures the arc is generated initially between the tip of
cathode and the edge of nozzle hole only, and this arc will later be transferred to the anode which
can be several centimeters away from the cathode. The auxiliary anode is to reduce the electrical
Chapter 3 Apparatus
26
breakdown voltage of the plasma for both ease of ignition and safety. According to the Paschen
curve, to breakdown neutral argon gas into plasma gas at atmosphere pressure, per centimeter
gap between the electrodes will require 30kV voltage. For example, if we want to have a plasma
column of 3cm, 90 kV voltage has to be supplied at the beginning. By shortening the gap to 3
mm, the initial voltage requirement reduces tenfold. After ignition, the voltage normally will
drop to some tens of volts since the plasma gas is conductive; thus, a much lower power supply
voltage can be used for sustaining the plasma. In practice a high voltage power supply increases
potential hazards and cost.
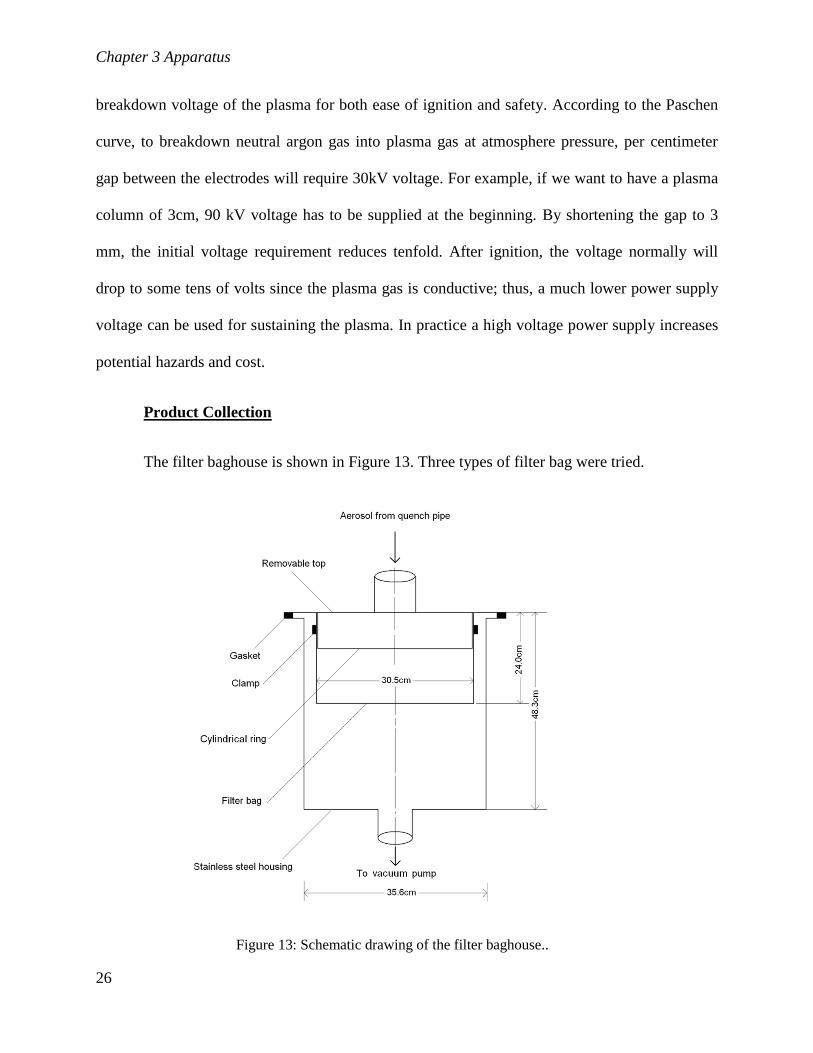
Product Collection
The filter baghouse is shown in Figure 13. Three types of filter bag were tried.
Figure 13: Schematic drawing of the filter baghouse..
Xiaohong Liao, M. Eng. Thesis
27
1. Nomex filter bag (Filtration Quebec: Nomex® 30cm diameter × 48cm long)
2. Polyster filter bag(Filtration Quebec: Polyster 12cm diameter × 22cm long)
3.Teflon membrane coated woven glassfiber filter bag (Filtration Quebec: 30 cm
diameter × 24 cm long)
The Teflon membrane coated filter coated bag has the highest efficiency to collect our
products.
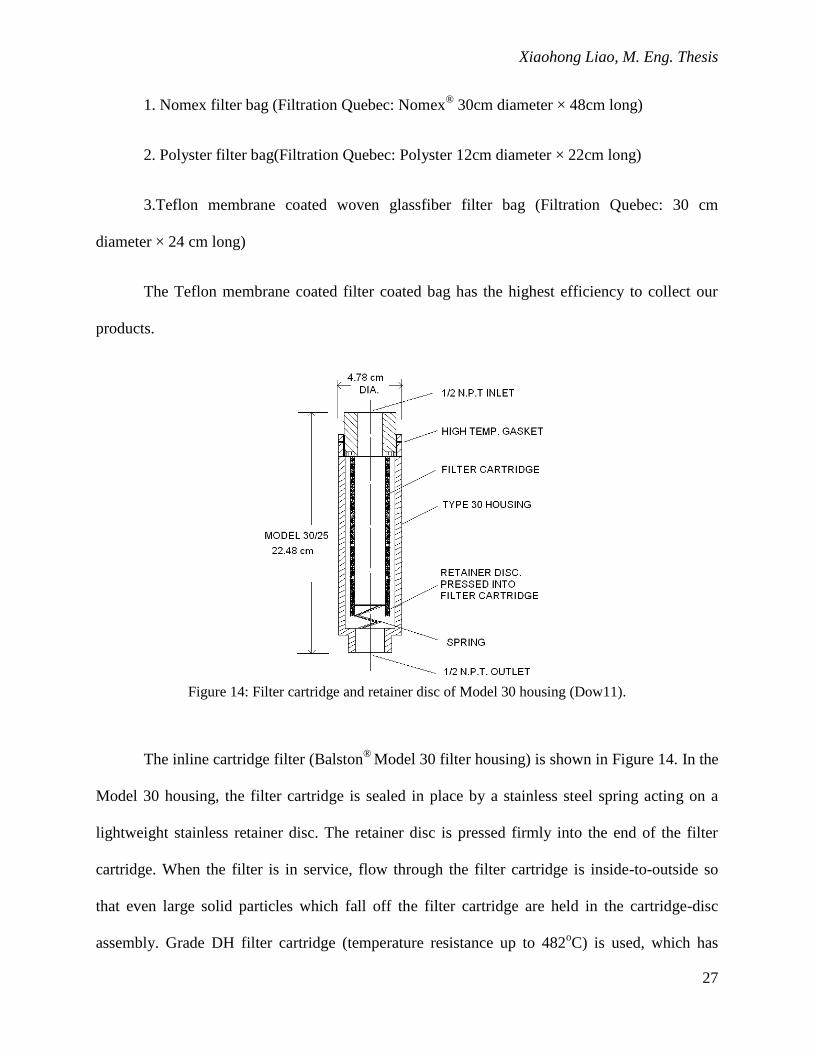
Figure 14: Filter cartridge and retainer disc of Model 30 housing (Dow11).
The inline cartridge filter (Balston®
Model 30 filter housing) is shown in Figure 14. In the
Model 30 housing, the filter cartridge is sealed in place by a stainless steel spring acting on a
lightweight stainless retainer disc. The retainer disc is pressed firmly into the end of the filter
cartridge. When the filter is in service, flow through the filter cartridge is inside-to-outside so
that even large solid particles which fall off the filter cartridge are held in the cartridge-disc
assembly. Grade DH filter cartridge (temperature resistance up to 482oC) is used, which has

Chapter 3 Apparatus
28
retention efficiency of 93% for particles at 10nm. Filter cartridge material consists of glass fiber,
quartz fiber, and high performance polymers etc.
3.2 Measurement Techniques and Instrumentation
Important operating parameters including pressure, current, voltage, gas flow rate and
temperatures are measured during the experiment.
Pressure Gauge
In order to monitor the pressure changes during the experiment, pressure gauges are
installed at the reactor and baghouse. The experiment was conducted around one atmosphere,
and the pressure was controlled less than 5 psi gauge. This limit was set by the gas leakage test.
Negative gauge pressure was avoided at all the times to avoid potential inflow of air which
would react with the graphite parts of the plasma reactor and reduce evaporation of titanium
compounds.
Rotameter
Gas flow rates were measured by calibrated rotameters. Calibration of these rotameters
was done with Gilian Gilibrator-2 air flow calibrator, under the identical conditions to that of the
actual sampling. The rotameter reading can be converted into actual gas flow rate using the
corresponding calibration curve.
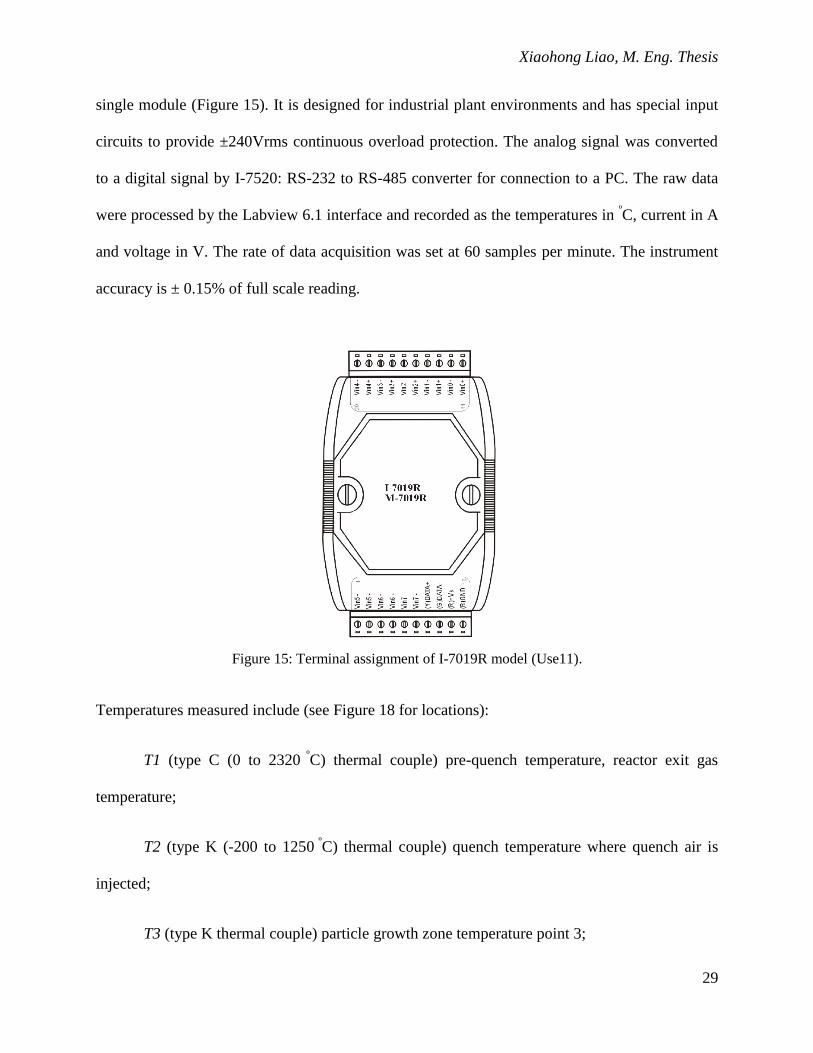
ICP-DAS data acquisition system (DAS)
The DAS system consists of an input module and a computer. The input module used is
ICP-DAS model I-7091R (Hoskin Scientific LTD). The module is an 8-channel voltage, current,
and thermocouple analog input module, with the ability to connect various types of inputs to a
Xiaohong Liao, M. Eng. Thesis
29
single module (Figure 15). It is designed for industrial plant environments and has special input
circuits to provide ±240Vrms continuous overload protection. The analog signal was converted
to a digital signal by I-7520: RS-232 to RS-485 converter for connection to a PC. The raw data
were processed by the Labview 6.1 interface and recorded as the temperatures in ºC, current in A
and voltage in V. The rate of data acquisition was set at 60 samples per minute. The instrument
accuracy is ± 0.15% of full scale reading.
Figure 15: Terminal assignment of I-7019R model (Use11).
Temperatures measured include (see Figure 18 for locations):
T1 (type C (0 to 2320 º
C) thermal couple) pre-quench temperature, reactor exit gas
temperature;
T2 (type K (-200 to 1250 ºC) thermal couple) quench temperature where quench air is
injected;
T3 (type K thermal couple) particle growth zone temperature point 3;

Chapter 3 Apparatus
30
T4 (type K thermal couple) particle growth zone temperature point 4;
T5 (type K thermal couple) temperature of gas entering the filter bag.

Xiaohong Liao, M. Eng. Thesis
31
Chapter 4 Experimental Procedure
4.1 Material
The starting bath material for plasma production of nano titinia powder was rutile titania
(99.5% min, metals basis) bought from Alfa Aesar (USA). The feeding material (99.5%, metals
basis) was bought from Guangdong Huazhou TiO2 Inc. (China).
The feeding pellets were prepared by a TDP-single tablet press (Mode Dia. 3mm, Max
Pressure 20MPa, Shanghai Tianxiang & Chentai pharmaceutical machinery Co. LTD); the
formed pellets have a diameter of 3mm and length of 2 mm.
4.2 Preparation of Reactor
The reactor was cleaned after each experiment. The condensed residue was removed
from the reaction chamber and exit tube. The crucible was replaced with a new one for every
experiment. The insulation was replaced once visual damage was observed. The resistance of
graphite reactor chamber to the outside stainless steel wall was checked to make sure these parts
were electrically insulated before closing the reactor. The detailed preparation procedure is
described in the pre-experimental procedure section of Appendix D.
4.3 Experiments
The general experimental procedure was summarized as the following steps (Detail
procedures were shown in experimental procedure section of Appendix D):
1. Clean the reactor and replace damage parts
2. Load the bath material

Chapter 4 Experimental Procedure
32
3. Check the isolation of the reactor inside chamber from the outside reactor wall
4. Close the reactor
5. Load the feed material
6. Connect the water pipes, gas lines check for leakage and gas pressure
7. Purge the system for 1 hour with argon at 10 slpm
8. Bypass the system (to avoid collection of not pseudo steady state product)
9. Ignite the plasma
10. Inject quench air
11. Start vacuum pumps
12. Start the data acquisition system to collect experimental data
13. Start feeding the titania pellets
14. Switch to baghouse after the system has reached steady state temperature
15. Shut down the system when finishing the experiment
16. Shut down the data acquisition system
17. Cool down the system to room temperature before shutting down the cooling water
18. Collect the product powder

Xiaohong Liao, M. Eng. Thesis
33
Chapter 5 Analytical Methods
5.1 Instrumental Analysis
5.1.1 XRD
The X-ray diffraction instrument used in this study was a Philips PW 1710 diffractometer
with monochromatic radiation under Bragg-Brentano geometry. X-ray diffraction is one of the
most important non-destructive methods to identify and characterize the solid samples. It is
widely used for phase identification, quantitative volume fraction analysis, crystallinity analysis,
residual stress analysis, texture analysis etc. In our study, XRD is used to identify the crystal
structure, composition, as well as crystalline size of the titania particles produced. Diffraction
patterns (Figure 23) were collected with Cu Kα radiation (40kV, 20mA) in the step scanning
mode. The scanning 2θ range was 10º to 100º with step size of 0.02º and collecting time of 1s per
step.
The obtained spectra were processed by HighScore software as the following: identifying
the background, eliminating outlier, stripping the Kα2 lines, and searching peak. The peaks were
then compared to the literature data searching for candidates; and the best matched patterns were
accepted.
Taking the full width at half maximum (FWHM), we also can estimate the crystallite size
of the sample according to Scherrer formula,
B
Cuc
W
fD
cos2
1
(5)
Chapter 5 Analytical Methods
34
where cD is the crystallite size, f is a dimensionless shape factor evaluated to 0.9, Cu is the X-
ray wavelength ( Cu =1.5406Å produced by copper anode), 2
1W is the peak width at half the
maximum intensity (in radians) and B is the Bragg angle (in radians). The standard deviation of
crystalline size was calculated based on all the peaks matched with the same reference code in
the spectrum.
5.1.2 BET
BET is an important analysis technique for the specific surface area measurement of a
solid sample. It is based on Langmuir isotherm of the monolayer gas adsorption, and extended to
multilayer gas adsorption. Adsorption is the consequence of surface energy minimization. In
BET theory, the adsorption mechanism concerned is physical adsorption, which is a function of
temperature, gas pressure, interactions between the surface and the gas (e.g. vapor pressure), and
surface area. Therefore, at a given pressure and temperature, the amount of gas adsorbed on a
solid surface can derive the surface area of the solid. From the surface area measurement, a
representative average particle size can be obtained using the following equation (2), assuming
the particle to be spherical.
AD
p
av
6 (6)
where p is the true density of the particle and A is the specific surface area given in m2/g.Since the
product we produced is the mixture of anatase and rutile, the relative density is calculated from the
following (3)
rraap ff (7)

Xiaohong Liao, M. Eng. Thesis
35
where af and rf denote fraction of anatase and rutile, and r and a denote density of anatase
and rutile, respectively.
The equipment used for BET analysis in this study was a TriStar 3000 analyzer, which
uses physical adsorption and capillary condensation principle to obtain information about the
surface area and porosity of a solid material. It consists of three units: a degas unit for
preparation of a clear sample, a surface area measurement unit including three independently
sample stations and four gas transducer, a computer control unit for setup of the parameters,
recording data and performing calculations. The sample measurement cycle includes cooling
the sample tubes to 77 K (temperature of liquid nitrogen at atmosphere), then exposing the
sample to analysis gas at a series of precisely controlled pressures. As the pressure is increased
stepwise, the ratio of equilibrium pressure and saturated pressure is recorded along with the
amount of gas absorbed at each equilibrium pressure. During the adsorption process, the
micropores will be filled first, and then the free surface will be covered completely. The larger
pores will be filled last by capillary condensation of the analysis gas. After that, a reverse process
of adsorption, desorption will be proceeded in the reverse fashion. Pressure is decreased stepwise
allowing the release of the gas; the quantity of gas liberated at each equilibrium pressure is
recorded. From these two sets of data, adsorption and desorption isotherm can be plotted, and the
surface area porosity of the sample can be derived. These calculations are done by the computer,
a detailed report can be obtained including the operating conditions (for example, relative
pressure, absolute pressure, quantity adsorbed, time and saturation pressure) at each step,
isotherm linear plot, isotherm log plot, BET surface area report, and BET surface area plot.
Figure 16 showed the Tristar 3000 BET analyzer used in this study.

Chapter 5 Analytical Methods
36
Figure 16: TriStar 3000 surface area and porosimetry analyzer (Adapted from micromeritics home page).
5.1.3 SEM
The scanning electron microscopy (SEM), Hitachi S-4700 FEG-SEM (Field Emission
Gun) was employed to exam the morphology, size distribution and chemical composition in this
study. The SEM uses a focused beam of high-energy electrons to generate a variety of signals at
the surface of solid specimens. The signals derived from electron-sample interaction reveal
information about the sample such as external morphology by means of secondary electron
emission and chemical composition by means of energy dispersive X-ray emission (EDS). The
SEM is also capable of performing analysis of selected point locations on the sample; this
approach is especially useful in qualitatively or semi-quantitatively determining chemical
compositions (using EDS).
In our study, the produced nano titanium dioxide powder was dusted onto a conductive
double-sided adhesive carbon tape. While doing so, the particles were dispersed as widely as
possible and excess powder was removed by compressed air. This sample preparation method
allowed us to observe a relatively large number of nano particles in one analysis, which could
represent the real sample morphology. However, charging occurred as nano titania is not
Xiaohong Liao, M. Eng. Thesis
37
conductive at room temperature. Impinging electrons are trapped within the sample and these
accumulated electrons on the surface will distort the image by deviating electron probes and
secondary electrons arising from repulsion. Therefore, a low accelerating voltage (2kV) with
current of 10 μA was used in the study of morphology to obtain fairly good images. A high
accelerating voltage of 10 kV with a current of 10 μA was used for the elemental composition
study in EDS.
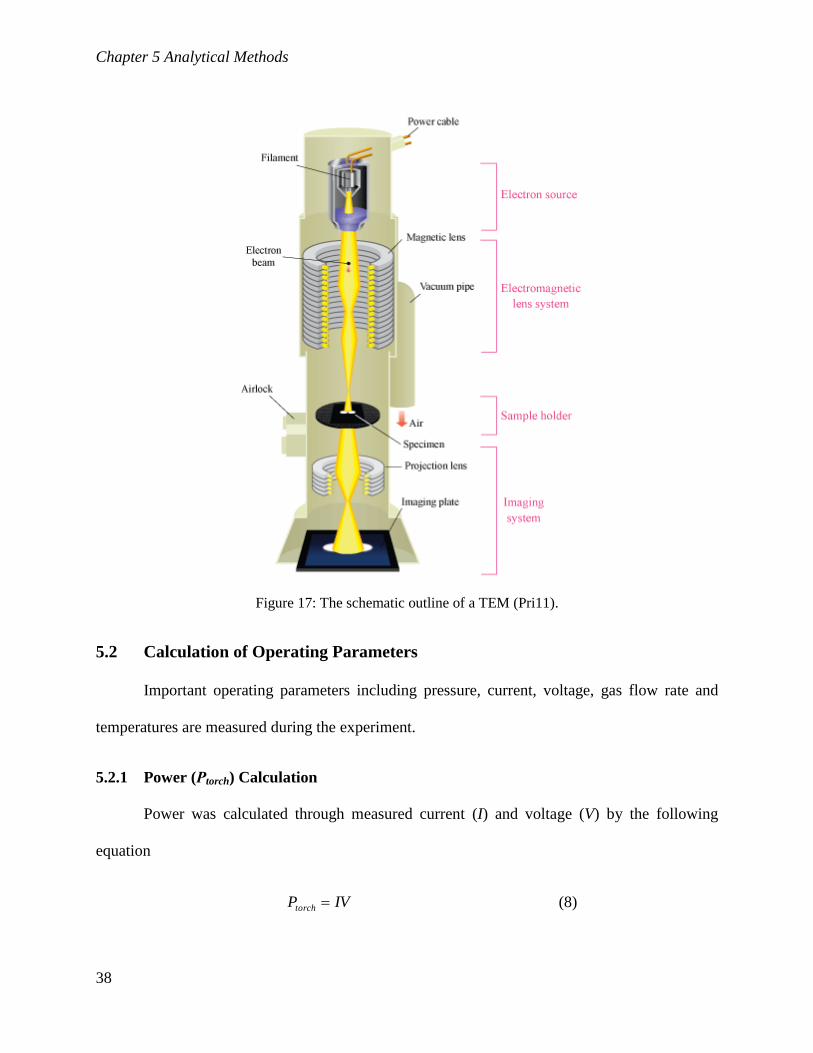
5.1.4 TEM
The transmission electron microscope (TEM) is capable to study the size, shape and
arrangement of the particles with atomic scale resolution using a high energy electron beam
transmitted through a very thin sample. Philips CM200 200 kV FEG-TEM was employed to
study the morphology and composition of plasma produced particles in this study. The schematic
outline of a TEM is shown in Figure 17. The electrons are focused with electromagnetic lenses
and the image is observed on a digital camera. The electrons accelerated at 200kV have a
wavelength of 0.025Å; therefore in theory, it could resolve the image close to this range.
However, the resolution of TEM is limited by aberrations inherent in electromagnetic lenses, to
about 1-2 Å. For our purpose, this is fine enough to study the morphology, crystal lattice, and
defects of the crystal produced. The TEM is also capable of forming a focused electron probe, as
small as 20 Å, which can be positioned on a specific particle in the sample for microdiffraction
information or analysis of x-rays for compositional information.
Different from SEM sample preparation-dusted directly on the carbon tape, particles were
dispersed in acetone first, then a few drops of suspension were dribbled on the copper grid (G200
square mesh with carbon film coating) placed on the Kim wipes to absorb acetone. The grid was
air dried for more than 10 minutes before analysis to ensure the acetone was totally evaporated.
Chapter 5 Analytical Methods
38
Figure 17: The schematic outline of a TEM (Pri11).
5.2 Calculation of Operating Parameters
Important operating parameters including pressure, current, voltage, gas flow rate and
temperatures are measured during the experiment.
5.2.1 Power (Ρtorch) Calculation
Power was calculated through measured current (I) and voltage (V) by the following
equation
IVPtorch (8)

Xiaohong Liao, M. Eng. Thesis
39
5.2.2 Quench rate (Rq) Calculation
In the different sites of plasma rector system, the pressure and temperature have been
measured as shown in Figure 18. The pressures of plasma reactor and exit tube after cooling are
named PV1 and PV2, respectively. There are 5 sites for measuring temperature. Site 1 is located at
the exit of reactor, its temperature T1 is referred as pre-quench temperature. Site 2 is the injection
point of compressed dry air, its temperature T2 is really the mixing temperature. Site 3 is
arranged after water-cooling, its temperature T3 also referred to quench temperature. T4 is the
temperature of the site with the heat loss to room air through the pipe wall by convection; T5 is
the site with the injection of compressed dry air before the hot gas stream entering the filter
baghouse.
Figure 18: Schematic drawing identifying the sites of pressure and temperature measurement in the
plasma rector system.
The quench rate(Rq, sK ) is denoted as the change of temperature( T , K ) during the
quench time( t , s), it is shown in Equation (9),
Chapter 5 Analytical Methods
40
t
TRq
(9)
where, T is the change of temperature between site1 and site 3, i.e. 31 TTT , then T is
the residence time of mixture gas between site1 and site 3, the calculation of T is shown in
Equation (10),
S
lt
VV
2
31
(10)
where l is the distance of quench process from site1 to site 3; 1VQ and 3VQ are volumetric
flow rates of the gas at site1 and site 3 respectively; S is the inner cross-sectional area of exit
tube. We assume that the high-temperature gas obeys the ideal gas law,
nRTQP VV (11)
where VP is the pressure in the reactor, n is the total molar flow rate, R is the gas constant, and
T is the temperature at the different measuring points.
Assume the pressure and total mass of gas are constant inside the reactor, then,
iVi
V
T
T
Q
Q 00
(12)
The subscripts i indicate the different temperature sites inside the plasma reactor system.
0T means the initial condition of gas at the room temperature (298K); and 0VQ is the gas flow
rate from compressed cylinder to the reactor.
0
1
1
)(
T
TQQQQ
fwt
V
(13
Xiaohong Liao, M. Eng. Thesis
41
where tQ , wQ and fQ is for volumetric gas flow rate of observation torch, window, and feeder,
respectively.
5.2.3 Residence time (τ) Calculation
Residence time (τ) is denoted as the time of high-temperature mixing gas during the pre-
quench and a specific temperature.It is shown in Equation (14),
S
l
VV
r
2
31
(14)
where rl is the distance of nanocrystalline growth or crystal phase transformation from site 1T
to 3T point; 3VQ is volumetric flow rate of the gas at specific 3T point.
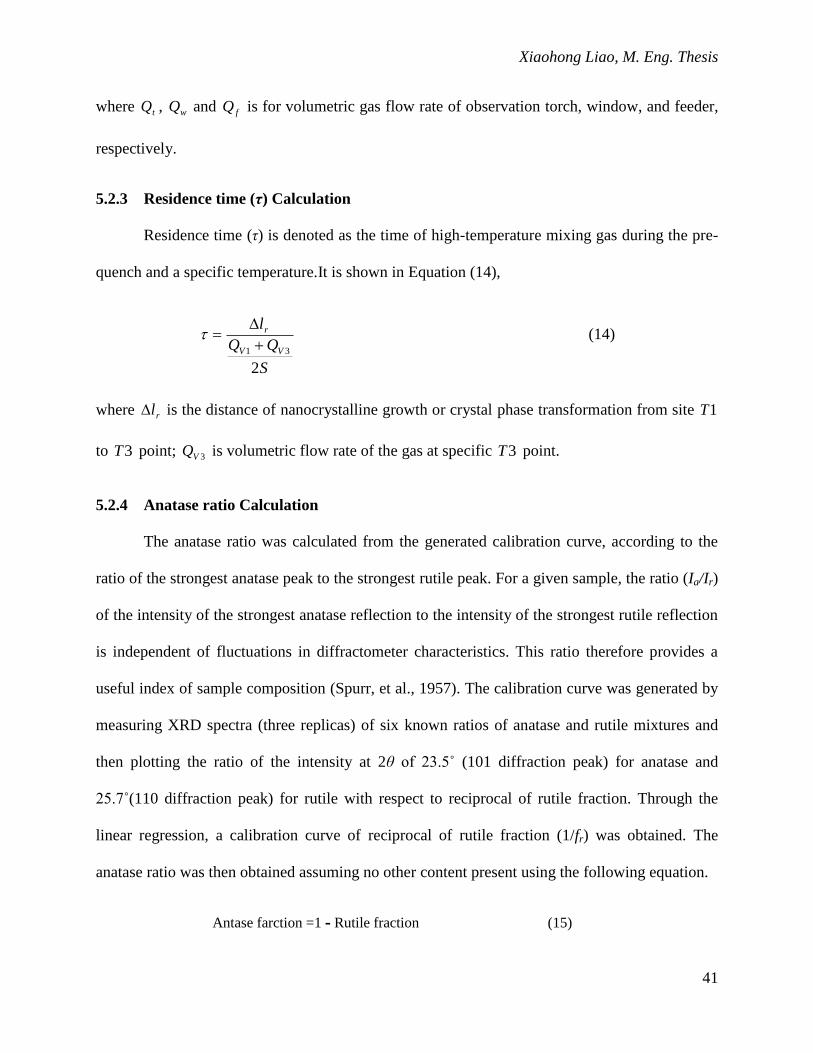
5.2.4 Anatase ratio Calculation
The anatase ratio was calculated from the generated calibration curve, according to the
ratio of the strongest anatase peak to the strongest rutile peak. For a given sample, the ratio (Ia/Ir)
of the intensity of the strongest anatase reflection to the intensity of the strongest rutile reflection
is independent of fluctuations in diffractometer characteristics. This ratio therefore provides a
useful index of sample composition (Spurr, et al., 1957). The calibration curve was generated by
measuring XRD spectra (three replicas) of six known ratios of anatase and rutile mixtures and
then plotting the ratio of the intensity at 2θ of 23.5˚ (101 diffraction peak) for anatase and
25.7˚(110 diffraction peak) for rutile with respect to reciprocal of rutile fraction. Through the
linear regression, a calibration curve of reciprocal of rutile fraction (1/fr) was obtained. The
anatase ratio was then obtained assuming no other content present using the following equation.
Antase farction =1 - Rutile fraction (15)
Chapter 5 Analytical Methods
42
Standard deviation of anatase ratio was calculated from background influence of peak
height. Two sets of peak height were obtained based on the computer defined base line and
absolute zero line, respectively.
Figure 19: Calibration curve for anatase and rutile ratio calculation.
The resulting calibration curve of reciprocal of rutile weight fraction was shown in Figure
19. The linear relationship was obtained between the ratio of intensity of anatase and intensity of
rutile (Ia/Ir ) versus reciprocal of rutile weight fraction (1/fr ) in sample. The slope of the function
is 0.6843 with the intercept of 0.9777. The data fit nicely for the linear function with R-square
value of 99.83%. The empirical data of Ia/Ir obtained from XRD spectra were within the
calibration range, thus the calibration function was valid for the calculation of anatase/rutile
fraction.
Xiaohong Liao, M. Eng. Thesis
43
Chapter 6 Results and Discussion
6.0 Summary of Experimental Conditions
Different quench conditions were studied by varying the torch gas flow, the quench air
flow and current to find the optimum conditions for the production of a high anatase: rutile ratio,
which is close to Degussa P25. The torch position was located 3 cm above the crucible for all the
experiments. The arc length was around 4-8cm depending on the melt height in the crucible. The
torch gas used was pure argon (99.9%) from MEGs. Dry air from the lab line was used for
quench air. The successful experiments are summarized in Table 2. A total of 24 experiments
were conducted, however due to various reasons only ten experiments yielded full results. The
experiments were grouped according to total argon flow rate and quench air flow rate. For runs
xl-05 to xl-07, the feed consisted of irregularly shaped pellets (1-1.7mm pieces) and the initial
titania loaded into the crucible was 150-200g. For runs xl-17 to xl-24, the feed was uniform
cylindrical round pellets (Diameter 3mm×Length 2mm), and the crucible loading was 250g. The
duration of the experiments depended on the process conditions. The weight loss during the
experiment was not recorded for each experiment, due to the difficulty of removing the reaction
chamber to make the measurement. After each experiment, the reaction chamber stuck to the exit
tube by the condensation of vapor, separating the parts by force might damage them.

Chapter 6 Results and Discussion
44
Tab
le 2
: S
um
mar
y o
f su
cces
sful
exper
imen
ts
xl-
20
17
0
57
25
45
11
86
11
0
37
0
0.0
37
8
35
(5)
xl-
22
18
0
57
25
55
12
17
79
29
0
0.0
92
7
85
(40)
xl-
23
17
0
58
25
15
12
40
20
2
59
2
0.1
58
0
65
(20)
xl-
21
16
0
56
25
15
11
21
19
1
49
2
0.2
54
1
75
(30)
xl-
24
160
60
25
30
1257
137
525
0.2
866
55
(15)
xl-
19
160
48
25
30
1207
151
379
0.1
624
55(2
5)
xl-
18
200
60
25
20
1287
246
769
0.4
833
60(1
5)
xl-
17
170
53
25
20
1145
222
539
0.1
957
60(1
5)
xl-
07
150
57
35
30
1186
176
429
0.2
211
95(5
0)
xl-
06
210
54
35
30
1327
152
481
trac
e
80(3
5)
xl-
05
16
0
57
35
30
14
00
17
2
43
8
0.1
38
1
55
(20)
(A)
(V)
(slp
m)
(slp
m)
(˚C
)
(˚C
)
(˚C
)
(g)
(min
)
Ru
n #
Cu
rren
t
Volt
age
Qarg
on
Qair
T1
T2
T3
Pro
du
ct
Dura
tio
n
Xiaohong Liao, M. Eng. Thesis
45
6.1 General Observations and Discussion
The currents, voltages and temperatures reported here were averages at the pseudo-steady
state conditions during which product was collected. The experiments could be divided into two
periods, the preliminary testing period as runs xl-05 to xl-07 and formal experimental period as
runs xl-17 to xl-24.
In the preliminary testing period, we encountered the particle collection problems. The
particles were removed from the filter bag by blowing air into the filter bag to force the trapped
powder out of the filter bag. We also collected the particles from the inside wall of the baghouse;
this powder had bypassed the filter bag.
The results from the formal experimental period were considered more representative. In
these runs, we overcame all the difficulties. Every experiment was successful and under control.
The particles were all collected from either the filter cartridge or inside filter bag, which limited
the contamination.
Voltage
Voltage was influenced by the feeding rate and melting process of the bath material, and
it was very stable (±1V) once the pseudo-steady state was established. It was also used as a
warning if the level of molten titania in the crucible was too low (sudden lowering of voltage),
under these circumstances the feed rate would be increased.
Current
During the experiment, current was a major controllable parameter to yield a desirable
pre-quench temperature. Higher currents resulted in higher pre-quench temperatures at pseudo
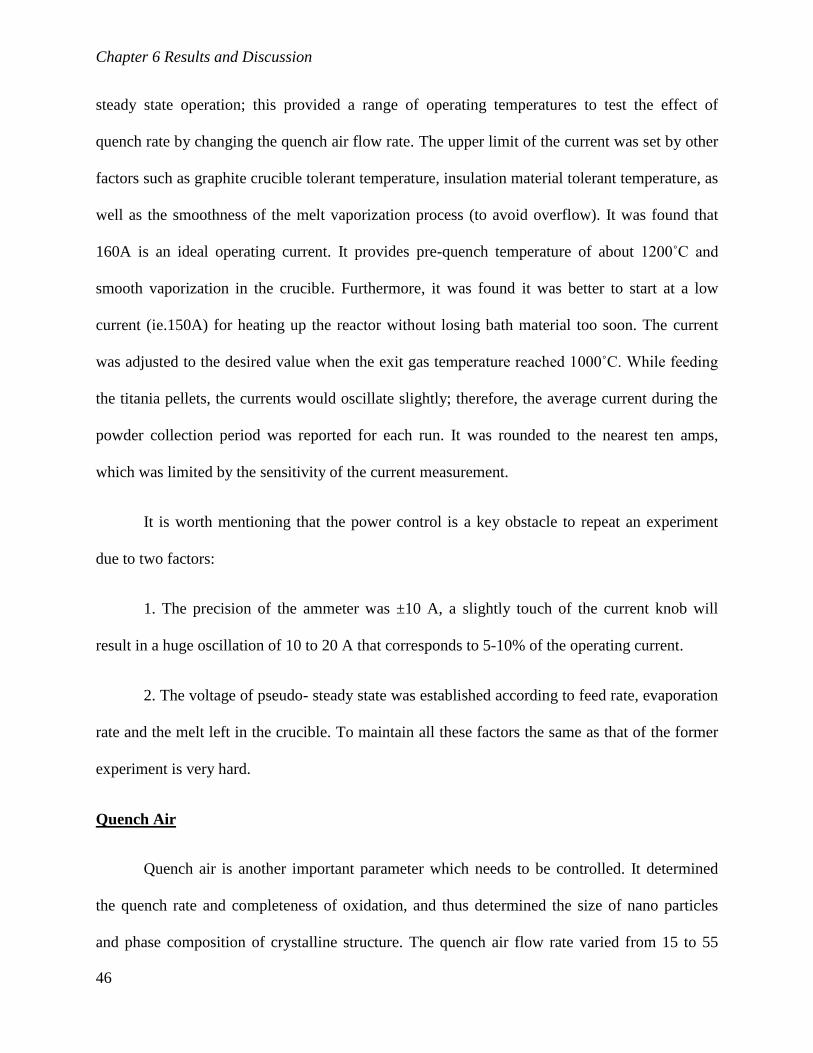
Chapter 6 Results and Discussion
46
steady state operation; this provided a range of operating temperatures to test the effect of
quench rate by changing the quench air flow rate. The upper limit of the current was set by other
factors such as graphite crucible tolerant temperature, insulation material tolerant temperature, as
well as the smoothness of the melt vaporization process (to avoid overflow). It was found that
160A is an ideal operating current. It provides pre-quench temperature of about 1200˚C and
smooth vaporization in the crucible. Furthermore, it was found it was better to start at a low
current (ie.150A) for heating up the reactor without losing bath material too soon. The current
was adjusted to the desired value when the exit gas temperature reached 1000˚C. While feeding
the titania pellets, the currents would oscillate slightly; therefore, the average current during the
powder collection period was reported for each run. It was rounded to the nearest ten amps,
which was limited by the sensitivity of the current measurement.
It is worth mentioning that the power control is a key obstacle to repeat an experiment
due to two factors:
1. The precision of the ammeter was ±10 A, a slightly touch of the current knob will
result in a huge oscillation of 10 to 20 A that corresponds to 5-10% of the operating current.
2. The voltage of pseudo- steady state was established according to feed rate, evaporation
rate and the melt left in the crucible. To maintain all these factors the same as that of the former
experiment is very hard.
Quench Air
Quench air is another important parameter which needs to be controlled. It determined
the quench rate and completeness of oxidation, and thus determined the size of nano particles
and phase composition of crystalline structure. The quench air flow rate varied from 15 to 55
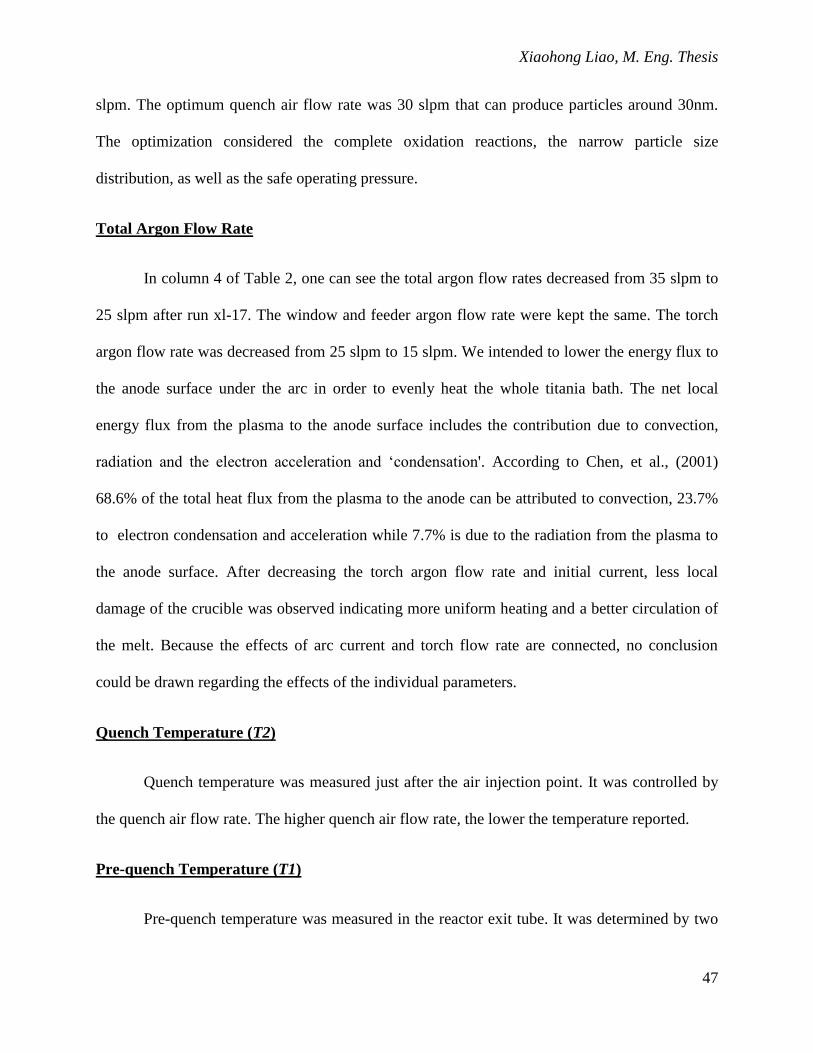
Xiaohong Liao, M. Eng. Thesis
47
slpm. The optimum quench air flow rate was 30 slpm that can produce particles around 30nm.
The optimization considered the complete oxidation reactions, the narrow particle size
distribution, as well as the safe operating pressure.
Total Argon Flow Rate
In column 4 of Table 2, one can see the total argon flow rates decreased from 35 slpm to
25 slpm after run xl-17. The window and feeder argon flow rate were kept the same. The torch
argon flow rate was decreased from 25 slpm to 15 slpm. We intended to lower the energy flux to
the anode surface under the arc in order to evenly heat the whole titania bath. The net local
energy flux from the plasma to the anode surface includes the contribution due to convection,
radiation and the electron acceleration and „condensation'. According to Chen, et al., (2001)
68.6% of the total heat flux from the plasma to the anode can be attributed to convection, 23.7%
to electron condensation and acceleration while 7.7% is due to the radiation from the plasma to
the anode surface. After decreasing the torch argon flow rate and initial current, less local
damage of the crucible was observed indicating more uniform heating and a better circulation of
the melt. Because the effects of arc current and torch flow rate are connected, no conclusion
could be drawn regarding the effects of the individual parameters.
Quench Temperature (T2)
Quench temperature was measured just after the air injection point. It was controlled by
the quench air flow rate. The higher quench air flow rate, the lower the temperature reported.
Pre-quench Temperature (T1)
Pre-quench temperature was measured in the reactor exit tube. It was determined by two
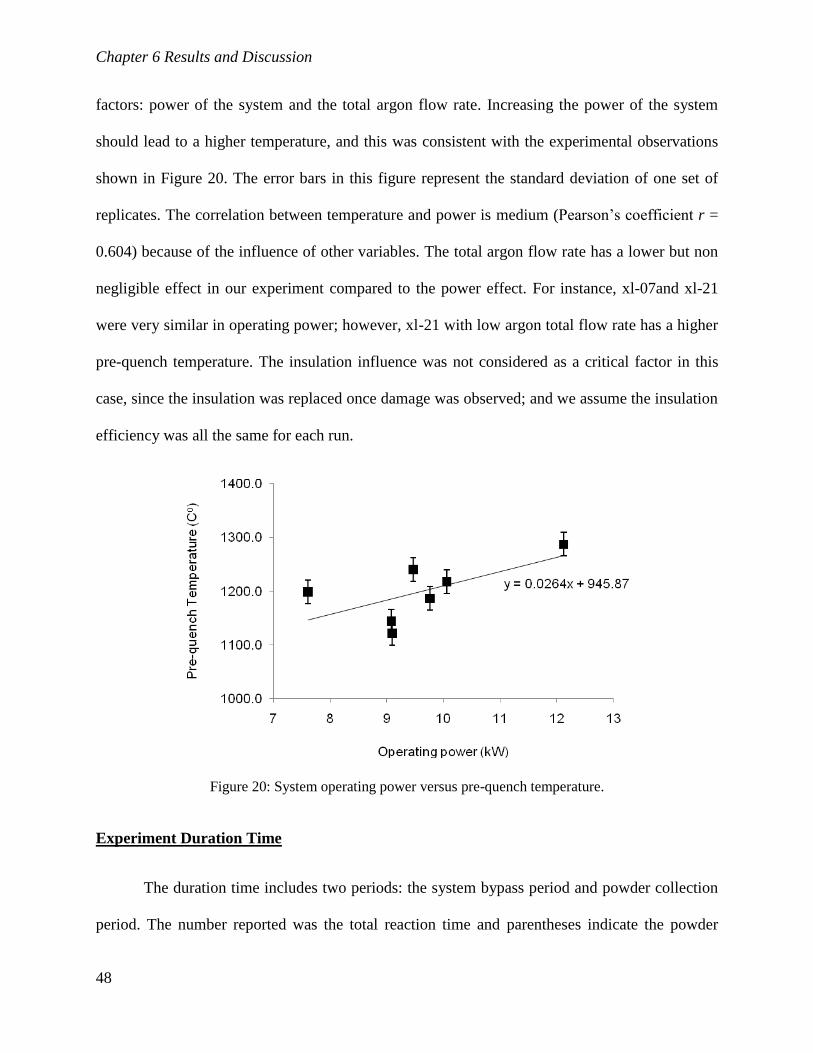
Chapter 6 Results and Discussion
48
factors: power of the system and the total argon flow rate. Increasing the power of the system
should lead to a higher temperature, and this was consistent with the experimental observations
shown in Figure 20. The error bars in this figure represent the standard deviation of one set of
replicates. The correlation between temperature and power is medium (Pearson‟s coefficient r =
0.604) because of the influence of other variables. The total argon flow rate has a lower but non
negligible effect in our experiment compared to the power effect. For instance, xl-07and xl-21
were very similar in operating power; however, xl-21 with low argon total flow rate has a higher
pre-quench temperature. The insulation influence was not considered as a critical factor in this
case, since the insulation was replaced once damage was observed; and we assume the insulation
efficiency was all the same for each run.
Figure 20: System operating power versus pre-quench temperature.
Experiment Duration Time
The duration time includes two periods: the system bypass period and powder collection
period. The number reported was the total reaction time and parentheses indicate the powder
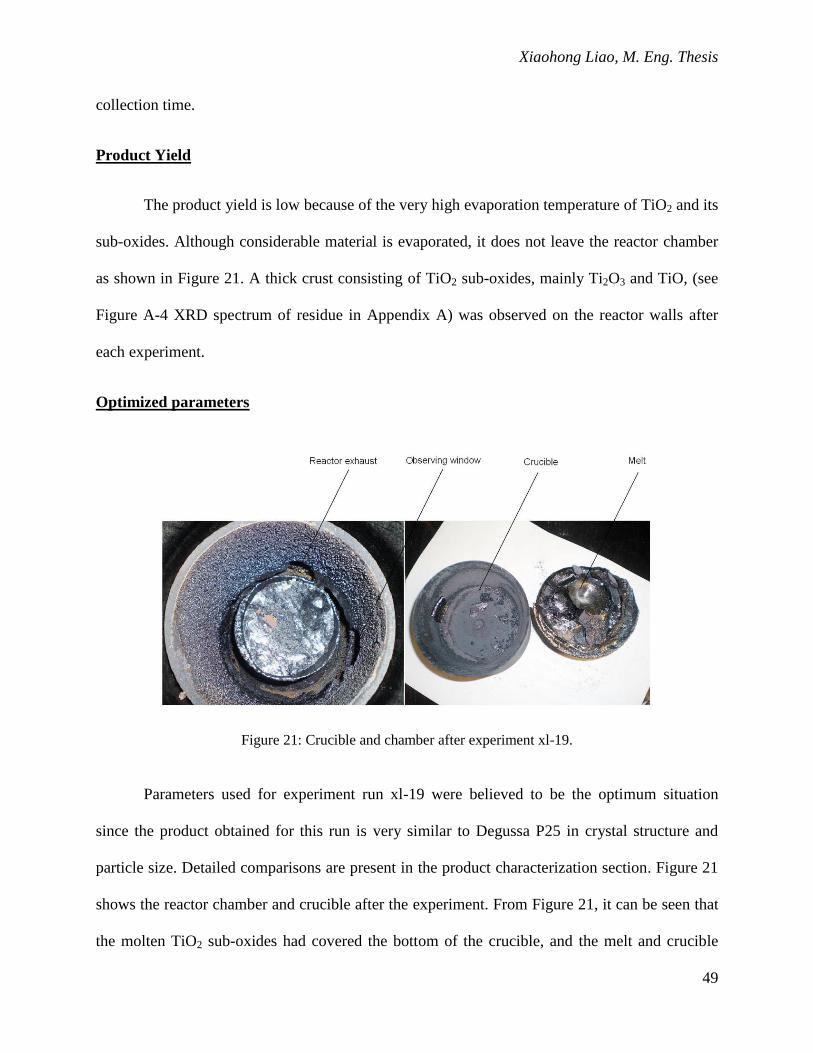
Xiaohong Liao, M. Eng. Thesis
49
collection time.
Product Yield
The product yield is low because of the very high evaporation temperature of TiO2 and its
sub-oxides. Although considerable material is evaporated, it does not leave the reactor chamber
as shown in Figure 21. A thick crust consisting of TiO2 sub-oxides, mainly Ti2O3 and TiO, (see
Figure A-4 XRD spectrum of residue in Appendix A) was observed on the reactor walls after
each experiment.
Optimized parameters
Figure 21: Crucible and chamber after experiment xl-19.
Parameters used for experiment run xl-19 were believed to be the optimum situation
since the product obtained for this run is very similar to Degussa P25 in crystal structure and
particle size. Detailed comparisons are present in the product characterization section. Figure 21
shows the reactor chamber and crucible after the experiment. From Figure 21, it can be seen that
the molten TiO2 sub-oxides had covered the bottom of the crucible, and the melt and crucible
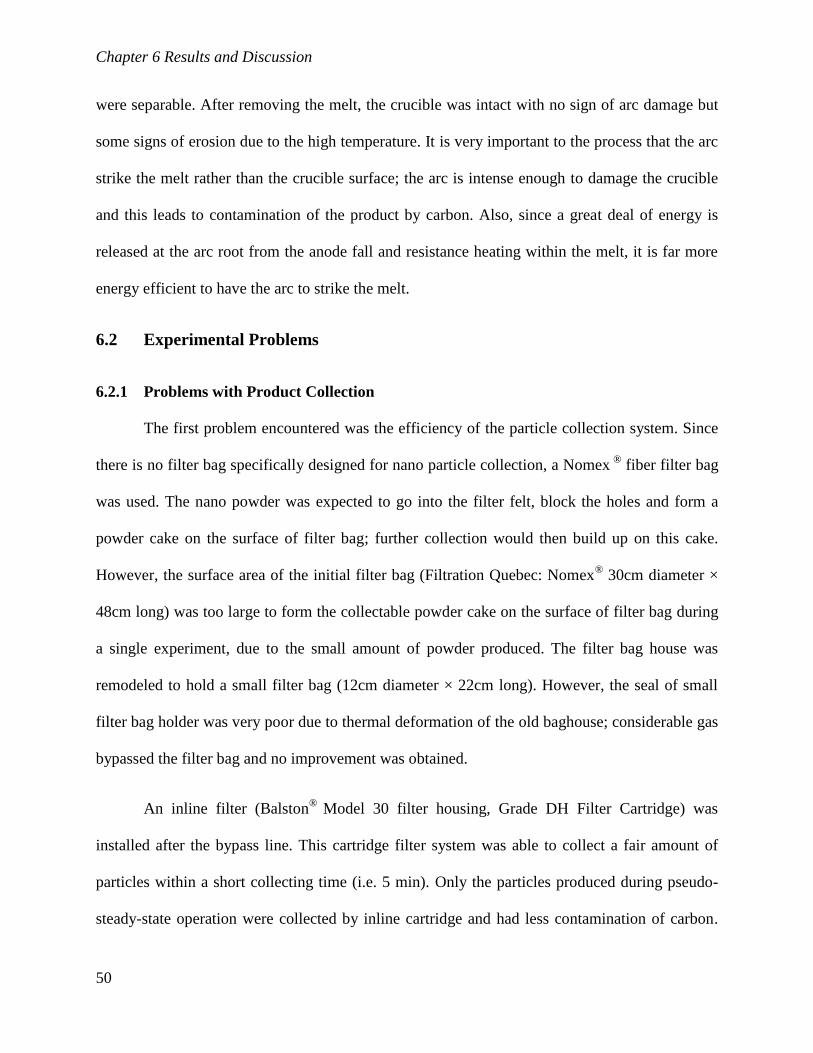
Chapter 6 Results and Discussion
50
were separable. After removing the melt, the crucible was intact with no sign of arc damage but
some signs of erosion due to the high temperature. It is very important to the process that the arc
strike the melt rather than the crucible surface; the arc is intense enough to damage the crucible
and this leads to contamination of the product by carbon. Also, since a great deal of energy is
released at the arc root from the anode fall and resistance heating within the melt, it is far more
energy efficient to have the arc to strike the melt.
6.2 Experimental Problems
6.2.1 Problems with Product Collection
The first problem encountered was the efficiency of the particle collection system. Since
there is no filter bag specifically designed for nano particle collection, a Nomex ®
fiber filter bag
was used. The nano powder was expected to go into the filter felt, block the holes and form a
powder cake on the surface of filter bag; further collection would then build up on this cake.
However, the surface area of the initial filter bag (Filtration Quebec: Nomex® 30cm diameter ×
48cm long) was too large to form the collectable powder cake on the surface of filter bag during
a single experiment, due to the small amount of powder produced. The filter bag house was
remodeled to hold a small filter bag (12cm diameter × 22cm long). However, the seal of small
filter bag holder was very poor due to thermal deformation of the old baghouse; considerable gas
bypassed the filter bag and no improvement was obtained.
An inline filter (Balston®
Model 30 filter housing, Grade DH Filter Cartridge) was
installed after the bypass line. This cartridge filter system was able to collect a fair amount of
particles within a short collecting time (i.e. 5 min). Only the particles produced during pseudo-
steady-state operation were collected by inline cartridge and had less contamination of carbon.

Xiaohong Liao, M. Eng. Thesis
51
Nevertheless, there were three drawbacks. First of all, pressure could build up during the powder
collection because of the much smaller filtering area. The system must be kept below 5 psi gauge
due to safety concerns and this restriction normally limited the particle collection period to 10
minutes. Secondly, since the filter cartridge was made of glass fiber, it might be a source of
silicon contamination. The study was attempting to produce titania with silica coating; therefore,
silica contamination should be strictly controlled. The last drawback was the high cost of
cartridges compared to the filter bag cost.
A compromise solution was to use Teflon coated filter bags to collect the powder using
the original filter bag holder. To increase collection efficiency and reduce the surface area of the
filter bag, the bag length was reduced from 48cm to 24cm. Since the filter bag has Teflon coating,
the most of produced powder was trapped on the filtering surface and ready for collection. A
problem of contamination of the product by carbon remained. Because the bypass valve was
located after the filter, transient pressure changes at the beginning of the experiments caused
some dirty gas to flow into the baghouse. This gas contained some graphite from arc ignition and
some graphite felt fibers from the reactor insulation.
6.2.2 System Related Limitations
1. The current plasma reactor system was very successful for synthesizing fumed silica.
However, a much higher temperature is needed to decompose and vaporize titania. Quenchable
TiO gas is formed ca. 3300-3700 K (Altenhoff, 2009) and plasma chamber wall temperature
ranged from 1375 K to 1975 K (Addona, 1998), which means that much of the vapor product
was condensed before reaching the quench section. This is consistent with the experimental
observation as shown in Figure 21.
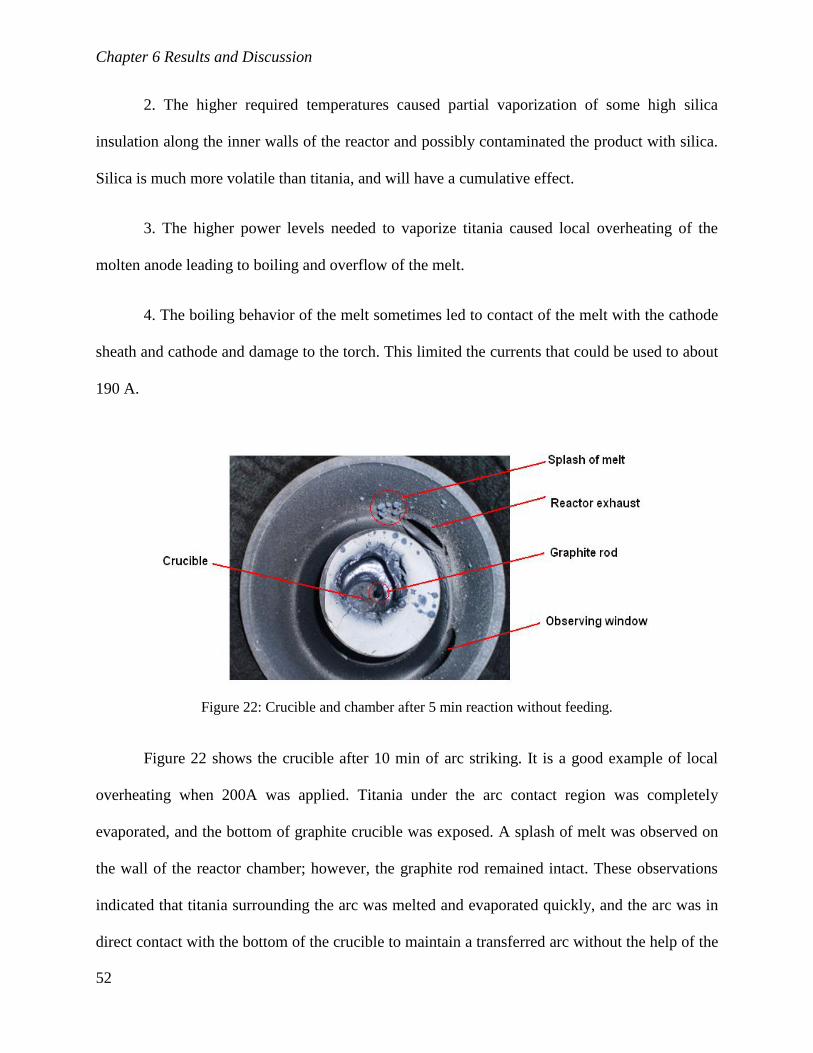
Chapter 6 Results and Discussion
52
2. The higher required temperatures caused partial vaporization of some high silica
insulation along the inner walls of the reactor and possibly contaminated the product with silica.
Silica is much more volatile than titania, and will have a cumulative effect.
3. The higher power levels needed to vaporize titania caused local overheating of the
molten anode leading to boiling and overflow of the melt.
4. The boiling behavior of the melt sometimes led to contact of the melt with the cathode
sheath and cathode and damage to the torch. This limited the currents that could be used to about
190 A.
Figure 22: Crucible and chamber after 5 min reaction without feeding.
Figure 22 shows the crucible after 10 min of arc striking. It is a good example of local
overheating when 200A was applied. Titania under the arc contact region was completely
evaporated, and the bottom of graphite crucible was exposed. A splash of melt was observed on
the wall of the reactor chamber; however, the graphite rod remained intact. These observations
indicated that titania surrounding the arc was melted and evaporated quickly, and the arc was in
direct contact with the bottom of the crucible to maintain a transferred arc without the help of the
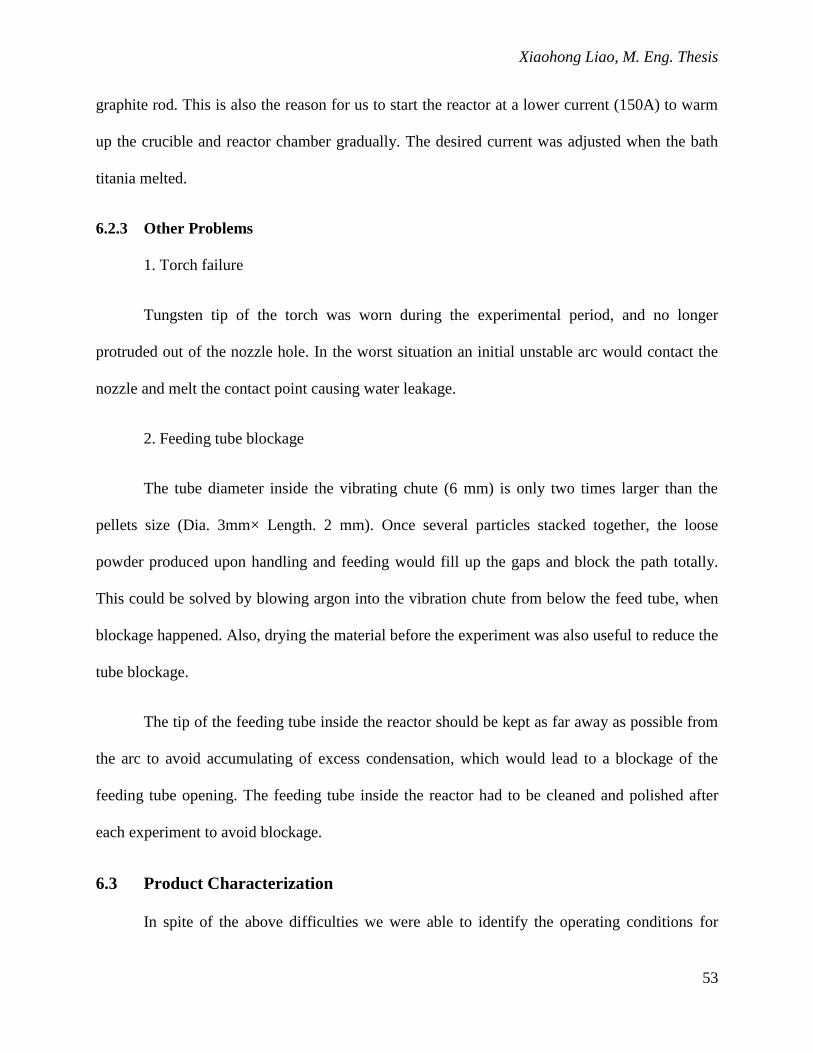
Xiaohong Liao, M. Eng. Thesis
53
graphite rod. This is also the reason for us to start the reactor at a lower current (150A) to warm
up the crucible and reactor chamber gradually. The desired current was adjusted when the bath
titania melted.
6.2.3 Other Problems
1. Torch failure
Tungsten tip of the torch was worn during the experimental period, and no longer
protruded out of the nozzle hole. In the worst situation an initial unstable arc would contact the
nozzle and melt the contact point causing water leakage.
2. Feeding tube blockage
The tube diameter inside the vibrating chute (6 mm) is only two times larger than the
pellets size (Dia. 3mm× Length. 2 mm). Once several particles stacked together, the loose
powder produced upon handling and feeding would fill up the gaps and block the path totally.
This could be solved by blowing argon into the vibration chute from below the feed tube, when
blockage happened. Also, drying the material before the experiment was also useful to reduce the
tube blockage.
The tip of the feeding tube inside the reactor should be kept as far away as possible from
the arc to avoid accumulating of excess condensation, which would lead to a blockage of the
feeding tube opening. The feeding tube inside the reactor had to be cleaned and polished after
each experiment to avoid blockage.
6.3 Product Characterization
In spite of the above difficulties we were able to identify the operating conditions for

Chapter 6 Results and Discussion
54
producing a high content of anatase (70.8%) with the average diameter of 38.6±0.6nm (run xl-19,
based on BET analysis). The following Table 3 shows the comparison of our samples with
Degussa P25. The experiments were divided into five groups with the same argon flow rate and
same quench air flow rate for later comparison. The product analysis of TEM and SEM were
focused on the experiment xl-23 and xl-24, these last two runs had minimum contamination.
Temperature profiles of these two runs as well as xl-19 are shown in Appendix C. The plateau
region of the temperature profile demonstrates the pseudo-steady state achieved during the
synthesis.
Table 3: The summary of experiment results
Exp No. Rq τ fa fa stdev Dv Dv stdev σg DA DA stdev ABET ABET stdev
(K/s) (ms) (nm) (nm) (nm) (nm) (nm) (m2/g) (m
2/g)
P25 NA NA 0.8001 0.010 25.2 12.5 NA 27.1 0.3 52.0987 0.4602
xl-17 8696 70 0.330 0.029 27.6 13.2 1.67 46.9 1.3 30.9235 0.6215
xl-18 8852 59 0.111 0.019 16.7 10.2 2.11 68.4 2.8 20.8406 0.5934
xl-21 8197 77 0.653 0.012 24.1 12.3 1.65 43.7 1.0 34.1240 0.5716
xl-23 9339 69 0.236 0.004 28.1 12.0 1.59 57.1 2.0 25.2319 0.6293
xl-19 12010 69 0.708 0.024 18.7 8.5 1.61 38.6 0.6 38.8953 0.4559
xl-24 11970 61 0.570 0.006 28.3 10.6 1.56 40.0 1.6 37.0401 1.0426
xl-20 13250 62 0.369 0.019 31.1 9.8 1.62 34.6 1.2 42.0971 0.9972
xl-22 15170 61 0.535 0.003 21.4 7.0 1.34 17.7 0.4 83.2898 1.4700
6.3.1 Crystallographic Structure
The XRD pattern analysis identifies the crystallographic structure of the produced
powder. XRD spectra of the powder produced were reproduced in the same scale on one graph
for comparison (Figure 23). It was noticed that a mixture of anatase and rutile crystal structure
was obtained in all cases. Characteristic peaks at 2θ of 25.3° and 27.5° represent strongest

Xiaohong Liao, M. Eng. Thesis
55
reflection of the anatase and rutile phases, respectively. Peak heights indicate the phase ratio
semi-quantitatively.
The peak pattern of our sample is very similar to Degussa P25. The different peaks were
marked by the vertical dashed lines in Figure 23. The 1st, 3
rd and 4
th lines are the rutile peaks,
which missed in Degussa P25 and showed up in all plasma produced samples. The 2nd
line is also
a rutile peak. It showed up in Degussa P25, but missed in our samples. This could due to the
different synthesis methods resulting in different defects, which are detectable by XRD. An
example is that the XRD spectrum of the natural occurring rutile is different from that of
synthesized rutile.
Figure 23: XRD spectra of products compared with P25.
The peak list of the powder produced in run xl-19 was shown in Figure 24 as an example.
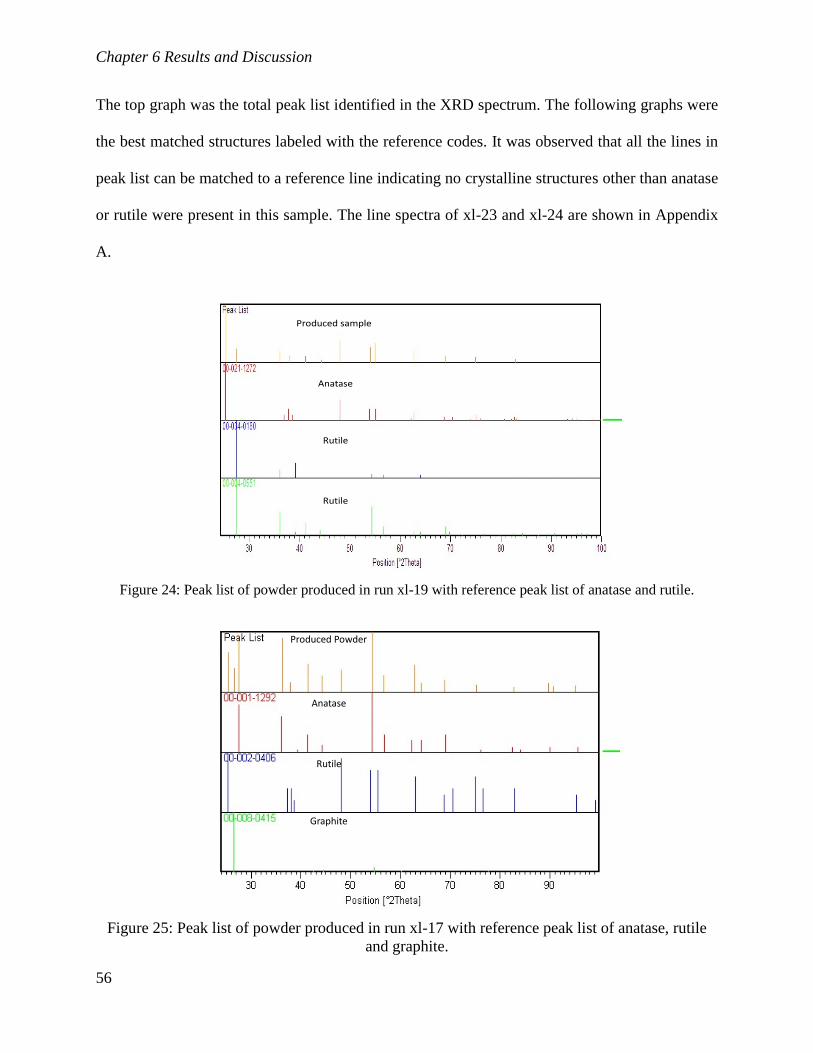
Chapter 6 Results and Discussion
56
The top graph was the total peak list identified in the XRD spectrum. The following graphs were
the best matched structures labeled with the reference codes. It was observed that all the lines in
peak list can be matched to a reference line indicating no crystalline structures other than anatase
or rutile were present in this sample. The line spectra of xl-23 and xl-24 are shown in Appendix
A.
Anatase
Rutile
Rutile
Produced sample
Figure 24: Peak list of powder produced in run xl-19 with reference peak list of anatase and rutile.
Produced Powder
Anatase
Rutile
Graphite
Figure 25: Peak list of powder produced in run xl-17 with reference peak list of anatase, rutile
and graphite.

Xiaohong Liao, M. Eng. Thesis
57
It is noticed that for run xl-17 and xl-20, a small peak was observed around 26.5˚
indicating graphite contamination as shown in Figure 23 and Figure 25. This is also consistent
with lower peak height of our sample than that of P25, indicating less crystals in the sample.
The background of XRD spectrum for each sample was much higher than that of Degussa
P25, which probably indicates some amorphous contents in the sample. A detailed discussion is
in the elemental composition analysis section.
6.3.3 Particle Size Analysis
There are several ways to analyze the particle size and distribution of a powder. Due to
the different theories, the particle sizes obtained are expected to be slightly different from
different measurement techniques. Since our TiO2 particles were not necessarily single crystals,
XRD can only provide us an indication of the smallest crystal present in the sample.
BET measurement enables us to calculate the average particle size based on a relatively
large sample. The larger sampling scale yields a closer representation of the real sample
properties. However, BET analysis cannot distinguish TiO2 particles from the contaminants. The
average particle size is directly influenced by the particle size of contaminants. Summarized
particle sizes obtained from XRD and BET measurements with its deviation can be found in
Table 3.
Fortunately, TEM image provides us another method to study the particle size
distribution. Size distribution may be obtained by counting particles in the TEM image. Also, the
TEM image was able to distinguish contamination from TiO2 by shape, particle darkness
(reflecting density of material) and particle aggregation. Confirmed contaminations can be
excluded from the calculation.( The results will be discussed in Section6.3.3.3.)
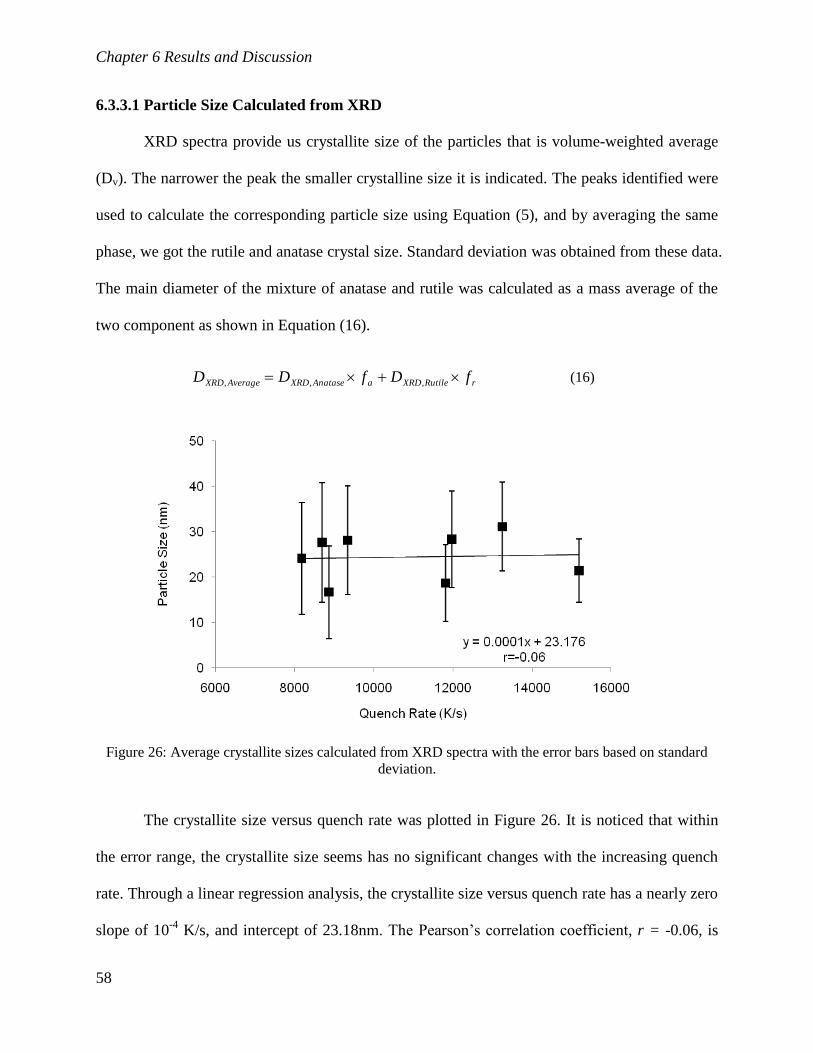
Chapter 6 Results and Discussion
58
6.3.3.1 Particle Size Calculated from XRD
XRD spectra provide us crystallite size of the particles that is volume-weighted average
(Dv). The narrower the peak the smaller crystalline size it is indicated. The peaks identified were
used to calculate the corresponding particle size using Equation (5), and by averaging the same
phase, we got the rutile and anatase crystal size. Standard deviation was obtained from these data.
The main diameter of the mixture of anatase and rutile was calculated as a mass average of the
two component as shown in Equation (16).
rRutileXRDaAnataseXRDAverageXRD fDfDD ,,, (16)
Figure 26: Average crystallite sizes calculated from XRD spectra with the error bars based on standard
deviation.
The crystallite size versus quench rate was plotted in Figure 26. It is noticed that within
the error range, the crystallite size seems has no significant changes with the increasing quench
rate. Through a linear regression analysis, the crystallite size versus quench rate has a nearly zero
slope of 10-4
K/s, and intercept of 23.18nm. The Pearson‟s correlation coefficient, r = -0.06, is
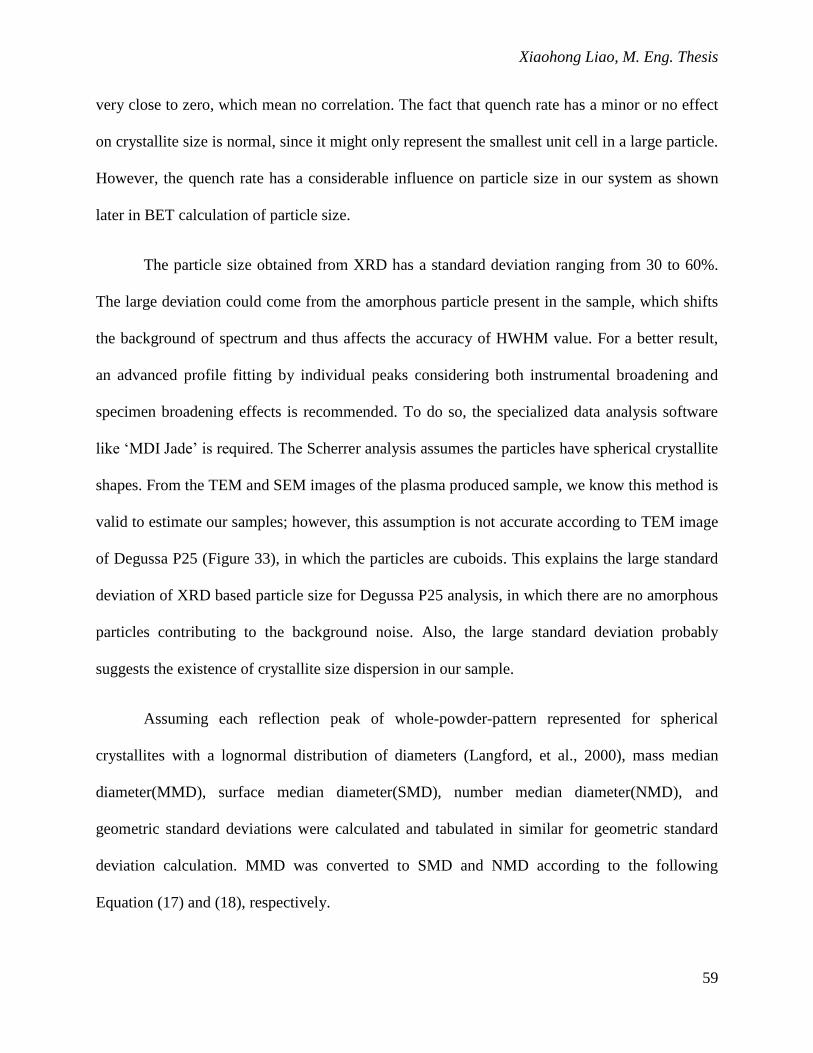
Xiaohong Liao, M. Eng. Thesis
59
very close to zero, which mean no correlation. The fact that quench rate has a minor or no effect
on crystallite size is normal, since it might only represent the smallest unit cell in a large particle.
However, the quench rate has a considerable influence on particle size in our system as shown
later in BET calculation of particle size.
The particle size obtained from XRD has a standard deviation ranging from 30 to 60%.
The large deviation could come from the amorphous particle present in the sample, which shifts
the background of spectrum and thus affects the accuracy of HWHM value. For a better result,
an advanced profile fitting by individual peaks considering both instrumental broadening and
specimen broadening effects is recommended. To do so, the specialized data analysis software
like „MDI Jade‟ is required. The Scherrer analysis assumes the particles have spherical crystallite
shapes. From the TEM and SEM images of the plasma produced sample, we know this method is
valid to estimate our samples; however, this assumption is not accurate according to TEM image
of Degussa P25 (Figure 33), in which the particles are cuboids. This explains the large standard
deviation of XRD based particle size for Degussa P25 analysis, in which there are no amorphous
particles contributing to the background noise. Also, the large standard deviation probably
suggests the existence of crystallite size dispersion in our sample.
Assuming each reflection peak of whole-powder-pattern represented for spherical
crystallites with a lognormal distribution of diameters (Langford, et al., 2000), mass median
diameter(MMD), surface median diameter(SMD), number median diameter(NMD), and
geometric standard deviations were calculated and tabulated in similar for geometric standard
deviation calculation. MMD was converted to SMD and NMD according to the following
Equation (17) and (18), respectively.

Chapter 6 Results and Discussion
60
gNMDMMD 2ln3lnln (17)
gNMDSMD 2ln2lnln (18)
The sequence of median size always follow MMD > SMD > NMD.
The relationship of MMD versus quench rate was plotted in Figure 27. Pearson‟s
correlation coefficient is 0.13 suggesting very weak correlation between quench rate and
crystallite size.
Figure 27: Crystallite size of the samples versus quench rate with geometric standard deviation.
It is of interest to notice that in Table 4, geometric standard deviations for all the runs are
close to 1.60nm except xl-18 and xl-22. This observation is consistent with size distribution
computed from TEM number diameter in which σg is 1.62nm. This might suggest that the
previous assumption is valid; the crystallite size obeys the lognormal distribution as the particle
size for plasma produced titania. From the Table 4, comparing group xl-23/xl-21 and group xl-
19/xl-24, it is noticed that with the same quench air flow rate and a similar quench rate the
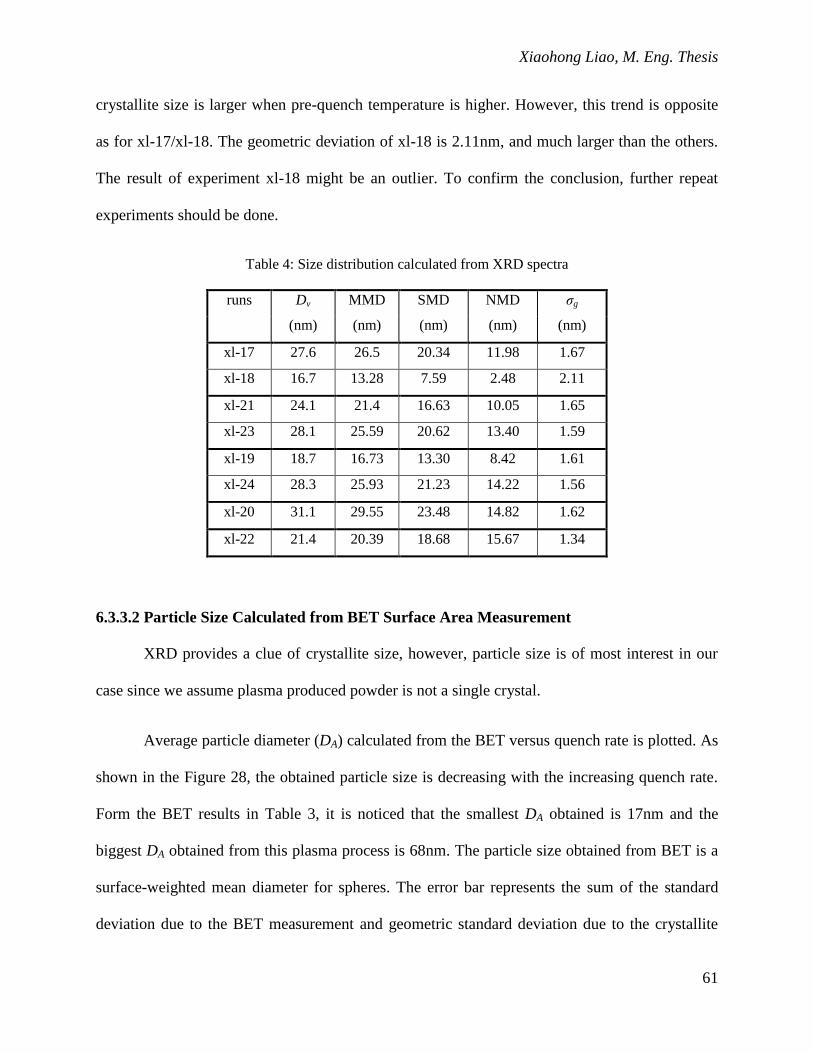
Xiaohong Liao, M. Eng. Thesis
61
crystallite size is larger when pre-quench temperature is higher. However, this trend is opposite
as for xl-17/xl-18. The geometric deviation of xl-18 is 2.11nm, and much larger than the others.
The result of experiment xl-18 might be an outlier. To confirm the conclusion, further repeat
experiments should be done.
Table 4: Size distribution calculated from XRD spectra
runs Dv MMD SMD NMD σg
(nm) (nm) (nm) (nm) (nm)
xl-17 27.6 26.5 20.34 11.98 1.67
xl-18 16.7 13.28 7.59 2.48 2.11
xl-21 24.1 21.4 16.63 10.05 1.65
xl-23 28.1 25.59 20.62 13.40 1.59
xl-19 18.7 16.73 13.30 8.42 1.61
xl-24 28.3 25.93 21.23 14.22 1.56
xl-20 31.1 29.55 23.48 14.82 1.62
xl-22 21.4 20.39 18.68 15.67 1.34
6.3.3.2 Particle Size Calculated from BET Surface Area Measurement
XRD provides a clue of crystallite size, however, particle size is of most interest in our
case since we assume plasma produced powder is not a single crystal.
Average particle diameter (DA) calculated from the BET versus quench rate is plotted. As
shown in the Figure 28, the obtained particle size is decreasing with the increasing quench rate.
Form the BET results in Table 3, it is noticed that the smallest DA obtained is 17nm and the
biggest DA obtained from this plasma process is 68nm. The particle size obtained from BET is a
surface-weighted mean diameter for spheres. The error bar represents the sum of the standard
deviation due to the BET measurement and geometric standard deviation due to the crystallite

Chapter 6 Results and Discussion
62
size dispersion, assuming particle size follows the same distribution as crystallite size. The
decreasing average particle size was observed with the increasing quench rate, as the quench rate
larger than 10 000 K/s. At the lower quench rate region, a rather random distribution was
observed; however, the particle sizes in this region in spite of everything are greater than that in
high quench rate region. The Pearson‟s correlation coefficient for quench rate and average
particle size is -0.82 suggesting a strong negative correlation. However, no conclusion should be
made based on so few data. Further repeated experiments are necessary to investigate the
relationship between quench rate and particle size.
Figure 28: Average particle size based on BET measurement with deviation (sum of measurement error
and geometric standard deviation).
6.3.3.3 Particle Size Obtained from TEM analysis
To confirm the assumption of lognormal distribution for the particle size, TEM analysis
was performed. Figure 29 is the images taken from the two sites of sample xl-24 with
magnification of 22 000X and 16 500 X of a) and b), respectively. These images are used to
Xiaohong Liao, M. Eng. Thesis
63
count the particles. The total number of 660 particles was counted. The average particle size is
31.6nm with the standard deviation of 16.2nm.
Figure 29: TEM images used for particle size calculation (a) Mag. 122 000X (b) Mag. 162 000X.
The size distribution data obtained from TEM were fitted by a lognormal function in
Figure 30. From the particle distribution histogram, it is shown that particles were primarily
distributed in the range of 10nm to 40nm (71.5%). Less than 2.5% of the particles were smaller
than 10nm; and less than 4% of the particles were greater than 100nm. The largest particle found
in this sample was 283. 3nm, the smallest particles found in this sample was 6.59nm.
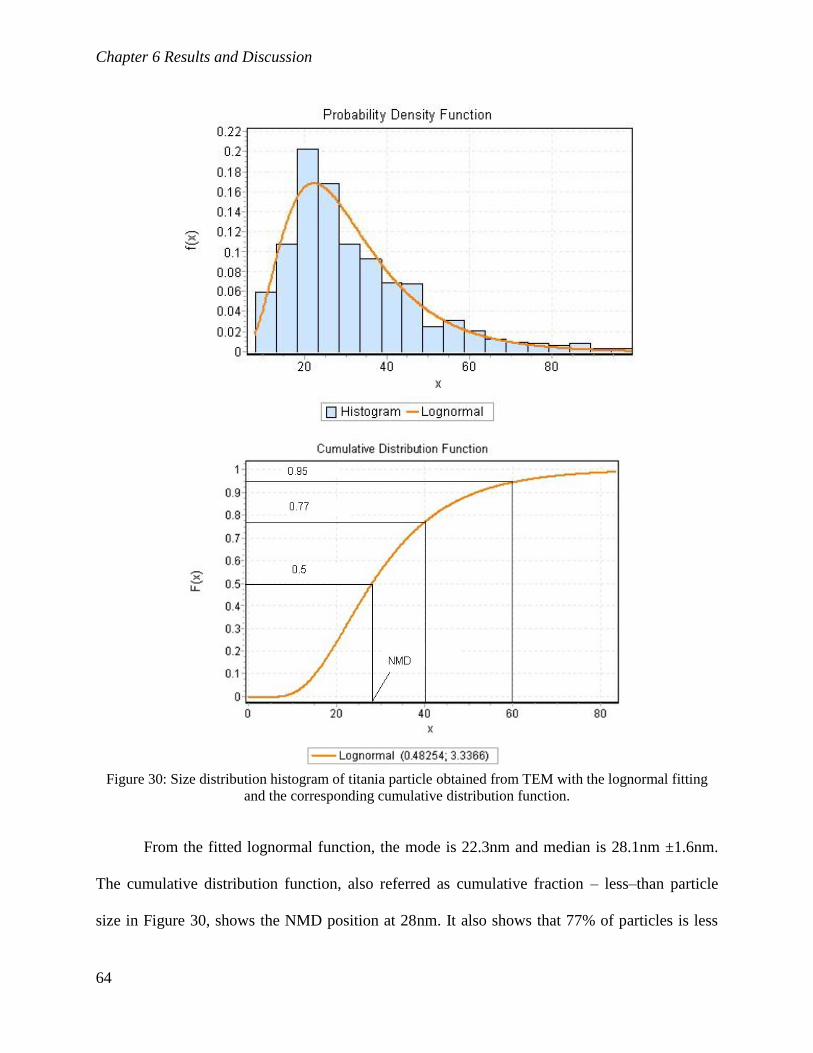
Chapter 6 Results and Discussion
64
Figure 30: Size distribution histogram of titania particle obtained from TEM with the lognormal fitting
and the corresponding cumulative distribution function.
From the fitted lognormal function, the mode is 22.3nm and median is 28.1nm ±1.6nm.
The cumulative distribution function, also referred as cumulative fraction – less–than particle
size in Figure 30, shows the NMD position at 28nm. It also shows that 77% of particles is less

Xiaohong Liao, M. Eng. Thesis
65
than 40nm and 95% of particles is less than 60nm. The parameters denoted μ and σ, are the mean
and standard deviation of the variable‟s natural logarithm, are 3.3366 and 0.48254, respectively.
It is noticed that the geometric standard deviation obtained from TEM is 1.6nm and from XRD
line fitting is 1.56nm. The NMD, SMD and MMD obtained from TEM, are 28.1nm, 44.76nm
and 56.48nm; from XRD spectrum are 14.22nm, 21.23nm, and 25.93nm, respectively. The
different results show the difference of crystallite size and particle size, the particle size is almost
double the crystallite size. The closely related geometric standard deviations for two analyses
suggest that the particle size and crystallite size follow the same distribution pattern.
Table 5: Comparison of diameter calculated from TEM and XRD particle size analysis
Analysis Method MMD (nm) SMD (nm) NMD (nm) σg(nm)
TEM 56.48 44.76 28.10 1.62
XRD 25.93 21.23 14.22 1.56
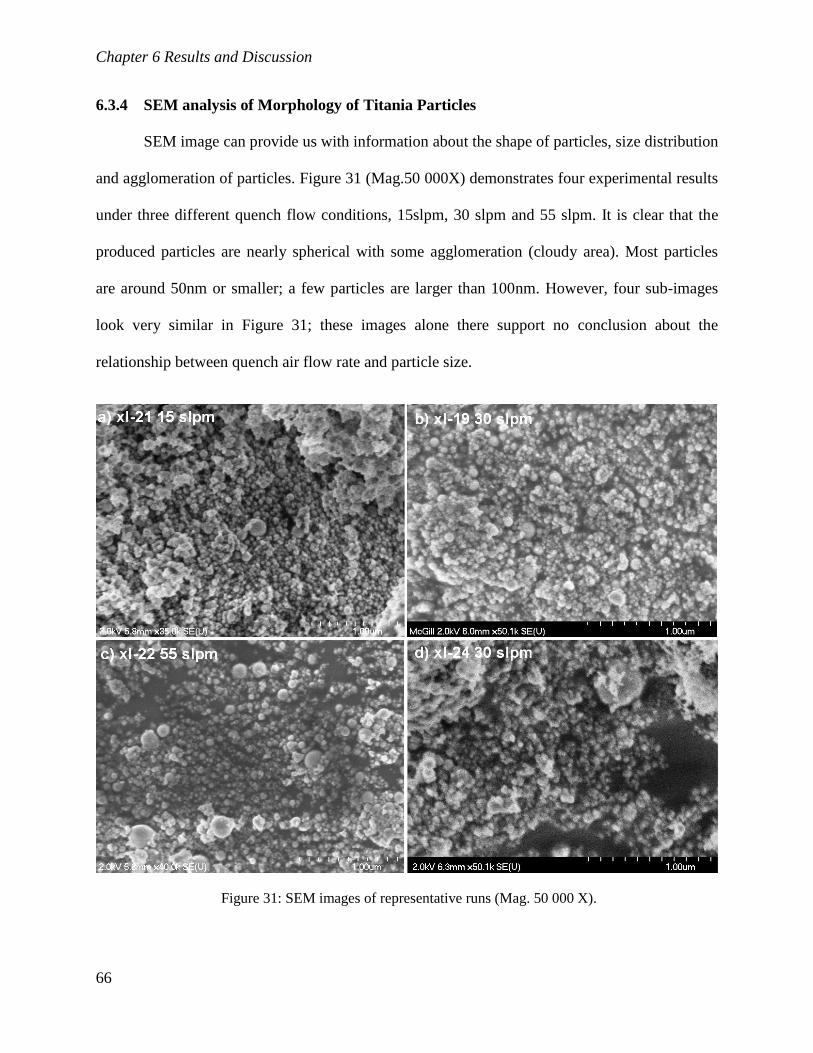
Chapter 6 Results and Discussion
66
6.3.4 SEM analysis of Morphology of Titania Particles
SEM image can provide us with information about the shape of particles, size distribution
and agglomeration of particles. Figure 31 (Mag.50 000X) demonstrates four experimental results
under three different quench flow conditions, 15slpm, 30 slpm and 55 slpm. It is clear that the
produced particles are nearly spherical with some agglomeration (cloudy area). Most particles
are around 50nm or smaller; a few particles are larger than 100nm. However, four sub-images
look very similar in Figure 31; these images alone there support no conclusion about the
relationship between quench air flow rate and particle size.
Figure 31: SEM images of representative runs (Mag. 50 000 X).

Xiaohong Liao, M. Eng. Thesis
67
c) Xl19 30 slpm
a) Xl21 15 slpm b) Xl17 20 slpm
d) Xl22 55 slpm
Figure 32: SEM images of representative runs (Mag. 110 000 X).
Figure 32 shows the images observed under high magnification (Mag. 110 000X). The
four quench air flow rates were 15, 20, 30 and 55 slpm, respectively. Compared with previous
Figure 31, we observe more details of small particles. The sphericity of particles is nearly
complete and particles are distinguishable. There is no sign of strong sintering. It is clear that in
Figure 32 (c) and (d) images contain more particles less than 50nm than that in (a) and (b)
images. No particle is greater than 100nm due to the smaller view of high magnification.
6.3.5 TEM analysis of Morphology of Titania Particles
Since our particles are normally smaller than 100nm, TEM analysis with high resolution
(down to 5nm) is helpful to observe more details of the particle morphology. In Figure 33, the
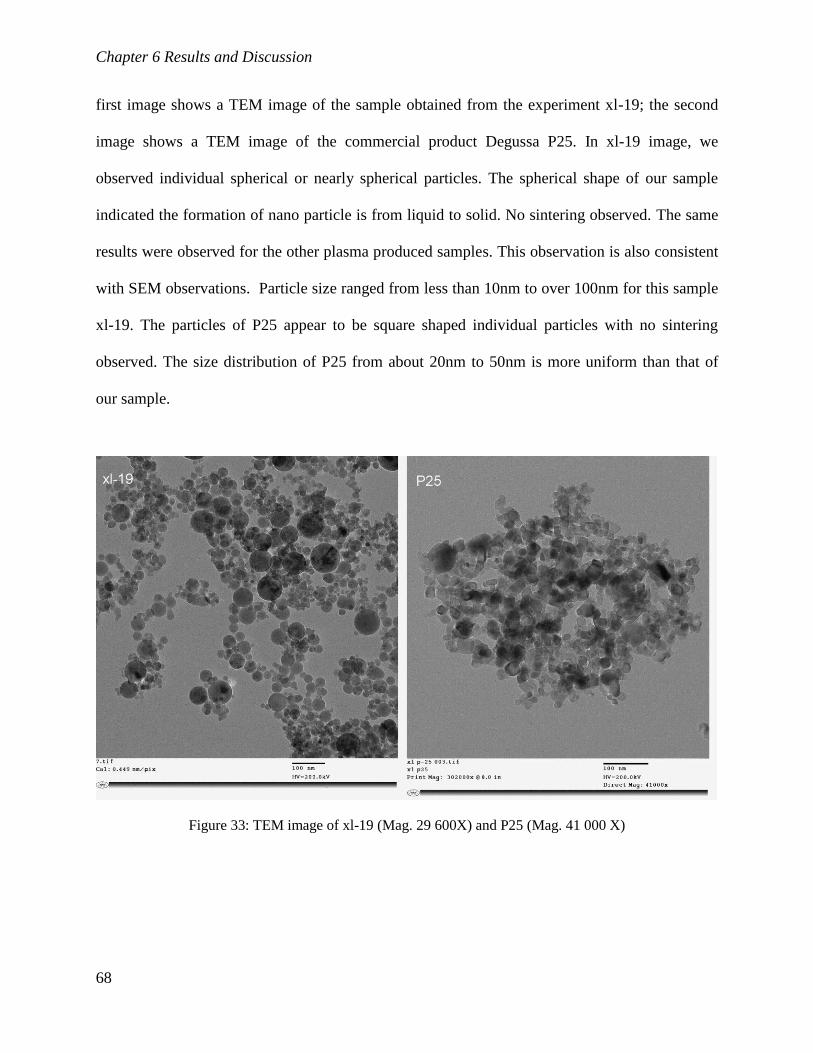
Chapter 6 Results and Discussion
68
first image shows a TEM image of the sample obtained from the experiment xl-19; the second
image shows a TEM image of the commercial product Degussa P25. In xl-19 image, we
observed individual spherical or nearly spherical particles. The spherical shape of our sample
indicated the formation of nano particle is from liquid to solid. No sintering observed. The same
results were observed for the other plasma produced samples. This observation is also consistent
with SEM observations. Particle size ranged from less than 10nm to over 100nm for this sample
xl-19. The particles of P25 appear to be square shaped individual particles with no sintering
observed. The size distribution of P25 from about 20nm to 50nm is more uniform than that of
our sample.
Figure 33: TEM image of xl-19 (Mag. 29 600X) and P25 (Mag. 41 000 X)

Xiaohong Liao, M. Eng. Thesis
69
Figure 34: TEM image of sample xl-23 and xl-24 (Mag. 380 000X).
The TEM image of Figure 34 shows the lattice spacing of particles. From the xl-23 image,
we noticed grooves on the particle indicating the orientation of crystalline growth and the whole
particle is crystallized. The xl-24 image marked 10 lattice distances of 3.78 and 3.79nm
corresponding to 10 fold of lattice constant of anatase phase a = 3.7845Å (Ana11). At the same
time, not all the small particles appear to be crystallized; some parts of the small particles are
amorphous. This is consistent with the elemental composition analysis in the later section. The
small particles (Dia.< 20nm) consist not only of titania but also of other impurities like Si, C and
P, which structure is amorphous.
6.3.6 Elemental Composition Analysis
6.3.6.1 SEM-EDS Analysis
Elemental composition analysis was performed on SEM-EDS for selected samples. Each
sample was mapped over the whole captured area in SEM electron image unless otherwise
Chapter 6 Results and Discussion
70
specified. Qualitative and quantitative results were present here. However, it is worth to mention
that because the sample surface was not polished; the obtained results are at best semi-
quantitative. The accuracy of SEM-EDS for particles, with rough surface is ±50% relative.
Therefore, for a qualitative analysis using SEM-EDS, the identification of the major constituents
of a sample can usually be done with a high degree of confidence, but, when minor (1-10%) or
trace-level (<1%) elements are considered, errors in peak assignments can arise unless careful
attention is paid to the problems of spectral interferences, artifacts, and the multiplicity of
spectral peaks observed for elements of intermediate and high atomic number (Goldstein, et al.,
2003).
Taking produced sample powder xl-24 as an example, Figure 35, Figure 36 and Figure 37
show the mapping results of the different sites, sub-images (A) (B) (C) and (D) show the SEM
electron image for mapping, sum spectrum, quantitative table of elements, and graph of
quantitative result plotted in weight percent, respectively. In sub-image (A), the particles in the
SEM are shown in white and gray, the black region was the background of the carbon tape. The
bright region is due to the charge built up on the surface of TiO2 particles. It is noticed that
different sites of the same sample xl-24 have different compositions of contaminations. Ti, O, C,
Si, and P are found in all sites. Site 1 has V and W; site 2 has V; site 3 has no contamination of V
and W at all. Assuming the Si and P contaminants are oxides, the rough ratio of compound SiO2:
P2O5: TiO2 are 2:3:10, 1:2:20 and 2:3:11 for site 1, site 2 and site 3, respectively. All the results
show that Ti and O are the dominant elements; P contamination is slightly higher than Si.
In Figure 37 (A), the sub-images in (A) show the maps of Ti, P and Si ions together with
those of O and C. This figure revealed that while Ti, P, Si, and O are distributed equally on the
selected area, C appears to show a weak signal. This might indicate that the C influence of

Xiaohong Liao, M. Eng. Thesis
71
carbon tape is limited to a minimum by choosing this thick powder covered region.
Contaminant Si and P probably originate from the insulation layer - refractory material
since both of them are found in the SEM-EDS spectrum, as shown in Figure B-2 in Appendix B.
Although a high purity alumina layer was inserted between the graphite felt and silica/alumina
refractory layer to limit the contamination, silica/alumina refractory is possibly exposed to the
high temperature gas at the opening sites of the reactor, for instance, the top of reactor graphite
chamber (two openings for the torch and feeding tube), exit tube joint and observing window
joint. In addition the filter bag could be a source of contaminant Si, since the filter bag is made
of glass fiber (shown in Figure B-3 in Appendix B).
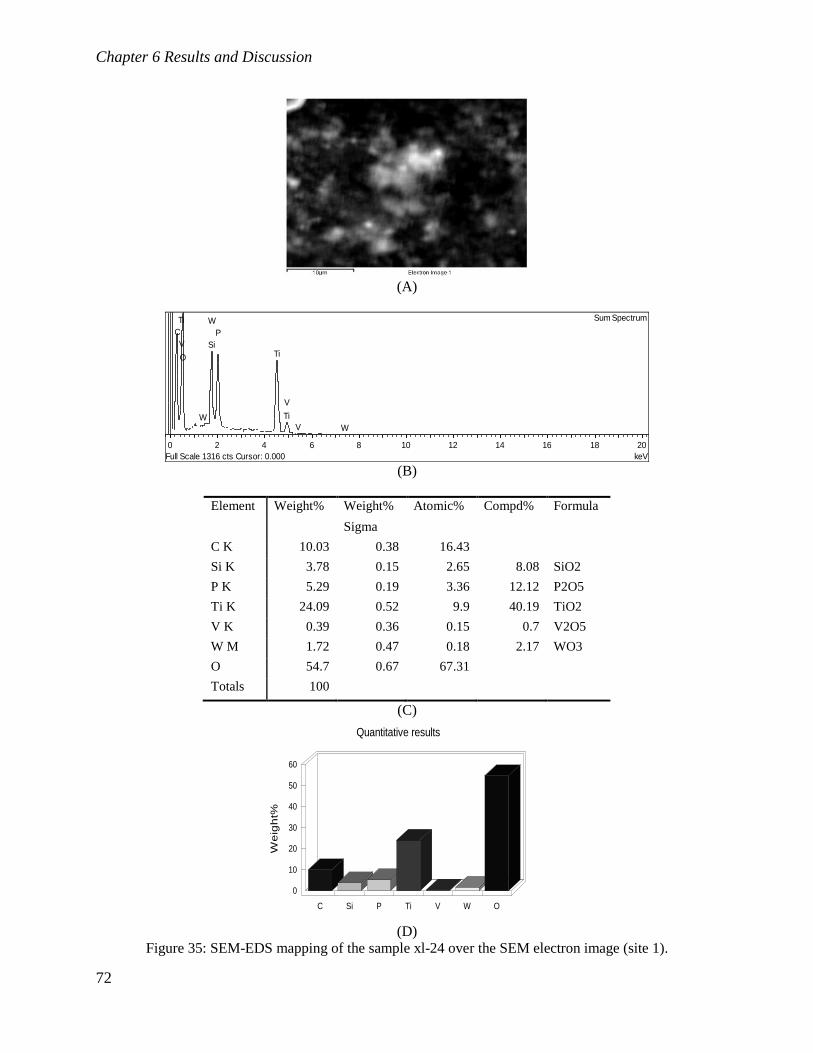
Chapter 6 Results and Discussion
72
(A)
WVW Ti
V
Ti
SiTi
P
W
C
V
O
0 2 4 6 8 10 12 14 16 18 20
keVFull Scale 1316 cts Cursor: 0.000
Sum Spectrum
(B)
Element Weight% Weight% Atomic% Compd% Formula
Sigma
C K 10.03 0.38 16.43
Si K 3.78 0.15 2.65 8.08 SiO2
P K 5.29 0.19 3.36 12.12 P2O5
Ti K 24.09 0.52 9.9 40.19 TiO2
V K 0.39 0.36 0.15 0.7 V2O5
W M 1.72 0.47 0.18 2.17 WO3
O 54.7 0.67 67.31
Totals 100
(C)
Quantitative results
We
igh
t%
0
10
20
30
40
50
60
C Si P Ti V W O
(D)
Figure 35: SEM-EDS mapping of the sample xl-24 over the SEM electron image (site 1).

Xiaohong Liao, M. Eng. Thesis
73
(A)
V
Ti
VSi
P
Ti
C
V
O
Ti
0 2 4 6 8 10 12 14 16 18 20
keVFull Scale 1784 cts Cursor: 0.000
Sum Spectrum
(B)
Element Weight% Weight% Atomic% Compd% Formula
Sigma
C K 7.74 0.27 13.60
Si K 1.61 0.09 1.21 3.44 SiO2
P K 2.68 0.12 1.82 6.13 P2O5
Ti K 36.95 0.50 16.28 61.64 TiO2
V K 0.24 0.35 0.10 0.42 V2O5
O 50.78 0.53 66.99
Totals 100.00
(C)
Quantitative results
We
igh
t%
0
10
20
30
40
50
60
C Si P Ti V O
(D)
Figure 36: SEM-EDS mapping of the sample xl-24 over the SEM electron image (site 2).
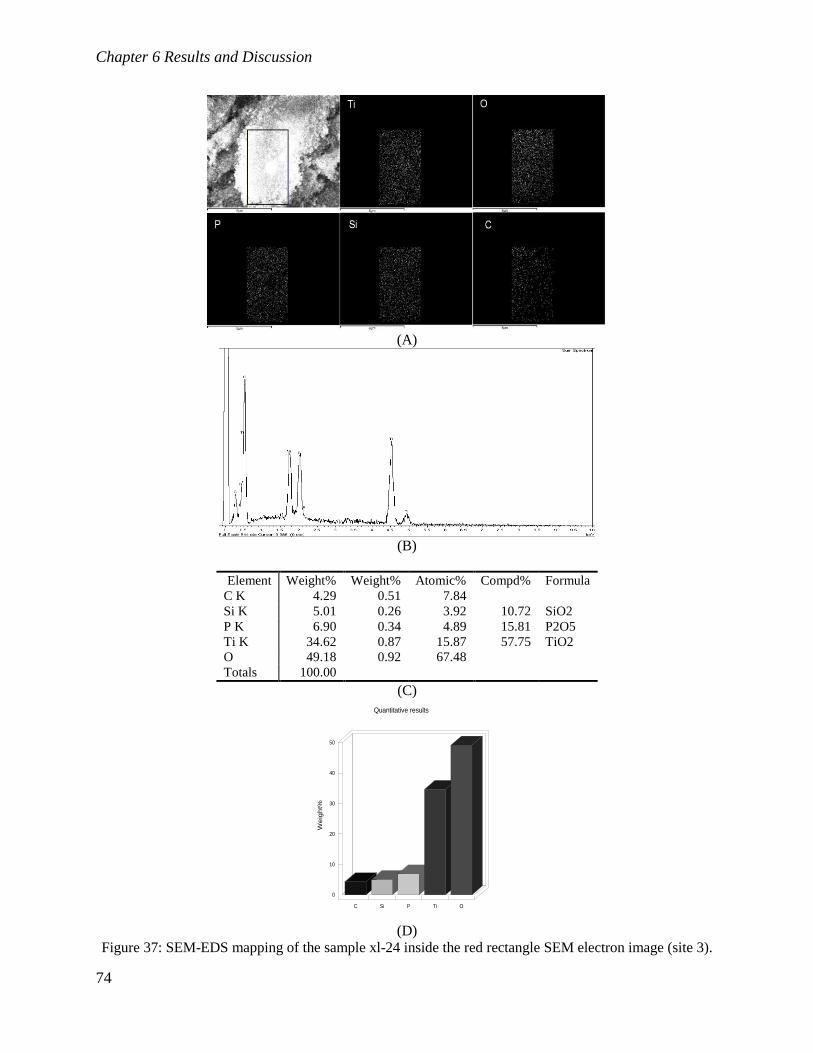
Chapter 6 Results and Discussion
74
(A)
(B)
Element Weight% Weight% Atomic% Compd% Formula
C K 4.29 0.51 7.84
Si K 5.01 0.26 3.92 10.72 SiO2
P K 6.90 0.34 4.89 15.81 P2O5
Ti K 34.62 0.87 15.87 57.75 TiO2
O 49.18 0.92 67.48
Totals 100.00
(C)
Quantitative results
We
igh
t%
0
10
20
30
40
50
C Si P Ti O
(D)
Figure 37: SEM-EDS mapping of the sample xl-24 inside the red rectangle SEM electron image (site 3).
Xiaohong Liao, M. Eng. Thesis
75
Contaminant V may originate from the starting raw material as shown Figure B-1 in
Appendix B. It may also be possible that the material identified as V was due to software error
and not really present in the sample, as the V(Kα) emission line (4.9 KeV) actually overlaps with
the Ti(Kβ) emission line (4.9 KeV), the V(Kβ) (5.4 KeV) is buried in the background as shown in
sub-image (B). Overlap peaks in the low energy region are even harder to resolve and to
distinguish from element to element. W was likely from the tungsten tip of the torch, this is
consistent with the observation of slight damage of the torch tip after each experiment. Since
carbon tape was used as the adhesive media for the sample, the semi-quantitative result is not
representative for carbon. Nevertheless, carbon was found in the sample when analyzing with
TEM-EDS using the copper grid (Figure 38). The carbon contamination was from the graphite
parts of reactor.
For the samples collected by inline filter cartridge, we observed contaminations of Ca, Al,
Fe and K (shown in Figure B-6 in Appendix B). Ca may originate from the raw material or filter
cartridge (Figure B-1, Figure B-4 in Appendix B), since Ca was identified in both materials. The
source of K was from the filter cartridge. Al was from the insulation and/or the filter cartridge.
6.3.6.2 TEM-EDS Analysis
The elemental composition of selected samples was also analyzed using the TEM-EDS
technique. In each sample several random sites were selected to determine the elemental
composition. The typical results show five elements in a sample, Ti, O, C, Si, and P. Taking the
sample xl-23 as an example in Figure 38, two extreme regions were selected to distinguish titania
from contaminates, the large particle (>100nm) region and small particle (<20nm) region. The
minimum probe diameter of the detector was 20nm; therefore, a single particle elemental
composition could be identified for a large particle. In Figure 38, two different EDS spectra were
Chapter 6 Results and Discussion
76
shown with the region A and region B in the TEM image of sample xl-23, respectively. In
spectrum A, the characteristic peaks of Ti(Kα) and Ti(Kβ) appear between 4.10 -5.10 keV
confirming the presence of titanium in the sample; the oxygen peak appears around 0.5 keV
confirming the presence of oxygen; which means that the large particle is titanium oxide. This
was corroborated by the lattice structure observed in TEM image (Figure 34) and XRD spectrum
result (Figure 23). In the TEM image of sample xl-23, the lattice spacing was very obvious; and
in the XRD spectrum of sample xl-23, the only crystalline material present was TiO2. The copper
peaks originated from the copper grid used to support the sample. The trace silicon peak is
negligible. It is either originated from the surroundings of the large particle; or from the Si
internal fluorescence peak. Si peak may be present to an apparent level of 0.2 wt% even though
there is no Si in the sample under examination (Lyman, et al., 1988).
In spectrum B, except for the strong copper peaks originating from the copper grid,
characteristic peaks for C, Si, P and Ti were present, similar to Figure 36. It shows that small
particles were contaminated by C, Si, and P.
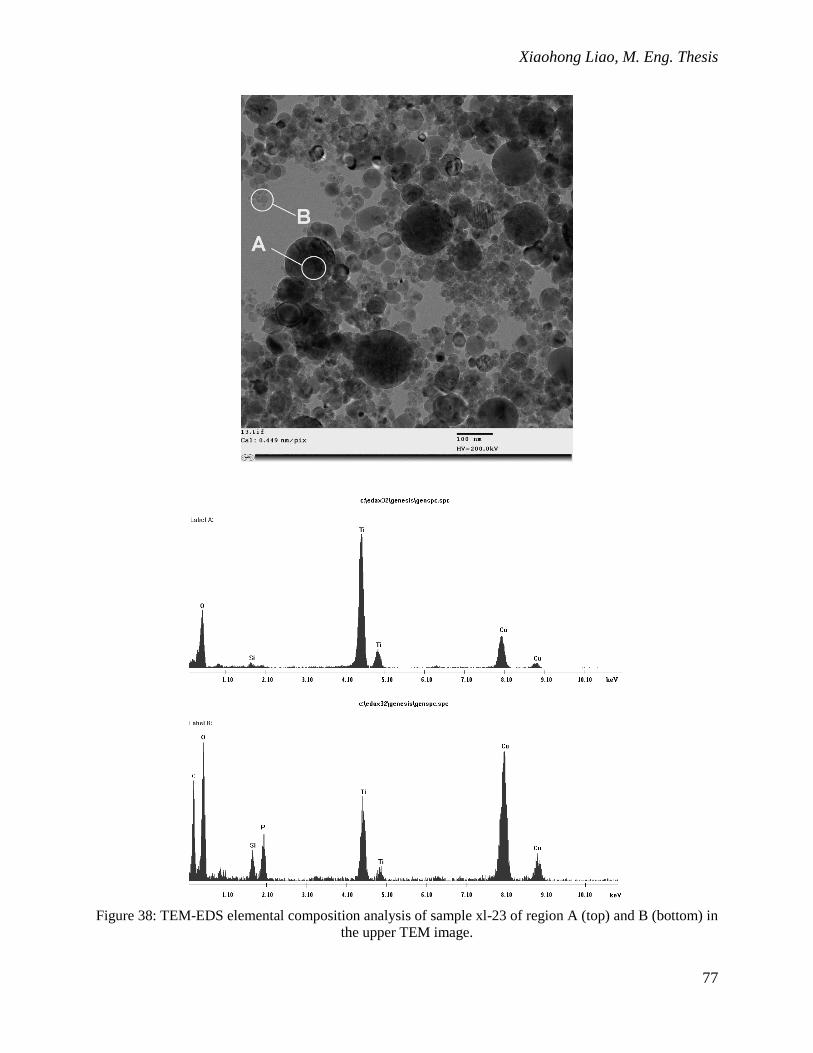
Xiaohong Liao, M. Eng. Thesis
77
Figure 38: TEM-EDS elemental composition analysis of sample xl-23 of region A (top) and B (bottom) in
the upper TEM image.
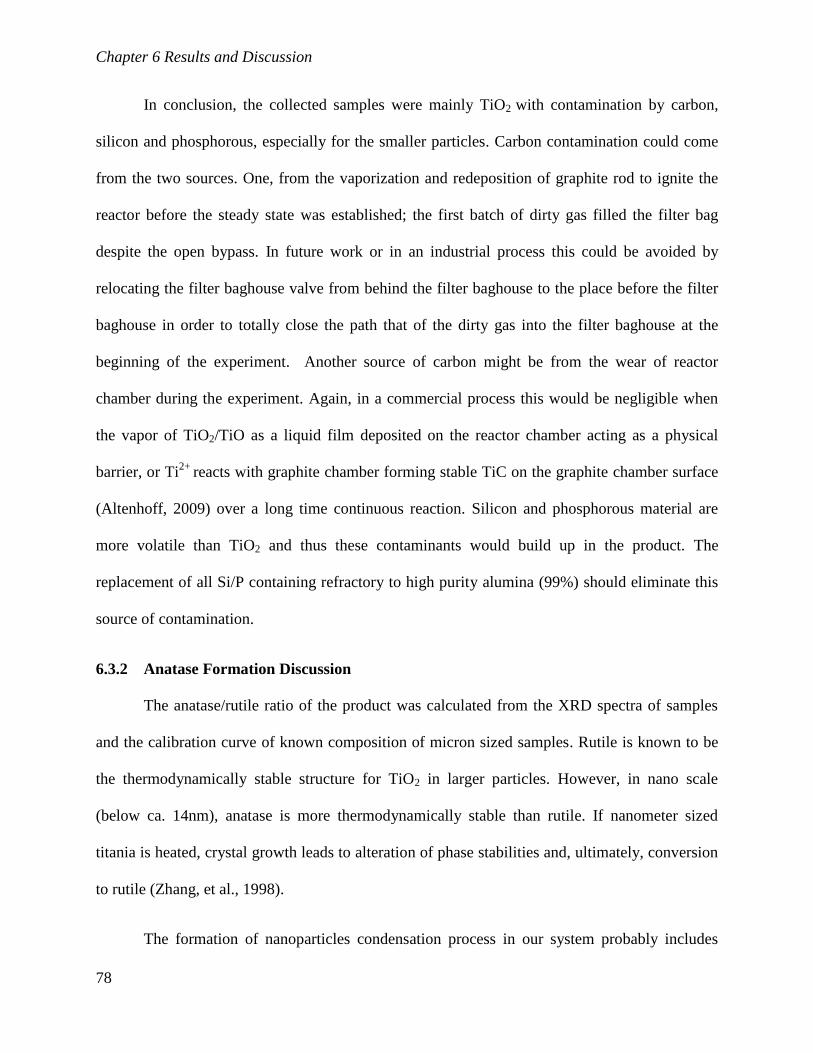
Chapter 6 Results and Discussion
78
In conclusion, the collected samples were mainly TiO2 with contamination by carbon,
silicon and phosphorous, especially for the smaller particles. Carbon contamination could come
from the two sources. One, from the vaporization and redeposition of graphite rod to ignite the
reactor before the steady state was established; the first batch of dirty gas filled the filter bag
despite the open bypass. In future work or in an industrial process this could be avoided by
relocating the filter baghouse valve from behind the filter baghouse to the place before the filter
baghouse in order to totally close the path that of the dirty gas into the filter baghouse at the
beginning of the experiment. Another source of carbon might be from the wear of reactor
chamber during the experiment. Again, in a commercial process this would be negligible when
the vapor of TiO2/TiO as a liquid film deposited on the reactor chamber acting as a physical
barrier, or Ti2+
reacts with graphite chamber forming stable TiC on the graphite chamber surface
(Altenhoff, 2009) over a long time continuous reaction. Silicon and phosphorous material are
more volatile than TiO2 and thus these contaminants would build up in the product. The
replacement of all Si/P containing refractory to high purity alumina (99%) should eliminate this
source of contamination.
6.3.2 Anatase Formation Discussion
The anatase/rutile ratio of the product was calculated from the XRD spectra of samples
and the calibration curve of known composition of micron sized samples. Rutile is known to be
the thermodynamically stable structure for TiO2 in larger particles. However, in nano scale
(below ca. 14nm), anatase is more thermodynamically stable than rutile. If nanometer sized
titania is heated, crystal growth leads to alteration of phase stabilities and, ultimately, conversion
to rutile (Zhang, et al., 1998).
The formation of nanoparticles condensation process in our system probably includes

Xiaohong Liao, M. Eng. Thesis
79
oxidation, nucleation, growth, particle coagulation and coalescence. The oxidation process
occurs simultaneously with the nucleation process; the quench gas (dry air) consists of 21%
oxygen. The high temperature (>1000°C) TiO gas stream encountered room temperature quench
gas and formed TiO2 through oxidation. At the same time, stable spherical nuclei (Mitchell, et al.,
2003) (Balthasar, et al., 2005) were also formed due to supercooling and supersaturation through
homogenous nucleation, and finally growth to the final particle size.
Studies showed that TiO2 is more stable as anatase at sizes under 14nm (Gribb, et al.,
1997) (Zhang, et al., 1998) and at the low temperature.Very likely, the initially formed stable
nuclei are anatase at the low quench temperature (~100-200°C); these then grew until
thermodynamic equilibrium is restored. TiO2 crystalline phase transition probably occurs during
the process of the restoration of thermodynamic equilibrium. Gribb et al demonstrated that the
pure anatase nano crystallites sample (~6nm, spherical particles) had 9.6% conversion to rutile
when held at 525.8 °C for 1.2h. As the residence time of quenching zone (from T1 to T3) is no
more 100ms (2.78×10⁻⁵
h), it is likely that the crystalline phase of nano TiO2 particles is formed
during the quench/mixing process; in other words, phase transformation occurs simultaneously
with nucleation depending on local thermodynamic and/or reaction equilibrium. No later
conversion from anatase to rutile or vice versa, once the particle stops growth.
As shown in Figure 39, there is little correlation between residence time and anatase
fraction of the TiO2 product (Pearson‟s correlation coefficient r = 0.55). At the residence time 69
ms, both high (0.71) and low (0.24) anatase fraction are observed. In this very short time range
(from 55 to 80ms), the anatase fraction is between 0.10 and 0.71.

Chapter 6 Results and Discussion
80
Figure 39: Anatase fraction of the product versus residence time.
The anatase fraction versus quench rate is plotted in Figure 40.There is weak correlation
(r = 0.34) within the studied quench rate range. Unfortunately, the experiments have no
replicates; several repeated experiments are useful to obtain valuable conclusions with the
consideration of system error. The error bars present in Figure 39 and Figure 40 is based on XRD
calculation error only.
Figure 40: Anatase fraction of the product versus quench rate of the system.
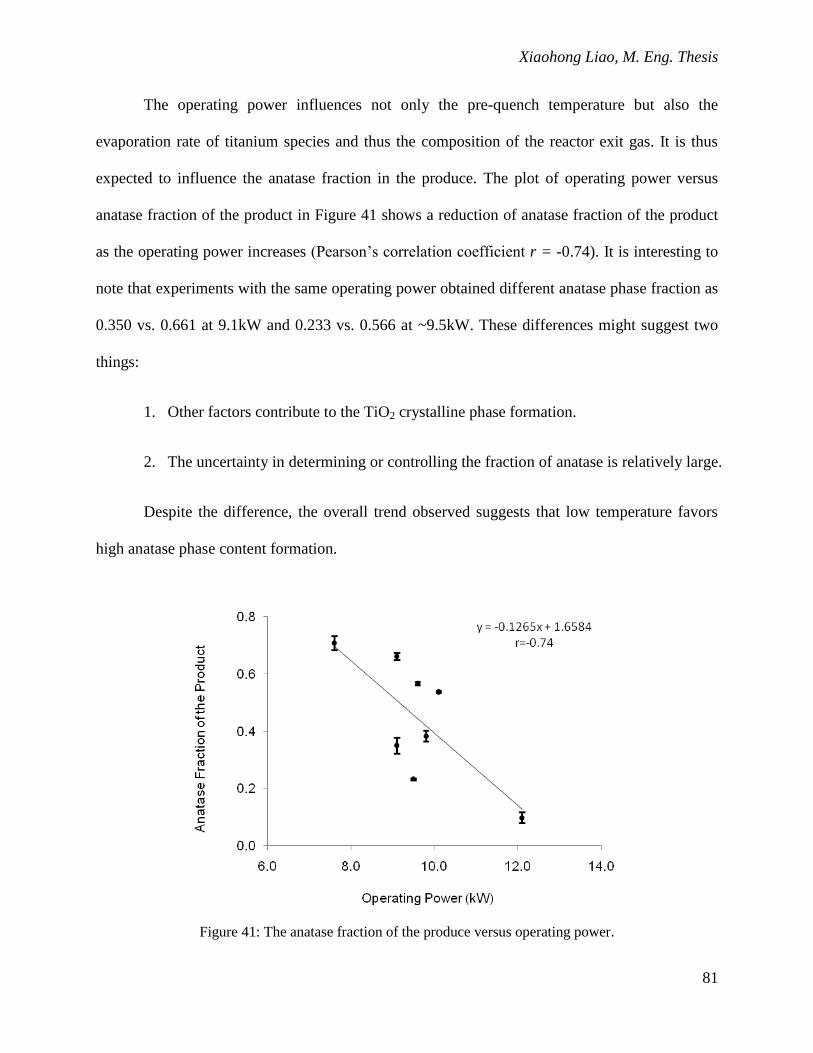
Xiaohong Liao, M. Eng. Thesis
81
The operating power influences not only the pre-quench temperature but also the
evaporation rate of titanium species and thus the composition of the reactor exit gas. It is thus
expected to influence the anatase fraction in the produce. The plot of operating power versus
anatase fraction of the product in Figure 41 shows a reduction of anatase fraction of the product
as the operating power increases (Pearson‟s correlation coefficient r = -0.74). It is interesting to
note that experiments with the same operating power obtained different anatase phase fraction as
0.350 vs. 0.661 at 9.1kW and 0.233 vs. 0.566 at ~9.5kW. These differences might suggest two
things:
1. Other factors contribute to the TiO2 crystalline phase formation.
2. The uncertainty in determining or controlling the fraction of anatase is relatively large.
Despite the difference, the overall trend observed suggests that low temperature favors
high anatase phase content formation.
Figure 41: The anatase fraction of the produce versus operating power.
Chapter 6 Results and Discussion
82
Comparing experiments xl-17 and xl-18 in Table 6, those with the same gas volume of
argon and quench air, 25slpm and 20slpm respectively, we found that the anatase fraction of xl-
18 is only 0.098 with 1286°C pre-quench temperature, very different from 0.35 with 1145.5°C
pre-quench temperature, the result of xl-17. The anatase fraction decreases with the increasing
pre-quench temperature at the same gas flow rate and quench flow rate. This trend can also be
obtained from other experiment groups with similar operation conditions, xl-19 and xl-24, xl-21
and xl-23, respectively.
With the same flow rate, high pre-temperature indicates large change of temperature. The
greater the supercooling, the smaller the critical nucleus size and the less energy required to form
it as shown in the following equations according to classic homogeneous nucleation theory
TH
Tr
S
m
12* (19)
22
23*
)(
1
3
16
TH
TmG
S
(20)
where *r is the critical radius, *G is the free energy formation of critical radius, is the surface
tension, mT is the melting temperature, SH is the enthalpy of sublimation, and T is the
change of temperature. These equations only provide us information of the relative ease of
homogenous nucleation and how small the critical radius could be with the increasing T . But,
how the change of temperature is connected with TiO2 crystalline phase formation and why the
lower temperature favors higher anatase content in the plasma synthesis process remain unclear.
The anatase-rutile transformation has been shown in the literature to be affected by processing
parameters like dopants and impurities (Okada, et al., 2001) (Chen, et al., 2007), atmosphere
(Gamboa, et al., 1992), particle size (Zhang, et al., 2007), and synthesis method (Iida, et al.,
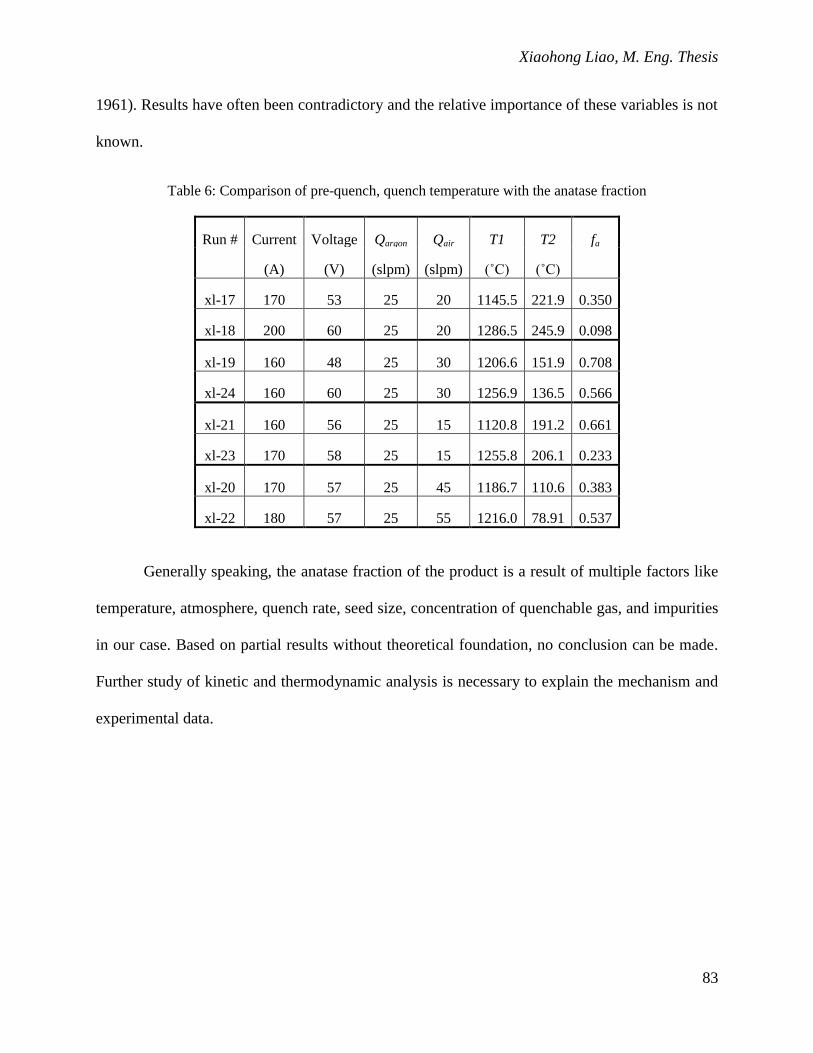
Xiaohong Liao, M. Eng. Thesis
83
1961). Results have often been contradictory and the relative importance of these variables is not
known.
Table 6: Comparison of pre-quench, quench temperature with the anatase fraction
Run # Current Voltage Qargon Qair T1 T2 fa
(A) (V) (slpm) (slpm) (˚C) (˚C)
xl-17 170 53 25 20 1145.5 221.9 0.350
xl-18 200 60 25 20 1286.5 245.9 0.098
xl-19 160 48 25 30 1206.6 151.9 0.708
xl-24 160 60 25 30 1256.9 136.5 0.566
xl-21 160 56 25 15 1120.8 191.2 0.661
xl-23 170 58 25 15 1255.8 206.1 0.233
xl-20 170 57 25 45 1186.7 110.6 0.383
xl-22 180 57 25 55 1216.0 78.91 0.537
Generally speaking, the anatase fraction of the product is a result of multiple factors like
temperature, atmosphere, quench rate, seed size, concentration of quenchable gas, and impurities
in our case. Based on partial results without theoretical foundation, no conclusion can be made.
Further study of kinetic and thermodynamic analysis is necessary to explain the mechanism and
experimental data.
Chapter 7 Conclusions
84
Chapter 7 Conclusions
The synthesis of nano titania using a laboratory scale transferred arc device with
continuous feed of TiO2 pellets feeding was studied: nanosized titania particles were successfully
synthesized. Through the XRD, BET, TEM, SEM, and EDS analysis, the following conclusion
could be made.
1. The obtained TiO2 particles are a polymorphous mixture of anatase and rutile. The
highest anatase fraction obtained is 0.708±0.024.
2. The highest surface area of the product TiO2 is 83.3 m2/g.
3. The TiO2 particles are individual spherical particles with NMD between 20-30nm.
4. TiO2 crystalline size is smaller than particle size for plasma produced powder.
5. The TiO2 particle size decreases as the quench rate increases; residence time has no
obvious influence on particle size in the range studied.
6. Size distribution of the crystallite size and particle size follows a log-normal distribution
with geometric standard deviation around 1.6nm.
7. The temperature, residence time and quench rate has very weak correlation on phase
content of anatase in the range studied.
8. The product was somewhat contaminated with C, Si and P which came from graphite rod
and refractory material. Due to the poor insulation of the laboratory device, large heat
losses and short reaction time limited the production rate. Much of the evaporated
material recondensed within the plasma chamber.

Xiaohong Liao, M. Eng. Thesis
85
The study has demonstrated the technical feasibility of the proposed process and has led
to suggestions for modifications to the equipment and process which will enhance the economic
viability.

Chapter 8 Suggestions for Future Work
86
Chapter 8 Suggestions for Future Work
The current device has the filter baghouse located before the bypass line, and the control
valve is after the baghouse. This setup allows transient exit gas to enter the baghouse during the
time in the run that the pressure is increasing, thus contaminating the filter bag. Reversing the
order of the bypass and baghouse and placing the control valve before the baghouse entrance
would solve this problem.
In our experiments, the collection system was normally bypassed for 45 min, and the
powder collecting time was normally 20-30 min. A large amount of material was consumed
during the steady state establishment stage; however, we have no idea about the system behavior
during this period. We could install an extra baghouse to collect the transient particles, which
could be useful to help us understand system behavior throughout the course and obtain
information like mass balance and reaction rate.
The quench zone has only a short length of water cooling region, to protect the filter bag
from high temperature damage; extra cooling air was injected before the hot gas stream entering
the baghouse. However, this injection of air increases the pressure of the baghouse/system and
limits the maximum quench air can be used is 55 slpm. It might necessary to extend water
cooling region to whole quench pipe. A cooling coil around the current quench pipe could
improve the operation with minimal changes. If no extra cooling air injected, the pressure change
of the baghouse or system was purely due to the TiO2 reaction system. Possible influence of
pressure with the product properties could be studied. Also, extreme condition with higher
quench air flow rate (up to 100 slpm) can be studied.

Xiaohong Liao, M. Eng. Thesis
87
In our experiments considerable raw material was evaporated but never reached the
quench zone of the tubular reactor; it condensed within the plasma chamber. Attempts should be
made to better insulate this chamber with suitable high temperature materials to increase the
material and thermal efficiency of powder production. This might be difficult in a small scale
laboratory reactor but easier in a higher power pilot scale or commercial reactor.

REFERENCES
88
REFERENCES
Addona, T. (1993). The effect of quench conditions on the properties of fumed silica producted
using an arc process. Ph.D. Eng. Thesis, Department of Chemical Engineering, McGill
University, Canada.
Addona, T. (1998). The study of a novel plasma process for the production of fumed silica. Ph.D.
Eng. Thesis, Department of Chemical Engineering, McGill University, Canada.
Altenhoff, M. (2009). Synthesis of titania nanoparticles using a transferred arc plasma. Diploma
Thesis, Institute of Particle Technology, Clausthal University of Technology, Germany.
Anatase . (n.d.). Retrieved 03 14, 2011, from the mineral and locality database:
http://www.mindat.org/min-213.html
Anopo, M. (2004). Preparation , characterization, and reactivities of highly functional titanium
oxide-based photocatalysts able to operate under UV-visible light irradiation: Approaches in
realizing high efficiency in the use of visible light. Bulletin of the Chemical Society of Japan , 77,
1427-1442.
Arabatzis, I.M. (2003). Characterization and photocatalytic activity of Au/TiO2 thin films for
azo-dye degradation. Journal of Catalysis , 220, 127-135.
Asahi, R., Morikawa, T., Ohwaki, T., Aoki, K., & Taga, Y. (2001). Visible-light photocatatysis
in nitrogen-doped titanium oxides. Science , 293, 269-271.
Balthasar, M., & Frenklach, M. (2005). Detailed kinetic soot modeling of soot aggregate
formation in laminar premixed flames. Combustion and Flame ,140, 130-145.
Xiaohong Liao, M. Eng. Thesis
89
Bankmann, M., Brand, R., Engler, B. H., & Ohmer, J. (1992). Forming of high surface area Ti02
to catalyst supports. Catalysis Today , 225-242.
Chen, B., Zhang, H., Dunphy-Guzman, K., & Banfield, J. F.(2009). Size-dependent elasticity of
nanocrystalline titania. Physical Review B, 79,125406-1-8.
Chen, B., Zhang, H., Gilbert, B., & Banfield, J. F. (2007). Mechanism of inhibition of
nanoparticle growth and phase transformation by surface impurities. Physical Review Letters,98,
106103-1– 4.
Chen, X., & Li, H.-P. (2001). Heat transfer and fluid flow in a high-intensity free-burning arc: an
improved modeling approach. International Journal of Heat and Mass Transfer , 44, 2541-2553.
Chun, H.-Y., Park, S.-S., You, S.-H., Kang, G.-H., Bae, W.-T., & Kim, K.-W (2009).
Preparation of a transparent hydrophilic TiO2 thin film photocatlyst. Journal of Ceramic
Processing Research , 10, 219-223.
Coulombe, S. (2009, Nov). Electrical discharge. Course Note of Plsama Engineering . McGill
University.
Download literature: Balston sample filter documentation and specification . (n.d.). Retrieved
January 27, 2011, from Gas analyzer and Gas sample filters:
http://www.balstonfilters.com/pdf/SampleFilters.pdf
Gaffet, E. (2007). cnam. Retrieved December 20, 2010, from
www.cnam.fr/servlet/com.univ.utils.LectureFichierJoint?CODE...0
Gamboa, J. A., & Pasquevich, D. M. (1992). Effect of chlorine atmosphere on the anatase-rutile
transformation. Journal. of the American Ceraminc Scociety,75, 2834-3938.

REFERENCES
90
Gao, X., & Wachs, I. (1999). Titania-silica as catalysts: Molecular structural characteristics and
physico-chemical properties. Catalysis Today , 51, 233-254.
Goldstein, J. I., Lyman, C. E., Newbury, D. E., & Joy, D. C. (2003). Qualitative X-ray analysis.
In J. I. Goldstein, C. E. Lyman, D. E. Newbury, & D. C. Joy, Scanni Electron Microscopy and X-
Ray Microanalysis (pp. 356-382).
Gribb, A. A., & Banfield, J. F. (1997). Particle size effects on transformation kinetics and phase
stability in nanocrystalline TiO2. American Mineralogist , 82, 717-728.
Herrmann, J., & Tahiri, H. (1997). Characterization and photocatalytic activity in aqueous
medium of TiO2 and Ag-TiO2 coatings on quartz. Applied Catalysis B: Environmental , 13, 219-
228.
Horn, M., Schwerdtfeger, C. F., & and Meaghe, E. P. (1972). Refinement of the structure of
anatase at several temperatures. Zeitschrift Fur Kristallographie , 273-281.
Iida, Y., & Ozaki, S. (1961). Grain growth and phase transformation of titanium oxide during
calcination. 44 (3), 120-127.
Ishigaki, T., & li, J.-G. (2007). Synthesis of functional nanocrystallites through reactive thermal
plasma processing. Science and Technology of Advanced Materials , 617-623.
Ito, S., & Zakeeruddin, S. (2006). High-efficiency organic-dye-sensitized solar cells controlled
by nanocrystalliner-TiO2 electrode thickness. Advanced Materials , 18, 1202-1205.
Jung, C. B. (2005). Synthesis of TiO2 photocatalyst and study on their improvement technology
of photocatalytic activity. Surface and Coatings Technology , 200, 534-538.
Xiaohong Liao, M. Eng. Thesis
91
Jung, C., & Bar, I. (2005). Plasma surface modification of TiO2 photocatalysts for improvement
of catalytic efficiency. Surface and Coatings Technology , 200, 1320-1324.
Kakati, m., Bora, B., Sarma, S., Sikia, B., Shripathi, T., Deshpande, U., et al. (2007). Synthesis
of titanium oxide and titanium nitride nano-particles with narrow size distribution by supersonic
thermal plasma expansion. Vacuum , 82 , 833-841.
Kloepfer, H. (1953). Patent No. DE-PS 870 242. Germany.
Langford, J. I., Louèrb, D., & Scardic, P. (2000). Effect of a crystallite size distribution on X-ray.
Journal of Applied Crystallography , 33, 964-974.
Langmuir, I. (1928). Oscillations in ionized gases. Proc. Nat. Acad. Sci. U.S. , 14, 628.
Lee, J., Oh, S., & Park, D. (2004). Synthesis of nano-sized Al doped TiO2 powder using thermal
plasma. Thin solid films , 457, 230-234.
Li, J.-G., Ikeda, M., Ye, R., Moriyoshi, Y., & Ishigaki, T. (2007). Control of particle size and
phase formation of TiO2 nanoparticles synthesized in RF induction plasma. J. Phys. D:Appl.
Phys. , 40, 2348-2353.
Li, J.-G. K.-H. (2006). TiO2 nanpowders via radio-frequency thermal plasma oxidation of
organic liquid precursors: Synthesis and characterization. Journal of European Ceramic Society ,
26, 423-428.
Li, J.-G., Ikeda, M., Ye, R., Moriyoshi, Y., & Ishigaki, T. (2007). Control of particle size and
phase formation of TiO2 nanoparticles synthesized in RF induction plasma. J. Phys. D:Appl.
Phys. , 40, 2348-2353.
REFERENCES
92
Li, J.-G., Ikeda1, M.,Ye, R., Moriyoshi, Y., & Ishigak, T. (2007). Control of particle size and
phase formation of TiO2 nanoparticles synthesized in RF induction plasma. Journal of Physics
D:Applied Physics , 40, 2348-2353.
Li, J.-G., Kamiyamaa, H., Wanga, X.-H., Moriyoshib, Y., & Ishigaki, T. (2006). TiO2
nanpowders via radio-frequency thermal plasma oxidation of organic liquid precursors:
Synthesis and characterization. Journal of European Ceramic Society , 26, 423-428.
Li, Y.-L., & Ishigaki, T. (2004). Controlled one-step synthesis of nanocrystalline anatase and
rutile TiO2 powders by in-flight thermal plasma oxidation. Journal of Physical Chemistry B ,
15536-15542.
Liao, Z., Chen, J. J., Yao, K., Zhao, F., & Li, R. (2004). Preparation and characterization of
nanometer-sized magnetic photocatalyst TiO2/SiO2/Fe3O4. Journal of Inorganic Materials , 4,
749-753.
Lyman, C., Williams, D., & Goldstei, J. I. (1988). X-ray detectors and spectrometers. 28, 137-
149 .
Horn, M., Schwerdtfeger, C. F., & Meaghe, E. P. (1972). Refinement of the structure of anatase
at several temperatures. Zeitschrift Fur Kristallographie , 273-281.
Mchida, M., Norimoto, K., & Watanabe, T. (1999). The effect of SiO2 addition in super-
hydrophilic property of TiO2 photocatalyst. Journal of Materials Science , 34, 2569-2574.
Mitchell, P., & Frenklach, M. (2003). Particle aggregation with simultaneous surface growth.
Phiscal Review, E67.
Xiaohong Liao, M. Eng. Thesis
93
Munz, R., Addona, T., & Cruz, A.–C. (1999). Application of transferred arcs to the production of
nanoparticles. Pure Appl. Chem. , 71, 1889-1897.
Oh, S.-M.,& Park, D.-W. (2001). Production of ultrafine titanium dioxide by DC plasma jet.
Thin Solid Films , 386, 233-238.
Oh, S.-M., Li, J.-G., & Ishigaki, T. (2005). Nanocrystalline TiO2 powders synthesized by in-
flight oxidation of tiN in thermal plasma: Mechanisms of phase selection and particle
morphology evolution. J. Mater. Res. , 20, 529-537.
Okada, K., Yamamoto, N., Kameshima, Y., Yasumori, A., & Mackenzie, K. J. (2001). Effect of
silica additive on the anatase-to-rutile phase transition. 84, 1591–1596.
Pfender, E. (1999). Thermal plasma technology:where do we stand and where are we going?
Plasma Chemistry and Plasma Processing , 19, 1-31.
Pookmanee, P., & and Phanichphant, S. (2009). Titanium dioxide powder prepared by a sol-gel
method. Journal of Ceramic Processing Research , 10, 167-170.
Pratsinis, S. (1998). Flame aerosol synthesis of ceramic powders. Progress in Energy and
Combustion Science , 24, 192-219.
Principle of TEM. (n.d.). Retrieved 02 22, 2011, from Atomic World: http://www.hk-
phy.org/atomic_world/tem/tem02_e.html
Shannon, R. D., & Pask, J. A. (1965). Kinetics of the anatas-rutiel trasformation. 48, 391-398.
Skoog, D. A., Holle, F. J., & and Crouch, S. R. (1998). Principles of instrumental analysis (Fifth
Edition ed.). Thomson Learning, Inc.(pp 232)
REFERENCES
94
Spurr, R. A., & Myers, H. (1957). Quantitative analysis of anatase-rutile. Analytical Chemistry ,
29 , 760-762.
Transmission Electron Microscope (TEM) Facility. (n.d.). Retrieved 2 22, 2011, from Stanford
Univeristy : http://www.stanford.edu/group/snl/tem.htm
Turner, I., Addome, T., & Munz, R. (2000). Patent No. 6060680. United States of America.
User's manual. (n.d.). Retrieved January 27, 2011, from ICP-DAS Corporation:
http://www.icpdas-usa.com/documentation/manuals/7017-18-19_english%20B17.pdf
Vijiay, M., Selvarajan, V., Sreekumar, K. P., Yu, Jiaguo, Liiu, Shengwei, &
Ananthapadmanabhan, P. V. (2009). Characterization and visible light photocatalytic properties
of nanocrystalline TiO2 synthesized by reactive plasma processing. Solar Energy Materials
&Solar Cells , 93, 1540-1549.
www.haydencorp.com. (n.d.). Retrieved 11 01, 2009, from http://www.haydencorp.com/pat.html
Yang, Y., Wang, Q.-W., & Wang, L.-J. (2009). Catalysis of nanometer TiO2/SiO2 composite.
Environmental Sceince and Technology. 4 , 9-13.
Zhang, H., & Banfield, J. F. (2007). Polymorphic transformations and particle coarsening in
nanocrystalline titania ceramic powders and membranes. 111, 6621-6629.
Zhang, H., & Banfield, J. F. (1998). Thermodynamic analysis of phase stability of
nanocrystalline titania. J. Mater. Chem. 8, 2073-2076.
Zhang, H., Chen, B., & Banfield, J. F. (2009). The size dependence of the surface free energy of
titania nanocrystals.Physical Chemistry Chemical Physics, 11, 2553-2558.
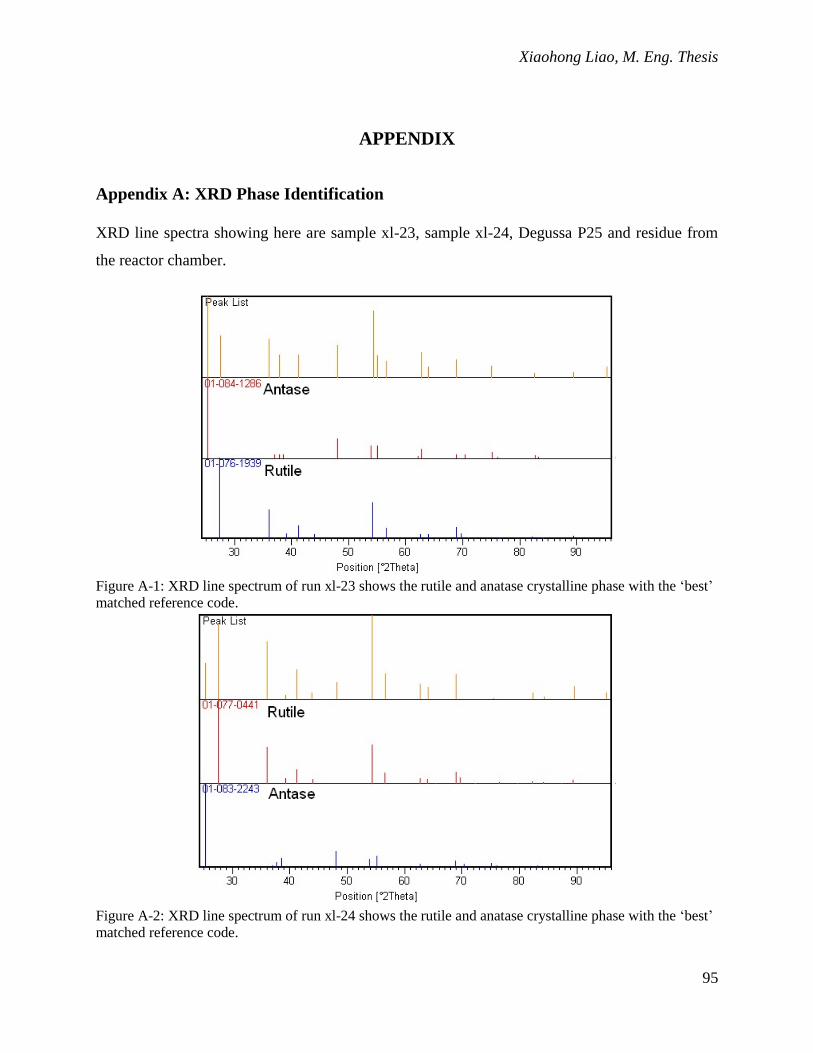
Xiaohong Liao, M. Eng. Thesis
95
APPENDIX
Appendix A: XRD Phase Identification
XRD line spectra showing here are sample xl-23, sample xl-24, Degussa P25 and residue from
the reactor chamber.
Figure A-1: XRD line spectrum of run xl-23 shows the rutile and anatase crystalline phase with the „best‟
matched reference code.
Figure A-2: XRD line spectrum of run xl-24 shows the rutile and anatase crystalline phase with the „best‟
matched reference code.
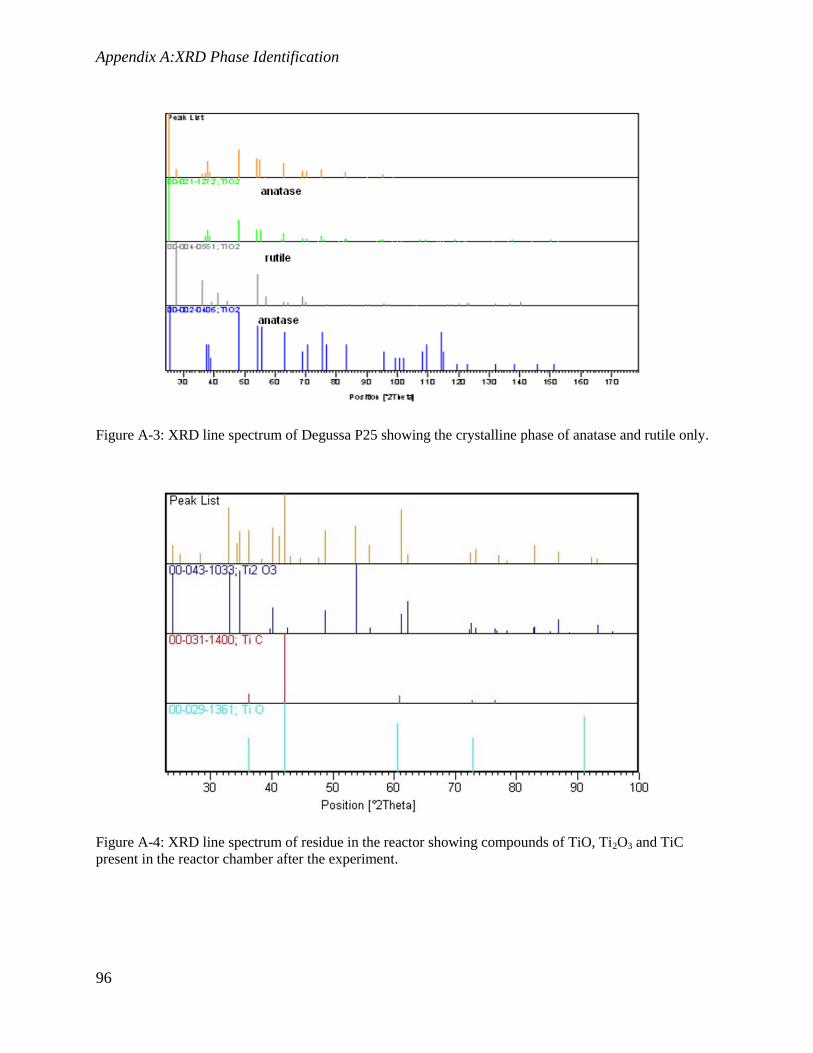
Appendix A:XRD Phase Identification
96
Figure A-3: XRD line spectrum of Degussa P25 showing the crystalline phase of anatase and rutile only.
Figure A-4: XRD line spectrum of residue in the reactor showing compounds of TiO, Ti2O3 and TiC
present in the reactor chamber after the experiment.

Xiaohong Liao, M. Eng. Thesis
97
Appendix B: SEM-EDS Analysis
SEM-EDS was employed to identify the resource of contaminants of Si, P and K.
Element Weight% Atomic%
C K 19.03 26.86
S K 0.32 0.17
Ti K 17.17 6.08
V K 0.33 0.11
Zn L 0.21 0.05
O 62.94 66.72
Totals 100.00
Figure B-1: SEM-EDS mapping of raw TiO2 material over the whole SEM electron image showed the
trace amount of V, S and Zn present in the sample.
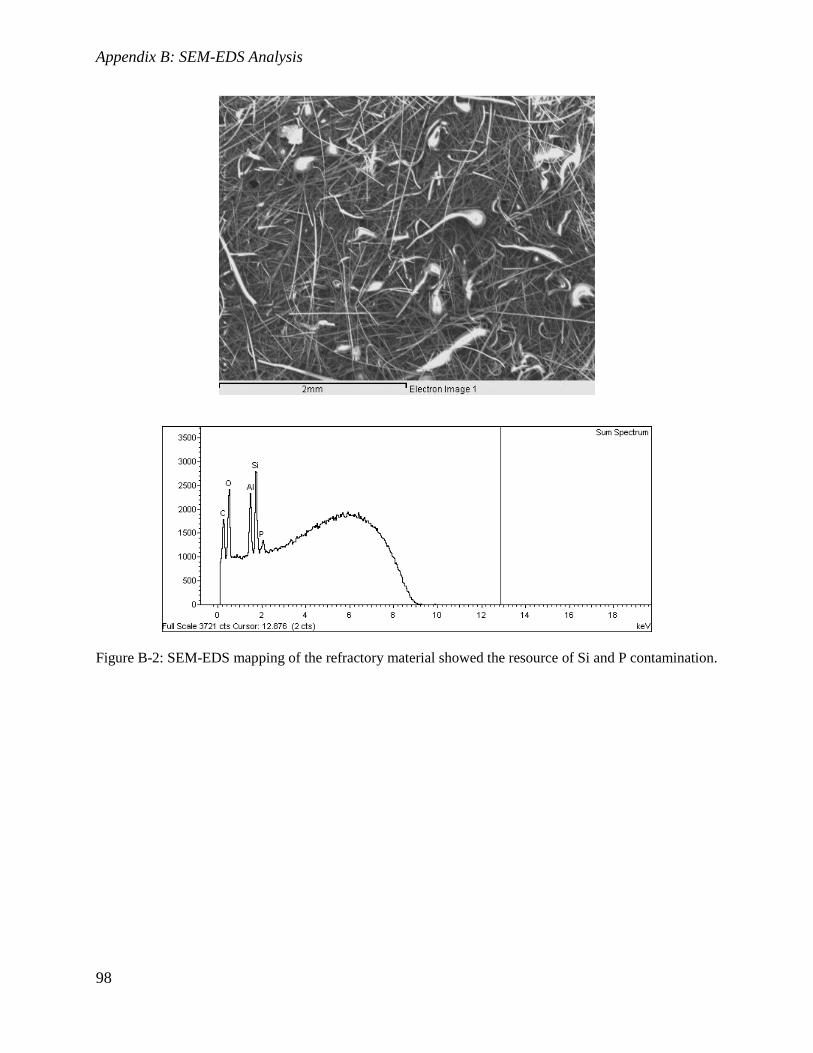
Appendix B: SEM-EDS Analysis
98
Figure B-2: SEM-EDS mapping of the refractory material showed the resource of Si and P contamination.
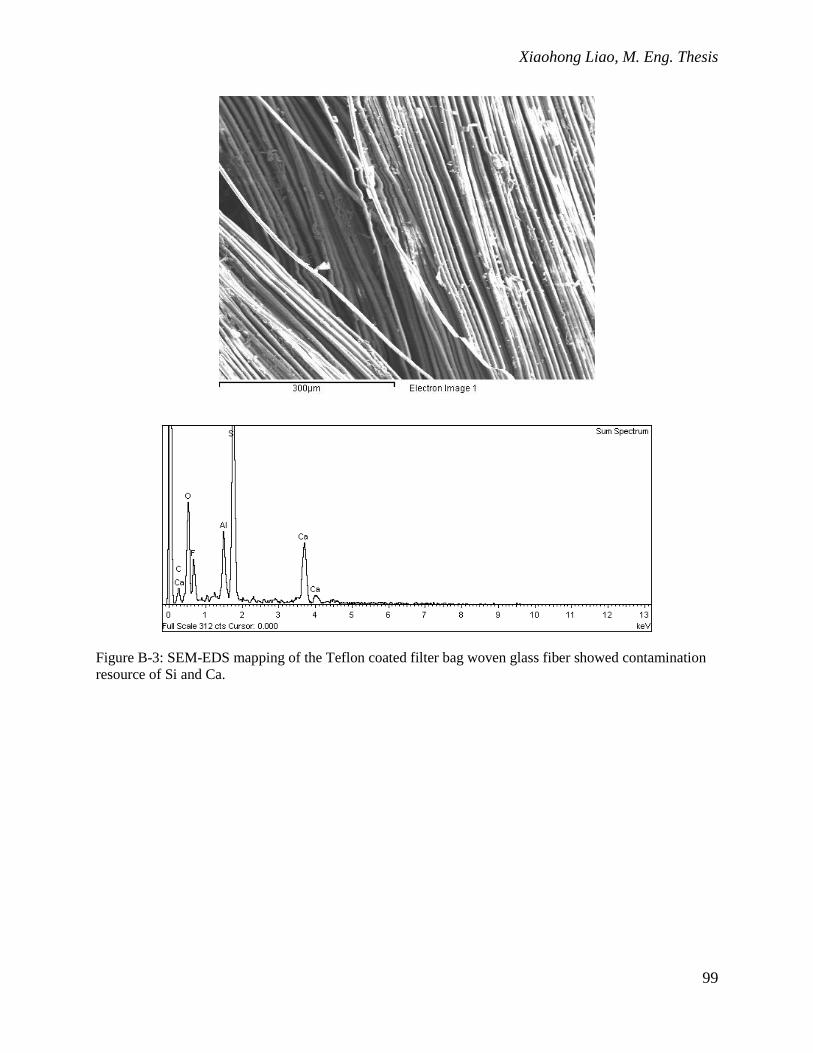
Xiaohong Liao, M. Eng. Thesis
99
Figure B-3: SEM-EDS mapping of the Teflon coated filter bag woven glass fiber showed contamination
resource of Si and Ca.
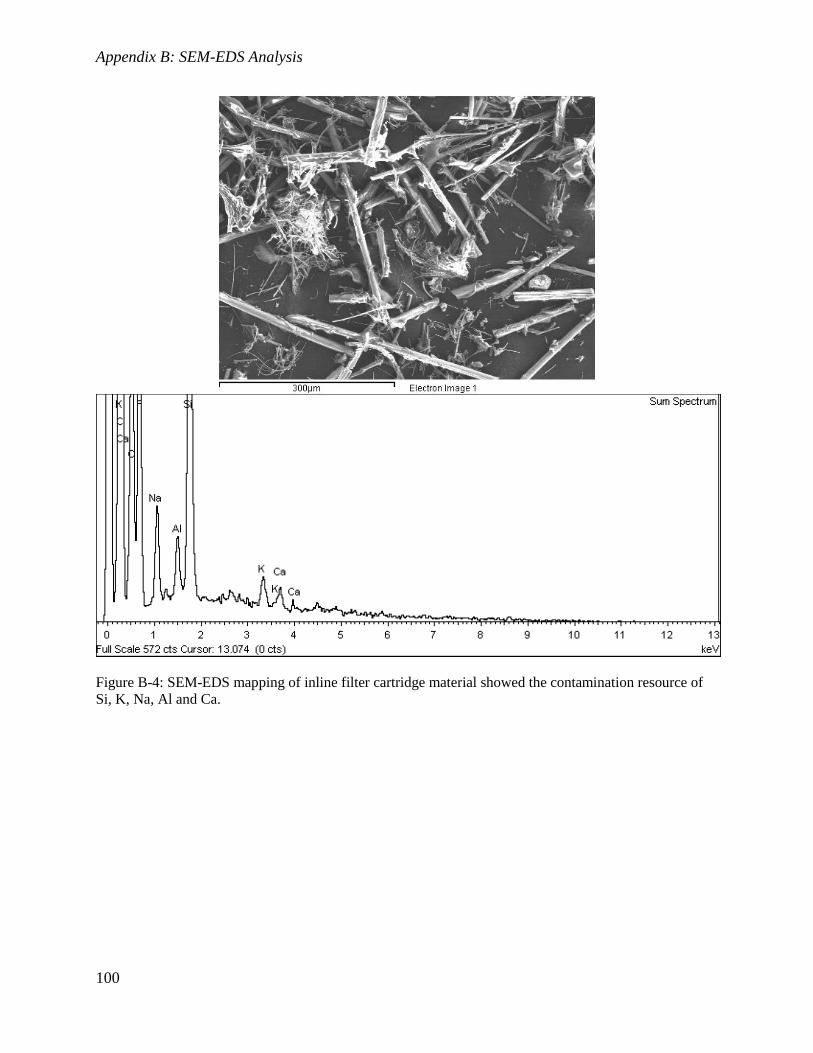
Appendix B: SEM-EDS Analysis
100
Figure B-4: SEM-EDS mapping of inline filter cartridge material showed the contamination resource of
Si, K, Na, Al and Ca.

Xiaohong Liao, M. Eng. Thesis
101
Figure B-5: SEM-EDS line scan of the sampel xl-24. The scan line crossed a glass fiber contaminant.The
spectrum after 100μm showed the content of glass fiber and the particles on the surface of the glass fiber.
Carbon is originated from the adhesive carbon tape.

Appendix B: SEM-EDS Analysis
102
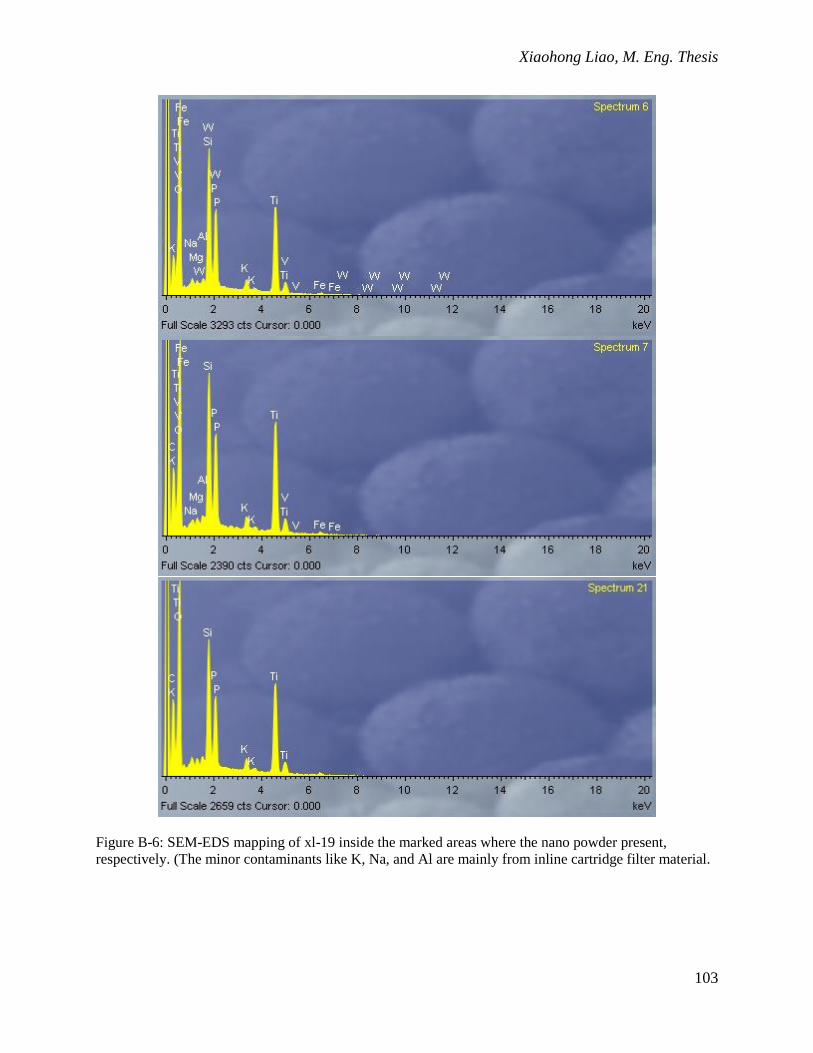
Xiaohong Liao, M. Eng. Thesis
103
Figure B-6: SEM-EDS mapping of xl-19 inside the marked areas where the nano powder present,
respectively. (The minor contaminants like K, Na, and Al are mainly from inline cartridge filter material.
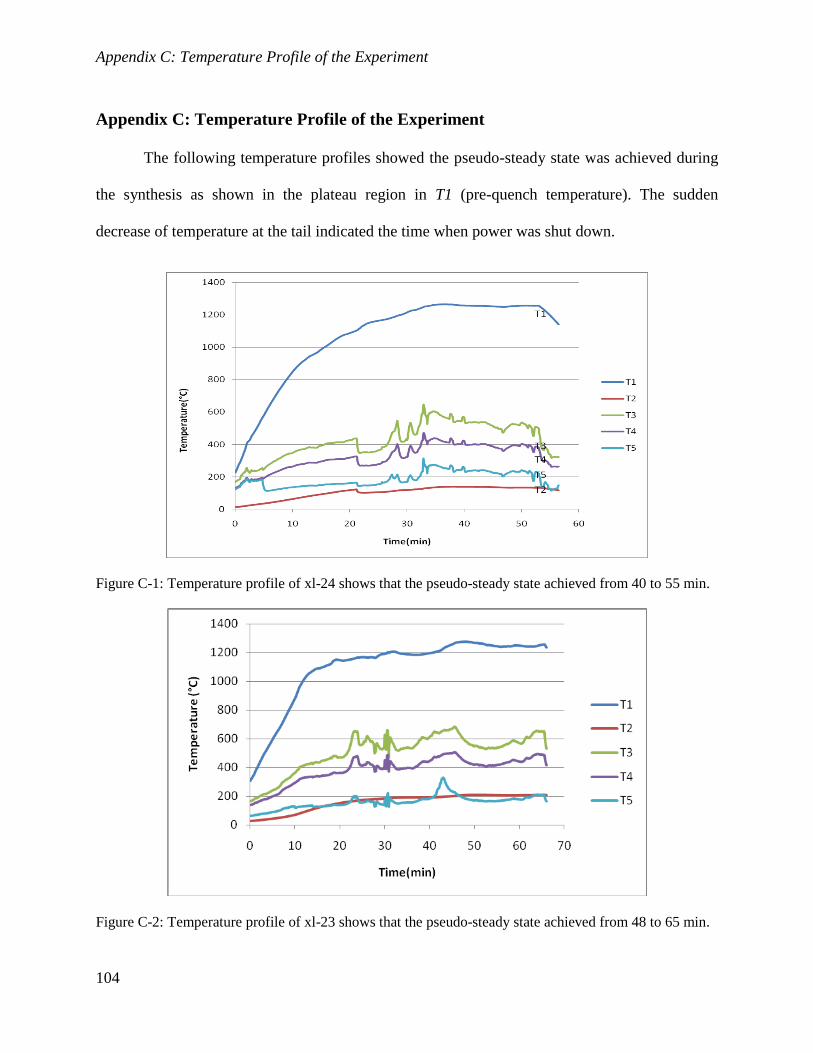
Appendix C: Temperature Profile of the Experiment
104
Appendix C: Temperature Profile of the Experiment
The following temperature profiles showed the pseudo-steady state was achieved during
the synthesis as shown in the plateau region in T1 (pre-quench temperature). The sudden
decrease of temperature at the tail indicated the time when power was shut down.
Figure C-1: Temperature profile of xl-24 shows that the pseudo-steady state achieved from 40 to 55 min.
Figure C-2: Temperature profile of xl-23 shows that the pseudo-steady state achieved from 48 to 65 min.

Xiaohong Liao, M. Eng. Thesis
105
Figure C-3: Temperature profile of xl-19 shows that the pseudo-steady-state achieved from 42 to 55min.

Appendix D: Experiment Procedure
106
Appendix D: Experimental Procedure
Pre-experimental procedure
Preparation of the reactor and its peripheral devices
To start, make sure the power switch is off, gas valves and water faucets are closed
Check and fasten the external parts, gas lines, and water pipes
Clean the inside of the reactor(use brush and vacuum), dispose of waste to the proper container
(use suitable mask when cleaning)
Check the insulation and other internal parts, replace the damaged ones
Inspect and clean the torch
Clean and reassemble the exit tube, window, filter, powder feeder and feed line.
Weigh the empty crucible and feeder
Verify electrical isolation of the crucible and chamber
Press TiO2(99.5% purity) into crucible and weigh crucible with the TiO2
Press TiO2(99.5% purity) into small tablet and place in the feeder and weigh the feeder with
TiO2
Pressure test
Turn on gas flow and build up a 4 psi pressure inside the reactor
Use soap solution to check the leakage

Xiaohong Liao, M. Eng. Thesis
107
Turn off the gas flow and check if pressure remains constant for 5 min
Check the ground cables
Check resistance
Make sure resistance between cathode and ground and cathode and nozzle is at least 1MΩ
If not, the consequence is that the torch is not electrically isolated and must be repaired
Replace the electrical tape on the cathode and be sure the cathode tip and the nozzle do not touch
each other
Experimental procedure
Use a check list for the experiment
Turn on the elephant trunk exhaust and place it at the exhaust gas exit
Turn on cooling water flows to the reactor and touch and check for leaks
The valves must be fully opened to give the maximum flow rates
turn on the booster pump and check for leaks
check, if the water flow indicators for the cathode and the nozzle are working
Turn on the argon gas flows.
Before ignition of the arc, argon must flow for 1 hour with 5 slpm to purge the system of air
(when air concentration reaches about ~10-7
, this is approximation in theory, no indicator
installed)
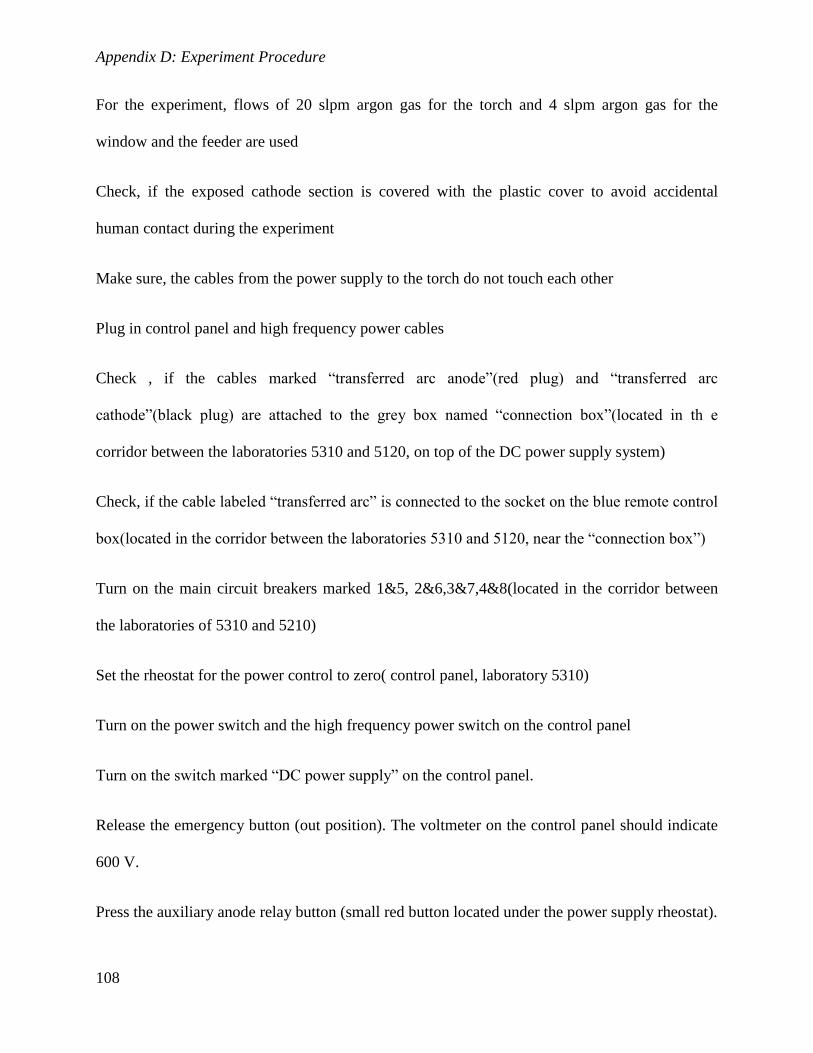
Appendix D: Experiment Procedure
108
For the experiment, flows of 20 slpm argon gas for the torch and 4 slpm argon gas for the
window and the feeder are used
Check, if the exposed cathode section is covered with the plastic cover to avoid accidental
human contact during the experiment
Make sure, the cables from the power supply to the torch do not touch each other
Plug in control panel and high frequency power cables
Check , if the cables marked “transferred arc anode”(red plug) and “transferred arc
cathode”(black plug) are attached to the grey box named “connection box”(located in th e
corridor between the laboratories 5310 and 5120, on top of the DC power supply system)
Check, if the cable labeled “transferred arc” is connected to the socket on the blue remote control
box(located in the corridor between the laboratories 5310 and 5120, near the “connection box”)
Turn on the main circuit breakers marked 1&5, 2&6,3&7,4&8(located in the corridor between
the laboratories of 5310 and 5210)
Set the rheostat for the power control to zero( control panel, laboratory 5310)
Turn on the power switch and the high frequency power switch on the control panel
Turn on the switch marked “DC power supply” on the control panel.
Release the emergency button (out position). The voltmeter on the control panel should indicate
600 V.
Press the auxiliary anode relay button (small red button located under the power supply rheostat).

Xiaohong Liao, M. Eng. Thesis
109
Push the high frequency toggle switch (located under the knob labeled power supply rheostat) to
the right. A spark is created, generating an arc between the cathode and nozzle, which then is
transferred to the graphite rod in the center of the crucible. When this occurs, the nozzle relay is
opened.
Increase the power to desired value (100-200 A) by adjusting the power supply rheostat slowly.
Turn slowly on the quench gas (air, taken from the pressure line).
Start the data acquisition system (approximately one minute after the arc ignition).
The power collection starts when the temperature in the exit tube is almost constant. The filter
has to be set from bypass to inline.
Start feeding with TiO2 tablets
Shut-down procedure
Prior to the termination of an experiment, particle feeding must be stopped and the filter must be
bypassed again.
Turn off the quench gas
Reduce the argon flow of the torch, window and feeder.
Turn off the power switch and simultaneously set the rheostat to zero
Push the red emergency button (in position)
Turn off the control panel power switch and the high frequency power switch (down position)
Turn off the main circuit breakers marked 1&5, 2&6 and 4&8.

Appendix D: Experiment Procedure
110
Argon purge and cooling water flows must continue until the apparatus is cooled to normal
temperatures (approximately 50 ˚C)
When reactor is cooled down, turn off the argon and water flows.
Turn off the elephant trunk.
Emergency situation
Push the red emergency button( in position) to remove D.C. power
Check and solve the suspected problem
In case of uncontrollable fire, leave the room as soon as possible after shut down the power, call
McGill security immediately.
Potential hazard description and hazard handling and safety precautions
High voltages and currents
All parts of equipment except cathode are grounded.
Torch is surrounded with plastic cover to prevent human contact during the experiment.
During the experiment, I should be very cautious not touching devices and stay at least 0.5 m
away.
High temperatures
High temperature exist only in the plasma chamber, which is heavily water cooled
High pressures
Xiaohong Liao, M. Eng. Thesis
111
The argon cylinders are pressurized; they must be securely attached to an appropriate cylinder
support.
The reactor itself is operated at atmospheric pressure ( or slightly above, +4 psi)
Other hazards
TiO2 causes violent exothermic reaction and development of heat as well as the risk of explosion
if it is mixed with the following metals: aluminum powder, calcium, potassium, magnesium,
sodium, lithium, zinc powder. These substances are not included in the system.
When handling with either TiO2 powder as reactant or nanoparticle as the product, a dust
mask/respiratory filter (particle filter P2 or P3, color code white) should be worn. Inhalation of
TiO2 dust may cause cancer.
TiO2 irritates the eyes and skin, so half face mask and gloves should be worn all the time during
handling the sample collection.
The arc plasma causes flash burn of the eyes by looking directly into it. To observe the arc
plasma, welding glasses should be worn.

Appendix D: Experiment Procedure
112
Checklist of Transferred Arc Experiment
Pre-experimental procedure
Number Procedure Check
1 Clean the reactor. O
2 Replace damaged carbon parts & insulation. O
3 Clean & inspect torch. O
4 Clean & reassemble the exit tube, the window, the filter, feeder and
feeder line.
O
5 Weight the graphite crucible and feeder O
6 Are the crucible & the chamber electrical isolated? _______ MΩ O
7 Press TiO2 powder to tablets and weight the used amount. O
8 Ensure that the crucible stem does not touch the chamber. O
9 Place the tablets in the crucible and feeder. O
10 Close the reactor O
11 Place the torch and put the electrical isolation between the flanges and
the torch and all metal connections.
O
12 Pressure test: 4 psi air (0,275 bar). Does the pressure remain constant
after 5 minutes? If no, use Snoop (soap solution) and search for leaks!
O
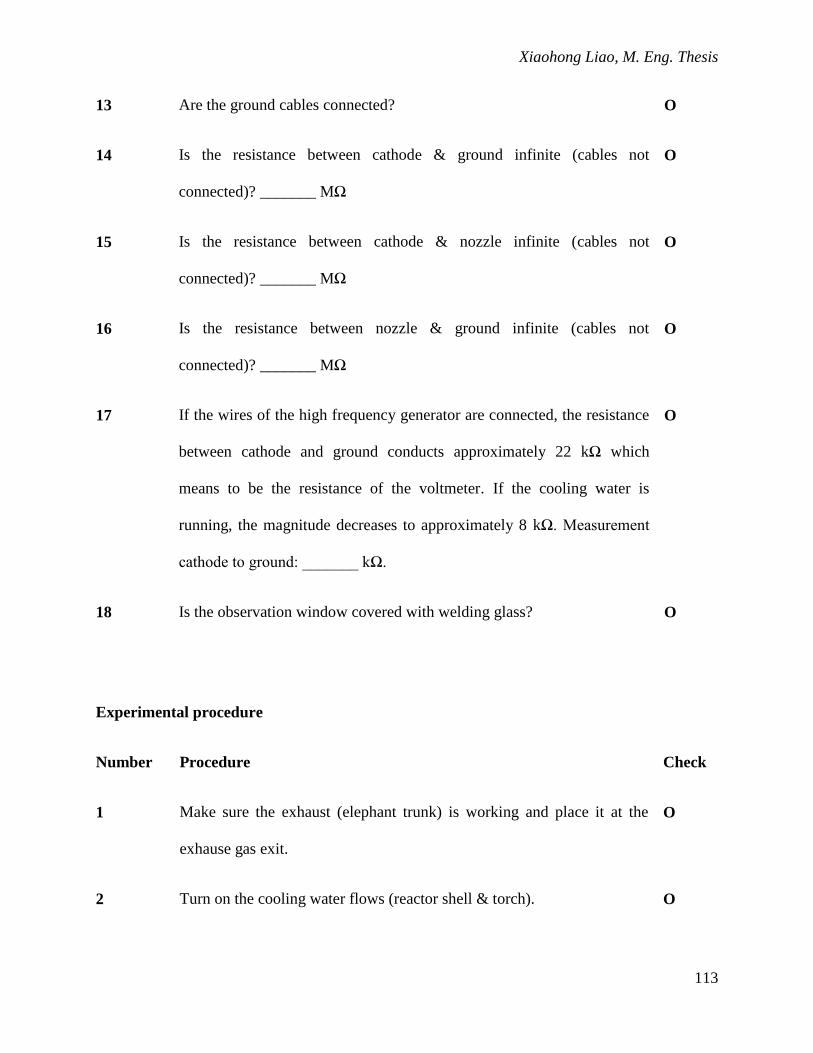
Xiaohong Liao, M. Eng. Thesis
113
13 Are the ground cables connected? O
14 Is the resistance between cathode & ground infinite (cables not
connected)? _______ MΩ
O
15 Is the resistance between cathode & nozzle infinite (cables not
connected)? _______ MΩ
O
16 Is the resistance between nozzle & ground infinite (cables not
connected)? _______ MΩ
O
17 If the wires of the high frequency generator are connected, the resistance
between cathode and ground conducts approximately 22 kΩ which
means to be the resistance of the voltmeter. If the cooling water is
running, the magnitude decreases to approximately 8 kΩ. Measurement
cathode to ground: _______ kΩ.
O
18 Is the observation window covered with welding glass? O
Experimental procedure
Number Procedure Check
1 Make sure the exhaust (elephant trunk) is working and place it at the
exhause gas exit.
O
2 Turn on the cooling water flows (reactor shell & torch). O
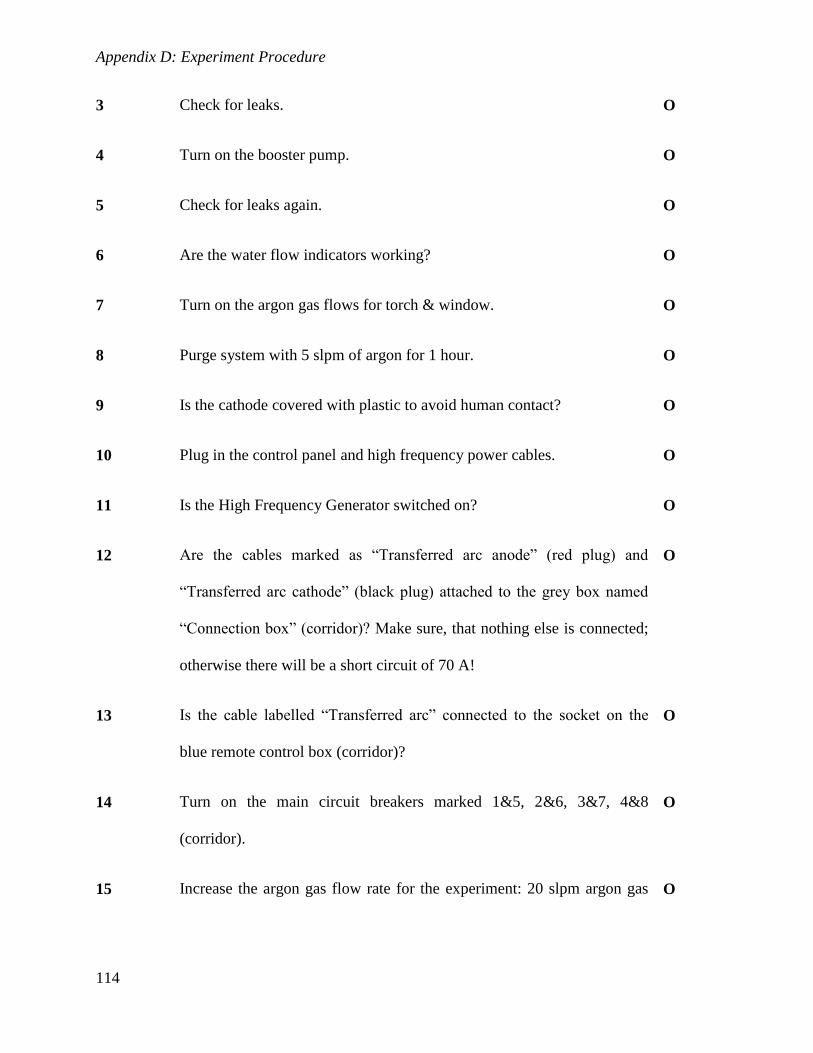
Appendix D: Experiment Procedure
114
3 Check for leaks. O
4 Turn on the booster pump. O
5 Check for leaks again. O
6 Are the water flow indicators working? O
7 Turn on the argon gas flows for torch & window. O
8
9
Purge system with 5 slpm of argon for 1 hour.
Is the cathode covered with plastic to avoid human contact?
O
O
10 Plug in the control panel and high frequency power cables. O
11 Is the High Frequency Generator switched on? O
12 Are the cables marked as “Transferred arc anode” (red plug) and
“Transferred arc cathode” (black plug) attached to the grey box named
“Connection box” (corridor)? Make sure, that nothing else is connected;
otherwise there will be a short circuit of 70 A!
O
13 Is the cable labelled “Transferred arc” connected to the socket on the
blue remote control box (corridor)?
O
14 Turn on the main circuit breakers marked 1&5, 2&6, 3&7, 4&8
(corridor).
O
15 Increase the argon gas flow rate for the experiment: 20 slpm argon gas O
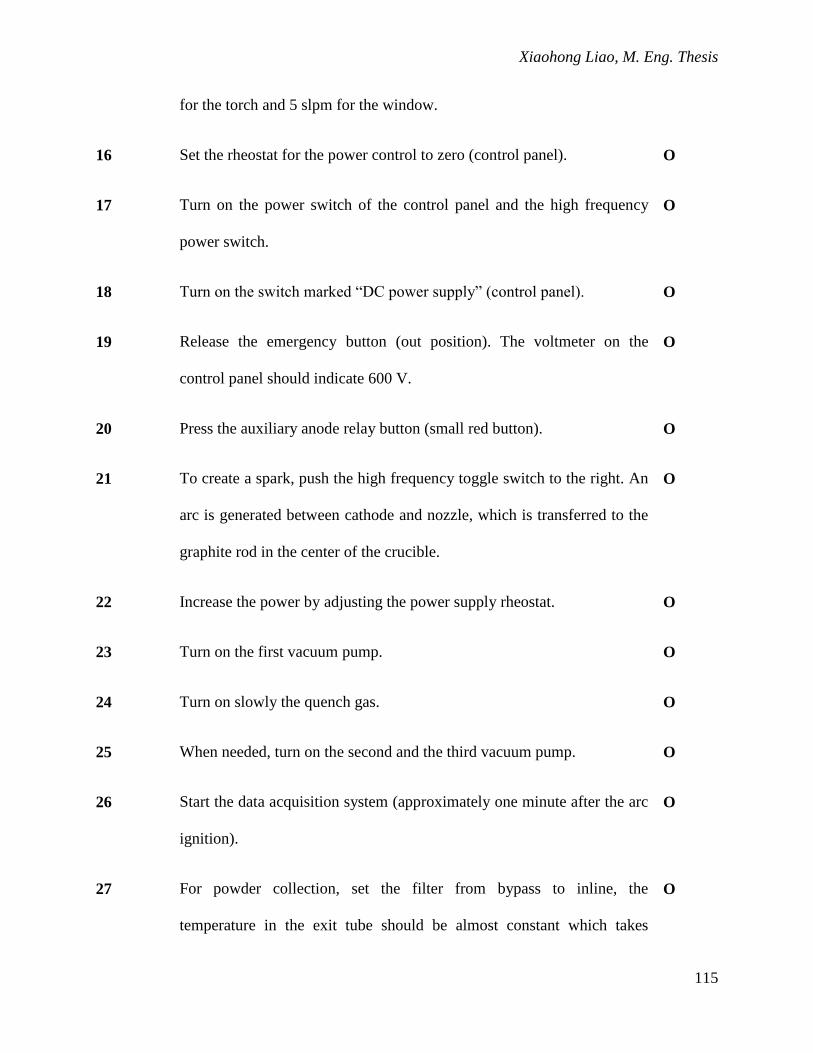
Xiaohong Liao, M. Eng. Thesis
115
for the torch and 5 slpm for the window.
16 Set the rheostat for the power control to zero (control panel). O
17 Turn on the power switch of the control panel and the high frequency
power switch.
O
18 Turn on the switch marked “DC power supply” (control panel). O
19 Release the emergency button (out position). The voltmeter on the
control panel should indicate 600 V.
O
20 Press the auxiliary anode relay button (small red button). O
21 To create a spark, push the high frequency toggle switch to the right. An
arc is generated between cathode and nozzle, which is transferred to the
graphite rod in the center of the crucible.
O
22 Increase the power by adjusting the power supply rheostat. O
23 Turn on the first vacuum pump. O
24 Turn on slowly the quench gas. O
25 When needed, turn on the second and the third vacuum pump. O
26 Start the data acquisition system (approximately one minute after the arc
ignition).
O
27 For powder collection, set the filter from bypass to inline, the
temperature in the exit tube should be almost constant which takes
O

Appendix D: Experiment Procedure
116
approximately 45 minutes.
Shut-down procedure
Number Procedure Check
1 Bypass the filter. O
2 Turn off power switch and simultaneously set rheostat to zero. O
3 Push red emergency button. O
4 Turn off quench gases (air, SiCl4 enriched argon). O
5 Turn off the vacuum pumps. O
6 Reduce argon flow of the torch & window. O
7 Turn off control panel and high frequency power switch. O
8 Turn off main circuit breakers 1&5, 2&6, 3&7, 4&8. O
9 Turn off the booster pump. O
10 Argon purge and cooling water must continue until the reactor is cooled
down to normal temperatures of ca. 400°C in the exit tube.
O
11 Turn off water and argon flows. O
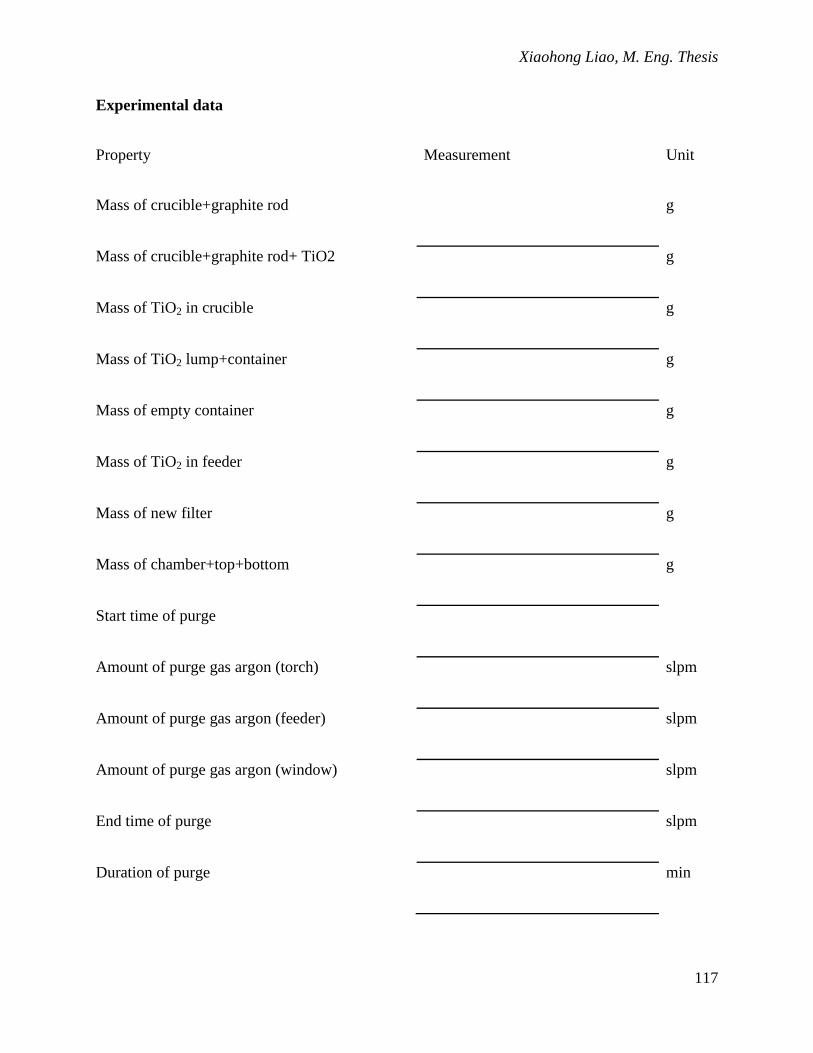
Xiaohong Liao, M. Eng. Thesis
117
Experimental data
Property Measurement Unit
Mass of crucible+graphite rod g
Mass of crucible+graphite rod+ TiO2 g
Mass of TiO2 in crucible g
Mass of TiO2 lump+container g
Mass of empty container g
Mass of TiO2 in feeder g
Mass of new filter g
Mass of chamber+top+bottom g
Start time of purge
Amount of purge gas argon (torch) slpm
Amount of purge gas argon (feeder) slpm
Amount of purge gas argon (window) slpm
End time of purge slpm
Duration of purge min

Appendix D: Experiment Procedure
118
Start time of experiment
Amount of purge gas experiment (torch) slpm
Amount of purge gas experiment (window) slpm
Amount of purge gas experiment (feeder) slpm
Starting time of data collecting
Current A
Voltage V
Amount of quench gas air slpm
Start time of feeding
End time of feeding
Duration of feeding
Start time of powder collection
End time of powder collection
Duration of powder collection min
Pressure in the reactor during experiment psi
End time of experiment
Xiaohong Liao, M. Eng. Thesis
119
Duration of experiment min
Mass of crucible at the end g
Mass of chamber+top+bottom at the end g
Mass of TiO2 in the feeder at the end g
Mass of powder + filter g
Mass of powder collected g
Mass of TiO2 used in total g


