

1
The Three Domains of Life: A Challenge to the concept of the Universal Cellular Ancestor?
Pattle.P.Pun1,2, Stephen Schuldt1* and Benjamin T. Pun1
1 Department of Biology, Wheaton College, Wheaton, IL 60187
2 Corresponding author:
telephone: 630-752-5303
email: [email protected]
fax: 630-752-5996
* present address: 591 E. Bechtel, Apt. U, Akron, OH 44304
Abstract:

2
With the discovery of the uniqueness of Archaebacteria in rRNA sequence and by comparative studies with
well-characterized molecular systems, cell walls, lipid compositions and features of the transcriptional and
translational machineries, the three domains of life, namely Archaea, Bacteria and Eukarya, has become the
currently accepted paradigm in the field of molecular taxonomy. Sequence analyses based on functional
proteins across the three domains also suggest each of the three domains as independent monophyletic
lineage representing ribosomal, metabolic, biosynthetic proteins as well as the replicational, transcriptional
and translational machineries. Current view suggests that the universal tree of life branched from the
universal ancestor in separate lineages leading to Bacteria and Archaea, the latter then diverged into
Eukarya. The search for the universal ancestor has led to postulating a universal communal gene pool
(progenotes) in which lateral or horizontal gene transfer (HGT) played the most important role in
diversification since the three domains of life are resistant to HGT after they have crystallized into cellular
communities. This scenario challenges the concept of the Universal Cellular Ancestor and may be open to
alternative views based on design.
Introduction:
In the age of genomics when entire genome sequences of organisms are known, molecular taxonomy has
become a dominant way by which phylogenetic relationship of organisms are analyzed. Under the
prevailing Darwinian paradigm of Common Descent, sequence comparison is supposed to give evidence of
the nature and history of evolutionary lineages. Similar protein sequences across taxa presumably are
results of a common universal ancestor. Microscopic characteristics have classified the living world into the
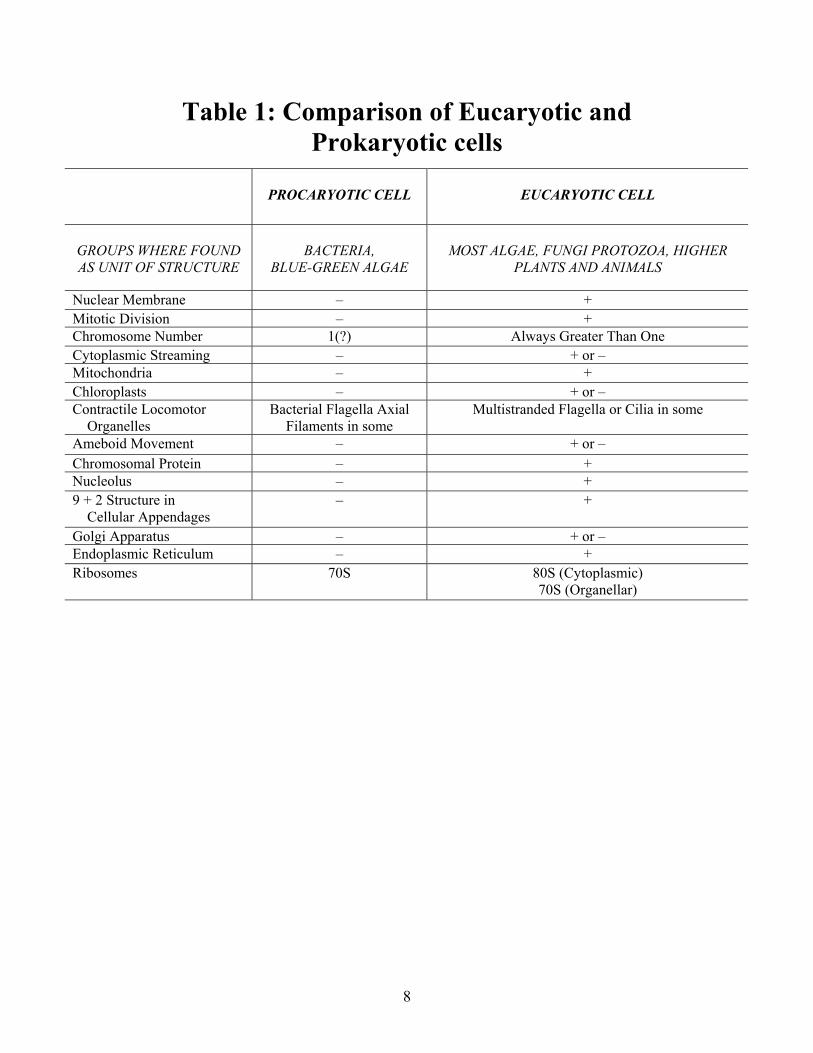
two primary domains of Eukaryotes (Eukarya) and Prokaryotes (Bacteria) (Murray, 1968). Eukaryotes and
Prokaryotes differ from each other mainly on the basis of the presence or absence of the membrane-bound
nucleus as well as characteristics of other cellular organelles (Murray, 1968)(Table 1). Woese and
coworkers proposed a third domain of life based on the studies of a heretofore poorly known group of
prokaryotes, the archaebacteria(Archaea). From the identification of signature sequences on the 16S
ribosomal RNA, which are distinctive in eukaryotes, prokaryotes and archaebacteria, the third domain
Archaea was proposed (Woese, 1987, 1992)
Additional evidence of the Archaea distinctions was also found in comparative studies with well-
characterized molecular systems, cell walls, lipid compositions and features of the protein synthesis
machinery (Woese, 1987). A summary of the characteristics of the three domains of life can be seen in
Table 2.

3
The Three Domain paradigm was challenged by other sequence analyses and the morphological
characterization of cellular envelop of gram negative and gram-positive bacteria. The former are
surrounded by an external and an internal membrane (diderm) and while the latter, one membrane
(monoderm). (Gupta, 1998a, 1998b). From the universal ancestor, a lineage of monoderm prokaryotes (i.e.
gram positive bacteria and archaebacteria) and diderm prokaryotes (i.e. gram negative bacteria) diverged.
Eukaryotic nucleus then developed by the fusion event between an archaebacterium of the Crenarachaeota
division and a gram-negative bacterium. Gupta�s hypothesis has been criticized since it also requires gene
transfer to explain conflicting phylogenies.(Doolittle, 1999a). One question that remains is whether lateral
gene transfer is truly a major component of genome evolution. The examples of lateral gene transfer that
are published in the literature often involve specific, isolated lineages, such as the occurrence of
glutaminyl-tRNA synthetase in certain bacterial groups (Doolittle and Handy, 1998). In contrast to isolated
incidents, rampant gene transfer should abolish our ability to recognize coherent evolutionary lineages.
The present study will contribute to this discussion by evaluating the integrity of the three domains as
coherent phylogenetic units. The monophyletic nature of the domains as well as relationships between the
three domains within functional classes of proteins will be examined.
Sequence Analysis of functional proteins across taxa:
We have attempted to verify the three-domain hypothesis by examining the databases of available protein
sequences for sequence alignment. Functional protein sequences instead of nucleic acid sequences were
chosen because of its importance in the extant organisms to bypass the necessity to assign functions to
obscure genomic sequences. The criteria being used for these analyses were: 1. The protein must be
functional for the whole cell. Thus, with very few exceptions, we excluded putative sequences as well as
proteins from mitochondria or chloroplasts. 2. Diverse proteins were selected with at least 4 species
represented in each of the three domain. Gram positive and gram-negative bacteria, plants and animals
were selected when available. 3. High degree of similarities as inferred from the BLAST scores (Altschul,
et.al. 1997). Of these 68 protein families, Brown and Doolittle (1997) and Doolittle and Handy (1998) list
20 (30%) as families in which gene transfer is thought to have occurred. Thus, if gene transfer is
widespread, we should observe those transfer events in at least 30% of our protein families. Since the
complete genome of the Archaea Methanococcus jannaschii is known (Bult, et al), its entire protein
database was evaluated for potential use. After examining closed to 5,000 and tracing thoroughly 250
proteins on the basis of similarities by using the search engine of BLAST, 68 proteins fulfilling the above
criteria were further analyzed. The sequences were aligned using CLUSTALW (Thompson, et.al. 1994))
and the programs NEIGHBOR JOINING DISTANCE (NJ) (which is based on the number of estimated
nucleotide differences separating two proteins) (Felsenstein, 1995) and the most recently updated version
of PAUP (Swofford, 1996). Similar results were also obtained by using the program PROTEIN

4
PARSIMONY (PROTPARS)(which is the exact number of nucleotide replacements that are minimally
necessary to bring about the difference in amino acid sequence between 2 species) (Felsenstein, 1995).
For each protein analyzed, alignments comprised four sequences from the same domain, or a systematic
aligning of 3 sequences from one domain (ingroup) with 1 sequence from a different domain (outgroup),
such that every possible alignment and analysis of the eukaryotic, bacterial, and archaeal sequences was
performed accordingly. A total of 99 permutations were carried out in the analysis of a single gene family,
i.e. 3 ingroups only, 32 each of ingroup/outgroup using 3 sequences each of the 3 domains as ingroups and
systematically assorting with one sequence each of the remaining 2 domains as outgroups. For statistical
analysis of the ingroup vs. the outgroup results, we employed the power primer effect size or Cohen�s d
(Cohen, 1992). It expresses the difference in units of population standard deviations. For example, in
3A1B, a NJ or PAUP tree of the sequences of each protein is generated from 3 Archaea and 1
representative of the Bacteria. The differences of the average distances or the parsimony steps between the
outgroup and ingroup divided by their respective standard deviations are reported as Cohen�s d. To
evaluate the 68 proteins (70 assortments of sequences including two each of Inosine 5� monophosphate
dehydrogenase and Argininosuccinate synthetase) for groupings, d of the parsimony and neighbor joining
results of 0.5 and above (although most are much larger) are assumed to have practical significance.
Several surveys suggested that Cohen's d of 0.5 approximates the average size of observed effects in the
fields to establish separate lineages.(Kirk, 1999) Separate lineages are represented as hyphens (i.e. B-A-K).
Ambiguities amongst the groupings are defined as those that have d�s of less than 0.5. Repeated analyses of
the same genes using other species within the same domain yielded similar results. (i.e. Inosine 5'
monophosphate dehydrogenase and Argininosuccinate synthetase)
Three subsets of analyses for each protein on NJ and parsimony were performed (see Tables 3 and 4
respectively). Of the 420 total analyses, 85.95% conformed to grouping into three monophyletic domains,
B-A-K (Table 5). 9.29% of the analyses do not distinguish between the two domains of AK, BA and BK
enough to group them into separate lineages, i.e. B-(AK), (BA)-K and (BK)-A. Only 4.76% of the analyses
fail to distinguish the 3 domains individually (i.e. BAK). The NJ and parsimony methods yielded slightly
varying results as expected (Table 6). Additionally, the parsimony and NJ results could yield conflicting
relationships between the domains (i.e. Seryl-tRNA synthetase, RPS 13, RPS15, etc.) (Tables 3 and 4).
However, with the Bonferroni adjustment with three planned comparisons, there are no significant
differences amongst the d�s for all of the two ingroup/outgroup columns as estimated by the paired t-test (p
> 0.017) (See legend d in Tables 3 and 4). Repeated analyses of the same genes using other species within
the same domains yielded similar results.
The usual assumption in molecular phylogenetic studies is descent from a common organismal ancestor. If
correct, genetic lineages should converge in terms of protein similarity within protein classes depending on

5
evolutionary divergence points. But in situations such as the endosymbiotic capture, lateral gene transfer, or
chimeric fusion, phylogenies of different genes should yield conflicting results. In our study, the proportion
of groupings representing three monophyletic lineages was exceedingly high in comparison with all other
combinations of groupings, implying that gene transfer after the divergence of the three domains is a low
frequency phenomenon in comparison with inheriting genes from organismal ancestors. The robust nature
of the grouping (both overall and within the various protein classes) representing three monophyletic
domains suggests three independent lineages with little or no genetic transfer. Individual exceptions to this
statement should and do exist (Brown and Doolittle, 1997, Doolittle and Handy, 1998), but the overall
pattern is one of vertical inheritance rather than horizontal transfer.
Similar to the work of Jain et al. (1999) and others, our results show a slightly higher incidence of
anomalous phylogenies among the metabolic genes than among the informational genes (see Table 6),
indicating the possibility of an infrequent occurrence of inter-domain gene transfer after the origin of the
three domains. The overall frequency of anomalous phylogenies is only 14%, and in no category does the
frequency of anomalous phylogenies exceed 36.67%; thus, we infer that large-scale inter-domain transfers
have not been a major factor in the evolution of the three domains. In contrast to the findings of Doolittle
and Handy (1998), we found no significant anomalous phylogenies among the aminoacyl-tRNA
synthetases. This is undoubtedly because the broader taxonomic sampling of Doolittle and Handy (1998) is
more likely to reveal isolated examples of individual gene transfers.
Regarding the origin of the three domains themselves, the results of this study reflect positively on Jain et.
al�s (1999) complexity hypothesis albeit in a much smaller scale than originally proposed. Gene transfer
has been continual throughout the history of the monophyletic evolution of the three domains, but the
coherence of the domains argues that transfer cannot have played a major role in genomic evolution of
most organisms. Alternatively, Woese�s genetic annealing hypothesis (1998, 2000) cannot be ruled out
using our present data. Gene transfer may well have been widespread prior to the emergence of the three
domains. Our results would be consistent with that history. For Gupta�s hypothesis, if the gram-positive
bacteria/archaic clade represented a phylogenetic lineage distinct from the gram-negative bacteria, our
results should have clearly shown this, but this was not the case. We find that the domains Archaea,
Bacteria, and Eukarya are monophyletic after their emergence from the universal ancestor. Similar results
using large combined alignments of 23 orthologous proteins conserved across 45 species from all domains
also strongly supports separate monophyletic domains. (Brown et al, 2001)
The Search for a universal ancestor
The reconstruction of the Tree of Life based on a common ancestor demands a universal ancestor
(cenancestor). Analysis of 66 proteins gauging the interdomain relationship suggests Archaea and Eukarya

6
were the nearest domains in 34 comparisons, Archaea and Bacteria were the nearest domains in 21
comparisons, and Bacteria and Eukarya were the nearest domains in the remaining 11.(Brown and
Doolittle, 1997). A popular model in which two lineages emerged leading to Bacteria and Achaea which
later diverged into Eukarya was proposed. Protein similarities or the lack thereof incongruent with this
model were explained by lateral or horizontal gene transfer (HGT, or exchange of genetic information
across major taxa) or specific gene losses which occurred after the development of the three domains.
Woese (1998, 2000), while affirming the Darwinian universal genealogical tree of all life, traced a
universal phylogenetic tree, not to a universal cellular ancestor, but rather, to a universal communal gene
pool that he popularized, progenotes (Woese, 1998). In a way analogous to physical annealing while
temperature is cooled, the rampant activities of mutation and HGT amongst this universal gene pools until
the precursors of the individual domains are �crystallized� so that the components in each of them have
little functional significance in another pool. Therefore HGT was a pervasive mechanism in this universal
gene pool and it became restrictive to within each individual domain but not between different domains
when the different organismic lineages emerged. This cellular complexity that became refractory to global
HGT first appeared in the translational machineries especially in its RNA component and then followed by
other systems such as metabolic enzymes and transmembrane proteins (Woese, 2000). Doolittle (2000)
came close to admitting the possibility of the absence of a cellular ancestor because of the need to
accommodate rampant HGT and opened up the possibility of a polyphyletic origins of the three domains of
life. In other words, the investigation of the early cellular evolution is in a state of serious confusion
(Doolittle, 1999b).
Horizontal Gene transfer: A challenge to the concept of the Universal Cellular Ancestor?
Mendelian genetics accounts for vertical inheritance from parents to offspring within the same taxon.
However, HGT is only observed readily in prokaryotes and in some lower eukaryotes in the forms of
transduction, conjugation, or transformation (Madigan, et.al. 2000). Although it is proposed to account for
sequence similarities amongst the three domains of life (Gogarten et.al. 1999), it lacks mechanistic content
in regards to inter-domain gene exchanges. Models of HGT are predicated on the Darwinian paradigm of a
common ancestor in a universal tree of life. The recently published draft of the human genome raised the
issue of role of HGT from prokaryotes to vertebrate eukaryotes although there is no consensus on this
debate. (International Human Genome Sequencing Consortium, 2001, Celera Genomics, 2001). Since there
is confusion in the investigation of early cellular evolution, it is far from settled whether a universal cellular
ancestor existed. However, the implication of polyphyletic origins of the three domains of life from a
universal pool of progenotes seems to demand a mechanism beyond the realm in which Darwinian natural
selection can operate (Doolittle, 2000; Woese, 1998, 2000, 2002). Theories explaining the origin of life on
the basis of the �RNA world�(Joyce and Orgel, 1993) and the deterministic processes of self organizing
properties intrinsic to the primordial earth (DuDuve, 1995) have not solved the problem of the origin of

7
information carried by the sequence of the nucleic acids (Meyer, 2000). A new theory accounting for origin
of intermediary metabolism presupposes a pruning or constraining algorithm, which may be physical,
chemical, biological, and informational, or a combination thereof. (Morowitz et.al., 2000). The
thermodynamic constraints (Shuster, 2000) thus applied resulted in the selection of 153 organic molecules
from Beilstein, the most comprehensive encyclopedia of organic chemistry, which contain all 11 members
of the most basic network of intermediary metabolism, the reductive citric acid cycle. This is an example of
a new way of scientific thinking, emergence, or hierarchical reductionism: the whole is greater than the
sum of its parts. (Morowitx, 2002). Various pruning algorithms are applied to different hierarchy of
emergences, from matter to spirit. However, these constraints may also be consistent with Complex
Specified Information as a design inference (Dembski, 1998, 1999, 2001). They also seem to follow the
criteria of design as involving �directly or indirectly, free, deliberate, intentional agent activity, aimed at
generating some phenomenon typically embodying a mind-correlative pattern, which, if left to itself, nature
would not (normally) produce.�(Ratzsch, 2001) The pruning algorithm (or agent) was selected deliberately
to generate the 11 compounds of the reductive citric acid cycle (a mind-correlative pattern), when if left to
itself, nature would not normally produce. Since natural selection cannot operate at the pre-cellular stage of
the progenotes, might there be a specific pruning algorithm or constraint that can be applied to the
emergence of the genetic communities from the universal gene pool such that they will be crystallized into
the three domains of life?
8
Table 1: Comparison of Eucaryotic and Prokaryotic cells
PROCARYOTIC CELL
EUCARYOTIC CELL
GROUPS WHERE FOUND AS UNIT OF STRUCTURE
BACTERIA,
BLUE-GREEN ALGAE
MOST ALGAE, FUNGI PROTOZOA, HIGHER
PLANTS AND ANIMALS
Nuclear Membrane � + Mitotic Division � + Chromosome Number 1(?) Always Greater Than One Cytoplasmic Streaming � + or � Mitochondria � + Chloroplasts � + or � Contractile Locomotor Organelles
Bacterial Flagella Axial Filaments in some
Multistranded Flagella or Cilia in some
Ameboid Movement � + or � Chromosomal Protein � + Nucleolus � + 9 + 2 Structure in Cellular Appendages
�
+
Golgi Apparatus � + or � Endoplasmic Reticulum � + Ribosomes
70S 80S (Cytoplasmic) 70S (Organellar)

9

10
Table 2: Summary of major differentiating features among Bacteria, Archaea, and Eukaryaa, b
a
Characteristic Bacteria Archaea Eukarya Prokaryotic cell structure Yes Yes No DNA present in covalently closed and circular form
Yes Yes No
Histone proteins present No Yes Yes Membrane-enclosed nucleus Absent Absent Present Cell wall Muramic acid
present Muramic acid absent Muramic acid absent
Membrane lipids Ester-linked Ether-linked Ester-linked Ribosomes 70S 70S 80S Initiator tRNA Formylmethionine Methionine Methionine Introns in most genes No No Yes Operons Yes Yes No Capping and poly-A tailing of mRNA
No No Yes
Plasmids Yes Yes Rare Ribosome sensitivity to diphtheria toxin
No Yes Yes
RNA polymerases One (4 subunits) Several (8-12 subunits each)
Three (12-14 subunits each)
Transcription factors required No Yes Yes
Promoter structure -10 and �35 sequences (Pribnow box)
TATA box TATA box
Sensitivity to chloramphenicol, streptomycin, and kanamycin
Yes No No
Methanogenesis No Yes No Reduction of S0 to H2S or Fe3+
Fe2+ Yes Yes No
Nitrification Yes No No Denitrification Yes Yes No Nitrogen fixation Yes Yes No Chlorophyll-based photosynthesis
Yes No Yes (in chloroplasts)
Chemolithotrophy (Fe, S, H2) Yes Yes No Gas vesicles Yes Yes No Synthesis of carbon storage granules composed of poly-β-hydroxyalkanoates
Yes Yes No
Growth above 80°C Yes Yes No a Note that for many features only particular representatives within a domain show the property. b Adapted with permission from Table 12.3, Biology of Microorganisms, by Madigan, Martinko and Parker, Prentice Hall, 2000

11
TABLE 3: 4 taxa analyses of Neighbor Joining distances as measured by d values obtained from pairwise comparisons
between species within the same domain (ingroup) and between species of two different domains (ingroup/outgroup)a
3 A 1 B 3 A 1 K 3 B 1 A 3 B 1 K 3 K 1 A 3 K 1 B
DNA synthesis Topoisomerase I 2.425865 2.669138 4.365063 7.046429 2.015413 4.694234
Transcription RNA Polymerase subunit A 8.550514 6.499713 6.296476 11.19691 1.258097 4.662997
RNA Polymerase subunit B 8.333718 11.05004 6.54597 8.01662 2.869581 12.15119
Translation Alanyl-tRNA synthetase 10.48018 14.35547 6.932123 1.9045 12.34256 4.988126
(aminoacyl-tRNA synthetases Aspartyl-tRNA synthetase 10.07547 13.89807 4.397734 12.57243 5.60298 8.99439
and elongation factors) Histidyl-tRNA synthetase 5.400502 5.625913 6.309885 11.58169 4.576737 7.10963
Isoleucyl-tRNA synthetase 5.884458 3.654536 3.840167 6.443964 10.50844 11.68186
Lysyl-tRNA synthetase 5.801957 6.378536 12.24134 1.572325 11.75166 4.813168
Methionyl-tRNA synthetase 3.030693 3.875524 -0.47733+ 0.053119+ 4.489012 3.366238
Seryl-tRNA synthetase 0.564095 0.751593 0.902697 2.090663 0.934657 1.141011
Threonyl-tRNA synthetase 10.95221 10.60724 10.4773 3.352697 14.73694 7.052162
Tryptophanyl-tRNA synthetase 3.458452 1.641817 3.233482 6.36127 3.261609 5.449539
Tyrosyl-tRNA synthetase 4.946913 2.637877 7.217573 9.162542 4.130168 9.006909
Valyl-tRNA synthetase 6.944471 6.577877 5.622093 2.086238 10.07869 3.495736
EFG 10.02705 12.56153 13.25872 22.00327 7.374463 10.80744
EFTU 8.283279 3.019429 16.43295 18.86874 4.541272 12.64965
Translation(ribosomal proteins) RP L2 8.033114 4.183989 7.783404 16.26909 2.800233 5.850763
RP L3 8.346263 4.731174 9.169058 11.21214 11.11747 11.32213
RP L5 4.832026 2.299371 3.811596 6.031977 6.715524 12.44565

12
RP L6 6.032922 3.635271 8.90574 10.63961 4.675371 4.195127
RP L11 2.02601 3.397762 9.755808 12.05037 7.231043 8.972034
RP L13 3.875092 4.339421 3.484009 4.248353 7.676802 5.065983
RP L14 4.717789 3.201212 5.759651 11.73742 10.37709 17.09212
RP L15 4.678269 3.597705 5.817614 5.700324 5.182529 5.519944
RP L22 2.280295 2.566729 3.436419 5.765489 4.96957 5.784356
RP S3 7.094445 6.587102 8.37842 12.80231 8.227666 13.85075
RP S4 10.45883 5.755453 7.027778 5.359134 4.705402 6.903423
RP S5 5.221323 4.531926 4.458939 3.980542 9.339481 8.375188
RP S7 3.967652 1.383791 5.179935 5.235539 5.763569 8.105104
RP S8 5.764757 2.770651 4.305347 5.552367 9.588174 11.96894
RP S9 4.377231 2.519016 2.808853 3.099939 5.519817 8.163763
RP S10 6.982472 8.075887 5.384902 3.735241 8.583352 8.896095
RP S11 9.571898 3.633321 2.708759 4.391194 5.159107 14.45112
RP S12 6.966376 2.781513 9.282328 12.7398 5.092316 10.73942
RP S13 2.350179 0.896496 5.389141 4.990714 6.551423 6.625785
RP S15 4.508114 1.360359 7.366926 9.213613 5.85749 8.513674
RP S17 4.228876 3.329663 3.775771 5.266656 9.395147 3.498226
RP S19 3.362313 3.343713 5.148133 7.394784 7.5393 9.184511
Biosynthesis (pyrimidines and purines) Adenylosuccinate synthase 10.34674 9.312978 1.580922 6.545712 6.545712 4.983417
Argininosuccinate lyase 2.077386 2.64909 2.592517 1.80623 2.596425 1.207013
Aspartate transcarbamoylase 3.172877 2.537617 -0.15323* 0.71388* 0.116314++ 2.292724++

13
CTP synthase 2.20526 3.875606 -0.48925* 2.205425* 1.059454 1.682138
Dihydro-orotase 2.482885 2.275617 4.060343 3.188276 -0.00381+ 0.059053+
Inosine 5' monophosphate dehydrogenaseb 2.966254 6.069944 1.916606 5.503693 5.959759 4.810327
Inosine 5' monophosphate dehydrogenaseb 3.001449 5.444483 3.604289 7.240405 3.307368 2.800365
Nucleoside diphosphate kinase 2.600565 2.910789 -0.11253+ -0.36813+ 3.473889 2.253486
Serine hydroxylmethyl-transferase 7.639994 8.042556 11.20126 4.377509 8.947983 3.681123
Biosynthesis (amino acids) Argininosuccinate synthetaseb 3.676644 5.981398 2.282775 4.876388 40.07526 31.15312
Argininosuccinate synthetaseb 3.601791 5.784803 2.109738 4.512754 2.999101 3.121791
Chrismate synthase 1.047015 2.184124 0.255894+ 0.422024+ 1.264819 0.741218
Glutamine synthetase 1.910787 4.624558 0.88194 3.937935 5.506518 4.1325
hisD product 0.938341 1.027258 0.464528+ 0.150131+ 2.144213 1.477558
Methionine aminopeptidase 7.43407 5.961264 3.968743 6.843636 5.100095 8.412203
Ornithine transcarbamoylase 1.393398 4.125869 -0.59833* 1.484952* -0.06913+ -0.01365+
trpB product 0.566339++ 0.347684++ 0.226153+ -0.33282+ 0.35406+ -0.09892+
trpC product 0.880984 1.566121 -0.24955+ 0.309951+ 6.549307 1.81533
Biosynthesis (porphyrins) 5'Aminolevulinic acid dehydratase 3.44493 5.269262 0.566539 2.110579 0.548359** 0.482805**
Glutamyl-tRNA reductase 12.32934 2.911192 8.69422 1.758346 -0.26637+ -0.40601+
Central metabolism Acetyl-CoA synthase 1.100762 1.900968 0.969107** 0.268286** 2.695585** 0.356196**
Adenylhomocysteinase 1.227794 5.670255 -0.76481* 0.176183* 7.067481 2.912659
Enolase -0.15191+ 0.350178+ 1.919142 4.380932 2.923901 7.095949
Glyceraldehyde 3-phosphate dehydrogenase 13.27622 8.627617 7.667763** -0.5135** 8.411295 2.059158
Peptidylprolyl-cis-trans isomerase 2.374129 6.037126 0.67996 4.526522 0.259228++ 0.781774++

14
Phosphoglycerate kinase 2.267047 3.96564 2.657607 0.488554 8.880773 5.396645
Protein-L-isoaspartate-O-methyltransferase 3.931223 4.490642 -0.12623* 0.623949* 4.768992 4.305801
Ribosephosphate pyrophosphokinase 2.956937 3.772016 4.671677 1.570705 3.502506** 0.339275**
Superoxide dismutase (Mn) 3.616171 1.13814 5.125609 3.173079 4.861756 2.833747
Triose phosphate isomerase 4.974146 6.365248 4.262532** 0.064757** 10.07005 5.764093
Membrane Preprotein translocase secY 11.6246 4.472734 5.861304 8.710552 5.427163 9.661261
Chaperon Heat shock protein 60 13.44378 11.07189 15.08218 26.78237 5.440546 12.71524
paired t test .481c .1369d -1.025c 0.0281d -0.333c 0.4867d
aThe differences of Neighbor Joining distances are statistically significant at the p < 0.05 level using
student t test with equal or unequal variances. Proteins are grouped into the three domains (B-A-K)
based upon an analysis on the effect size (d, the difference between independent means of ingroups
and outgroups divided by the standard deviation which is the degree to which the null hypothesis is
false) of Neighbor Joining distances. Statistically insignificance or negative differences in d�s (< 0.5)
are indicated by the italics and lack of hyphens between the groups: i.e. BAK+, B-(AK)++, (BA)-K*,
(BK)-A**.
bRepeated analyses using different species of the same domains.
cMean differences of d�s in the comparison between all of the sequences in two ingroup/outgroup
columns by paired t test analysis.
dp values of paired t test analysis for null hypothesis of no difference of d�s in the comparison
between all of the sequences in two ingroup/outgroup columns. The Bonferroni adjustment with
three planned comparisons (3A1B/3A1K; 3B1A/3B1K; 3K1A/3K1B) can reduce the significance level
to 0.017 (3 times 0.017 gives .05). ( Aron and Aron, 1999)

15
Table 4: 4 taxa analyses of parsimony steps as measured by d values obtained from pairwise comparisons between species
within the same domain (ingroup) and between species of two different domains (ingroup/outgroup)a
3 A 1 B 3 A 1 K 3 B 1 A 3 B 1 K 3 K 1 A 3 K 1 B
DNA synthesis Topoisomerase I 1.3706018 2.7821192 0.049484* 0.856147* 0.7335481 0.8740844
Transcription RNA Polymerase subunit A 3.4533153 7.0811108 1.5866542 4.6651135 -0.96719++ 1.3413819++
RNA Polymerase subunit B 3.0068864 2.5887286 1.5725337 5.2827012 1.0238204 4.698922
Translation Alanyl-tRNA synthetase 8.4767845 9.2020544 4.3048616 1.6788991 3.9788592 3.3666902
(aminoacyl-tRNA synthetases Asparyl-tRNA synthetase 7.5286684 10.922658 2.0212973 4.8931258 1.8685671 3.5349373
and elongation factors) Histidyl-tRNA synthetase 3.2958297 9.0710193 4.1038739 6.2658704 4.2754518 11.72631
Isoleucyl-tRNA synthetase 2.2364377 5.2883643 2.6632756 3.6544159 3.3524667 6.4596799
Lysyl-tRNA synthetase 5.4760961 6.1843668 9.94454 1.0883617 4.6218736 3.4439812
Methionyl-tRNA synthetase 3.4184336 2.2448813 1.5260945 1.283383 0.9264348 0.9958263
Seryl-tRNA synthetase 0.8938277 0.9640493 -0.35709* 1.2131787* 0.123302++ 4.210477++
Threonyl-tRNA synthetase 11.394439 13.730879 19.314739 6.6853665 6.3727957 4.0486328
Tryptophanyl-tRNA synthetase 1.5601568 2.2732348 2.0710589 4.3730477 1.9122434 2.2271063
Tyrosyl-tRNA synthetase 2.7839589 2.0944372 3.0489991 8.1766015 2.2171276 5.3488794
Valyl-tRNA synthetase 5.8743962 5.0433621 3.8319439 1.0929649 1.6954226** 0.475683**
EFG 4.0110771 3.4042815 10.01793 12.851717 2.7210027 3.3517673
EFTU 1.3816495 0.847901 16.064015 21.889732 3.8736395 22.241935
Translation(ribosomal proteins) RP L2 14.374802 5.6880138 6.168864 8.8700864 2.6402564 4.0608454
RP L3 24.647583 29.845748 9.8194401 11.068913 6.8289129 5.3079458
RP L5 3.6089364 2.6644636 2.184888 3.0451008 4.3300445 6.2858377
RP L6 4.2638673 3.8867907 9.8550648 12.716044 4.1827366 6.9171334

16
RP L11 1.3056855 1.3548938 7.4257214 10.314508 7.2635624 9.8634719
RP L13 1.5395078 2.4784743 2.421705 3.2173369 2.0608115 3.9839973
RP L14 16.79486 15.335453 25.640438 37.042956 14.494523 19.471683
RP L15 1.4540532 1.8475153 4.1128688 3.7569592 3.510433 2.4967106
RP L22 0.218432* 1.3371741* 2.2765623 2.6271959 2.3619642 1.90689
RP S3 2.1780101 2.4926616 5.0190034 10.653103 3.3469061 3.6018405
RP S4 24.556843 18.095433 14.313725 13.339527 1.5652588 4.2797566
RP S5 1.7328153 1.4457166 3.3067086 3.4964117 4.847476 3.7989966
RP S7 2.6769275 2.6610044 3.3905234 4.6943053 2.7470913 5.6108849
RP S8 3.6940492 2.2758899 2.9971494 3.4029337 6.8595112 11.793564
RP S9 3.7822969 2.3644667 1.7206778 1.7684166 4.3343352 5.3295484
RP S10 7.204636 9.3399526 4.3766773 5.860812 3.7379647 4.819793
RP S11 9.0838476 5.5557331 1.755411 2.4760084 3.3659266 6.2214618
RP S12 3.2779731 2.0775059 5.3511409 5.6848071 5.0494731 8.9561084
RP S13 0.003435* 0.5818534* 3.6339176 4.7575129 3.7856631 3.8421613
RP S15 0.7537964++ -1.38558++ 7.0735294 14.31886 3.7179416 3.7070497
RP S17 1.1752336 2.5349031 3.3976593 3.1715374 3.6009259 1.682321
RP S19 1.0738405 3.0726012 4.4243405 4.4584283 2.5848626 2.5988892
Biosynthesis(pyrimidine and purine) Adenylosuccinate synthase 13.628533 9.120675 0.679126 1.2555184 2.3315799 3.4538153
Argininosuccinate lyase 1.3901582 1.7436943 2.0760491 1.4937131 1.8060808 0.9422392
Aspartate transcarbamoylase 2.5612447 1.0191553 -1.69549+ -0.38619+ 0.338168++ 0.9597468++
CTP synthase 2.2606056 1.7988628 -0.61723* 0.9817685* 0.8065065 1.1494777
Dihydro-orotase 1.7857473 1.0524691 2.9066398 1.8598842 4.1433039 2.7579809

17
Inosine 5' monophosphate dehydrogenaseb 2.339885 3.9106072 1.7042835 3.3694149 3.5771179 3.0253698
Inosine 5' monophosphate dehydrogenaseb 1.6799224 3.446211 0.679203 1.9656599 2.0323751 2.3150474
Nucleoside diphosphate kinase 0.328157* 3.1341506* -0.04494+ 0.00+ 2.1129706 1.477563
Serine hydroxylmethyl-transferase 4.2699826 2.6314899 9.486284 1.3564222 3.4609851 1.8621938
Biosynthesis (amino acids) Argininosuccinate synthetaseb 5.039236 7.626859 1.4399372 5.1590811 29.981093 34.619241
Argininosuccinate synthetaseb 5.2916013 8.0963171 1.2873666 4.3379435 1.9863247 2.3458244
Chrismate synthase 1.3863395 3.8298901 0.6352095 0.826114 -0.16487+ -0.19101+
Glutamine synthetase 0.9187298 1.4742233 1.2468115 2.4871121 3.0371112 2.5091879
hisD product 2.3516255 2.2220597 0.7350024 0.9622571 0.246397+ 0.209246+
Methionine aminopeptidase 1.1941248 4.4015488 1.986549 4.0793473 1.4108313 1.4699611
Ornithine transcarbamoylase 1.207012 5.0462724 0.247345* 1.2979743* 0.006971+ 0.304284+
TrpB product 0.6135051 0.9095615 0.252801+ -0.33078+ -0.26722+ -0.34712+
TrpC product 0.6749084 2.5727465 -1.41766* 1.5190318* -0.38947+ 0.385957+
Biosynthesis (porphyrins) 5'Aminolevulinic acid dehydratase 2.8311148 5.8701946 0.9055461 3.1449444 0.9272816 1.0154576
Glutamyl-tRNA reductase 1.0120861 6.6077202 9.8922639 1.1085231 0.6688658** -0.1939**
Central metabolism Acetyl-CoA synthase 0.393795* 1.116999* 1.6709451 0.951743 1.3711129** -0.12298**
Adenylhomocysteinase 0.9672576 5.5396294 0.9709534** 0.283225** 4.7640435 1.9172425
Enolase 0.396459* 0.7884533* 1.2443963 4.7901716 2.3614725 5.6413383
Glyceraldehyde 3-phosphate dehydrogenase 14.723487 7.4311361 -1.71328* 1.5563298* 6.2686058 1.5118321
Peptidylprolyl-cis-trans isomerase 0.310463* 3.4058275* 0.400398* 6.0964981* -1.14182+ -1.67242+
Phosphoglyceragte kinase 1.2681259 3.560687 1.9008338** 0.430519** 5.85926 6.1965526
Protein-L-isoaspartate-O-methyltransferase 1.0491945 3.9117577 0.4714942* 0.9682615* 6.0062509 0.9108006
Ribosephosphate pyrophosphokinase 3.4207233 3.3265766 2.2780167 1.255728 3.5931077 2.5149622

18
Superoxide dismutase (Mn) 4.1311269 3.425056 4.1003164 2.7153223 2.5725835 1.9159015
Triose phosphate isomerase 3.4353892 4.1532853 2.9755709** -0.28349** 4.7036455 5.0778748
Membrane Preprotein translocase secY 7.448576 4.4098105 2.4137986 3.1824063 3.0562447 3.5479375
Chaperon Heat shock protein 60 8.4506664 6.3408001 11.391225 11.662757 2.2842679 4.0457032
Paired t test -0.413c 0.2011d 1.301c 0.0655d -0.868c 0.0195d
aThe differences of Parsimony Steps are statistically significant at the p < 0.05 level using student t
test with equal or unequal variances. Proteins are grouped into the three domains (B-A-K) based
upon an analysis on the effect size (d, the difference between independent means of ingroups and
outgroups divided by the standard deviation which is the degree to which the null hypothesis is false)
of Parsimony Steps. Statistically insignificance or negative differences in d�s (< 0.5) are indicated by
the italics and lack of hyphens between the groups: i.e. BAK+, B-(AK)++, (BA)-K*, (BK)-A**.
bRepeated analyses using different species of the same domains.
cMean differences of d�s in the comparison between all of the sequences in two ingroup/outgroup
columns by paired t test analysis.
dp values of paired t test analysis for null hypothesis of no difference of d�s in the comparison
between all of the sequences in two ingroup/outgroup columns. The Bonferroni adjustment with
three planned comparisons (3A1B/3A1K; 3B1A/3B1K; 3K1A/3K1B) can reduce the significance level
to 0.017 (3 times 0.017 gives .05) (Aron and Aron, 1999)

19
Table 5. Total number of grouping in the NJ and PAUP analyses as
percentages out of 420a
Grouping B-A-K BAK B-(AK) (BA)-K (BK)-A
frequencies 361 20 7 19 13
percentage 85.95 4.76 1.67 4.52 3.10
aSee Tables 3 and 4 for definition of groupings.

20
Table 6. Summary of groupings in NJ and PAUP analyses in individual classes of proteinsa
B-A-K BAK B-(AK) (BA)-K (BK)-A
RNA Polymerase a and b/ Topoisomerase I NJ (9) 9 0 0 0 0
% of NJ 100% 0.00% 0.00% 0.00% 0.00%
PARS (9) 7 0 1 1 0
% of PARS 77.78% 0.00% 11.11% 11.11% 0.00%
total=18 16 0 1 1 0
% of total 88.88% 0.00% 5.56% 5.56% 0.00%
Aminoacyl tRNAsynthetases and Elongation Factors NJ (39) 38 1 0 0 0
% of NJ 97.44% 2.56% 0.00% 0.00% 0.00%
PARS (39) 36 0 1 1 1
% of PARS 92.31% 0.00% 2.56% 2.56% 2.56%
total=78 74 1 1 1 1
% of total 94.87% 1.28% 1.28% 1.28% 1.28%
Ribosomal Proteins NJ (66) 66 0 0 0 0
% of NJ 100% 0.00% 0.00% 0.00% 0.00%
PARS (66) 63 0 1 2 0
% of PARS 95.45% 0.00% 1.52% 3.03% 0.00%

21
total=132 129 0 1 2 0
% of total 97.73% 0.00% 0.76% 1.52% 0.00%
Biosynthetic Proteins NJ (60) 45 9 2 3 1
% of NJ 75.00% 15.00% 3.33% 5.00% 1.67%
PARS (60) 46 8 1 4 1
% of PARS 76.67% 13.33% 1.67% 6.67% 1.67%
total=120 91 17 3 7 2
% of total 75.83% 14.17% 2.50% 5.83% 1.67%
Metabolic Proteins NJ (30) 20 1 1 2 6
% of NJ 66.67% 3.33% 3.33% 6.67% 20.00%
PARS (30) 19 1 0 6 4
% of PARS 63.33% 3.33% 0.00% 20.00% 13.33%
total= 60 39 2 1 8 10
% of total 65.00% 3.33% 1.67% 13.33% 16.67%
HSP60 and SecY NJ (6) 6 0 0 0 0
% of NJ 100% 0.00% 0.00% 0.00% 0.00%
PARS (6) 6 0 0 0 0

22
% of PARS 100% 0.00% 0.00% 0.00% 0.00%
total=12 12 0 0 0 0
% of total 100% 0.00% 0.00% 0.00% 0.00%
aSeeTables 3,4 and 5 for explanation.

23
Acknowledgement: This project was supported in part by a grant from the Discovery Institute and
Fieldstead & Co. to PPP and Wheaton College summer student research funds to SS and BTP. The authors
thank Dr. Todd Wood of Bryan College for providing the original sequences and some of the analysis
software as well as critical advices to the manuscript. We are also appreciative to Drs.Terrance Perciante
and Trey Buchanan for advices on statistics, Erich Enke and Dustin Lang for writing programs for data
entry and analysis for the operation of PAUP, and to Carla Ihm for performing some of the computational
analyses. This paper has been presented as poster H123 at the 100th General Meeting of the American
Society for Microbiology in May of 2000. A modified version is also presented by one of us (PPP) at 57th
Annual Meeting of the American Scientific Affiliation in August, 2002.
References:
Altschul, S.F., T.L. Madden, A.A. Schäffer, J. Zhang, Z. Zhang, W. Miller, and D.J. Lipman. 1997.
Gapped BLAST and PSI-BLAST: A new generation of protein database searching programs. Nucleic
Acids Res. 25: 3389-3402
Aron, A, and E.L. Aron. 1999. Statistics for Psychology, 2nd ed. Bonferroni procedure, p. 364-365.
Prentice Hall, NY.
Brown, J.R. and W.F. Doolittle. 1997. Archaea and the Prokaryote-to-Eukaryote Transition. Microbiol.
Molec. Biol. Rev. 61:456-502.
Brown, J.R, C.J. Douady, M.J. Italia, W.E. Marshall and M.J. Stanhope, 2001. Universal trees based
on large combined protein sequence data sets. Nature Genetics 28:281-285.
Bult, C.J., O. White, G.J. Olsen, L. Zhou, R.D.Fleischmann, G.G. Sutton, J.A. Blake, L.M.
Fitzgerald, R.A. Clayton, J.D. Gocayne, A.R. Kerlavage, B.A. Dougherty, J.F. Tomb, M.D. Adams,
C.I. Reich, R. Overbeek, E.F. Kirkness, K.G. Weinstock, J.M. Merrick, A. Glodek, J.L. Scott, N.S.M.
Geoghagen, J.F. Weidman, J.L. Fuhrmann, D. Nguyen, T.R. Utterback, J.M. Kelley, J. D. Peterson,
P.W. Sadow, M.C. Hanna, M.D. Cotton, K.M. Roberts, M.A.Hurst, B.P Kaine, M. Borodovsky, H.P.
Klenk, C. M Fraser, H.O. Smith, C. R. Woese, and J. C. Venter. 1996. Complete genome sequence of
the methanogenic archaeon, Methanococcus jannaschii, Sc. 273:1058-1073
Celera Genomics. 2001. The Sequence of the Human Genome. Science 291: 1304-1351
Cohen, J. 1992. A power primer. Psych. Bull. 112:155-159.
24
Dembski, W. 1998. The Design Inference. Cambridge Univ. Press, Cambridge.
Dembski, W. 1999. Intelligent Design: The Bridge between Science and Theology. Chapter 5: Reinstating
Design within science. Intervarsity Press, Downers Grove.
Dembski, W. 2002. No Free Lunch: Why Specified Complexity Cannot Be Purchased without Intelligence.
Rowman & Littlefield Publishers, Lanham, MD.
Doolittle, R.F. and J. Handy. 1998. Evolutionary anomalies among the aminoacyl-tRNA synthetases.
Current Opinion in Genetics & Development 8:630-636.
Doolittle, W.F. 1999a. Lateral gene transfer, genome surveys, and the phylogeny of prokaryotes. Science
286: 1443a.
Doolittle, W.F. 1999b. Rethinking the Origin of Eukaryotes. Biol. Bull. 196: 378-380.
Doolittle, W. F. 2000. The nature of the universal ancestor and the evolution of the proteome. Curr. Opin.
Struct. Biol. 10: 355-358.
DuDuve, C. 1995. The Beginning of Life on Earth. Am. Scient. 83: 437.
Felsenstein, J. 1995. PHYLIP (Phylogeny Inference Package) version 3.57, Department of Genetics,
University of Washington, Seattle, Wash. (Distributed by the author),
Gogarten, J.P., R.D. Murphey, and L. Olendzenski. 1999. Horizontal Gene Transfer: Pitfalls and
Promises. Biol. Bull. 196:359-362
Gupta, R. 1998a. Life�s third domain (Archaea): An established fact or an endangered paradigm. Theor.
Pop. Biol. 54:91-104.
Gupta, R. 1998b. Protein phylogenies and signature sequences: A reappraisal of evolutionary
relationships among archaebacteria, eubacteria, and eukaryotes. Microbiol. Mol. Biol. Rev. 62:1435-1491.
International Human Genome Sequencing Consortium, 2001. Initial sequencing and Analysis of the
human genome. Nature 409: 860-921.
Jain, R., M.C. Rivera, and J.A. Lake. 1999. Horizontal gene transfer among genomes: The complexity
hypothesis. Proc. Natl. Acad. Sci. USA 96:3801-3806.

25
Joyce, G and L. Orgel. 1993. Prospect for understanding the origin of the RNA world. In: ed. R.F.
Gesteland, J.F. Atkins. RNA World, Cold Spring Harbor, NY, p. 1-25
Kirk, R.E. 1999. Statistics: An Introduction. Sec.10.4. More About Hypothesis Testing. p. 323-324, Sec.
10.6, Practical Significance, p. 333-334. Harcourt Brace, NY
Madigan, M.T., J.M. Martinko, and J. Parker. 2000. Chapter 9, Biology of Microorganisms, 9th ed.
Prentice Hall, NJ.
Meyer, S. 2000. DNA and the origin of Life: Information, Specification, and Explanation. Monograph
distributed in the �Design, Self-Organization, and the Integrity of Creation� seminar in Christian
Scholarship, Calvin College, June 19- July 28.
Morowitz, H., J.D. Kostelnik, J. Yang and G.D. Cody. 2000. The origin of intermediary metabolism.
Proc. Natl. Acad. Sci. 97: 7704-7708
Morowitz, H. 2002. Emergence: Twenty-Eight Steps from Matter to Spirit, (In Press, Oxford Univ. Press,
Oxford)
Murray, R.G.E. 1968. Microbial structure as an aid to microbial classification and taxonomy, Spicy
Prirodoved Fak. Univ. J. E. Purkyne Brne 43: 249-252.
Ratzsch, D. 2001. Nature, Design, and Science: The Status of Design in Natural Science, Chap. 1,
SUNY Press, Albany.
Schuster, P. 2000. Taming combinatorial explosion. Proc. Natl. Acad. Sci. 97: 7678-7680.
Swofford, D. 1996. PAUP*: Phylogenetic Analysis Using Parsimony (and Other Methods), version 4.0
(Sunderland, MA: Sinauer Associates). Get updates from www.lms.si.edu/PAUP.
Thompson, J. D., D. G. Higgins, and T. J. Gibson. 1994. CLUSTAL W: improving the sensitivity of
progressive multiple alignment through sequence weighting, position-specific gap penalties and weight
matrix choice. Nucleic Acids Res. 22: 4673-4680.
Woese, C. R. 1987. Bacterial evolution, Microbiol. Rev. 51: 221-271.

26
Woese, C. R. 1992. Prokaryote systematics: the evolution of a science. In ed: A. Balows, H.G. Truper, M.
Dworkin, W. Harder, and K.H. Schleifer, The Prokaryotes, Springer-Verlag, NY, p. 3
Woese, C. R. 1998. The universal ancestor. Proc. Natl. Acad. Sci. 95: 6854-6859.
Woese, C. R. 2000. Interpreting the universal phylogenetic tree. Proc. Natl. Acad. Sci. 97: 8392-8396.
Woese, C. R. 2002. On the evolution of cells. Proc. Natl. Acad. Sci. USA, 99, 8742-8747.

![Update Kingdoms 2011.pptx [Read-Only] - lcps.org file9/26/2011 1 3 Life Domains … 6 Life Kingdoms Prokaryotes2 Domains, 1 Kingdom each: o 1) ARCHAEA: Archaebacteria o 2) BACTERIA:](https://static.documents.pub/doc/80x56/5d519e9288c993ae6f8b79c3/update-kingdoms-2011pptx-read-only-lcps-1-3-life-domains-6-life-kingdoms-prokaryotes2.jpg)


